Embed Size (px)
DESCRIPTION
concept report
Citation preview
NEXT DOOR QUARTIER _Concept Report
B2.1. Industrial Design TU/e Eindhoven
Jorg de Bont_Berend Hoogendoorn_Jeroen Paijmans_Vivian van den Burght
Coach: Vera Winthagen

2+2=3x5=9-6=
2+2=3x5=9-6=
2+2=3x5=9-6=
2+2=3x5=9-6=
Table of Content
Introduction 2
From vision to concept 3
Metroplan 4
Sidewalk curb & information light 5
Information Spots 6
Conclusion 7

2+2=3x5=9-6=
2+2=3x5=9-6=
1

2+2=3x5=9-6=
2+2=3x5=9-6=
2
Introduction As conclusion to the research performed, a vision was formulated. This vision was used for both inspiring and validating new ideas and con-cepts.
“Empowering residents of the ‘Brabantwijk’ so they, themselves, can make a change, rather than being dependant on others.”
The difficulty of forming concepts after this vision lay in the interpreta-tion of ‘empowering’. This resulted in a wide range of ideas and con-cepts, targeting different aspects of empowering people. Ultimately a concept focusing on communicating a sense of improvement and posi-tive activity was chosen.
The final concept revolves around a more abstract representation of the “Brabantwijk” area, which is used in order to map all neighbor-hood-related activities.The following pages are used to explain the concept as a whole, as well as its separate implementations.
2+2=3x5=9-6=
2+2=3x5=9-6=
3
FROM VISION TO CONCEPT
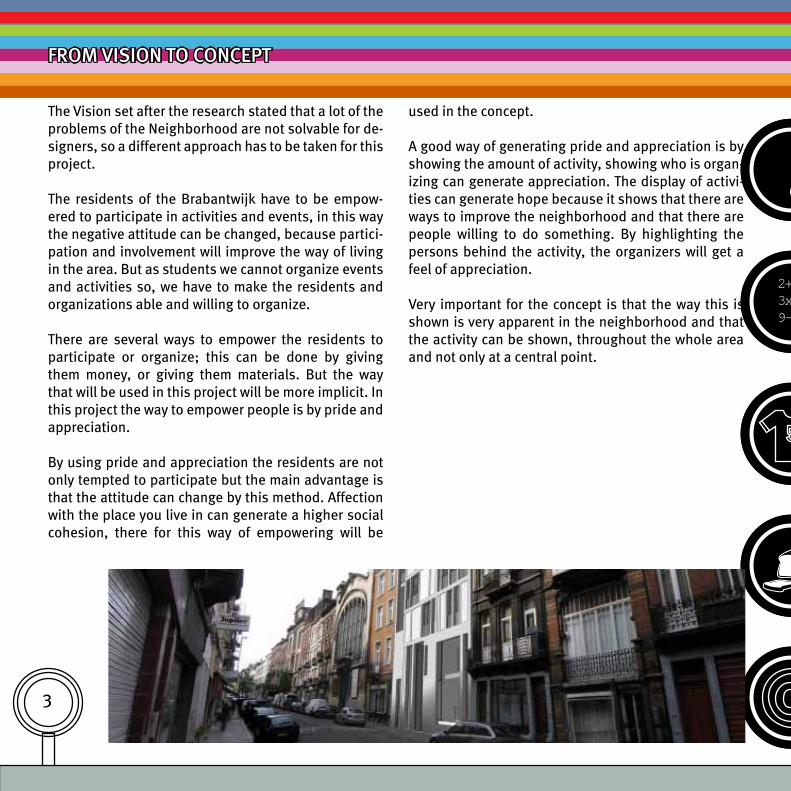
used in the concept.
A good way of generating pride and appreciation is by showing the amount of activity, showing who is organ-izing can generate appreciation. The display of activi-ties can generate hope because it shows that there are ways to improve the neighborhood and that there are people willing to do something. By highlighting the persons behind the activity, the organizers will get a feel of appreciation.
Very important for the concept is that the way this is shown is very apparent in the neighborhood and that the activity can be shown, throughout the whole area and not only at a central point.
The Vision set after the research stated that a lot of the problems of the Neighborhood are not solvable for de-signers, so a different approach has to be taken for this project.
The residents of the Brabantwijk have to be empow-ered to participate in activities and events, in this way the negative attitude can be changed, because partici-pation and involvement will improve the way of living in the area. But as students we cannot organize events and activities so, we have to make the residents and organizations able and willing to organize.
There are several ways to empower the residents to participate or organize; this can be done by giving them money, or giving them materials. But the way that will be used in this project will be more implicit. In this project the way to empower people is by pride and appreciation.
By using pride and appreciation the residents are not only tempted to participate but the main advantage is that the attitude can change by this method. Affection with the place you live in can generate a higher social cohesion, there for this way of empowering will be
2+2=3x5=9-6=
2+2=3x5=9-6=
4
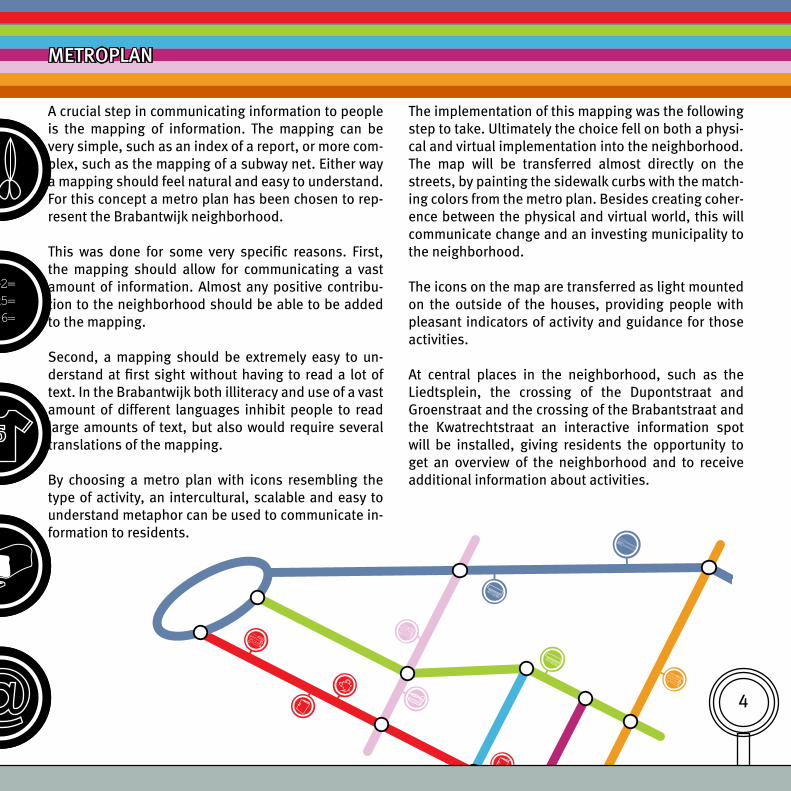
The implementation of this mapping was the following step to take. Ultimately the choice fell on both a physi-cal and virtual implementation into the neighborhood.The map will be transferred almost directly on the streets, by painting the sidewalk curbs with the match-ing colors from the metro plan. Besides creating coher-ence between the physical and virtual world, this will communicate change and an investing municipality to the neighborhood.
The icons on the map are transferred as light mounted on the outside of the houses, providing people with pleasant indicators of activity and guidance for those activities.
At central places in the neighborhood, such as the Liedtsplein, the crossing of the Dupontstraat and Groenstraat and the crossing of the Brabantstraat and the Kwatrechtstraat an interactive information spot will be installed, giving residents the opportunity to get an overview of the neighborhood and to receive additional information about activities.
A crucial step in communicating information to people is the mapping of information. The mapping can be very simple, such as an index of a report, or more com-plex, such as the mapping of a subway net. Either way a mapping should feel natural and easy to understand.For this concept a metro plan has been chosen to rep-resent the Brabantwijk neighborhood.
This was done for some very specific reasons. First, the mapping should allow for communicating a vast amount of information. Almost any positive contribu-tion to the neighborhood should be able to be added to the mapping.
Second, a mapping should be extremely easy to un-derstand at first sight without having to read a lot of text. In the Brabantwijk both illiteracy and use of a vast amount of different languages inhibit people to read large amounts of text, but also would require several translations of the mapping.
By choosing a metro plan with icons resembling the type of activity, an intercultural, scalable and easy to understand metaphor can be used to communicate in-formation to residents.
METROPLAN

2+2=3x5=9-6=
2+2=3x5=9-6=
5
SIDEWALK CURB & INFORMATION LIGHT
sented differently than painting on the sidewalk.Since the type and amount of activities fluctuate over time, a more dynamic representation is needed for im-plementation on the streets.
For this representation, cylindrical lights are mounted on the relating homes. These lights represent the icons on the mapping in real life. They glow in the color of the street they are mounted in, and project the icon of the relating activity.
The lights too, have been designed to be cheap to im-plement and maintain.
ImplementationThe lights are simple fixtures with LED’s, a small bat-tery and a permanent magnet, encased in an opaque plastic casing with a metal backside.
The light is hung up by giving each home an ornament when they qualify for one. This ornament is made out of metal, and by itself serves as a reminder of the good that a resident has previously done. Using the magnets and the metal, a light can easily be hung up and taken down.
This implementation of the metro plan focuses on the physical impact upon the neighborhood. The imple-mentation is divided in a static component and a dy-namic component.
The street curbs are installed once, and remain the same until the neighborhood is renovated.Upon installment, the curbs give the grim neighbor-hood a cheerful boost of attention. This should provide the project with an initial boost of goodwill towards the upcoming changes.
Besides the boost of goodwill, the colored curbs are used to give streets their own identity that people can identify with.
ImplementationThe current curbs will be treated with a heavy poly-urethane or epoxy coating. These coatings can with-stand long years of corrosion and heavy use. This way, the implementation of this static representation doesn’t have to be an incredibly costly venture.
While the painted sidewalk curbs represent the ‘metro lines’ from the mapping, the metro stops are repre-
2+2=3x5=9-6=
2+2=3x5=9-6=
6
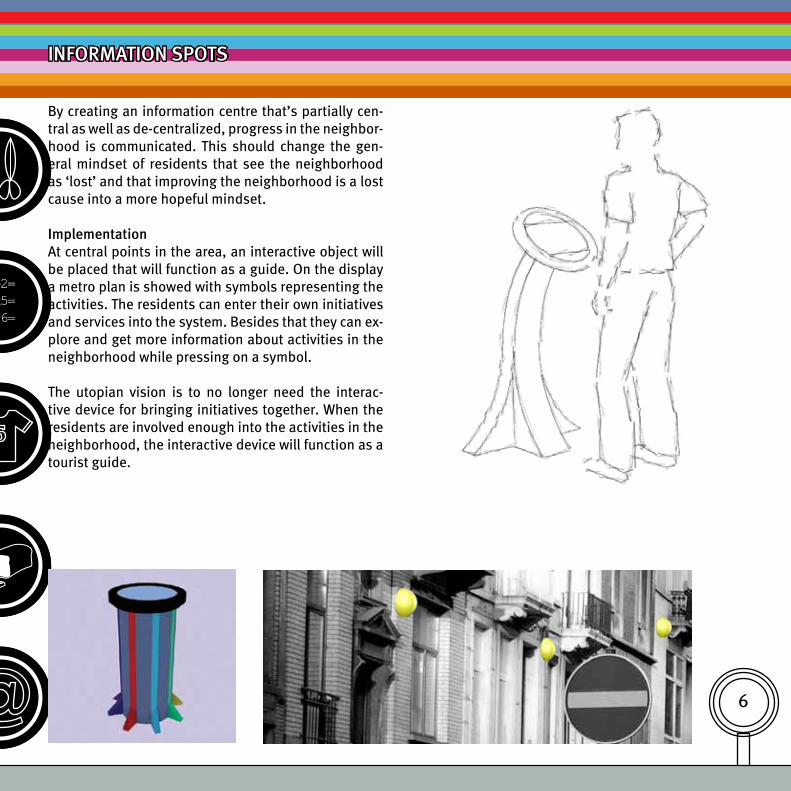
By creating an information centre that’s partially cen-tral as well as de-centralized, progress in the neighbor-hood is communicated. This should change the gen-eral mindset of residents that see the neighborhood as ‘lost’ and that improving the neighborhood is a lost cause into a more hopeful mindset.
ImplementationAt central points in the area, an interactive object will be placed that will function as a guide. On the display a metro plan is showed with symbols representing the activities. The residents can enter their own initiatives and services into the system. Besides that they can ex-plore and get more information about activities in the neighborhood while pressing on a symbol.
The utopian vision is to no longer need the interac-tive device for bringing initiatives together. When the residents are involved enough into the activities in the neighborhood, the interactive device will function as a tourist guide.
INFORMATION SPOTS
2+2=3x5=9-6=
2+2=3x5=9-6=
CONCLUSION
7
The vision as it was derived from the research has served well as a guideline to design by. The resulting objects aren’t necessarily great in their design, but are great in their abstract values. The system behind the objects is where the real concept lies.
By creating an information system that consists out of both a real life and digital implementation, residents are able to experience the information that is given to them by the system.
Whether these real life and digital implementations should be done the way they have been designed right now is a valid question though. Given the large amount of time spent on extensive research and creating a val-id solution, relatively little time could be spent on actu-ally designing this solution. To really take the designs to the next level, they should be subjected to user tests in which their merit as a solution can be measured so that the process can be iterated.
Therefore, the objects as they are presented in this re-port should not be viewed as the final result, but as objects that should cause discussion and inspiration on how they can be improved upon.

2+2=3x5=9-6=
2+2=3x5=9-6=
8