Embed Size (px)
Citation preview

Annick GERVAIS, UCB, Belgium on behalf of EBE
CASSS CMC Strategy Forum – EBE satellite session – Sorrento – May 5, 2014
Concept Paper on Forced
Degradation Studies

Background
2
• Early 2013 – EBE Biomanufacturing Working Group endorsed the project
of a Concept Paper for Forced Degradation Studies
• Aim of this Concept Paper: Describe approaches and best practices
amongst biopharmaceutical companies in the design and execution of
Forced Degradation Studies (FDS).
• May 2013 – Kick off meeting
• Working group composed of 9 EBE member Companies:
Janssen Biologics, MedImmune, Merck-Serono, Novo Nordisk, Pfizer,
Roche, Sanofi, UCB (topic group lead)
• Draft concept paper will be ready for review end Q3 2014

Objective & Scope of the Concept Paper
3
• Provide industry best practices in the field of Forced Degradation Studies
for therapeutic proteins based on experience of the EBE member
companies.
• Does not aim at defining regulatory requirements.
• The following questions will be addressed:
- Why do we need to use Forced Degradation Studies?
- When to initiate them?
- At which product development phase?
- Which are the relevant stressing conditions and for which purpose?
- What is the extent of degradation we want to achieve?
- How are acceptance criteria defined?
- What are the limitations of Forced Degradation Studies?
What is FDS and What is it Used For?
4
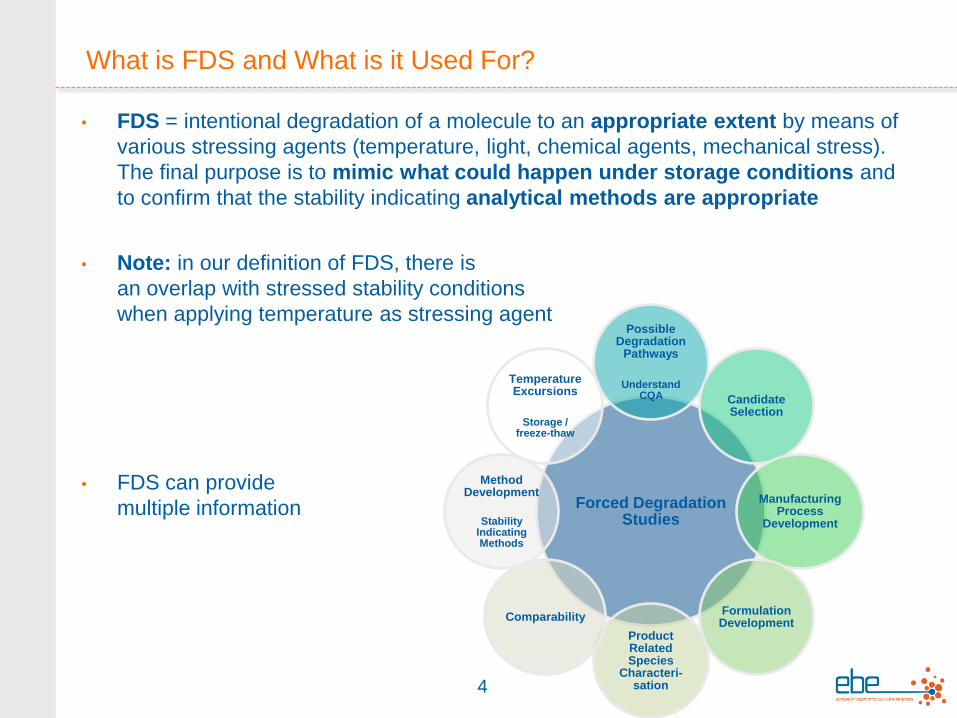
• FDS = intentional degradation of a molecule to an appropriate extent by means of
various stressing agents (temperature, light, chemical agents, mechanical stress).
The final purpose is to mimic what could happen under storage conditions and
to confirm that the stability indicating analytical methods are appropriate
• Note: in our definition of FDS, there is
an overlap with stressed stability conditions
when applying temperature as stressing agent
• FDS can provide
multiple information
Forced Degradation Studies
Possible Degradation
Pathways
Understand CQA Candidate
Selection
Manufacturing Process
Development
Formulation Development
Product Related Species
Characteri-sation
Comparability
Method Development
Stability Indicating Methods
Temperature Excursions
Storage / freeze-thaw

Goal of this Presentation and Presentation Outline
• To present specific case studies and related questions to initiate discussions
in the panel.
• The discussions will help the team finalising the draft Concept Paper.
Case Studies:
• Candidate Selection
• Comparability – How are acceptance criteria defined?
- Degradation pathway
- Kinetics of degradation
- Particular case of lyophilised products
• Photostability
5

CASE STUDY 1
Candidate Selection
6

When Are Forced Degradation Studies Performed?
sequence lock
No. clones 1011 100’s 10’s 1-2 109 100’s 10’s 1-2
FDS
Study
Example of tests performed:
- Tm,
- Aggregate levels on agitation,
- Temperature Study,
- Forced Oxidation and Deamidation,
- bioactivity
CASE STUDY 2
Comparability
How to define acceptance criteria for:
1. Degradation pathway « static » comparison
2. Kinetics of degradation comparison
8

Degradation Pathway – How to Compare Pre- and Post-change ?
• Monoclonal Antibody - Characterization for comparability between
pre and post change
- Time zero
- Post forced degradation by temperature (8 weeks at 40°C)
- 7 samples tested
3 pre-change + 1 reference STD
3 post change
Use of specific and orthogonal methods:
Qualitative and quantitative data
9

Degradation Pathway – Mab – Peptide mapping/MS – Qualitative information
Chain PTMs
Time zero Post Forced degradation
Ref.
STD
pre-
change
Batch 1
pre-
change
Batch 2
pre-
change
Batch 3
post
change
Batch 1
post
change
Batch 2
post
change
Batch 3
Ref.
STD
pre-
change
Batch 1
pre-
change
Batch 2
pre-
change
Batch 3
post
change
batch 1
post
change
batch 2
post
change
batch 3
HC Ox M (a) Yes
Trace
Yes
Trace
Yes
Trace
Yes
Trace
Yes
Trace
Yes
Trace
Yes
Trace
Yes
Trace
Yes
Trace
Yes
Trace
Yes
Trace
Yes
Trace
Yes
Trace
Yes
Trace
HC Deam N(a) Yes
Trace
Yes
Trace
Yes
Trace
Yes
Trace
Yes
Trace
Yes
Trace
Yes
Trace
Yes
Trace
Yes
Trace
Yes
Trace
Yes
Trace
Yes
Trace
Yes
Trace
Yes
Trace
HC Succ N(a)
Yes
Trace
Yes
Trace
Yes
Trace
Yes
Trace
Yes
Trace
Yes
Trace
Yes
Trace
Yes
Trace
Yes
Trace
Yes
Trace
Yes
Trace
Yes
Trace
Yes
Trace
Yes
Trace
HC Deam N(b) Yes
minor
Yes
minor
Yes
minor
Yes
minor
Yes
minor
Yes
minor
Yes
minor Yes Yes Yes Yes Yes Yes Yes
HC Deam Q(a) Yes
Trace
Yes
Trace
Yes
Trace
Yes
Trace
Yes
Trace
Yes
Trace
Yes
Trace
Yes
minor
Yes
minor
Yes
minor
Yes
minor
Yes
minor
Yes
minor
Yes
minor
HC C-Term
Truncation Yes Yes Yes Yes Yes Yes Yes Yes Yes Yes Yes Yes Yes Yes
LC Deam N(c) No No No No No No No Yes
Trace
Yes
Trace
Yes
Trace
Yes
Trace
Yes
Trace
Yes
Trace
Yes
Trace
HC Ox M(b) No Yes
Trace
Yes
Trace
Yes
Trace No No No
Yes
Trace
Yes
Trace
Yes
Trace
Yes
Trace
Yes
Trace
Yes
Trace
Yes
Trace
HC Ox M(c) No Yes
Trace
Yes
Trace
Yes
Trace No No No
Yes
Trace
Yes
Trace
Yes
Trace
Yes
Trace
Yes
Trace
Yes
Trace
Yes
Trace
HC Pyro-Glu (Q)
(N-TERM) Yes Yes Yes Yes Yes Yes Yes Yes Yes Yes Yes Yes Yes Yes
Acceptance criteria for
comparability : same PTMs and
similar intensity between pre
and post change before and
after forced degradation.
Acceptance criteria
MET
Same PTMs between
pre and post change
with similar intensities
10

Degradation Pathway – MAb – Deamidation – Quantitative Analysis
0 5
10 15 20 25 30 35 40 45
Ref. STD Pre change Batch 1
Pre change Batch 2
Pre change Batch 3
Post Change batch 1
Post Change batch 2
Post Change batch 3
% Deamidation Time Zero % Deamidation Post forced Degradation
AU
0.00
0.02
0.04
0.06
0.08
0.10
0.12
0.14
0.16
0.18
0.20
0.22
Minutes
9.00 10.00 11.00 12.00 13.00 14.00 15.00 16.00 17.00 18.00 19.00 20.00 21.00 22.00 23.00 24.00
T=0
T= 8w
Deamidated species
Acceptance criteria MET
Acceptance criteria for comparability : same
deamidation ranges between pre and post
change before and after forced degradation.
11

• Behavior under thermal stress
- Better purity for PIII material
• Aggregation profile confirmed by orthogonal methods (AF4 & svAUC) A
U
-0.004
-0.002
0.000
0.002
0.004
0.006
0.008
0.010
0.012
0.014
0.016
0.018
0.020
0.022
0.024
0.026
0.028
0.030
0.032
0.034
0.036
0.038
0.040
0.042
0.044
0.046
0.048
0.050
0.052
0.054
0.056
0.058
0.060
0.062
0.064
0.066
0.068
0.070
Minutes
5.00 5.20 5.40 5.60 5.80 6.00 6.20 6.40 6.60 6.80 7.00 7.20 7.40 7.60 7.80 8.00 8.20 8.40 8.60 8.80 9.00 9.20 9.40 9.60 9.80 10.00 10.20 10.40
Post-change T0 & 4w 40°C
AU
-0.004
-0.002
0.000
0.002
0.004
0.006
0.008
0.010
0.012
0.014
0.016
0.018
0.020
0.022
0.024
0.026
0.028
0.030
0.032
0.034
0.036
0.038
0.040
0.042
0.044
0.046
0.048
0.050
0.052
0.054
0.056
0.058
0.060
0.062
0.064
0.066
0.068
0.070
Minutes
5.00 5.20 5.40 5.60 5.80 6.00 6.20 6.40 6.60 6.80 7.00 7.20 7.40 7.60 7.80 8.00 8.20 8.40 8.60 8.80 9.00 9.20 9.40 9.60 9.80 10.00 10.20 10.40
Pre-change T0 & 4w 40°C
Monom
er
dim
er
LM
W 1
LM
W 2
HM
W 1
HM
W4
HM
W 3
Degradation Pathway – Antibody Drug Conjugate – Size Variants
12

• Soluble aggregates
- Dimer increase
Slopes ratio (Post/Pre) = 100%
- Other HMWs
Slopes ratio (Post/Pre) = 96%
• Fragments
- Slopes ratio (Post/Pre) = 90%
Compliant with acceptance criteria:
80% to 125%
Acceptance criteria (proposed by FDA) :
comparison of slopes
slope ratio: 80% to 125%
Kinetics of Degradation – Antibody Drug Conjugate – Size Variants (1)
13

14
0 0.5 1 1.5 2 2.5 3
– to
3
–
Common slope/different
Intercept model
Degradation profiles behave
similarly between process 1
and process 2
Acceptance criteria : covariance analysis at p=0.25 (poolability criteria).
1. Test for the equality of slopes
2. Test for equality of intercepts
Kinetics of Degradation – Mab – Size Variants (2)

Kinetics of Degradation – Examples 1&2 – Acceptance Criteria – Limitations
• Both approaches require a linear model
• To be significant, the degradation must be sufficiently high in comparison
to the method variability.
15

Particular Case of Lyophilised Products - Pitfalls
• Lyophilised Drug Products are typically very stable
Practically no degradation is observed at recommended storage
condition
• In case substantial degradation is targeted, harsh stress conditions have to
be applied
• How representative are degradation products obtained at harsh stress
conditions?
• Is there a requirement to do FDS on lyophilised products?
or is it better to do it on the API?
• What can be done to show comparability on lyophilised products?
16
Conclusions (1)
Expectations from Health Authorities:
• Forced degradation studies are expected for comparison of pre- and post-
change stability profiles, especially for transitions from early to late clinical
development and post-approval comparability protocols.
• Meaningful forced degradation conditions should be selected which result
in controlled degradation.
• Conditions should be selected which allow sufficient degradation to
occur over a reasonable time period.
• Multiple time points are expected for each condition to determine a
slope (trend) accurately for each quality attribute measured.
• Example: Accelerated and stressed conditions for a lyophilized drug
product may not allow sufficient degradation to occur for comparison of
drug substance process changes.
17

Conclusions (2)
Industry Concerns:
• Extent of degradation to achieve in FDS should be close to degradation
seen over shelf-life to be meaningful
- But, statistical evaluation of limited degradation might be misleading
• To be significant, the degradation must be sufficiently high in comparison
to the method variability.
18

CASE STUDY 3
Photostability
19
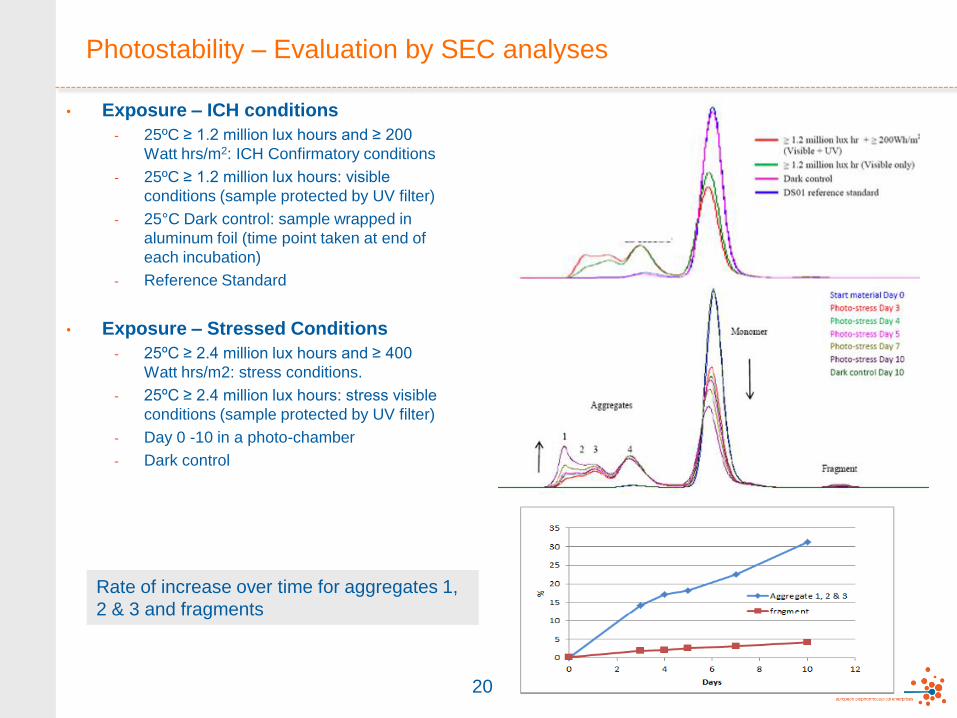
Photostability – Evaluation by SEC analyses
• Exposure – ICH conditions
- 25ºC ≥ 1.2 million lux hours and ≥ 200
Watt hrs/m2: ICH Confirmatory conditions
- 25ºC ≥ 1.2 million lux hours: visible
conditions (sample protected by UV filter)
- 25°C Dark control: sample wrapped in
aluminum foil (time point taken at end of
each incubation)
- Reference Standard
• Exposure – Stressed Conditions
- 25ºC ≥ 2.4 million lux hours and ≥ 400
Watt hrs/m2: stress conditions.
- 25ºC ≥ 2.4 million lux hours: stress visible
conditions (sample protected by UV filter)
- Day 0 -10 in a photo-chamber
- Dark control
20
Rate of increase over time for aggregates 1,
2 & 3 and fragments

Photostability: ICH Conditions Versus a Time Course Incubation
21
Lane 3: DS01 Reference Standard
Lane 4: ≥ 1.2 million lux hour ± ≥ 200Wh/m2 (Vis + UV)
Lane 5: ≥ 1.2 million lux hour ± ≥ 200Wh/m2 (Vis only)
Lane 6: Dark control
22
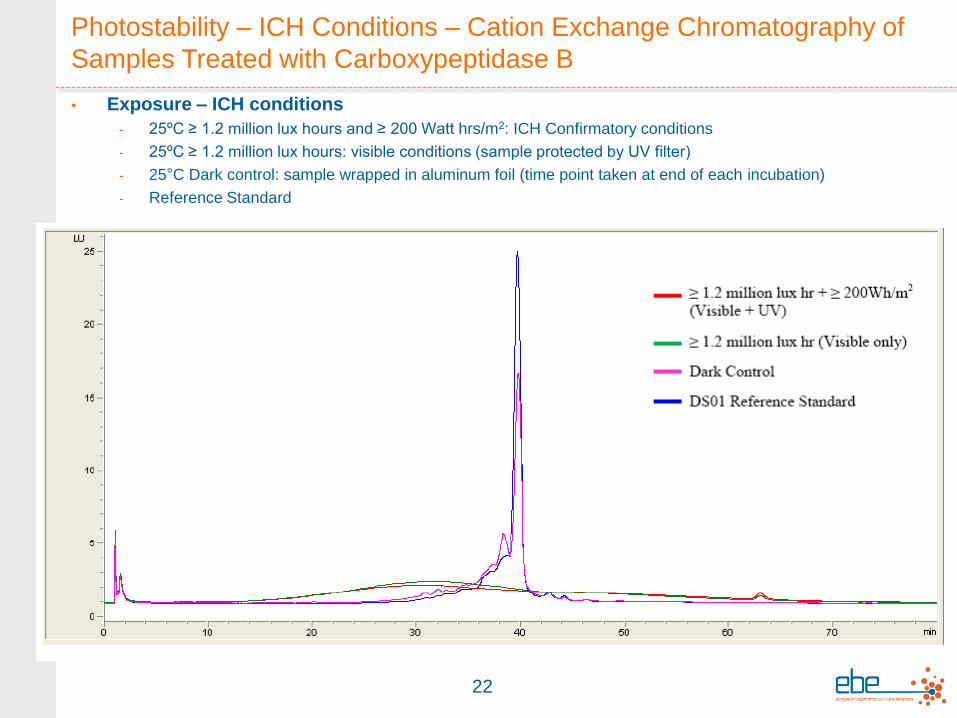
Photostability – ICH Conditions – Cation Exchange Chromatography of
Samples Treated with Carboxypeptidase B
• Exposure – ICH conditions
- 25ºC ≥ 1.2 million lux hours and ≥ 200 Watt hrs/m2: ICH Confirmatory conditions
- 25ºC ≥ 1.2 million lux hours: visible conditions (sample protected by UV filter)
- 25°C Dark control: sample wrapped in aluminum foil (time point taken at end of each incubation)
- Reference Standard

Photostability - Conclusion
23
• ICH recommended conditions induce aggregation and fragmentation
• Time course photostability studies also induce aggregation and
fragmentation
• Easier to control the amount of aggregation and fragmentation using time
course studies, especially as the impact of photostress is molecule
dependent
• Impact of the stress on analytical techniques should be considered –
- Size based methods
- Consider the impact of photo-stress on surface charge and charge based
methods
- Others: mass spectrometry for post-translational modifications; Fluorescence
for unfolding etc

Acknowledgments
24
Concept Paper Working Group:
- Annick Gervais, UCB
- John O’Hara, UCB
- Karin Juul Jensen, Novo Nordisk
- Karin Sewerin, MedImmune (consultant)
- Mara Rossi, Merck-Serono
- Michael Nedved, Janssen Biologics
- Paul Dillon, Pfizer
- Shahid Uddin, MedImmune
- Stéphane Cornen, Sanofi
- Volker Schnaible, Roche
All reviewers and contributors from the EBE BioManufacturing Working
Group member companies experts.
Panel Members:
- Annick Gervais, UCB
- Carlo Giartosio, Merck-Serono
- Gabriella Angiuoni, Merck-Serono
- John O’Hara, UCB
- Shahid Uddin, MedImmune
- Stéphane Cornen, Sanofi
Chaired by:
- Karin Sewerin, MedImmune (consultant)
- Ronald Imhoff, Janssen Biologics

Open Questions for Panel Discussion
25
• Extent of degradation:
- What should be the « appropriate level of degradation »? What product characteristics are important to
assess?
- Extent of degradation should be close to degradation seen over the shelf-life to be meaningful, but to be
significant, the degradation must be sufficiently high in comparison to the method variability. How to deal with
cases where it is not?
- Traditionally, lyophilised products are considered very stable. How representative is the degradation profile for
lyophilised products?
• Comparability:
- Would it be helpful to conduct forced degradation at more than one temperature (e.g., 25C and 40C) to have
more controlled conditions across all of the analytical parameters?
- Besides using slope ratios, what other approaches could be used as a way to compare degradation rates?
- Apart from linear models, what other statistical model can be used?
- How many batches are required to demonstrate comparability? Are 3 batches sufficient ? What about
statistical evaluation? What about early development comparability where 3 batches may be difficult to have?
• Photostability:
- The standard ICH exposure time is very harsh. It might not fall under the category of “controlled degradation”
in some applications.
In general, would time course studies for photo-stress studies be more effective in determining the sensitivity to
fluorescent or UV light?
• Different oxidation mechanisms are induced by chemical, photo-stress, and metal-stress. Which
stresses are preferred for analytical method development to determine stability indicating
properties?

26
THANK YOU