Embed Size (px)
Citation preview

59
Concept of Research20
According to The Advanced Learner’s Dictionary of Current English, research is “a
careful investigation or inquiry especially through search for new facts in any branch of
knowledge.” It can also be described as a systematic, methodical and ethical process of
enquiring and investigating research problems and increasing knowledge. Research is an
art of scientific investigation. D. Slesinger and M. Stephenson in the Encyclopedia of
Social Sciences defined research as “the manipulation of things, concepts or symbols for
the purpose of generalizing to extend, correct or verify knowledge, whether that
knowledge aids in construction of theory or in the practice of an art.” Redman and Mory
defined research as a “systematized effort to gain new knowledge.” According to Clifford
Woody research comprises defining and redefining problems, formulating hypothesis or
suggesting solutions; collecting, organizing and evaluating data; making deductions and
reaching conclusions; and at last carefully testing the conclusions to determine whether
they fit the formulated hypothesis.
3.1 Research Problem
In today’s competitive world communication plays a very important role. Like blood in
human body, cellular phones have become an integral part for growth, success and
efficiency of any business. Colossal budge in both technology and consumer behavior
during the past two decades have taken a contemporary visage. The sustainable profitable
growth has lead companies into head-to-head competition. Companies are fighting for
customer satisfaction through differentiation. The imperative factors that may be
accounted towards customer satisfaction be focus on marketing mix, marketing
communication, perceived quality, and customer loyalty. This study investigates the
effect of marketing strategies espoused by Bharti Airtel and Idea Cellular and its upshot
20 Kothari, C.R., Research Methodology-Methods and Techniques, New Age International, 2004

60
on consumers. It also attempts to study expectations of customers and marketing
strategies that have been taken by both organizations to discharge them.
Time and again many studies have been carried out to study marketing strategies of
Bharti Airtel and analyze consumer behaviour in context of expectations and satisfaction.
Very few studies have been carried out to study the marketing strategies of Idea Cellular
for the same and none have been carried as comparative analysis of marketing strategies
for both. Employee’s discernment about products and services offered by its organization
also plays an important role in sustainability and growth and thus employee’s acumen in
this perspective is imperative. This research helps in studying the similarities and
differences in perception of marketing strategies adopted to fulfill customers’ needs
expectations and grow in business. The study highlights the factors that contribute to the
hedonistic escalation in this dynamic competitive world.
Different researchers have different opinion about the key factors that influenced growth
of the players in telecom sector. The main purpose of the study is to find out the
marketing strategies that Bharti Airtel and Idea Cellular have implemented in order to
give quality of service to its customers, satisfy their needs, retain them and gain loyalty in
return.
3.2 Review of Literature
Yeboah and Atakora (2013)21
reviewed that the disadvantages of traditional marketing
system could be overcome by using IMC. Tools of IMC help in informing, persuading,
and convincing customer about product or service. This new generation approach of
marketing helps company focus on customer acquisition, customer retention and
increasing life time value of customers. An optimum mix of tools creates synergy which
further helps in increasing return on investments. The purpose of IMC is to bring
customer’s expectation and experience on the same platform to bring satisfaction.
21 Yeboah, A., & Atakora, A. (2013). Integrated Marketing Communication: How Can It Influence
Customer Satisfaction? (Vol. 5). European Journal of Business and Management.

61
Mishra (2013)22
suggested that the concept of “Blue Ocean” strategy can be applied to
the Indian Telecom industry. Lear and uninterrupted network, quality of service, network
coverage in farthest of regions, value for money and economic VAS are critical factors
for the success of telecom service providers. A large portion of rural market is untapped
along with urban and semi-urban areas. This strategy can be used to enhance
competitiveness in penetrating markets both existing and new.
Kajale A. Ramesh (2012)23
focused on understanding consumer needs and wants with
the help of relationship marketing. Relationship Marketing helps in understanding
customers and thus aids in customizing products and services fro them. It helps in
handling unpredictable demands of customers. It is one of most powerful strategy to
upbeat competition.
Kotler (2010)24
defined marketing strategy as a master plan to meet organization
objectives. This is done by investigating target markets about their needs and
expectations and designing suitable marketing mix that satisfies customer and the
organization. When a product is launched, the upper management decides value of
product based on target market and lower management does the task of communicating
the same to target customers using 4 P’s i.e. Product, Place, Price and Promotion.
Types of Marketing Strategies
Michael Porter defined three types of marketing strategies: Low-Cost Strategy,
Differentiation Strategy, and Focus Strategy.
Source: 22Mishra, D. (2013). Blue Ocean Strategy for Indian Telecom Industry. Retrieved from
mishradipankar.blogspot.in: http://mishradipankar.blogspot.in/2012/08/blue-ocean-strategy-for-indian-telecom.html 23 Kajale, A. R. (March ; 2012). Importance of Relationship Marketing in Competitive Marketing Strategy.
Indian Streams Research Journal.
24 Kotler, P. (2010). Principles of Marketing:A South Asian Perspective (13th Edition ed.). Pearson
Education India.

62
Low-Cost Strategy
This strategy suits large corporations where unit turnover is high. This strategy enables
business units to produce standard products in large quantities at lower price than
competitors. This strategy helps in gaining profits through economies of scale, brand
loyalty of price sensitive customers and reduction in competition.
Differentiation Strategy
This includes creating unique and distinctive attributes in product, product design and
product quality that helps organization surpasses competition. Companies can charge
premium for this differentiation. Organization gain brand loyalty and profits in return.
Focus Strategy
Under this strategy a firm focuses on target market through low-cost or differentiation25
.
Kotler asserted that loyalty to a service provider depends on certain variables. A
summary of those variables is-
Pricing
� High price
� Price increases
� Unfair pricing
� Deceptive pricing
Inconvenience
� Location/hours
� Wait for appointment
� Wait for service
Core service failure
� Service mistakes
� Billing errors

63
Service encounters failures
� Uncaring
� Impolite
� Unresponsive
� Unknowledgeable
Response to service failure
� Negative response
� No response
� Reluctant response
Involuntary switching
� Customer moved
Provider closed
� Found better service
Ethical problems
� Cheat
� Hard sell
� Unsafe
� Service catastrophe
� Conflict of interest
Schiffman and Kanuk (2009)26
affirmed that cost of acquiring new customers is higher
than retaining old customers. Customers are also delighted when company does
something special to retain them. If customer’s defection list is small, so are the
expenses. A satisfied customer becomes a loyal customer and shows significant increases
in profits. Benefits of having an array of loyal customers are-
� They are less price sensitive and buy more products.
� Competitive advertising does not tempt them to switch.
� It cost less to service existing and satisfied customers.
26 Schiffman, L. G. (2009). Consumer Behaviou (Ninth ed.). Pearson Education.

64
� Loyal customers spread positive word-of-mouth and refer other customers.
Ramaswamy et.al (2009)27
pointed that to escape price competition in service industry;
organizations need create differentiation, just like products do. Differentiation in service
industry could be created by following one or all the routes:
The offer should be made different by adding certain attributes.
1) Differentiate through the actual performance of the service on the basis of
people providing the service, physical evidence involved in the service,
and process involved in the service
2) Differentiate through the experience
3) Differentiate through image/branding
ICFAI (2009)28
suggested that a variety of factors influence customer perception. The
hybrid behaviour of customers is usually price sensitive and companies try to entice them
by price reductions. Customer is satisfied not only by basic offering but entire process of
product or service delivery is crucial to customer satisfaction.
In today’s globalized information driven economy, this can comprise issues like:
� How other customers or influencing groups perceive the product or brand
� The degree to which customer feels the actual marketing campaign addresses the
most important issues
� Responsiveness and service quality of any affiliates like distribution partners.
Customer perceptions are dynamic and with time they change. The more experience the
customer accumulates, the more his perceptions will shift from fact based judgments to a
more general understanding of the gains involved for him. Over time, he puts a stronger
focus on the consequence of the product or service consumption.
27 Ramaswamy, V. S. (2009). Marketing Management (4th ed.). Macmillan Publishers.
28 The ICFAI University, 2. (2009). Journal of Marketing Management.

65
Lovelock C (2008)29
argued that frontline staff of any service organization is very
important as he/she is the face of organization for customers. Customer’s encounter with
service staff is very critical for differentiation. To deal with this, organizations now train
their staff in ways that enable them to differentiate. Service personnel play a significant
role in differentiation due to following:
- Service employees form the most visible part of an organization and they represent
the service firm.
- They ensure that what their brand promise is delivered, productivity of operations is
enhanced and sales increases.
Whirtz (2008)30
pointed that historically CRM was not practiced in organizations. There
was no centralized system that enabled smooth running of operations at different
geographical locations. With advancement in technology organizations have created
several touch-points to service millions of customers of a single firm. Today however,
CRM systems act as an enabler, capturing customer information and delivering it to the
various touch points. Today CRM systems offer a centralized friendly customer interface
that delivers customization and personalization. This has resulted in delivering quality of
service to customers. Customers are better informed about products, schemes and offers.
This enables vast improvement in image of organizations, delivering value to customers,
enhancing customer experience, satisfying them and increasing customer loyalty.
Lovelock et al (2008)31
discussed that is very difficult for a service organization to create
differentiation in market when competition is tough. Customers are widely spread into
different geographical locations and accordingly their needs, tastes and preferences are
different. In such case companies should offer specific products and services that are
meaningful to them. A service organization should utilize its efforts in pleasing
customers it can serve in a better way rather than entertaining the entire market.
29Christopher, L. (2008). Services Marketing (Asian Edition ed.). Pearson Education.
30 Christopher, L. (2008). Services Marketing (Asian Edition ed.). Pearson Education.
31 Christopher, L. (2008). Services Marketing (Asian Edition ed.). Pearson Education.

66
Venugopal et al. (2006)32
discussed that it is very important to study needs and demands
of target customers and their preference for services so that product or service could be
delivered more effectively than competitors and higher degree of satisfaction is realized
by customers. This helps organizations in achieving their goals and objectives. The
author discussed that in traditional marketing system only customer’s perception was
imperative but in relational model the focus is dual. Organizations need to focus on
customers along with its employees who are involved in the process of creation and
consumption of services.
Raghu et al. (2006)33
summarized that service firms have a wide range of alternatives
available to it when competing in a market place. They are:
• Competing for market share: the service firm may compete for market share in
one or many markets at the same time by expanding both the service offered and
the segments served. The strategies to be considered in this regard are – retention
of customers, recovery from service failure, to create highest level of service
quality and to be highly customer focused.
• Competing for reach: the competition here focuses on the size of the area from
which it can draw customers, and how far customers will travel to use the service.
If the service firm remains static, and it requires physical presence of the
customers, then the customers must come to the service. The strategy is to offer
distinct and unique service.
• Competing for geography: it is based on the assumptions that the service
formula is easy to copy and being second to enter into a market is a disadvantage.
The strategy is to sell intensively and spread out geographically.
32 Venugopal, V. (2006). Services Marketing. Himalaya Publishing House.
33The ICFAI University, 2. (2009). Journal of Marketing Management.

67
Schultz et al. (2003)34
focused on marketing communication planning that recognized
the need of using an added value of using an absolute plan to evaluate the strategic roles
of different tools of communication discipline. All the tools when combined provide
clarity and consistency and enhance communication impact (Schultz et al. 1993). Schultz
(1999) argued that IMC is the result of a natural evolution from the use of mass-market
advertising to more targeted message strategies. Proponents of IMC contend that it
represents a logical first step in the transition from out-bound product-driven
communication to the more interactive, consumer and behaviour-oriented approaches of
the twenty-first century (Kitchen & Schultz 1999). Most organizations today are
accepting the concept of IMC to create greater impact on customers.
A paradigm shift has been observed in advertising and planning of communication mix.
This change is bought by rise electronic media. While the list of new electronic media is
growing, those most often discussed include the interactive portion of the World Wide
Web, email, interactive television, handheld wireless communication devices and related
systems. While some dismiss these new media as simply more direct marketing tools,
most experts acknowledge the potential for these media to alter the way in which
advertisers view marketing and marketing communication. The challenge of the ‘new
electronic media’ is for marketers to find ways to use these new tools to become more
effective and efficient marketing communicators.
Reichheld and Sasser (1990) emphasized that it is essential for an organization to satisfy
customers else they will not be able to prevent customers from defecting. Bei and Chiao
(2001) discussed that loyalty is directly proportion to customer satisfaction. If customer is
satisfied he would not switch to competition. Fornell (1992) suggested that satisfied
customer prevents customer turnover, lowers customer price sensitivity, helps in new
34 Schultz, D. E., Peltier, J. W., & Schibrowsky, J. A. (2003). Interactive integrated marketing
communication: combining the power of IMC, the new media and database marketing, International
Journal Of Advertising. World Advertising Research Center.
68
customer acquisition, reduces operating costs thus improving image of organization and
supports advertisements.35
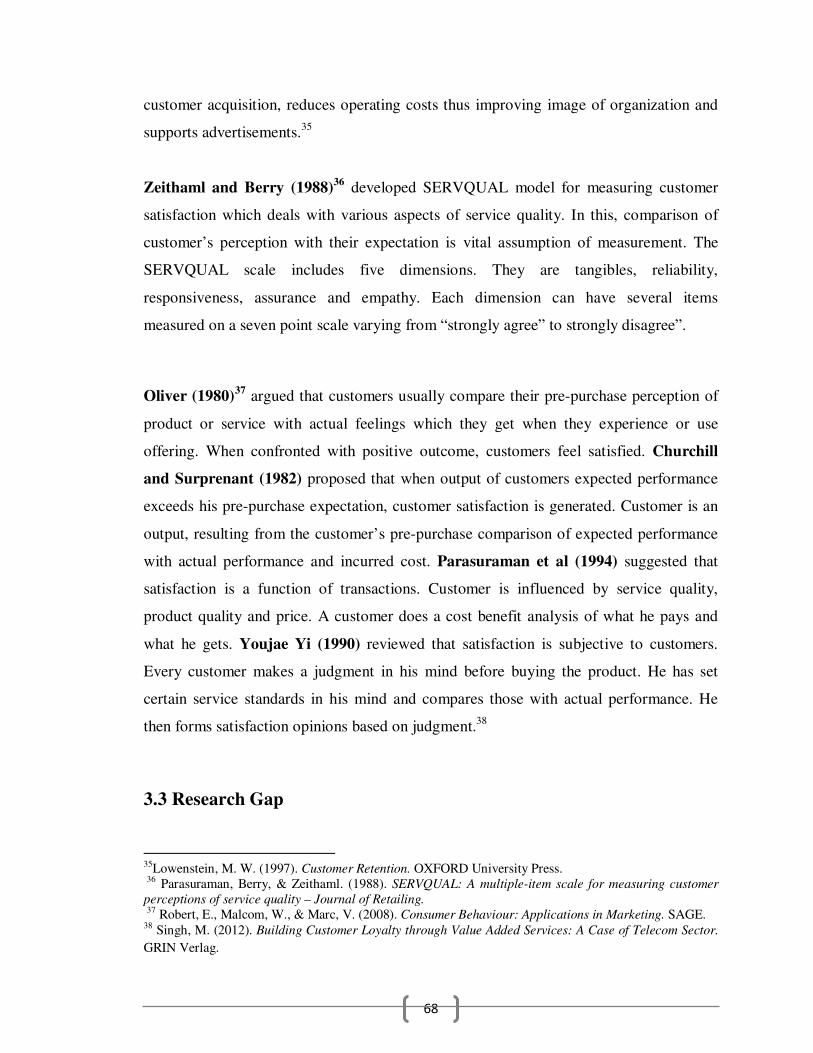
Zeithaml and Berry (1988)36
developed SERVQUAL model for measuring customer
satisfaction which deals with various aspects of service quality. In this, comparison of
customer’s perception with their expectation is vital assumption of measurement. The
SERVQUAL scale includes five dimensions. They are tangibles, reliability,
responsiveness, assurance and empathy. Each dimension can have several items
measured on a seven point scale varying from “strongly agree” to strongly disagree”.
Oliver (1980)37
argued that customers usually compare their pre-purchase perception of
product or service with actual feelings which they get when they experience or use
offering. When confronted with positive outcome, customers feel satisfied. Churchill
and Surprenant (1982) proposed that when output of customers expected performance
exceeds his pre-purchase expectation, customer satisfaction is generated. Customer is an
output, resulting from the customer’s pre-purchase comparison of expected performance
with actual performance and incurred cost. Parasuraman et al (1994) suggested that
satisfaction is a function of transactions. Customer is influenced by service quality,
product quality and price. A customer does a cost benefit analysis of what he pays and
what he gets. Youjae Yi (1990) reviewed that satisfaction is subjective to customers.
Every customer makes a judgment in his mind before buying the product. He has set
certain service standards in his mind and compares those with actual performance. He
then forms satisfaction opinions based on judgment.38
3.3 Research Gap
35Lowenstein, M. W. (1997). Customer Retention. OXFORD University Press.
36 Parasuraman, Berry, & Zeithaml. (1988). SERVQUAL: A multiple-item scale for measuring customer
perceptions of service quality – Journal of Retailing.
37 Robert, E., Malcom, W., & Marc, V. (2008). Consumer Behaviour: Applications in Marketing. SAGE.
38 Singh, M. (2012). Building Customer Loyalty through Value Added Services: A Case of Telecom Sector.
GRIN Verlag.

69
After reviewing literature on marketing strategy in telecom industry, researcher found
that no proper work has been done on comparative analysis of marketing strategies of two
private Telecom operators of Indian origin. Secondly, no research work has been done in
the region taken for study i.e. Eastern Rajasthan (cities considered for study were: Jaipur,
Alwar, Bharatpur and Dausa) which comprises of varied topography. Socio-economic
status of people differs to a great extent and so the needs of people. Telecom companies
are putting efforts to create a win-win situation for both, service user and service provider
by implementing various strategies. Thirdly, no comparative study has been done on
perception of employees regarding services of their own organization.
The research is a comparative analysis of two private players in telecom sector i.e. Bharti
Airtel and Idea Cellular. This research will help both companies identify customer’s
preference and perception of services; harvest opportunities identified and prevent
customers from defecting. It will also assist future researcher in carrying his/her research.
3.4 Research Justification
Liberalization of telecom sector in the Indian economy aims at improving accessibility,
availability, reliability and connectivity through private sector participation and to bring
about the needed improvement in the quality of service. Through increased competition
the service providers are expected to become more sensitive and responsive to the
customers needs and choices in order to give him greater satisfaction
There are many innovations that have helped reduced the cost of ownership of mobile
phones. The increased subscriber base was the result of reduced tariffs bought by
innovations and government interventions. India is now the second largest market in
terms of mobile subscriber base after China but still it is at 66% teledensity and adding
15-17 million new subscribers every month. However, the rural subscriber penetration is
less than 50% so there is a lot of room for growth.
Also the impact of tariff wars has been immense. It was estimated that only 50% of new
subscriber addition were actually new subscribers. Rest all were either churning from one
network to another or were adding to multiple SIM phenomenon. With the advancement

70
in the technology lot of different services came in Telephony. Airtel has been market
leader with the strongest network in India. Because of this it has been preferred. With the
late entry into the market it was difficult for Idea to beat Airtel. Idea fought back with
different strategies to gain market share and increase revenues. The motive of the study
was to find out what were the factors and strategies that were common to both
competitors in sustaining business and what different factors and strategies they focused
on to create differentiation to be the consumers choice.
3.5 Objectives of the Research
• Broad Objectives
o To study employee’s and customer’s perception of marketing strategies of
Bharti Airtel and Idea Cellular in Eastern Rajasthan.
o To study customer’s preference of product and services while selecting mobile
service provider.
The broad objectives have been further divided into sub objectives as following:
o To determine the role of price mix while selecting telecom service provider.
o To determine the non-pricing factors those were important to customers.
o To study the effect of price reduction on consumers and organizations.
o To determine preference and perception of telecom products and services
offered by both companies.
o To determine promotional tools that effected customer’s purchase decision.
o To determine preference and perception of quality of service that is provided
by Airtel and Idea.
o To determine the distribution strategy used by Airtel and Idea
o To determine the strategy used by Airtel and Idea in managing relationship
with their respective customers.

71
3.6 Hypothesis of the Research
A hypothesis is a tentative explanation for certain behaviors, phenomena, or events that
have occurred or will occur. The hypothesis states the researcher's expectations
concerning the relationship between the variables in the research problem. For the present
research following null and alternate hypothesis have been formulated.
• Ho: There is no significant difference between marketing strategies adopted by
Bharti Airtel vis-à-vis Idea Cellular.
• Hа: There is significant difference between marketing strategies adopted by Bharti
Airtel vis-à-vis Idea Cellular.
The null hypothesis has been divided into various hypotheses subject to various aspects
of study. They are:
• Ho1: There is no significant difference between preference for price based factors
of Bharti Airtel and Idea Cellular at the time of selecting telecom service
• Ho2: There is no significant difference between non-pricing factors of Bharti
Airtel and Idea Cellular at the Time of Selecting Telecom Service
• Ho3: There is no significant effect on usage of telecom services when price of
products and service were reduced at both Airtel and Idea.
• Ho4: There is no significant difference in preference of services for Bharti Airtel
and Idea Cellular.
• Ho5: There is no significant difference between switching factors of Bharti Airtel
and Idea Cellular.
• Ho6: There is no significant difference between factors of satisfaction and brand
loyalty of Bharti Airtel and Idea Cellular.

72
• Ho7: There are no significant variables of Marketing Mix that are critical to
customers when they plan to buy telecom services.
• Ho8: There is no significant difference in perception for factors of Marketing Mix
that Airtel and Idea focus on.
• Ho9: There is no significant difference between marketing communication tools
adopted by Bharti Airtel and Idea Cellular that affected customers purchase
decision.
• Ho10: There is no significant difference between sources of information used to
educate customers about various products and services of Bharti Airtel and Idea
Cellular
• Ho11: There is no significant difference between factors that motivate retailers/
distributors of Airtel and Idea to carry business.
• Ho12: There is no significant difference between factors of CRM strategy that
Airtel and Idea practice to sustain business.
• Ho13: There is no significant difference between product distribution strategy of
Bharti Airtel and Idea Cellular employ to expand business and grow.
• Ho14: There is no significant difference in employee’s sensitivity for services of
Airtel and Idea as a Consumer.
Assumptions
Following assumptions have been taken by the researcher for the purpose of study:
• Assumption 1: Airtel and Idea are two leading telecom service providers in India.
• Assumption 2: Airtel and Idea have equal market share.

73
• Assumption 3: Airtel and Idea are passing through the same stage of PLC.
• Assumption 4: Customers have same perception about telecom products and
services offered by Airtel and Idea.
• Assumption 5: Customers are highly loyal to the brand they use.
• Assumption 6: Similar strategies are adopted by Airtel and Idea to retain
customers.
3.7 Scope of Study
Indian telecommunication sector is experiencing revolution. Liberalization and
privatization increased the number of players in the market. Technological advancement
is changing taste and preferences of customers’ everyday. Organizations are giving all
efforts for revenue generation, increasing subscriber base and increasing market share.
The study is done on two Indian telecom giants, Airtel and Idea. This study helps in
identifying attributes of product and service that customers prefer and what is their
perception about products and services offered by their TSP. The study is carried in four
cities of Eastern Rajasthan with varied demographics over a period of 3 years, 2010-
1013. The factors of customer satisfaction, customer defection, and quality of service,
relationship management, and marketing mix can be figured those are essential for
growth.
3.8 Sample Design
Pilot Survey
A pilot survey was conducted on a sample of 50 respondents to ensure the feasibility,
time, cost, difficulties, effective sample size, and make improvements in the research

74
design prior to running a full scale project. Respondents were drawn from Jaipur city on
convenience basis. An online sample size calculator provided by Raosoft.com was used
to calculate sample size. A minimum of 385 respondents were recommended by the
software for the survey. The final sample size taken for the study was 550. Following is
the sample design taken for the study:
Sampling Method – Multistage sampling was used to draw customer respondents and
purposive sampling was used to draw employee respondents.
Sample size – The sample size was distributed as following-
• Employees: Total of 50 Employees from sales and marketing department were
chosen as respondents from Rajasthan Circle office based in Jaipur City.
• No. of Employees of Idea Cellular (Rajasthan circle office) - 25
• No. of Employees of Bharti Airtel (Rajasthan circle office) - 25
• Customers: Total 500 customers from Jaipur, Bharatpur, Alwar and Dausa were
chosen as respondents.
• No. of Customers of Idea Cellular – 250
• No. of customers of Bharti Airtel – 250
The research was limited to four districts with 100 respondents from Jaipur and 50 each
from Bharatpur, Alwar and Dausa for each Airtel and Idea.
Table 3.1 shows district-wise number of respondents.
Table 3.1
District-wise Number of Respondents
Category of
Respondents Name of Unit No. of
Respondents
No. of
Respondents

75
Descriptive Profile of Customers
� Airtel
A brief description of the profile of customers is as follows: 95.2% of the respondents
belonged to the age group of 15-40 years while rest 4.8% population was in the age
group of 40-60 years. The majority of the respondents were students accounting to
56.4 % followed by people who were into service (18%), and were self-employed
(25.6%). For the educational qualification, respondents belonged to 5 different
categories as Under Graduates (48.4%), Graduates (30%), Post Graduates (10.8%),
Professional (3.2%) and others (7.6%). In the type of connection that the respondents’
owned, majority of the connections were pre-paid with 91.6% and only 8.4%
connections were post-paid. The duration of usage of Airtel services measured to be
as Less than 1 month (2.8%), 2-6 months (20.8%), 6-12 months (10.4%) and highest
being more than a year (66%).
(Bharti Airtel) (Idea Cellular)
Employees
Jaipur
(Rajasthan
Circle office)
25 25
Jaipur 100 100
Dausa 50 50
Alwar 50 50
Bharatpur 50 50
Customers
Total 275 275

76
� Idea
A brief description of the profile of customers is as follows: 92% of the respondents
belonged to the age group of 15-40 years while rest 8% population was in the age
group of 40-60 years. The majority of the respondents were students accounting to
41.2 % followed by people who were into service (30%), were self-employed
(25.6%) and were housewives (3.2%). For the educational qualification, respondents
belonged to 5 different categories as Under Graduates (41.2%), Graduates (29.2%),
Post Graduates (11.2%), Professional (3.2%) and others (15.2%). In the type of
connection that the respondents’ owned, majority of the connections were pre-paid
with 98% and only 2% connections were post-paid. The duration of usage of Idea
Cellular services measured to be as Less than 1 month (2.4%), 2-6 months (9.6%), 6-
12 months (7.2%) and highest being more than a year (80.8%).
3.9 Source of Data
• Sample Frame – Rajasthan
• Sample Unit - Jaipur, Alwar, Bharatpur and Dausa
• Collection of Data –
o Primary Data – through structured questionnaire of 12 questions for
customers and 12 questions for employees has been used to collect
primary data.
o Secondary data - has been collected from books, internet, magazines,
journals and annual reports of Bharti Airtel and Idea Cellular.
3.10 Tools used for Data Analysis

77
For analyzing the data and resolving it into its constituent components, software SPSS
21, TRIAL VERSION, IBM INC. has been used. The results of analysis have been
reported using P (significance) value of relevant tests.
The important steps of the process were:
Editing
Editing is the process of reviewing the data to ensure maximum accuracy and clarity.
Editing was conducted as the data was being collected. The editing was applied during
the collection of forms for the full scale project. Careful editing in the early stage helped
in catching misunderstandings and misinterpretation of the variables. Editing ensured that
the data was legible, complete, consistent and accurate.
Coding
Coding is the process of assigning responses to data categories, and numbers were
assigned to identify them with those categories.
Tabulating
Tabulating is the process of arranging data in the form of rows and columns. The
variables or data fields were entered in the columns while each row had the data for a
respondent’s records. A rectangular array of entries was formed containing data on which
statistical tools were applied, converted into information and summarized for decision
making.
While tabulating, approximately 100 forms with ambiguous and missing information
were eliminated and was ensured that data from rightly filled 550 forms is entered.
However, respondents who missed to fill response of an item in the group were assigned
the mean of group.
3.11 Tools used for Hypothesis Testing

78
SPSS 21 Trial version has been used to test the hypotheses of the research. It offered
flexible data handling facility and easily computable statistical and mathematical
functions. Reliability Analysis has been done to measure internal consistency of
variables. Following functionalities of SPSS have been used for the purpose of testing
hypotheses:
• Independent t-Test for comparing the means between two unrelated groups of
variables.
• Chi-square test for association of variables.
Reliability Analysis
Reliability analysis allowed studying the properties of measurement scales and the items
that made them. The analysis calculated measure of scale reliability and also provided
information about the relationships between individual items in the scale. Cronbach's
alpha has been used to measure internal consistency ("reliability"). It has been used as the
questionnaire had multiple Likert questions that form a scale.
Following is the formula for Cronbach's alpha to check the reliability of questionnaires:
α = (n / (n-1)) × (1- (Σsi2
/ sT2))
Where n is the number of items, Si 2 is the variance of the ith item, and ST
2 is the total
score variance (Cronbach, 1951).
In the present study the internal consistency of two questionnaires was found to be strong
and reliable as the Cronbach’s alpha score was closer to 01. Table 3.2 shows reliability
score of 0.852 for questionnaire related to customers and Table 3.3 shows the reliability
score of 0.897 for questionnaire related to employees.
Table 3.2

79
Reliability Analysis of Questionnaire for Customers
Table 3.3
Reliability Analysis of Questionnaire for Employees
Hypotheses of the research has been tested using the following tests-
Independent t-Test
The Independent t-Test compared the means between two unrelated groups Airtel and
Idea on the same continuous, dependent variables. The SPSS t-Test method allowed the
testing of equality of variances (Levene's test) and the t-value for both equal- and
unequal-variance. It also provided the relevant descriptive statistics. The meaning of
terms and concepts used in independent t-Test is given below-
• Group Statistics Box – The group statistic box in the study has six columns. The
first column has the name of the variable; second column, grouping variable i.e.
two conditions being studied; third, the no. of cases that have been administered;
fourth, and the mean of values; fifth and sixth, the standard deviation and standard
error mean respectively for the group of variables being considered for evaluation.
Reliability Statistics
Cronbach's Alpha N of Items
0.852 72
Reliability Statistics
Cronbach's Alpha N of Items
0.897 76

80
• Levene’s Test for Equality of Variances – This test determined if the two
conditions had about the same or different amounts of variability between scores.
The significance column had one value that helped in determining which row to
read from.
• Sig. Value > .05 – When the significance value was greater than .05, values from
top row was considered for interpretation. A value greater than .05 meant that the
variability in two conditions was about the same. That the scores in one condition
did not vary too much more than the scores in second condition. In scientific
terms the variability in the two conditions was not significantly different.
• Sig. Value <= .05 – When the significance value was less than or equal to .05, the
bottom row was considered. A value less than .05 meant that the variability in the
two conditions was not the same. That the scores in one condition varied much
more than the scores in the second condition. In scientific terms the variability in
the two conditions was significantly different.
• Sig (2-Tailed) > .05 – this indicated that there was no statistically significant
difference between two conditions. It has been concluded that the differences
between condition Means were likely due to chance and not likely due to the
factor / variable manipulation.
• Sig (2-Tailed) <= .05 – This indicated that there was statistically significant
difference between two conditions. This assisted in concluding that the
differences between condition Means were not likely due to change and were
probably due to the factor / variable manipulation.
Chi square Test
The Chi-square statistic has been used to arbitrate whether the degree of association
observed between the two variables was greater than what was expected on the basis of
chance alone, i.e., whether the association was statistically significant or not. Null
hypotheses were tested using chi-square test, which stated that there was no significant

81
difference between the expected and observed results. The value of the chi-square has
been assumed from zero to infinity and no negative value has been taken.
Standard tables have been used to represent the analysis.