Embed Size (px)
Citation preview

A
Aa
b
a
ARRAA
KRSTFB
1
dslcnc(arise
aiofTodwa
0d
Computers and Chemical Engineering 35 (2011) 2786– 2798
Contents lists available at ScienceDirect
Computers and Chemical Engineering
j ourna l ho me pag e: w ww.elsev ier .com/ locate /compchemeng
sustainability root cause analysis methodology and its application
bhishek Jayswala, Xiang Lia, Anand Zanwara, Helen H. Loua,∗, Yinlun Huangb
Dan F. Smith Dept. of Chemical Engineering, P.O. Box 10053, Lamar University, Beaumont, TX 77710, United StatesDepartment of Chemical Engineering and Materials Science, Wayne State University, Detroit, MI 48202, United States
r t i c l e i n f o
rticle history:eceived 20 January 2011eceived in revised form 5 April 2011ccepted 9 May 2011vailable online 14 May 2011
a b s t r a c t
In the design of chemical/energy production systems, a major challenge is to identify the bottleneck issuesand improve its sustainability effectively. Due to the multi-dimensional feature of sustainability, how toaccount for the impacts of various design factors and the cause-and-effect relationships can be verydifficult. This paper will present a sustainability root cause analysis method based on the combinationof Pareto Analysis and Fishbone diagram. The sustainability of the process is assessed incorporating
eywords:oot cause analysisustainability analysishe Pareto analysisishbone diagram
economic, environmental, societal and efficiency concerns.This methodology is able to help the designers focus the attention on the most important fundamental
causes, discover opportunities for sustainability improvement and provide critical guidance to design forsustainability. The efficacy of this methodology will be demonstrated through a case study on a biodieselproduction technology.
iodiesel
. Introduction
Triple-bottom-line is the basic concept of sustainability,emanding a balance among economic, environmental, and socialustainability (Pintaric & Kravanja, 2006). The chemical industry,ike other manufacturing industries, has been facing tremendoushallenges due to economic globalization, environmental pressure,atural resource depletion, etc. The industry fully recognizes itsommitment to product stewardship and sustainable developmentTurton, Bailie, Whiting, & Shaeiwi, 2003). A sustainable design, asn evolving popular topic, should be based on the conception andealization of the full consequence of a particular economic activ-ty on the environmental and societal dimensions. Implementingustainability philosophy in early design stage requires much lessffort and cost than to retrofit the process after its launch.
However, in the design of chemical/energy production systems, major challenge is to identify the bottleneck issues and improvets sustainability effectively. Due to the multi-dimensional featuref sustainability, how to account for the impacts of various designactors and the cause-and-effect relationships can be very difficult.his paper will present a sustainability root cause analysis method-logy based on the combination of Pareto Analysis and Fishboneiagram. The Pareto analysis is used to identify the major causes
hile the complicated cause–effect relationships are illustrated byFishbone diagram. As shown in Fig. 1, the sustainability of the
∗ Corresponding author. Tel.: +1 409 880 8207; fax: +1 409 880 2197.E-mail addresses: [email protected], [email protected] (H.H. Lou).
098-1354/$ – see front matter © 2011 Elsevier Ltd. All rights reserved.oi:10.1016/j.compchemeng.2011.05.004
© 2011 Elsevier Ltd. All rights reserved.
process is assessed incorporating economic, environmental, andsocietal concerns.
This methodology is able to help the designers focus theattention on the most important fundamental causes, discoveropportunities for sustainability improvement and provide criticalguidance to design for sustainability. The efficacy of this method-ology will be demonstrated through a case study on a biodieselproduction technology. The conventional biodiesel production pro-cess is analyzed and the results are used to derive an improvedprocess.
2. Sustainability root cause analysis
The development of suitable sustainability assessment anddesign decision methodologies are of upmost importance. Due tothe sophistication of processes, the fundamental causes leading toan inferior sustainability performance could be hiding deep downfrom the surface. This research aims at developing a novel yet prac-tical methodology for conducting sustainability root cause analysison chemical and energy production systems. The root-cause anal-ysis framework is built on the combination of Pareto chart andthe Fishbone diagram, in conjunction with a set of sustainabilitymetrics for conducting comprehensive sustainability assessmenton complex chemical and energy production systems along eachdimension of sustainability. Due to the multi-dimensional natureof sustainability, a good root-cause analysis method depends on
an appropriate sustainability assessment system. The proceduresfor sustainability assessment and root cause analysis in this studyare shown as Fig. 2. When the designers are facing more than twodesigns, a series procedure is recommended (Li, Zanwar, Jayswal,
A. Jayswal et al. / Computers and Chemical Engineering 35 (2011) 2786– 2798 2787
Nomenclature
E0ch
standard chemical exergy (J/mol)Ech chemical exergy (W)Emix mixing exergy (W)Eph physical exergy (W)Etot total exergy (W)Exin inlet stream exergy (W)Exout outlet stream exergy (W)Exloss exergy loss (W)F mole flow rate (mol/s)H enthalpy (J/mol)P pressure (Pa)Q heat or cooling duty (W)S entropy (J/(mol K))T temperature on thermodynamic scale
Superscripts0
LcfstcaediaapfqrtiitbtnrpDodT5&
2
aTeho
tp
denotes standard state at normal temperature andpressure
ou, & Huang, 2011). In this approach, the economic viability ishecked first and non-profitable processes can be eliminated fromurther consideration. The next step is to evaluate the inboundafety, which represents the societal impacts. For chemical indus-ries, social sustainability encompasses many aspects, includinghemical safety, process equipment safety, possibility of workingccidents, occupational disease, toxicity potential of the process,tc. However, the assessment of all these factors will be difficulturing the early design stage of a chemical process, when only lim-
ted information is available. Moreover, the possibility of workingccidents, occupational disease, toxicity potential of the process arell rooted from the inherent safety aspects of the chemical and therocess equipment. In this work, we used a simpler method whichocuses on the inherent chemical and process equipment safety touantify the social dimension of a process. Then the various envi-onmental impacts will be evaluated. This sequence is set becausehe designer needs to check the inbound safety issues first. If thenbound safety can not be satisfied, the potential environmentalmpacts must be undesirable. The efficiency is checked last becausehere are strict regulations on safety and environmental issues,ut no such regulations on efficiency. This series procedure helpshe designers to improve the efficiency of screening by eliminatingon-viable processes systematically at the early design stage. Theoot cause analysis (Anderson & Fagerhaug, 2006) is originally aroblem solving technique used in quality management (Wilson,ell, & Anderson, 1993) and is a powerful tool to pinpoint thebstacles to improvement. It is usually used in a reactive mode toetermine the causes of the problems which have already occurred.he root cause analysis can be performed using many tools such as
Whys (Ammerman, 1998), the Pareto chart (Surhone, Timpledon, Marseken, 2010) and the Fishbone diagrams (Robitaille, 2004).
.1. The Pareto analysis
The Pareto analysis (Surhone et al., 2010), which is also knowns 80–20 rule, is named after the Italian economist Vilfredo Pareto.he principle states that for many events, roughly 80% of theffects/problems come from 20% of causes. The Pareto analysiselps focusing the attention on the most important causes instead
f wasting time and energy on minor ones.A combination of line and bar chart is prepared to identify theop 20% problems. The following steps need to be followed to pre-are the chart:
Fig. 1. Sustainability assessment of chemical/energy production system.
1. A table is prepared showing all causes with their impacts inpercentage.
2. The table is sorted out in descending order by percentage.3. A third column is added to show cumulative percentage.4. A line chart is prepared. The causes are on x-axis and their cumu-
lative percentage values are on y-axis.5. On the same chart a bar chart is added by causes on x-axis and
percent impacts on y-axis.6. A horizontal line is drawn at 80%. At the intersection of the 80%
line with curve, a vertical line is added.7. The point of intersection of the vertical line and x-axis separates
the major causes to the left side and minor causes to the rightside.
This technique helps the users to identify the top causes thatneed to be addressed to resolve the 80% of the problems. Oncethe major causes are identified, tools like the Ishikawa diagram orFish-bone diagram can be used to illustrate the root causes of theproblems. Then efforts can be made to remove the major obstaclesin order to develop a more sustainable process.
This study is directed towards sustainability root cause analysisof chemical/energy production systems, considering the economicperformance, environmental impacts and societal concerns as themajor criteria for the analysis. Pareto charts are prepared for allthe criteria to identify major causes and the Fish-bone diagram isprepared to illustrate the problems.
2.1.1. Comparing sensitivity analysis with sustainability rootcause analysis
Generally, sensitivity analysis is a technique used to determinehow different values of an independent variable will impact a par-ticular dependent variable under a given set of assumptions (Saltelliet al., 2008). In chemical engineering, sensitivity analysis is gener-ally used to optimize or analyze a process flow sheet under differentoperating scenarios. In this work, the scope of process analysisis extended to include the triple aspects of sustainability, whichis broader than the traditional economic-centered process anal-ysis. On the other hand, traditional sensitivity analysis does notinclude Pareto analysis to prioritize the importance of the con-tributing factors, nor does it include Fishbone analysis to visualizethe complicated relationships. With this sustainability root causeanalysis methodology, the designers are equipped with a new toolin the exploration of new designs. In the mean time, root cause
analysis and sensitivity analysis can be complementary. Once thecritical issues are identified using the root cause analysis method,the designers can use sensitivity analysis to check how much the
2788 A. Jayswal et al. / Computers and Chemical Engineering 35 (2011) 2786– 2798
ot cau
cp
2
Ifi
mamTr
P
Fig. 2. Sustainability ro
hange on a root cause factor can affect the final sustainabilityerformance.
.2. The Fishbone diagram
The Fishbone diagram (Kelleher, 1995), which is also known asshikawa diagram, was proposed by Kaoru Ishikawa in 1960s, whoounded quality management processes in Kawasaki shipyards. Its considered one of the seven basic tools of quality control.
The Fishbone diagrams are used for the representation of theajor problems in a process. In this study, the results of the Pareto
nalysis are used to prepare the Fishbone diagram to represent theajor causes which drive the process away from being sustainable.
he Fishbone diagram helps to visualize and convey the importantelationships between the seemingly disconnected elements.
For the purpose of preparing the Fishbone diagram and theareto analysis, the economic analysis, the environmental impacts
se analysis flow sheet.
and the societal concerns are used as the major criteria and arediscussed as follows.
2.3. Economic matrix
About half of the papers found in a study by Pintaric and Kra-vanja were using cost and profit and only 10% were using netpresent value (NPV) as the economic objective function (Pintaric& Kravanja, 2006). The internal rate of return (IRR) with NPV isconsidered as the most useful indicator for economic performanceby Othman, Repke, Wozny, and Huang, 2010 and Li et al. (2011),since IRR and NPC includes initial investment, annual profit, annualdepreciation, salvage value and interest on investment. When usingNPV for profit calculation, a positive value means that the project
is feasible and negative values indicate otherwise. Therefore, whencomparing between alternatives, one with the largest positive NPVvalue will be the best choice. IRR is designed to reflect the high-est, after-tax interest or discount rate at which the project can just
A. Jayswal et al. / Computers and Chemica
Table 1Impact categories in WAR algorithm (Pintaric & Kravanja, 2006).
General impact category Impact category Measure ofimpactcategory
Human toxicityIngestion LD50
Inhalation/dermal OSHA PEL
Ecological toxicityAquatic toxicity Fathead
MinnowLC50
Terrestrial toxicity LD50
Global atmospheric impactsGlobal warming potential GWPOzone depletion potential ODPAcidification potential AP
bIp
af(AoskatN
2
e“Lcistev
2
mmIprTlproptrdce
cr
Regional atmospheric impactsPhotochemical oxidationpotential
PCOP
reak even (Turton et al., 2003). Apparently, a project that yieldsRR with higher value than the cost of capital is considered to berofitable.
In the following case study, only the annualized capital costnd operating cost are used for the evaluation of economic per-ormance because the product is always the same: the biodieselSeider, Seader, & Lewin, 2004). The capital cost is calculated usingspen Icarus software while the operating cost is calculated basedn the mass and energy flow information obtained by Aspen Plusimulation. The cost of chemicals and utilities is based on the mar-et prices shown in Table 4. Results of the root cause analysisre used to develop a new heterogeneous catalyst process andhe economic performance of both processes is compared usingPV and IRR.
.4. Environmental matrix
Life cycle analysis (LCA) is a powerful method for assessing thenvironmental impact of products, processes and activities fromcradle to grave” and the EPA waste reduction algorithm is a typicalCA matrix to quantify the various environmental impacts of a pro-ess. It must be pointed out that the existing indicator sets does notnclude a very important type of efficiency analysis – exergy analy-is. The authors argue that exergy analysis is particularly useful forhe assessment of energy/fuel production systems. Therefore, thenvironmental metrics in this study consists of two subcategories:arious environmental impacts and the efficiency analysis.
.5. Environmental impacts
The LCA method uses the material flow and energy flow infor-ation to assess a process from “cradle-to-grave”, i.e., from rawaterial acquisition through production, use, and final disposal.
n 1999 Young and Cabezas (US EPA) introduced a specific andrecise methodology namely WAR algorithm to assess the envi-onmental impact of chemical process (Young & Cabezas, 1999).he environmental impacts at the manufacturing stage can be ana-yzed using WAR algorithm for the overall life cycle of the chemicalroduction process. The WAR algorithm uses the potential envi-onmental impacts of chemicals to provide a relative indicationf environmental friendliness or unfriendliness of the chemicalrocess. The PEI indexes consider the mass and energy balanceo evaluate environmental impacts of the process. A database ofelative environmental impact scores has been created and embed-ed in the WAR software. As shown in Table 1, the eight differentategories are divided into four general environmental impact cat-
gories (Young & Cabezas, 1999).The scores given by the WAR software helps the users toompare different process alternatives based on the potential envi-onment impact of the process. The lower PEI index represents
l Engineering 35 (2011) 2786– 2798 2789
more environmentally friendly process. However, the design isalways constrained by by-products, environmental impacts of thewaste and the energy consumption.
The WAR algorithm and any other indicator of environmentalimpact don not consider the efficiency of the process. In this study,the authors suggest use of efficiency analysis to compliment WARalgorithm and complete analysis of the environmental impacts.
2.6. Indicators on efficiency performance
As we all know, the first law of thermodynamics states thatenergy can neither be created nor destroyed; it just changes itsforms. The law does not provide enough information about thepotential work producible by a form of energy or that lost duringenergy transformation. Note that different types of energy displaydifferent qualities. In thermodynamics, the exergy of a system isthe maximum useful work possible during a process that bringsthe system into equilibrium with a heat reservoir. Exergy analysiswill allow accounting for irreversibility in a process and provides amore detailed tracking mechanism for energy and chemical gener-ation and consumption. Defined as the maximum amount of workavailable from a stream, exergy analysis differentiates the quali-ties of energies and chemicals (Szargut, 2005; Szargut, Morris, &Steward, 1988).
A chemical/energy production system has three types ofstreams: the material streams, the power streams, and the heatflows. The exergy of a material stream should be a sum of chem-ical exergy, physical exergy and the mixing exergy. The exergy ofa power stream (electricity) is simple to calculate, as 1 kW of elec-tricity represents 1 kW of exergy. The exergy of a heat stream witha constant temperature at the reference pressure can be obtainedbased on the concept of Carnot efficiency. The calculation methodis detailed in the seminal work by Szargut (2005) and Szargut et al.(1988). The standard chemical exergy of a compound (E0
ch) can be
calculated from the standard formation enthalpy and the Gibbsenergy (or obtainable in standard tables). The chemical exergy of amulti-component stream (Ech) can be evaluated by calculating thesummation of the standard chemical exergy (E0
ch,i) of component i
multiplied by its molar flow rate (Fi) as follow:
Ech =∑
(Fi × E0ch,i)
The physical exergy (Eph) quantifies the amount of work arisingwhen a stream (containing unmixed components) changes from aprocess condition (T, P) to the reference state (T0, P0), i.e.,
Eph = [∑
(Fi × Hi) −∑
(F0i × H0
i )] − T0 × [∑
(Fi × Si)
−∑
(F0i × S0
i )]
In addition, the mixing exergy (Emix) is the amount of work whena stream (consisting of pure components) is mixed at the processcondition (T, P). It can be calculated as:
Emix = [F × H −∑
(Fi × Hi)] − T0 × [F × S −∑
(Fi × Si)]
Therefore, the total exergy of a material stream at the processconditions can be derived as:
Etot = Ech + Eph + Emix
The exergy of a power stream (electricity) can be readily cal-culated, as 1 kW of electricity represents 1 kW of exergy. Theexergy of a heat flow with a constant temperature at the reference
2 emical Engineering 35 (2011) 2786– 2798
pi
E
www
E
eT
�
toco
2
omcafdfaamp
cawscspm
EmiapaHtccaSgmrape
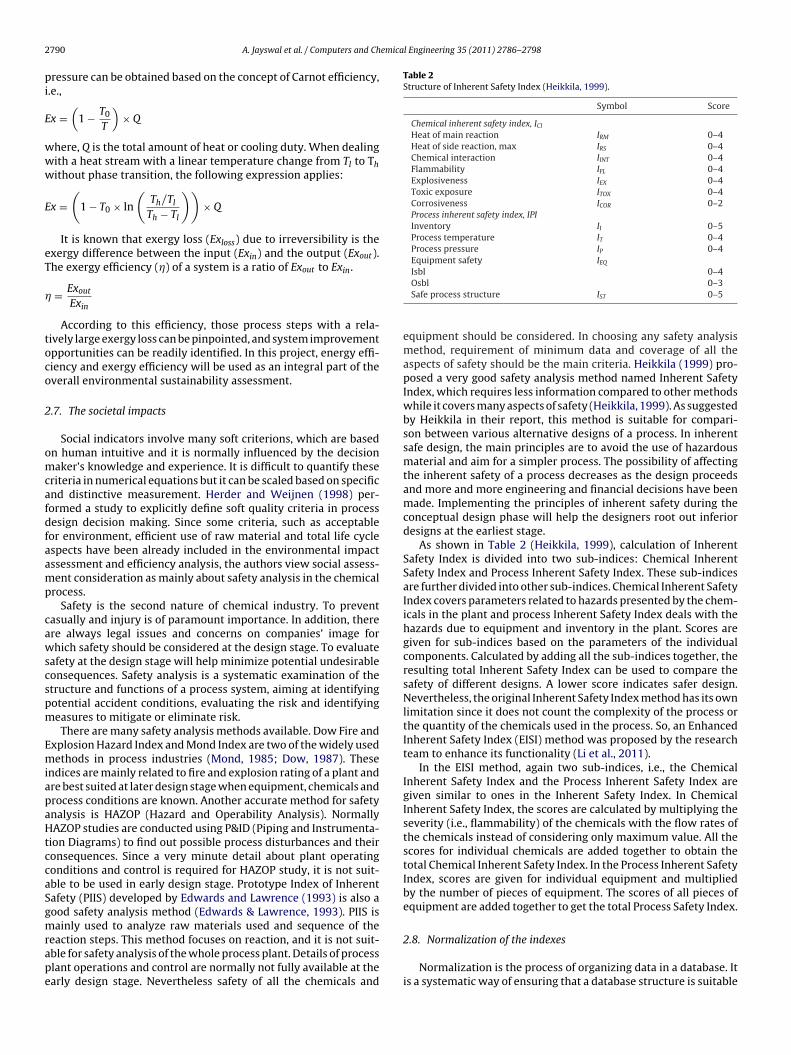
Table 2Structure of Inherent Safety Index (Heikkila, 1999).
Symbol Score
Chemical inherent safety index, ICI
Heat of main reaction IRM 0–4Heat of side reaction, max IRS 0–4Chemical interaction IINT 0–4Flammability IFL 0–4Explosiveness IEX 0–4Toxic exposure ITOX 0–4Corrosiveness ICOR 0–2Process inherent safety index, IPIInventory II 0–5Process temperature IT 0–4Process pressure IP 0–4Equipment safety IEQ
Isbl 0–4
790 A. Jayswal et al. / Computers and Ch
ressure can be obtained based on the concept of Carnot efficiency,.e.,
x =(
1 − T0
T
)× Q
here, Q is the total amount of heat or cooling duty. When dealingith a heat stream with a linear temperature change from Tl to Thithout phase transition, the following expression applies:
x =(
1 − T0 × ln
(Th/Tl
Th − Tl
))× Q
It is known that exergy loss (Exloss) due to irreversibility is thexergy difference between the input (Exin) and the output (Exout).he exergy efficiency (�) of a system is a ratio of Exout to Exin.
= Exout
Exin
According to this efficiency, those process steps with a rela-ively large exergy loss can be pinpointed, and system improvementpportunities can be readily identified. In this project, energy effi-iency and exergy efficiency will be used as an integral part of theverall environmental sustainability assessment.
.7. The societal impacts
Social indicators involve many soft criterions, which are basedn human intuitive and it is normally influenced by the decisionaker’s knowledge and experience. It is difficult to quantify these
riteria in numerical equations but it can be scaled based on specificnd distinctive measurement. Herder and Weijnen (1998) per-ormed a study to explicitly define soft quality criteria in processesign decision making. Since some criteria, such as acceptableor environment, efficient use of raw material and total life cyclespects have been already included in the environmental impactssessment and efficiency analysis, the authors view social assess-ent consideration as mainly about safety analysis in the chemical
rocess.Safety is the second nature of chemical industry. To prevent
asually and injury is of paramount importance. In addition, therere always legal issues and concerns on companies’ image forhich safety should be considered at the design stage. To evaluate
afety at the design stage will help minimize potential undesirableonsequences. Safety analysis is a systematic examination of thetructure and functions of a process system, aiming at identifyingotential accident conditions, evaluating the risk and identifyingeasures to mitigate or eliminate risk.There are many safety analysis methods available. Dow Fire and
xplosion Hazard Index and Mond Index are two of the widely usedethods in process industries (Mond, 1985; Dow, 1987). These
ndices are mainly related to fire and explosion rating of a plant andre best suited at later design stage when equipment, chemicals androcess conditions are known. Another accurate method for safetynalysis is HAZOP (Hazard and Operability Analysis). NormallyAZOP studies are conducted using P&ID (Piping and Instrumenta-
ion Diagrams) to find out possible process disturbances and theironsequences. Since a very minute detail about plant operatingonditions and control is required for HAZOP study, it is not suit-ble to be used in early design stage. Prototype Index of Inherentafety (PIIS) developed by Edwards and Lawrence (1993) is also aood safety analysis method (Edwards & Lawrence, 1993). PIIS isainly used to analyze raw materials used and sequence of the
eaction steps. This method focuses on reaction, and it is not suit-ble for safety analysis of the whole process plant. Details of processlant operations and control are normally not fully available at thearly design stage. Nevertheless safety of all the chemicals and
Osbl 0–3Safe process structure IST 0–5
equipment should be considered. In choosing any safety analysismethod, requirement of minimum data and coverage of all theaspects of safety should be the main criteria. Heikkila (1999) pro-posed a very good safety analysis method named Inherent SafetyIndex, which requires less information compared to other methodswhile it covers many aspects of safety (Heikkila, 1999). As suggestedby Heikkila in their report, this method is suitable for compari-son between various alternative designs of a process. In inherentsafe design, the main principles are to avoid the use of hazardousmaterial and aim for a simpler process. The possibility of affectingthe inherent safety of a process decreases as the design proceedsand more and more engineering and financial decisions have beenmade. Implementing the principles of inherent safety during theconceptual design phase will help the designers root out inferiordesigns at the earliest stage.
As shown in Table 2 (Heikkila, 1999), calculation of InherentSafety Index is divided into two sub-indices: Chemical InherentSafety Index and Process Inherent Safety Index. These sub-indicesare further divided into other sub-indices. Chemical Inherent SafetyIndex covers parameters related to hazards presented by the chem-icals in the plant and process Inherent Safety Index deals with thehazards due to equipment and inventory in the plant. Scores aregiven for sub-indices based on the parameters of the individualcomponents. Calculated by adding all the sub-indices together, theresulting total Inherent Safety Index can be used to compare thesafety of different designs. A lower score indicates safer design.Nevertheless, the original Inherent Safety Index method has its ownlimitation since it does not count the complexity of the process orthe quantity of the chemicals used in the process. So, an EnhancedInherent Safety Index (EISI) method was proposed by the researchteam to enhance its functionality (Li et al., 2011).
In the EISI method, again two sub-indices, i.e., the ChemicalInherent Safety Index and the Process Inherent Safety Index aregiven similar to ones in the Inherent Safety Index. In ChemicalInherent Safety Index, the scores are calculated by multiplying theseverity (i.e., flammability) of the chemicals with the flow rates ofthe chemicals instead of considering only maximum value. All thescores for individual chemicals are added together to obtain thetotal Chemical Inherent Safety Index. In the Process Inherent SafetyIndex, scores are given for individual equipment and multipliedby the number of pieces of equipment. The scores of all pieces ofequipment are added together to get the total Process Safety Index.
2.8. Normalization of the indexes
Normalization is the process of organizing data in a database. Itis a systematic way of ensuring that a database structure is suitable

emical Engineering 35 (2011) 2786– 2798 2791
fasiwNcc
3
dmrsimT&a
bfio29
otcccTtwocntg
tttTapttotfpcceai
Table 3Feed specifications and reaction conditions of conventional process (Li et al., 2011).
Traditional process
Feed cond.Oil (triolein) 1050 kg/hMethanol 121 kg/hNaOH 44.5 kg/hH3PO4 34.2 kg/hWater 50 kg/hReaction cond.Temp. (◦C) 60Press (bar) 4
Table 4Cost information of the raw materials and utilities (Li et al., 2011).
Cost of raw materials
Vegetable oil 0.830 ($/kg)Methanol 0.347 ($/kg)Sodium hydro oxide 0.174 ($/kg)Biodiesel 1.3114 ($/kg)Glycerol 0.190 ($/kg)
Cost of utilitiesWater 0.1 ($/GJ)Gas 0.5 ($/kg)
Table 5Economics of the conventional process.
Parameters Conventional process
Total capital investment ($) 8,247,978Total feedstock cost ($) 7,968,949Total utilities cost ($) 230,387Total waste management cost ($) 61,763Total labor cost ($) 1,510,080Total maintenance cost ($) 663,962Total operating overheads ($) 170,625Property taxes and insurance cost ($) 164,960Depreciation ($) 412,398General expenses ($) 362,604Total production cost ($) 11,545,728Total sales ($) 12,086,807Total profit ($) 541,079
A. Jayswal et al. / Computers and Ch
or general-purpose querying and free of certain undesirable char-cteristics. As different indicators have different values, which maypread over several orders of magnitude, it is necessary to normal-ze the values to a unified scale to compare them easily. Most often,
eights to each criterion are chosen subjectively for each indicator.ormalized vector value indicates the percentage importance of ariterion in the overall decision of its parent level. In the followingase study, all the values will be normalized from 0 to 1.
. Illustrative case study: biodiesel processes
Biodiesel is a renewable fuel suitable for both centralized andistributed production at a wide range of scales. Currently, theost common method to produce biodiesel is by transesterification
eaction of vegetable oils (e.g., canola, palm, jatropha, palm kernel,unflower, and waste vegetable oils), the main component of whichs triacylglycerol (TAG). When TAG reacts with alcohol, fatty acid
ethyl esters (FAME, or biodiesel) and glycerol will be generated.he catalyst can be either enzymes, acids, or bases (Zabeti, Daud,
Kheireddine, 2009). The transesterification reaction is illustrateds follows (Singh, 2008):
H2 C-OCOR´ ROCOR ´ H2C-OH
HC-OCOR´´ + 3ROH ROCOR´ ´ + HC-OH
H2 C-OCOR´´´ ROCOR´ ´´ H2C-OH
Triglyceride Alcohol Mixtur e of alkyl este rs Glycerol
Catalyst
The conventional homogeneous process, which producesiodiesel using alkali based catalyst. Alkali-catalyzed transesteri-cation (also known as alcoholysis) uses an alkali such as NaOHr KOH as catalyst to convert TAG into biodiesel (Hass & McAloon,006). The preferred methanol to oil molar ratio is 6:1. At 65 ◦C, a3–98% conversion of TAG is achieved within 1 h.
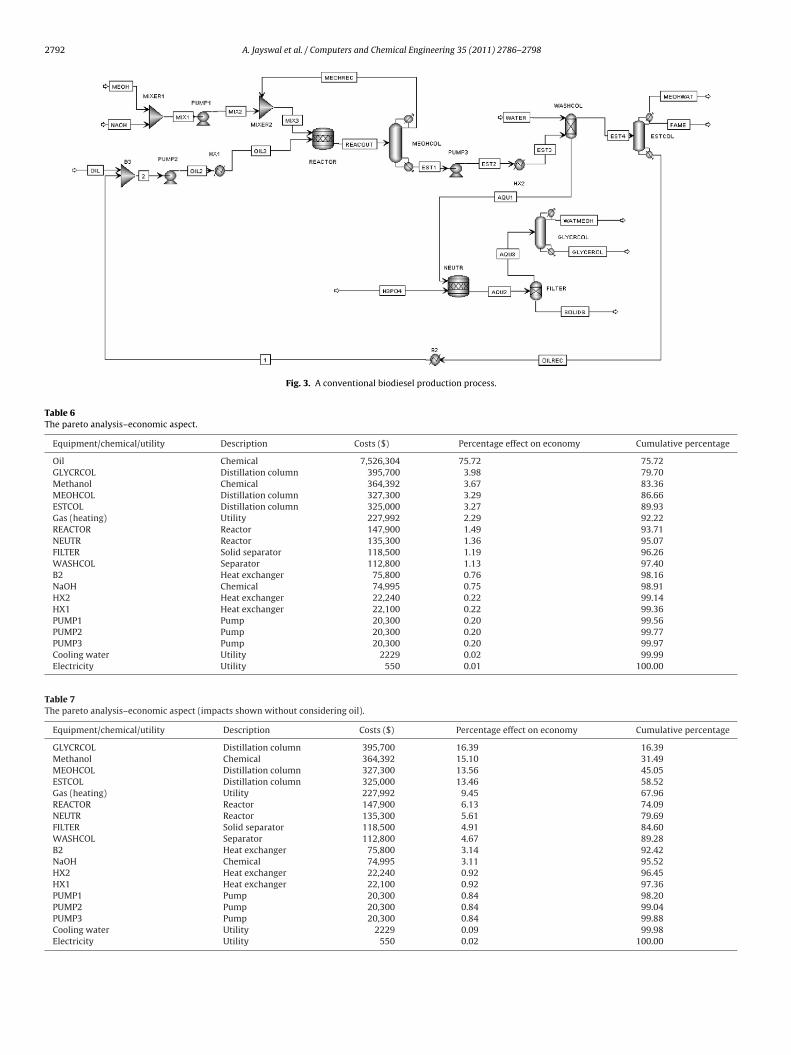
In this case study, the process simulator Aspen Plus is used. Theutputs of process simulators provide the inventory data neededo perform process assessment and selection. A flow sheet of theonventional process is provided in Fig. 3 (Aspen, 2008). In aonventional process, vegetable oil is mixed with liquid causticatalyst and methanol in a plug flow reactor namely “REACTOR”.he un-reacted methanol is then separated from product mix-ure in a distillation column “MEOHCOL”. The product biodiesel isater washed in the separator “WASHCOL” and the final product is
btained after separating un-reacted vegetable oil in a distillationolumn “ESTCOL”. The aqueous phase from WASHCOL separator iseutralized by H3PO4 in a reactor “NEURT” and an additional dis-illation column “GLYCRCOL” is required to separate by-productlycerol from water and methanol.
In comparison to both the enzyme- and acid-catalyzed transes-erification reactions, the high yield in a relatively short reactionime and the relative low cost makes the alkali-catalyzed methodhe dominating production method in current industrial practice.he transesterification reaction requires a low water (<0.06 wt%)nd free fatty acid (FFA) content (<0.5 wt%) in the feedstock. Thus,re-treatment of the feedstock is usually needed. Finally, due tohe presence of excess methanol and glycerol by-product, post-reatment of the biodiesel mixture is required. The main limitationsf this homogeneous process include the following aspects. Firstly,he FFA content of the triglyceride stock should be below 0.5 wt%or the alkali transesterification process to be efficient, since theresence of FFA competes with the transesterification reaction byonsuming alkali to produce soaps and water, which subsequently
auses emulsion formation. NaOH and glycerol together will formmulsion, which creates problems in the downstream separationnd purification of biodiesel. Secondly, the conventional transester-fication reaction tends to be slow and phase separation of glycerinNet present value ($) (1,834,893)Discounted cash flow rate of return (%) 7
is time consuming. Developing a continuous process leads to theuse of additional equipments, which ultimately contributes to thecapital cost. Thirdly, the catalyst dissolves fully in the glycerinlayer and partially in the FAME layer. As a result, raw biodieselis usually cleaned through a slow, tedious and an environmen-tally unfriendly water washing process. Certainly purified glycerincan be converted to other value-added products, however, cata-lyst contaminated glycerin has little value in today’s market and isincreasingly becoming a disposal issue. Another negative aspect ofthe homogeneously catalyzed process is that the catalysts are notre-usable.
In this case study, a comprehensive root cause analysis was con-ducted on the economic, environmental and social dimensions ofconventional biodiesel processes, i.e., the homogeneous catalystprocess. Table 3 shows the design parameters, feed conditions andreaction conditions of the process. One thing to be noted is thatfeasibility of biodiesel industries are much influenced by vegetableoil price and price of biodiesel. The capital cost of the two pro-cesses was estimated using Aspen Icarus Process Evaluator (2006).In this work, the cost of the raw materials and utilities based oninformation in 2008 are provided in Table 4.
3.1. Assessment results
The results of all three impacts are used to carry out the Paretoanalysis and prepare Pareto charts to identify major causes. Aspen
2792 A. Jayswal et al. / Computers and Chemical Engineering 35 (2011) 2786– 2798
Fig. 3. A conventional biodiesel production process.
Table 6The pareto analysis–economic aspect.
Equipment/chemical/utility Description Costs ($) Percentage effect on economy Cumulative percentage
Oil Chemical 7,526,304 75.72 75.72GLYCRCOL Distillation column 395,700 3.98 79.70Methanol Chemical 364,392 3.67 83.36MEOHCOL Distillation column 327,300 3.29 86.66ESTCOL Distillation column 325,000 3.27 89.93Gas (heating) Utility 227,992 2.29 92.22REACTOR Reactor 147,900 1.49 93.71NEUTR Reactor 135,300 1.36 95.07FILTER Solid separator 118,500 1.19 96.26WASHCOL Separator 112,800 1.13 97.40B2 Heat exchanger 75,800 0.76 98.16NaOH Chemical 74,995 0.75 98.91HX2 Heat exchanger 22,240 0.22 99.14HX1 Heat exchanger 22,100 0.22 99.36PUMP1 Pump 20,300 0.20 99.56PUMP2 Pump 20,300 0.20 99.77PUMP3 Pump 20,300 0.20 99.97Cooling water Utility 2229 0.02 99.99Electricity Utility 550 0.01 100.00
Table 7The pareto analysis–economic aspect (impacts shown without considering oil).
Equipment/chemical/utility Description Costs ($) Percentage effect on economy Cumulative percentage
GLYCRCOL Distillation column 395,700 16.39 16.39Methanol Chemical 364,392 15.10 31.49MEOHCOL Distillation column 327,300 13.56 45.05ESTCOL Distillation column 325,000 13.46 58.52Gas (heating) Utility 227,992 9.45 67.96REACTOR Reactor 147,900 6.13 74.09NEUTR Reactor 135,300 5.61 79.69FILTER Solid separator 118,500 4.91 84.60WASHCOL Separator 112,800 4.67 89.28B2 Heat exchanger 75,800 3.14 92.42NaOH Chemical 74,995 3.11 95.52HX2 Heat exchanger 22,240 0.92 96.45HX1 Heat exchanger 22,100 0.92 97.36PUMP1 Pump 20,300 0.84 98.20PUMP2 Pump 20,300 0.84 99.04PUMP3 Pump 20,300 0.84 99.88Cooling water Utility 2229 0.09 99.98Electricity Utility 550 0.02 100.00

A. Jayswal et al. / Computers and Chemical Engineering 35 (2011) 2786– 2798 2793
nalysi
Icappasnciornnamd
Fig. 4. The Pareto a
carus software was used to calculate the capital cost. The utilityost and cost of chemicals are calculated using the market pricess shown in Table 4. The values of the economic indicators areresented in Table 5. Based on the calculated results, Table 6 isrepared to show the percentage effect of each cost on the over-ll economy of the process and the corresponding Pareto chart ishown in Fig. 4. The results illustrates that the major factors for eco-omic dimension are the cost of oil. The oil price is dominant andontributes about 76% towards economic impacts. If the oil costs removed from the list, the readers can clearly see the impactsf other major factors. Table 7 and corresponding Fig. 5 show theesults of analysis without considering the impacts of oil on eco-omic analysis. As per the results, the other major causes for eco-
omic problems are distillation columns, i.e., GLYCRCOL, MEOHCOLnd ESTCOL, reactors (i.e., REACTOR and NEUTR) and chemical, i.e.,ethanol. So if the process can be made less complex by using feweristillation columns and reactors, it can be more economic.
Fig. 5. The Pareto analysis–economic aspec
s–economic aspect.
The root cause analysis on the environmental dimension is car-ried out for waste reduction and exergy efficiency. The resultsfrom the WAR software are shown in Table 8 and Fig. 6. Methyloleate, i.e., biodiesel is the root cause of environmental impactsamong all chemicals since it counts for about 80% of the contri-bution. However, biodiesel is the main product and the process isaimed at increasing its production, it is not possible in practicalscenario to remove biodiesel from the process. Keeping the prod-uct unchanged, it is visible that the major environmental impactsfrom the process come from the glycerol and methanol.
The efficiency indicators, energy efficiency and exergy effi-ciency, are calculated as well. The ExerCom software is used tocalculate the exergy of the process streams except the chemi-
cal exergy (Jacobs, 2009). The standard chemical exergy valuesof biodiesel, methanol and oil feed stock were collected and cal-culated from the literature (Szargut et al., 1988) and their valuesare listed below: methanol 718 kJ/mol, oil 35354.62 kJ/mol, FAMEt (without considering impact of oil).

2794 A. Jayswal et al. / Computers and Chemical Engineering 35 (2011) 2786– 2798
Fig. 6. The Pareto analysis–environmental aspect (the waste reduction).
Table 8The pareto analysis–environmental aspect (the waste reduction).
Case Iout (PEI/kg) Igen (PEI/kg) Flow rate (kg/h) Iout (PEI) Percentage effect on safety Cumulative percentage
Methyl oleate 0.0609 0.0609 1051.361 64.0384 81.81 81.81Glycerol 0.1150 0.1150 106.245 12.2182 15.61 97.42Triolein 0.0015 −0.0198 1050 1.5519 1.98 99.41Methanol 0.0040 −0.0359 117.2 0.4643 0.59 100.00
Table 9The pareto analysis–environmental aspect (the exergy efficiency).
Equipments Exergy loss Percentage effect on efficiency Cumulative percentage
WASHCOL 4.54 80.23 80.23GLYCRCOL 0.89 15.81 96.04Cooler 0.09 1.51 97.54ESTCOL 0.08 1.48 99.03MIXER1 0.02 0.42 99.45MEOHCOL 0.02 0.33 99.78Heater1 0.01 0.16 99.94MIXER2 0.00 0.05 100.00Heater2 0.00 0.00 100.00PUMP2 0.00 0.00 100.00B3 0.00 0.00 100.00Total 5.66 100.00
Table 10Enhanced Inherent Safety Index of the conventional homogeneous catalyst process.
Chemical Index Chemical Inherent Index ICI
Flammability IFL Explosiveness IEX Toxic limit ITOX Corrosiveness ICOR
Chemical Inherent Index, ICI
Methanol 0.35 0.23 0.23 0 0.81Oil, Triolein 1.05 0.00 5.25 0 6.30FAME, methyl oleate 1.05 0 5.26 0 6.31Glycerol 0.11 0 0.42 0 0.53NaOH 0.00 0 0.2 0.05 0.25Water 0.00 0 0 0 0.00H3PO4 0.00 0 0.25 0.05 0.30Na3PO4 0.00 0 0.07 0 0.07Total chemical Inherent Safety Index, ICI 2.56 0.23 11.68 0.10 14.6
Equipment Index Process Inherent Index IPI
Inventory II Process temperature IT Process pressure IP Equipment safety IEQ
Process Inherent Index, IPI
Pump 2 0 0 3 5Heat exchanger 2 0 0 3 5Reactor 1 0 0 4 5Distillation column 2 5 0 3 10Separator/extractor 1 0 0 1 2Total Process Inherent Safety Index, IPI 8 5 0 14 27Total Inherent Safety Index, ITI 41.6

A. Jayswal et al. / Computers and Chemical Engineering 35 (2011) 2786– 2798 2795
nmen
19eatelloiitpte
e
TT
TE
shown in Table 11 and Fig. 8. Distillation columns, biodiesel, oil,pumps, heat exchangers and reactors are responsible for the 90% ofthe impacts. It is evident from the results that reducing the number
Table 13Economic comparison between two processes.
Parameters Traditionalprocess
New process
Total capital investment ($) 8,247,978 3,901,402Total feedstock cost ($) 7,968,949 7,975,347Total utilities cost ($) 230,387 166,780Total waste management cost ($) 61,763 779
Fig. 7. The Pareto analysis–enviro
2282.91 kJ/mol, glycerol 1640.63 kJ/mol, NaOH 74.9 kJ/mol, water.5 kJ/mol, H3PO4 104 kJ/mol, Na3PO4 518.14 kJ/mol. The energyfficiency of the conventional process is 87.92% whereas the over-ll exergy efficiency of the process is 97.27% which also includeshe chemical exergy. The exergy efficiency excluding the chemicalxergy is only 37.21%. However, for this study calculation of exergyoss through various process steps is vital. Table 9 shows the exergyoss for each equipment with percentage effect of each equipmentn total efficiency. A Pareto chart is prepared using this data ands shown in Fig. 7. It is shown that the major cause for exergy losss the separator “WASHCOL” which is responsible for about 80% ofhe exergy losses. The purpose of WASHCOL in the conventionalrocess is to separate biodiesel from liquid catalyst and it is impor-
ant to remove the separator from the process to improve exergyfficiency.As discussed earlier, the safety analysis is performed using thenhanced Inherent Safety Index methodology and the scores are
able 11he pareto analysis–safety aspect.
Chemicals/equipments Score Percentageeffect on safety
Cumulativepercentage
Distillation column 10 24.1 24.1FAME, methyl oleate 6.3 15.2 39.2Oil, Triolein 6.3 15.2 54.4Pump 5 12.0 66.4Heat exchanger 5 12.0 78.4Reactor 5 12.0 90.5Separator/extractor 2 4.8 95.3Methanol 0.8 2.0 97.2Glycerol 0.5 1.3 98.5H3PO4 0.3 0.7 99.2NaOH 0.3 0.6 99.8Na3PO4 0.1 0.2 100.0Water 0.0 0.0 100.0
able 12xergy efficiency comparison between two processes.
Exergy in(MW)
Exergy out(MW)
Exergyefficiency (%)
Traditional processIncluding chemical exergy 161.57 157.16 97.27Excluding chemical exergy 0.43 0.16 37.21New processIncluding chemical exergy 160.77 157.18 97.77Excluding chemical exergy 0.42 0.18 42.86
tal aspect (the exergy efficiency).
shown in Table 10. The results of the safety root cause analysis are
Total labor cost ($) 1,510,080 755,040Total maintenance cost ($) 663,962 314,063Total operating overheads ($) 170,625 84,387Property taxes and insurance cost ($) 164,960 78,028Depreciation ($) 412,398 195,070General expenses ($) 362,604 362,742Total production cost ($) 11,545,728 9,932,235Total sales ($) 12,086,807 12,091,390Total profit ($) 541,079 2,159,155Net present value ($) (1,834,893) 9,340,064Discounted cash flow rate of return (%) 7 40
Table 14Safety comparison between two processes.
Inherent safety sub-indices Symbol Traditionalprocess
Newprocess
Chemical inherent safety index, ICI
Heat of main reaction IRM – –Heat of side reaction IRS – –Chemical interaction IINT – –Flammability IFL 2.6 2.6Explosiveness IEX 0.2 0.2Toxic exposure ITOX 11.7 11.2Corrosiveness ICOR 0.1 0.0Total chemical inherent safety index, ICI 14.6 14.0Process inherent safety index, IPI
Inventory II 8 6Process temperature IT 5 3Process pressure IP 0 0Equipment safety IEQ
ISBL 14 9OSBL –Safe process structure IST – –Total Process Inherent Safety Index, IPI 27 18Total Inherent Safety Index, ITI 41.6 32.0

2796 A. Jayswal et al. / Computers and Chemical Engineering 35 (2011) 2786– 2798
analy
op
cFcwtammc
Fig. 8. The Pareto
f distillation columns and reactors can improve safety aspect of therocess significantly.
Fig. 9 shows the Fishbone diagram, which represents the mainauses for all three aspects of root cause analysis. As shown in theishbone diagram, raw materials and the utility cost are the mainauses for the operating cost. Developing an alternative processhich is able to use cheap oil instead of vegetable oil can reduce
he economic impact of feedstock oil dramatically. The diagramlso shows that reactors, separator and distillation columns are the
ain causes for the capital cost of the conventional process. Theain reason of using these equipments is to separate the liquidatalyst from glycerol, which is the byproduct in this process. The
Fig. 9. The fish-bo
sis–safety aspect.
liquid catalyst is a root cause for complexity of the separation steps,low exergy efficiency and safety concerns. So efforts are made todevelop a heterogeneous catalyst process, which uses a solid cat-alyst, is able to accommodate low-grade feedstock oil, and onlyneeds a simpler separation.
On the safety aspect, distillation columns and reactors are maincauses for undesirable sustainability performance of the conven-tional biodiesel process. Overall, by switching to the heterogeneouscatalyst process, the process complexity is reduced and the triple
bottom line of sustainability is improved.Fig. 10 shows the flow sheet of a new process. Unlike homo-geneous catalysts, heterogeneous catalysts (i.e., Na2O, MgO) can
ne diagram.

A. Jayswal et al. / Computers and Chemical Engineering 35 (2011) 2786– 2798 2797
alyst biodiesel production process.
brssef&cbwu
toccict0tace$pIaIscs
TE
Table 16Normalized score of the two processes.
Traditional process New process
Economic 0.1234 0.8696Environmental impacts 0.7436 0.6929Efficiency 0.9259 0.946
process, especially on social and economic aspects.
Fig. 10. A heterogeneous cat
e operated in continuous processes and they can be reused andegenerated. Metal hydroxides, metal complexes, metal oxidesuch as calcium oxide, magnesium oxide, zirconium oxide andupported catalysts have been investigated. The continuous trans-sterification of triglycerides and simultaneous esterification ofree fatty acids with very low residence times was reported (McNeff
Nowlan, 2008). A variety of less expensive feedstock that oftenontain high levels of free fatty acids, such as tall oil, algae oil cane used. Based on the kinetics data reported by Singh (2008), Na2Oas chosen as the catalyst and a process flow sheet was designedsing Aspen Plus software.
A comprehensive sustainability assessment was conducted onhe economic, environmental, efficiency and social dimensionsf two biodiesel processes, i.e., the conventional homogeneousatalyst process and the new heterogeneous catalyst process foromparison. In the new process, no separator is required, whichncreases exergy efficiency significantly. The actual exergy effi-iency for the new process is 97.77%, in comparison to 97.27% inhe traditional process. The normalized score for exergy efficiency is.946 for the new process, in comparison to 0.9259 for the conven-ional process. In the new process, additional distillation columnsnd reactor are also not required, so the performance of new pro-ess is also improved in economic and safety aspects. Regarding theconomic sub-indicators, the NPV and IRR value of new process are9,340,064 and 40% respectively, which are much higher in com-arison to those of the conventional process (NPV – $1,834,893
RR 7%). The normalized score of the new process for economicspect is 0.8696 and that of the conventional process is 0.1234.
n safety assessment, a lower score indicates a safer design. Thecore of inherent safety for new process is only 32 while that ofonventional process has a score as high as 41.6. The normalizedcore on safety aspect for new process is 0.64 and for conventionalable 15nvironmental assessment results comparison between two processes.
PEI outputrate (PEI/h)
PEIgenerationrate (PEI/h)
PEI output/mass ofproduct(PEI/kg)
PEIgeneration/mass ofproduct(PEI/kg)
Traditional process 146.7 82.25 0.1392 0.07800New process 137.7 75.74 0.1305 0.07179
Safety 0.832 0.64
process the same is calculated as 0.832. The normalized score ofenvironmental impacts using WAR algorithm is 0.6929 for the newprocess and 0.7436 for the traditional process, which indicates thatthe new process is cleaner. The original values comparing thesetwo processes in the efficiency, economic, safety and environmen-tal aspects have been shown in Tables 12–15 respectively. Table 16lists the normalized values being discussed above. The details ofthe normalization procedure are reported in the paper by Li et al.(2011). Fig. 11 shows the normalized score for each indicator andthe final result comparison between the two processes. As shown inthe figure, the new process is more sustainable than the traditional
Fig. 11. Overall comparison of the two processes.

2 emica
4
ctcbsd
A
tT
R
AA
AD
E
H
H
H
798 A. Jayswal et al. / Computers and Ch
. Conclusion
A systematic approach for sustainability root cause analysis ofhemical/energy production process has been presented, wherehe economic, environmental, and social sustainability are all beonsidered. The methodology will be general enough so as toe applicable to different chemical/energy production systems. Ithould help the designers advance their practice for sustainableevelopment more systematically.
cknowledgements
This work is in-part supported by the National Science Founda-ion under Grants Nos. 0737104, 0736739, and 0731066 and theexas Hazardous Waste Research Center.
eferences
mmerman, M. (1998). The root cause analysis handbook. Productivity Press.nderson, B., & Fagerhaug, T. (2006). Root cause analysis: Simplified tools and tech-
niques. Wisconsin: Quality Press.spen. (2008). Aspen Plus biodiesel model. Burlington, MA: Aspen Technology, Inc.ow, C. (1987). DOW’s fire and explosion index hazard classification guide. New York:
American Institute of Chemical Engineers.dwards, D. W., & Lawrence, D. (1993). Assessing the inherent safety of chemical
process routes: Is there a relation between plant costs and inherent safety?TransIChemE, 71(B), 252–258.
ass, M. J., & McAloon, A. J. (2006). A process model to estimate biodiesel productioncosts. Bioresource Technology, 97, 671–678.
eikkila, A.-M. (1999). Inherent safety in process plant design. An index-
based approach. Technology. Helsinki: Helsinki University of Technology,Doctor.erder, P. M., & Weijnen, M. P. C. (1998). Quality criteria for process design in thedesign process – industrial case studies and an expert panel. Computers andChemical Engineering, 22(Supplement), 513–520.
l Engineering 35 (2011) 2786– 2798
Jacobs. (2009). ExerCom v2.2 manual, enthalpy and exergy function for gases and liq-uids. Amsterdam, Netherlands: Jacobs Consultancy.
Kelleher, K. (1995). Cause-and-effect diagrams: Plain and simple. WI: Joiner AssociatesIncorporated.
Li, X., Zanwar, A., Jayswal, A., Lou, H. H., & Huang, Y. L. (2011). Incorporating exergyanalysis and inherent safety analysis for sustainability assessment of biofuels.Industrial and Engineering Chemistry Research, 50(5), 2981–2993.
McNeff, C. V., & Nowlan, D. T. (2008). Continuous catalytic system for biodieselproduction. Applied Catalysis, 343, 39–48.
Mond, I. (1985). The mond index. Winnington.Othman, M. R., Repke, J. U., Wozny, G., & Huang, Y. L. (2010). A modular approach
to sustainability assessment and decision support in chemical process design.Industrial and Engineering Chemistry Research, 49(17), 7870–7881.
Pintaric, Z. N., & Kravanja, Z. (2006). Selection of the economic objective functionsfor the optimization of process flow sheets. Industrial and Engineering ChemistryResearch, 45, 4222–4232.
Robitaille, D. (2004). Root cause analysis: Basic tools and techniques. CA: Paton PressLLC.
Saltelli, A., Ratto, M., Andres, T., Campolongo, F., Cariboni, J., Gatelli, D., et al. (2008).Global sensitivity analysis. The primer. John Wiley & Sons.
Seider, W. D., Seader, J. D., & Lewin, D. R. (2004). Product and process design principles:Synthesis, analysis, and evaluation (2nd ed.). New York: John Wiley and Sons.
Singh, A. K. (2008). Development of conventionally catalysed chemical process to pro-duce biodiesel. Mississippi: Mississippi State University, MS.
Surhone, L., Timpledon, M., & Marseken, S. (2010). Pareto analysis: Statistics, decisionmaking, Pareto principle, fault tree analysis, failure mode and effects analysis. Paretodistribution. Wikipedia Betascript Publishing.
Szargut, J. (2005). Exergy method: Technical and ecological applications. Southampton:WIT.
Szargut, J., Morris, D. R., & Steward, F. R. (1988). Energy analysis of thermal, chemical,and metallurgical processes. New York, NY: Hemisphere Publishing.
Turton, R., Bailie, R., Whiting, W. B., & Shaeiwi, J. A. (2003). Analysis, synthesis, anddesign of chemical processes (2nd ed.). Upper Saddle River, NJ: Prentice Hall.
Wilson, P., Dell, L., & Anderson, G. (1993). Root cause analysis: A tool for total qualitymanagement. Wisconsin: Quality Press.
Young, D. M., & Cabezas, H. (1999). Designing sustainable processes with simula-tion: The waste reduction (WAR) algorithm. Computers and Chemical Engineering,23(10), 1477–1491.
Zabeti, M., Daud, W. M., & Kheireddine, M. A. (2009). Activity of solid catalysts forbiodiesel production. Fuel Processing Technology, 90, 770–777.