Embed Size (px)
Citation preview

University of Nebraska at Omaha University of Nebraska at Omaha
DigitalCommons@UNO DigitalCommons@UNO
Student Work
5-1-1997
Computerized Brainstorming and Decision Making Computerized Brainstorming and Decision Making
Virginia Louise Collins University of Nebraska at Omaha
Follow this and additional works at: https://digitalcommons.unomaha.edu/studentwork
Recommended Citation Recommended Citation Collins, Virginia Louise, "Computerized Brainstorming and Decision Making" (1997). Student Work. 1665. https://digitalcommons.unomaha.edu/studentwork/1665
This Thesis is brought to you for free and open access by DigitalCommons@UNO. It has been accepted for inclusion in Student Work by an authorized administrator of DigitalCommons@UNO. For more information, please contact [email protected].

COMPUTERIZED BRAINSTORMING AND DECISION MAKING
A Thesis
Presented to the
Department of Psychology
and the
Faculty of the Graduate College
University of Nebraska
In Partial Fulfillment
of the Requirements for the Degree
Master of Arts
University of Nebraska at Omaha
by
Virginia Louise Collins
May 1997

UMI Number: EP73505
All rights reserved
INFORMATION TO ALL USERS The quality of this reproduction is dependent upon the quality of the copy submitted.
In the unlikely event that the author did not send a complete manuscript and there are missing pages, these will be noted. Also, if material had to be removed,
a note will indicate the deletion.
Dissertation PW&lisMng
UMI EP73505
Published by ProQuest LLC (2015). Copyright in the Dissertation held by the Author.
Microform Edition © ProQuest LLC.All rights reserved. This work is protected against
unauthorized copying under Title 17, United States Code
ProQuestProQuest LLC.
789 East Eisenhower Parkway P.O. Box 1346
Ann Arbor, Ml 48106- 1346

THESIS ACCEPTANCE
Acceptance for the faculty of the Graduate College, University of
Nebraska, in partial fulfillment of the requirements of the degree of Master’s of
Arts in Industrial/Organizational Psychology, University of Nebraska.
Committee
J. PJiilib Grager, Ph.D. Department of Psychology
d Millimet, Ph.D. Department of Psychology
aAMiW'T QQ. jjrfar_____________William Clute, Ph.D. Department of Sociology
P j.p .cherer, Ph.D. “ Department of Psychology
Chairperson_Roni-Reiter Palmon, Ph.D.
Date - w 30. my

ACKNOWLEDGMENTS
I would like to thank Dr. Roni Reiter-Palmon for your expertise,
encouragement and guidance. This research is a reflection of your care and
attention to detail and willingness to see me through the tough times. You
shared your experience and demonstrated your patience as we wandered this
pathway together.
Thank you also to Dr. Philip Craiger, Dr. Lisa Scherer, Dr. Ray Millimet
and Dr. Bill Clute. Each of you made major contributions in shaping this piece
of research. I appreciate the time and effort you gave so willingly. In addition
to my committee, a major contribution was made by Tony Susa and Jody
lilies. As quality raters, your job was arduous but was carried out with
diligence and a smile. Thank you.
To Joan Bell, a special thanks for creating the computer environment
used in this research. Joan, your computer networking expertise was a
lifesaver. Thank you for your time and patience. I would also like to thank
Ventana Corporation for donating the GroupSystem software used in this
study. Your technical support saved the day more than once!
To Travis, Evan and Jim, though our lives have changed, you have
never wavered in your support and encouragement as I’ve reached for my
stars. I thank you with my love.
And to Libby who walked each step with me, encouraging me to trust
myself, giving me courage and hope and laughing me through each day, I
thank you with my love. You are a golden thread in the tapestry of my life.

IV
Table of Contents
Introduction . 1
Group versus Individual Performance . . 2
Group Process and Performance . 6
Group Process and Technology 11
Problem Construction 14
Purpose of the Study 20
Method 22
Participants . 22
Setting and Apparatus 22
Procedures . 24
Phases of Research 24
Pregroup Phase 24
Collaboration Phase 26
Postgroup Phase 26
Dependent Variables 27
Quality Ratings 27
New Factors Generated 29
Time . 29
Additional Measures 29
Computer Questionnaire 29
Problem Solving Process Questionnaire . 30

Table of Contents (continued)
Analysis 31
Data Sets 31
Full Data S et. 32
Initial Solution Quality Ratings 32
Number of New Factors Generated 32
Satisfaction Survey Subscales 33
Computer Survey Subscales 33
Group Data Set 33
Final Solution Quality Ratings 34
Comparison of Initial Solution to Final Solution
on Quality Ratings . 34
Time . 34
Pilot Study 35
Results 36
Confounding Variable - Computer Experience - Full Data Set . 40
Analysis of Variance - Quality 40
Pregroup Quality Ratings . 40
Postgroup Quality Ratings . 41
Repeated Measure Quality Ratings 46
Analysis of Variance - New Factors Generated . 46
Analysis of Variance - Time 53

vi
Table of Contents (continued)
Additional Measures 55
Computer Experience - Full Data Set 55
Computer Experience: Factual 58
Computer Experience: Affect 61
Satisfaction Survey - Full Data Set 64
General Satisfaction 64
Evaluation Apprehension 64
Perception of Time . 68
Synergy & Stimulation 68
Production Blocking and Free Riding 70
Discussion 73
Hypothesis 1: Quality of Solutions Generated 73
Hypothesis 2: Number of New Factors Generated 76
Hypothesis 3: Time . 77
Computer Experience 79
Implications of Findings 80
Study Limitations 82
Future Research 85
References . 89
Appendixes . 95

vii
List of Tables
Table
01 Participant’s Random Assignment 23
02 Phases of Study 25
03 Descriptives for Variables . 37
04 Correlations: Dependent Variables - Full Data Set 38
05 Correlations: Quality Ratings - Group Data S et. 39
06 Pregroup Quality Ratings . 42
07 Pregroup Quality Ratings - Full Data S et. 43
08 Postgroup Quality Ratings . 44
09 Postgroup Quality Ratings - Group Data Set 45
10 Repeated Measures-Appropriateness Ratings . 47
11 Repeated Measure - Originality Ratings . 48
12 Repeated Measure - Resolving Power Ratings . 49
13 Repeated Measure - Appropriateness Rating 50
14 Number of New Factors Generated 52
15 Number of New Factors Generated - Group/Media Interaction 54
16 Time for Completion of Task 56
17 Time in Minutes for Completion of Problem Solving Task 57
18 ANOVA Results - Computer Experience - Factual 59
19 Mean Response Rates: Factual Computer Experience 60

viii
List of Tables (continued)
20 Computer Experience - Affect 62
21 Mean Response Rates: Affective Computer Experience 63
22 Mean Response Rates for Satisfaction Survey Subscales 66
23 Satisfaction Survey: General Satisfaction Subscale 66
24 Satisfaction Survey: Evaluation Apprehension Subscale 67
25 Satisfaction Survey: Perception of Time Subscale. 69
26 Satisfaction Survey: Synergy and Stimulation Subscale 71
27 Satisfaction Survey: Production Blocking Subscale. 72
28 Satisfaction Survey: Free Riding Subscale. 72

IX
Figure Captions
Figure
1 Repeated Measure for Mean Appropriateness Rating . 50
2 Group/media interaction for number of new factors generated. 54
3 Time - Group/Media Interaction 56
4 Interaction by group and media for factual computer experience 60
5 Interaction by group and media for affective computer experience 63
6 Group by media interaction for mean evaluation apprehension
responses on the satisfaction survey. 67
7 Group by media interaction for mean synergy and stimulation
responses on satisfaction survey. . 71

Abstract
Computers are widely used in business and industry today and are frequency
considered essential to efficient job performance. A great deal of research
has been generated over the past decade regarding computer use in the
workplace. However, research has lagged regarding computer technology
and group performance.
The purpose of this study is to determine empirically if there are
enhancements in the performance of groups and individuals when they use a
computer to facilitate the problem solving process. It is hypothesized that the
quality of solutions generated to a complex problem will be a function of the
interaction between use of computer and whether participants work
independently or in groups. In addition, number of new factors generated and
time taken for completion of the problem solving task will also be a function of
this same interaction.
One hundred and sixty-one participants were randomly assigned to one
of four treatment conditions: group computer, group non-computer, individual
computer and individual non-computer. All participants were asked to
generate factors which might contribute to a final solution of the complex
problem and to generate an initial and final solution to the problem. The group
computer condition utilized GroupSystems (GS) software to network
computers for group interaction and to facilitate individual work on the
computer. The other two treatment conditions (group non-computer and
individual non-computer) employed paper and pencil. The problem solutions

were rated for appropriateness, originality and resolving power. In addition,
number of new factors generated were counted and time taken for task
completion was recorded.
Overall, this study had several major findings. A marginally significant
difference was noted in the gain in quality of solution as measured by
appropriateness from the pre-group to the post-group condition for those
people working in groups. An “anticipation effect” appears to have been at
work in the group conditions which contributed to a depression of the quality
of the original solutions. Contrary to previous research on the group dynamics
of production blocking, free riding and evaluation apprehension, the non
computer group generated significantly more new factors than did the other
conditions. In addition, groups took significantly more time for task
completion than did those individuals working alone. The computer group
stayed engaged for a significantly greater time than did other conditions. This
group also report greater satisfaction with the problem solving process.
This study indicates that problems can be addressed and solved
effectively via computer interaction. Such access to the dialogue of problem
solving allows for individual time management as well as group interaction.

1
Generation X is moving full steam ahead into the American workplace as
the Baby Boom Generation eases into retirement. Although this generation of
workers has grown up in the computer age, we are still at the beginning of our
understanding of the dynamics that electronic technologies bring to our work
environment. Computers are currently so widely used in business and industry
that they are considered to be essential to efficient job performance at all levels of
organizational life. As computer hardware and software advances continue at
lightning speed with design updates occurring every six months, research into the
impact of these technologies on individual and group performance has lagged
behind (McGrath & Hoilingshead, 1994). Although there has been a wealth of
literature over the past decade about computers in the workplace, very little
research has been conducted from the group perspective.
The purpose of this study is to determine empirically if there are
enhancements in the performance of groups and individuals when they use a
computer to facilitate the problem solving process. To gain a stronger
understanding of this relationship, a review of past research that looks at group
performance, group versus individual performance, and the empirical studies
dealing with group performance and the use of computers will be reviewed.
This review will focus on the body of research that uses a decision making
or problem solving task approach. The productivity or performance of a group

2
frequently is dependent on a groups quick and efficient solution to problems of
various complexity. By improving a group’s ability to solve a problem, or to make
the best decision, it should be possible to improve the group’s productivity as well
(Moreland & Levine, 1992). The review will begin with group performance theory
as the foundation on which the current technology performance research is
based.
Group versus Individual Performance
Compelling evidence that groups were better at problem solving and
decision making than individuals working on their own resulted from numerous
groups versus individuals experiments during the first half of the 20th century
(Davis, 1992). This is exemplified by Shaw’s (1932) experiment comparing group
versus individual performance on a complex problem solving task. These results
suggested a proportional group performance superiority over individual
performance. The efficiency (or inefficiency) of the group process was not
evaluated at that time, and for better than twenty years, the belief in the efficacy
of the group process was supported.
Lorge and Solomon (1955) reanalyzed the Shaw (1932) data and found
group inefficiencies based on probabilities of problem solvers being members of
groups. This became known as the Lorge-Solomon pooling model. Lorge and
Solomon (1955) hypothesized that the superiority of group performance found by
Shaw (1932) was a function of the ability of one or more of its members to solve
the problem presented without taking into account the interpersonal rejection and

3
acceptance of suggestions among its members. This implies that group
enhancement is due to the abilities of the individual members rather than the
contribution of personal interaction. Davis (1992) argues that freely interacting
groups usually fall below the Lorge-Solomon baseline, occasionally match it and
seldom exceed it. It should be kept in mind that this inefficiency is an expression
of low group return relative to individual investment and not a function of
comparison of solutions generated or speed of solution generated. A direct
comparison based on these factors typically shows groups producing more
solutions in a shorter time period than individuals (Davis, 1992).
The “assembly bonus effect” (Tindale & Larson, 1992a, 1992b) makes the
assumption that a group's combined knowledge decisions will be of higher quality
than any decision made by an individual in the group (Collins & Guetzkow, 1964).
The implication of this is that the shared knowledge in the group will combine
synergistically to produce the higher quality product. Nemeroff and King (1975)
observed this effect with trained participants under consensus decision
conditions. Michaelson, Watson and Black (1989) also studied the assembly
bonus effect. Using trained participants, they found support for group superiority
over the group's most knowledgeable member on low complexity decision-making
tasks. These tasks were predominantly taken from course tests requiring recall,
application and some synthesis. These findings were replicated in a second study
(Watson, Michaelson, & Sharp, 1991).

4
Michaelson et al.’s (1989, 1992) interpretation of their findings have
been challenged by Tindale and Larson (1992). They endeavored to replicate the
Michaelson et al. study using a computer simulation. Their findings were typical
of past research results with ad hoc laboratory groups; there were no assembly
bonus effects. This was contrary to the results Michaelson et al. produced with
the same data. They argued that the difference in interpretation of the data
stems from the inferences of Michaelson et al. which were drawn from total test
scores whereas the processes operate at the single item level. Tindale and
Larson believe that when the phenomenon of interest, in this case the assembly
bonus effect, operates on the level of the single item or disaggregate elements, it
is inappropriate to aggregate the items for analysis. This process produces
results that are not consistent with the underlying theoretical construct of
assembly bonus effect which requires that the group's performance is not
attributable to a combination of the individual efforts (Collins & Guetzkow, 1964).
Numerous situational factors have also been found to influence subjects
performance within a group. For example, Kameda and Davis (1990) found a
move toward a more conservative decision choice for members performing within
a group. Group decision choice was compared to individual decision choice. All
participants were exposed to the influence of differing levels of gains and losses.
They found that individuals tended to make riskier choices under recent loss
conditions. However, this decision making tendency did not transfer to the three

5
member group decision situation in which conservative decisions tended to
overrule risky choice.
In a summary of the research on the communication aspects of decision
making in groups, Hirokawa and Johnston (1989) found three ways that group
decision making is influenced by communication processes: (a)individual
variables, such as attitudes, beliefs and values; (b)critical task requirements and
functions; and, (c)social reality boundaries within which the decision is shaped.
This communication process, along with social variables pertaining to the
interpersonal relationships within the group and normative variables constituted
by explicit decision rules all act on a global level to influence group decision
making.
The nature of the problem to be solved and the process people engage in
to arrive at a solution appear to influence the quality of decisions for groups
(Hinsz, 1991). Under conditions of explicitly delineated process with a well-
defined problem, Davis and Toseland (1987) found no significant difference
between individuals (nominal groups) and interactive groups on the quality of the
consensus decision. This study employed the use of group process leaders who
had been trained in the use of Social Judgment Analysis, but were naive as to the
experts' solutions to the problems. This approach can be compared to studies
employing ill-defined problems with moderate process structure definition, where
creativity is required. Under such conditions, interactive group process has been
shown to impede both decision making and creativity (Vroom, Grant & Cotton,

6
1969). Hill (1982) conducted a meta-analysis on 140 studies on group versus
individual decision making. He concluded that under conditions of high problem
complexity, the group performance was often inferior to the best individual
performance.
These conditions of high problem complexity now prevail for groups
working in the fast paced maelstrom of today’s business and industry. As stated
earlier, the use of computers to facilitate performance in groups has been widely
applied and reported but little researched. Over the past ten years, some effort
has been made to fill this gap. These efforts will be summarized next.
Group Process and Performance
Research into group productivity and performance has been a roller
coaster ride since Marjorie Shaw’s (1932) classic experiment that attempted to
prove the superiority of group productivity over individual productivity. The latest
resurgence began with the publication of Ivan Steiner’s book, Group Process and
Productivity, in 1972. This marked the point at which interest in developing
systems to support effective performance for a variety of tasks, including decision
making, began in earnest (McGrath & Hollingshead, 1994). Steiner’s (1972)
research focused on ways to improve group productivity through the elimination
of group inefficiencies. Brainstorming, nominal group techniques, and many other
processes have their roots in this fertile period.
Brainstorming is a well established technique used for the purpose of
generating ideas in an uncensored, uncritical environment. Although it is widely

7
used today, there is little empirical evidence to support the superiority of
brainstorming over other idea generation techniques (Gallupe, Cooper, Grise, &
Bastianutti, 1994). Frequently, comparisons are drawn between the quantity of
ideas generated in brainstorming groups and the quantity of ideas generated in
groups where individuals work through a process of individual idea generation,
pool their ideas and eliminate redundant ideas. With this later procedure known
as a nominal group technique, results typically show that nominal groups
outperform brainstorming groups. Researchers attribute this lack of superiority in
brainstorming groups over nominal groups to three major group dynamics:
production blocking, evaluation apprehension and social loafing (Gallupe, etal.,
1994). Production blocking occurs when an individual in a group cannot
immediately express his or her idea because someone else is expressing an idea
at that particular moment. Evaluation apprehension occurs when individuals are
reluctant to express their ideas in a group for fear of being criticized by other
members. Social loafing, also known as free riding, occurs when an individual in
a group is content to sit back and let others do the work knowing all will get credit
for the group contribution.
In spite of these problems, group brainstorming remains a mainstay in
industry and organizations due to a perception of productivity (Paulus, Dzindolet,
Poletes, & Camacho, 1993). An analysis by these researchers revealed a
tendency for brainstorming participants to report a perception of productivity bias
in favor of groups versus solitary brainstorming. This favorable evaluation of
8
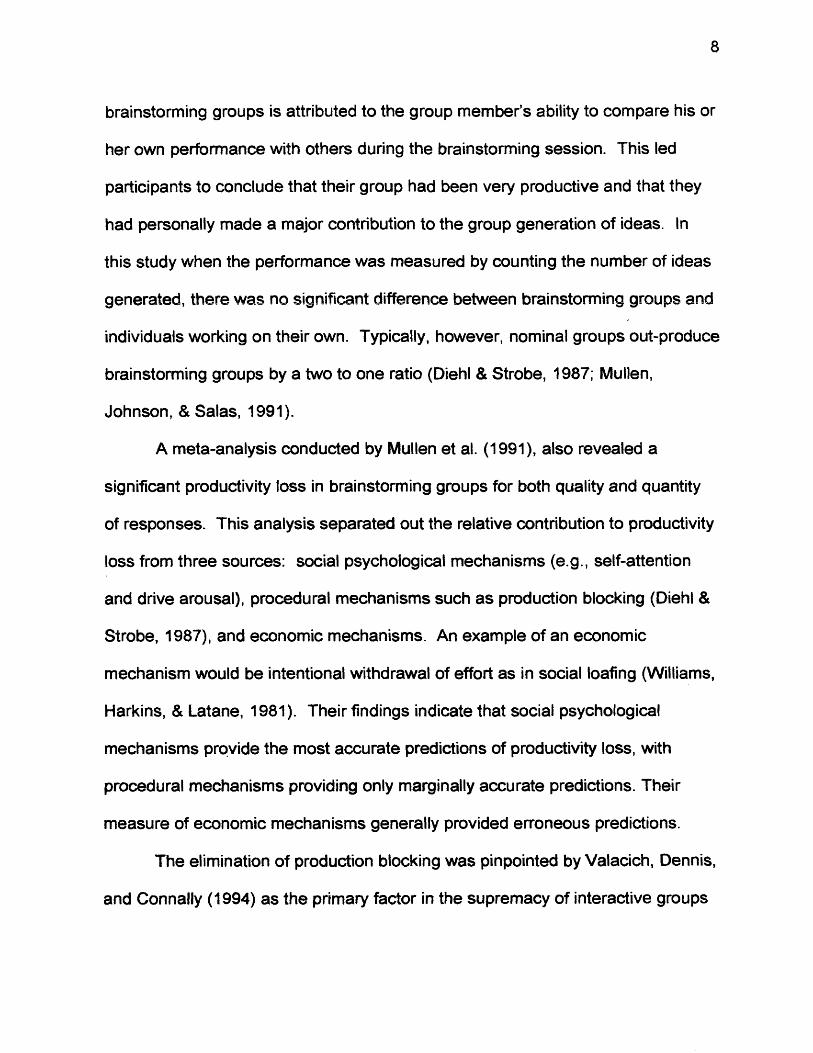
brainstorming groups is attributed to the group member’s ability to compare his or
her own performance with others during the brainstorming session. This led
participants to conclude that their group had been very productive and that they
had personally made a major contribution to the group generation of ideas. In
this study when the performance was measured by counting the number of ideas
generated, there was no significant difference between brainstorming groups and
individuals working on their own. Typically, however, nominal groups out-produce
brainstorming groups by a two to one ratio (Diehl & Strobe, 1987; Mullen,
Johnson, & Salas, 1991).
A meta-analysis conducted by Mullen et al. (1991), also revealed a
significant productivity loss in brainstorming groups for both quality and quantity
of responses. This analysis separated out the relative contribution to productivity
loss from three sources: social psychological mechanisms (e.g., self-attention
and drive arousal), procedural mechanisms such as production blocking (Diehl &
Strobe, 1987), and economic mechanisms. An example of an economic
mechanism would be intentional withdrawal of effort as in social loafing (Williams,
Harkins, & Latane, 1981). Their findings indicate that social psychological
mechanisms provide the most accurate predictions of productivity loss, with
procedural mechanisms providing only marginally accurate predictions. Their
measure of economic mechanisms generally provided erroneous predictions.
The elimination of production blocking was pinpointed by Valacich, Dennis,
and Connally (1994) as the primary factor in the supremacy of interactive groups

9
over nominal groups in an electronic media. Using the University of Arizona
GroupSystems Electronic Brainstorming (EBS) software, this research team also
took into consideration the group size and found a consistent performance
enhancement for EBS groups over nominal groups when group size exceeded
eight to ten members. Performance was found to be equal for EBS groups and
nominal groups for group sizes ranging from three to six members. Valacich et
al. (1994) concluded that for groups above a moderate size (eight to ten
members), groups using the EBS technology outperform nominal groups on
production of unique ideas. Performance is accomplished without any loss in
idea quality or participant satisfaction. This research demonstrates that
stimulation by other’s ideas at short intervals can lead to higher productivity in
idea generation over working alone.
Dennis and Valacich (1994) also found a group size main effect for
electronic media brainstorming with optimal group size effect occurring in groups
with 12 to 18 members. They suggest that the pattern of electronic
communication could hold the key to this difference that occurs as a function of
group size. An analysis of the conversation patterns used by the subjects in
these groups indicates that the smaller groups tended to follow typical social rules
for conversation, responding to others comments. Statistically significant
differences were found between groups in the number of entries that make
reference to a previous entry. The smaller groups made more frequent reference
to others comments. As the group size increased, this communication technique

10
was not used as readily, perhaps due to the increased amount of information
requiring processing. This social communication technique is replaced with a
’’multiple monologue” technique that appears to facilitate the increase in idea
generation (Dennis & Valacich, 1994).
A concluding word about group size is appropriate. Ideally, optimal group
size should be determined by the situation and the complexity of the task or
problem to be solved. There are situations that would benefit from the
aggregation of experts with diverse backgrounds (Valacich et al., 1994). Such a
group would have very little overlap in knowledge and skills. Typically, however,
these studies have targeted fluency as the dependent variable, having subjects
generate multiple responses to well-defined problems (e.g. What are all the
possible ways for the State Department of Tourism to attract tourists?). There
appears to be general agreement that the number of good ideas generated is
highly correlated with the total number of ideas (Valacich et al., 1994; Diehl &
Strobe, 1987). The conclusion is then drawn that the high cost of solution quality
evaluation is not justified. Following this research, Diehl and Strobe decided to
only measure number of ideas generated and to stop measuring idea quality. For
this reason quality is assumed when number of alternatives is high even though it
is frequently not measured. The relationship between quality and quantity could
be expected to be different when solving ill-defined tasks.
In addition to the group effect mentioned above, social choice has been
shown to effect group function and performance. Grofman and Feld (1992)

11
reviewed the literature concerning social choice theory and majority rule voting
using a mathematical approach. Grofman and Feld point out the tendency toward
selection of alternatives that are central representations of the group rather than
original or creative problem solutions that could be of higher quality. They
indicate that when a group makes a decision, there can be a strong force toward
maintaining the status quo. Similar conclusions were reached by Janis (1982) in
his research. He discovered that for well established groups there exists in-group
pressures to seek consensus. These pressures result in a reduction of mental
efficiency, moral judgment, and reality testing that Janis labeled groupthink. This
process is characterized by a group holding the illusory belief of consensus on an
issue, when in fact there are unexpressed doubts and reservations. The
suppression of these doubts and reservations occurs out of loyalty to the group or
to the group leader. There is also a tendency for the group to overestimate the
quality and inherent morality of the group. This leads to group rationalization for
defective plans and decisions.
It can be readily seen from the literature, that there are a number of factors
that contribute to lower performance measures in group face-to-face interaction.
These factors are further clarified through a review of research that reviews group
process and technology.
Group Process and Technology
Contrary to popular conception, typical group meetings are still facilitated
through the use of flip charts and large hand written notes which express the

12
collaborative effort of group members (Johansen, 1989). The move toward
electronic group facilitation, however, is currently underway with software moving
out of the research laboratory and into actual use in the business community.
There is an emerging trend toward electronically supported group decision
making, supported by a fast growing software industry that has developed various
“groupware” system software. The use of such electronic technologies are
perceived to be a benefit to business from both a performance and a cost
standpoint. This perception has not been well supported in the empirical
research forum; however, the trend in industry toward business teams as problem
solving units will probably continue to drive the trend toward electronic supported
group processing. Companies with decentralized project teams, high
concentrations of networked PCs, and flexible organizational structures will be in
the best position to capitalize on the blossoming technology (Johansen, 1989).
Dhar and Olson (1989) encounter collaborative efforts most often directed at
communication and problem solving. They suggest that electronic group decision
teams provide “added value” benefits to the collaborative process. This occurs in
the same way that electronic mail gives “added value” over face to face
communication in the form of quick, action-oriented written communication.
The business environment in the information age is faced with an ever
increasing need for knowledge within a complex and turbulent infrastructure.
Huber (1984) suggests this necessitates faster organizational decision making,
continuous information acquisition, organizational innovation and quicker

13
information distribution in order to avoid overload, all of which point the way to
electronic systems utilization at all levels of an organization.
Group electronic systems provide expanded dimensions for conversation
unfettered by normal rules of face-to-face communication (Stefik & Brown, 1989).
Research on diversity and group decision making processes suggests that
homogeneous groups perform better than diverse groups (i.e., in terms of gender,
culture, race, age, etc.), but that diversity can also serve to increase a group's
performance (Maznevski, 1994). Group diversity provides more perspectives for
solving problems in that diverse groups have more viewpoints at their disposal
and therefore have a higher potential for performance. This diversity in
knowledge, skills, gender and cultural perspectives can be a source of synergy
for a group (Dennis & Valacich, 1993). However, diversity may also introduce
communication barriers that contribute to an inability to integrate the
perspectives. When the communication variables, such as motivation, ability to
understand another’s perspective (decenter), and confidence in one’s ability to
communicate are all working in a positive direction, the potential for problem
solving within the group is increased (Maznevski, 1994). This dilemma posed by
the benefits of diversity versus the decrements due to communication barriers
can possibly be circumvented through electronic communication media. Every
participant brings equal status and diversity to an environment that doesn’t
recognize age, ethnicity or gender thereby increasing the potential for synergy
within the group.

14
The use of a computer network to facilitate brainstorming has been shown
to overcome many of the brainstorming barriers and to assist a group through the
simultaneous generation of ideas via computer to achieve performance in excess
of that achieved by nominal groups or verbal brainstorming groups (Nunamaker,
Dennis, Valacich, Vogel & George, 1991). Although performance was measured
by number of non-redundant ideas, this research sets the stage for the current
thesis research and the investigation of quality of solution that comes out of
computer network problem solving activities.
This thesis intends to examine the relationship between a number of
variables connected to problem solving. The subjects will be required to make
decisions using information presented in the form of a complex, ill-defined
problem. Most previous studies have focused on well-defined problems. Well-
defined problems are rare in the work environment where problems tend to be
complex and ill-defined. The approach required with such ill-defined problems
differs from the approach required for well-defined problems. Before ideas can
be generated for ill-defined problems, problem construction or definition is
required (Mumford, Reiter-Palmon & Redmond, 1994).
Problem Construction
Problem construction has been shown to effect the problem solving
process. Research by Reiter-Palmon (1993) suggests that problem construction
can provide a plan for problem solving activities that contributes to the quality of
the problem solution. This research examined an individual’s interpretation and

15
definition of ambiguous situations as a function of previous problem solving
efforts. Some individuals were able to restate problems in numerous patterns
with a variety of definitions making them more likely to find a problem definition
that was a fit for their particular experience and knowledge structure. In turn, the
availability of knowledge and a wide array of information or availability of
environmental resources, can act to enhance this problem finding (i.e., problem
restating) ability. A basic level of problem finding (problem construction) skill,
however, appears to be requisite before people can take advantage of the
opportunities presented by the environment. Those who are lacking in this basic
skill would not be able to benefit from the additional information provided by the
environment, and in fact, this additional information could serve to reduce the
quality of their problem solutions.
Mumford, Mobley, Uhlman, Reiter-Palmon and Doares (1991) suggest a
model for creative problem solving and present a design displaying the
hypothesized relationships among eight processes: (a) problem construction, (b)
information encoding, (c) category search, (d) specification of best-fitting
categories, (e) combination and reorganization of best-fitting categories, (f) idea
evaluation, (g) implementation, and (h) monitoring.
Mumford et al. (1991) view these processes as a consecutive series that
provides feedback at each level and that occasionally passes information back
and forth until the next step is formulated. An example of this would be the
information encoding process interacting dynamically with the category search

16
process until the best-fitting categories can be specified. The importance of this
process is most notable when subjects are working in an ill-defined domain, or as
the degree of a priori structure decreases. Problem construction has greater
influence when goals, parameters, solution strategies, and pertinent information
are unknown or under represented.
This lack of information or knowledge appears to present people with a
situation that is highly ambiguous. Hogarth and Kunreuther’s (1992) research
addressed the question of ambiguity and the decision-making task. Their theory
of decision-making under uncertain situations assumes that the problem solvers
evaluate the desirability of a given alternative by weighting the utility of the
outcome by the probability of obtaining that alternative. Under this model, people
tend to choose an anchor point based on the probability of obtaining an
alternative and then adjust above and below this anchor, assigning weights
based on the ambiguity of the situation. Let’s look, for example, at the conditions
under which people purchase flight insurance. The probability of an air accident
is actually very low, but based on the ambiguity of the situation, and the
availability of the flight insurance, people tend to assign a high weight to the
possibility of an accident and purchase the insurance. This scenario is also a
reflection of a person’s ability to imagine an accident happening. The easier it is
to imagine the outcomes, the more readily this will contribute to the weighting
process. Hogarth and Kunreuther believe that the amount of perceived ambiguity
and the person’s attitude towards ambiguity in a specific situation will influence

17
the anchoring and adjusting (weighting) process. According to Mintzberg, Duru,
Raisinghani and Theoret (1976) organizational problems and the strategic
decision process is characterized by ambiguity in the form of openendedness,
complexity, and novelty. They found that this process typically begins with the
decision makers having little understanding of the problem situation, solution
route, or solution. This is decision-making under ambiguity, with problem solution
goals and constraints either missing, underdefined, or undefined. In an
experiment conducted using MBA students and actuaries, four variables were
manipulated: (a) role (consumer or firm), (b) ambiguity (present or absent), (c)
probability of loss (p = .10, .35, .65, or .90) and, (d) type of respondent (actuaries
or MBA students). The results fit the profile of the ambiguity model. For
consumers, a preference for ambiguity was shown under high probability
conditions and aversion to ambiguity under low probability conditions. Similar
results held for the firms although to a lesser extent under the high ambiguity
condition. They conclude that characteristics of the situation and roles people
assume will determine their response in a positive or negative direction to an
ambiguous problem solving situation (Hogarth & Kunreuther, 1992). This work
builds on work by Kahneman and Tversky (1969) on decisions under risk and risk
attitudes towards losses and gains regarding the decisions of an opponent.
In summary, it is important to keep in mind that there are major differences
between solving well-defined problems and ill-defined problems. One of the
major differences in ill-defined problems occurs in the beginning because decision

18
makers are faced with a decision-making task where the problem is not clear, the
goals are not specified, and the constraints on both the specific problem and
within the environment of that problem are not clearly defined. Faced with this
situation, the decision maker must reach some understanding of the problem
construction, which involves problem definition and recognition and consideration
of the goals and constraints, before a solution can be attempted. When this
same situation is faced by the members of a group, this task becomes even more
daunting, as each member will bring to the table a different paradigm for problem
clarification. Agreement must be reached on these important variables before a
solution can be attempted (Mumford, Reiter-Palmon, & Redmond, 1994).
This look at problem construction provides the final piece of the puzzle we
will be working with in this current research. People are faced with the need to
make decisions and thus solve problems every day. Most of these problems are
complex which can contribute to the difficulty of arriving at sound decisions.
Frequently in the business environment, people work in groups, pooling
information and skills. Any tools that can be utilized to enhance the decision
making process should be made available to facilitate job performance. The
computer is such a tool. The problem lies in the lack of empirical data providing
support for the efficacy of the use of computers for problem solving over
traditional face-to-face discussion and problem solving. This study will endeavor
to clarify the performance enhancement achieved through the use of the
computer. Although this issue of group performance enhancement in the

19
electronic environment has been studied over the past few years, the area of
performance on ill-defined problems has not been well-developed. The use of
such real-life scenarios should increase the generalizability of the findings, giving
important information to the decision-making community on ways to facilitate the
solution of the problems they face each day. The use of electronic brainstorming
appears to bring together the positive elements of the nominal group structure
(generation of ideas and solutions with minimal apprehension, blocking, and
social loafing) and the positive elements of face-to-face brainstorming (synergistic
interactions wherein members share ideas and build on them)(Dennis & Valacich,
1993). This synergistic effect is believed to occur as a result of members bringing
different knowledge and skills to the table (Steiner, 1972).

20
Purpose of the Study
The research described above suggests that there will be differences in
quality of solution and number of factors generated for complex problems,
depending on the conditions under which a subject is working. Due to conflicting
information in the research data, the direction of the difference with regard to
originality of problem solution cannot be specified. Exploratory analysis will be
conducted on this dependent variable. The time needed to arrive at a final
solution under the different conditions is another factor that could be expected to
vary with condition. To bring all of these variables together for examination,
subjects will be assigned randomly to computer and non-computer conditions
working either individually or in groups of three in a 2 X 2 factorial design. The
following hypothesis will be tested in this research.
Hypothesis 1: It is predicted that the quality of solutions generated will be
a function of the interaction between use of computer and whether participants
worked independently or in groups. Specifically, it is predicted that computer use
will have no effect on the quality of solutions generated by individuals. In
contrast, computer use will differentially affect solution quality for groups such
that those groups using a computer will generate higher quality solutions than
those groups not using a computer.
Hypothesis 2: It is predicted that the number of new factors generated will
be a function of the interaction between use of computer and whether participants

21
worked independently or in groups. Specifically, it is predicted that computer use
will have no effect on the number of new factors generated by individuals. In
contrast, computer use will differentially affect the number of new factors
generated for groups such that those groups using a computer will generate more
new factors than those groups not using a computer.
Hypothesis 3: The time needed for groups to generate a final solution will
be significantly longer than the time needed for individuals.

22
Method
Participants
One hundred and sixty-one students from undergraduate psychology
classes at the University of Nebraska at Omaha were recruited to participate in
this study. Participants ranged in age from 16 through 61 with a mean age of 24
years, and a standard deviation of 6.7. Forty-eight males and 113 females
participated in this research. The mean college grade point average reported
was 3.27 for all participants. Fifteen Freshmen, 37 Sophomores, 39 Juniors, 48
Seniors, 9 Postgraduates, and 1 High School student taking an advanced course,
participated in this study. Twelve participants did not report their grade level.
Participants received extra credit in return for their participation.
All participants were randomly assigned to one of four treatment conditions;
group computer, group non-computer, individual computer and individual non
computer (see Table 1). Participants were clearly informed whether they would
be working alone or in a group and also informed whether they would be working
on a computer or with paper and pencil as they were taken to their work stations
prior to the beginning of the study.
Setting and Apparatus
GroupSystems (GS) software was used in the group and individual
computer conditions. GS was developed by J. F. Nunamaker and colleagues at
the University of Arizona. This system is currently marketed by Ventana
Corporation of Tucson, Arizona. This software provided the computer system

23
Table 1
Participant’s Random Assignment
Media 3-Member Groups Individuals
Computer 19 (57)a 23Non-Computer 19 (57)a 24
3 - number in parenthesis indicates total number of individuals

24
necessary to facilitate computer-based group and individual problem solving
(Nunamaker, etal., 1991).
The research room was designed to house four computers all linked via the
GS software. The first computer allowed the researcher to configure the other
three computers to be linked or independent. Using the group configuration,
participants could communicate with other members of their group, exchanging
information on factors, ratings and solutions as well as making comments to each
other in their effort to reach consensus on a final solution. Using the individual
configuration of the GS software, individuals working on the computer only had
access to their own information.
Although the computers were in close proximity to each other, large, solid
partitions were installed between work stations which dissuaded participants from
viewing or talking with each other.
Procedures
Although procedures differed strategically, most of the instructions were the
same for all participants. For clarity, this study can be divided into three phases:
Pregroup, group and Postgroup (see Table 2).
Phases of Research
Preqroup Phase.
All participants were instructed to read Clara’s problem (see Appendix A)
and to generate a list of all key pieces of information (factors) either presented or

‘Task 1:
All individuals regardless
of condition, generate a
factor list, importance
ratings and
initial solution
“Task
2: All individuals regardless
of condition, review and
revise factor list, im
portance ratings
and write
final solution .
Complete
satisfaction and
computer surveys
& are
debriefed
G>
■oOo3-o
Q .< '
Oo3-o
N>o
ao3■ocCD
3Q .5 ‘
oo3■oS.CD
oO3Q .r t -
o'3
0}(/)a>v>o—♦>
c/>cCL<
0)(Dto
—I m ©a3co
-oS ’B>0»©
CO "Os ICD3 £
S. o
a> o a . 3 8 ° § os §
oo3
-g _CD
cCD
COc3CD•<
— ri •"
& | 8O <t JL.3 3 ?
0 $< CD
S' oCO O .
® ma g1 =3 oCO = CD 3 3 O
Oo3■o.CDcar.o
a*c3COc3CD•<
oo -0&>O’o
fi>w©
a> to
5Q.CDTJCD3Q .CD3
Moo3COCD3COc
CD3Q .CD3
“0o(A
§co
&><o©cj
to<ji

26
implied that should be considered when attempting to solve this problem.
Participants were provided with an importance rating scale and asked to rate
each factor on their list for importance in arriving at a final solution. All
participants were then instructed to write the best solution they could generate for
Clara’s problem. This completed the pre-group phase of the study for all
participants as they were all working as individuals up to this point.
Collaboration Phase.
Groups. Those assigned to work in groups either on the computer or face-
to-face were instructed to consult with each other at this time, exchanging
information on the factors, importance ratings and solutions generated during the
pre-group phase. Group participants were given an opportunity to revise their
own factor list and importance ratings independent of other members of the
group. Group participants were also asked to reach consensus on the final
problem solution.
Individuals. Those assigned to work as individuals either on the computer
or with paper and pencil, were instructed to complete a Leisure Activity Survey
(see Appendix B). This assignment was designed to provide the individual
participants with an activity that would be roughly equivalent in length to the
collaboration phase of the group participants.
Postaroup Phase.
Again, working alone, all participants were given an opportunity to revise
their factor list and importance ratings and to generate a final solution to Clara’s

27
problem. For the group participants, this final solution was reached through
consensus. Prior to debriefing, ail participants were asked to complete the
Satisfaction Survey and the Computer Experience Survey (see Appendixes
C and D). A detailed summary of the procedures that differentiate conditions is
provided in Appendixes E-H.
Dependent Variables
All subjects were given one problem to solve. The problem was written so
as to be ambiguous and ill-defined, i.e., with more than one possible solution. A
pre-group (initial) solution and a post-group (final/consensus) solution were
generated by all participants as well as an initial factors list and a revised factor
list. Quality, number of new factors generated and time served as dependent
variables in this analysis.
Quality ratings. Quality was considered to be a complex concept composed
of three separate variables: appropriateness, originality and resolving power.
Appropriateness was defined as providing a viable solution to the problem that
was realistic, practical, feasible and socially appropriate. Originality was defined
as the degree to which the solution was not structured by the problem presented
and the degree to which the solution extended past this structure. The definition
includes the degree of novelty and uniqueness of the solution. Resolving power
was defined as the degree to which the solution addressed and resolved the
underlying conflicts presented in the problem (Reiter-Palmon, et al., 1997).
Appendix I presents details of the quality rating scales used in this study.

28
Ratings were obtained using a modification of Hennesey and Amabile’s
(1988) consensual rating technique. Two subject matter experts (SME’s) were
trained in the use of these rating scales and were given both the stimulus
materials and the participants individual and consensus solutions. The SME’s
were asked to rate the appropriateness, originality and resolving power of the
solutions without knowledge of the specific manipulations.
An intraclass correlation coefficient (ICC) was calculated to determine
interrater reliabilities (Shrout & Fleiss, 1979). Numerous versions of the ICC
calculation applicable to specific situations are available. Because each of the
targets (scores) were rated by the same two judges, a two-way mixed model
utilizing the following equation
ICC = (BMS-EMS)/BMS
where BMS represents the between-target mean square and EMS represents the
residual or error within-target mean square was employed for calculation of the
ICC. Although the interrater reliabilities were weak (Appropriateness, ICC=.66;
Originality, ICC=.63; Resolving Power, ICC=.51), consensus was reached on all
items without the necessity of a third party tie breaker. Consensus ratings were
used in all analysis.
Appropriateness, originality and resolving power ratings were made on all
pre-group (initial) and post-group (final) solutions.

29
New factors generated. The number of new factors generated under each
condition was also counted. Only the new factors generated, when participants
were given an opportunity to revise their original factor list, were counted.
Time. Time was also used as a dependent variable. Time was measured
from the time the researcher began reading initial instructions to time the
participant handed-in the completed questionnaires and protocols. The
researcher noted all beginning times and all ending times based on time elapsed
on a watch. The difference, or total time on task was recorded by the researcher
on the front of each participants protocol.
Additional Measures
Computer Questionnaire. Data was also collected on variables considered to be
possible sources of variability and thus alternative explanations for results. A
survey was developed for completion by all participants in order to determine the
participant’s computer experience (see Appendix D). This survey contained two
sub-scales in an attempt to tap into actual computer experience and participants’
emotional reaction to computer interaction. Reliabilities were strong: computer
experience -full scale (Alpha=.92) computer experience-affect (Alpha = .90),
computer experience-factual (Alpha = .86). This separation of attitude toward
computers and computer factual experience has been recognized as an important
distinction that could impact computer performance (Hudiburg, 1989; Ballance &
Ballance, 1992). The survey was completed by all participants at the end of the
study just prior to debriefing.

30
Problem Solving Process Questionnaire. An additional post-session
questionnaire queried the participants perception of the computer software
system and problem solving format (see Appendix C). This questionnaire was a
modification of a survey developed by Dennis and Valacich (1993). The purpose
of this questionnaire was to determine participants’ perception of group
interaction variables that have been previously found to have an influence on
group productivity. These variables include production blocking, evaluation
apprehension, synergy and stimulation, free riding and overall satisfaction. As
stated previously, production blocking occurs when an individual in a group must
wait their turn and cannot immediately express his or her idea because someone
else is expressing an idea at that particular moment. Evaluation apprehension
relies on the notion that when in the presence of others, people become
concerned with succeeding or failing at a task. This heightened concern is
translated into enhanced drive which can lead to improved performance on well-
leamed tasks, and degraded performance on novel tasks. Synergy and
stimulation refers to the combined cooperative activity or force that occurs when
individuals work together in a group. This combined energy can lead to a
synergistic situation where the productivity of the group is greater than the sum of
the productivity of the individual within the group. Synergy occurs when a group
participant is motivated to create new ideas based on the ideas expressed by
others in the group (Dennis & Valacich, 1993). Although some of the synergy
questions in this survey had been previous used as a measure of synergy, the

31
specific wording also lends itself to an interpretation of task involvement or task
enjoyment. Social loafing, also known as free riding, occurs when an individual in
a group is content to work with less effort than they would if they were working
alone, knowing all group members will get credit for the group contribution. The
overall satisfaction portion of the survey taps into general satisfaction with the
process that participants were engaged in. The modifications to the original
questionnaire included changes in wording to make the survey more specific to
this study and also included the addition of one or two questions to each
category.
The reliability of five of the perceptual measures included in this survey were
shown to be adequate: production blocking (A!pha=.84), evaluation apprehension
(Alpha=.73), synergy and stimulation (Alpha=.79), satisfaction (Alpha=.86), and
free riding (Alpha=.74). Perception of whether participants had sufficient time was
also measured using a modification of a scale previously found to be reliable
(alpha = .84), but it proved less homogeneous in this study (alpha = .61).
Analysis
All analyses were conducted using SPSS for Windows, 6.0 utilizing the
Base, Advanced and Professional programs, with both prewritten and custom
syntax.
Data Sets
Two data sets were used for analysis purposes in this study, which will be
described below.

32
Full Data Set.
The full data set contained data for all individuals who participated in the
study. Due to the nature of the design, unequal cell sizes exist in this data set.
Each of the group conditions contains data from 57 individuals compared to the
non-group cells which contain approximately 24 individuals. As it was appropriate
for certain analysis to be run on the full data set, tests for homogeneity of
variance were conducted for each analysis. Simple main effects were calculated
for all significant interactions in order to determine the exact nature of the
interaction. The following analyses were run on the full data set. The full data set
was used for these analyses because this data was generated independently by
each individual in the study.
Initial solution quality ratings. Using the full data set, a 2 X 2 factorial design
was used to analyze the between group differences in the initial solution for
appropriateness, originality and resolving power. This analysis was designed to
examine the effect of the independent variables, group (group vs. individual) and
media (computer vs. non-computer) on the quality of the initial problem solution
generated prior to consensus or changes.
Number of new factors generated. During the postgroup phase of this
study, all subjects, working independently, were given the opportunity to revise
their factor list. This revision included the opportunity to add new factors. The
number of new factors generated during this postgroup phase were counted. As
all individuals had the opportunity to revise their factor lists independently, the full

33
data set was used for this analysis. A 2 X 2 factorial analysis of variance was
employed to examine the effect of the independent variables (group and media)
on the dependent variable, number of new factors generated.
Satisfaction Survey subscales. General satisfaction, production blocking,
free riding, evaluation apprehension, perception of time, and synergy and
stimulation were analyzed using the full data set as all individuals completed the
survey independently. Again, an analysis of variance was utilized to examine the
effects of the independent variables (group and media) on these specific
dependent variables.
Computer Survey subscales. The two subscales of the computer survey,
affect and factual experience, were analyzed using the same process reported
above for the satisfaction survey. An example of a question from the computer
factual experience subscale would be, “I use a computer to do my homework.”
An example of a question from the computer affective experience subscale would
be, “Using a computer makes me nervous.” This survey is presented in Appendix
D.
Group Data Set.
The group data set differs from the full data in several ways. In order to
compare pre- and post-group quality ratings, the quality ratings for the initial
solution in the group conditions were collapsed for each three-person group
resulting in a mean initial quality rating per group. The quality scores for the final
consensus solution in the group conditions are reported directly as was time for

34
completion. This data was not useable in the full data set as the scores for the
group members were not independent. Again, as with the full data set, simple
main effects were calculated for all significant interactions in order to determine
the exact nature of the interaction. The following analyses were run on the group
data set.
Final solution quality ratings. Using the group data set, a 2 X 2 factorial
analysis of variance was used to analyze the between group differences in the
final solution for appropriateness, originality and resolving power. Again, this
analysis was designed to examine the effect of the independent variables on the
quality of the final solution.
Comparison of initial solution to final solution quality ratings. Using the
group data set and a 2 X 2 X 2 factorial design analysis of variance with two
between subjects factors (group and media) and one within subjects repeated
measure (initial and final solution) analyses were conducted to determine if
differences existed on quality ratings (appropriateness, originality and resolving
power) between the initial and final solutions generated to the problem.
Time. The overall time taken to complete this study was recorded.
Subjects working in groups had the same recorded time. As such, this
information was not independent and therefore the group data set was used for
this analysis. A 2 X 2 factorial design analysis of variance was used to examine
the effect of the independent variables, (group and media) on the amount of time
needed for completion of task.

35
Pilot Study
In an effort to work out any procedural kinks, 20 subjects participated in a
pilot study. Based on information from debriefing interviews, the complexity of the
problem was increased in order to avoid participants selecting obvious answers.
The pilot study information was used during rater training.

36
Results
Results of all analysis conducted are reported below. Descriptive statistics
including means, standard deviations and range for ail dependent variables are
reported below on Table 3. Correlations for quality ratings from the group data
set are reported on Table 4. Correlations for the dependent variables in the full
data set are reported on Table 5.
As seen in Table 4, there appears to be a positive correlation between all
of the quality ratings: Appropriateness with Originality r= 32, g<.01;
Appropriateness with Resolving Power, r=.50, p<.0i and Originality with
Resolving Power r= 46, p< 01. In addition, a strong positive relationship is
apparent between the two Computer Survey subscales, Computer Experience:
Fact and Computer Experience: Affect, r=.79, g<.01 as well as among many of
the Satisfaction Survey subscales.
When the group data set is used to calculate correlations the variables of
interest are the mean initial quality ratings and the final consensus quality ratings.
As can be clearly determined from correlations Table 5, a strong relationship
exists between all quality ratings with the exception of the final appropriateness
rating which appears to stand alone.
The two deviations from this pattern are the correlation between the final
appropriateness rating and the final resolving power rating, r=.42, p<.01. and the
correlation between the initial and final appropriateness ratings, r=.49, p<01.

37
Table 3
Descriptives for Variables
Variable M SD Range
Age 24.1 6.7 16-61
CGPA 3.3 .5 2-4
Comp. Exp. Factual 5.1 1.1 2-7
Comp. Exp. Affect 5.5 1.1 2-7
General Satisfaction 5.6 .9 2-7
Evaluation Apprehension 5.4 1.1 2-7
Free Riding 5.5 1.0 2-7
Perception of Time 6.0 1.0 2-7
Production Blocking 5.2 1.4 1-7
Synergy 5.1 1.0 2-7
Time 41.9 17.1 19-98
New Factors .8 1.7 0-7
Appropriateness 1 2.5 1.0 1-5Originality 1 2.8 1.4 1-6
Resolving Power 1 3.3 1.3 1-6

Table
4
Corre
latio
ns:
Depe
nden
t Va
riabl
es
- Full
Data
Se
t
0000
C\1CM
CO05O
O OCO CO ID
05t t"T CO
coCO 2\| CM CO
00«* «* **o 05CO in CM
o
CMO
05 CM CD O CM
CMO
CD05 CM 05 05
o oCM cm in
■«- o
mCM O 05
X- o05 CM O t- CM
oO CD t - O
CM CO h - 05 0 ^ - 0 0
'M' •M-o o
CO O CD
CO'M-O in -a- CM CM
O T- X- ooo mo T“ m
oin05 CMo o
CM
CO©jQ©
1
%T—CO CO © c05ro ^Q .Ot_Q l Q .<
at
«* *CD CONT
** 1CM O COCO iq o
r
%
©
%x—
oQl05C
■© '_>c o05 u
(0<D
O QLb) 05c ,C ©© E
tn QC i-CM cb ■M-
CM CO O T - O O
CD CD x- O
T>©©i—©C©Ooo©Li.£©
©oc©
■«w,©QlXLU©nQ .Eoo
COCM
CD CMO r-
0 ©
81 © Q. X Lii©*3Q.Eo
c oo roh—- CO
©O CD
co(Oc©
-C©L_Q.<co©
_Q
5LU
O CM
CO 00 oo o
m cd 06 05
05cXJ£©©i—LL.o'
© c £ 12 = 8 OQocoQ .©o©
CL
cots3T3o
>%05l_©c>»
CDCL CM CO
Note
*
- e<
.05
Note
**
- f>
<.Q1
Note
# A
ppro
pria
tene
ss
1=A
ppro
pria
tene
ss
ratin
gs
on in
itial
, pr
e-gr
oup
solu
tion.
O
rigin
ality
1=
0rig
inal
ity
ratin
gs
on
initi
al,
pre-
grou
p so
lutio
ns.
Reso
lvin
g Po
wer
l =R
esol
ving
Po
wer
ra
tings
on
initi
al,
pre-
grou
p so
lutio
ns.

Table
5
Corre
latio
ns:
Quali
ty Ra
tings
- G
roup
Da
ta Se
tCDCO
IO
CO
CM
CO0)"8
I
**oCO
too CO
**CD
**CMCO
*«toCO
CO
a>c'■J3COcnCOCOCDcsCO•CCL£>Q .a.<
COc
a>ccoa:COCOCDca)CO‘ua.2OtrrQ .<
CM
CO
Cio>c"cocr:
76c!s>oco
cocu_
Io>cCOcr:>?
76ca>'i—OTl"
**CM
IO
oCM
**CO
CO
CD
SCLO)cj>oCOCDa:to
**CMIO
b>CM
**COCM
**CM
*COCM
COcLl.
CD
ICLo>c
' >
$CDQCCO No
te.
* = £<
-05.
**=
g<
.01.

40
Confounding Variable - Computer Experience - Full Data Set
It was important to verify that differences found in our analysis could not be
attributed to variables other than our manipulations. Computer experience was
considered to be one of these possible confounding variables. The computer
survey was administered following the completion of the problem solving task. All
participants completed this survey. A t-test was conducted to determine whether
differences existed between those participants randomly assigned to work on the
computer and those assigned to work with paper-and-pencil. This t-test for the
full-scale computer survey displayed no significant differences between the
computer and non-computer conditions t(156)=1.60, p>.05.
Analysis of Variance - Quality
Hypothesis 1: It is predicted that the quality of solutions generated will be
a function of the interaction between use of computer and whether participants
worked independently or in groups. Specifically, it is predicted that computer use
will have no effect on the quality of solutions generated by individuals. In
contrast, computer use will differentially affect solution quality for groups such
that those groups using a computer will generate higher quality solutions than
those groups not using a computer.
Prearoup quality ratings. As a first step in the testing of the hypothesis
stated above, an analysis of variance was conducted on the initial pregroup
solution quality ratings (appropriateness, originality and resolving power). No

41
differences were predicted at this point, as all participants were working on their
own and had not been subjected to group interaction yet. The analysis
supported this homogeneity of ratings across conditions for the originality and
resolving power quality ratings. However, the appropriateness ratings yielded a
marginal main effect for group such that those individuals who were anticipating
working in a group wrote solutions of lower appropriateness (M=2.44, SD=1.06)
relative to those individuals who anticipated working alone for the entire study
(M=2.74, SD=.90), F(1,160)=3.01, £=.085, (see Table 6 & 7) with 2% of the
variance accounted for (n=.02). Cochran’s test of homogeneity demonstrated an
absence of heterogeneity in this analysis allowing us some confidence in these
marginally significant results. A Cochran’s test is being run for analysis using the
full data set due to unequal cell size.
Postaroup quality ratings. The next step in the test of hypothesis one was
to determine if there were differences in final quality ratings as a function of the
independent variables (group and media). This analysis of variance was
conducted on the group data set using solution arrived at by consensus in the
group conditions and individually by those working alone. No significant main
effects or interactions were found for any of the three quality variables (see Table
8 and 9).

42
Table 6
Prearoup Quality Ratings
Source SS DF MS F P
Appropriateness
Computer . 11
Group 3.11
Computer by Group .07
Originality
Computer .45
Group .12
Computer by Group .90
Resolving Power
Computer 1.12
Group 1.95
Computer by Group .30
.11
3.11
.07
11
3.01
.07
.743
.085
.789
.45
12
.90
.24
.07
.48
.627
.798
.49
1.12
1.95
.30
.67
1.17
.18
.413
.28
.669

43
Table 7
Prearoup Quality Ratings - Full Data Set
Variable M SD
AppropriatenessGroup 2.44 1.06
Computer 2.39 1.06Non-Computer 2.49 1.05
Alone 2.74 .90Computer 2.74 .81Non-Computer 2.75 .99
OriginalityGroup 2.79 1.4
Computer 2.92 1.52Non-Computer 2.65 1.26
Alone 2.85 1.3Computer 2.82 1.47Non-Computer 2.88 1.15
Resolving PowerGroup 3.2 1.32
Computer 3.16 1.39Non-Computer 3.25 1.27
Alone 3.45 1.18Computer 3.3 1.11Non-computer 3.6 1.25

44
Table 8
Postaroup Quality Ratings
Source SS DF MS F P
ADDrooriateness
Computer .16 1 .16 .18 .669
Group 1.05 1 1.05 1.18 .281
Computer by Group .82 1 .82 .93 .338
Oriainalitv
Computer 1.22 1 1.22 .65 .424
Group 1.59 1 1.59 .84 .361
Computer by Group .45 1 .45 .24 .627
Resolvina Power
Computer .07 1 .07 .04 .841
Group 1.16 1 1.16 .70 .406
Computer by Group 1.78 1 1.78 1.07 .304

45
Table 9
Postgroup Quality Ratings - Group Data Set
Variable M SD
Appropriateness
Group 2.68 .96Computer 2.9 1.05Non-Computer 2.47 .84
Alone 2.6 .92Computer 2.6 .78Non-Computer 2.58 1.06
Oriainalitv
Group 2.74 1.33Computer 2.5 1.39Non-Computer 2.9 1.27
Alone 2.98 1.4Computer 2.9 1.38Non-Computer 3.04 1.4
Resolvina Power
Group 3.26 1.29Computer 3.0 1.5Non-Computer 3.5 .96
Alone 3.32 1.29Computer 3.35 1.15Non-Computer 3.29 1.4

46
Repeated measure quality ratings. A final analysis comparing the initial
solution with the final solution to determine if differences exist as a function of this
repeated measure, group or media was run on the group data set. A significant
interaction was found for group on the repeated measure for appropriateness
F(1,81)=4.49, g <.05, with 5% of variance accounted for (£=.05). Figure 1
provides a graphic representation of this interaction. A simple main effects
analysis revealed significance difference for groups such that their second or
consensus solution were rated significantly higher on appropriateness (M=2.7,
SD= 96) relative to the mean of the initial solution across group members
(M=2.44, SD=-62). F(1,83)=3.09, £=.08 (see Tables 10-13). Four percent of the
variance in the gain in appropriateness rating is accounted for through group
(£=.0359). It is interesting to note that significant differences were not found
between the groups on either the pregroup quality ratings or the postgroup quality
ratings, however, a marginally significant increase or gain in quality of ratings
occurred for groups from the pregroup to postgroup ratings relative to the gain
shown by those working alone (see Figure 1).
Analysis of Variance- New Factors Generated
Hypothesis 2: It is predicted that the number of new factors generated will
be a function of the interaction between use of computer and whether participants
worked independently or in groups. Specifically, it is predicted that computer use
will have no effect on the number of new factors generated by individuals. In
contrast, computer use will differentially affect the number of new factors

47
Table 10
Repeated Measure - Appropriateness Ratings
Source SS DF MS F P
AppRM .10 1 .10 .27 .603
Gp X AppRM 1.63 1 1.63 4.49 .037
Cp X AppRM .83 1 .83 2.28 .135
Gp X Cp X AppRM .63 1 .63 1.73 .192
Note. Gp=Group; Gp1=Worked in Group; Gp2=Worked Alone;Cp=Computer; Cp1=Worked on Computer; Cp2= Did not use Computer;AppRM=Appropriateness Ratings (Repeated Measure - Pre- & Post-group Quality Ratings).
48
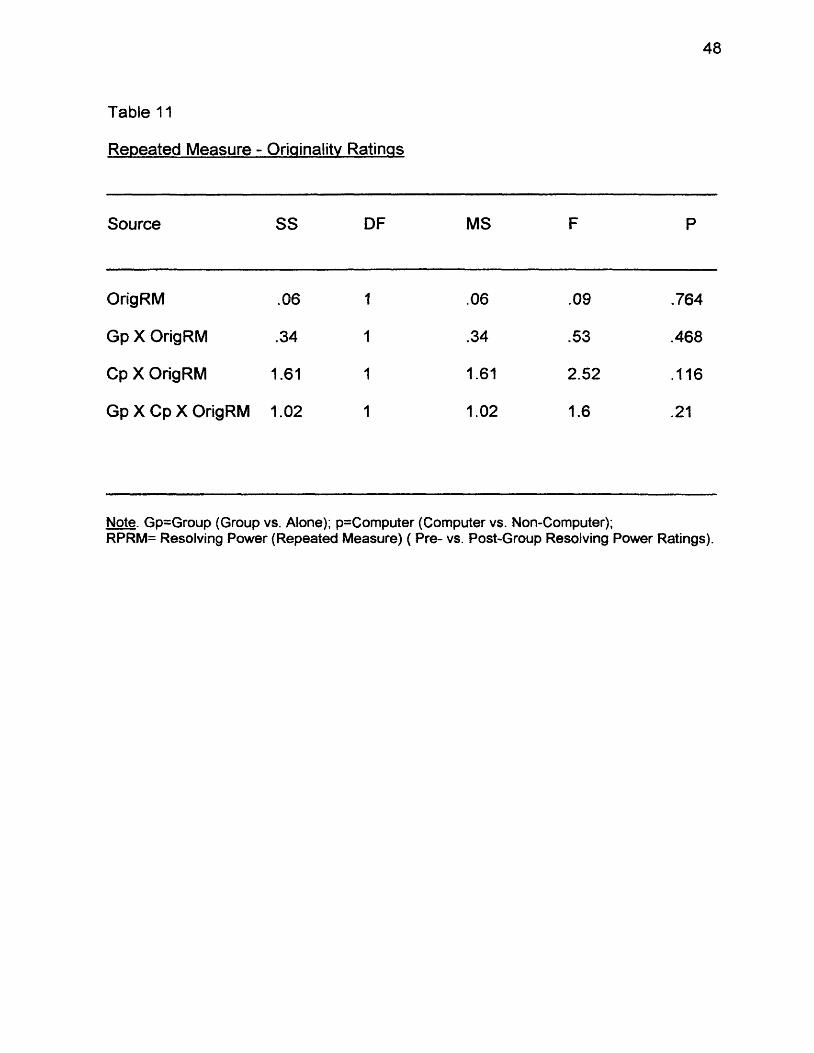
Table 11
Repeated Measure - Originality Ratings
Source SS DF MS F P
OrigRM .06 1 .06 .09 .764
Gp X OrigRM .34 1 .34 .53 .468
Cp X OrigRM 1.61 1 1.61 2.52 .116
Gp X Cp X OrigRM 1.02 1 1.02 1.6 .21
Note. Gp=Group (Group vs. Alone); p=Computer (Computer vs. Non-Computer);RPRM= Resolving Power (Repeated Measure) ( Pre- vs. Post-Group Resolving Power Ratings).

49
Table 12
Repeated Measure - Resolving Power Ratings
Source SS DF MS F P
RPRM .04 1 .04 .06 .803
Gp X RPRM .36 1 .36 .55 .459
Cp X RPRM .03 1 .03 .04 .836
Gp X Cp X RPRM 1.57 1 1.57 2.4 .125
Note. Gp=Group (Group vs. Alone); p=Computer (Computer vs. Non-Computer);RPRM= Resolving Power (Repeated Measure) ( Pre- vs. Post-Group Resolving Power Ratings).

50
o >cCDq:wwQ>c®TocQ.sCLCL<
32.92.82.72.62.52.42.32.22.1
Group — Alone
Tim e 1 Tim e 2
Repeated Measure for Appropriateness
Figure 1. Repeated measure for mean appropriateness rating.
Table 13
Repeated Measure - Appropriateness Rating
M SD
Variables Time 1 App. Time 2 App Time 1 App. Time 2 App.
Group 2.44 2.68 .62 .96
Alone 2.74 2.60 .90 .92
Note. Time 1 App.=appropriateness rating for initial problem solution. Time 2
App.=appropriateness rating for final problem solution.

51
generated for groups such that those groups using a computer will generate more
new factors than those groups not using a computer.
Participants were given the opportunity to revise their factor list during the
postgroup session of the study. The number of new factors that individuals
added to their factor lists was counted. This new factor count was used as the
dependent variable to determine the effect of the independent variables, group
and media.
This analysis was run on the full data set as all factors were generated by
individuals independent of each other. Again, Cochran's test of homogeneity was
completed due to the concern regarding unequal cell size in this data set. The
Cochran's test was significant, C(39,4) =.67, £<.05. As such the probability
level should be lowered in order to avoid Type I interpretation error. For this
reason, a probability level of £=.025 was used for the analysis using this
dependent variable. The analysis of variance as summarized on Table 14,
indicated a significant main effect for group with participants working in a group
generating significantly more new factors (M=.98, SD=1.8) than those people
working alone (M=-3, SD=1.12), F(1,160) =7.17, £<.01, (rp-04). In addition, a
main effect was found for media in that those people not working on the computer
generated more new factors (M=1-47, SD=2.14) than those working on the
computer (M=.09, SD=.33), F(1,160)=19.92, £<.01, with 11 percent of the
variance accounted for (n=.11) Table 15 provided details of this analysis. The
analysis of variance also indicates a marginally significant interaction between

52
Table 14
Number of New Factors Generated
Source SS DF MS F P
Group 15.88 1 15.88 7.17 .008
Computer 44.10 1 44.10 19.92 .000
Group X Computer 10.73 1 1.73 4.85 .029
Simple Main Effects for New Factors Generated
Cp within Gp1 84.25 1 84.25 36.48 .000
Cp within Gp2 3.72 1 3.72 1.32 .252
Gp within Cp1 5.28 1 5.28 1.88 .172
Gp within Cp2 57.22 1 57.22 23.08 .000
Note. Gp=Group; Gp1= Worked in Group; Gp2=Worked Alone;
Cp=Computer; Cp1=Worked on Computer; Cp2= Did not use Computer.

53
group and media was detected F(1,160)=4.85, £=.029, (rj=.03). A simple main
effects analysis was conducted to pinpoint the location of the significant mean
differences. This analysis revealed a significant difference for media such when
groups worked face-to-face (M=1.84, SD=2.26) they generated more new factors
than groups working on the computer (M=-12, SD=.38), F(1,160)=36.48, £ < 025.
Nineteen percent of the variance in new factors generated is accounted for by
non-computer groups (n=-19)- In addition, a significant difference was detected
for participants not working on computers such that those people working alone
generated fewer new factors (M=.58, SD=1.5) than participants working in
groups (M=1.84, SD=2.6), F(1,160)=23.08, £<.01, (n=-13). Figure 2 presents a
graphic representation of this interaction. Table 15 displays the means for this
analysis.
Analysis of Variance - Time
Hypothesis 3. The time needed for groups to generate a final solution will
be significantly longer than the time needed for individuals.
Cochrans test of homogeneity demonstrated some problems in this area,
C(20,4)=.45, £<.05 indicating heterogeneity of cells analyzed for time differences.
For this reason, the level of significance was lowered to a probability level of
£=.025 to compensate for the increase tendency to make a Type 1 interpretation
error under these conditions. In an effort to determine the full nature of time as a
factor in this study, an analysis of variance was conducted. The initial analysis of

54
NO. Of NOW Factors
Generated0.5
0 4
— —Computer Non-computer
Group Alone
Group Variable
Figure 2. Group/media interaction for number of new factors generated.
Table 15
Number of New Factors Generated - Group/Media Interaction
Variable M SD
GroupGroup
ComputerNon-Computer
AloneComputerNon-Computer
ComputerComputer
GroupAlone
Non-ComputerGroupAlone
.9825
.12281.842
2979.0000.5833
.0875
.1228
.0000
1.46911.8421.5833
1.8289.3813
2.25821.1212
.0001.529
.3258
.3813
.0000
2.13942.25821.5299

55
variance showed a strong interaction effect for group by media with twelve
percent of the variance in time accounted for through this interaction (£=.12),
F£1,81 )=11.25, £<.025 (see Table 16 and Figure 3). Simple main effects
demonstrate significant difference at three out of four of the analysis points.
For those participants working within groups, there was a significant
difference in amount of time taken to complete the problem solving process such
that those working on the computer took significantly longer (M=57.8 minutes)
than did those working in face-to-face groups (M=35.5 minutes), F(1,83)=25.50,
£<025, with 24% of variance accounted for (£=.24). In addition, a strong
significant difference occurred between those working alone on the computer
relative to those working as a group on the computer, F(1,83)=29.71, p<.025,
with 26% of the variance in time accounted for (£=.26). The group computer
mean was 57.8 minutes as stated above while the those working alone on the
computer took an average of 33.9 minutes to complete the task. A marginal
difference also was found between those people not working on the computer,
F(1,83)=4.39, £=.039, (£=.05). In this comparison, face-to-face groups took
approximately 35.5 minutes to complete the task compared to 27.3 minutes on
average for those working alone with paper and pencil (see Table 17).
Additional Measures
Computer experience using full data set. The Computer Experience
Survey was completed by participants immediately following the computer

56
Table 16
Time for Completion of Task
Source SS DF MS F P
Group 5433.70 1 5433.70 46.75 .000Computer 4371.87 1 4371.87 37.61 .000
Group X Computer 1307.69
Simple Main Effects for Time
1 1307.69 11.25 .001
Cp within Gp1 4730.95 1 4730.95 25.50 .000
Cp within Gp2 549.96 1 549.96 2.33 .131
Gp within Cp1 5305.97 1 5305.97 29.71 .000
Gp within Cp2 1010.78 1 1010.78 4.39 .039
Note. Gp=Group ; Gp1= Worked in Group ; Gp2=Worked Alone; Cp=Computer.;Cp1= Worked on Computer; Cp2= Did not use Computer.
Time
60
50
40
30
20
—— Computer — — Non-Computer
Group Alone
Group Condition
Figure 3. Time; Group/Media Interaction.

57
Table 17
Time in Minutes for Completion of Problem Solving Task
Variable M SD
Group
Group 46.7 17.8Computer 57.8 15.0Non-Computer 35.5 12.9
Alone 30.5 7.9Computer 33.9 9.06Non-Computer 27.3 5.0
ComputerComputer 44.7 16.9
Group 57.8 15.0Alone 33.9 9.1
Non-Computer 30.9 10.1Group 35.5 12.9Alone 27.3 5.0

58
experience. For this reason, we considered the possibility that the immediacy of
the computer experience may have influenced the computer survey responses.
Therefore, a full analysis of this data was completed in order to determine all
possible response differences.
The Computer Survey contained two subscales: Computer Experience
(Factual) and Computer Experience (Affect). Cochran’s test of homogeneity
proved to be non-significant for this analysis, C(39,4) = 31, g >.05.
Factual computer experience . A significant interaction between group and
media was revealed in this analysis, F(1,157) =7.64, g<.01, (rp.05). This
interaction is graphically depicted in Figure 4.
Simple main effects were conducted to determine the exact nature of the
interaction depicted graphically above. A significant difference was confirmed for
those working in groups such that the group members who worked on the
computer reported more factual computer experience (M=5.4, SD=.89) than the
groups working face-to-face not using a computer (M=4.7, SD=1.18),
F(1,157)=11.17, g<.01, (n= 07). Table 18 provides clarification. In addition,
when participants used the computer, there was a difference in reported factual
computer experience such that those working alone on the computer reported
less experience (M=4.9, SD=1.17) than those working in a group on the computer
(M=5.4, SD=.89) (see Table 19). A higher mean rating indicates greater factual
experience.

59
Table 18
Analysis of Variance Results - Computer Experience - Factual
Source SS DF MS F P
Group .01 1 .01 .01 .941
Computer .78 1 .78 .69 .406
Group X Computer 8.58 1 8.58 7.64 .006
Simole Main Effects for Comouter Experience - Factual
Cp within Gp1 12.49 1 12.49 11.17 .001
Cp within Gp2 1.48 1 1.48 1.24 .267
Gp within Cp1 7.43 1 7.43 6.46 .012
Gp within Cp2 7.02 1 7.02 6.09 .015
Note. Gp=Group; Gp1=Worked in Group; Gp2=Worked Alone; Cp=Computer;
Cp1=Worked on Computer; Cp2= Did not use Computer.

60
Group Alone
Group Variable
- — Computer - — Non-Computer
Figure 4. Interaction by group and media for factual computer experience
Table 19
Mean Response Rates: Factual Computer Experience
Variable M SD
Grouo
GroupComputer 5.4 .888Non-Computer 4.7 1.18
AloneComputer 4.88 1.17Non-Computer 5.23 1.01

61
Computer Experience: Affect. The questions on this subscale of the
Computer Survey were designed to determine how participants felt about
computer use in general. A significant interaction was found between the two
independent variables, F(1,157)=5.81, £<05, (n=04). This interaction is
depicted in Figure 5.
Simple main effects were analyzed in order to determine the exact nature
of this interaction. A significant simple main effect was found for those
participants working within groups such that when they working on a computer
they reported more positive attitude toward computer use (affective measure)
(M=5.68, SD=.84) compared to those working in face-to-face groups (M=5.25,
SD=1.32), £(1,156) 4.27, g<.05 (£=.03). A marginally significant simple main
effect was also found for those participants who worked on the computer,
(£=.02), F(1,156)=3.76, £=.054, (see Table 20). Those working in a group on
the computer report more positive attitude toward computer use (M=5.68,
SD=.84) than did those participants who worked alone on the computer (M=5.19,
SD=1.22). In addition, a marginally significant simple main effect was also found
for those participants who did not work on the computer, F(1,156)=3.44, £=.066,
(£=.02). This main effect indicates that participants working alone reported more
positive computer affect (M=5.69, SD=.99) than did participants who worked in
face-to-face groups (M=5.25, SD=1.32) (see Table 21).

62
Table 20
Computer Experience - Affect
Source SS DF MS F P
Group .01 1 .01 .01 .922
Computer .04 1 .04 .03 .858
Group X Computer 7.13 1 7.13 5.81 .017
Simple Main Effects for Computer Experience - Affect
Cp within Gp1 5.25 1 5.25 4.27 .04
Cp within Gp2 2.89 1 2.89 2.32 .13
Gp within Cp1 4.64 1 4.64 3.76 .054
Gp within Cp2 4.25 1 4.25 3.44 .066
Note. Gp=Group: Gp1= Worked in Group; Gp2=Worked Alone;
Cp=Computer; Cp1=Worked on Computer; Cp2= Did not use Computer.

63
Mean Computer Experience
Affect
5.75.65.55.45.35.25.1
54.9
AloneGroup
Group Variable
—•—Computer Non-Computer
Figure 5. Interaction by group and media for affective computer experience.
Table 21
Mean Response Rates: Affective Computer Experience
Variable M SD
GrouD
GroupComputer 5.68 .8355Non-Computer 5.25 1.3187
AloneComputer 5.19 1.2177Non-Computer 5.69 .9945

64
Satisfaction Survev-Fuli Data Set
As stated earlier, the satisfaction survey contained six subscales: General
Satisfaction, Evaluation Apprehension, Production Block, Free Riding, Perception
of Time and Synergy and Stimulation. Each of these subscales will be address in
the following analyses. The subscales were used one at a time as dependent
variables to determine if response means differed systematically as a function of
the independent variables, group and media. Table 22 displays the means for ail
satisfaction survey responses.
General satisfaction. Cochran’s test of homogeneity was not significant for
this particular analysis, C(39,4)=.34583, £>>.05. A main effect for group was
revealed in the analysis of variance, such that participants who worked in groups
reported greater general satisfaction with the task process (M=5.66, SD=.78)
relative to those participants who worked alone (M=5.33, SD=98),
F(1,155)=5.14, g<.05, (n=.03). Table 23 provided details of this analysis.
Evaluation apprehension. Cochran’s test of homogeneity was non
significant, C(39,4)=.31867, £>>.05. A significant interaction for computer by
group was revealed through the analysis of variance, F(1,155)=4.88, £><05,
(rp.03). Figure 6 presents a graphic illustration of the relationship between the
variables.
Simple main effects were conducted to determine the nature of the
interaction effect (see Table 24). A significant difference was found in media for
those participants working alone such that those working alone using paper and

65
Table 22
Mean Response Rates for Satisfaction Survey Subscales
Variable M SD
General SatisfactionGroup 5.66 .783
Computer 5.56 .803Non-Computer 5.76 .759
Alone 5.33 .982Computer 5.3 1.05Non-Computer 5.35 .935
Evaluation ADDrehensionGroup 5.46 1.10
Computer 5.39 1.18Non-Computer 5.54 1.03
Alone 5.36 1.08Computer 4.85 1.12Non-Computer 5.82 .83
Production BlockinaGroup 5.05 1.41
Computer 5.22 1.18Non-Computer 4.88 1.61
Alone 5.41 1.17Computer 5.4 1.19Non-Computer 5.43 1.16
Free RidinaGroup 5.53 .957
Computer 5.43 .975Non-Computer 5.63 .937
Alone 5.34 1.036Computer 5.15 .953Non-Computer 5.2 1.096
Perception of TimeGroup 5.89 1.06
Computer 5.8 1.09Non-Computer 6.0 1.03
Alone 6.33 .843Computer 6.18 .91Non-Computer 6.46 .772
Svnerav & StimulationGroup 5.15 1.04
Computer 5.26 1.1Non-Computer 5.04 .96
Alone 5.02 1.02Computer 4.75 1.13Non-Computer 5.27 .854
Note. Scale ranged from 1 to 7 with 7 reflecting: Gemeral Satisfaction; 7= Most positive satisfaction; Evaluation
Apprhension; 7=Lowest apprehension; Production Blocking 7=lowest blocking effect; Free Riding 7=lowest sense of free
riding; Perception of Time 7=Not enough time; Synergy & Stimulation 7=highest task involvement.

66
Table 23
Satisfaction Survey: General Satisfaction Subscale
Source SS DF MS F P
Group 3.69 1 3.69 5.14 .025
Computer .48 1 .48 .68 .412
Group X Computer .17 1 .17 .23 .629

67
Table 24
Satisfaction Survey: Evaluation Apprehension Subscale
Source SS DF MS F P
Group 10.11 1 10.11 8.81 .003Computer .52 1 .52 .45 .501Group X Computer 5.6 1 5.6 4.88 .029
Simole Main Effects
Cp within Gp1 .58 1 .58 .48 .49Cp within Gp2 10.65 1 10.65 9.35 .003Gp within Cp1 1.56 1 1.56 1.3 .256Gp within Cp2 .17 1 .17 .14 .706
Note. Gp=Group Gp1=Worked in Group Gp2=Worked Alone Cp=Computer Cp1= Worked on Computer Cp2= Did not use Computer
5 -Mean 4
Evaluation Apprehension
Responses 2 -■1 -
0 -
Group Alone
Group Variables Note. A high rating (6) indicates less apprehension, low rating
(1) high apprehension
— —Computer — — Non-Computer
.Figure 6. Group by media interaction for mean evaluation apprehension responses on the
satisfaction survey. A rating of 6 indicates less apprehension.

68
pencil to complete the problem solving task were less apprehensive (M=5.82,
SD=.83) than those working alone on the computer (M=4.85, SD=1.12),
F(1,157)=9.35, £<.01, (n=-06).
Perception of time. Cochran’s test of homogeneity was non-significant,
C(39,4)=.32491, £>.05 giving confidence to traditional significance levels for this
analysis. Table 25 shows that a significant main effect was found for group,
F(1,155)=5.78, £<.05, (r|=.04). An examination of the means demonstrates that
participants working alone felt less time urgency (M=6.33, SD=.84) than did
participants working in a group (M=5.8, SD=1.06). This effect held true
regardless of whether the task was completed on the computer or with paper and
pencil.
Synergy and stimulation. The test of homogeneity proved to be non
significant for this analysis of variance, C(39.4)=.3098. £>.05. This provides
confidence in the results of this analysis which demonstrated a significant
interaction between group and media. Figure 7 graphically depicts this
interaction.
The simple main effects analysis revealed a marginally significant result
such that for those working on a computer, participants who worked in a group
perceived a greater sense of synergy (M=5.26, SD=1.1) than did those
individuals working alone (M=4.75, SD=1.1), F(1,157)=3.58, £=.06, (n=.02)

69
Table 25
Satisfaction Survey; Perception of Time Subscale
Source SS DF MS F P
Group 5.83 1 5.83 5.78 .017
Computer 1.83 1 1.83 1.81 .18
Group X Computer .05 1 .05 .05 .82

70
(see Table 26). Due to the specific nature of the questions, these results can be
said to reflect amount of task involvement or task enjoyment (see Appendix C).
Production Blocking and Free Riding. The analysis of variance failed to
detect any differences in the survey responses for production block or free riding
as a function of group or media (see Tables 27 and 28).

71
Table 26
Satisfaction Survey: Synergy and Stimulation Subscale
Source SS DF MS F P
Group .62 1 .62 .59 .445Computer .67 1 .67 .64 .425Group X Computer 4.44 1 4.44 4.24 .041
Simple Main Effects
Cp within Gp1 1.43 1 1.43 1.35 .247Cp within Gp2 2.92 1 2.92 2.78 .097Gp within Cpt 3.73 1 3.73 3.58 .060Gp within Cp2 .87 1 .87 .82 .365
Note. Gp=Group; Gp1=Worked in Group; Gp2=Worked Alone; Cp=Computer; Cp1=Worked on
Computer; Cp2= Did not use Computer.
Mean Synergy & Stimulation Responses
— -Computer
— “ Non-Computer
Alone Group
Group Variable
Figure 7. Group by media interaction for mean synergy and stimulation responses on
Satisfaction Survey. Can be interpreted as task involvement with a high rating indicating greater
involvment (synergy & stimulation).

72
Table 27
Satisfaction Survey; Production Blocking Subscale
Source SS DF MS F P
Group 4.3 1 4.3 2.37 .126
Computer .83 1 .83 .45 .501
Group X Computer 1.16 1 1.16 .64 .426
Table 28
Satisfaction Survev: Free Ridina Subscale
Source SS DF MS F P
Group 1.20 1 1.20 1.26 .263
Computer 2.70 1 2.70 2.82 .095
Group X Computer .24 1 .24 .25 .617

73
Discussion
It is important at this point to change the focus of the discussion from a
micro perspective to a macro perspective. It is sometimes difficult to evaluate
complex results when the focus is on the minute statistical details. For this
reason, a broader focus will be adopted in order to discern the meaningfulness of
these results as an integrated body of information. Results will be summarized
and linked with past research in an effort to gain a better understanding of
complex problem solutions under varying conditions.
The effect of computer/group interaction on problem solving was
investigated in this study. A comparison was made, utilizing networked group
software, between those individuals working together via computer linkup and
those working face-to-face. In addition, individual productivity was examined
under similar circumstances.
Hypothesis 1: Quality of Solutions Generated
Quality, defined as a tripartite concept which includes the appropriateness
of the solution, originality of the solution and the resolving power of the solution
was the focus of Hypothesis 1 in this study. Utilizing a research design wherein
all subjects worked as individuals during the pre-group phase, it was anticipated
that there would be no differences in the quality of the solutions generated at this
juncture. This proved to be the case for the originality and resolving power
ratings for this initial solution, however, the appropriateness ratings displayed a

74
surprising result. The participants who knew they would eventually be working
and sharing information with others in their group, generated initial solutions
which were of lower appropriateness than those participants who knew they
would continue to work alone. Although this pre-solution was lower, the gain in
the appropriateness rating for the post-group consensus solution for those
working in groups was marginally higher than the change experienced by those
working alone. Although no significant differences were detected in either the
appropriateness of the initial solution, or in the appropriateness of the final
solution, we do see a marginally significant difference in the gain in quality as
measured by appropriateness for those people working in groups.
This depression of the pre-group initial solution quality ratings is an
interesting result. There appears to be what might be called an “anticipation”
effect at work with these participants which resulted in lower appropriateness
ratings for those solutions. This anticipation effect may possibly stem from social
loafing (also known as free riding) which has frequently been shown to reduce an
individual’s contribution to the group. However, this group dynamic is typically
detected within the group framework when an individual in a group is content to
sit back and let others do the work knowing all will get credit for the group
contribution. Social loafing suggests that participants do not perform up to their
potential because they believe they will get credit for the group productivity
regardless of their input. This group effect has been pinpointed as a reason for
lowered group productivity (Gallupe, et al., 1994). The fact that participants were

75
not yet working within the group environment suggests there may be something
quite different at work here. The significantly higher level of synergy and
stimulation reported by the computer group may have driven the improvement or
gain displayed by all those working within a group. However, this would not
explain the relative lower starting point for those anticipating working in a group.
It appears that they chose to put less effort into their initial solution because they
knew they would have an opportunity to collaborate in the future. For those
working alone, this opportunity to collaborate was not an option as they knew
from the beginning that the effort and product was their’s alone.
The finding that differences in the appropriateness of the solutions was
eliminated with the final solution points suggests that free riding was not a factor
during the actual group interaction. The difference found between the initial
solution rating and the final solution rating for appropriateness is a reflection of
the group participants starting lower and ending higher than those participants
working alone. This suggests that free riding did not occur. In addition, free riding
was not detected through the satisfaction survey. This survey attempted to
determine participants’ perception of level of involvement which can be
interpreted as a measure of free riding. The mean ratings indicated strong
feelings of involvement for all participants in all conditions.

76
Hypothesis 2: Number of New Factors Generated
Again, the foundation for this hypothesis lies in the action of the negative
group dynamics, free riding, production blocking and evaluation apprehension
and the positive dynamic of synergy and stimulation. As the negative dynamics
have been shown to decrease the productivity of people working in face-to-face
groups, the computer linked work environment was designed to capture the
synergy of the group interaction while eliminating the negative aspects of group
interaction. In this way, when given the opportunity to do so, the computer group
was expected to produce a greater number of new factors. This did not happen.
In fact, just the opposite proved to be true in this study. The group working face-
to-face, presumably under the burden of the negative group dynamics of free
riding, production blocking and evaluation apprehension, proved to be the most
productive in new factors generation. Overall, those working on the computer
generated very few new factors. At least a partial explanation may be revealed
through an examination of the computer group dynamics. As the participants in
these computer group could communicate with each other only through the
computer, a verbatim record was captured of their communications with each
other. A review of these communications revealed several similarities among
computer groups. While managing to stay focused on the task, their comments
revealed an enjoyment of the computer communication process. This process is
similar to on-line e-mail or the communication one would encounter through a
computer chat line. The computer communication processes appears to be so

77
engaging that at the end of each session participants had lost track of time and
felt time pressure to reach consensus.
Based on the verbal feedback during debriefing and comments captured
on the computer communication screen, I would hypothesize that the computer
group failed to generate new factors because they ran out of time. Although this
was not a “timed” exercise per se, in effect their perception of “running out of
time” may have been a controlling factor. To recap the process, the participants
arrived at consensus for solution, were instructed to turn back to their individual
factor list for revision and then to the survey material. Very little revising of factor
lists took place in this group and time appears to be the offender. The
commentary reveals that it was not uncommon for at least one member of the
group to be pushing the others to consensus toward the end of the session, due
to time constraints. Comments recorded on the computer printout of the
information exchange between group members point in this direction. This
included mention of participants having to get to another class, go to lunch
(getting hungry !), or just having other things to do which necessitated finishing
the assigned task and “getting out of there.”
Hypothesis 3: Time
The time issue is evident in the analysis that demonstrates a significantly
longer time interval for completion of the task for groups in general and for the
computer group condition in particular. Some of this may be accounted for by the
need for the groups to reach concensus, some perhaps by the computer process

78
itself. Although training time (apx. 2 minutes) for those using computers was not
included in their total work time, the lack of familiarity with the work media may
have increased time used for completion of the problem solving process.
However, this doesn’t account for the dramatic increase in time shown by the
participants in the computer group over and above all other conditions, including
those working alone on the computer. An additional 23 minutes, on average, was
taken by computer groups over any of the other conditions. In addition, the
Satisfaction Survey subscale on Perception of Time reveals that participants in
the group conditions felt greater time pressure with regard to the problem solving
process.
Some of the time difference may be accounted for based on procedural
differences. A task assigned to the people working alone designed to give them
a time interval during which they could think about the problem similar to those
working in a group appears to have been a less time consuming activity (Leisure
Activity Survey). Although exact times were not kept for this specific part of the
activity, most individuals were able to complete this survey in less than five
minutes. In general, based on observation of time on task, the group information
exchange took longer than this. For this reason, we would expect the groups to
be engaged in the overall problem solving task for a longer time. However, this
factor alone cannot account for the dramatic differences in the time participants
used for this study. Those on the computer appeared to choose to stay engaged
in the performance of the task longer than all other conditions. Perhaps this

79
willingness to stay engaged could be put to more productive use under different
conditions. One could speculate that if the generation of new factors had been
assigned as a group task rather than an individual task, the results would have
been more productive.
Computer Experience
This survey was designed to tap into each individual’s factual and affective
computer experience. The survey was used in order to address the concern that
results could be attributed to differences in computer experience that the
individuals brought with them to the problem solving task. Of particular concern
was that computer illiteracy could depress the performance of the computer
participants. This does not appear to have happened. In fact, the computer
survey sub-scale for factual experience indicated that the computer group was
more experienced relative to other conditions. It was anticipated that there
would be no differences in either factual or affective computer experience due to
random assignment to the various conditions. Although the full computer survey
supported this hypothesis, the sub-scale analysis revealed an unexpected result.
These results showed that the people who worked in computer groups reported
more computer experience and stronger positive affect toward computer
useHowever, these additional findings are of interest as the computer experience
survey was completed at the end of the problem solving task. Therefore, these
results are possibly attributable to the study computer experience. Computer use
was very salient in the minds of the computer group. The individuals working in

80
the computer group had also reported high satisfaction with the problem solving
process. In fact, this satisfaction level was significantly higher than the
satisfaction level reported by people working in the other conditions. Comments
made during debriefing also indicated these participants found the computer
group experience to be interesting and fun. This experience appears to have had
an impact on their reported factual and affective computer experience.
Obviously, our purpose would have been better served had the computer
experience survey been completed at the beginning of the problem solving
exercise. This small format change would have likely provided us with a more
accurate pre-study report on this variable.
It is important to remember that our main concern was that computer
illiteracy might depress computer performance, as such, the report of more
computer experience and stronger positive affect was not a concern for the
analysis.
Implications of Findings
Today’s focus on team activity coupled with computer networking,
provided the impetus for this study. Although the original hypotheses were not
supported, the findings of this study do provide important information that can be
useful to business and industry. Communication plays an ever increasing role in
the success and failure of business ventures in the information age. It is not
unusual for the exchange of information and collaboration on a problem to be
conducted via network computer communications. This focus on group

81
interaction via computer either within a decentralized company or between
companies with common goals, begs the question of whether this is an effective
way to interact. This study indicates that problems can be addressed and solved
as effectively via computer interaction. We see no deficit in the quality of problem
solution when people were linked only through the computer. So, rather than
physically bringing people together for a face-to-face conference, and incurring
the associated costs, groups can collaborate through a computer linkup with
confidence that their product will be as effective as those solutions that come out
of face-to-face meetings. A major complaint in industry today is the number of
meetings people are required to attend. Some of these meetings could
presumably be replaced with computer problem solving. In this way, problems
could be addressed by groups in real time or over a pre-specified time period at
the convenience of participants. This access to the dialogue of problem solving
provided by the computer environment allows for individual time management as
well as group interaction.
This is not to say that people should be encouraged to stay at their
computer having contact with others only rarely. The benefits of occasional face-
to-face interaction cannot be understated including the members’ growth and
personal well-being (Sutton & Hargadon, 1996). This sense of well-being that
springs from group interaction can quickly turn into stress, however, when
meetings are strung end to end. It is interesting to note that the computer groups
appear to have experienced some of these same group interaction benefits as

82
reflected in the satisfaction survey without the time and resource availability
limitations of physically moving to different meeting sites. Through the intelligent
integration of computer group interaction into the corporate communication
process, time control can be put back into the hands of the individuals involved.
Study Limitations
One of the major limitations of this study comes out of the inability of this
research study to develop a computer group environment that incorporated more
than three computers. Research indicates that many of the benefits of computer
interaction are not evident until groups approach 12 to 15 in number (Dennis &
Valacich, 1993). These researchers speculated that a critical mass of ideas is
necessary in order for synergy to be triggered in a group. In groups of 12 to 15
participants, they believe this synergy is achieved. In this study, the limitation of
groups to three members may have contributed to our inability to detect condition
differences in the pre- and postgroup quality ratings. However, the fact that we
did experience a gain in the appropriateness ratings demonstrates that a
computer group environment is conducive to productive complex problem solving.
With larger groups, perhaps more typical of the real world work environment,
pulled together via computer, this productivity gain may be even more evident.
Such real world groups would differ qualitatively as well as quantitatively from the
research groups utilized in this study where there were no real consequences for
task outcome and the group members brought relatively homogeneous skills to
the task environment. Real world groups could be expected to bring diverse

83
skills and knowledge to the task as well as motivation stemming from the
consequences of their problem resolution.
A second limitation to this study was perhaps the actual problem presented
to the participants for solution (Clara’s problem). Although couched in student
terms, this problem was selected in order to simulate the kind of complex problem
faced by people in industry. Feedback from the pilot study indicated that students
did not find the problem to be difficult to solve or particularly complex in nature.
For this reason, the problem was revised, in an effort to increase the complexity.
However, if the problem was still not complex enough, the problem may have
stimulated multiple obvious solutions. With many obvious solutions available, the
participants may not have made the effort to develop more creative problem
solutions. The lack of variance in the originality of solutions is a strong indicator
that creativity was not tapped in this study. Presentation of a problem of very
high complexity, with no obvious solution, may have changed the nature of the
problem solving process, forcing participants to become more creative in their
approaches, which in turn could have provided the variance necessary to
distinguish performance differences between groups. It is in this highly complex
environment that group synergy is likely to boost productivity based on one group
member working from an idea or even a small piece of an idea presented by
another group member.
That the actual problem presented can have an effect of the participants
and in turn the participants responses as been demonstrated in recent research.

84
This problem was drawn from a group of problems which had been tested for
emotional impact on the participants as part of a taxonomy study (Scherer, Butler,
Reiter-Palmon, & Weiss, 1994). Clara’s problem was shown to be relatively
innocuous with regard to emotional reactions, however, the level of complexity
may have fallen short of that needed in this study to challenge the group mind.
One could expect real world problems that would trigger or necessitate the
bringing together of multiple sources of expertise to be of such complexity.
In retrospect, it appears that training of raters may also have been a
weakness in this study. Although consensus data was used in the analyses, the
initial ratings completed by the two raters displayed relatively low reliability. This
indicates that the raters may have lacked a solid understanding of the rating
concepts during the initial rating. A presumption of understanding, based on
rater familiarity with the rating schema and a brief but intense training period, was
perhaps misplaced. The consensus information could possibly have been a
product of compromise in divergent ratings rather than a cognitively correct
interpretation of the quality under scrutiny. This compromise in ratings may have
diluted the variance for the quality ratings for problem solutions.
The placement of the computer survey at the end of the study also
appears to have influenced the responses by participants, with the primacy of the
computer experience having a particular impact. This is, however, only an error
based on the original purpose. The placement of this survey at the end of the
process provided unexpected valuable information regarding the positive aspects

85
of the computer experience. When people actually work on the computer for
group problem solving, they find the experience to be very positive which
apparently influences their self-efficacy regarding computer use. This increased
computer self-efficacy is reflected not only in the reported computer factual and
affective responses but also in the high overall satisfaction reported by this group.
The influence of anticipated group participation, which may have led to
social loafing or free riding for some of the subjects was a function of research
design. This effect could have been eliminated had all subjects been told initially
that they would be working on their own for this project. Later in the instructions,
a change could have been introduced to the participants which would have linked
some of them into groups. In this way, anticipation of group interaction would not
have been a factor.
Future Research
The similarity found in the quality of problem solutions regardless of group
or media is a positive finding. But, it is just a starting point. Field research which
utilizes existing computer networks within and between companies, with the
capability of linking large groups in complex problem solving may be a better test
of the original hypothesis. This hypothesis suggested that computer linked
groups would actually produce higher quality problem solutions because they
were not subjected to the negative group dynamics of free riding, production
blocking and evaluation apprehension.

86
Typically, groups are brought together when any individual working alone
would have a difficult time solving the actual problem. The group members will
bring different skills, knowledge, experience and perspectives to the problem
solving activity. This diverse group make-up working on a highly complex
problem may be exactly what is needed for the generation of high quality
solutions. It is difficult to approximate these real world group dynamics in the
laboratory. A field study could more closely approximate the conditions faced by
problem solvers in their day to day efforts to “get the job done”.
The perception of time factor revealed in this study and the potential for
impact on quality may be another fruitful source of future research. As it appears
that people may impose time constraints even when the researcher does not, a
study directed specifically at actual and perceived time could provide information
that would be applicable to the work environment.
Past research also suggests that working in face-to-face groups leaves
participants with a feeling of well-being. I would suggest that this satisfaction
turns to stress as the number of meetings increases. Where is the pivot-point
located which turns the positive aspects of face-to-face interaction into a stressor.
This research could reveal the nature of the balance that should be promoted
between face-to-face work groups and electronic work groups.

87
An analysis of group process based on the dialogue captured during the
computer group exchange would also be of interest. Would group size influence
the dynamics of the communication exchange? Do those groups who
communicate at greater length produce a higher quality final product? Are
participants actually responding to other group member’s ideas or building on
their own ideas?
The complexity of computer interaction could also be explored through a
research design that controlled the nature of communication between group
participants. A simple statement to the effect that computer group interaction
facilitates problem solving fails to delve into the richness of the dynamics of the
media. The groupware program could be configured to simulated the variance
found in the natural work environment. These configurations might include: a
read only condition, waiting sequentially for an opportunity to respond or timed
entry to other group participant’s ideas.
The computer experience survey results could also provide fodder for
future research. Did these results actually occur because of the placement of the
survey following the computer experience? Would we get similar results if
placement of the survey was manipulated with some participants completing it
immediately prior to, or perhaps a week following the actual study?
In the current study, the importance of the decision or solution to the
problem was not manipulated. It is possible that had emphasis been place on the
importance of generation of new factors or the importance of the final solution,

88
our results would have been different. When the importance level is left up to the
individual participants, each brings a different impetus to the situation. Decision
importance is certainly a variable that influences people mandated to make
decisions in the work environment. Could the added stress of importance
actually undermine the quality of the final solution?
The anticipation effect found in this study may also be an interesting study
in itself. Is this effect common to all individuals who anticipate working in a group
and under what conditions is it most prevalent? Can this effect be isolated and
can attributions regarding the source of this effect be teased out? Is this effect a
complex blending of social loafing, free riding and evaluation apprehension?
This study appears to bring to mind many avenues for future research, while
also serving to provide a little more information to guide these ventures.

89
References
Collins, E. &Geutzkow, H. (1994). A social psychology of group
processes for decision-making. New York: Wiley.
Davis, J. (1992). Some compelling intuitions about group consensus
decisions, theoretical and empirical research, and interpersonal aggregation
phenomena: Selected examples, 1950-1990. Organizational Behavior and
Human Decision Processes. 52. 3-38.
Davis, L.,& Toseland, R. (1987). Group versus individual decision making:
An experimental analysis. Social Work with Groups. 10(2). 95-110.
Dennis, A., & Valacich, J. (1994). Group, sub-group, and nominal group
idea generation: New rules for a new media? Journal of Management. 20(4).
723-736.
Dhar, V., & Olson, M. (1989). Assumptions underlying systems that
support work group collaboration. In M. Olson (Ed.), Technological support for
work group collaboration (pp. 33-50). Hillsdale, NJ: Lawrence Erlbaum
Associates, Publishers.
Diehl, M., & Stroebe, W. (1987). Productivity loss in brainstorming groups:
Toward the solution of a riddle. Journal of Personality and Social Psychology. 53.
497-509.
Gallupe, R., Cooper, W., Grise, M., & Bastianutti, L. (1994). Block
electronic brainstorms. Journal of Applied Psychology. 79 (1). 77-86.
Grofman, B.,& Feld, S. (1992). Group decision making over
multidimensional objects of choice. Organizational Behavior and Human Decision
Processes. 52. 39-63.

90
Hill, G. (1982). Group versus individual performance: are N + 1 heads
better than one? Psychological Bulletin. 91(31. 517-539.
Hinsz, V. (1991). Individual versus group decision making; Social
comparison in goals for individual task performance. Journal of Applied Social
Psychology, 21(12). 987-1003.
Hirokawa, R., & Johnston, D. (1989). Toward a general theory of group
decision making: Development of an integrated model. Small Group Behavior.
20(4), 500-523.
Hogarth, R., & Kunreuther, H. (1992). Decision-making under uncertainty:
the effects of role and ambiguity. In F. Heller (Ed.), Decision-making and
leadership (pp. 189-212). Victoria, Australia: Cambridge University Press.
Huber, G. (1984). The nature and design of post-industrial organizations.
Management Science, 30. 928-951.
Janis, I. (1982). Groupthink: Psychological studies of policy decisions and
fiascoes (2nd ed.). Boston: Houghton Mifflin Co.
Johansen, R. (1989). User approaches to computer-supported teams. In
M. Olson (Ed.), Technological support for work group collaboration (pp. 1-32).
Hillsdale, NJ: Lawrence Erlbaum Associates, Publishers.
Kameda, T., & Davis, J. (1990). The function of the reference point in
individual and group risk decision making. Organizational Behavior and Human
Decision Processes. 46. 55-76.
Kahneman, D., & Tversky, A. (1979). Prospect theory; An analysis of
decision under risk. Econometrica. 47, 263-291.
Lorge, I., & Solomon, H. (1955). Two models of group behavior in the
solution of eureka-type problems. Psvchometrika. 20. 139-148.

91
McGrath, J., & Hollingshead, A. (1994). Groups interacting with
technology. Thousand Oaks, CA: SAGE Publications, Inc.
Maznerski, M. (1994). Understanding our differences: Performance in
decision-making groups with diverse members. Human Relations. 47(5). 531-
552.
Michaelson, L., Watson, W., & Black, R. (1989). A realistic test of
individual versus group consensus decision making. Journal of Applied
Psychology. 74(5). 834-839.
Michaelson, L., Watson, W., Schwartzkopf, A., & Black, R. (1992). Group
decision making: How you frame the questions determines what you find.
Journal of Applied Psychology. 77(1). 106-108.
Mintzberg, H., Duru, K., Raisinghani, D., & Theoret, A. (1976). The
structure of unstructured decision processes. Administrative Science Quarterly.
21, 246-275.
Moreland, R., & Levine, J. (1992). The composition of small groups. In E.
L. Lawler, B. Markovsky, C. Ridgeway, & H. Walker (Eds.), Advances in Group
Processes. 9 (pp. 237-280).
Mullen, B., Johnson, C., & Salas, E. (1991). Productivity loss in
brainstorming groups: A meta-analytic integration. Basic and Applied Social
Psychology, 12(1). 3-23.
Mumford, M., Mobley, M., Uhlman, C., Reiter-Palmon, R., & Doares, L.
(1991). Process analytic models of creative capacities. Creativity Research
Journal. 4(2). p. 106.

92
Mumford, M., Reiter-Palmon, R., & Redmond, M. (1994). Problem
construction and cognition: Applying problem representations in ill-defined
domains. In M. Runco (Ed.), Problem finding, problem solving and creativity (pp.
3-39). Norwood, NJ: Ablex Press.
Nemeroff, P., & King, D. (1975). Group decision-making performance as
influenced by consensus and self-orientation. Human Relations. 28. 1-21.
Nunamaker, J., Dennis, A., Valacich, J., Vogel, D., & George, J. (1991).
Electronic meeting systems to support group work. Communications of the ACM.
34(7), 40-61.
Paulus, P., Dzindolet, M., Poletes, G., & Camacho, L. (1993). Perception
of performance in group brainstorming: The illusion of group productivity.
Personality and Social Psychology Bulletin. 19(1). 78-89.
Reiter-Palmon, R. (1993). Applying the life template: Problem
construction in everyday life. Unpublished doctoral dissertation, George Mason
University, Fairfax, VA.
Scherer, L., Butler, A., Reiter-Palmon, R., & Weiss, J. (1994, Nov.).
Toward a taxonomy of reactions to ill defined problems. Paper presented at the
annual meeting of the Society for Judgment and Decision Making, St. Louis,
Missouri.
Shaw, M. (1992). Comparison of individuals and small groups in the
rational solution of complex problems. American Journal of Psychology. 44. 491-
504.
Stefik, M., & Brown J. (1989). Toward Portable Ideas. In M. Olson (Ed.),
Technological support for work group collaboration (pp. 147-166). Hillsdale, NJ:
Lawrence Erlbaum Associates, Publishers.

93
Steiner, I. (1972). Group process and productivity. San Diego, CA:
Academic Press.
Sutton, R., & Hargadon, A. (1996). Brainstorming groups in context:
Effectiveness in a product design firm. Administrative Science Quarterly. 41.
685-718.
Tindale, R., & Larson, J. (1992a). Assembly bonus effect or typical group
performance? A comment on Michaelson, Watson, and Black (1989). Journal of
Applied Psychology. 77(1). 102-105.
Tindale, R., & Larson, J. (1992b). It’s not how you frame the questions, it’s
how you interpret the results. Journal of Applied Psychology. 77(1). 109-110.
Valacich, J., Dennis, A., & Connolly, T. (1994). Idea generation in
computer-based groups: A new end to an old story. Organizational Behavior and
Human Decision Processes. 57. 448-467.
Vroom, V., Grant, L., & Cotton, T. (1969). The consequences of social
interaction in group problem solving. Organizational Behavior and Human
Performance. 4, 77-95.
Vroom, W., & Yetton, P. (1973). Leadership and decision making.
Pittsburg: University of Pittsburg Press.
Watson, W., Michaelson, L., & Sharp, W. (1991). Member competency,
group interaction, and group decision making: A longitudinal study. Journal of
Applied Psychology. 76(6). 803-809.
Williams, K., Harkins, S., & Latane’, B. (1981). Identifiability as a deterrent
to social loafing: Two cheering experiments. Journal of Personality and Social
Psychology. 40(2). 303-311.

94
Yetton, P., & Crawford, M. (1992). Reassessment of participative
decision-making: A case of too much participation. In F. Heller (Ed.), Decision
making and leadership (pp. 90-112). Victoria, Australia: Cambridge University
Press.

95
Appendix A
Stimulus Problem: Clara

96
Problem Description
Clara’s Problem
Clara, a junior pre-med student, is working part-time and taking a 15 hour credit load at school. Clara enjoys her pre-med courses very much, but they are difficult and time consuming. Her current job as a “gopher” at an architectural design firm requires her to work 25 hours a week which really cuts into her available study time. In fact, she is barely getting “C’s?” in two of the classes she needs for her major. The pay in her present job is good, and she enjoys the work, although she is not getting a lot of practical experience. Clara does not want to drop any of her classes as she needs them to graduate so that she can be admitted to medical school in the coming year. Up until now, Clara has been able to work at her job and still get good grades, but the difficult courses she is taking now require much more of her time. Clara needs to work in order to finance her education. Clara is not sure how to solve her problem.

Appendix B
Leisure Activities Survey

Leisure Activities 1
Participant No..
In this inventory we are interested in your extra-curricular activities and accomplishments. For each item mark in the corresponding . shadow box the answer that bast describes you. Do not count school assignments unless specified to do so.
Please use the following scale to answer the items.
A=*neverm il i m t i t i l i l i i i i im ilinisiiiim imii iw im ii mum |I«m
lLV .V il;
or more times
How often have you constructed something that required scientific knowledge, such as radio, telescope, or other scientific apparatus?
How often have you presented an original mathematics paper to a professional or special interest group?
^ How often have you entered a project or paper into science competition?
How often have you applied math in an original way to solve a practical problem?
How often have you written an original computer program?
How often have you won an award for a scientific project or paper?
How often have you entered a mathematical paper or project into a contest?
How often have you had a scientific paper published?
How often have you dissected a plant and/or animal. Remember - not in school?
How often have you solved statistical/mathematical problems with a computer?
"y .1 How often have you attended summer math/science programs?
How often have you had a scientific project publicly displayed or exhibited?
How often have you participated in scientific research project?

Leisure Activities 1
Participant No.
A=never Sconce C=2-3 times 0=4-5 times E=6 or more times
How often have you participated in a scientific/math club or organization?
How often have you worked as a laboratory assistant?
How often have you worked as an editor for a school literary publication?
How often have you had a piece of literature (e.g.. poem, short story) published in a school/university publication or professionally?
How often have you written poetry?
How often have you written lyrics to a song?
How often have you won an award for something you wrote?
How often have you participated in a writers' workshop, club, or similar organization?
How often have you written a short story?
How often have you written something humorous, such as jokes, limericks, satire, etc.?
How often have you painted an original picture?
How often have you made a sculpture?
How often have you received an award for artistic accomplishment?
How often have you drawn cartoons?
How often have you drawn a picture for aesthetics reasons?
How often have you taken and developed your own photographs?
How often have you constructed a puppet or put on a puppet show?
How often have you designed and made your own greeting cards?
How often have you cooked an original dish?

Leisure Activities 1 100Participant No.________
A=never B=once C=2*3 times
times :£=$ or more times
How often have you made a ceramic craft?
How often have you won an award in musical competition?
How often have you performed regularly as a professional musician?
How often have you had any music that you have composed or arranged receive a professional performance?
How often have you written music for lyrics?
How often have you belonged to a community/professional musical organization?
How often have you set up your own experimental conditions or laboratory?
How often have you won an award in math competition (math league, math club)?
How often have you had artwork or craftwork publicly exhibited?
How often have you designed and constructed a craft out of wood?
How often have you designed and made a piece of clothing?

Appendix C
Satisfaction Survey

102
Participant NoSatisfaction Survey
Please circle the number that best expresses vour answer to the question
*How do you feel about the process by which you generated ideas?Very VeryDissatisfied Satisfied1 2 3 4 5 6 7
**How do you feel about the problem solutions?Very VeryDissatisfied Satisfied1 2 3 4 5 6 7
*All in all, how did you feel?Very VeryDissatisfied Satisfied1 2 3 4 5 6 7
***How do you feel about the process by which you weighted the factors?Very VeryDissatisfied Satisfied1 2 3 4 5 6 7
***How do you feel about the opportunity to review and revise the final solutions?Very VeryDissatisfied Satisfied1 2 3 4 5 6 7
*When you thought of an idea,Could you express Did you have toit immediately wait to express it1 2 3 4 5 6 7
***This process made it easy for me to immediately express my thoughts?Strongly Agree Strongly Disagree1 2 3 4 5 6 7
***Waiting was not a problem in this problem solution process.Strongly Agree Strongly Disagree1 2 3 4 5 6 7
*Did you feel any apprehension about generating your ideas?A lot of Neutral/ Noapprehension Undecided apprehension 1 2 3 4 5 6 7
**How at ease were you during the problem solving?Definitely not Neutral/ Veryat ease Undecided at ease1 2 3 4 5 6 7
***l was nervous about what others would think of my answersStrongly Agree Strongly Disagree1 2 3 4 5 6 7
*Did you express you ideas Soon after you thought of them 1 2 3 4 5
After waiting for awhile
6 7
***l felt like I would be evaluated on the quality of my information.Strongly Agree Strongly Disagree1 2 3 4 5 6 7

103
""How much do you feel you participated in this problem solving session?Not much Neutral/ A lotat all Undecided1 2 3 4 5 6 7
*How satisfied are you with your own performance on this task?Very Neutral/ VeryDissatisfied Undecided Satisfied 1 2 3 4 5 6 7
***Participating in this problem solving process was exhausting Strongly Agree Strongly Disagree1 2 3 4 5 6 7
***l was bored very quickly by this problem solving processStrongly Agree Strongly Disagree1 2 3 4 5 6 7
***l didn’t have to contribute much to this process.Strongly Agree Strongly Disagree1 2 3 4 5 6 7
***l felt very involved with the problem solving process.Strongly Agree Strongly Disagree1 2 3 4 5 6 7
""For this task, did you Have as much Wanttime as you needed more time1 2 3 4 5 6 7
"Considering all the ideas you thought of, did youHave time to Not have time toexpress all your ideas express all ideas1 2 3 4 5 6 7
"How stimulating did you find this task?Not Neutral/ VeryStimulating Undecided Stimulating1 2 3 4 5 6 7
""How interesting was this task?Very Neutral/ VeryUninteresting Undecided Interesting 1 2 3 4 5 6 7
"How motivated were you to generate quality ideas?Definitely Neutral/ VeryNot Motivated Undecided Motivated 1 2 3 4 5 6 7
***l always felt rushed to move on to the next part of the problem solving process Strongly Agree Strongly Disagree1 2 3 4 5 6 7
***l had sufficient time to complete each part of this problem solving process Strongly Agree Strongly Disagree1 2 3 4 5 6 7
" Original survey question (Dennis & Valacich, 1993)"* Modification of original survey question **" New survey question added for this study

104
Appendix D Computer Experience Survey

105
C o m p u te r E x p e r ie n c e a n d A t t it u d e S u rv e y
I e n jo y w o r k in g o n a c o m p u te rStrongly Agree Strongly Disagree1 2 3 4 5 6 7
I w is h c o m p u te r s h a d n e v e r b e e n c r e a te dStrongly Agree Strongly Disagree1 2 3 4 5 6 7
I u s e a c o m p u te ra) alwaysb) almost every dayc) only every few daysd) only once a weeke) only a few times a month 0 only a few times a year g) never
I f a v a ila b le , I w o u ld u s e a c o m p u te r f o r w r i t in g le t t e r s .Almost Always Almost Never1 2 3 4 5 6 7
I e n jo y le a r n in g n e w c o m p u te r s o f tw a r e a p p lic a t io n s .Strongly Agree Strongly Disagree1 2 3 4 5 6 7
I c o n s id e r c o m p u te r s to b e u s e r - f r ie n d ly in g e n e r a l.Strongly Agree Strongly Disagree1 2 3 4 5 6 7
Y o u h a v e to b e a g e n iu s t o u n d e r s ta n d h o w to u s e m o s t c o m p u te r p r o g r a m s !Strongly Agree Strongly Disagree1 2 3 4 5 6 7
I w o u ld a p p ly f o r a jo b t h a t r e q u ir e d c o m p u te r e x p e r t is e .Strongly Agree Strongly Disagree1 2 3 4 5 6 7
I u s e a c o m p u te r to d o m y h o m e w o r k .Strongly Agree Strongly Disagree1 2 3 4 5 6 7
C o m p u te rs m a k e m o r e w o r k th a n th e y s a v e .Strongly Agree Strongly Disagree1 2 3 4 5 6 7
I a m c o m fo r ta b le w o r k in g o n a c o m p u te r .Strongly Agree Strongly Disagree1 2 3 4 5 6 7
I c o n s id e r m y s e lf to b e e x p e r ie n c e d in th e u s e o f c o m p u te r s .Strongly Agree Strongly Disagree1 2 3 4 5 6 7
I w o u ld r a t h e r w r i t e a n a s s ig n m e n t o u t b y h a n d th a n u s e a c o m p u te r w o r d p r o c e s s o r .Strongly Agree Strongly Disagree1 2 3 4 5 6 7
W h e n I u s e a c o m p u te r , I a m a f r a id I w i l l m a k e a m is ta k e a n d t h is m a k e s m e a p p r e h e n s iv e !Strongly Agree Strongly Disagree1 2 3 4 5 6 7
I f in d a c o m p u te r to b e a n in d is p e n s a b le t o o l in m y w o r k .Strongly Agree Strongly Disagree1 2 3 4 5 6 7
U s in g a c o m p u te r m a k e s m e n e r v o u s .Strongly Agree Strongly Disagree1 2 3 4 5 6 7
I f a v a ila b le to m e , I w o u ld u s e th e In t e r n e t to a c c e s s in f o r m a t io n .Frequently Never1 2 3 4 5 6 7
W h e n I u s e a c o m p u te r , s o m e th in g u s u a lly g o e s w r o n g .Strongly Agree Strongly Disagree1 2 3 4 5 6 7

106
I h a v e u s e d a c o m p u te r f o r ,1) never2) less than 2 months3) 6 months4) at least 1 year5) at least 2 years6) more than 2 years7) seems like forever
I a m v e r y c o m fo r ta b le u s in g a c o m p u te r
Strongly Agree 1 2 3
Strongly Disagree 5 6 7
In d ic a te th e o p e r a t in g s y s te m s y o u h a v e u s e d
DOS_______ _____WINDOWS ____OS/2 ____UNIX ____NEX1 ____MAC/US _____VMS

107
Appendix E Research Condition: Paper and Pencil/Alone

108
SOCIAL PROBLEM RESEARCH
This packet will present a complex social problem, which will be referred to as Clara’s problem. I will be asking you to write down key pieces of information or factors that might be important to consider when searching for a solution to this problem and also to assign an importance rating to each of these factors.For example: Imagine that your have a friend named James. James has been offered a contract to play professional football in his sophomore year in college. What should he do? Some of the factors or key pieces of information that need to be considered might be. 1) James is currently in college 2) he's been offered a contract 3) the value he places on his education 4) his need for money. In other words, factors can include possible outcomes the person might want to achieve, relevant information present (explicit), relevant information not presented but understood (implicit), factors that would present limitations or restrictions to the problem solution, personal values that may need to be considered in the problem solution, personal control over the problem solution, risk factors, impact of solution, etc. More specific information on importance will be giving in your written instructions in the packet, but for this example, the fact that James was actually offered a contract may be a very important piece of information and might be rated as 10, some other piece of information may not be quite as important and you may want to rate it as a 7, a third piece of information may also warrant a rating of 7. The ratings are based on your perception of how important that piece of information is to the solution of the problem. Are there any questions about factors or importance ratings?
Please work through this packet in the order presented. You are being asked to follow the steps as outlined below:
Step 1) Please read Clara’s problem.
Step 2) Turn the page and read the all directions presented at the top of the next page.
Step 3) Following the directions on this page before proceeding to the next page.
Step 4) Continue to work through the packet, reading directions on each page and completing the task before moving to the next page.
Step 5) Upon completion, please double check that your Participant Number is clearly written on each page that you have worked on.
Step 6) Put the packet back in order and bring the packet to me.
Thank you for your assistance with this research
Gini Collins I/O Ph.D. Student
Upon completion of this page please turn the page and proceed.

109
Problem Description
Clara’s Problem
Clara, a junior pre-med student, is working part-time and taking a 15 hour credit load at school.
Clara enjoys her pre-med courses very much, but they are difficult and time consuming. Her
current job as a “gopher” at an architectural design firm requires her to work 25 hours a week
which really cuts into her available study time. In fact, she is barely getting “C’s” in two of the
classes she needs for her major. The pay in her present job is good, and she enjoys the work,
although she is not getting a lot of practical experience. Clara does not want to drop any of her
classes as she needs them to graduate so that she can be admitted to medical school in the
coming year. Up until now, Clara has been able to work at her job and still get good grades, but
the difficult courses she is taking now require much more of her time. Clara needs to work in
order to finance her education. Clara is not sure how to solve her problem.

110
Participant No
Factor and Importance Rating Sheet
With Clara’s problem in mind, please list all the key information, either presented or implied that you might consider when attempting to solve this problem. Please do not list solutions -jus t list the individual pieces of relevant information that you read in this problem paragraph
or which you can imply from the information presented in the problem paragraph.
After listing all of the key information, please go back to each factor and rate it for importance for the final solution. “How important is this piece of information when searching for a final solution to this problem.”
Please rate each factor using a full scale from 1 to 10, with 1 as Least Important and 10 as Most Important. These importance rating numbers can be used for more than one factor. For example, if you believe that both factor 2 and factor 4 are Most Important then you would give them both a rating of 10.
LEAST IMPORTANT MOST IMPORTANT1----------2----------3-------------4------------ 5---------6---------- 7-------- 8---------9-------- 10
IMPORTANCE RATING 1 ______
2 ______
3 ___________________________________________________ ______
4 __________________________________________________ _ ______
5 ___________________________________________________ ______
6 ______
7 ___________________________________________________ ______
8 ______
9 ___________________________________________________ ______
10 ______
11 ______
12 ______
13 _______________________________________________ ______ ______
14

111
Participant No......................
Best Solution Sheet
Having considered all the key information for Clara’s problem, please write your
best solution.

112
Please complete the Leisure Activity survey that follows this page. Read the
instructions presented at the top of the page and complete the survey as directed.
Be certain to enter your Participant Number in the upper right hand corner of
each page. You may turn the page and begin.

113
Participant No
Revised Factor and Importance Rating Sheet
At this point, I would like to give you the opportunity to revise your factor list if you choose and also revise your importance ratings if necessary. This factor list can be revised by adding new factors, modifying existing factors or changing your importance ratings.
KEY INFORMATION (FACTORS) IMPORTANCE RATING1 ______
2
3
4
5
6
7
8
9
10
11
12
13
14
15
16
17
18

114
Participant No._________
REVISION OF BEST SOLUTION
The final task in this problem solving study is to revise your final solution if you want to.

115
Please turn the page and complete the two survey forms that follow. Upon completion, please check to be sure that you have written your participant number on every sheet.

Appendix F
Research Condition: Paper and Pencil/Group
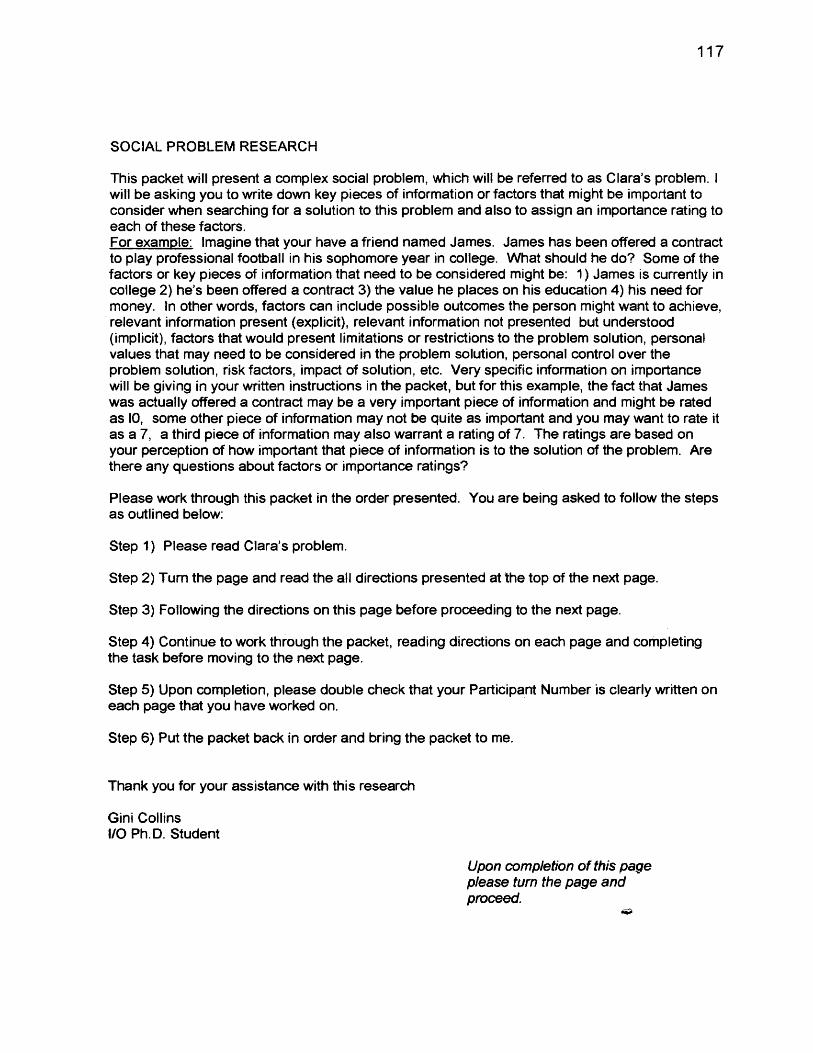
117
SOCIAL PROBLEM RESEARCH
This packet will present a complex social problem, which will be referred to as Clara’s problem. I will be asking you to write down key pieces of information or factors that might be important to consider when searching for a solution to this problem and also to assign an importance rating to each of these factors.For example: Imagine that your have a friend named James. James has been offered a contract to play professional football in his sophomore year in college. What should he do? Some of the factors or key pieces of information that need to be considered might be: 1) James is currently in college 2) he’s been offered a contract 3) the value he places on his education 4) his need for money. In other words, factors can include possible outcomes the person might want to achieve, relevant information present (explicit), relevant information not presented but understood (implicit), factors that would present limitations or restrictions to the problem solution, personal values that may need to be considered in the problem solution, personal control over the problem solution, risk factors, impact of solution, etc. Very specific information on importance will be giving in your written instructions in the packet, but for this example, the fact that James was actually offered a contract may be a very important piece of information and might be rated as 10, some other piece of information may not be quite as important and you may want to rate it as a 7, a third piece of information may also warrant a rating of 7. The ratings are based on your perception of how important that piece of information is to the solution of the problem. Are there any questions about factors or importance ratings?
Please work through this packet in the order presented. You are being asked to follow the steps as outlined below:
Step 1) Please read Clara’s problem.
Step 2) Turn the page and read the all directions presented at the top of the next page.
Step 3) Following the directions on this page before proceeding to the next page.
Step 4) Continue to work through the packet, reading directions on each page and completing the task before moving to the next page.
Step 5) Upon completion, please double check that your Participant Number is clearly written on each page that you have worked on.
Step 6) Put the packet back in order and bring the packet to me.
Thank you for your assistance with this research
Gini Collins I/O Ph.D. Student
Upon completion of this page please turn the page and proceed.

118
Problem Description
Clara’s Problem
Clara, a junior pre-med student, is working part-time and taking a 15 hour credit load at school.
Clara enjoys her pre-med courses very much, but they are difficult and time consuming. Her
current job as a “gopher” at an architectural design firm requires her to work 25 hours a week
which really cuts into her available study time. In fact, she is barely getting “C’s” in two of the
classes she needs for her major. The pay in her present job is good, and she enjoys the work,
although she is not getting a lot of practical experience. Clara does not want to drop any of her
classes as she needs them to graduate so that she can be admitted to medical school in the
coming year. Up until now, Clara has been able to work at her job and still get good grades, but
the difficult courses she is taking now require much more of her time. Clara needs to work in
order to finance her education. Clara is not sure how to solve her problem.

119
Participant No
Factor and Importance Rating Sheet
With Clara’s problem in mind, please list all the key information, either presented or implied that you might consider when attempting to solve this problem. Please do not list solutions -just list the individual pieces of relevant information that you read in this problem paragraphor which you can imply from the information presented in the problem paragraph.
After listing all of the key information, please go back to each factor and rate it for importance for the final solution. “How important is this piece of information when searching for a final solution to this problem.”
Please rate each factor using a full scale from 1 to 10, with 1 as Least Important and 10 as Most Important. These importance rating numbers can be used for more than one factor.Forexample, if you believe that both factor 2 and factor 4 are Most Important then you would givethem both a rating of 10.
LEAST IMPORTANT MOST IMPORTANT
IMPORTANCE RATING 1 '
2 ______
3 ___________________________________________________ ______
4 ___________________________________________________ ______
5 ___________________________________________________ ______
6 ______
7 ___________________________________________________ ______
8 ______
9 ___________________________________________________ ______
10 ______
11
12

120
Participant No.
Best Solution Sheet
Having considered all the key information for Clara’s problem, please write your best solution.

121
Please Wait!
When all members of your group have completed their best solution, discuss the problem, your
factors and importance ratings. The goal of this discussion is for your group to reach consensus
regarding a single best solution to Clara’s problem.
The revision of your factors and importance rating sheet can be done individually.
Following your discussion, review your own list and revise this list by adding new factors,
revising factors or changing importance ratings.
When you have finished your discussion, please proceed to the next page and read the
directions located at the top of the page.

122
Participant No.
Revised Factor and Importance Rating Sheet
At this point, I would like to give you the opportunity to revise your factor list if you choose and also revise your importance ratings if necessary. This factor list can be revised by adding new factors, modifying existing factors or changing your importance ratings.
12
3
4
5
67
8
9
10
11
12
13
14
15
16
17
KEY INFORMATION (FACTORS) IMPORTANCE RATING
18

123
Participant No
Group Consensus Solution Sheet
The final problem solving task for this group is to arrive at an agreement regarding the best solution to this problem. All three members of the group must agree to the solution to Clara’s problem. This consensus can be reached through an exchange of information regarding the solution with the other members of your team.

124
Appendix G Research Condition: Computer/Alone

125
SOCIAL PROBLEM RESEARCH
This packet will present a complex social problem, which will be referred to as Clara’s problem.I will be asking you to write down key pieces of information or factors that might be important to consider when searching for a solution to this problem and also to assign an importance rating to each of these factors.For example: Imagine that your have a friend named James. James has been offered a contract to play professional football in his sophomore year in college. What should he do? Some of the factors or key pieces of information that need to be considered might be: 1) James is currently in college 2) he’s been offered a contract 3) the value he places on his education 4) his need for money. In other words, factors can include possible outcomes the person might want to achieve, relevant information present (explicit), relevant information not presented but understood (implicit), factors that would present limitations or restrictions to the problem solution, personal values that may need to be considered in the problem solution, personal control over the problem solution, risk factors, impact of solution, etc. More specific information on importance will be giving in your written instructions in the packet, but for this example, the fact that James was actually offered a contract may be a very important piece of information and might be rated as 10, some other piece of information may not be quite as important and you may want to rate it as a 7, a third piece of information may also warrant a rating of 7. The ratings are based on your perception of how important that piece of information is to the solution of the problem. Are there any questions about factors or importance ratings?
We will now take a few minutes while I demonstrate some of the basics on the computer program you will be using for this exercise.
Please work through this packet in the order presented. Computer instructions will be given on each page. You are being asked to follow the steps as outlined below:Step 1) Please read Clara’s problem.Step 2) Turn the page and read the all directions presented at the top of the next page.Step 3) Following the computer directions on this page before proceeding to the next page.Step 4) Continue to work through the packet, reading directions on each page and completing the task before moving to the next page.Step 5) Upon completion, please double check that your Participant Number is clearly written on each page that you have worked on.Step 6) Put the packet back in order and bring the packet to me.
DO NOT EXIT FROM THE COMPUTER PROGRAM!
Thank you for your assistance with this researchGini CollinsI/O Ph.D. Student Upon completion of this page
please turn the page and proceed.

126
Problem Description
Clara’s Problem
Clara, a junior pre-med student, is working part-time and taking a 15 hour credit load at school. Clara enjoys her pre-med courses very much, but they are difficult and time consuming. Her current job as a “gopher” at an architectural design firm requires her to work 25 hours a week which really cuts into her available study time. In fact, she is barely getting “C’s” in two of the classes she needs for her major. The pay in her present job is good, and she enjoys the work, although she is not getting a lot of practical experience. Clara does not want to drop any of her classes as she needs them to graduate so that she can be admitted to medical school in the coming year. Up until now, Clara has been able to work at her job and still get good grades, but the difficult courses she is taking now require much more of her time. Clara needs to work in order to finance her education. Clara is not sure how to solve her problem.

127
FACTOR AND IMPORTANCE RATING
Please read all instructions on this page. Once all instructions have been read, please followingthe computer instructions step by step in order to carry out the instructions.
With Clara’s problem in mind, please list all the key information, either presented or implied that you might consider when attempting to solve this problem. Please do not list solutions - just list the individual pieces of relevant information that you read in this problem paragraph or which you can imply from the information presented in the problem paragraph.
Computer instructions
You will use the Add Idea dialog box to list these factors or key information.
1} Type a statement regarding a single piece of key information or a single factor that you might consider when searching for a solution to this problem.
2} Click on the SUBMIT button
3} Repeat steps 1 and 2 until you feel satisfied that you have listed all the important factors that need to be considered when solving this problem.
Upon completion of this task, please turn the page.......

128
IMPORTANCE RATINGS
Please read all instructions on this page. Once all instructions have been read, please followingthe computer instructions step by step in order to carry out the instructions.
instructionsAfter listing ail of the key information, please go back to each factor and rate it for importance for the final solution. “How important is this piece of information when searching for a final solution to this problem”
Please rate each factor using a full scale from 1 to 10, with 1 as Least Important and 10 as Most Important. These importance rating numbers can be used for more than one factor. For example, if you believe that both factor 2 and factor 4 are Most Important, then you would give them both a rating of 10.
Least important Most Important
Computer instructions
1) in the Add Idea screen, double click directly on the first factor or key piece of information that you entered on the screen. This will open a comment box with your factor listed at the top of the page.
2) In the comment box, type in an importance rating number for that factor (from 1 to 10)
3) Click on the SUBMIT button
4) Click on the NEXT button to call up your next factor for rating.
5) Repeat steps 1 through 4 until all factors have been rated.
6) Click on the CLOSE button
Upon completion of this task,please turn the page.

129
SOLUTION
Please read all instructions on this page. Once all instructions have been read, please following the computer instructions step by step in order to carry out the instructions
Having considered all the key information for Clara’s problem, please write your best solution.
Computer Instructions:
1) Double click on your last factor in your factor list. This will open the comment box where you entered your importance ratings and will add your solution under your rating as a new entry. Even though the window looks small, you can enter a length answer if you choose.
2) Type the word SOLUTION — This will identify the information that you type in after as the solution to the problem.
3) Following the word SOLUTION, type in your best solution to Clara’s problem.
4) Click on the SUBMIT button
5) Click on CLOSE button
Instructions
Upon completion of this task,please turn the page

130
REVISION OF FACTORS AND IMPORTANCE RATING.
Please read all instructions on this page. Once all instructions have been read, please following the computer instructions step by step in order to carry out the instructions
At this point I would like to give you the opportunity to revise vour factor list if you choose and also revise your importance ratings if necessary. This factor list can be revised by adding new factors, modifying existing factors or changing your importance ratings.
Computer Instructions
1 )Double click directly on the screen on the typed words of your first factor. This will open the comment screen and will display the factor at the top, plus your importance rating of that factor.
2) To enter a revision, type the revised edition of this factor in the dialogue box and also enter a new rating if you are not satisfied with the previous rating.
3) Click on SUBMIT button
4) Click on NEXT button to bring up your next factor and importance rating. Revise as needed.
5) Click on CLOSE button when your factor revisions are completed.
Upon completion of this task,please turn the page.

131
REVISION OF BEST SOLUTION
Please read all instructions on this page. Once all instructions have been read, please following the computer instructions step by step in order to carry out the instructions
The final task in this problem solving study is to revise your final solution if you want to. In order to complete this revision, please follow the following computer instructions.
Computer instructions
1) Double click on the final factor to show your solution. Revise your solution by typing in your revised version into the dialogue box. Click on the SUBMIT button when you are satisfied with your final solution.
2) Click on the CLOSE button to end this task.
Upon completion of this task,please turn the page

Appendix H Research Condition: Computer/Group

133
SOCIAL PROBLEM RESEARCHThis packet will present a complex social problem, which will be referred to as Clara’s problem. I will be asking you to write down key pieces of information or factors that might be important to consider when searching for a solution to this problem and also to assign an importance rating to each of these factors.For example: Imagine that your have a friend named James. James has been offered a contract to play professional football in his sophomore year in college. What should he do? Some of the factors or key pieces of information that need to be considered might be: 1) James is currently in college 2) he’s been offered a contract 3) the value he places on his education 4) his need for money. In other words, factors can include possible outcomes the person might want to achieve, relevant information present (explicit), relevant information not presented but understood (implicit), factors that would present limitations or restrictions to the problem solution, personal values that may need to be considered in the problem solution, personal control over the problem solution, risk factors, impact of solution, etc. More specific information on importance will be giving in your written instructions in the packet, but for this example the fact that James was actually offered a contract may be a very important piece of information and might be rated as “10”, some other piece of information may not be quite as important and you may want to rate it as a “7”, a third piece of information may also warrant a rating of u7”. The ratings are based on your perception of how important that piece of information is to the solution of the problem.Are there any questions about factors or importance ratings?
We will now take a few minutes while I demonstrate some of the basics on the computer program you will be using for this exercise.
Please work through this packet in the order presented. You are being asked to follow the steps as outlined below:
Step 1) Please read Clara’s problem.Step 2) Turn the page and read the all directions presented at the top of the next page.Step 3) Following the directions on this page before proceeding to the next page.Step 4) Continue to work through the packet, reading directions on each page and completing the task before moving to the next page.Step 5) Upon completion, please double check that your Participant Number is clearly written on each page that you have worked on.Step 6) Put the packet back in order and bring the packet to me.
DO NOT EXIT FROM THE COMPUTER PROGRAM!
Thank you for your assistance with this research
Gini Collins I/O Ph.D. Student
Upon completion of this page please turn the page and proceed.
op

134
FACTOR AND IMPORTANCE RATING
Please read all instructions on this page. Once all instructions have been read, please followingthe computer instructions step by step in order to carry out the instructions.
With Clara’s problem in mind, please list all the key information, either presented or implied that you might consider when attempting to solve this problem. Please do not list solutions - just list the individual pieces of relevant information that you read in this problem paragraph or which you can imply from the information presented in the problem paragraph.
Computer Instructions
You will use the Add Idea dialog box to list these factors or key information.
1} Type a statement regarding a single piece of key information or a single factor that you might consider when searching for a solution to this problem.
2} Click on the SUBMIT button
3} Repeat steps 1 and 2 until you feel satisfied that you have listed all the important factors that need to be considered when solving this problem.
Upon completion of this task,please turn the page

135
IMPORTANCE RATINGS
Please read all instructions on this page, Once all instructions have been read, please followingthe computer instructions step by step in order to carry out the instructions.
InstructionsAfter listing all of the key information, please go back to each factor and rate it for importance for the final solution. “How important is this piece of information when searching for a final solution to this problem”
Please rate each factor using a full scale from 1 to 10, with 1 as Least Important and 10 as Most Important. These importance rating numbers can be used for more than one factor. For example, if you believe that both factor 2 and factor 4 are Most Important, then you would give them both a rating of 10.
Least Important Most Important1-------—2----------- 3---------- 4----------- 5---------6---------- 7---------- 8---------9--------- 10
Computer Instructions
1) In the Add Idea screen, double click directly on the first factor or key piece of information that you entered on the screen. This will open a comment box with your factor listed at the top of the page.
2) In the comment box, type in an importance rating number for that factor (from 1 to 10)
3) Click on the SUBMIT button
4) Click on the NEXT button to call up your next factor for rating.
5) Repeat steps 1 through 4 until all factors have been rated.
6) Click on the CLOSE button
Upon completion of this task,please turn the page.....

136
SOLUTION
Please read all instructions on this page. Once all instructions have been read, please following the computer instructions step by step in order to carry out the instructions
Having considered all the key information for Clara’s problem, please write your best solution.
Computer Instructions:
1) Double click on your last factor in your factor list. This will open the comment box where you entered your importance ratings and will add your solution under your rating as a new entry. Even though the window looks small, you can enter a length answer if you choose.
2) Type the word SOLUTION — This will identify the information that you type in after as the solution to the problem.
3) Following the word SOLUTION, type in your best solution to Clara’s problem.
4) Click on the SUBMIT button
5) Click on CLOSE button
Upon completion of this task, please turn the page.....

137
ACCESSING INFORMATION FROM OTHER GROUP MEMBERS
Please read all instructions on this page. Once all instructions have been read, please following the computer instructions step by step in order to carry out the instructions
At this point, you can access the factors and importance ratings of the other members in your group. You can also access their solution. Please review their factors and importance ratings by following these simple instructions.
Computer Instructions
1) Notice the buckets located at the side of the Category screen. The top bucket contains your information. The other two buckets contain information generated by the other members of your group. To access this information, double click directly on a bucket. This will “tip” the bucket over and your teammates information will appear on your screen.
2) Review the information typed by one other member of your group.
3) Double click on an idea and you will see the rating that was made.
4) Work your way through all of the ideas and ratings of each member of your group.
5) Click on CLOSE to return to your original category screen.
Upon completion of this task, please turn the page.....

138
REVISION OF FACTORS AND IMPORTANCE RATING.
Please read all instructions on this page. Once all instructions have been read, please following the computer instructions step by step in order to carry out the instructions
At this point, I would like to give you the opportunity to revise vour factor list if you choose and also revise your importance ratings if necessary. Your factor list can be revised by adding new factors, modifying existing factors or changing your importance ratings.
Computer Instructions
Be sure that vour bucket is tipped over. If not, double click on your bucket to Open your Add Idea screen.
1 )Double click directly on the screen on the typed words of your first factor. This will open the comment screen and will display the factor at the top, plus your importance rating of that factor.
2) To enter a revision, type the revised edition of this factor in the dialogue box and also enter a new rating if you are not satisfied with the previous rating.
3) Click on SUBMIT button
4) Click on NEXT button to bring up your next factor and importance rating. Revise asneeded.
5) Click on CLOSE button when your factor revisions are completed.
Upon completion of this task,please turn the page

139
CONSENSUS BEST SOLUTION
Please read alt instructions on this page. Once all instructions have been read, please followingthe computer instructions step by step in order to carry out the instructions
The final problem solving task for this group is to arrive at an agreement regarding the best solution to this problem. All three member of the group must agree to the solution to Clara’s problem. This consensus can be reached through an exchange of information regarding the solution with the other members of your team.
Computer instructions
This information can be exchanged by accessing your team members solution and making comments regarding this solution directed on their screen from your terminal. As you will recall, you can access their information by double clicking on their bucket. You can enter information on this screen in exactly the same manner that you entered information on your own ideas. This process will begin with your final revision of your own solution to Clara’s problem.
1) Double click on the final factor to show your solution. Revise your solution by typing in your revised version into the dialogue box. Click on the submit button in order to make it available to the other group members.
2) Double click on the buckets of your group members to review their revised solutions. Enter comments regarding how well you agree with the others by typing comments in the their dialogue boxes from your terminal.
In this way, they will see your comments regarding their solutions and they can access your solution and give you feedback as well.
3) Continue this process of commenting to each other until you indicate your agreement with a solution and convey that agreement to the other members of your group through your type written messages.
4) Click on CLOSE button to return you to the original screen.
Upon completion of this task,please turn the page.....

140
Appendix I Quality Rating Scales

141
Quality Rating Scales
Appropriateness
An appropriate solution is one that is realistic, practical, feasible, and socially appropriate.
1. Solution highly inappropriate2.3.4.5. Solution highly appropriate
Originality
The degree to which the solution is not structured by the problem presented and goes beyond it. The degree of novelty and uniqueness of the solution.
1. Very common response. Solution completely structured by problem aspresented.
2. Solution less common but very structured by problem as presented.3. Solution somewhat unique but very structured by problem as presented.4. Solution relatively common but not structured by problem as presented.5. Solution somewhat novel and unique and not structured by problem as
presented.6. Solution novel and unique, and not structured by problem as presented.
Resolving Power
Each problem presents an underlying conflict, which you will have before you. Remember to focus on the underlying conflict and not specific goals/objectives.
1. Solution doesn’t do a very good job addressing any aspects/facets of theproblem.
2. Solution addresses one aspect/facet of the problem moderately well.3. Solution effectively addresses one aspect/facet of the problem.4. Solution attempts to address the conflicting aspects/facets of the problem.5. Solution resolves the conflicting aspects/facets of the problem moderately well.6. Solution does a very good job resolving the conflicting aspects/facets of the
problem.