Embed Size (px)
Citation preview

Computer Tool for Comparison of Classical and Non-Conventional Lightning Protection
Designs for Electric Substations
by
Vinit Marathe
A Thesis Presented in Partial Fulfillment of the Requirements for the Degree
Master of Science
Approved December 2015 by the Graduate Supervisory Committee:
George Karady, Chair
Raja Ayyanar Keith Holbert
ARIZONA STATE UNIVERSITY
May 2016

i
ABSTRACT
Electric substation physical plans are developed with consideration given to lightning pro-
tection. To develop these plans utility design engineers use various methods. This thesis
focuses on developing a computer program for two methods/models for substation shield-
ing against direct lightning strokes. The first method is being used currently in the industry
to protect the substation structures. The second model is a new and more physics based
approach towards lightning phenomenon. Both the methods consider only direct lightning
strikes that can hit the substation equipment. Hence, the travelling waves, indirect strokes
or over-voltage arriving at the substation equipment are not considered.
The Electro-Geometric method (EGM) based Rolling Sphere Method (RSM) is used to
develop first part of the program. The aim of the program is to design the protection system
for the substation equipment quickly and error free. The protection system uses lightning
masts and/or shield wires to protect the station equipment. These are grounded solidly with
low impedance to earth. The MATLAB based program gives a two dimensional visual
representation of the zone of protection and therefore helps utility engineers to position
shielding system. As this program is converted further into an executable file, it can be
used on any computer to produce the results without need of any other software.
The second part of the thesis focuses on developing the MATLAB code for protection of
substation equipment using the Rizk model which is not used as of now for shielding sys-
tem design in industry. Using more physics based model, simulation of downward light-
ning leader and connecting upward leader is shown.
Finally both the methods are compared. This includes consideration of a 220 kV substation
layout arrangement. The equipment are protected using shielding masts and the comparison

ii
is made in terms of number of the protective equipment needed. It is found that the classical
rolling sphere model gives more conservative results than the physics based model. Hence
the results shows that it is possible to use present methods and still protect the equipment
sufficiently.

iii
Dedicated to my Parents

iv
ACKNOWLEDGMENTS
Towards the end of a very fruitful journey as Master of Science graduate from
Electrical Engineering department at Arizona State University there are few people to
whom I would like to extend my sincere gratitude. First and foremost, I would like to ex-
press the deepest appreciation to my advisor and chair Dr. George Karady, who guided me
through each and every step of my research. I would also like to thank my committee mem-
bers, Dr. Raja Ayyanar and Dr. Keith Holbert, for their time and valuable feedback.
In addition, I would like to extend my gratitude to Dr. Snehal Dalal, Tom LaRose
and Dave Kelly for providing their practical and technical expertise in my research. I would
like to thank SRP for providing financial support for this work. It was really wonderful
experience working with them.
Lastly, I would like to thank my family, friends and colleagues at Arizona State
University for believing in my dreams and providing unconditional support and help.

v
TABLE OF CONTENTS
Page
LIST OF TABLES ............................................................................................................ vii
LIST OF FIGURES ......................................................................................................... viii
CHAPTER
1. INTRODUCTION .......................................................................................................... 1
2. LITERATURE REVIEW ............................................................................................. 10
3. ROLLING SPHERE METHOD COMPUTER PROGRAM ....................................... 26

vi
4. RIZK LEADER INCEPTION AND PROPAGATION MODEL IN MATLAB ........ 37
5. COMPARISON OF TWO METHODS USING SUBSTATION LAYOUT ............... 47
6. CONCLUSION AND FUTURE WORK ..................................................................... 59
REFERENCES ................................................................................................................. 62
APPENDIX
A. MATLAB CODE FOR ROLLING SPHERE METHOD ...................................... 65
B. MATLAB CODE FOR RIZK MODEL ................................................................. 75

vii
LIST OF TABLES
Table Page
I: Surge Impedance Verification ........................................................................... 33

viii
LIST OF FIGURES
Figure Page
1. Charge Distribution in Cloud and Ground during Lightning .................................. 2
2. AIEE Lightning Stroke Current Distribution .......................................................... 4
3. IEEE and CIGRE Lightning Stroke Current Distribution ..................................... 5
4. Vaisala National Lightning Detection Network Ground Flash Density Map-USA
................................................................................................................................. 6
5. V-I Characteristics of Typical MO Arrestors in a Solidly Eatherd 420 kV System
............................................................................................................................... 15
6. Protection Angle Method with α as Protective Angle .......................................... 17
7. Empirical Curves for Single Mast Protecting One Object ................................... 18
8. Difference between Rolling Sphere and Protection Angle Method ..................... 19
9. Calculation of Protected Zone by Rolling Sphere Method .................................. 26
10. Calculation of Strike Distance ............................................................................. 29
11. Coordinate System for the Program ..................................................................... 30
12. Executable File Output ........................................................................................ 32
13. Adding New 69/230 kV Station Transformer ...................................................... 33
14. Visualization of Existing Shielding System ........................................................ 34
15. Repositioning the Shield Wires for Protection .................................................... 35
16. Visualization after Repositioning Shielding System with Section at y = 202 feet
............................................................................................................................... 36
17. Visualization after Repositioning Shielding System with Section at y = 222 feet
............................................................................................................................... 36

ix
Figure Page
18. Variation of Charge Density at Ground versus Current in Downward Leader ..... 39
19. Effect of Height of Mast/Shield Wire on Upward Leader Inception Voltage ..... 41
20. Variation of Height of Inception with Stroke Current Magnitude ........................ 42
21. Single Mast with Upward and Downward Leader - Successful Strike ................ 44
22. Unsuccessful Interception of Lightning Strike .................................................... 45
23. Successful Interception of Stroke by One of the Mast – Two Mast Case ........... 45
24. 220 kV Substation Layout Top View ................................................................... 47
25. Protection for Bus 1 using Two Masts on Both Sides .......................................... 48
26. Cross Section for Placement of New Mast Location ........................................... 49
27. Protection Offered by New and Old Mast to Diagonal Section of Bus ................ 49
28. Final Position of Lightning Masts for Bus 1 Protection ...................................... 50
29. Lightning Mast Positions after Bus 2 Protection Design ...................................... 51
30. Addition of New Mast to Protect Bus 3 ................................................................ 51
31. Verification for Correct Positioning of New Mast for Bus 3 ................................ 52
32. Cross Section for Placement of New Mast to Protect Bus 3................................. 52
33. Verification of Correct Positioning of New Mast Location.................................. 53
34. Final Positioning of Masts to Protect all Three Buses in Substation ................... 53
35. Protection of Bus 1 Keeping Shielding System same as RSM ............................ 54
36. Repositioning of Masts According to Rizk model for Bus 1 ................................ 55
37. Placement of Mast after Positioning Masts for Bus 1 ........................................... 56
38. Shielding Mast Positions after Bus 2 Protection................................................... 56

x
Figure Page
39. Output of the Program to Validate Correct Shielding Position ........................... 57
40. Final Placement of Masts to Protect all Three Buses using Rizk Model Program 58

1
CHAPTER 1
INTRODUCTION
Lightning – Overview
1.1.1. Phenomenon
Lightning is a conducting channel of air plasma. The lightning is caused due to electrostatic
charges accumulated in clouds during thunderstorms. There are different types of lightning
based on where the strike takes place [1]. The most important of all, as far as electric sys-
tems are considered is cloud to ground discharges. As the name suggests the discharge
starts as a movement of charges from the cloud towards ground.
The phenomenon of generation and propagation of lightning during a thunderstorm event
is discussed below. Strong winds moving in upward direction carries water droplets upward
where they are cooled between temperatures of -10 to -20 degree Celsius. The collision of
the super cooled water droplets with ice crystals forms a soft ice-water mixture. The colli-
sions result in positive charge on ice crystals and a negative charge on soft ice-water mix-
ture. The ice crystals are less heavy and therefore carried on the top portion of the cloud
whereas the soft ice water mixture being heavier stays at the bottom of the cloud. This
causes a charge separation within the cloud with positive charge at top of the cloud and
negative at the base of the cloud. The negative charge at the bottom of the cloud produces
a positive charge on the earth ground beneath it. Due to the separation of the charge within
the cloud and between cloud base and earth, electric field is generated. Figure 1 explains
the charge accumulation and electric field generation process in clouds and earth during
thunderstorm event.

2
Figure 1 Charge Distribution in Cloud and Ground during Lightning [2]
Since we are concerned with lightning strikes to objects and structures on the surface of
the earth and nearly 85-95% of all ground strikes are negative cloud to ground lightning
[3], for the purpose of this discussion only negative cloud-to-ground lightning is described.
As the charge builds up in the cloud and on the earth due to cloud, a point is reached where
strength of electric field is sufficient to cause air breakdown which has breakdown strength
of approximately 30 kV/centimeter. This field generates electron avalanche which joined
together forms streamer. When tip of the leader exceeds thermal ionization threshold it
propagates with high speed. The streamer propagates as its head is charges continuously
seeking least resistance path. Streamers moves 30-100 meters and stops and some success-
ful streamers move towards earth in series of steps. Due to this structures on the ground
produce upward streamers. When this two discharges are joined together, an ionized path
is formed which leads to a high magnitude of current from earth to the cloud. This is the

3
current that causes damage to the structures. As this current superheats the air to plasma
generating a shock wave of thunder.
1.1.2. Important Lightning Parameters
1. Electrical Fields Generated by Thunderclouds
The thunderclouds generate electric field and they are an important factor to consider in
following ways:
Electric field causes sharp, grounded tips and pointed leaves of vegetation to go
into corona, which generates space charge.
The electric fields generated by thunderclouds at ground level are responsible for
the initiation of upward flashes.
The electric fields generated by thunderclouds can be used in issuing warnings on
the threat of lightning strikes.
2. Distribution of Magnitudes of Current in Lightning
The first stroke of the flash normally contains the highest crest current. An AIEE working
group published the crest current distribution [4] as given in Figure 2. This curve includes
both positive and negative flashes. The curve is approximated by a lognormal distribution
with 15 kA as median current and standard deviation of 0.98.
Later on Anderson analyzed the crest current and gave an alternate distribution with median
current of 46.5 kA. It had log standard deviation of 0.71for currents above median current
and 0.41 for currents below median current.
In the recent CIGRE working group report [5] it was shown that median value of current
is 34 kA with log standard deviation of 0.74. The minimum crest current was 3 kA and
maximum of 100 kA.

4
Figure 2 AIEE Lightning Stroke Current Distibution [4]
IEEE working group uses distribution as given by Popolansky and Anderson with 31 kA
as the median current. The probability function is given by,
P I1
1 I31
. 1.1
Here, P(I) is the probability that the current in the lightning will be greater than I, where I
is in kA. This IEEE curve and the CIGRE curve agree with each other except for some
discrepancy at end of the distribution. Both the curves are shown in Figure 3.

5
Figure 3 IEEE and CIGRE Lightning Stroke Current Distribution [5]
3. Lightning Incidence
The number of flashes that could end up in hitting transmission line or substation is given
by lightning incidence. The quantity known as ground flash density (GFD) is the basic
measure of the lightning incidences on the structure. It is denoted generally as N with
units of flashes/km -year. The best method of this is direct measurement of the lightning
activity. As it is difficult to measure all the lightning flashes accurately, an empirical for-
mula is given as,
N kT 1.2
Where, T Number of thunderstorm days per year also known as keraunic level. The
values of k and α varies according the region concerned. For example, Sweden uses k =
0.0046 with α 2. Whereas South Africa which has more number of lightning incidents

6
used k = 0.04 and 1.25. CIGRE has also suggested to use number of thunderstorm
hours instead of days which some researchers believe provides better estimate of GFD.
Vaisala's U.S. National Lightning Detection Network (NLDN) is the most scientifically
accurate and reliable lightning information system, monitoring total lightning activity
across the continental United States, 24 hours a day, and 365 days a year. Corresponding
GFD graph is shown in Figure 4.
Figure 4 Vaisala National Lightning Detection Network Flash Density Map –
USA[6]
More recently CIGRE has used flash counters which has range of up to 300 to 400 km to
measure ground flash density.
Substation and Lightning
Nearly 11.3% of the blackouts in USA are due to lightning related events [7]. Due to in-
crease in demand of electricity, reliable operation of the electric system is necessary. Sub-
stations are the point of connections that help direct flow of electricity. Many transmission

7
lines are connected and substation equipment failure will result in shut down of some or
whole part of substation. Lightning protection of substation equipment is crucial in electric
utilities since the lightning strike can cause transformer and equipment damage and there-
fore longtime substation outages. In many cases if the lightning hits the transformer, the
oil catches fire which can lead to other failures.
There are two types of substation arrangements, Air insulated substation (AIS) and Gas
insulated substations (GIS). Out of these AIS being air insulated are prone to natural factors
and weather conditions. The lightning being the most hazardous. Due to electric supply
reliability and expensive equipment, they must be protected from such adverse conditions.
It costs a lot of money, time to repair or replace the damaged equipment. Hence utilities
protect and invest a lot of money in the area of protection. For example protecting trans-
formers or substations from lightning can cost anywhere from $20,000 to $150,000 and
more, depending on the size and intricacies of the facility. Some large facilities whose
equipment is valued at $7 to $10 Million have spent $150,000 and up to protect their in-
stallations [8]. The direct stroke protection to substation is provided through mast or static
shield wires. Both are grounded solidly and placed physically above the equipment. This
is to make sure that the lightning strikes first such protection system and the energy is
carried safely to the ground without any equipment damage. The placing of substation is
done by methods as described by standards. These standards are IEEE 998-2012, NFPA
780 and IEC 62305. Such placement of protection system is done during design phase of
substation plans [9].

8
Objective and Scope of Research
There are two objectives for the thesis. First is to develop two computer programs that can
calculate zone of protection against direct lightning to the substations for two different
methods. The first method is rolling sphere method and second is the Rizk model method.
The other objective is to determine the number of protective masts needed to protect same
area of the substation. The comparison will help to distinguish any differences between the
conventional method and more physics based approach. In the end a conclusion can be
drawn if it is really needed to change the shielding plans according to the new method or
current plans are sufficient to protect equipment against direct lightning strike.
Thesis Outline
Chapter 1 provides an overview of process of lightning generation and propagation. The
important lightning parameters are discussed which are of engineering interest. The rest of
the thesis is organized as follows.
Chapter 2 presents a detailed literature review of types of transients generated due to light-
ning and corresponding protection methods. Also the existing methods for lightning pro-
tection are reviewed. This involves methods used by utilities for many years. Also more
recent models which are based on physics of lightning are discussed. Existing software
tools for lightning protection, their limitations and need of developing a simple program is
discussed. Finally, the need to determine if the existing methods are sufficient for lightning
protection of substation is discussed.
Chapter 3 presents development of MATLAB program for one of the conventional meth-
ods that is being used by the utilities namely rolling sphere method. A test case for addition
of a substation transformer is shown.

9
Chapter 4 presents MATLAB program development for the Rizk model. Simulation of
negative downward leader and connecting upward positive leader is described. Criterion
for final jump and inception of upward leader from ground object is discussed. Also crite-
rion for shielding failure is presented.
In chapter 5 a standard layout of 220 kV substation is taken. The calculations for number
of static masts required to protect substation are performed. Both the methods are applied
and results are presented.
Chapter 6 draws a conclusion based on the results of the program and presents future work.
Appendix A shows detailed and commented MATLAB code for the Rolling Sphere
Method (RSM). Appendix B shows detailed MATLAB code for Rizk model with com-
menting.

10
CHAPTER 2
LITERATURE REVIEW
Transients Generated by Lightning - Consideration for Substations
When a lightning strike hits any object or its surroundings, it generates transient voltage
and current pulses. Following section presents important distinction amongst these and
which of it is considered as a part of this thesis. The effects of cloud to ground discharges
can be broadly grouped into two categories, namely: (1) indirect strokes which are
known as induced overvoltage and (2) direct strokes. Following sections describes them in
more detail.
2.1.1. Indirect Strokes – Induced Overvoltage
Even if a lightning strikes near an object, tower, phase conductor it can be a cause of over-
voltage. Such surges are produced by induction. These arise in two different ways, one by
electrostatic induction and other by electromagnetic induction. The return stroke of the
lightning discharge is responsible factor for the induced voltages. Calculation of such in-
duced stroke are done in two parts [10]:
i. The return stroke model with its associated electric field effects. This is a model of
return stroke current in time and space. The return stroke is assumed vertical
ii. The voltage induced on phase resulting from the interaction of above model. For
calculating induced voltages, coupling models are used. The Rusck’s model is used
for calculating induced voltages flashover rate.
The distance within which a cloud-to-ground lightning discharge can cause an induced
voltage flashover is generally within 200 meters of the stroke. The Rusck’s formula is given
by [11], for calculation of induced voltage is as follows,

11
VZ I hy
1v
√2v 1 12
vv
kV 2.1
Where, Z 30ohms, I is the lightning peak current in kA, h is the average height of the
power line over ground, y is the distance between line and the lightning strike in meters, v
is return stroke velocity and v is speed of light in free space in m/sec. Generally assumed
value of v varies between 0.3 and 1.5 10 m/sec. The number of induced flashovers
decreases as a function of BIL. Also major factor while considering induced overvoltage
is steepness of the pulse. Such overvoltage can cause phase-to-ground or phase-phase flash-
over.
Therefore static overhead shielding system is useless in these kind of strokes. This effect
of induced overvoltage is prominent in distribution lines where the insulation level is low
and where overhead ground wires are normally not employed. Also since, low and medium
voltage distribution networks have heights less than the surrounding environment, induced
overvoltage is of major concern. Therefore for substation design of protection, these can
be eliminated as far as use of static shielding system is considered.
2.1.2. Direct Stroke
Another effect of lightning is due to direct lightning stroke where the discharge path, that
is, the path of the current is directly from cloud to the object struck. A lightning CG dis-
charge like this hitting power-line, building structure or even a person is far more danger-
ous than indirect stroke. It can result in significant physical damage and have associated
fire hazards. In the case of buildings it can result in cracks in the masonry work. In case of
power lines and substation equipment, it can cause flashovers and it is fatal if it hits a

12
person. The injected voltages and currents associated with direct strokes are much higher
compared to indirect strokes. As in this thesis we are concerned about power system, the
focus is on power lines and substation equipment and not on the personnel safety.
Most of the times the direct stroke terminate on the overhead ground wire or onto the struc-
ture that holds power conductor, like a tower. As both of these are grounded the surge
travels into the ground but generates potential rise of the tower. The amount of overvoltage
generated by the stroke is product of surge current and the impedance it encounters till
perfect ground. For example a 30 kA strike current with equivalent tower resistance and
footing resistance of 200 Ω can generate voltage of the magnitude of 6 million volts. This
back flashover phenomenon is another effect of lightning caused overvoltage. But as sub-
station ground grid resistance is very low, nearly equal to 1-2 Ω, compared to tower footing
resistance of the transmission line and therefore this is not considered while designing di-
rect stroke protection of substations.
Another important aspect of lightning generated direct stroke is travelling waves generated
on nearby transmission lines travelling till the substation. When a lightning strikes a trans-
mission lines that are connected to the substation, a travelling wave of voltage and current
is generated. This wave travels towards the substation and may cause a considerable dam-
age if adequate protection is not provided. As the wave travels along the line, the wavefront
above the corona inception voltage is reduced in magnitude by corona loss. Skin effect on
line conductors also causes further attenuation due to high frequency nature of the surge.
Therefore it is usual to consider lightning strikes that are close in (approximately 3 km)
when assessing the surge arrestor installation requirements. Therefore in this cases too,
shielding wires are ineffective and not used.

13
Lightning Protection Practices for Substations
After careful review of transients generated by lightning and its dangerous effects of to the
substation, methods of preventing damages from such overvoltage are discussed for sub-
station.
2.2.1. Shield wires and masts protection
This type of protection scheme is a focus of this thesis, along with it some other protection
methods are mentioned in following sections. Shield wires and masts installation are two
methods are commonly employed in a substation. Overhead ground wire are bonded to the
primary earthing system. They are sized for maximum lightning stroke current in the area
and maximum fault current level. Preference is to use ACSR for overhead earth wires. In
most of the substations, the overhead earth wires do not cross substation equipment beneath
it [12] since an anchor failure which holds the shield wire can cause faults in the equipment.
Sometimes lightning mast are the preferred method of lightning mitigation in smaller sta-
tions over overhead earth wires because they provide a greater security of supply and better
maintenance accessibility as well as the ability to minimize the overall visual profile of the
substation. The lightning masts are positioned in the substation in such a way that they do
not obstruct electrical clearances and maintenance access to other equipment within the
switchyard. These masts are connected directly to the substation’s earth grid. Ground grids
are installed at a depth such that the currents flowing in from the shield wire are easily
dissipated into the earth. Ground rods at strategic locations are drilled to a depth where the
soil resistivity is low. Connecting the ground grid to the rods so that the grid can access the
low resistivity soil. The ground grid and depth of the ground rods are governed by standards

14
and utility practices. At locations where the soil resistivity is high, ground wells are ac-
cessed.
2.2.2. Surge arrestors protection
Surge arresters are placed in substations, transmission or distribution lines to provide the
protection to the equipment connected against voltage surges. Arrestors appear as a very
high impedance at normal operating voltages and a very low impedance on the arrival of a
high voltage surge resulting from lightning or switching activity. Every equipment has a
BIL and BSL level. Arrestors will make sure that incoming surge is either clamped below
this value or grounded without reaching and damaging the equipment for which it is in-
tended to protect. Metal-Oxide Surge Arrester (MOSA), with resistors made of zinc oxide
(ZnO) blocks, or gapped type with resistors made of Silicon-Carbide (SiC) are used. These
arresters have extremely non-linear voltage-current or V-I characteristic, low power losses.
Insulation coordination studies are conducted in order to decide the placement and rating
of such arresters. For switching over voltages studies, the surge arresters can be represented
by their nonlinear V-I characteristic as shown in Figure 5 for Siemens surge arrestor [13].
Lightning arresters are rated by the peak current they can withstand, the amount of energy
they can absorb, and the breakover voltage that they require to begin conduction.

15
Figure 5 V-I characteristics of Typical MO Arrestors in a Solidly Eatherd 420 kV
System [13]
2.2.3. Communication and Electronics Equipment Protection
Even if substation is grounded properly, communication equipment are victim of the
Ground potential rise (GPR) [14]. Communication equipment are grounded at some point
in the substation. When a lightning strikes and potential of this ground changes and raises
up. If the equipment is grounded at same points, this potential rise is same and do no affect
operation of communication equipment. But wire-line telecommunications are connected
through equipment bonded to the substation’s ground grid and also terminated at another
end by copper pair. Therefore during such events of potential rise, current will flow through
the equipment and wire-line. To resolve this issue, an isolator device is placed. It functions
such a way that it will allow the communication signals to pass through but not fault cur-
rents through the phone lines The standards used for designing this are IEEE Standard 487-

16
2000-Guide for the protection of wire-line communication facilities serving electric power
stations and ANSI/IEEE Standard 80-2000-Guide for safety in AC substation grounding.
Classical Models for Lightning Protection of Substations
Impact of a lightning strike varies depending upon if it is an indirect stroke or a direct one.
The type of protection to be offered depends upon the equipment to be protected and type
of stroke. As mentioned in previous sections, the direct stroke protection of substation
equipment is based on protection offered by shield wires and masts, the methods and mod-
els that have been used by industry as of now to design these systems are discussed in detail
in following section.
2.3.1. Fixed Angle Method
The first concept for lightning protection assumed that there is a protected zone into which
neither the lightning channel nor its effect can penetrate to cause damage. According to
this concept structure inside this zone is protected against direct lightning strikes. This an-
gle is at the top of air terminal. The border surface can be produced by moving a straight
line which has a constant angle to the vertical. The motion is, for example, rotation around
to the vertical rod or parallel translation long a horizontal conductor. To apply the concept
for shielding wires in substation, a cross section can be taken at desired location. Protective
angle ranging from 30 to 50 degrees can be used for designing the protection system. As it
can be seen from the Figure 6, lesser the angle, lesser is the protective angle provided by
the lightning rod. Therefore more number of lightning masts will be required for low an-
gles. The most important conflict of the fixed angle concept is with observed lightning
strikes which penetrated possible protection zone. Typical cases are the lightning strikes
on the sides of thin high objects.

17
Figure 6 Protection Angle Method with α as Protective Angle [15]
2.3.2. The Mesh Method
Air terminals are positioned around the edge of the roof and on high points. A network of
conductors follows the external perimeter of the roof. This network is completed with
transverse elements. The mesh size is between 5 and 20 meters depending upon the effec-
tiveness required. The top of the down conductors fitted to the walls are connected to the
roof mesh, and the bottom to dedicated earthing systems. The distance between two down
conductors is between 10 and 25 meters depending upon level of protection required.
The majority of lightning current is conducted and dissipated by the conductors and earth-
ing systems closest to the point of impact of the lightning strike.
2.3.3. The Empirical Curve Method
The empirical curves are derived experimentally and then used as a ‘scaled’ model. The
first step is to determine what equipment needs to be protected. After this, the exposure
level has to be selected. This can be from 0.1%, 1% etc. Figure 7 shows protection offered
by a single lightning mast to object. The height of mast is h meters and that of protected

18
object is d meters. The distance between these two is x. There are six curves showing var-
ious exposure levels from 0.1 to 15%.
Figure 7 Empirical Curves for Single Mast Protecting One Object [16]
Some of the assumption of this method are mentioned as follows. All lightning strikes are
assumed to propagate vertically downward and earth resistivity is considered very low. The
method is independent of voltage level and only depends on the geometric relationship
between the shield or mast, the equipment, and the ground. It does not take into account
factors such as surge impedance, insulation level. Also stroke current magnitude, and the
probability of lightning. Although not much numerically difficult it has some limitations.
Since it ignores almost all important factors as mentioned above its application is doubtful.
The modified curves are not user friendly and time consuming for design purposes. It is
seen by experience that this method is not recommended for shielding design for EHV
substations.

19
2.3.4. The Electro-Geometric Model
During early 1950’s transmission lines were protected by protection angle and empirical
methods. It was observed that outage rate was much higher than expected. Therefore, E. R.
Whitehead developed EGM in 1963 after an extensive research. Later in 1976, Mousa de-
veloped a program called Subshield to use this method. In 1977 Ralph H. Lee developed
rolling sphere method for shielding buildings and industrial plants. Which was then ex-
tended by J.T. Orrell [17] for use in substation design. It uses stroke current, surge imped-
ance and BIL level of the equipment to calculate zone of lightning protection for substation.
Figure 8 gives visual difference between protection angle, mesh method and rolling sphere
method.
Figure 8 Difference between Rolling Sphere and Protection Angle Method [18]

20
Physics Based Models
The final attachment of lightning strike to structures is dependent on downward and up-
ward moving leader. These models try to explain how this mechanism takes place and try
to simulate the leaders to find location of final strike.
2.4.1. Model by Dellera and Garbagnati
The model by Dellera and Garbagnati takes into account the main physical mechanisms
defined from studies of discharges in long air gaps as well as studies of lightning channels
[19]. It assumes that charge per unit length along the leader channel is equal except that
lower few meters have charge of 100µCoulombs/meter. The electric field so generated by
the leader is calculated based on this charge relationship. It is assumed that downward
leader follows electric field lines. Therefore The direction of propagation of the leaders,
both the down-coming stepped leader and the upward moving connecting leader, is deter-
mined by the direction of the maximum electric field along an equipotential line at a dis-
tance from the leader tip equal to the streamer extension. The upward leader speed is as-
sumed to be a function of the mean voltage gradient between the upward and descending
leader tips at any instant.
2.4.2. Leader progression model of Erikson
Eriksson proposed the improved EGM which took into account the dependence of striking
distance on the structure height in addition to the known dependence on peak stroke current
[20]. It also considered field intensification factors (FIF) given by Ki. These factors define
degree of intensification of the electric field by the structure on the ground. The extension
of the Eriksson EGM into a practical, three-dimensional air terminal placement method is
referred as the collection volume method (CVM). Ki is depends upon height and width and

21
radius of curvature of the structure. In the case of vertical masts FIF depends on the height
and tip radius of curvature. For horizontal shield wires, similar concepts are applied. For
elevated structures, the Ki’s are multiplied by a factor that depends on the structure dimen-
sions and the location of the air termination on the structure. Value of Ki in space is calcu-
lated by numerical techniques such as the finite element method (FEM). CVM requires
extensive electric field modeling in 3D to be carried out and greater weight is given to taller
air terminations. Along with this physical criteria for leader inception must be met. It en-
forces the important concept of competing features which says that all points are considered
capable of launching upward leaders and hence must be taken into account in the analysis.
2.4.3. Rizk leader progression model
The basis for this model is that an object struck by lightning is an active participant in the
attachment process. In this model, upward connecting positive leader and downward con-
necting negative leader are modelled [21]. First the movement of downward negative
leader in space is defined. Then for upward positive leader from ground structures, criterion
for inception and propagation are simulated. The final strike condition is checked to see if
the successful strike takes place or there is a shielding failure. This model is discussed and
applied in detail in chapter 4.
Software Currently Used for Lightning Protection
SESShield-3D [22] is a software package developed by safe engineering services and tech-
nologies. It can be used for lightning protection designs of complex 3D environments, in-
cluding substations, power plants, industrial plants and buildings. It uses rolling sphere
method and the Eriksson electro geometric model, the protection angle and the mesh

22
method. It allows any metallic structures to act as a shielding system. It performs its calcu-
lations by first generating a 3- dimensional surface corresponding to all possible positions
of the center of a rolling sphere for a specific radius, whose surface is in contact with a
vulnerable structure to be shielded. Next, the software generates a 3-dimensional surface
corresponding to all possible positions of the center of a similar sphere that is in contact
with the shielding structures. A 3D hidden surface algorithm is then used to determine
which surfaces corresponding to contact with a vulnerable structure protrude outside sur-
faces generated by shielding structures. These protruding surfaces represent the locations
where lightning strike can hit a vulnerable structure due to inadequate shielding. The
shielding structures, then are adjusted and positioned in such a way that the unprotected
surface is no longer visible. No utility would spend money on a software that only does
dedicated lightning protection calculations. This software is more valuable for complex
structures in 3D such as buildings, bridges where geometry is unpredictable. In case of the
substations, the geometry of the equipment and corresponding shielding system is not com-
plex. For example, for protecting a transformer or a bus bar, there will be always wires
parallel to the equipment and will never cross equipment as breaking of the shield wire
support can cause it to fall over energized equipment. Whereas for other complex engi-
neering structures the placement of shielding is not fixed.
Another software provided for lightning protection is by ABB known as Furse StrikeRisk.
It is used to calculate risk assessments of a facility against lightning as it automates the
complex calculations required by BS EN 62305 [23]. The designer can carry out and view
multiple risk assessments under the banner of a single project, build new projects from

23
previously saved cases and create templates for standard cases. A project case can be cre-
ated and used for calculations. Each case is a separate risk assessment in its own right. Each
Case is used to carry out a series of calculations using relevant formulae to determine the
actual risk R for the structure under review. The designer should decide the type of losses
relevant to the structure, enter a number of dimensions and various weighting factors rela-
tive to the structure, along with various assigned values from the appropriate tables in an-
nexes. Then risk R is calculated and then compared to its corresponding value of RT. If the
result shows R <= RT then the structure is adequately protected for a particular type of
loss. If the result shows R > RT then the structure is not adequately protected for the type
of loss, therefore protection measures need to be applied. The above steps can be set within
each case and by a series of trial and error calculations sufficient protection measures are
taken until the risk R is reduced below that of RT.
Primtech is another software that features a powerful 3D lightning protection calculation
implementing conventional lightning protection calculation methods [24]. Using lightning
protection rods and wires as lightning arresters, it visually illustrates the required results in
form of the lightning protection volumes and areas Primtech supports lightning calcula-
tions according to the DIN VDE 0101 Standard and the rolling-sphere method.
Conclusion
The conventional models for the lightning protection of substation are based on different
concepts, namely the protective angle, empirical curves and the electro-geometrical
method. Most of these models, especially protective angle and empirical curves neglect the
physics behind the lightning inception and propagation. As it can be seen they are com-

24
pletely independent of stroke current magnitude, BIL levels of the equipment. These as-
sumptions are oversimplifying and therefore application of such methods is limited. The
rolling sphere method on the other hand gives some explanation and engineering evaluation
towards lightning phenomenon and electrical parameters. However the advancement in the
lightning research during the last several decades has resulted in deeper and more physics
based understanding of the lightning attachment process. As explained in section 2.4, many
researchers have tried to explain inception and propagation of the lightning leaders with
emphasis on upward and downward leaders. Therefore today we have a possibility to sim-
ulate such phenomenon on a computer to determine the strike point onto the structure.
Looking at the limitations of lightning models currently used, it is an important factor to
determine if the current methods are really enough to protect the substation equipment
against direct stroke or do we have to switch to new models. Also such complex analysis
require software automation, this thesis attempts to focus on development of such computer
program.
As seen from section 2.5, there are many software that are commercially available for cal-
culation of lightning protection of substation and structures. Even though some of the soft-
ware are powerful 3D visualization tools, in many utilities only two dimensional cross sec-
tions are enough to determine the protection level. Also the drawing files of the utilities
can be in a different format which is a limiting factor considering costs/price of such com-
mercial software. In many utilities, they already have all most of their static shielding plans
developed while designing the substation layout. Whenever new equipment is to be in-
stalled at the substation, the adequacy of already present static wire system to protect this
equipment needs to be calculated. This include the addition of a transformer, reactor or bus

25
bar bay. Also, after a careful revision and literature review, it was found that there is no
commercial software currently available in the industry that simulates new physics based
models into a program. Therefore final aim would be to develop computer program and
see if there are any practical differences between the conventional method and new models.
Therefore the first objective of the proposed computer program is to develop a computer
tool for rolling sphere method that would provide quick results with high accuracy in such
a way that it is independent of any CAD software which can run on any computer. Also ‘to
the scale’ visual representation will be provided by the program rather than just numbers.
This would help the utility design engineer to position the shielding system faster. The
program will also be calculating lightning protection based on Rizk model, which is phys-
ical approach towards lightning. A comparison between these models considering actual
substation layout will determine if we need to switch to newer methods.

26
CHAPTER 3
ROLLING SPHERE METHOD COMPUTER PROGRAM
Explanation of Rolling Sphere Method and Formulae
Figure 9 shows a cross section of a static shielding system. Two poles are shown at height
H above the ground. These can be either lightning masts or points on a static shield wire
after taking a cross section. In a substation, it is possible to have unequal height of the
masts. D is the distance between two shielding structures. According to rolling sphere
method, an imaginary sphere of radius R is rolled over the substation structures. It is sup-
ported by masts, shield wires, fencing and all metallic grounded objects that can provide
shielding. Starting from the leftmost side in Figure 9, the sphere first touches the ground.
After encountering the mast of height H it rolls over and on top of it. Before it goes on the
other side and touches the ground, another mast of height H supports it. After that, similar
to the first mast it rolls over the second mast and onto the ground on the other side.
Figure 9 Calculation of Protected Zone by Rolling Sphere Method [3]
In Figure 9, all the area under the arcs generated by the sphere is considered as protected.
This implies that any equipment having dimensions under this area is protected from light-
ning strokes whereas any structure that protrudes out of the area of protection is vulnerable

27
to direct lightning stroke. In such a case, additional shielding is necessary. It can be noticed
from Figure 9, the distance between the two masts, D, dictates how much area of protection
in generated between the two poles. As they move closer, more area is protected. This
principle is used in positioning the shielding system, in order to protect the equipment. The
radius of sphere R is also known as the striking distance. According to the rolling sphere
method, this depends upon the magnitude of the return stroke current and is given as fol-
lows,
R 8 ∗ k ∗ I . (3.1)
Where, R is strike distance in meters, k equals 1 for wires and ground plane and equals 1.2
for mast. I is return stroke current magnitude in kilo amperes.
Since the stroke current in the lightning is not fixed, it is necessary to find the stroke current
magnitude for which protection is required. This current is known as ‘allowable stroke
current’ and it is calculated by following formula
I 1.1 BIL
Z2
2.2 BILZ
kA 3.2
Where, BIL-Basic lightning impulse insulation level of equipment to be protected in kilo-
volts. Zs is surge impedance of the bus in ohms. The calculation of surge impedance is
done using equation (3.3).
As seen from (3.1), the striking distance is a function of stroke current and increases as the
current increases. If a shield wire protects the equipment for stroke current I1 then it will
shield for any current I2 > I1. Therefore, shielding will be effective against any current
higher than protected current. Stroke currents less than this value are permitted to enter
protected zone since the equipment can withstand stroke generated voltages below its BIL

28
and would not damage it. The probability that the current in lightning will be more than
the calculated allowable stroke current is given by equation (1.1). For example, if allowable
stroke current is 10 kA, then probability that a current less than this will be present in a
lightning strike is 5%.
Data Preparation for the Program- Entering Electrical Parameters
The substation has different voltage levels with transformers at the voltage interface.
Therefore, equipment BIL on each voltage side is different. As seen from (3.1) and (3.2),
every BIL has a corresponding allowable stroke current and therefore striking distance.
The surge impedance depends upon the height and radius of the bus. Therefore, user of the
program is required to enter BIL level, bus height and conductor radius. The surge imped-
ance (Zs) in ohms is given by:
Z 60 ln2hR
ln2hr
3.3
Where, h is average height of the conductor in meters. Rc is the corona radius of the con-
ductor in meters. r is metallic radius of the conductor or equivalent radius in case of bun-
dled conductors in meters. The corona increases the radius of the conductor. The corona
radius in (3.3) is calculated using (3.4), which is given below and should be solved itera-
tively.
R ln2hR
VE
0 3.4
Where, Vc is allowable insulator voltage for negative polarity surge having 6 microseconds
front in kilovolts (Vc is BIL for post insulators) and Eo is limiting corona gradient taken
29
equal to 1500 kV/m. The metallic radius of the bus, if bundled, is calculated by (3.5) and
substituted in (3.3).
r rg sr
3.5
Where, n- Number of sub-conductors in bundle. g equals 1 for bundles of 1, 2 and 3 sub
conductors and equals 1.12 for 4 bundle conductor. r is a conductor radius in meters and s
is the distance between conductors in meters. Figure 10 represents the flowchart of entering
the data into the program developed for rolling sphere method and finding strike distance.
Figure 10 Calculation of Strike Distance
Defining Axis Orientation for the Program
As RSM is a geometry based method, dimensions of the shielding system and of protected
equipment are required. The coordinate system is established to enter geometrical data.
Figure 11 shows a top view of a shielding system and equipment in a typical substation.
Finding strike distance R
Enter height of bus h and radius
of bus r
Surge impedance Zs is calculated
Enter equipment
Allowable stroke current Is and Striking Distance R is calcu-

30
Figure 11 Coordinate System for the Program
In Figure 11, OP is a shield wire denoted by dotted line. Similar to OP, there are two more
shield wires running parallel to this wire. They too are shown by dotted lines. Point ‘O’ is
considered as the origin for this coordinate system. This origin can be any point on which
a shielding wire rests. In this particular example, the origin is one of the poles of static wire
OP but can be taken either at Q or R. The Y axis runs parallel to the shielding system and
the X axis is perpendicular to it. The Z axis comes out of XY plane and is not visible in
this two dimensional view. Z axis represents height of the equipment or shield wire. Typi-
cal circuit breaker, disconnect switch and a bus bar are shown between shield wires. AB
represents the cross section taken at distance ‘S’ away along the Y axis. Similarly, different
vertical cross sections can be taken along the Y axis. Once the axes orientation is defined,
coordinates corresponding to the equipment and shielding wires can be entered.
Following section describes how to enter coordinates of the shielding system and equip-
ment. The static wire is supported at two ends by poles or dead end structure. The shield

31
wire can be resting on poles with either equal or unequal heights. Therefore, to define a
shield wire we need (x, y, z) coordinates of the topmost point on two poles. Here, z coor-
dinates is the height of the pole. A hanging wire supported at two ends with only its own
weight as the force acting on it, takes the shape of a catenary. Shield wires are approxi-
mated by single straight wire. Once the equation of the wire is known, only one co-ordinate
is enough to find the other two along the curve. When a cross section ‘S’ distance away on
y axis is defined, x and z coordinates can be known by substituting y = S in the equation.
The equipment is approximated by a rectangular parallelepiped. Only two opposite corner
coordinates are enough in three dimensional space to define a parallelepiped. Hence the
user is required to enter only (x, y, z) coordinates of the bottom corner and diagonally
opposite top corner. Z coordinate of bottom corner is always 0 since it lies on the ground
and that of top corner is height of the equipment. When cross section at ‘S’ is defined,
corresponding x and z coordinates can be found.
Data and Executable File
Data files are created from where the program reads the data. Equipment data, bus data and
shield wire data are the three files created that store coordinates of the respective elements
and electrical parameters. Since user already knows the position of the existing shielding
system, he can enter coordinates corresponding to shield wires. Also the placement of the
equipment is fixed since it is decided on factors like connection to other buses or ease of
installation. Therefore equipment coordinates are fixed and can be entered. The bus data
and BIL levels can be entered by knowing at which voltage level the equipment is operat-
ing. Once the user runs the program and finds that existing system is inadequate, reposi-
tioning can be done easily. The visual representation of the program gives exact location

32
where additional or repositioning of shielding is required. The repositioning is achieved by
changing the coordinates of the shield wire appropriately. Since it involves only minor
changes in the data file, user need not enter all other data again hence making calculations
faster.
The other goal of the program is to make it independent of any CAD tool used by the utility.
This is achieved by creating an executable file of the program. MATLAB compiler allows
to create an executable files that can run on any machine. Figure 12 shows the executable
program file output. The program finds the strike distance and waits for user to enter the
desired cross section. The specifications of the bus are the same as mentioned in Table I
for a 69 kV substation
Figure 12 Executable File Output
Result and Test Case
The program calculates the surge impedance of the bus using (3.3). To verify that calcu-
lated values are correct, they are verified with the values given in [25] and shown in Table
I.

33
Bus Names Height of Bus
(Feet)
BIL (kV)
Diameter of Bus
(Inches)
Surge imped-ance by IEEE 998 (Ohms)
Surge Impedance by Program
(Ohms)
69 kV Substation Bus A 14 350 4.5 300 308
230 kV Substation Bus B 39 900 5.5 336 335
500 kV Substation Bus C 55 1800 4.5 336 336
Table I : Surge Impedance Verification
Since the values match very closely, the program calculates them correctly and can be used
further for finding stroke current and strike distance.
Now a case for addition of a station transformer in parallel to existing transformer is pre-
sented to show usability of the program. Figure 13 shows addition of a transformer in a
substation. The proposed transformer is shown in dotted rectangle. The smaller rectangle
is the actual transformer whereas outer one is a degasifier unit.
Figure 13 Adding New 69/230 kV Station Transformer.

34
The rating of the transformer is 69/230 kV. The transformer has a height of 32 feet, 30 feet
of length and 20 feet width. The height of the transformer includes foundation, bushing
and phase connection height. The existing shielding system is shown by dotted lines. Wires
OP, QV, RT are three shield wires and are resting on their respective poles. Other structures
such as bus bars, breakers are also seen in the diagram. But we are only interested in shield-
ing system that protects the transformer and the transformer itself. We should now deter-
mine if these three wires are enough to protect a newly added transformer. The pole O is
chosen as the reference with (x, y) as (0, 0). Poles O, P, Q, R, V are at height of 60 feet.
Poles T and U are 55 feet tall and they are on 69 kV side of the transformer.
Once all the data is entered into the program, it finds out strike distance and plots out the
zone of protection, which is marked by circles in Figure 14 and equipment as rectangular
section. The three vertical masts are basically heights of the shield wires at cross section
specified. The cross section specified is 202 feet away from the origin where the trans-
former is placed. Since the transformer width is 20 feet, it ends at y=222 feet.
Figure 14 Visualization of Existing Shielding System.

35
Figure 14 shows a portion of the equipment protruding out of the sphere on the rightmost
side. Therefore shielding is inadequate and we must reposition static wire RT. Figure 15
shows repositioning of wire RT to the new wire, RU. With this, we must check if the trans-
former is protected by running the program again and changing the T coordinate of wire to
U coordinate in the data file. All the other parameters are same as in Figure 13.
Figure 15 Repositioning the Shield Wires for Protection
The program is run again and used to verify if the repositioning gives adequate lightning
protection zone. Two different sections are shown in Figure 16 and Figure 17, one at 202
feet away and another at 222 feet away respectively. These are the end coordinates of the
transformer. If these are protected then all cross sections in between are also protected

36
Figure 16 Visualization after Repositioning Shielding System with Section at y =
202 feet
Figure 17 Visualization after Repositioning Shielding System with Section at y = 222 feet
We can see from Figure 16 and Figure 17, the transformer is perfectly protected for both
the sections and no area of it protrudes out of the rolling sphere arcs. Hence, repositioning
is correct and there is no need to reiterate the steps.

37
CHAPTER 4
RIZK LEADER INCEPTION AND PROPAGATION MODEL IN MATLAB
The following section describes how Rizk model is simulated in MATLAB. This involves
simulation of downward negative leader as a vertical charge column in space, inception of
positive leader from the ground object and propagation of upward leader towards negative
leader. In the end successful meeting of these two leader will be described and simulated.
The program flow is described and various test cases are shown in order to explain program
visually.
Modeling Descending Downward Leader
The downward leader is modeled as a vertical negative charge column in space. As the
leader moves down towards earth, it carries this charge along with it. The charge center is
assumed to be at the base of the cloud from which leader originates. A finite charge is
supplied from this cloud base to the leader.
There are various models to define how exactly charge in the leader is distributed. For
modelling the leader in Rizk method, the linear charge decay is used to define charge dis-
tribution. The mathematical modelling in MATLAB goes as follows. The charge density
in the leader at ground level is assumed to be ρ coulomb/meter. This charge density de-
creases gradually and becomes zero as one moves from tip of the leader to base of the
cloud. This charge column is modeled by linear charge density column and therefore
charge density along the column with height ‘Z’ of the leader can be written mathemati-
cally as,
ρ z ρ 1ZH
Coloumbmeter
4.1

38
Both Z and Hcl are in meters. For a small segment of charge length, say dz, the charge
contained in it can be written as,
dq ρ z dz 4.2
Therefore total charge contained in the downward lightning column is given by integrating
whole column of the leader from ground level (that is z =0) till cloud base (z = H ),
TotalCharge ρ z dz 4.3
Substituting (4.1) in (4.3),
TotalCharge p 1ZH
dz 4.4
TotalCharge H ρ
2Coulombs 4.5
Once total charge is described in terms of ρ as in (4.5), it is important to know charge in
terms of stroke current. It is well known that the charge is related to stroke current in the
downward leader I. There are many empirical formulae that predict the total charge in the
descending downward leader. The empirical formula in [26] is used to describe total charge
in leader as follows,
Q 76 I . 10 Coulombs 4.6
In above equation I is in kA. Figure 18 shows variation of current in negative leader versus
charge density at ground level.

39
Figure 18 Variation of Charge Density at Ground versus Current in Downward
Leader
After assuming the charge distribution in the negative leader, it is important to describe
how the voltage at the tip of the leader is calculated. It is possible to calculate the potential
along the length of the leader. The total voltage or the voltage at the tip of the negative
leader is sum of the potential along the leader channel plus the voltage of the corona shell
at the tip of the leader. Therefore,
Voltage Voltagealongtheleaderchannel Voltage 4.7
Now, the voltage along the channel is defined by the voltage gradient of the leader. This
gradient is given to be 60 volts/cm as given in [27]. Therefore, total voltage depends on
length of the leader, which in turn depends the height at which cloud base is assumed. For
example for one kilometer of a leader will have total voltage along the leader channel of 6
megavolts. As the cloud base is assumed at 2.5km above the earth. Therefore total voltage
drop across the leader length is nearly 15 megavolts.

40
The voltage of the at corona tip of is calculated by knowledge of corona shell. The field at
outer surface of this shell is E = 30 kV/cm. The radius of this corona shell can be given by,
rQ
2πεEmeters 4.8
In this equation, Q is the charge density at ground level of the leader column.
Inception of Positive Leader from Structure
Once detailed modelling of the downward leader is done, following section presents
MATLAB coding for upward leader inception. As the negative leader travels downward it
carries charge and thereby generates surrounding electric field. Therefore, at some point
there is enough space potential around ground objects that a successful inception of the
upward positive leader takes place from the ground object. This is given for mast/slender
structure and wire/horizontal conductor as follows [28],
U _ _1556
1 3.89h
kV 4.9
U _ _2247
15.15 5.49 log a
h log 2ha
kV 4.10
In (4.9), h is the height of mast in meters and in (4.10) h is height of shield wire in meters
and ‘a’ is radius of the shield wire in meters. Figure 19 shows variation of inception voltage
for both mast and wires. Radius ‘a’ is taken to be 5 centimeters which is close to radius of
a shield wire.

41
Figure 19 Effect of Height of Mast/Shield Wire on Upward Leader Inception
Voltage
Once the critical inception voltage for each of the structure is known, the condition to reach
corresponding voltage is calculated by simulating the downward leader and its effect on
the structure as it approaches near the ground. The voltage due to any charge Q at some
distance away is given as follows,
Voltage 1
4πεTotalChargedistance
4.11
Consider a leader approaching ground structure at R distance away from the object and
height of the grounded object is h. As the downward leader moves towards ground, the
charge carried produces voltage on the ground object. By method of image of charge and
substituting (4.2) in (4.11) we get voltage at the tip of the mast due to this leader as,
V1
4περ z dz
z h R
ρ z dz
z h R 4.12

42
Substituting (4.1) in (4.10) we get,
Vρ4πε
1 xH
x h R
1 xH
x h R 4.13
Figure 20 shows variation of height of inception versus the current in downward leader. It
is assumed that mast is 50 feet tall with location (0, 0) and negative leader at (5, 20) in
coordinate axis.
Figure 20 Variation of Height of Inception with Stroke Current Magnitude
Propagation and Leader Potential of Positive Leader
The propagation of the positive leader is in such a way that it tries to meet the tip of the
negative leader. Once the positive leader inception takes place from the ground object, the
vector motion of the upward positive leader seeks tip of negative leader and the negative
leader maintains its position in x-y plane but reducing its z (vertical) coordinate.

43
As the upward leader moves its length increases till it either meets the downward leader or
is unsuccessful in the strike. The voltage at the tip of the leader as it moves is calculated
by empirical formula [29] by Rizk as,
U L ∗ E x ∗ E ∗ lnEE
E EE
e kV 4.14
Where, E and E are the initial and ultimate values of the leader gradient. It is assumed
that E 400kV/m andE 50kV/m . x is the product of velocity of the upward
leader and time step in meters. L is length of positive leader in meters.
The propagation of the upward leader is in such a way that its tip always seeks the down-
ward leader tip. In the program, it is assumed that both leaders move with a step of 2µsec-
onds during each iteration. Therefore for each iteration the downward leader moves 1.5
(leader velocity) * 2 (single iteration time step) = 3 centimeters down. Correspondingly
positive leader moves up in the space.
Validation of the Program Using a Test Case
Following section describes various test cases to show working and validity of the program.
Initially a single mast is considered with downward leader approaching ground. This case
shows successful interception of lightning strike by the mast. The downward leader is lo-
cated at location (5 meters, 5 meters). The mast is 50 feet tall and located at (0 meters, 0
meters). As the downward leader approaches ground, the upward leader is initiated when
tip of the downward leader is at 73.95 meters. The current magnitude is considered to be
15 kA. Figure 21 shows how a positive leader is incepted and seeks negative leader. It
shows a point in space when initiation of upward leader starts and when the leader potential

44
gradient reaches 500 kV/meter and the simulation stops. At this point negative leader is at
52.4 meters and positive leader is at 36.54 meters above the ground.
Figure 21 Single Mast With Upward and Downward Leader - Successful Strike
Now a case is considered where the mast is unable to intercept the lightning stroke. The
lightning mast is located at (0, 0) meters and the leader is travels down with location at (15,
15) meters. The leader current is now 5 kA. The inception takes place at 31.35 meters. It is
therefore clear that as lightning stroke goes far away from the mast or if the current in the
leader reduces, the mast is not able to intercept the current. In this case, by the time leader
gradient reaches 500 kV/meter, the negative leader is at 16.83 meters and positive leader
at 19.22 meters. That height of positive leader has already crossed that of negative leader
leading to shielding failure. Figure 22 clearly explains this case.

45
Figure 22 Unsuccessful Interception of Lightning Strike
Now two masts are considered, one located at (10, 10) and other at (-10, 10). One mast is
50 feet and other is 60 feet tall. The leader is assumed to carry 8 kA of current and located
at (0, 0) in space. Figure 23 explains this case.
Figure 23 Successful Interception of Stroke by One of the Mast – Two Mast Case

46
As the leader approaches ground the upward leader is incepted at different time and at
different height of the downward leader. Once upward leaders are initiated and start trav-
elling toward negative leader, the condition for final strike has to be checked. In this case
upward leader for 50 feet mast is unsuccessful in interception the negative leader since the
leader for 60 feet mast meets the final strike criteria prior in time.
Now, there can be a case where both the upward leaders fail to intercept negative leader
and this criteria is crucial in shielding failure. Therefore, for a case where both the upward
leader reach the same height as the downward leader but still do not reach gradient of
500 kV/meter, the shielding failure occurs. In this case designer must change the coordi-
nates of the static shielding mast and recalculate for that particular stroke.

47
CHAPTER 5
COMPARISON OF TWO METHODS USING SUBSTATION LAYOUT
Substation Layout and Geometry of the Equipment
Before starting lightning protection design of the substation, it is important to know layout
of the substation bus work. Figure 24 shows a physical layout of a 220 kV substation. As
shown in the figure, there are three buses in the substation. Two of the buses are 28 feet
high and other is 20 feet high. The bus spans and length of the sections in the substation
are shown too.
Figure 24 220 kV Substation Layout Top View
Rolling Sphere Method to Design Protection Shielding System
The lightning protection should be designed for every bus. Therefore initially bus 1 is con-
sidered. The bus is to be protected by positioning the lightning masts using developed com-
puter program. To start with the designing, two lightning masts are placed on either side of
the bus with an objective that the rolling sphere will not touch the bus bar and go over and

48
on top of it. Height of the bus is 28 feet and width is 30 feet as shown in figure 24. The
BIL level corresponding to 220 kV bus is 900 kV. Once these electrical parameters of the
bus are entered into the program, allowed stroke current and strike distance for the rolling
sphere is calculated. This strike distance is radius of the rolling sphere. The value of allow-
able stroke current is 6.27 kA. This corresponds to radius of rolling sphere equal to 86.04
feet. While positioning the lightning masts, a two dimensional cross section of the bus is
used. Now the two lightning masts are positioned 37 feet away from either side of the bus.
The height of lightning mast is selected to be 50 feet. The program is run and output is
shown in figure 25.
Figure 25 Protection for Bus 1 using Two Masts on Both Sides
As we can see, the bus is perfectly protected in between two masts without rolling sphere
touching it. If we try to move masts farther away from the bus, the rolling sphere will touch
the equipment and therefore this position of the masts is now fixed. Now the next step for
placement of the masts is to place a mast next to current mast and in parallel to the equip-
ment. To decide how far the mast need to be placed, it is made sure that the rolling sphere

49
stays on top of the bus for diagonal section of the bus. Initially, the two masts is placed at
37 feet from the current masts on either sides. Figure 26 shows the placement of the old
masts and the new two masts for this diagonal two dimensional section.
Figure 26 Cross Section for Placement of New Mast Location
As seen from the figure, the distance between two masts, one already placed and other new
mast, is the diagonal distance which equals 110.4 feet and length of the bus (diagonal) in
between is 31.84 feet. Entering this data into the program, the output is shown in figure 27.
Figure 27 Protection Offered by New and Old Mast to Diagonal Section of Bus

50
As it can be seen from the figure, the bus is perfectly protected. On similar design method
two more masts are added in parallel to the existing masts to complete the lightning pro-
tection design for bus 1. The final placement of the masts after designing the protection for
bus1 is shown in figure 28. The six circles represent the final placement of lightning masts
for bus 1 protection. Each mast is 37 feet away from either side of the bus and distance
between two adjacent masts is 37 feet too.
Figure 28 Final Positions of Lightning Masts for Bus 1 Protection
Now since bus 2 has similar dimensions as that of bus 1 which is 30 feet wide and 28 feet
high, there is no need to perform the steps for placement of the masts again. The final
positioning after designing protection for bus 2 is shown in figure 29.

51
Figure 29 Lightning Mast Positions After Bus 2 Protection Design
Bus 3 is protected using one of the mast placed already shown in figure 30 which is 42.2
feet away from the bus and another new mast is added on the other side of the bus at same
distance from the bus.
Figure 30 Addition of a New Mast to Protect Bus 3
52
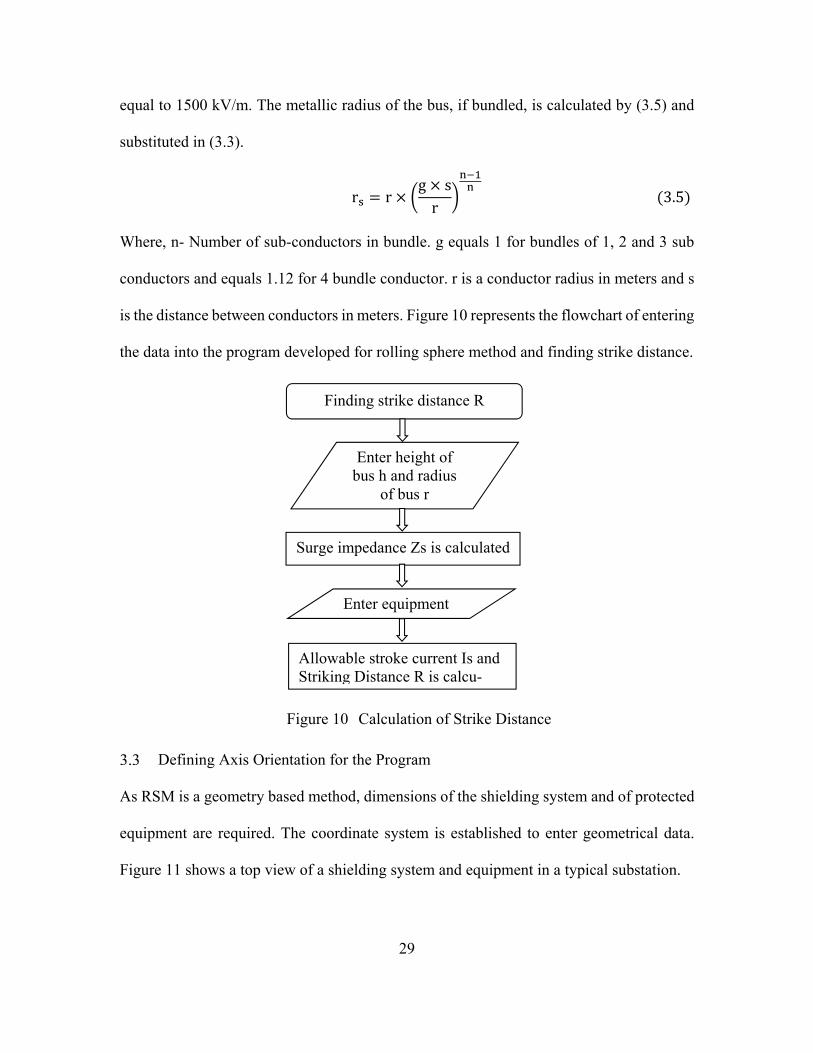
The zone of protection has to be checked for this placement of the mast. The coordinates
of masts and bus are entered into the program and output is shown in figure 31.
Figure 31 Verification for Correct Positioning of New Mast for Bus 3
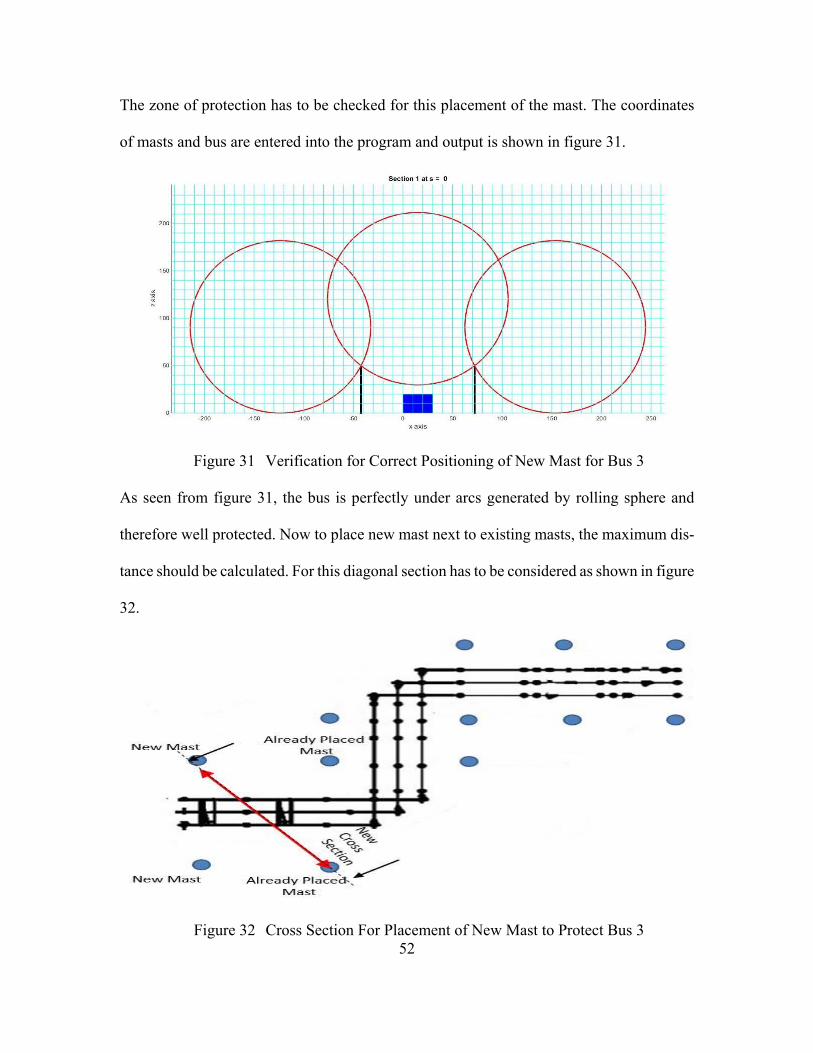
As seen from figure 31, the bus is perfectly under arcs generated by rolling sphere and
therefore well protected. Now to place new mast next to existing masts, the maximum dis-
tance should be calculated. For this diagonal section has to be considered as shown in figure
32.
Figure 32 Cross Section For Placement of New Mast to Protect Bus 3

53
The coordinate data is entered into the program and figure 33 shows perfect shielding
against lightning. Therefore this arrangement of masts is correct and the final arrangement
to protect all three buses using rolling sphere method program is shown in figure 34.
Figure 33 Verification for Correct Positioning of New Mast Location
Figure 34 Final Positioning of Masts to Protect all Three Buses in Substation

54
Rizk Model based MATLAB Program for Lightning Protection Calculations
From the previous calculations, the rolling sphere method requires 12 masts and the loca-
tion of masts in shown in figure 34. With this as a starting point, the calculation for Rizk
model are performed. To start with, for bus 1 lightning protection calculations are per-
formed. First, current placement of masts is used to find if they are enough to protect the
given area of bus 1. Therefore, coordinates of the six masts located around bus 1 are entered
into the program. The design strike current is 6.27 kA which is obtained from rolling sphere
method initial calculations. The height of all masts is taken as 50 feet. The output of the
Rizk model MATLAB program is shown in figure 35.
Figure 35 Protection of Bus 1 keeping Shielding System same as RSM
The lightning leader travels downward and reaches height of 28 meters (92 feet) and the
upward leader from mast at (0,0) location travels 24.09 meters(79 feet) when the final strike
happens. Therefore, this arrangement is perfect against direct shielding failure. This is be-

55
cause, height of positive leader is not greater than negative leader when final strike condi-
tion is met. Now since, we have enough margin to reposition the masts away from the
substation bus work, the coordinates of the masts are changed without changing height of
mast, which is 50 feet (15.24 meters).
Instead of six masts only four are placed with distance between adjacent masts as 75 feet
and distance of from either side of bus is taken as 47.5 feet away. The output of simulation
is shown in Figure 36.
Figure 36 Repositioning of Masts According to Rizk model for Bus 1
The height of inception of upward positive leader for four masts is 37.5 meters above the
ground. The height of the negative and positive leader at final strike are 22.3 and 22.29
meters respectively. As it is observed that, any further change in placing the masts will
cause negative leader to travel below upward leader which is a condition for shielding fail-
ure, the repositioning of the masts is stopped and this is the final position for masts. Figure
37 shows final position of masts in order to protect bus 1.

56
Figure 37 Placement of Mast after Positioning Masts for Bus 1
Now, protection of bus 2 is considered. Since one mast is placed already near bus 2, one
more mast is placed on other side of bus 2. The distance of both the masts from bus 2 is 36
feet with height 50 feet. The placement of next mast will be on similar lines as for bus 1
and can be done 75 feet away from the first mast. But since there is not enough space the
next mast is placed at 60 feet away from the first mast. Therefore final layout is shown in
figure 38.
Figure 38 Shielding Mast Positions after Bus 2 Protection

57
The coordinates of the masts for bus 2 are entered into the program and checked for pro-
tection. The detailed result of the simulation are shown in figure 39. It shows four mast
placed around bus 2.
Figure 39 Output of the Program to Validate Correct Shielding Position
It is observed that height of inception for upward leader is 42.85 meters above the ground.
At final jump conditions negative leader is at 31.9 meters and positive leader from mast at
(0, 0) location is at 24.92 meters above ground. Therefore, bus 2 is protected. Now bus 3
already has one mast on one of its sides at 12 feet of distance. Similarly another mast is
placed 12 feet away from the bus. Two more masts can be placed on either side of the bus
at a distance of 70 feet away from current masts. The final layout is similar to the one
shown in figure 40. As shown by figure 36 and figure 39, the buses are protected and the
design is complete.

58
Figure 40 Final Placement of Masts to Protect all Three Buses using Rizk Model
Program

59
CHAPTER 6
CONCLUSION AND FUTURE WORK
General Conclusions
Computer tool is developed for rolling sphere method to design lightning protection
of the electric substations. A test case is shown for addition of a new substation
transformer using rolling sphere method.
The program is very easy to use and gives zone of protection calculation quickly.
This avoids the design effort by utility design engineers to refer back to drawings
and perform calculations by hand. The visualization of zone of protection helps in
redesigning protection system by knowing where the rolling sphere touches the
equipment.
The Rizk model program is developed that gives more physical approach towards
lightning phenomenon. A detailed simulation of downward, upward leader and
their propagation for final jump is programmed into MATLAB. This program too
is easy to use, since it involves entering parameters and coordinates similar to roll-
ing sphere method program.
A 220 kV substation layout is used to compare between these two methods. As the
area of the substation is same in both cases, the results obtained give a clear picture
of performance of the two methods.
It is seen that Rizk model requires 10 masts of 50 feet height to protect the bus work
whereas rolling sphere method needs 12 masts to protect the area. Although there
is not much of a difference between these two, rolling sphere method can therefore
be called as conservative method. The main reason that can be attributed to this

60
difference is the simulation of both upward and downward leaders for final strike
in Rizk model. In rolling sphere method, concept of upward leader is not given
consideration.
Therefore it is suggested that utility engineers can still use the conventional light-
ning protection design methods and there is no need to shift to new models.
Future Work
While developing RSM, some assumptions are made which can be improved.
The shield wires are installed between two vertical masts. Any structure hanging
between two supports would take a shape of a catenary. Therefore, the shield wire
will have sag, thereby reducing its height at particular sections. Since RSM is a
geometry based method, this would mean that the rolling sphere may dip thereby
touching the equipment beneath. Therefore more accurate mathematical catenary
equation can be used for shield wires.
Also, substation equipment is assumed to be a rectangular cross section which is
true in case of buses, but transformers, breakers being not ideal shapes cannot be
always modeled like this. The geometry can be improved by specifying some points
on these equipment so as to model them as closely as possible without sacrificing
the program simplicity.
Some of the generalizations made during the development of the Rizk model can be im-
proved.

61
The background field during a thunderstorm is neglected. The effect of cloud field
and other charges in space different from that of negative leader will induce poten-
tial on structures on ground. This will in turn affect the critical upward leader in-
ception voltage. Therefore, the time at which upward leader is initiated can be dif-
ferent than calculated ignoring background electric field.
The cloud height being a statistical parameter can be varied in order to see its impact
on charge density in leader. Although, cloud height is generally given between 2.5
-3 km, this would not make much difference to the final output of the model.
The proximity effect on one mast due to presence of the other is not considered to
simplify the calculations. To consider this, the upward leader inception voltage has
to be multiplied by some factor that relates to the geometry between two masts.
This will change the height at which upward leader is incepted.

62
REFERENCES
[1] Lukasz Staszewski, “Lightning Phenomenon – Introduction and Basic Information to Understand the Power of Nature,” 8th International Conference on Environment and Electrical Engineering, 2009. (Available at http://eeeic.eu/proc/papers/52.pdf )
[2] “Exceptional Weather - Thunderstorms, Tornadoes, Nor'easters, & Drought” 2014. (Available at http://www.tulane.edu/~sanelson/Natural_Disasters/tornadoes.htm )
[3] Andrew R. Hileman, “Insulation Coordination for Power Systems,” Marcel Dekker Inc., 1999.
[4] AIEE Committee Report, “A Method of Estimating Lightning Performance of Transmission Lines,” AIEE Trans., vol. 69, pp. 1187-1196, 1950.
[5] CIGRE Working Group 33.01, “Guide to Procedures for Estimating the Lightning Performance of Transmission Lines,” Technical Brochure no. 63, 1991.
[6] “National Lightning Detection Network Flash density per sq km 2005-2014”. (Available at http://www.vaisala.com/en/products/thunderstormandlightningdetec-tionsystems/Pages/NLDN.aspx#prettyPhoto )
[7] Richard J. Campbell, “Weather-Related Power Outages and Electric System Re-siliency,” CRS Report for Congress, 2012.
[8] The Lightning Diva, “Damages Rise when substations don’t invest in lightning protection,” 2012. (Available at http://www.lightningprotection.com/damages-rise-when-substations-dont-invest-in-lightning-protection/ )
[9] Dominik Pieniazek, “HV Substation Design: Applications and Considerations,” IEEE CED – Houston Chapter, 2012.
[10] Gururaj S. Punekar, Chandrasekaran Kandasamy, “Indirect effects of Light-ning Discharges,” Serbian Journal of Electrical Engineering, vol. 8, no. 3, pp. 245-262, 2011.
[11] IEEE Std 1410-2004, “IEEE Guide for Improving the Lightning Performance of Electric Power Overhead Distribution Lines.”
[12] Power & Water Corporation Power Networks, “Substation Design Manual- Chap-ter 14,” 2009.
[13] Volker Hinrichsen, “Metal Oxide Surge Arrestor Fundamentals” Siemens, 2001.

63
[14] Kathy Siciliano, “Lightning Protection: Protecting Communications Equipment in Substations,” 2005. (Availble at http://www.elp.com/articles/powergrid_interna-tional/print/volume-10/issue-3/features/lightning-protection-protecting-communica-tions-equipment-in-substations.html )
[15] “Lightning rod (air termination section) angle of protection”. (Available at http://www.sankosha.co.jp/en/technical_data/technical_lightning/hogokaku.html )
[16] Wagner C. F., G. D. McCann, and C. M. Lear, “Shielding of Substations,” AIEE Transactions, vol. 61, no. 2, pp. 96-100,313,448, 1942.
[17] Orrell J. T., “Direct Stroke Lightning Protection,” EEI Electrical System and Equip-ment Committee Meeting, 1988.
[18] “Design Calculations of Lightning Protection Systems – Part Eighteen”. (Available at http://www.electrical-knowhow.com/2014/05/Protection-Angle-and-Mesh-Light-ning-Design-Methods.html )
[19] Dellera L. and Garbagnati E., “Lightning Strike Simulation by Means of the Leader Progression Model: II. Exposure and Shielding Failure Evaluation of Overhead Lines with Assessment of Application Graphs,” IEEE Transactions on Power Delivery, vol. 5, no. 4, pp. 2009-22, 1990.
[20] Eriksson, A. J., “An Improved Electrogeometric Model for Transmission Line Shielding Analysis,” IEEE Transactions on Power Delivery, vol. 2, no. 3, pp. 871–886, 1987.
[21] Farouk A.M. Rizk, “Modeling of Lightning Incidence to Tall Structures Part I: The-ory,” IEEE Transactions on Power Delivery, vol. 9, no. 1, pp. 162-171, 1994.
[22] “Graphical Analysis and Design Program of Shielding System Against Lightning Strike”. (Available at http://www.sestech.com/Products/Brochures/SESShield-3D.pdf )
[23] “Furse StrikeRisk v6.0 - IEC/EN 62305-2 Risk Management Software”. (Available at http://new.abb.com/low-voltage/products/furse-earthing-lightning-protec-tion/tools/strikerisk-management-software )
[24] “Lightning Protection Calculation”. (Available at (http://www.primtech.com/pages/usuk/product_lightning_protection_calculation.php )
[25] IEEE Std 998-2012, “IEEE Guide for Direct Lightning Stroke Shielding of Substa-tions.”

64
[26] L. Dellera, E. Garbagnati, “Lightning Stroke Simulation by Means of the Leader Progression Model Part I: Description of the Model and Evaluation of Exposure of Free-standing Structure,” IEEE Transactions on Power Delivery, vol. 5, no. 4, pp. 2009-2022, 1990.
[27] K. Berger, “The Earth Flash”, Chapter 5, Lightning, vol. 1, Academic Press, 1977.
[28] Farouk A. M. Rizk, “Switchig Impulse Strength of Air Insulation: Leader Inception Criterion,” IEEE Transactions on Power Delivery, vol. 4, no.4, pp. 2187-2195, 1989.
[29] Farouk A. M. Rizk, “A Model for Switching Impulse Leader Inception and Break-down of Long Air-Gaps,” IEEE Transactions on Power Delivery, vol. 4, no. 4, pp. 596-606, 1989.

65
APPENDIX A
MATLAB CODE FOR ROLLING SPHERE METHOD

66
%############## Main Calling Function ####################% % This program calculates zone of lightning protection for the given % arrangment of equipment shield wire positions and bus electrical data. home; clear all; clc; clf; disp('Before entering any value, make sure that all the .txt files are in the same folder as this program is.') disp('Also check if all the information is entered in given units as in the manual and in the respective columns.') disp(' ') %The first step is to calculate surge impedance for given bus structure %The function surge_impe() is called which calculates surge impedance Zs %and returns R, strike distance for further calculation R=3.28*surge_impe_chek(); str = ['Strike distance in feet is ' num2str(R)]; disp(str) hold on; % The following piece of code taken in the data of the shield wires % It takes in 3-D co-ordinates of the two poles on which shield wire is % mounted which are used for further calculation % THE CO-ORDINATE SYSTEM HAS ORIGIN (0,0,0) AT ANY POINT ON WHICH SHIELD % WIRE IS MOUNTED. SUGGESTED POLE IS ANY POLE ON EXTREME END OF THE CROSS % SECTION. % WHILE ENTERING CO-ORNITAES START FROM EXTREME END(LEFT-MOST) OF THE CROSS % SECTION AND MOVE ALONG THE CROSS SECTION %fid=fopen('C:/Users/vinitmarathe/Desktop/Lightning Protection/SRP project/SRP_fi-nal_program/MATLAB code/wire_data.txt'); str=strrep(pwd,'\','/'); str=strcat(str,'/wire_data.txt'); fid=fopen(str); total_wires=input('How many wires/mast are present?(Note: This should be same as en-tered in wire_data.txt file): '); for wire_no=1:total_wires for i=1:2 tline= fgets(fid);

67
end A=fscanf(fid,'%f'); x1(wire_no)=A(1); y1(wire_no)=A(2); z1(wire_no)=A(3); x2(wire_no)=A(4); y2(wire_no)=A(5); z2(wire_no)=A(6); end % The following piece of code taken in the data of cross-section of the % equipments. It takes in 2-D co-ordinates of leftmost bottom corner and % rightmost upper corner which are used for further calculation % SINCE CO-ORDINATE SYSTEM IS FIXED AS PER SHIELD WIRE POLE AT (0,0,0) % ENTER THE CO-ORDINATES OF EQUIPMENT WITH RESPECT TO IT. present_perbus=input('Is there any perpendicular bus in the shielding? Enter Number 1 = YES and 0 = NO: '); if present_perbus==1 %fid=fopen('C:/Users/vinitmarathe/Desktop/Lightning Protection/SRP project/SRP_fi-nal_program/MATLAB code/per_bus.txt'); str=strrep(pwd,'\','/'); str=strcat(str,'/per_bus.txt'); fid=fopen(str); tt=fgets(fid); P_bus=fscanf(fid,'%f'); xl_pbus=P_bus(1); yl_pbus=P_bus(2); xr_pbus=P_bus(3); yr_pbus=P_bus(4); ht_pbus=P_bus(5); end total_equipment=input('How many equipments are present Note: This should be same as entered in equipment_data.txt file): '); %fid=fopen('C:/Users/vinitmarathe/Desktop/Lightning Protection/SRP project/SRP_fi-nal_program/MATLAB code/equipment_ data.txt'); str=strrep(pwd,'\','/'); str=strcat(str,'/equipment_data.txt'); fid=fopen(str); for equipment=1:total_equipment

68
for i=1:2 tline= fgets(fid); end A=fscanf(fid,'%f'); x1_e(equipment)=A(1); z1_e(equipment)=A(2); x2_e(equipment)=A(3); z2_e(equipment)=A(4); end % This asks user to define sections starting from POLE AT ORIGIN as % section at 0. The number of sections can be changed by changing 'k' value % in following code. flag=0; if total_wires==1 && x1==x2 && y1==y2 && z1==z2 Number_sec=1; flag=1; else Number_sec=input('How many sections do you want?: '); end for k=1:Number_sec if flag==1 s(k)=y1(1); else str = ['Enter section ' num2str(k) ' from origin pole in feet ']; s(k)=input(str); end end % THE FOLLOWING CODE TAKES ALL THE ABOVE ENTERED DATA AND CONSTRUCTS VISUAL % ZONE OF PROTECTION AT 5 DIFFERENT CROSS-SECTIONS for k=1:numel(s) figure; grid on; grid on; xlim('auto') ylim('auto') str=['Section ' num2str(k) ' at distance = ' num2str(s(k)) ' feet away from origin pole ']; title(str) if present_perbus==1

69
if s(k)>=yl_pbus && s(k)<=yr_pbus rectangle('position',[xl_pbus,0,xr_pbus-xl_pbus,ht_pbus],'FaceColor','g'); hold on; end end % This code plots the equipments as rectangle by calling rectangle() % fuction for equipment=1:total_equipment rectangle('position',[x1_e(equipment),z1_e(equipment),x2_e(equipment)-x1_e(equip-ment),z2_e(equipment)-z1_e(equipment)],'FaceColor','b'); hold on; end % This code takes in co-ordinates of the wire poles and constructs an % imaginary wire in 3-D and takes out only two points(x,z) in 2-D at specified % section 's' to be used for further calculation for wire_no=1:total_wires [x(wire_no),z(wire_no)]=plot_wire(x1(wire_no),y1(wire_no),z1(wire_no),x2(wire_no),y2(wire_no),z2(wire_no),s(k)); end total_point=total_wires; % This code plots the points on shield wire for given cross section by % calling plot_section_mast(). A point is shown as a static pole of that % height( since 'seeing' a point is difficult in figure) for i=1:total_point plot_section_mast(x(i),z(i)); end % After plotting equipments and taking out points of shield wire, following % piece of code plots actual zone of protection section-by-section in the % form of circles, depending on the geometry and strike distance 'R' % calculated at first.This is divided in 3 parts % Part 1: Checks if the point of the shield wire < 'R' and find where would % the center of sphere be and stores in 'root' for i=1:total_point if z(i)<R root=sort(find_root(x(i),z(i),R)); root_use(i,1)=root(1); root_use(i,2)=root(2); end end

70
% Part 2: After finding roots, this plots out protection zone on either sides of % first and last points of wire in a section if z(1)<R C_x=root_use(1,1); else C_x=x(1)-R; end vinit_draw_cir(C_x,R,R) if z(total_point)<R C_x1=root_use(total_point,2); else C_x1=x(total_point)+R; end vinit_draw_cir(C_x1,R,R) % Part 3: After finding roots, this plots out protection zone in between % the points depending if the sphere 'rests' or 'falls down' on the ground for i=1:total_point if i == total_point %disp('breaked') break else c1=[x(i) z(i) R]; c2=[x(i+1) z(i+1) R]; % Finds out intersection of two circles points=intersectCircles(c1,c2); p1=points(2,1); p2=points(2,2); % if the intersection is not a point(i.e. do not intersect) the sphere % is plotted on the ground else with the intersection as centre of % sphere, sphere is plotted if isnan(points) disp('do not intersect'); if z(i)<R C_x=root_use(i,2); else C_x=x(i)+R; end vinit_draw_cir(C_x,R,R); if z(i+1)<R C_x=root_use(i+1,1); else C_x=x(i+1)-R; end

71
vinit_draw_cir(C_x,R,R); else vinit_draw_cir(p1,p2,R); end end end grid_control() axis([-100,220,0,155]) end % This function calculates surge impedance, stroke current and strike distance % based on the bus height and diameter and BIL Level % If there are two bus heights and/or two diameters of bus, enter all % combinations and check for strike distance. Use the smallest value of % strike distance for conservative reults. function S=surge_impe_chek() str=strrep(pwd,'\','/'); str=strcat(str,'/surge_data.txt'); fid=fopen(str); for i=1:1 tline= fgets(fid); end A=fscanf(fid,'%f'); n=A(1); %Number of conductors in bundle of a phase d=A(2); %Diameter of one conductor in feet h=A(3); %Height of bus in feet Vc=A(4);%BIL Level if n==1 s=1; g=1; elseif n==2|3 s=input('spacing between conductors in feet '); g=1; elseif n==4 s=input('spacing between conductors in feet '); g=1.12; end r=(d/2);%in feet

72
E0=1500; Rc=2; % guess value for corona radius meters % calculates actual corona radius for i=1:15 Rc=Rc-(Rc*log(2*h*0.3048/Rc)-(Vc/E0))/((log(2*h*0.3048/Rc))-1); end Rc=3.2808*Rc; R0=r*(g*s/r)^((n-1)/n); Rcnew=R0+Rc; % Surge impedance, stroke current and strike distances are calculated Zs=60*sqrt(log(2*h/Rc)*log(2*h/R0)); str = ['Surge impedance is ' num2str(Zs) ' ohms']; disp(str) Is=(Vc*2.2)/Zs; str = ['Allowable stroke current is ' num2str(Is) ' KiloAmperes']; disp(str) S=8*Is^0.65; str = ['Strike distance is ' num2str(S) ' meters']; disp(str) end %Plots a circle for given coordinates function vinit_draw_cir(x1,y1,R) theta=0:0.01:2*pi; %control smoothness of the circle [x,y]=pol2cart(theta,R); plot(x1+x,y1+y,'LineWidth',2,'Color','r'); hold on; end function points = intersectCircles(circle1, circle2) %INTERSECTCIRCLES Intersection points of two circles % POINTS = intersectCircles(CIRCLE1, CIRCLE2) % Computes the intersetion point of the two circles CIRCLE1 and CIRCLE1. % Both circles are given with format: [XC YC R], with (XC,YC) being the % coordinates of the center and R being the radius. % POINTS is a 2-by-2 array, containing coordinate of an intersection % point on each row. % In the case of tangent circles, the intersection is returned twice. It % can be simplified by using the 'unique' function.

73
% adapt sizes of inputs n1 = size(circle1, 1); n2 = size(circle2, 1); if n1 ~= n2 if n1 > 1 && n2 == 1 circle2 = repmat(circle2, n1, 1); elseif n2 > 1 && n1 == 1 circle1 = repmat(circle1, n2, 1); else error('Both input should have same number of rows'); end end % extract center and radius of each circle center1 = circle1(:, 1:2); center2 = circle2(:, 1:2); r1 = circle1(:,3); r2 = circle2(:,3); % allocate memory for result nPoints = length(r1); points = NaN * ones(2*nPoints, 2); % distance between circle centers d12 = distancePoints(center1, center2, 'diag'); % get indices of circle couples with intersections inds = d12 >= abs(r1 - r2) & d12 <= (r1 + r2); if sum(inds) == 0 return; end % angle of line from center1 to center2 angle = angle2Points(center1(inds,:), center2(inds,:)); % position of intermediate point, located at the intersection of the % radical axis with the line joining circle centers d1m = d12(inds) / 2 + (r1(inds).^2 - r2(inds).^2) ./ (2 * d12(inds)); tmp = polarPoint(center1(inds, :), d1m, angle); % distance between intermediate point and each intersection point h = sqrt(r1(inds).^2 - d1m.^2); % indices of valid intersections

74
inds2 = find(inds)*2; inds1 = inds2 - 1; % create intersection points points(inds1, :) = polarPoint(tmp, h, angle - pi/2); points(inds2, :) = polarPoint(tmp, h, angle + pi/2); %to plot masts function plot_section_mast(x1,z1) z_fir=0:1:z1; x_fir(1:numel(z_fir))=x1; plot(x_fir,z_fir,'LineWidth',3,'Color','k'); xlabel('x axis'); ylabel('z axis'); zlabel('y axis'); hold on; end %% draw your own grid lines function grid_control() xrange=300; yrange=300; division=10; for i=1:division:yrange % draw horizontals hGRID = plot([-xrange+1 xrange-1],[i-1 i-1],'c-'); hold on end for i=1:division:2*xrange % draw verticals hGRID = plot([i-1-xrange i-1-xrange],[0 yrange],'c-'); hold on; end end

75
APPENDIX B
MATLAB CODE FOR RIZK MODEL

76
%########### Main Calling Function ##########################% home; clear all; clc; clf; xlea=10.97/2; %Location of leader in space on x axis ylea= 18.23/2;%Location of leader in space on y axis I=6.27; % Current in KA in downward Negative Leader/Stroke Current v_pos=1.5/100; % Velocity of upward leader in meters/microsec v_neg=v_pos; % Velocity of downward leader in meters/microsec Hcl=2500; % Cloud height in meters k=8.984*10^9; % Value of Constant 1/(4*pi*epsilon) Qim=76*I^(0.68)*10^(-3); %Total charge in the down leader as function of stroke currrent Rho0=2*Qim/Hcl; %Charge density at ground level total_wire=input('How many protective wires are present? '); %User input for total shield wires fid=fopen('C:/Users/vinitmarathe/Desktop/RIZK MODEL_ APPROACH/wire.txt'); % Opening data file where wire coordinates are located %Extracting wire mast locations from data files and storing for program for wire_no=1:total_wire for i=1:2 tline= fgets(fid); end A=fscanf(fid,'%f'); xpw1(wire_no)=A(1); ypw1(wire_no)=A(2); zpw1(wire_no)=A(3); xpw2(wire_no)=A(4); ypw2(wire_no)=A(5); zpw2(wire_no)=A(6); end a=0.05; %Assuming all wires have radius of 0.05 meters = 2 inch % Find inception potential for all wires for wire_no=1:total_wire Upcw(wire_no)=10^3*(2247/(1+(5.15-5.49*log(a))/(zpw1(wire_no)*log(2*zpw1(wire_no)/a)))); end % Find Height of negative leader when upward leader is incepted by the wire for wire_no=1:total_wire H_inception(wire_no)=height_of_incep-tion1(Upcw(wire_no),Hcl,v_neg,Rho0,xpw(wire_no),ypm(wire_no),zpm(wire_no),xlea,ylea,k)

77
end total_mast=input('How many protective mast are present? '); %User input for total shield wires fid=fopen('C:/Users/vinitmarathe/Desktop/RIZK MODEL_ APPROACH/mast.txt'); % Opening data file where Mast coordinates are located %Extracting mast locations from data files and storing for program for mast_no=1:total_mast for i=1:2 tline= fgets(fid); end A=fscanf(fid,'%f'); xpm(mast_no)=A(1); ypm(mast_no)=A(2); zpm(mast_no)=A(3); end % Find inception potential for all masts for mast_no=1:total_mast Upcm(mast_no)= 10^3*1556/(1+(3.89/zpm(mast_no))); end % Find Height of negative leader when upward leader is incepted by the mast for mast_no=1:total_mast H_inception(mast_no)=height_of_incep-tion1(Upcm(mast_no),Hcl,v_neg,Rho0,xpm(mast_no),ypm(mast_no),zpm(mast_no),xlea,ylea,k); end [H_inception,xpm,ypm,zpm]=Mastsort(xpm,ypm,zpm,H_inception,total_mast) % Sort-ing all masts by the heights at which upward leader is incepted. zlea=H_inception(1); % Setting negative leader's 'z' in space at height at which first up-ward leader is incepted % Setting positive leaders trajectory first point as indivisual mast's tip for mast_no=1:total_mast x_pos(mast_no)=xpm(mast_no); y_pos(mast_no)=ypm(mast_no); z_pos(mast_no)=zpm(mast_no); end %Plotting vertical mast in space len(1:total_mast)=0; for mast_no=1:total_mast zpl=0:0.1:zpm(mast_no); xpl=repmat(xpm(mast_no),1,numel(zpl)); ypl=repmat(ypm(mast_no),1,numel(zpl)); plot3(xpl,ypl,zpl,'linewidth',5); hold on;

78
end lv=1; H_inception(total_mast+1)=0; InceptedMast=1; flagattached=0; %Setting a flag that says there is no final strike before simulation starts. time_interval=5; %Time step simulation takes in microsecond during each iteration for t=0:time_interval:100000 %Setting up simulation time of 0.1 seconds if H_inception(InceptedMast+1)>zlea InceptedMast=InceptedMast+1; end InceptedMast; for mast_no=1:InceptedMast plot3(x_pos(mast_no),y_pos(mast_no),z_pos(mast_no),'Marker','o'); %Plotting posi-tive leader trajectory in space hold on; plot3(xlea,ylea,zlea,'Marker','*'); %Plotting negative leader trajectory in space hold on; end %Positive leader trajectory movement if mast has reached leader inception voltage for mast_no=1:InceptedMast len(mast_no)=len(mast_no)+v_pos*time_interval; Upos(mast_no)=Pos_leader_voltage(len(mast_no),time_interval,v_pos); %Positive leader potential %lv=lv+1; [x_pos(mast_no),y_pos(mast_no),z_pos(mast_no)]=newcoordi-nates(x_pos(mast_no),y_pos(mast_no),z_pos(mast_no),xlea,ylea,zlea,v_pos*time_inter-val); end Uneg=Neg_pot(Rho0,Hcl,zlea,Qim); % Calculating Negative leader potential using function Neg_pot() zlea=zlea-time_interval*v_neg; % New position of downward negative leader in spcae % finding distance between tips of all positive leaders and a negative leader for mast_no=1:InceptedMast tipDistance(mast_no)=Dis-tance(xlea,ylea,zlea,x_pos(mast_no),y_pos(mast_no),z_pos(mast_no)); end for mast_no=1:InceptedMast if (abs(Upos(mast_no)+Uneg)/(tipDistance(mast_no)))>=500*10^3 %cheking crite-ria if the potentail gradient has reached 500 kV/meter stri=['Leaders meet for mast ' num2str(mast_no)]; % If reached, text message is displayed and succesful interecption by mast disp(stri) flagattached=1; zlea

79
z_pos(mast_no) tipDistance(mast_no) break; end end if flagattached==1; break; end end InceptedMast zlea z_pos %################# Function to calculate Height of Inception ##############% function H_inception=height_of_incep-tion1(Upcm,Hcl,v_neg,Rho0,xpm,ypm,zpm,xlea,ylea,k) Uinduced=0; % set induced voltage to 0 R=sqrt((xpm-xlea)^2+(ypm-ylea)^2) h=zpm; time_step=10; %time step in microsecond H_inception=Hcl;%set initial height of inception at height of cloud syms x; % Calculate the tip potential A(x)=log(x - h + (R^2 + h^2 - 2*h*x + x^2)^(1/2)) - log(h + x + (R^2 + h^2 + 2*h*x + x^2)^(1/2)) - (R^2 + h^2 - 2*h*x + x^2)^(1/2)/Hcl + (R^2 + h^2 + 2*h*x + x^2)^(1/2)/Hcl - (h*log(h + x + (R^2 + h^2 + 2*h*x + x^2)^(1/2)))/Hcl - (h*log(x - h + (R^2 + h^2 - 2*h*x + x^2)^(1/2)))/Hcl; while Uinduced<Upcm %Iterate till tip potential reaches critical potential Uinduced=k*Rho0*double(A(Hcl)-A(H_inception)); H_inception=H_inception-time_step*v_neg; if H_inception<=zpm H_inception=0; break; end Uinduced; end %############## Function to find Negative leader Potential ############% function Uneg=Neg_pot(Rho0,Hcl,ht,Qim) eps=8.85*10^(-12); grad=6*10^3;%volts/meter

80
E=3*10^6;%volts/meter ul=grad*(ht);% total voltage Rho0=Rho0*(1-ht/Hcl); Rad=Rho0/(2*pi*eps*E); ut=E*Rad; Uneg=ul+ut; %Uneg=Uneg*(ht)/Hcl; end %############# Function to sort masts/wires according to their inception voltage ################################# function [H_inception,xpm,ypm,zpm]=Mastsort(xpm,ypm,zpm,H_inception,total_masts) for i=1:total_masts % creates a matrix of x and z of all wires so that sortrows() func-tions can be used Mat(i,1)=H_inception(i); Mat(i,2)=xpm(i); Mat(i,3)=ypm(i); Mat(i,4)=zpm(i); end NewMat=sortrows(Mat,-1); %matlab built-in function that sorts a matriz in DESCEND-ING order of column 1 for i=1:total_masts H_inception(i)=NewMat(i,1); % disintegrating the matrix back to x and z to give it back to the program xpm(i)=NewMat(i,2); ypm(i)=NewMat(i,3); zpm(i)=NewMat(i,4); end end %############## Calculation of Positive leader voltage #############%%% function Upos=Pos_leader_voltage(len,time_interval,v_pos) Ei=400*10^3; % kV/m Einf=50*10^3; % kV/m x0=time_interval*v_pos;%meters 0.75 Upos=(len)*Einf+x0*Einf*log((Ei/Einf)-(((Ei-Einf)/Einf)*exp(-len/x0))); end % ############# Calculation of new coordinates after every iteration %############### function [x y z]=newcoordinates(x_pos,y_pos,z_pos,xlea,ylea,zlea,d) a=xlea-x_pos; b=ylea-y_pos; c=zlea-z_pos;

81
t=d/sqrt(a^2+b^2+c^2); x=x_pos+a*t; y=y_pos+b*t; z=z_pos+c*t; end