Embed Size (px)
Citation preview
Computer Graded Visualizations
John Fountain and Katherine Ryker
Marine, Earth and Atmospheric Sci.
GSA SE Meeting April 10, 2014
Development Team
• Katherine Ryker– Visualization Development– Class Use– Evaluation
• Doel Gonzalez– Database– Server – Sever/Client communication
Value of Visualizations Visualizations invaluable for learning in geosciences (e.g. Libarkin, 2002; McConnell et al., 2003 )
And Assessment: Student-created products invoke higher level skills, while multiple choice questions typically examines low Depth of Knowledge Skills (e.g. Yuan and Le, 2012).
Manual Grading Limits Use
• Although value proven, grading student-created products requires more resources, which limits use (Darling-Hammond and Adamson, 2013)
Research Objective
Allow increased use of visualizations in assessment by developing an auto-scoring method.
Method designed for routine use, including daily “homework” assignments
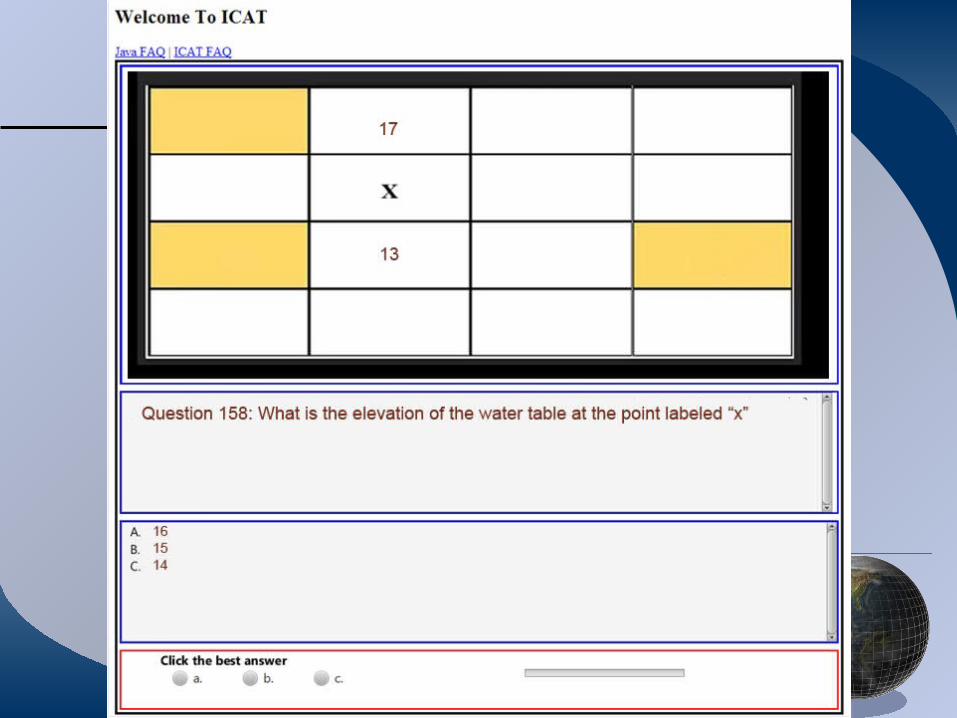
ICAT (Instructional Computer Adaptive Test)
• Visualization Grading added to ICAT
• ICAT combines instruction and assessment to enhance student mastery of material to be learned outside of class: Not Simply Assessment
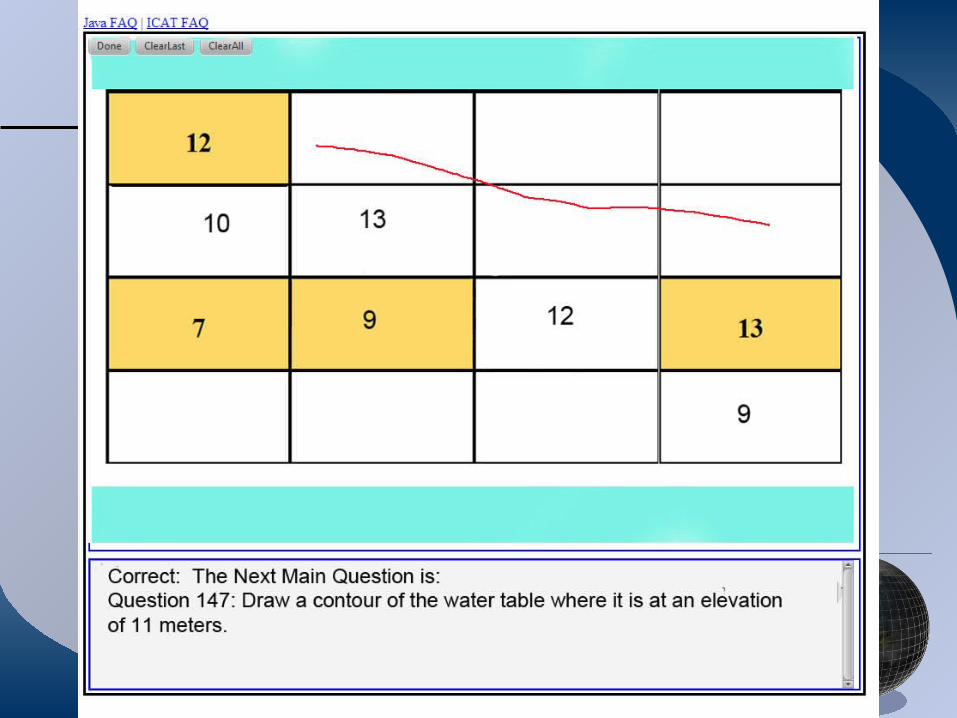
Three Types of Drawing
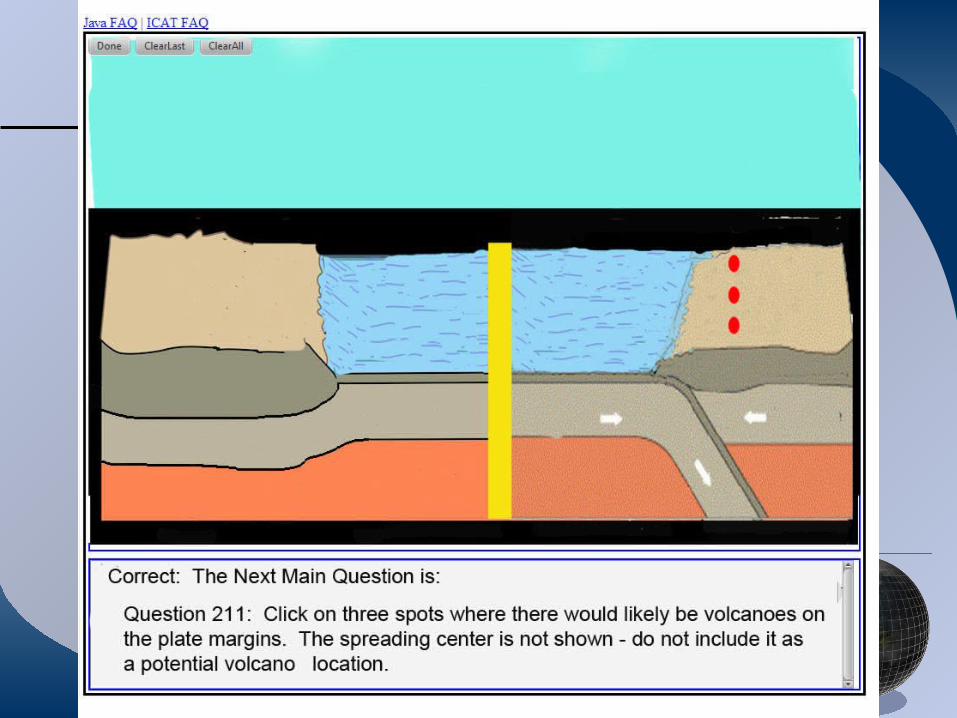
• Freehand drawing• Polylines (connected straight segments)• Insertion of symbols
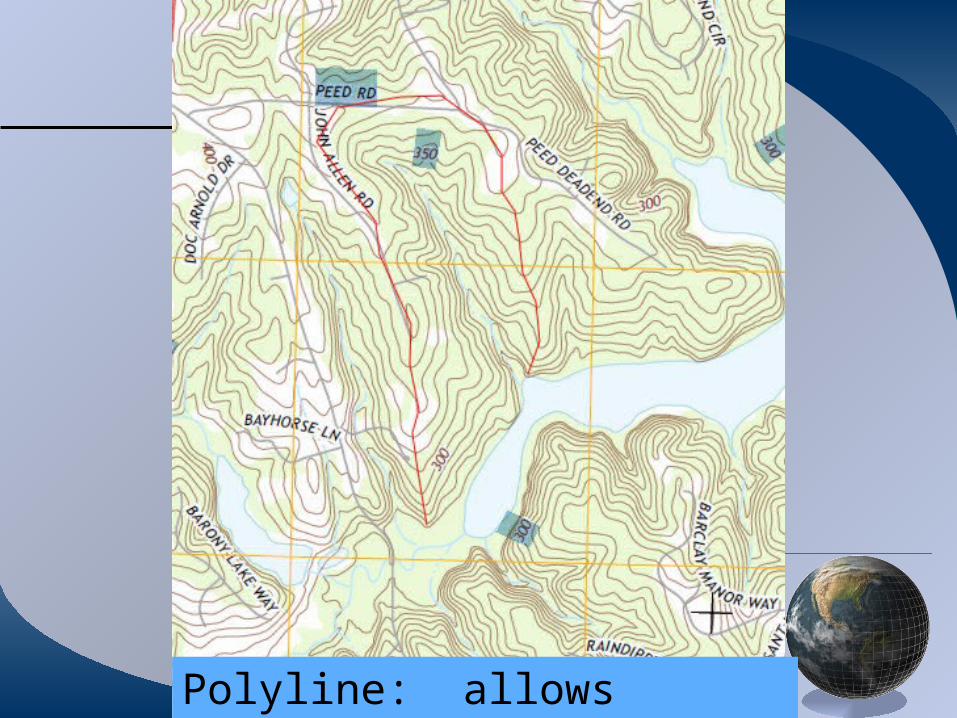
Polyline: allows precise location
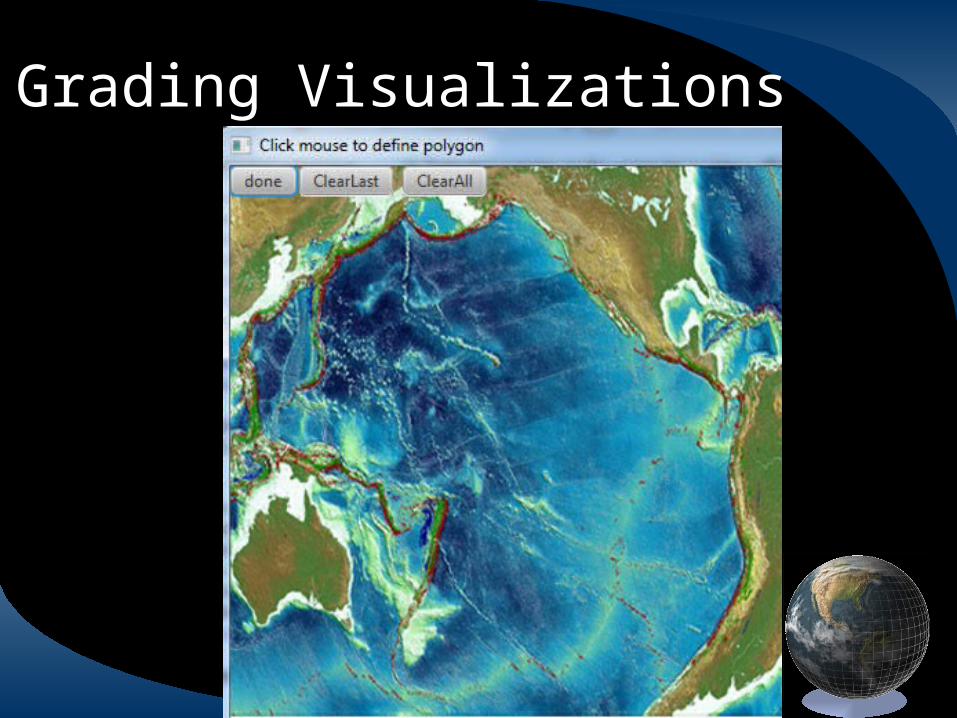
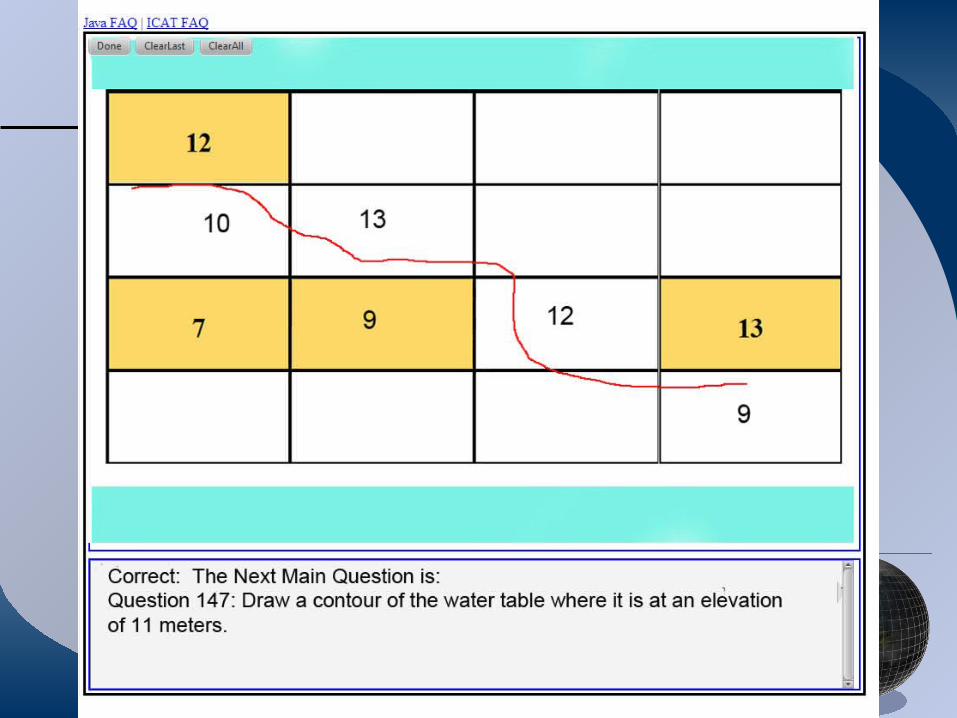
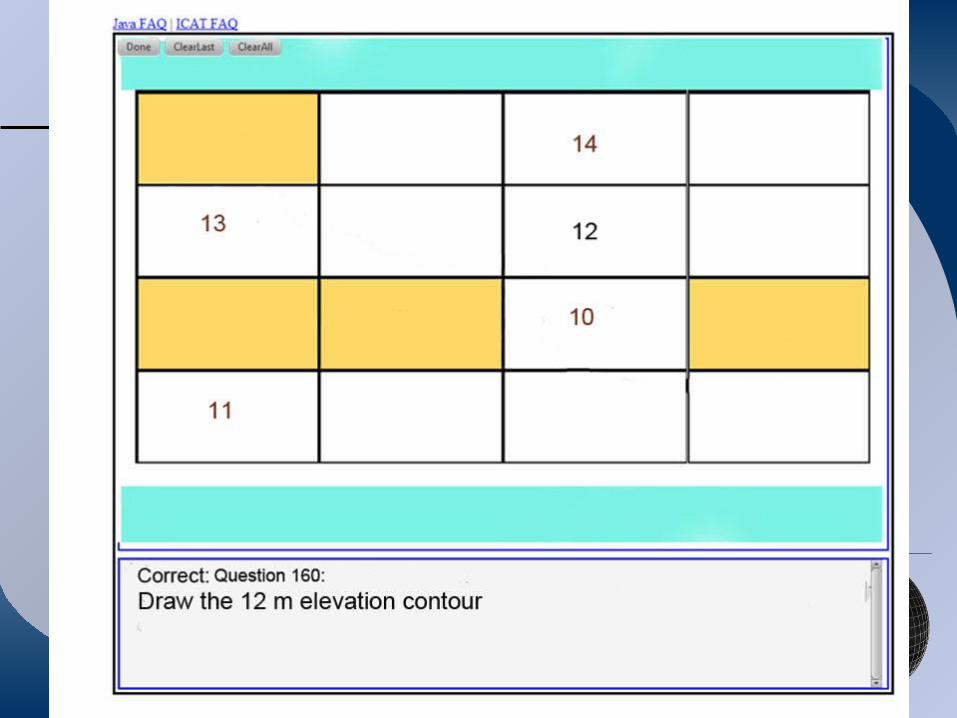
Grading Visualizations
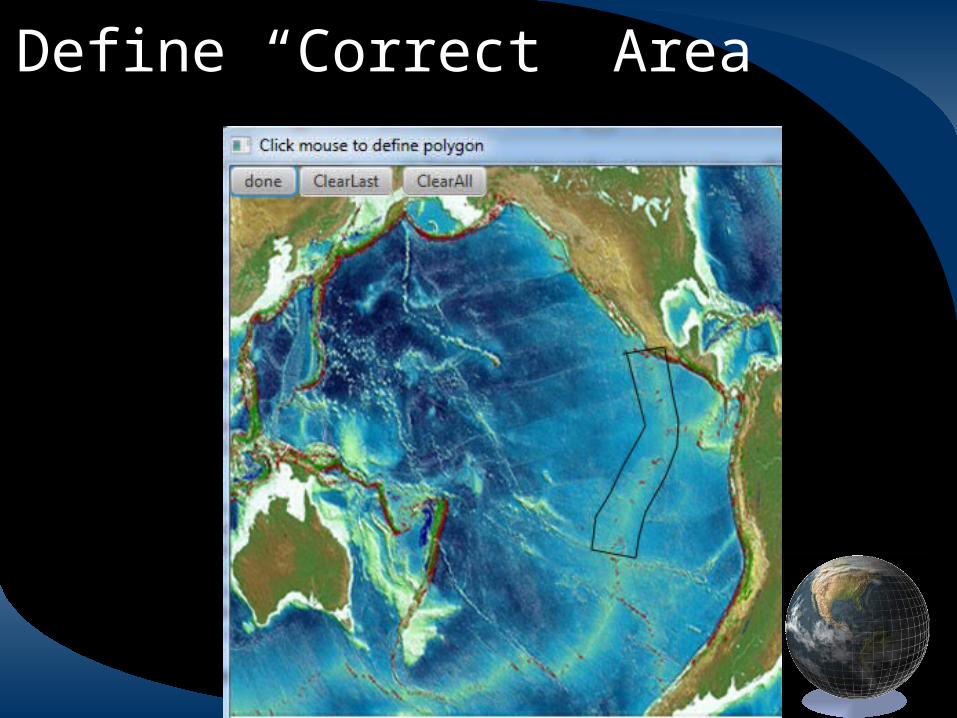
Define “Correct” Area” area
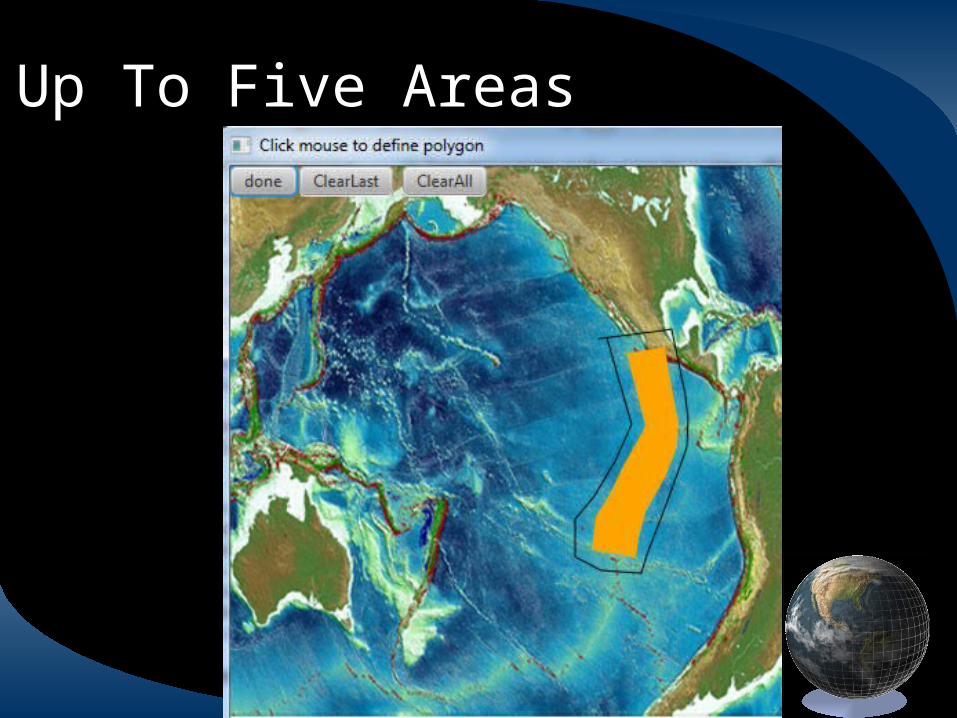
Up To Five Areas
Rubric Flexible
• Example: 90% of student’s line in “correct” area and 0% in “wrong” area = A
• Can be as complex as desired, using multiple logical statements
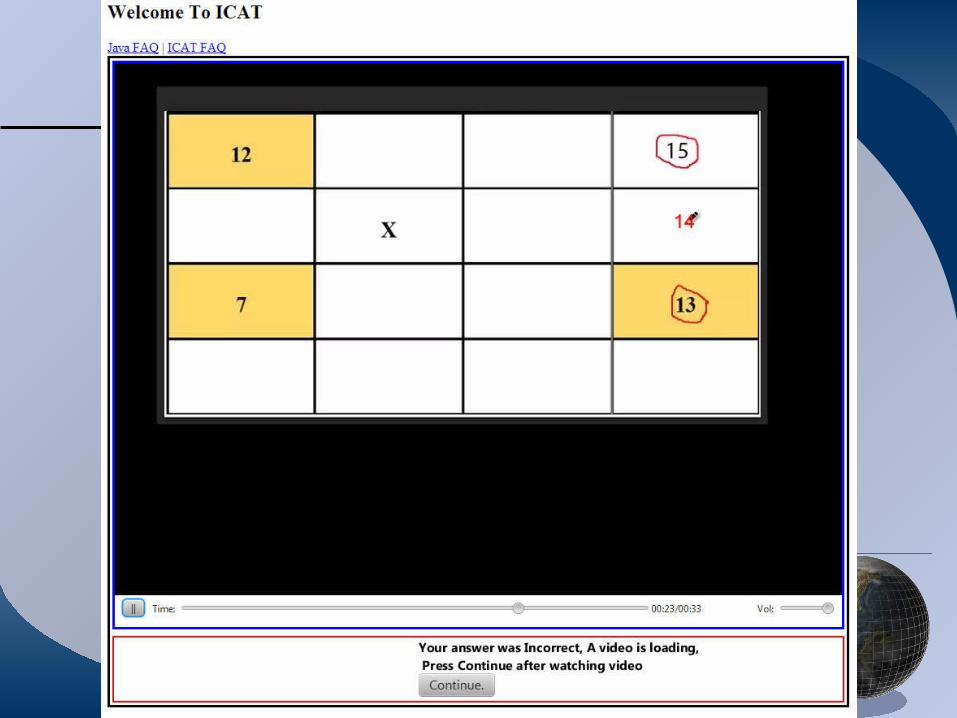
If The Answer is Wrong?
• If a high level question is missed, what does it mean?
• Usually involves synthesis of multiple knowledge areas
• ICAT designed to identify knowledge gaps and address them
Instructional
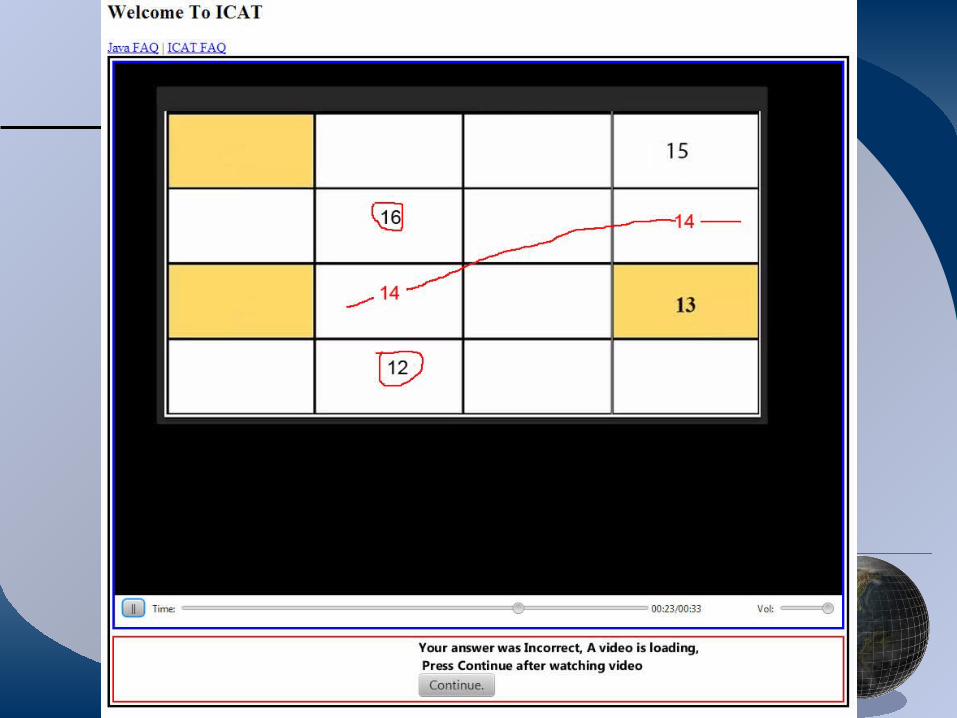
• ICAT provides instructional material when a question is not answered correctly
• May be videos or text + image
Investigate Underlying Concepts
• Sub-questions investigate individual knowledge areas
• Instructional material directed to specific area
Why The Question was Missed
• Sub-questions can investigate individual knowledge areas underlying main question
• Information keyed to responses can build knowledge needed to answer questions
Missed Questions Repeated• After a question is missed:
– information may be given– Or a sub-question that investigates underlying
knowledge areas
• Eventually the missed question will be returned to
Automatic Grade Book
Gradebook has student grade list plus:– Master Quiz Grades– Separate Grades For Each Visualization– Evaluations of Each Question
• Was material learned?• What was not understood?• Sub-questions results show knowledge areas
that were not mastered
Conclusion
• Auto-grading of visualizations implemented in ICAT
• Used successfully in Introductory Geology Classes
• Allows routine (daily) use of visualizations for assessment
Thank You for Listening!
Questions??
Funding from the
National Science Foundation’s Opportunities for Enhancing Diversity In the Geosciences Program