Embed Size (px)
Citation preview
Infacon XVI: International Ferro-Alloys Congress, Edited by A.N. Wærnes, G. Tranell, M. Tangstad, E. Ringdalen, and C. van der Eijk
SINTEF/NTNU/FFF, Trondheim 27 - 29 September 2021
1
Computational modelling of electrical conduction in ferroalloy furnace burdens
Q.G. Reynolds1,2, S.J. Baumgartner2,3, M.W. Erwee3, S. Swanepoel3, I.J. Geldehuys1, and G. Akdogan2
1Mintek, South Africa, [email protected] 2University of Stellenbosch, South Africa
3Samancor Chrome Ltd, South Africa
Keywords: modelling, electrical, ferrochromium, pyrometallurgy Abstract – A computational model of the electrical behaviour of the burden layer in a ferroalloy furnace system is presented, focusing on ferrochromium as an example case. The model is based on the discrete element method, which calculates the mechanical interactions and resulting motion of each particle in large ensembles. A simplified set of relationships describing the melting and reaction zones around each electrode tip is included in the computational model to control the continuous consumption of particles, and it is shown how different consumption mechanisms for different types of particles can lead to the formation of reductant-rich beds and other geometric structures within the burden. A method for calculating the inter-electrode electrical resistance by constructing a network based on particle contacts is developed and used to generate quantitative estimates of inter-electrode burden conduction effects under different conditions of electrode geometry and particle consumption dynamics.
INTRODUCTION Submerged-arc furnaces (SAF) are widely used in the production of ferroalloys including ferromanganese, silicomanganese, ferrosilicon, and ferrochromium (Olsen et al., 2007) (Gasik, 2013). These furnaces are typically of circular design, with three vertically-mounted electrodes connected to an alternating current (AC) electrical power supply. SAFs are fed with a mixture of either lumpy ore or pelletised fines, together with a carbonaceous reductant such as coke or anthracite and any other materials necessary to optimise the thermochemical behaviour. The furnace vessel is filled with a deep layer of raw materials (the burden) which is continuously replenished from feed ports in the vessel roof and consumed from below in the high-temperature smelting zones around the electrode tips. A simplified schematic of the furnace interior is given in Figure 1, showing the three central electrodes surrounded by the burden layer with the molten slag and metal pools below.
Figure 1: Side view of the interior of a typical SAF smelter
Electronic copy available at: https://ssrn.com/abstract=3926638

2
Conduction of electricity between the electrodes is necessary for the input of power to the furnace. It is often assumed that this occurs entirely by conduction from the electrode tips to the molten bath which serves as a common or neutral point in the AC circuit. However when one or more of the feed materials is electrically conductive, as is typically the case when carbonaceous reductants are used, it is also possible for some current to pass directly through the burden between adjacent electrodes. The degree to which this occurs is closely related to the complex three-dimensional structure of the burden, which arises from the different mechanical and thermochemical behaviour of the various feed components. This can cause segregation and preferential accumulation of particles in different regions (Wedepohl and Barcza, 1983) (Ringdalen and Eilertsen, 2001), and these non-uniformities may ultimately result in electrical heating in undesirable parts of the furnace. Due to the very high current levels it is also possible for plasma arcs to form between the electrode tips and the surrounding material in certain cases – in smelting of commodities such as silicon this is an integral part of the metallurgical process, for example. However, arc conduction is an extensive and complex field of research, and inclusion of these effects this is beyond the scope of the present paper. Several authors have performed comprehensive theoretical and experimental investigations on the electrical properties of burden particle beds (Dijs, 1979) (Eidem et al., 2007) (Eidem et al., 2008) (Eidem et al., 2009) (Eidem et al., 2010). In general these studies have focused on the nature of particle-to-particle contact as it relates to electrical conduction, and the various parameters that affect this. It has been observed that the overall resistance of reductant-rich beds underneath the electrode tips may be affected by a number of factors: these include the reductant material’s resistivity and mechanical properties, the contact area between particles, the size of the particles, and others. (Dijs, 1979) and (Eidem et al., 2008) offer mathematical analyses of burden conduction assuming that conductive particles are connected in parallel chains of various length, and demonstrate how bulk macro-scale properties can arise from micro-scale behaviour related to individual particles and the contacts between them. In order to combine the electrical understanding of burden conduction with computational modelling, two broad approaches are possible – continuum methods, which treat the burden as a uniform material with bulk properties governed by conservation laws in the form of differential equations, or granular methods, which calculate the behaviour of each individual particle in a large collection based on force and energy balances during their interactions with one another and the environment. Continuum methods integrate naturally with traditional finite-element and finite-volume computational mechanics models for fluid flow and energy transfer, and as such have been used to study furnace behaviour in a variety of SAF processes, e.g. (Sridhar and Lahiri, 1994) (Yang et al., 2004). Unfortunately the determination of bulk material properties for continuum methods is not straightforward in the case of particulate media such as that found in the burden layer; an interpretive framework is required to take micro-scale particle properties to macro-scale bulk properties. For mechanical and constitutive properties there are a number of kinetic theories of granular flow available, but electrical properties such as bulk resistivity are not as well understood. This is particularly true in the case of complex mixtures of particles of different types. By contrast, because granular methods are able to fully resolve each particle in the burden assembly, they are able to use micro-scale properties directly when calculating a system’s overall behaviour. This compensates to some degree for their computational expense, which is generally higher. In granular methods, the discrete element method (DEM) (Cundall and Strack, 1979) is arguably the most popular for studying pyrometallurgical problems involving the motion of densely-packed media. DEM has been particularly successful in the blast furnace industry
Electronic copy available at: https://ssrn.com/abstract=3926638

3
with numerous applications to raceway operation, dead-man behaviour, and many others (Adema et al., 2010) (Miao et al., 2017) (Shao et al., 2020). The application of DEM to study ferroalloy SAF operations is still in its infancy, but given the parallels with blast furnace operations it is expected to grow rapidly as software tools mature further and computational power becomes cheaper and more accessible. An investigation into the applicability of DEM-based computational models for studying electrical phenomena in furnace burdens was therefore thought to be of some interest. In the work presented here a decision has been taken to focus on ferrochromium production, but the models are intentionally kept simple and generic in order to retain some applicability to other ferroalloys.
MODEL DESCRIPTION To extend standard DEM models to the study of ferroalloy furnace burdens, it is necessary to include a sub-model describing how particles are consumed in the burden as well as a calculation method for the resistance between electrodes. Nomenclature 𝑃𝑃 Power density, W/m3 𝑟𝑟 Radial distance from centre of electrode tip, m 𝛿𝛿 Dimensionless radius from centre of electrode tip 𝑅𝑅𝑒𝑒 Electrode radius, m 𝑇𝑇 Temperature, °C 𝜃𝜃 Dimensionless temperature 𝑇𝑇0 Temperature at electrode tip surface, °C 𝑇𝑇∞ Temperature of environment, °C 𝑝𝑝𝑐𝑐 Particle-per-particle consumption rate (reductant), 1/s 𝑝𝑝𝑚𝑚 Particle-per-particle consumption rate (ore), 1/s 𝐴𝐴 Burden consumption model constant, m3/J 𝐵𝐵 Burden consumption model constant, 1/s°C 𝑉𝑉 Electric potential, V 𝑅𝑅𝑒𝑒 Electrode radius, m 𝜎𝜎 Electrical conductivity, S/m 𝑗𝑗0 Current density at electrode tip surface, A/m2 𝛾𝛾 Electrical-to-process power efficiency factor 𝜅𝜅 Thermal conductivity, W/m°C 𝑟𝑟𝑖𝑖 Radius of feed particle i, m 𝑟𝑟𝑖𝑖𝑖𝑖 Separation distance between particles i and j, m Ω𝑖𝑖𝑖𝑖 Electrical resistance between particles i and j, Ω 𝑌𝑌 Young’s modulus, Pa 𝜈𝜈 Poisson’s ratio Particle consumption in the burden In an operating furnace, the input of power via the electrodes results in a distribution of temperature throughout the vessel. The temperature field ranges from hot zones in the vicinity of each electrode tip at 2000°C or more to the cooler burden surface and outer regions near the sidewalls which typically operate at much lower temperatures (Ranganathan and Godiwalla, 2001). The local power input and temperature fields through the burden are affected by a number of variables including electrode geometry and properties of the feed mixture, and
Electronic copy available at: https://ssrn.com/abstract=3926638

4
directly affect the local consumption rates of particles via various thermophysical and thermochemical processes. To simplify the problem we consider a feed mixture made up of only two types of particles: reductant (typically a metallurgical coke or anthracite) and ore (typically crushed rocky material or pelletised fines). Ore and reductant are able to react chemically with one another under suitable conditions to generate alloy and slag products, and the mix fed to the furnace is therefore maintained in a suitable ratio to obtain the preferred degree of thermochemical reaction. It is important to note that additional components such as quartz, limestone, and other fluxes and modifiers will be present in real furnace feeds; their volumes are however small and they can often be considered to behave similarly to ore particles, at least to a first approximation. It should also be noted that this simplistic reaction model would need to be extended in order to account for more complex multi-stage thermochemical reactions as are found in (among others) silicon and ferrosilicon processing, but such extensions are left for future work in this area. If we now assume that at every point in the burden there is a known local power density 𝑃𝑃 in W/m3 and local ambient temperature 𝑇𝑇 in °C, we can estimate a rate of consumption for both reductant and ore particles by considering the energy available for two different mechanisms:
• Reductant particles can be consumed by chemical reaction only, the available energy for which is proportional to the local power density via an empirical specific energy requirement. In addition reductant cannot be consumed if the local temperature is below 𝑇𝑇𝑟𝑟𝑟𝑟𝑟𝑟, a lower bound temperature for any solid-to-gas phase conversion reactions. In most reductive smelting processes, 𝑇𝑇𝑟𝑟𝑟𝑟𝑟𝑟 will be controlled predominantly by the Boudouard conversion reaction between CO and CO2.
• Ore particles can be consumed by melting only, the available energy for which is proportional to the difference between the ambient temperature and 𝑇𝑇𝑚𝑚𝑚𝑚𝑚𝑚, the melting point of the ore. Ore particles cannot be physically consumed below 𝑇𝑇𝑚𝑚𝑚𝑚𝑚𝑚, even though they are still able to react with the reductant via solid-solid or gas-solid mechanisms.
This has the effect of dividing the burden into three distinct zones based on local temperature, assuming that 𝑇𝑇𝑟𝑟𝑟𝑟𝑟𝑟 < 𝑇𝑇𝑚𝑚𝑚𝑚𝑚𝑚:
𝑝𝑝𝑐𝑐 = 0𝑝𝑝𝑚𝑚 = 0 𝑓𝑓𝑓𝑓𝑟𝑟 𝑇𝑇 < 𝑇𝑇𝑟𝑟𝑟𝑟𝑟𝑟 (1)
𝑝𝑝𝑐𝑐 = 𝐴𝐴𝑃𝑃𝑝𝑝𝑚𝑚 = 0 𝑓𝑓𝑓𝑓𝑟𝑟 𝑇𝑇𝑟𝑟𝑟𝑟𝑟𝑟 < 𝑇𝑇 < 𝑇𝑇𝑚𝑚𝑚𝑚𝑚𝑚 (2)
𝑝𝑝𝑐𝑐 = 𝐴𝐴𝑃𝑃𝑝𝑝𝑚𝑚 = 𝐵𝐵Δ𝑇𝑇𝑚𝑚𝑚𝑚𝑚𝑚
𝑓𝑓𝑓𝑓𝑟𝑟 𝑇𝑇 > 𝑇𝑇𝑚𝑚𝑚𝑚𝑚𝑚 (3)
Here, Δ𝑇𝑇𝑚𝑚𝑚𝑚𝑚𝑚 = 𝑇𝑇 − 𝑇𝑇𝑚𝑚𝑚𝑚𝑚𝑚. The particle reaction rates 𝑝𝑝𝑐𝑐 and 𝑝𝑝𝑚𝑚 for reductant and ore respectively are expressed in “particles per particle per second” units, and are therefore proportional to the probability that a particle of a particular type is consumed in any given time interval; this is particularly convenient for integration into DEM models. Although it is possible to obtain analytical expressions for the variables 𝐴𝐴 and 𝐵𝐵 in terms of the local burden composition and void fraction, particle sizes and densities, material thermodynamics, and heat transfer effects, for the present purpose it is more useful to think of them simply as empirical constants which are specific to a particular furnace operation and control the relative consumption rates of reductant and ore in the different zones.
Electronic copy available at: https://ssrn.com/abstract=3926638
5
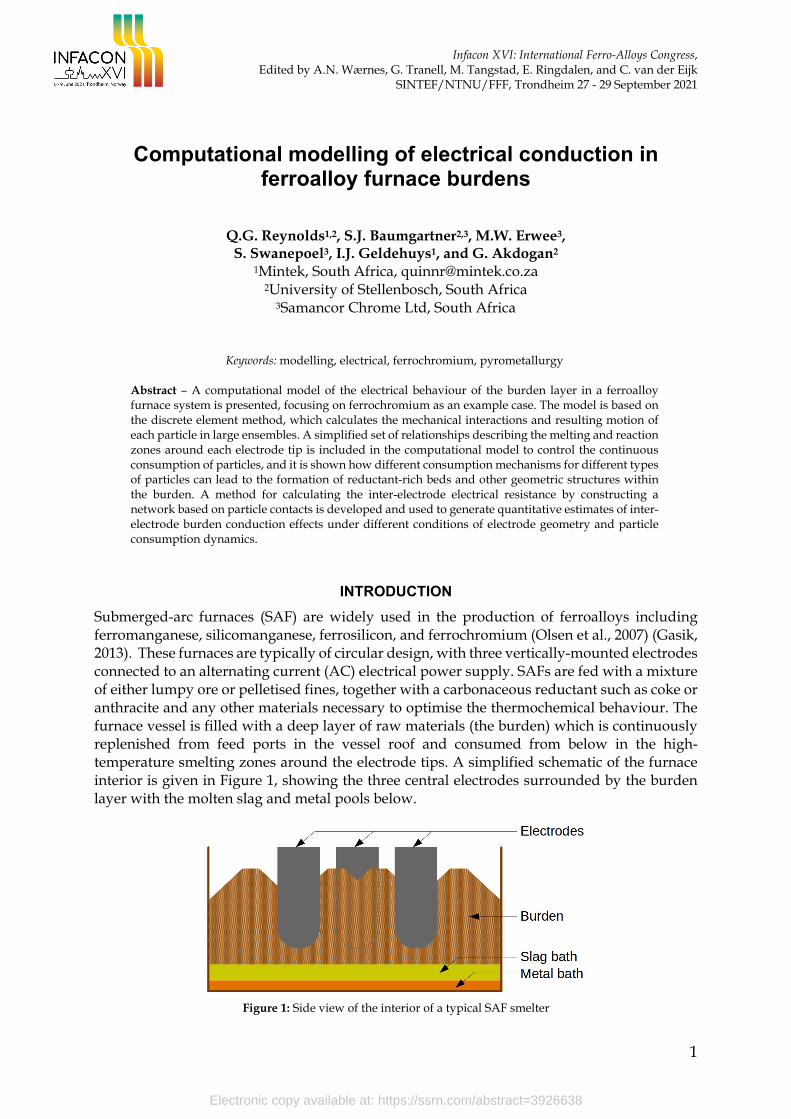
Power density and temperature fields around electrodes In order to close the particle consumption sub-models shown in equations (1)-(3) in a DEM furnace model, some knowledge of the power density and temperature fields in the furnace is required. This may be obtained from experiments, furnace measurements, or coupled models of varying levels of sophistication. For the purpose of this study a very simple a priori analytical model of power input and temperature distribution around each electrode is constructed in order to give a broad indication of the possible phenomena that arise. We consider that power is input into the burden by electrical conduction from the electrode tip, which is approximated as a spherical surface (see Figure 2). In addition, we assume that the bulk conductivity of the burden is constant and uniform, and low enough that magnetic induction effects are negligible. In this case, the electric potential field is given by the solution of Laplace’s equation (4) in spherical coordinates, with ground potential at 𝑟𝑟 = ∞. The result is shown in equation (5).
Figure 2: Approximated electrode tip region for analytical model, with indicative isosurfaces of electric potential
1
𝑟𝑟2𝑑𝑑𝑑𝑑𝑟𝑟
𝑟𝑟2𝑑𝑑𝑉𝑉𝑑𝑑𝑟𝑟
= 0 (4)
𝑉𝑉 =
𝑗𝑗0𝑅𝑅𝑒𝑒2
𝜎𝜎𝑟𝑟 (5)
The power density field may now be calculated directly from (5) using 𝜎𝜎(∇𝑉𝑉 ⋅ ∇𝑉𝑉). If we additionally define an efficiency factor 𝛾𝛾 as the fraction of the total electrical power that is available for smelting (typically 90-95% in modern furnaces), then 𝑃𝑃 in equations (1)-(3) is given by the expression in equation (6).
𝑃𝑃 =
𝛾𝛾𝑗𝑗02
𝜎𝜎𝑅𝑅𝑒𝑒𝑟𝑟4
(6)
Since the intention is to use these expressions empirically it is convenient to define the pre-multiplier constant as 𝑃𝑃0, the peak power density at the electrode tip. For convenience we also define a dimensionless radius 𝛿𝛿 = 𝑟𝑟/𝑅𝑅𝑒𝑒. This gives the non-dimensional expression (7). 𝑃𝑃
𝑃𝑃0=
1𝛿𝛿4
(7)
Electronic copy available at: https://ssrn.com/abstract=3926638

6
The remainder of the power input, given by the fraction 1 − 𝛾𝛾, acts to maintain the temperature gradient between the electrode tips and the extremities of the furnace. By again using the approximation of spherical symmetry around the electrode tip, and assuming that energy is only transported by thermal conduction, the resulting temperature field can be found from the solution of the energy transport equation (8). A zero-gradient boundary condition is imposed at the electrode surface (i.e. no energy is added or removed across the electrode surface), and 𝑇𝑇 =𝑇𝑇∞ at 𝑟𝑟 = ∞. The result obtained is shown in equation (9).
𝜅𝜅1𝑟𝑟2
𝑑𝑑𝑑𝑑𝑟𝑟
𝑟𝑟2𝑑𝑑𝑇𝑇𝑑𝑑𝑟𝑟
+(1 − 𝛾𝛾)𝑗𝑗02
𝜎𝜎 𝑅𝑅𝑒𝑒𝑟𝑟4
= 0 (8)
𝑇𝑇 =
(1 − 𝛾𝛾)𝑗𝑗02𝑅𝑅𝑒𝑒2
2𝜎𝜎𝜅𝜅2𝑅𝑅𝑒𝑒𝑟𝑟−
𝑅𝑅𝑒𝑒𝑟𝑟2 + 𝑇𝑇∞ (9)
As before, the intention is to use these expressions empirically. It is therefore more convenient to express (9) in terms of the peak temperature 𝑇𝑇0 at the electrode tip – this is shown in equation (10) in terms of 𝛿𝛿 and the classical dimensionless temperature 𝜃𝜃.
𝜃𝜃 =𝑇𝑇 − 𝑇𝑇∞𝑇𝑇0 − 𝑇𝑇∞
=2𝛿𝛿−
1𝛿𝛿2
(10)
Combined sub-model for particle consumption In order to create an empirical consumption model suitable for DEM simulations, equations (7) and (10) are substituted into equations (1)-(3). In this model the zone boundaries are concentric radii around each electrode tip defined by dimensionless temperatures 𝜃𝜃𝑟𝑟𝑟𝑟𝑟𝑟 and 𝜃𝜃𝑚𝑚𝑚𝑚𝑚𝑚. The final result is shown in equations (11)-(13).
𝑝𝑝𝑐𝑐 = 0𝑝𝑝𝑚𝑚 = 0 𝑓𝑓𝑓𝑓𝑟𝑟 𝜃𝜃 < 𝜃𝜃𝑟𝑟𝑟𝑟𝑟𝑟 (11)
𝑝𝑝𝑐𝑐 =
𝑝𝑝𝑐𝑐,𝑚𝑚𝑚𝑚𝑟𝑟
𝛿𝛿4𝑝𝑝𝑚𝑚 = 0
𝑓𝑓𝑓𝑓𝑟𝑟 𝜃𝜃𝑟𝑟𝑟𝑟𝑟𝑟 < 𝜃𝜃 < 𝜃𝜃𝑚𝑚𝑚𝑚𝑚𝑚 (12)
𝑝𝑝𝑐𝑐 =
𝑝𝑝𝑐𝑐,𝑚𝑚𝑚𝑚𝑟𝑟
𝛿𝛿4
𝑝𝑝𝑚𝑚 =𝑝𝑝𝑚𝑚,𝑚𝑚𝑚𝑚𝑟𝑟
1 − 𝜃𝜃𝑚𝑚𝑚𝑚𝑚𝑚
2𝛿𝛿−
1𝛿𝛿2
− 𝜃𝜃𝑚𝑚𝑚𝑚𝑚𝑚 𝑓𝑓𝑓𝑓𝑟𝑟 𝜃𝜃 > 𝜃𝜃𝑚𝑚𝑚𝑚𝑚𝑚 (13)
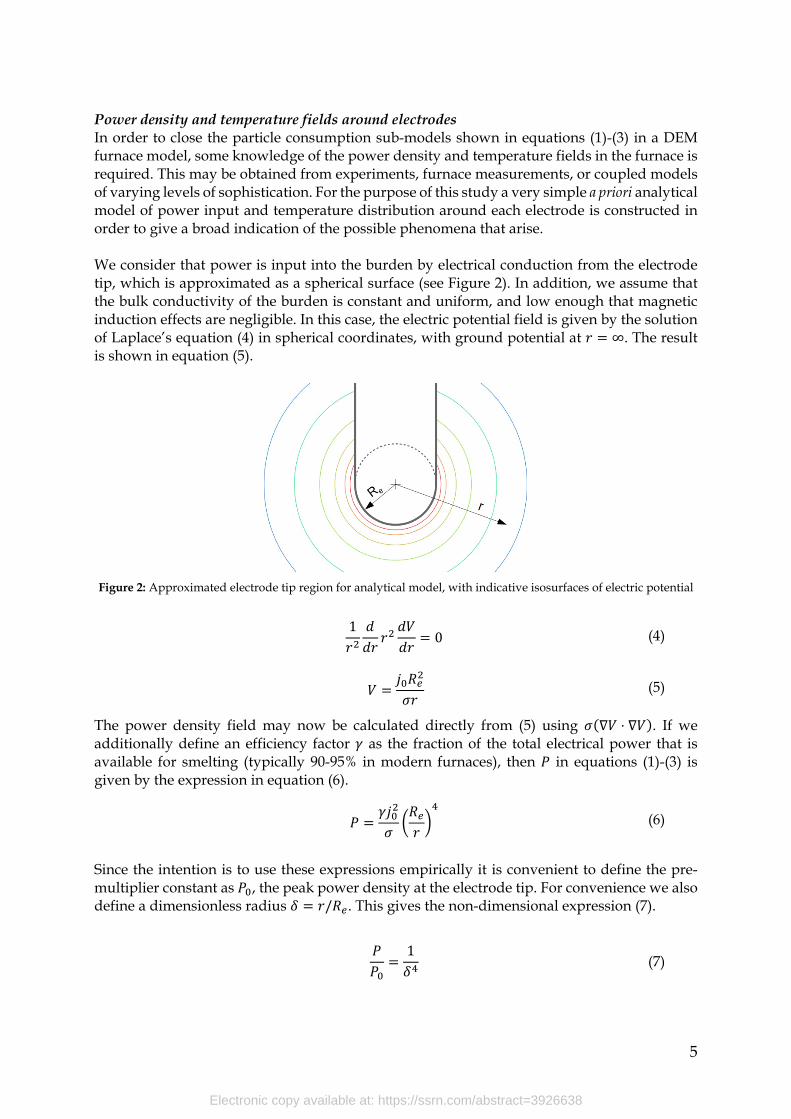
As before we have lumped various empirical constants together for simplicity. This allows expression of the particle consumption rates in terms of the peak rates at the electrode surface (𝛿𝛿 = 1), 𝑝𝑝𝑐𝑐,𝑚𝑚𝑚𝑚𝑟𝑟 and 𝑝𝑝𝑚𝑚,𝑚𝑚𝑚𝑚𝑟𝑟 for reductant and ore particles respectively. The particle consumption model is characterised by four empirical parameters. While this is of course a drastic oversimplification of real furnace burdens, it is nonetheless a useful phenomenological model and is able to display a range of interesting effects. An example of this is shown in Figure 3 – in cases (a) and (b) there is preferential consumption of ore particles near to the electrode, which would be expected to create a reductant-rich bed. In (c), the burden around the electrode is likely to evolve a complex structure with alternating reductant-rich and ore-rich regions. In (d) the rate of consumption of the reductant particles exceeds that of
Electronic copy available at: https://ssrn.com/abstract=3926638
7
the ore everywhere; in this burden, ore particles would be expected to build up in excess around the electrode. The volume-weighted integral of the curves shown can be interpreted as the overall particle-per-particle consumption rate in the furnace in each case, and is therefore approximately proportional to the production throughput.
Figure 3: Particle consumption rates as a function of dimensionless radius. Parameters 𝜽𝜽𝒓𝒓𝒓𝒓𝒓𝒓 and 𝜽𝜽𝒎𝒎𝒎𝒎𝒎𝒎 are fixed at
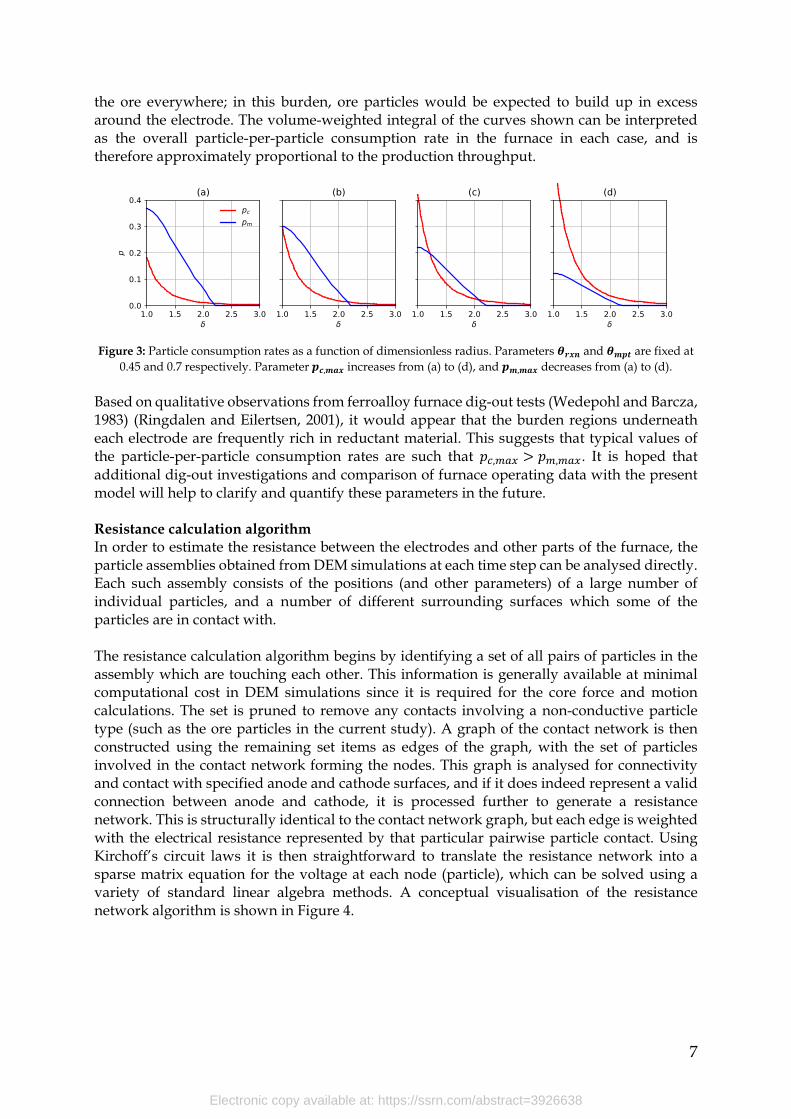
0.45 and 0.7 respectively. Parameter 𝒎𝒎𝒄𝒄,𝒎𝒎𝒎𝒎𝒓𝒓 increases from (a) to (d), and 𝒎𝒎𝒎𝒎,𝒎𝒎𝒎𝒎𝒓𝒓 decreases from (a) to (d). Based on qualitative observations from ferroalloy furnace dig-out tests (Wedepohl and Barcza, 1983) (Ringdalen and Eilertsen, 2001), it would appear that the burden regions underneath each electrode are frequently rich in reductant material. This suggests that typical values of the particle-per-particle consumption rates are such that 𝑝𝑝𝑐𝑐,𝑚𝑚𝑚𝑚𝑟𝑟 > 𝑝𝑝𝑚𝑚,𝑚𝑚𝑚𝑚𝑟𝑟. It is hoped that additional dig-out investigations and comparison of furnace operating data with the present model will help to clarify and quantify these parameters in the future. Resistance calculation algorithm In order to estimate the resistance between the electrodes and other parts of the furnace, the particle assemblies obtained from DEM simulations at each time step can be analysed directly. Each such assembly consists of the positions (and other parameters) of a large number of individual particles, and a number of different surrounding surfaces which some of the particles are in contact with. The resistance calculation algorithm begins by identifying a set of all pairs of particles in the assembly which are touching each other. This information is generally available at minimal computational cost in DEM simulations since it is required for the core force and motion calculations. The set is pruned to remove any contacts involving a non-conductive particle type (such as the ore particles in the current study). A graph of the contact network is then constructed using the remaining set items as edges of the graph, with the set of particles involved in the contact network forming the nodes. This graph is analysed for connectivity and contact with specified anode and cathode surfaces, and if it does indeed represent a valid connection between anode and cathode, it is processed further to generate a resistance network. This is structurally identical to the contact network graph, but each edge is weighted with the electrical resistance represented by that particular pairwise particle contact. Using Kirchoff’s circuit laws it is then straightforward to translate the resistance network into a sparse matrix equation for the voltage at each node (particle), which can be solved using a variety of standard linear algebra methods. A conceptual visualisation of the resistance network algorithm is shown in Figure 4.
Electronic copy available at: https://ssrn.com/abstract=3926638

8
Figure 4: A conceptual diagram showing the construction of the resistance network in a bed containing
conductive (red) and non-conductive (blue) particles Particles in contact share a surface contact area, and the electrical resistance between them may be estimated by integrating over the volume of material between the particle centre and the contact face. The geometry of a pair of spherical particles 𝑖𝑖 and 𝑗𝑗 with radii 𝑟𝑟𝑖𝑖 and 𝑟𝑟𝑖𝑖 and separated by a centre-to-centre distance 𝑟𝑟𝑖𝑖𝑖𝑖 < 𝑟𝑟𝑖𝑖 + 𝑟𝑟𝑖𝑖 is shown in Figure 5.
Figure 5: Two spherical particles in contact
Assuming that the current density vectors are parallel to the axis of contact at all points inside both, the nett resistance Ω𝑖𝑖𝑖𝑖 between the particle centres is given by the relationship shown in (14).
Ω𝑖𝑖𝑖𝑖 =1
𝜋𝜋𝜎𝜎𝑖𝑖𝑟𝑟𝑖𝑖arctanh
𝑟𝑟𝑖𝑖2 − 𝑟𝑟𝑖𝑖2 + 𝑟𝑟𝑖𝑖𝑖𝑖2
2𝑟𝑟𝑖𝑖𝑟𝑟𝑖𝑖𝑖𝑖 +
1 𝜋𝜋𝜎𝜎𝑖𝑖𝑟𝑟𝑖𝑖
arctanh 𝑟𝑟𝑖𝑖2 − 𝑟𝑟𝑖𝑖2 + 𝑟𝑟𝑖𝑖𝑖𝑖2
2𝑟𝑟𝑖𝑖𝑟𝑟𝑖𝑖𝑖𝑖 (14)
Here 𝜎𝜎𝑖𝑖 and 𝜎𝜎𝑖𝑖 are the electrical conductivities of the particle material for particles 𝑖𝑖 and 𝑗𝑗 respectively. These relationships may be used directly to calculate the resistance associated with each particle-to-particle contact in the resistance network. In general, there will be a second component of the particle-to-particle resistance due to the contact resistance at the shared surface between them. This arises due to micro-scale irregularities on the particle surfaces which reduce the effective contact area and create additional constrictions for the current path between the two particles. This parameter remains difficult to quantify however, with a number of competing theories for the dependence of the contact resistance on bed and particle properties (Dijs, 1979) (Eidem et al., 2009). In addition it should be noted that the parts of the particle bed participating in the electrical conduction network are under significant static pressure due to the weight of the burden above, and are also at temperatures at which the particles are mechanically softer and more susceptible to breakage. In particular it is observed in (Eidem et al., 2009) that contact resistance of carbonaceous reductants may be significantly reduced under such conditions due to brittle failure of the surface irregularities. The decision was therefore taken to ignore contact
Electronic copy available at: https://ssrn.com/abstract=3926638

9
resistances in the present model, although expression (14) may easily be extended to accommodate this in the future. Contact area correction It is standard practice in DEM simulations to use artificially low values for mechanical properties such as the Young’s modulus of the material in order to improve numerical stability and performance. This has the effect of altering the contact geometry between particles on which the particle-to-particle resistance Ω𝑖𝑖𝑖𝑖 depends. This must be corrected by modifying the distance between particle centres assuming invariance of the contact force, which in the case of spherical particles is given by a Hertzian force law. The result is shown in equation (15).
Δ𝑖𝑖𝑖𝑖,𝑚𝑚𝑟𝑟𝑡𝑡𝑒𝑒
Δ𝑖𝑖𝑖𝑖,𝑠𝑠𝑖𝑖𝑚𝑚=
𝑌𝑌𝑖𝑖𝑖𝑖,𝑠𝑠𝑖𝑖𝑚𝑚
𝑌𝑌𝑖𝑖𝑖𝑖,𝑚𝑚𝑟𝑟𝑡𝑡𝑒𝑒
23 (15)
Δ𝑖𝑖𝑖𝑖 = 𝑟𝑟𝑖𝑖𝑖𝑖 − 𝑟𝑟𝑖𝑖 − 𝑟𝑟𝑖𝑖 ,
1𝑌𝑌𝑖𝑖𝑖𝑖
=1 − 𝜈𝜈𝑖𝑖2
𝑌𝑌𝑖𝑖+
1 − 𝜈𝜈𝑖𝑖2
𝑌𝑌𝑖𝑖 (16)
Here 𝑌𝑌𝑖𝑖 and 𝑌𝑌𝑖𝑖 are the Young’s moduli of the two particles participating in the contact, and 𝜈𝜈𝑖𝑖 and 𝜈𝜈𝑖𝑖 are their Poisson’s ratios. The subscript 𝑠𝑠𝑖𝑖𝑠𝑠 refers to values in the DEM simulation while 𝑡𝑡𝑟𝑟𝑡𝑡𝑡𝑡 are the actual values. The correction in (15) is routinely used in DEM simulations of other contact-sensitive phenomena such as thermal conduction (CFDEMresearch GmbH, 2021), and is performed on each particle-particle pair prior to the resistance calculation. Software implementation The DEM implementation available in the open-source computational modelling package LIGGGHTS-PUBLIC® (CFDEMresearch GmbH, 2021) was used as a framework for the present model. LIGGGHTS is based on an explicit time-step soft sphere interaction algorithm, and implements a wide range of standard collision and friction force models. It is flexible and extensible, and permits easy inclusion of additional models for subcomponents such as the specialised particle consumption models described above. In order to perform resistance calculations based on the particle assemblies obtained from DEM, the electrical contact network calculation algorithm described above was implemented as a post-processor module for Python (Python Software Foundation, 2020). Network construction and manipulation methods were implemented using the NetworkX package (NetworkX, 2020). Optimised sparse matrix algorithms for efficient solution of the linear system described by the resistance network were provisioned with the SciPy package (SciPy, 2021). The resistance calculator was wrapped in automation scripts using the mpi4py package (mpi4py, 2020) to process large volumes of calculations in parallel.
RESULTS AND DISCUSSION A computational model of a generic SAF used for the smelting of ferrochromium was constructed to demonstrate the electrical modelling methodology. The geometry of the unit is shown in Figure 6, indicating the position of the feedports and the electrodes. Symmetry between the electrodes is assumed, which allows the model region to be reduced to a 1/6 section of the furnace as shown.
Electronic copy available at: https://ssrn.com/abstract=3926638

10
The model region starts empty, and is rapidly filled by particles entering the feedports under gravity. Once the level of the burden reaches the feedports the furnace enters a choke-fed condition in which the feed rate matches the rate of consumption in the burden. After this state is reached, the simulation is run for an additional period of time in order to allow the burden configuration to approach steady state.
Figure 6: SAF model used in DEM simulations (l) top view schematic of furnace showing electrode and feedport locations with model region given by heavy blue line, (r) three-dimensional view of model region
In order to calculate inter-electrode resistances from the DEM simulation results for each model case, two separate burden conduction modes were considered. The first is direct electrode-to-electrode conduction by particle contact in the burden layer only, while the second is conduction through the slag and metal bath at the base of the furnace, bypassing the burden. This amounts to setting the electrode surface as the cathode but choosing different anode surfaces in the resistance calculation algorithm (the symmetry plane between electrodes in the former case, the furnace base in the latter). This is shown conceptually in Figure 7.
Figure 7: Different modes of inter-electrode conduction, (l) electrode-to-electrode (r) electrode-bath-electrode
Multiple sources of information were collated to identify a representative set of parameters for the computational model (Dijs, 1979) (Sato, 1999) (Ranganathan and Godiwalla, 2001) (Eidem et al., 2007) (Eidem et al., 2009) (Steenkamp et al., 2019). These were used as the reference or base case model, and are shown in Table 1. The final DEM model was reduced in linear scale by a factor of two to reduce the computational cost, with appropriate corrections applied to the calculated electrical resistances so that they remained representative of the full-scale furnace. The models were
Electronic copy available at: https://ssrn.com/abstract=3926638

11
parallelised on 15 nodes (360 compute cores) at the CHPC national supercomputer centre in South Africa, and each simulation took about 24 hours to complete. Models were run for 2000 s of simulated time, representing approximately 7 days of real-world operation.
Table 1: Base case model parameters
Parameter Symbol Value Furnace vessel radius 𝑅𝑅𝑓𝑓 6 m Electrode radius 𝑅𝑅𝑒𝑒 0.75 m Electrode pitch circle radius 𝑅𝑅𝑚𝑚𝑐𝑐𝑝𝑝 2.25 m Electrode tip height 𝐻𝐻𝑒𝑒 0.75 m Inner feedport ring radius 𝑅𝑅𝑚𝑚𝑖𝑖 1.5 m Outer feedport ring radius 𝑅𝑅𝑚𝑚𝑝𝑝 4 m Maximum burden height 𝐻𝐻𝑓𝑓 3.5 m Reductant feed mass fraction 𝑥𝑥𝑐𝑐 0.2 Reductant particle diameter 𝑑𝑑𝑐𝑐 0.02 m Reductant particle density 𝜌𝜌𝑐𝑐 900 kg/m3 Ore particle diameter 𝑑𝑑𝑚𝑚 0.02 m Ore particle density 𝜌𝜌𝑚𝑚 1800 kg/m3 Young’s modulus (all particles, DEM simulation) 𝑌𝑌𝑠𝑠𝑖𝑖𝑚𝑚 5 MPa Young’s modulus (reductant, actual) 𝑌𝑌𝑚𝑚𝑟𝑟𝑡𝑡𝑒𝑒 400 MPa Poisson’s ratio (all particles) 𝜈𝜈 0.25 Coefficient of friction (all particles) 𝐶𝐶𝐶𝐶𝐶𝐶 0.75 Coefficient of restitution (all particles) 𝐶𝐶𝐶𝐶𝑅𝑅 0.75 Dimensionless reaction temperature 𝜃𝜃𝑟𝑟𝑟𝑟𝑟𝑟 0.45 Dimensionless ore melting temperature 𝜃𝜃𝑚𝑚𝑚𝑚𝑚𝑚 0.7 Peak reductant consumption rate 𝑝𝑝𝑐𝑐,𝑚𝑚𝑚𝑚𝑟𝑟 0.3/s Peak ore consumption rate 𝑝𝑝𝑚𝑚,𝑚𝑚𝑚𝑚𝑟𝑟 0.3/s Reductant electrical conductivity 𝜎𝜎𝑐𝑐 5000 S/m
Base case model Selected visualisations of the particle assembly in the model region at various points in time during the DEM simulation are shown in Figure 8. It can be seen that the structure of the burden, particularly in the vicinity of the electrodes, develops some significant non-homogeneity. A reductant-rich region is formed immediately around and below the electrode which facilitates electrical contact between the electrodes and the molten bath, while immediately around it is a reductant-depleted region close to the furnace hearth. It is debatable whether this “ore bed” is realistic given the highly simplified particle consumption models in use, but some depletion of the reductant in the bulk of the burden away from the electrodes is likely in ferrochromium smelting. By mirroring the particle assembly around appropriate symmetry planes it is possible to create a visualisation of the complete furnace, as shown in Figure 9. The segregation of particles based on the location of the feedports is clearly visible, with less dense reductant particles preferentially separating to the boundaries of feed cells and being drawn down into the burden to create complex three-dimensional structures. In the present work the only mechanical difference between reductant and ore particles is their density; it is expected that differences in other particle properties such as size and shape would act to exaggerate or ameliorate this effect in different ways.
Electronic copy available at: https://ssrn.com/abstract=3926638

12
(a) 200 s
(b) 400 s
(c) 1000 s
(d) 2000 s
Figure 8: Evolution of particle assembly in base case simulation (red particles are reductant, blue are ore)
Figure 9: Particle assembly at 2000 s visualised as full furnace model, (l) all particles (r) top view with ore particles
removed The results of post-processing the DEM results to calculate inter-electrode resistances are shown in Figure 10. It can be seen that the conduction mode between electrodes will be dominated by conduction via the molten bath, with this component having a much lower resistance than direct conduction through the burden. This is as a result of both the proximity of the electrode tips to the base of the furnace as well as the formation of a reductant-rich bed under the electrodes.
Electronic copy available at: https://ssrn.com/abstract=3926638

13
Figure 10: Inter-electrode resistances in base case model for different conduction modes
The average value of the electrode-bath-electrode resistance calculate over the last 500 s of the simulation is 1.56 mΩ, with a standard deviation of 0.0301 mΩ. The average value of the electrode-to-electrode resistance is 13.2 mΩ, with a standard deviation of 0.535 mΩ. Many of the input parameters for the model are subject to variation across wide ranges depending on the type of reductant in use. By way of example the electrical conductivity of metallurgical cokes has been observed to range between 2500 and 10000 S/m depending on temperature and source (Eidem et al., 2007), and their Young’s moduli may vary an order of magnitude or more between 250 and 15000 MPa (Sato, 1999) (Eidem et al., 2009). To assess the influence of these values on the base case model, average resistances were recalculated using these ranges. The results are shown in Figure 11 and Figure 12.
Figure 11: Sensitivity of predicted resistances to electrical conductivity of reductant particles
Furnace resistances are seen to be inversely proportional to conductivity, which is not surprising given the fundamentally linear nature of resistance. Resistances increase with increasing Young’s modulus, although the dependence is very shallow especially at higher values. This suggests that while it is important to obtain accurate values of 𝜎𝜎𝑐𝑐 for this type of calculation, 𝑌𝑌𝑚𝑚𝑟𝑟𝑡𝑡𝑒𝑒 is less critical and approximate values will generally suffice. Some comparison against real-world furnace operations is instructive at this point. 24 hours of electrical data were obtained from a period of relatively stable operation of a 48 MVA FeCr smelter of similar design to the base case model, and the average inter-electrode resistances
Electronic copy available at: https://ssrn.com/abstract=3926638
14
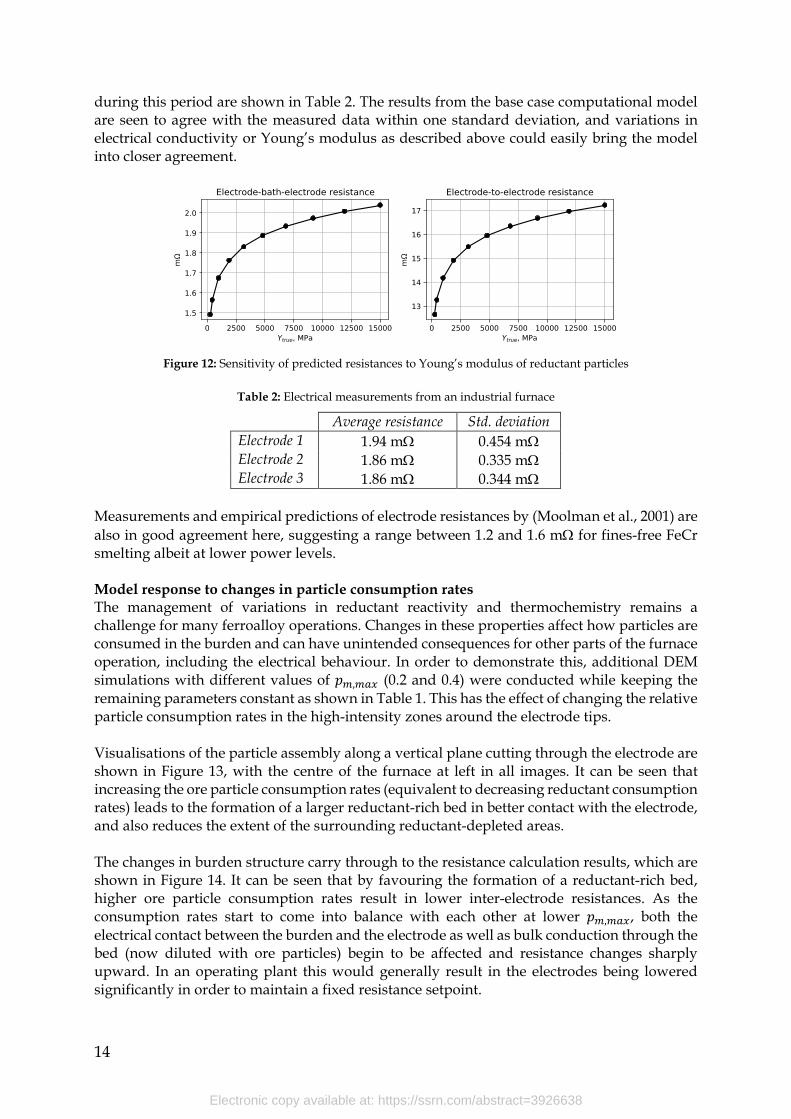
during this period are shown in Table 2. The results from the base case computational model are seen to agree with the measured data within one standard deviation, and variations in electrical conductivity or Young’s modulus as described above could easily bring the model into closer agreement.
Figure 12: Sensitivity of predicted resistances to Young’s modulus of reductant particles
Table 2: Electrical measurements from an industrial furnace
Average resistance Std. deviation Electrode 1 1.94 mΩ 0.454 mΩ Electrode 2 1.86 mΩ 0.335 mΩ Electrode 3 1.86 mΩ 0.344 mΩ
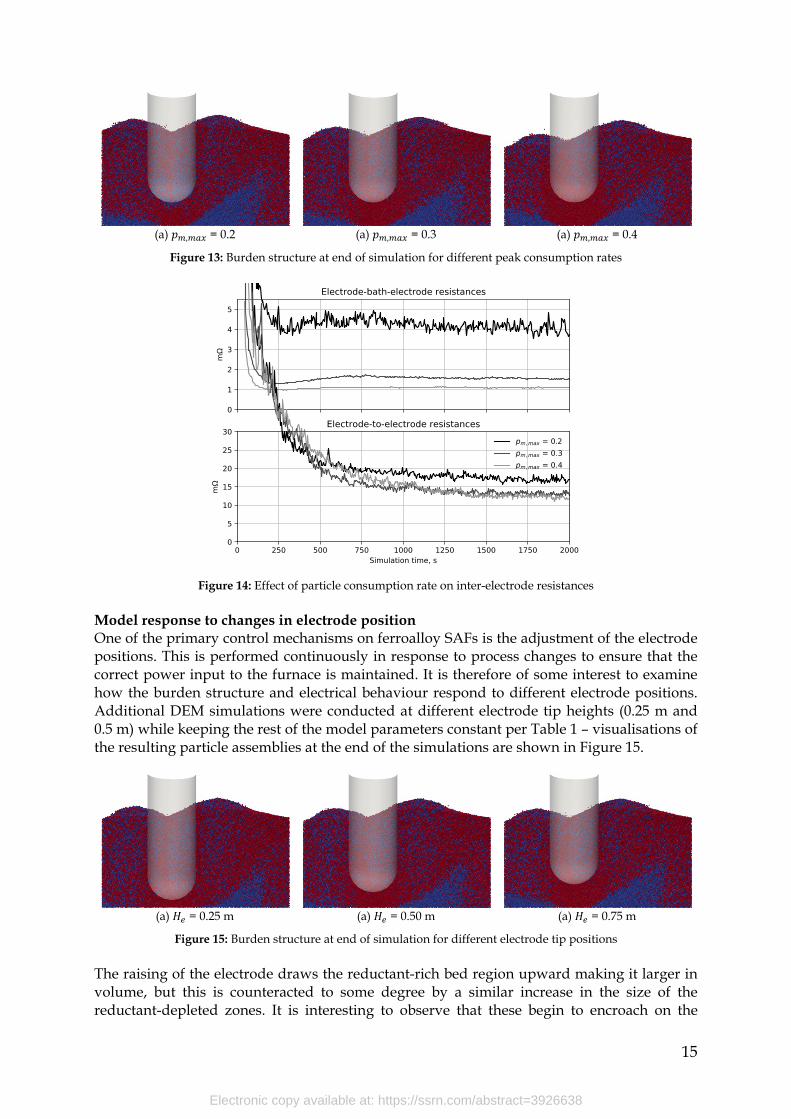
Measurements and empirical predictions of electrode resistances by (Moolman et al., 2001) are also in good agreement here, suggesting a range between 1.2 and 1.6 mΩ for fines-free FeCr smelting albeit at lower power levels. Model response to changes in particle consumption rates The management of variations in reductant reactivity and thermochemistry remains a challenge for many ferroalloy operations. Changes in these properties affect how particles are consumed in the burden and can have unintended consequences for other parts of the furnace operation, including the electrical behaviour. In order to demonstrate this, additional DEM simulations with different values of 𝑝𝑝𝑚𝑚,𝑚𝑚𝑚𝑚𝑟𝑟 (0.2 and 0.4) were conducted while keeping the remaining parameters constant as shown in Table 1. This has the effect of changing the relative particle consumption rates in the high-intensity zones around the electrode tips. Visualisations of the particle assembly along a vertical plane cutting through the electrode are shown in Figure 13, with the centre of the furnace at left in all images. It can be seen that increasing the ore particle consumption rates (equivalent to decreasing reductant consumption rates) leads to the formation of a larger reductant-rich bed in better contact with the electrode, and also reduces the extent of the surrounding reductant-depleted areas. The changes in burden structure carry through to the resistance calculation results, which are shown in Figure 14. It can be seen that by favouring the formation of a reductant-rich bed, higher ore particle consumption rates result in lower inter-electrode resistances. As the consumption rates start to come into balance with each other at lower 𝑝𝑝𝑚𝑚,𝑚𝑚𝑚𝑚𝑟𝑟, both the electrical contact between the burden and the electrode as well as bulk conduction through the bed (now diluted with ore particles) begin to be affected and resistance changes sharply upward. In an operating plant this would generally result in the electrodes being lowered significantly in order to maintain a fixed resistance setpoint.
Electronic copy available at: https://ssrn.com/abstract=3926638
15
(a) 𝑝𝑝𝑚𝑚,𝑚𝑚𝑚𝑚𝑟𝑟 = 0.2
(a) 𝑝𝑝𝑚𝑚,𝑚𝑚𝑚𝑚𝑟𝑟 = 0.3
(a) 𝑝𝑝𝑚𝑚,𝑚𝑚𝑚𝑚𝑟𝑟 = 0.4
Figure 13: Burden structure at end of simulation for different peak consumption rates
Figure 14: Effect of particle consumption rate on inter-electrode resistances
Model response to changes in electrode position One of the primary control mechanisms on ferroalloy SAFs is the adjustment of the electrode positions. This is performed continuously in response to process changes to ensure that the correct power input to the furnace is maintained. It is therefore of some interest to examine how the burden structure and electrical behaviour respond to different electrode positions. Additional DEM simulations were conducted at different electrode tip heights (0.25 m and 0.5 m) while keeping the rest of the model parameters constant per Table 1 – visualisations of the resulting particle assemblies at the end of the simulations are shown in Figure 15.
(a) 𝐻𝐻𝑒𝑒 = 0.25 m
(a) 𝐻𝐻𝑒𝑒 = 0.50 m
(a) 𝐻𝐻𝑒𝑒 = 0.75 m
Figure 15: Burden structure at end of simulation for different electrode tip positions The raising of the electrode draws the reductant-rich bed region upward making it larger in volume, but this is counteracted to some degree by a similar increase in the size of the reductant-depleted zones. It is interesting to observe that these begin to encroach on the
Electronic copy available at: https://ssrn.com/abstract=3926638

16
contact area between the reductant bed and the molten bath, and in extreme cases could cause the conduction path between electrode and bath to be broken altogether; this effect may however be an artefact of the simplified particle consumption model in use here and would require more detailed study. Resistance calculation results for the electrode tip position cases are shown in Figure 16. It can be seen that for these relatively low electrode positions, the electrode-bath-electrode resistances respond monotonically with increasing resistance as the electrode is raised. In this regime electrode position is therefore a good control variable, although more nonlinear effects may become evident at higher positions as mentioned earlier.
Figure 16: Effect of electrode tip height on inter-electrode resistances
It is interesting to consider the impact of certain material and furnace properties on practical aspects of the operation in light of these results. For example, if the chemical reactivity of the reductant used were to change (effectively increasing or decreasing the value of 𝑝𝑝𝑐𝑐,𝑚𝑚𝑚𝑚𝑟𝑟), this would have a knock-on effect to the amount of reductant that would accumulate underneath the electrode tips. If the furnace is being controlled to a resistance setpoint, this would then translate to changes in the operating position of the tips. Broadly speaking, more reactive reductants would lead to smaller reductant beds and hence lower electrode tip positions, and vice versa.
CONCLUSIONS A computational model of particle flow in submerged-arc furnace burdens was successfully developed using the discrete element method. The model was extended with a simplified phenomenological description of particle consumption in the burden during ferroalloy smelting, and combined with post-processing techniques to enable calculation of inter-electrode resistances directly from the structure of the particle bed forming the burden layer. Simulation of a typical ferrochromium furnace operation showed relatively good agreement with values obtained from industrial measurements. The bulk of the electrical conduction between electrodes was seen to occur via the molten bath rather than directly through the burden. Further examination of the results showed that complex structures can develop in the burden over time as a result of asymmetries between the rate of consumption of different
Electronic copy available at: https://ssrn.com/abstract=3926638

17
components of the feed mixture, and also differences in the mechanical properties of particles. In particular it was observed that a reductant-rich bed forms readily at the tip of each electrode if the reductant consumption rate is low in comparison to the other feed components, and this may be complemented by outer parts of the burden becoming reductant-depleted. Significant particle segregation due to density differences between reductant and ore particles was also observed in the bulk of the burden away from the electrode regions. The impact of process changes such as altering the reductant reactivity and moving the electrode tip positions was examined by conducting additional simulations, and showed that these parameters are able to have a significant effect on the inter-electrode resistances in the furnace. The current work represents a potential starting point as there remains a great deal to be done. Additional validation and testing of the model against industrial plant data is required first and foremost, in particular to test whether the electrical behaviour during disruptive events such as rapid electrode movements or furnace tapping can be successfully predicted. In parallel with this the particle consumption model can be improved considerably beyond the oversimplified analytical approach used here; the inclusion of a thermochemical reaction model with more detail would improve matters, as would the use of more accurate thermal and power density profiles through the burden. The latter can be achieved via stand-alone continuum models, granular conduction models integrated with DEM, or fully-coupled computational fluid dynamics simulations, although the computational cost associated with each of these would need to be assessed in terms of practicality and currently-available resources.
ACKNOWLEDGEMENTS This paper is published by permission of Mintek and Samancor Chrome Ltd. The authors acknowledge the Centre for High Performance Computing (CHPC), South Africa, for providing computational resources to this research project.
REFERENCES Adema, A.T., Yang, Y., Boom, R., 2010. Discrete Element Method-Computational Fluid Dynamic Simulation of the
Materials Flow in an Iron-making Blast Furnace. ISIJ International 50, 954–961. https://doi.org/10.2355/isijinternational.50.954
CFDEMresearch GmbH, 2021. LIGGGHTS Open Source Discrete Element Particle Simulation Code [WWW Document]. URL https://www.cfdem.com/liggghts-open-source-discrete-element-method-particle-simulation-code (accessed 1.15.21).
Cundall, P.A., Strack, O.D.L., 1979. A discrete numerical model for granular assemblies. Géotechnique 29, 47–65. https://doi.org/10.1680/geot.1979.29.1.47
Dijs, H.M., 1979. A laboratory investigation of reducing agents for use in the electric smelting industry (Internal Report No. 1997). NIM, Randburg, South Africa.
Eidem, P.A., Runde, M., Tangstad, M., Bakken, J.A., Zhou, Z.Y., Yu, A.B., 2009. Effect of Contact Resistance on Bulk Resistivity of Dry Coke Beds. Metallurgical and Materials Transactions B 40, 388–396. https://doi.org/10.1007/s11663-009-9235-1
Eidem, P.A., Tangstad, M., Bakken, J.A., 2008. Determination of Electrical Resistivity of Dry Coke Beds. Metallurgical and Materials Transactions B 39, 7–15. https://doi.org/10.1007/s11663-007-9105-7
Eidem, P.A., Tangstad, M., Bakken, J.A., 2007. Measurement of material resistivity and contact resistance of metallurgical coke, in: INFACON XI 2007: Innovations in the Ferroalloys Industry. Presented at the 11th International Ferroalloys Congress INFACON XI, IFAPA, New Delhi, India, pp. 561–571.
Eidem, P.A., Tangstad, M., Bakken, J.A., Ishak, R., 2010. Influence of coke particle size on the electrical resistivity of coke beds, in: INFACON XII. Presented at the 12th International Ferroalloys Congress INFACON XII, Outotec Oy, Helsinki, Finland, pp. 349–358.
Gasik, M. (Ed.), 2013. Handbook of ferroalloys: theory and technology. Elsevier/Butterworth-Heinemann, Amsterdam.
Electronic copy available at: https://ssrn.com/abstract=3926638

18
Miao, Z., Zhou, Z., Yu, A.B., Shen, Y., 2017. CFD-DEM simulation of raceway formation in an ironmaking blast furnace. Powder Technology 314, 542–549. https://doi.org/10.1016/j.powtec.2016.11.039
Moolman, A.L., Rennie, M.S., Brereton-Stiles, P., 2001. Experiences in operation of various electric-arc furnaces under resistance control, in: Proceedings of the Ninth International Ferroalloys Congress and the Manganese 2001 Health Issues Symposium. Presented at the 9th International Ferroalloys Congress INFACON IX, The Ferroalloys Association, Quebec City, Canada, pp. 103–107.
mpi4py, 2020. Python bindings for MPI [WWW Document]. URL https://pypi.org/project/mpi4py/ (accessed 12.10.20).
NetworkX, 2020. NetworkX: Network analysis in Python [WWW Document]. URL https://networkx.org/ (accessed 1.15.21).
Olsen, S.E., Tangstad, M., Lindstad, T., 2007. Production of Manganese Ferroalloys. Tapir Academic Press, Trondheim, Norway.
Python Software Foundation, 2020. Python [WWW Document]. URL https://www.python.org/ (accessed 2.3.20). Ranganathan, S., Godiwalla, K.M., 2001. Effect of preheat, bed porosity, and charge control on thermal response
of submerged arc furnace producing ferrochromium. Ironmaking & Steelmaking 28, 273–278. Ringdalen, E., Eilertsen, J., 2001. Excavation of a 54 MYA HC-ferrochromium furnace, in: Proceedings of the
Ninth International Ferroalloys Congress and the Manganese 2001 Health Issues Symposium. Presented at the 9th International Ferroalloys Congress INFACON IX, The Ferroalloys Association, Quebec City, Canada, pp. 166–173.
Sato, H., 1999. Strength of metallurgical coke in relation to fissure formation (Ph. D.). Loughborough University, United Kingdom.
SciPy, 2021. SciPy [WWW Document]. URL https://www.scipy.org/ (accessed 1.15.21). Shao, L., Xiao, Q., Zhang, C., Zou, Z., Saxén, H., 2020. Dead-Man Behavior in the Blast Furnace Hearth—A Brief
Review. Processes 8, 1335. https://doi.org/10.3390/pr8111335 Sridhar, E., Lahiri, A.K., 1994. Steady state model for current and temperature distributions in an electric smelting
furnace. Steel Research 65, 433–437. https://doi.org/10.1002/srin.199401189 Steenkamp, J.D., Reynolds, Q.G., Erwee, M.W., Swanepoel, S., 2019. Freeze Lining Formation in Submerged-Arc
Furnaces Producing Ferrochrome Alloy in South Africa, in: The Minerals, Metals & Materials Series (Eds) TMS 2019 148th Annual Meeting & Exhibition Supplemental Proceedings. Presented at the TMS Annual Meeting and Exhibition 2019, The Minerals, Metals & Materials Society, Phoenix AZ, USA, pp. 1161–1180.
Wedepohl, A., Barcza, N.A., 1983. The digout of a ferrochrome furnace. Special Publication Geological Society South Africa 7, 351–363.
Yang, Y., Xiao, Y., Reuter, M.A., 2004. Analysis of Transport Phenomena in Submerged Arc Furnace for Ferrochrome Production, in: Proceedings of the Tenth International Ferroalloys Congress: Transformation through Technology. Presented at the 10th International Ferroalloys Congress INFACON X, SAIMM, Cape Town, South Africa, pp. 15–25.
Quinn Reynolds Technical Specialist, Mintek Dr Reynolds has worked in the pyrometallurgy division at Mintek for the past 23 years. He holds degrees in chemical engineering and applied mathematics, and his research focuses on the application of advanced numerical and computational modelling methods to complex problems arising in the field of pyrometallurgical engineering.
Electronic copy available at: https://ssrn.com/abstract=3926638