Embed Size (px)
Citation preview

Computational modeling of malarial parasite protein interactions reveals function on a genome-wide scale
Chris StoeckertDept. of GeneticsCenter for BioinformaticsUniversity of Pennsylvania School of MedicinePrinceton PICASso talkOct. 18, 2006
Genomic Data Integration
• Inferring relationships between genes and proteins– Databases– Knowledge representation– Computational models
• Application to problem of genome annotation

Conventional approach to genome sequence
annotation…ACTGCGTATGCGTGCCTAGCTAGCATCGATCGATGCATCGATGCATCGATGCATCG;;;
Predict gene models
…ACTGCGTATGCGTGCCTAGCTAGCATCGATCGATGCATCGATGCATCGATAGCATCG…
Similarity to characterized protein?(BLAST, homology)
Yes! Name it after that protein.(maybe add “-like”)
No. Call it a “hypothetical protein.”

Computational challenge
• Predict the functions of the many hypothetical proteins identified as genome sequences become available.• Currently 3537 out of the 5444 protein-
coding genes in the malarial parasite, Plasmodium falciparum, are annotated as “hypothetical.”
• How do you predict function when direct sequence comparisons to known proteins fail?

Genome Resarch. 2006 Apr;16(4):542-9.

Some facts about Plasmodium
• Plasmodium falciparum is the causal organism of the most lethal form of Malaria
• Malaria is one of the three big killers (with TB and HIV/AIDS)
• >40% of the world’s population is exposed to the disease
• 300-500 Million cases every year, and up to 2.7 Million deaths (mostly children under the age of 5, ~ one death / 30 seconds).
• Drug-resistant malaria strains found in Asia, Africa and South America

Some facts about Plasmodium
QuickTime™ and aTIFF (LZW) decompressor
are needed to see this picture.
D. Wirth
Plasmodium has several distinct life stages in different
hosts and cells
Most expression studies focus on red
blood cell stages which can be
cultured.

P. falciparum S. cerevisiaeSize 22 Mb 12 MbNo. of genes 5,444 5,770Avg. gene length 2,283 kb 1,424 kbG+C content 19.4 % 38.3 %
Hypothetical proteins 3537 (~65%) ~30%
Hypothetical proteins w/o pfam domain 2684 (~50%)
Plasmodium falciparum Genome
Characterizing these hypothetical proteins will increase our options for drug targets
and vaccines.

Interactome modeling
Goal:• Reconstruct the network of functional
protein-protein interactions– Calculate functional linkages between
individual proteins using different functional genomics methods
• in-silico, or computational functional genomics methods
• Experimental functional genomics data
– Combine the results within a suitable framework (Bayesian).

Interactome modeling: Yeast models
Phylogenetic profilingDate & Marcotte, Nature Biotechnology, 2003
Combined experimental and functional genomics dataLee, Date, Adai & Marcotte, Science, 2004
Bayesian networks approach for predicting function from heterogeneous data sources Troyanskaya et al. PNAS 2003
MIPS complexesSubcellular loc.
Bayesian networks approach for predicting protein-protein interactions from genomic dataJansen et al., Science, 2003

Predicting function through guilt-by-association
• Phylogenetic Profiles: Proteins that work together are present or absent together in different genomes.
• Rosetta Stone fusions: Proteins that get fused together are ones that work together.
• Expression Coherence: Genes that work together are expressed together.

Phylogenetic profile linkage data
Phylogenetic profiles are a description of the presence or absence of a given protein in a set of reference genomes (Pellegrini et al, PNAS 1999).
Genomes G1 G2 G3 G4 G5
Protein1
Protein2
Protein3
Presence
Absence
Absence Strong Presence
Archaea Bacteria Eukaryotes
A phylogenetic profile constructed using BLAST E-values
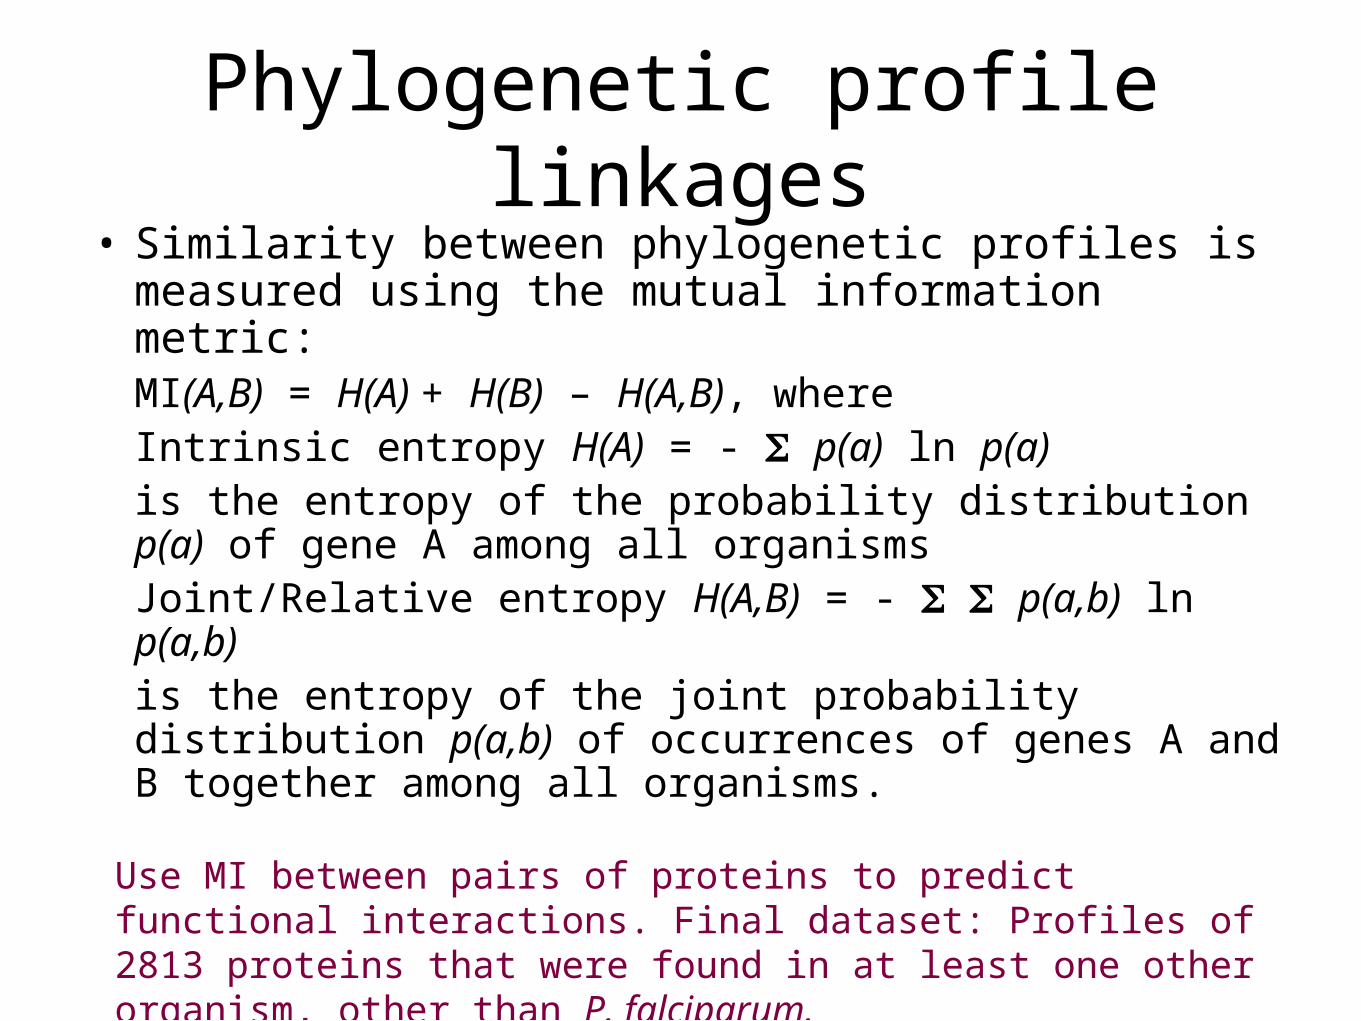
Phylogenetic profile linkages• Similarity between phylogenetic profiles is
measured using the mutual information metric:MI(A,B) = H(A) + H(B) – H(A,B), whereIntrinsic entropy H(A) = - p(a) ln p(a)
is the entropy of the probability distribution p(a) of gene A among all organisms
Joint/Relative entropy H(A,B) = - p(a,b) ln p(a,b) is the entropy of the joint probability distribution p(a,b) of occurrences of genes A and B together among all organisms.
Use MI between pairs of proteins to predict functional interactions. Final dataset: Profiles of 2813 proteins that were found in at least one other organism, other than P. falciparum.
Rosetta stone (domain fusion) linkage data
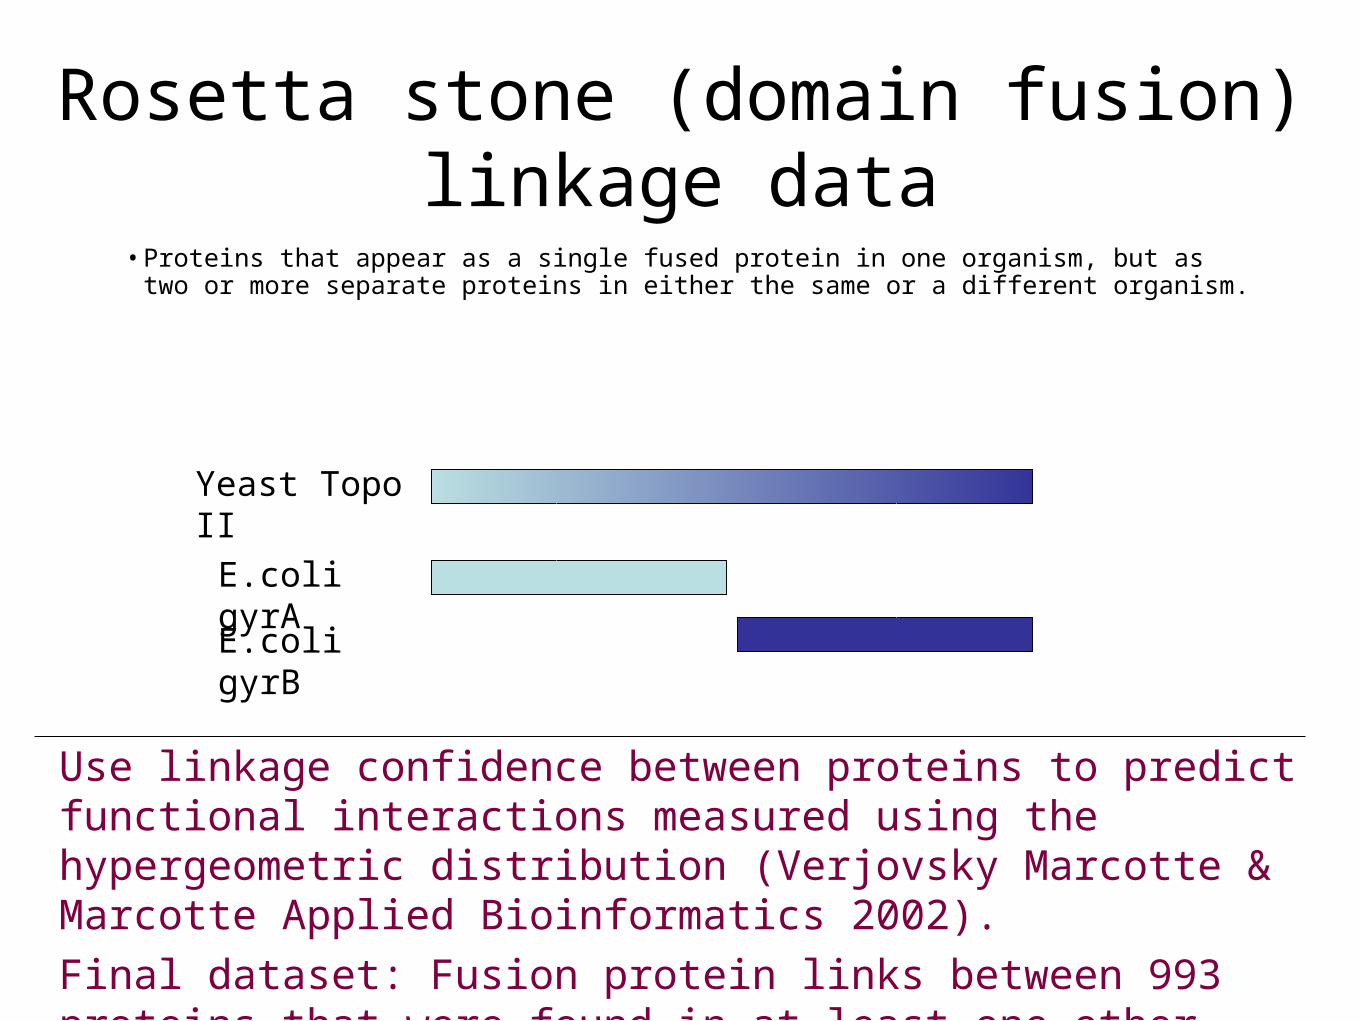
•Proteins that appear as a single fused protein in one organism, but as two or more separate proteins in either the same or a different organism.
Use linkage confidence between proteins to predict functional interactions measured using the hypergeometric distribution (Verjovsky Marcotte & Marcotte Applied Bioinformatics 2002).Final dataset: Fusion protein links between 993 proteins that were found in at least one other organism, other than P. falciparum.
E.coli gyrA
Yeast Topo II
E.coli gyrB

Expression coherence
• 3 major blood stages
• Single peak and trough•~75% of genes are cyclic
• Genes with similar function have similar phase
•High correlation of related genes
Bozdech, Z. et al. 2003. PLoS Biol. 4: R9
Use Pearson correlation to predict functional interactions. Expression profiles were available for 3471 proteins.

Interactome modeling: Data sets
• Experimental functional genomics datasets– Microarray expression time-series (Bozdech et al.
PLoS Biol 2003)– Microarray expression data for all stages (Le Roch
et al. Science 2003)– Mass spectrometry (Florens et al. Nature 2002,
Lasonder et al. Nature 2002)• Computational functional genomics datasets
– Phylogenetic profile linkages - 163 genomes – Rosetta stone linkages - 164 genomes
• Annotation datasets– Gene Ontology (GO) annotations (from Sanger &
TIGR) [GOLD STD]– KEGG Pathway annotations [GOLD STD]

Interactome modeling: Model features
G - gold standardsP – phylogenetic profilesR – Rosetta stone linksE1 – expression set 1E2 – expression set 2M1 – mass spec. set 1M2 – mass spec. set 2

Interactome modeling: Gold standards
+ve setPair all non-
Promiscuous1
proteins sharingKEGG pathways
GP
-ve setPair all proteins notsharing a pathway,then filter with GO
hierarchy (7 levels)2
GN’
GN
1Positive set: remove “promiscuous” proteins found in multiple pathways2Negative set: remove protein pairs that are closely related based on GO hierarchy

Interactome modeling: Likelihood scores
-+
+ - 0.9 – 1Bin
0.9 – 1Bin
LR(Binpairs) = P(Binpairs | GP) / P(Binpairs | GN)
Assign this LR to each protein pair (A,B) in the bin.
0.8 – 0.9Bin
0.8 – 0.9Bin
LR(A,B) = LR(A,B)Phylo x LR(A,B)Rosetta x LR(A,B)Expression
Compare accuracy of each data set with the gold standards and derive likelihood ratio (LR) scores
Example: Correlation values from expression profiles. Overlap of gold standard +ves (and -ves) for protein pairs with correlation values of 0.9 to 1, 0.8 to 0.9, 0.7 to 0.8, etc.
Result is likelihood that proteins A and B are functionally linked
+ve gold std-ve gold std

Interactome modeling: Reference priors
- Assume ‘X’ the number of proteins linkages in reality. Divide X by the number of possible linkages to get Oprior
- Predict ‘Y’ number of interacting pairs with odds of 1 or greater (Oposterior), and measure the ratio of true and false positives in the predictions (LR).
- Retain the prior with best coverage, and construct network
0.1
1
10
100
0.01 0.1 1 10 100 1000
Likelihood score thresholds
Overlap with gold standards (ratio of true positives to false positives)
0
10
20
30
40
50
60
70
80
90
100
Genome covered (%)
TP/FPAssumed coverageObserved coverageOposterior = Oprior x
LRBayes law

Interactome modeling: Validating results
Expression (Winzeler)
Mass spec (set 1)
Mass spec (set 2)
Random pairs
7-fold cross-validation and results of shuffled input
97%
3%Error
Shuff. input
87%
13%
`
Posterior probabilities based on Gold Standards improve with higher likelihood ratio thresholds on input datasets but do not improve with shuffled inputs. Overlap of input pairs with random pairs is small.

Interactome modeling: Validating results
Expression (Winzeler)
Mass spec (set 1)
Mass spec (set 2)
Posterior probabilities based on different benchmarks also improve with higher likelihood ratio thresholds on input datasets.
Microarray expression data for all stages (Le Roch et al. Science 2003)
Mass spectrometry (Florens et al. Nature 2002)
Mass spectrometry (Lasonder et al. Nature 2002)

0.1
1
10
100
0.01 0.1 1 10 100 1000
Likelihood score thresholds
Ov
erl
ap
wit
h g
old
sta
nd
ard
s (
rati
o o
f tr
ue
po
sit
ive
s t
o f
als
e p
os
itiv
es
)
0
Generating the interaction map and high-confidence subset
Likelihood ratio of 2 gives an Oposterior of 1. Interaction map.Likelihood ratio of 14 gives an Oposterior of ~10. High confidence subset.

Attributes of the interaction map and high-confidence subset
Note 9,428,653 pairs are possible for the 4343 proteins that had functional
information.

Interactome modeling: High-confidence subset

Interactome modeling: Examples

Interactome Modeling: Summary
• Computational challenge is inferring function when sequence similarity alone fails
• How many inferences made?• 2109 associations with characterized
genes• 107 hypothetical protein only linkages
• Computational success is using multiple lines of evidence tying genes together to infer functional interactions.

Data access and queries: PlasmoMAP
Provide predicted functional interactions so that
annotators and experimentalists can use these to establish protein
annotations

Data access and queries: PlasmoDB

Data access and queries: PlasmoDB

Data access and queries: PlasmoDB
LaCount et al. Nature 2005

PlasmoDB is part of a federation of databases on protozoan
parasites
QuickTime™ and aTIFF (Uncompressed) decompressor
are needed to see this picture.
QuickTime™ and aTIFF (Uncompressed) decompressor
are needed to see this picture.
Penn: Brestelli J, Brunk B, Chakravartula P, Date S, Dommer J, Essien K, Fischer S, Gajria B, Gao X, Grant G, Innamorato F, Iodice J, Pinney D, Roos D, Stoeckert C, Whetzel PUGa: Aurrecoechea C, Heiges M, Kissinger J, Kraemer E, Miller J, Wang H, Wang S

Applying interactome modeling to other species
Feng,C. et al. 2006. Nuc. Acids Res. 34: D363-D368
Have generated phylogenetic profiles
and Rosetta Stone linkages for Plasmodium
vivax and Toxoplasma gondii
Phylum apicomplexa
Homo SapiensHave also generated phylogenetic profiles
and Rosetta Stone linkages. Will add
expression data from tissue surveys.

Next computational challenges
• Compare functional interaction networks across related parasites
• Compare functional interaction networks across hosts and parasites
• Use functional interaction networks to look for regulators of biological processes (e.g., transcription for ribosomal protein genes)
• Use functional interactions to infer role of hypothetical protein families with novel domain

RAP1, a myb-family transcription factor, regulates transcription of ribosomal proteins in yeast. Is this regulatory
network conserved in P. falciparum?
Ribosomal proteins
RAP1
Yeast
Ribosomal proteins
?
P. falciparum
No RAP1 ortholog in P. falciparum but there are myb proteins. PF13_0088 (myb1)
expression is highly correlated with 43 ribosomal proteins (Pearson correlation of
0.9) Kobby Essien

Functional interaction network provides additional evidence for myb1
regulation of ribosomal proteins in Plasmodium
43 Ribosomal proteins
myb1
60 Ribosomal proteins plus 331 others (5/13 high confidence links are to ribosomal proteins).
In addition, cytoplasmic translational machinery proteins functionally linked to myb1 are significantly
enriched in a conserved motif in their promoter sequence. Kobby Essien

Next computational challenges
• Compare functional interaction networks across related parasites
• Compare functional interaction networks across hosts and parasites
• Use functional interaction networks to look for regulators of biological processes (e.g., transcription for ribosomal protein genes)
• Use functional interactions to infer role of hypothetical protein families with novel domains

P. Falciparum contains hypothetical proteins with putative novel domains
Family of 6 hypothetical proteins in P. falciparum identified by self BLAST (minimum 30% identity
over 30% of length)•These proteins have no known domains•May be restricted to P. falciparum•Top GO Biol. Process terms for proteins with predicted functional interactions with PFI0060c are GO:0020033 antigenic variation; GO:0020012 evasion of host immune response.
Shailesh Date

Functional interactions provide a path to infer role of hypothetical protein family
with novel domain
Family of 5 hypothetical proteins in P. falciparum identified by self BLAST (minimum 30% identity over 30% of length)
PFB0932w14 GO:0016070 RNA metabolism12 GO:0006396 RNA processing9 GO:0006350 transcription
PFB0930w 31 GO:0006412 protein biosynthesis16 GO:0020033 antigenic variation
MAL8P1.3 65 GO:0006412 protein biosynthesis16 GO:0016070 RNA metabolism
MAL7P1.17718 GO:0006412 protein biosynthesis16 GO:0009056 catabolism
Top GO Biol. Processes for proteins with predicted functional interactions to family members. (none for PFB0075c)
Shailesh Date

Connecting genes through data integration
Regulatory interactions
Physical interactions
Functional interactions
Functional genomics database

http://www.cbil.upenn.edu
![RESEARCH Open Access Malarial parasite diversity in ... · shared between humans and several species of New World ... A difference was that Bayesian ... sporozoite [37-39], the haploid](https://img.dokumen.tips/doc/110x75/5b91b70d09d3f211298c57e8/research-open-access-malarial-parasite-diversity-in-shared-between-humans.jpg)


![Plasmodium falciparum GFP-E-NTPDase expression at the … · 2017. 4. 11. · Plasmodium lifecycle (Fig. 1)[3]. There are reported cases of parasite resistance to all available anti-malarial](https://img.dokumen.tips/doc/110x75/602c77b1d19e3854dc09d88e/plasmodium-falciparum-gfp-e-ntpdase-expression-at-the-2017-4-11-plasmodium.jpg)