Embed Size (px)
Citation preview

STUDIA UBB CHEMIA, LXV, 3, 2020 (p. 45-61) (RECOMMENDED CITATION) DOI:10.24193/subbchem.2020.3.04
COMPUTATIONAL IMAGE ANALYSIS AS AN ALTERNATIVE TOOL FOR THE EVALUATION OF
CORROSION IN SALT SPRAY TEST
VITOR BONAMIGO MOREIRAa,b, *, ALEX KRUMMENAUERb, JANE ZOPPAS FERREIRAb, HUGO MARCELO VEITb,
ELAINE ARMELINa,c and ALVARO MENEGUZZIb, *
ABSTRACT. The current standards for evaluating corrosion during salt spray tests rely on the visual analysis of the specimens, and this may be a limitation when higher resolution quantitative outputs are desired. In this work, computational image analysis was used to measure the area affected by corrosion during salt spray tests with aluminum alloy, copper, carbon steel and galvanized steel plates. The software ImageJ was used to select and measure the corroded areas differentiating the corrosion products from the metals uncorroded surfaces according to their different colors. With ten measurements for each selected exposure time, a 95 % confidence interval was calculated for each material and time of exposure, giving an indication of the precision of the estimated corroded area. These data were compared with a visual inspection carried out by an experienced technician. The results indicate that computational image analysis may be a powerful tool to obtain higher resolution in the results interpretation in comparison with the standard visual analysis. Keywords: salt spray test, computational image analysis, corrosion assessment
INTRODUCTION
Although salt spray is extensively used as a comparative corrosion
test, its outcome may be limited by the current standards. Corrosion evaluation a Departament d’Enginyeria Química, Universitat Politècnica de Catalunya, Campus Diagonal
Besòs (EEBE), C/ Eduard Maristany, 10-14, Building I, 2nd floor, 08019, Barcelona, Spain b Programa de Pós-graduação em Engenharia de Minas, Metalúrgica e de Materiais
(PPGE3M), Universidade Federal do Rio Grande do Sul (UFRGS), Av. Bento Gonçalves, 9500 – 91501-970, Porto Alegre, RS, Brazil.
c Barcelona Research Center for Multiscale Science and Engineering, Universitat Politècnica de Catalunya, Campus Diagonal Besòs (EEBE), C/ Eduard Maristany, 10-14, Building I, basement floor, 08019, Barcelona, Spain.
* Corresponding authors: [email protected] and [email protected]

VITOR BONAMIGO MOREIRA, ALEX KRUMMENAUER, JANE ZOPPAS FERREIRA, HUGO MARCELO VEIT, ELAINE ARMELIN, ALVARO MENEGUZZI
46
standards, such as ASTM D610–08 [1], which uses visual examples as reference for comparison and subsequent rating of corrosion grades, are based on visual analysis. As such, they add some uncertainty to the results due to the adoption of subjective criteria and lowering the results resolution by limiting the outcome to an interval from 0 (zero) to 10, a discrete scale based on the percentage of area failed.
Computational image analysis may be an alternative to overcome this limitation by obtaining higher resolution data in order to improve the comparative investigation. One example was that reported by ASTM International with the standard D 7087-5a (2010) [2], where they reported a procedure for measuring rust creepage at scribe by an imaging technique. However, the withdrawal of this standard in 2019 showed that there are still challenges to be tackled in order to provide reliable methods for computational corrosion evaluation.
In a recent work, Denissen and Garcia [3] used iterative algorithms in the computational image analysis during electrochemical impedance spectroscopy tests in order to obtain complementary interpretation for such tests, showing the relevance of adequate assessment of the visible changes in the materials surface as an evidence of corrosive processes. Other authors [4–6] have already used image analysis for measuring corroded areas after corrosion tests. Although the successful use of those tools, there are no studies regarding the uncertainty of such analyses, from a statistical point of view, in salt spray tests.
Moreover, uncoated bare metal surfaces are not considered by the current corrosion evaluation standards. The inspection of the samples is usually limited by weight loss and corrosion analyses localized on the scribe of painted panels. Iribarren et al. [7] have demonstrated that dark and colored iron oxides and oxyhydroxides are associated with advanced carbon steel deterioration, due to their non-adherent properties and high permeability to ions. Therefore, the use of color evaluation not only allows to distinguish the uncorroded and corroded zones, but also indicates the severity of the corrosive process which the material has undergone.
Based on such examples, colors enable the use of image analysis tools to measure the fraction of the specimens’ surface affected by corrosion.
In this work, salt spray tests were carried out with bare plates of four different metals: aluminum alloy, copper, carbon steel and galvanized steel. These specimens were evaluated periodically using ImageJ software (National Institutes of Health, Bethesda, Maryland, USA) in order to quantify the area affected by corrosion on each sample and perform the statistical analysis of the measurements. The observed results are represented in terms of failed area (%) versus the time of salt fog exposition, for each material. These plots were used to assess and to compare the 95 % confidence intervals (CI), of the means of different datasets [8].
COMPUTATIONAL IMAGE ANALYSIS AS AN ALTERNATIVE TOOL FOR THE EVALUATION OF CORROSION IN SALT SPRAY TEST
47
For first time, the statistical reliability of the proposed technique, has been addressed. The main aim of such validation is to introduce a novel evaluation method in order to obtain high resolution results after conventional corrosion tests. The method can be extended to other destructive tests used for coatings and surface characterization, such as adhesion tests, blistering evaluation, and others. RESULTS AND DISCUSSION
In this section the results obtained for each metal will be discussed
as an independent analysis because the corrosion products are not the same for all samples. As expected, the tested metals demand a particular adjustment of parameters for correct selection of the corroded area because of the different visual aspects of the corrosion products.
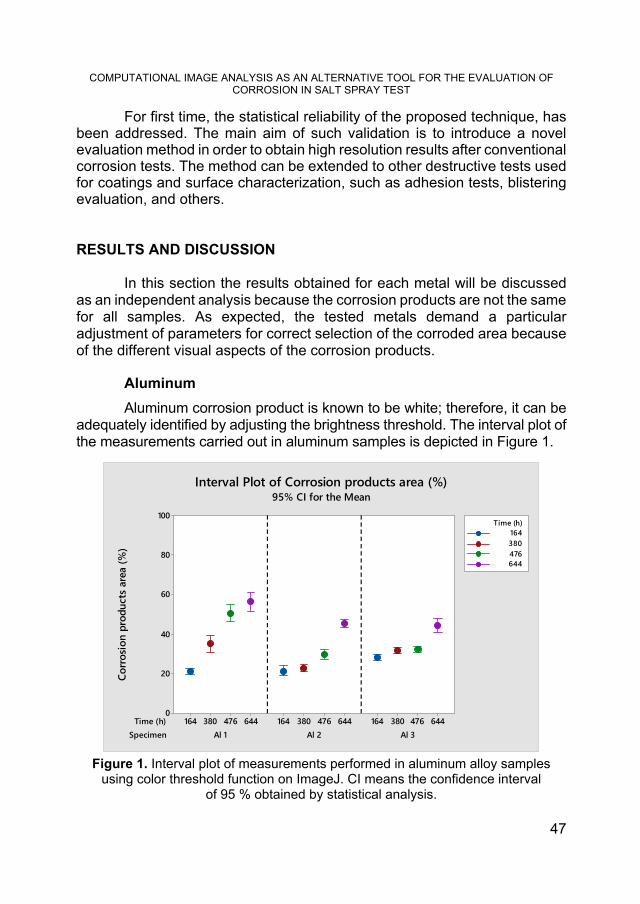
Aluminum Aluminum corrosion product is known to be white; therefore, it can be
adequately identified by adjusting the brightness threshold. The interval plot of the measurements carried out in aluminum samples is depicted in Figure 1.
Figure 1. Interval plot of measurements performed in aluminum alloy samples
using color threshold function on ImageJ. CI means the confidence interval of 95 % obtained by statistical analysis.
SpecimenTime (h)
Al 3Al 2Al 1644476380164644476380164644476380164
100
80
60
40
20
0
Corro
sion p
rodu
cts ar
ea (%
)
164380476644
Time (h)
Interval Plot of Corrosion products area (%)95% CI for the Mean

VITOR BONAMIGO MOREIRA, ALEX KRUMMENAUER, JANE ZOPPAS FERREIRA, HUGO MARCELO VEIT, ELAINE ARMELIN, ALVARO MENEGUZZI
48
The visual aspect of white aluminum oxide formed changed throughout the test duration, being evidently enlarged over increasing salt fog exposition time, as can be seen in Figure 2.
Figure 2. Aluminum sample (Al 1) during visual analysis a) before the test, b) after
164 h, c) 380 h, d) 476 h and e) 644 h. The bars correspond to 1 cm.
It is noticeable (Figure 2) that the corrosion products formed above the aluminum alloy surface, clearly delineated after 164 h of test, became less distinguishable assuming the aspect of the large stains with less brightness (light gray in color) in the following measurements. Therefore, the reduction of well-defined white oxides may be the reason why the data dispersion was increased for 380 h, 476 h and 644 h; resulting in broader confidence intervals. Those confidence intervals varied from 2.9 % for 164 h to 9.7 % for 644 h, for the sample Al 1; which are the lowest and the highest length of CI, respectively, for all measurements carried out in aluminum.
The comparison between the dispersion observed for Al 1 and Al 3 in the 380 h analysis confirms this hypothesis, once Al 3 still has well delineated corroded areas at this point, which does not occur with the sample Al 1. Comparison of both specimens is shown in the photograph images of Figure 3.
Figure 3. Visual aspect of the surface of: a) Al 1 and b) Al 3 specimens,
after 380 h of exposure on salt spray.

COMPUTATIONAL IMAGE ANALYSIS AS AN ALTERNATIVE TOOL FOR THE EVALUATION OF CORROSION IN SALT SPRAY TEST
49
Despite the difficulty imposed by the mentioned factor, the corroded areas are mostly statistically distinct and significant increases were observed for all samples during the test, as expected.
Figure 4 consists in a graphical comparison between the values measured using the ImageJ computer software and the values of corrosion grade, obtained with an adapted version of the standard ASTM D610 (described in the experimental section), for each aluminum sample.
Figure 4. Comparison of the computational measure using the ImageJ software (above) and the corrosion grade obtained with the standard ASTM D610 (below)
for aluminum specimens. The corrosion grade measured for the aluminum specimens
decreased from 3 to 2 at the first salt spray exposition (164 h), and then decreased more slowly until grade 1 at the end of the test. This sharp exponential curve decrease traduces in a less accurate measure for the samples with more corroded area, once the interval for the failed area does not allow differentiating a fine corrosion grade, in the ASTM D610 standard. On the other hand, the image analysis by adjusting the brightness for identifying the white aluminum oxides offers a linear ascending curve. This effect is noticeable during the test at 694 h, as the computational analysis provides distinct areas while the visual inspection, following the ASTM D610 criteria, results in the same corrosion grades for the three samples studied. Thus, the computational measure ensures a statistically relevant difference

VITOR BONAMIGO MOREIRA, ALEX KRUMMENAUER, JANE ZOPPAS FERREIRA, HUGO MARCELO VEIT, ELAINE ARMELIN, ALVARO MENEGUZZI
50
of approximately 20 % in the corroded area of these specimens. This can be explained because the standard corrosion grades regard only corrosion up to 50 % in total area, so it was expected that for higher corroded areas the visual analysis could not provide adequate differentiation.
Copper Considering the testing environment, the possible corrosion products
from copper and their respective colors are: Cu2O (red); CuO (black); Cu(OH)2 (blue); and, possibly, CuCl after the replacement of oxygen by chloride ions in Cu2O composition, changing it to a yellow colored layer [9,10].
The scan images of one copper specimen (Cu 1) are depicted in Figure 5.
Figure 5. Copper sample (Cu 1) during visual analysis a) before the test, b) after
476 h, c) 716 h, d) 1052 h and e) 1388 h. The bars correspond to 1 cm.
In the first exposition time (476 h), remembering that either the salt fog spray exposition or the adjustments for the image analysis were not the same for each metal, the corrosion products were predominantly light red, and they were adequately selected by setting the saturation spectrum and allowing the establishment of the appropriate hues and brightness values. After 476 h, the predominant color of the corrosion products was a dark shade of red, possibly a mixture of CuO and Cu2O, with some blue areas, possibly from Cu(OH)2. Those corrosion products are easily distinguished from the substrate by the control of the brightness values for all hue and saturation spectra. The interval plot for all measurements performed in copper samples is presented in Figure 6.

COMPUTATIONAL IMAGE ANALYSIS AS AN ALTERNATIVE TOOL FOR THE EVALUATION OF CORROSION IN SALT SPRAY TEST
51
Figure 6. Interval plot of the measurements carried out in copper specimens using
color threshold function on ImageJ. CI means the confidence interval of 95% obtained by statistical analysis.
The clear visual distinction of the corrosion products by color has influenced the data dispersion. The three analyzed specimens showed significant differences regarding the evolution of the corrosive process (Figure 5), but even with the observed differences all samples had a narrow data dispersion, indicating the reliability of our analysis method. The lowest length of CI for copper samples was observed for Cu 2 after 476 h, which was only 0.5 %; while the highest value was obtained for the sample Cu 3, 5.1 % length of CI. It is also noticeable that there are statistically significant differences for all of the points measured for each sample, indicating the expected evolution of the corroded area for all the specimens.
A graphical comparison between the computational image analysis and the visual inspection of copper corrosion products by using the adapted version of ASTM D610 is shown in Figure 7.
SpecimenTime (h)
Cu 3Cu 2Cu 1138810527164761388105271647613881052716476
100
80
60
40
20
0
Corro
sion p
rodu
cts ar
ea (%
)
476716
10521388
Time (h)
Interval Plot of Corrosion products area (%)95% CI for the Mean

VITOR BONAMIGO MOREIRA, ALEX KRUMMENAUER, JANE ZOPPAS FERREIRA, HUGO MARCELO VEIT, ELAINE ARMELIN, ALVARO MENEGUZZI
52
Figure 7. Comparison of the computational measure using the ImageJ software (above) and the corrosion grade obtained with
the standard ASTM D610 (below) for copper specimens. As observed previously in the aluminum specimens (Figure 4), the
corrosion grade from the ASTM D610 fails again to differentiate samples with large corroded areas, while computational image analysis detects significant differences between the samples. One example of this evidence is the evolution of corrosion in sample Cu 3, which increased only one corrosion grade from 716 h to 1388 h after testing. Computational image analysis showed that, in the same time interval, this increase corresponds to an evolution of approximately 60 % more of copper oxide products respect to the total of the corroded area.
Carbon steel The images used for the evaluation of one of the carbon steel samples
(CS 1) throughout the test can be seen in Figure 8.
Figure 8. Carbon steel sample (CS 1) during visual analysis a) before the test,
b) after 1 h, c) 2 h, d) 3 h and e) 5 h. The bars correspond to 1 cm.
COMPUTATIONAL IMAGE ANALYSIS AS AN ALTERNATIVE TOOL FOR THE EVALUATION OF CORROSION IN SALT SPRAY TEST
53
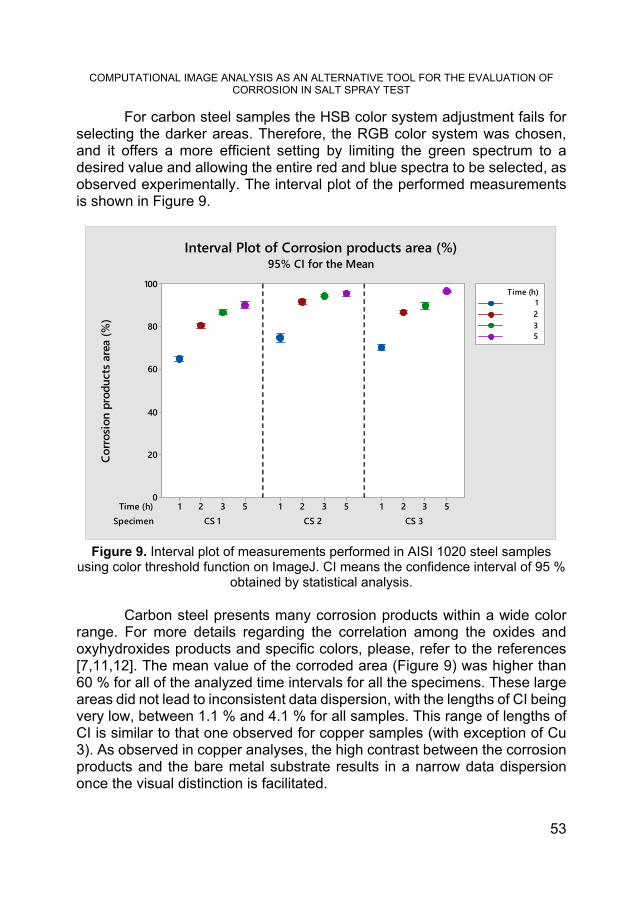
For carbon steel samples the HSB color system adjustment fails for selecting the darker areas. Therefore, the RGB color system was chosen, and it offers a more efficient setting by limiting the green spectrum to a desired value and allowing the entire red and blue spectra to be selected, as observed experimentally. The interval plot of the performed measurements is shown in Figure 9.
Figure 9. Interval plot of measurements performed in AISI 1020 steel samples
using color threshold function on ImageJ. CI means the confidence interval of 95 % obtained by statistical analysis.
Carbon steel presents many corrosion products within a wide color
range. For more details regarding the correlation among the oxides and oxyhydroxides products and specific colors, please, refer to the references [7,11,12]. The mean value of the corroded area (Figure 9) was higher than 60 % for all of the analyzed time intervals for all the specimens. These large areas did not lead to inconsistent data dispersion, with the lengths of CI being very low, between 1.1 % and 4.1 % for all samples. This range of lengths of CI is similar to that one observed for copper samples (with exception of Cu 3). As observed in copper analyses, the high contrast between the corrosion products and the bare metal substrate results in a narrow data dispersion once the visual distinction is facilitated.
SpecimenTime (h)
CS 3CS 2CS 1532153215321
100
80
60
40
20
0
Corro
sion p
rodu
cts ar
ea (%
)
1235
Time (h)
Interval Plot of Corrosion products area (%)95% CI for the Mean

VITOR BONAMIGO MOREIRA, ALEX KRUMMENAUER, JANE ZOPPAS FERREIRA, HUGO MARCELO VEIT, ELAINE ARMELIN, ALVARO MENEGUZZI
54
The graphical comparison between the proposed technique and the visual analysis offered by ASTM D610 of carbon steel specimens is shown in Figure 10.
Figure 10. Comparison of the computational measure using the ImageJ software
(above) and the corrosion grade obtained by with the standard ASTM D610 (below) for carbon steel specimens.
As can be seen in the Figure 10, the corrosion grade obtained with visual analysis (ASTM D610) resulted in no differentiation for large corroded areas, reaching the maximum rating number of 1 for any exposition time in salt spray test. By contrary, the corroded area measured with the computational image analysis indicated an exponential rise of the corroded area up to approximately 30 % from 1 h to 5 h of test. Altogether evidence that the computational software ImageJ can be used to achieve comparisons that are more accurate.
Galvanized steel The corrosion products formed in galvanized steel are initially white,
corresponding to ZnO molecules, and, after a severe corrosion of the zinc layer, red corrosion products are visible as a result of the underlying carbon steel corrosion process, as observed in Figure 11, which contains the analyzed images of a galvanized steel specimen (GS 1).

COMPUTATIONAL IMAGE ANALYSIS AS AN ALTERNATIVE TOOL FOR THE EVALUATION OF CORROSION IN SALT SPRAY TEST
55
Figure 11. Galvanized steel sample (GS 1) during visual analysis a) before the
test, b) after 2 h, c) 5 h, d) 10 h and e) 24 h. The bars correspond to 1 cm.
For the measurements carried out on galvanized steel specimens, the adjustment of the brightness was efficient for selecting the corroded area. The resulting interval plots are depicted in Figure 12.
Figure 12. Interval plot of measurements performed in galvanized steel samples
using color threshold function on ImageJ. CI means the confidence interval of 95 % obtained by statistical analysis.
SpecimenTime (h)
GS 3GS 2GS 1241052241052241052
100
80
60
40
20
0
Corro
sion p
rodu
cts ar
ea (%
)
25
1024
Time (h)
Interval Plot of Corrosion products area (%)95% CI for the Mean

VITOR BONAMIGO MOREIRA, ALEX KRUMMENAUER, JANE ZOPPAS FERREIRA, HUGO MARCELO VEIT, ELAINE ARMELIN, ALVARO MENEGUZZI
56
Differently from that observed in aluminum, the white corrosion products on galvanized steel do not have a significant change regarding their visual aspect, i.e. the corroded areas on galvanized steel are more clearly delimited with the evolution of the corrosive process than in aluminum alloy. In other words, the specific corroded areas that are visible in the first analysis time remain well defined until the end of the test. This has resulted in a narrow data dispersion on larger testing times.
Although some of the measurements for 5 h, 10 h and 24 h in salt fog test are statistically equivalent, this is a result of a stabilization in the corrosion evolution on the tested specimens. Between 5 h and 24 h the CI length did not exceed 4.7 % for all samples, which indicates that even with large corroded areas the computational method may provide significant data. The lowest and the highest lengths of CI observed for galvanized steel were 2.3 % and 5.8 %, respectively.
Figure 13 shows the graphical comparison between both the image and the visual analyses, obtained from adapted ASTM 610, for galvanized steel specimens.
Figure 13. Comparison of the computational measure using the ImageJ software (above) and the corrosion grade obtained with the standard ASTM D610 (below)
for galvanized steel specimens. If we compare the Figures 8 and 10 (lower plots), it can be seen that
there are no differences on the evaluation of the corroded area between carbon steel and galvanized steel, by using ASTM D610 visual inspection.

COMPUTATIONAL IMAGE ANALYSIS AS AN ALTERNATIVE TOOL FOR THE EVALUATION OF CORROSION IN SALT SPRAY TEST
57
Nevertheless, the fast increase of corrosion areas from the first measurement (65 %, 2 h) towards the second time (88 %, 5 h) in the galvanized samples (Figure 13, upper plot) was discriminated by the computational image analysis. It corresponds to the elimination of the ZnO layer and the starting of under layer corrosion, which is more similar to that reported for the carbon steel (Figure 10, upper plot). CONCLUSIONS
The use of a computational image analysis to measure corroded
areas during salt spray test resulted in higher differentiation between specimens with statistically significant difference at 95 % confidence level for all the tested metals, if compared to the visual inspection suggested by ASTM D610 standard. Among the different metal compositions, a clear linear curve of corroded area over time was found to aluminum alloy and copper substrates, whereas the carbon steel and the galvanized steel showed an exponential increase of corrosion rate.
Thus, for first time, we have demonstrated a reliable and reproducible method for the evaluation of corrosion products by contrast, brightness, hue and saturation adjustment, after salt spray test, which will undoubtedly enrich the interpretation of the data obtained from such assays.
This technique may enable differentiation in the performance of materials that would not be measurable with the conventional evaluation methods, providing a quantitative character to such experiment, which is typically limited by the intrinsically qualitative aspect of simple visual analysis.
It must be mentioned that the proposed method is limited by the ability of acquiring representative two-dimensional images of the tested surfaces with no perspective. In this way, complex three-dimensional shapes inevitably introduce misleading inputs, as affected areas may appear smaller with increasing distance to the image foreground. Additional image processing or alternative image acquisition methods would be necessary to overcome this limitation.
The authors expect to set ground for further developments in the improvement of accelerated corrosion analysis, as the technique herein described can be applied to other tests, such as immersion or 100 % relative humidity tests. This can be also the initial step towards the development of automated corrosion evaluation by computational image analysis in accelerated corrosion tests. The new insights presented here can be extended to other destructive analyses, like those performed on coatings industry (pull-off test, blistering, rust creepage at scribe, and others).

VITOR BONAMIGO MOREIRA, ALEX KRUMMENAUER, JANE ZOPPAS FERREIRA, HUGO MARCELO VEIT, ELAINE ARMELIN, ALVARO MENEGUZZI
58
EXPERIMENTAL SECTION
The metal plates used for this work were: aluminum (AA7075-T6; 80
mm × 40 mm × 3 mm), copper (UNS – C11000; 100 mm x 40 mm x 1 mm), carbon steel (AISI 1020; 100 mm × 50 mm × 1 mm) and galvanized steel (100 mm × 50 mm × 1 mm). Three specimens of each metal were tested. Individual specimens are referred to throughout this manuscript as: Al #, for aluminum alloy; Cu #, for copper; CS #, for carbon steel; GS #, for galvanized steel, being # a number from 1 to 3 that refers to the specimen tested.
Such metals were chosen due to the different surface contrast (by color) they present, as well as, due to the different contrast of their corrosion products. Aluminum provides a bright gray substrate with the formation of white corrosion products, which may not be easily distinguishable by visual analysis. Copper, as well as galvanized steel, may form more than one single corrosion product. Carbon steel, besides being one of the main structural materials for engineering applications, also form different corrosion products, with different colors. Therefore, its study is important for a broader application of the proposed technique.
All samples were degreased during 10 minutes at 70 °C with an industrial alkaline degreaser (Saloclean 667N – Klintex Insumos Industriais Ltda.) and subsequently washed with distilled water to eliminate the excess of degreaser agent.
Salt spray tests were carried out according to ASTM B117 [13]. Four analysis times were selected for each metal for the image analysis: 164 h, 380 h, 476 h and 644 h for aluminum; 476 h, 716 h, 1052 h and 1388 h for copper; 1 h, 2 h, 3 h and 5 h for carbon steel; 2 h, 5 h, 10 h and 24 h for galvanized steel; and 0 (before salt fog chamber conditioning). Such time intervals were defined individually for each material due to the differences in their reactivity, so that a wide range of corrosion levels would be measured.
For the computational image analysis, each specimen was scanned using an image scanner (HP Color LaserJet CM1312 MPF - Hewlett-Packard Company) as an important tool to eliminate the effect of picture perspective; which cannot be neglected if conventional photographs are used.
For image analysis, the “Color threshold” function was used. The desired area was selected and was measured by setting the adequate parameters in hue, saturation and brightness (HSB color system), after eliminating the edges and holes of the specimens and evaluating the visible corrosion products. Specifically, for carbon steel specimens, the Red, Green and Blue (RGB) color system was more adequate for selecting the correct areas. This measurement was repeated ten times for each sample and time, adjusting

COMPUTATIONAL IMAGE ANALYSIS AS AN ALTERNATIVE TOOL FOR THE EVALUATION OF CORROSION IN SALT SPRAY TEST
59
manually the parameters for each one of them in order to measure experimental error. These parameter adjustments were made for each repetition independently, without necessarily matching the previous measurements for the same specimen, allowing the evaluation of the experimental variability, shown graphically in the interval plots.
Figure 14 illustrates this procedure for one aluminum plate.
Figure 14. a) Aluminum sample with white corrosion products after salt spray test; b) ImageJ screen during color threshold adjustments for selecting the corroded area (in red); c) Parameters adjustments screen for color threshold in HSB color system.
a)
b)
c)

VITOR BONAMIGO MOREIRA, ALEX KRUMMENAUER, JANE ZOPPAS FERREIRA, HUGO MARCELO VEIT, ELAINE ARMELIN, ALVARO MENEGUZZI
60
The 95 % confidence interval (CI) were calculated using the software Minitab 17 (Minitab Inc., USA) by the statistical inference for small samples (less than 30 measurements) that uses the t distribution, also referred to as Student’s t distribution. These CI are defined by the lower confidence limit (LCL) and the upper confidence limit (UCL), which are calculated using the Equations [1] and [2], respectively [14].
nstxLCL ⋅−=
[1]
nstxUCL ⋅+=
[2]
Where �̅� represents the sample mean, s stands for the sample standard
deviation, n is the number of measurements and t is a factor depending on the degrees of freedom (ν = n - 1) and the significance level (α). This way, being calculated for each sample at each time, the length of the CI is a measurement of the precision of the estimate value for the corroded area [14].
Each interval plot shows the results for a single material, with three analyzed samples and five different exposure times on the salt spray test. These plots were generated by the software Minitab 17. The whiskers show the lower and upper confidence limits, while the center marker indicates the mean value for the group [8].
With the lack of adequate standards for evaluating corrosion in uncoated bare metal samples, an adapted version of the ASTM D610 standard [1], which describes the practice for evaluating degree of rusting on painted steel surfaces by visual inspection, was used in order to compare to the computational image analysis proposed in the present study. The adaption of the standard was made comparing the test images of bare plates with the standard images for painted plates. Then, the corroded area was evaluated as if it was a paint failure area. Each specimen is then associated to a corresponding corrosion grade from 10 (0 % of corroded area) to 0 (zero, > 50 % of corroded area) in each evaluation time. ACKNOWLEDGMENTS
Mr. Moreira acknowledges the fellowships received from the Conselho
Nacional de Desenvolvimento Científico e Tecnológico – CNPq (grant 200890/2018-2 and project 405956/2016-9) and Coordenação de Aperfeiçoamento de Pessoal de Nível Superior – CAPES (grant 88881.188990/2018-01) for the PhD study and mobility. Mr. Krummenauer acknowledges CAPES (grant 88882.345832/2019-01) for the financial support.

COMPUTATIONAL IMAGE ANALYSIS AS AN ALTERNATIVE TOOL FOR THE EVALUATION OF CORROSION IN SALT SPRAY TEST
61
REFERENCES
1. ASTM International; ASTM Stand., 2001, D610-01(Reapproved 2012), 1–6. 2. ASTM International; ASTM Stand., 2010, D7087-05a(Withdrawn 2019), 1–4. 3. P.J. Denissen; S.J. Garcia; Electrochim. Acta, 2019, 293, 514–524. 4. M. Rodošek; et al.; Corros. Sci., 2017, 126(June), 55–68. 5. J.L. Daure; K.T. Voisey; P.H. Shipway; D.A. Stewart; Surf. Coatings Technol.,
2017, 324, 403–412. 6. X.-B. Chen; N. Birbilis; T.B. Abbott; Corros. Sci., 2012, 55, 226–232. 7. J.I. Iribarren; F. Liesa; Á. Meneguzzi; C. Alemán; E. Armelin; J. Cult. Herit.,
2020, 42, 240–248. 8. W.P. Gardiner; Statistical Analysis Methods for Chemists Royal Society of
Chemistry, Cambridge, 2007, doi:10.1039/9781847551924 9. A. Groysman; Corrosion for Everybody Springer Netherlands, Dordrecht, 2010,
doi:10.1007/978-90-481-3477-9 10. S. Sathiyanarayanan; M. Sahre; W. Kautek; Corros. Sci., 1999, 41(10), 1899–
1909. 11. R.A. Antunes; I. Costa; D.L. A. de Faria; Mater. Res., 2003, 6(3), 403–408. 12. R.A. Antunes; R.U. Ichikawa; L.G. Martinez; I. Costa; Int. J. Corros., 2014,
2014, 1–9. 13. ASTM International; ASTM Stand., 2019, B117-19, 1–11. 14. D.C. Montgomery; G.C. Runger; Applied statistics and probability for engineers
Hoboken, USA, 2014, 6th editio Ed.