Embed Size (px)
Citation preview

Computational Analysis of the Large Scale Low-Boom Supersonic Inlet
This presentation describes two computational fluid dynamic (CFD) analyses done in support of a
supersonic inlet test performed at NASA Glenn Research Center in the fall of 2010. The large-scale-low-boom supersonic inlet was designed for a small supersonic aircraft that would cruise at a Mach number of 1.6. It uses an axisymmetric, external compression spike to reduce the Mach number to 0.65 at the fan face. The inlet was tested in the 8x6 supersonic wind tunnel at NASA GRC using conventional pressure probes, pressure sensitive paint, and high-speed schlieren.
Two CFD analyses of the inlet were performed before the test, and compared to the experimental data afterwards. Both analyses used the WIND-US code. First, an axisymmetric analysis of the inlet, diffuser, cold pipe, and mass flow plug was performed to predict the performance of the entire system in the wind tunnel. Then a 3-D analysis of the inlet with all its interior struts was performed to predict details of the flow field and effects of angle of attack.
Test results showed that the inlet had excellent performance, with a peak total pressure recovery of 96 percent, and a buzz point far outside the engine operating range. The computations agreed very well with the data, with predicted recoveries within 0.3 – 0.5 points of the measurements.

1
National Aeronautics and Space
Administration
www.nasa.gov
2011 Technical Conference
March 15-17, 2011
Cleveland, Ohio
Computational Analysis of the Large Scale Low-Boom Supersonic Inlet
Dr. Rodrick V. Chima NASA GRC Inlets and Nozzles Branch, SUP Propulsion Subproject
Supersonics Project

Low Boom Inlet in NASA GRC 8x6 Supersonic Tunnel
2 R. Chima, NASA GRC
Low boom inlet developed by Gulfstream Aerospace Corporation (GAC)
• Designed for Mach 1.6 cruise at 45,000 ft
• Over wing Mach number = 1.7 • Tested in 8x6 supersonic wind tunnel at NASA Glenn Research Center, Oct. – Nov. 2010
LBSI CFD Analysis
L – R: Stefanie Hirt, Manan Vyas, Rodrick Chima, Robert Reger

Inlet Design
3
• Isentropic compression spike produces weak shock at hub, strong shock at tip.
• Primary (center) stream would lead to engine.
• Bypass stream diverts lossy tip flow around engine gear box. • Low cowl angle minimizes boom.
R. Chima, NASA GRC LBSI CFD Analysis
4
Micro ramps, struts, and vortex
generators not considered here
Primary stream throttled with 16” mass
flow plug (MFP)
Bypass stream would duct flow around
large engine gearbox.
Bypass stream exits through choked plates
R. Chima, NASA GRC LBSI CFD Analysis

5
CFD Analyses
LBSI CFD Analysis

Axisymmetric model of the Gulfstream low boom inlet in the 8x6 wind tunnel including:
• Tunnel walls. Equivalent circular area is almost the same height as the tunnel.
• Bypass duct and exit plates • Inlet, subsonic diffuser
• Cold pipe, mass flow plug (MFP)
• Mounting strut and tunnel wall porosity were ignored.
Results were used for initial sizing of bypass exit plates and positioning of MFP.
Axisymmetric CFD Model
6
8
6
Axisymmetric section with same area as
8x6 tunnel has nearly the same height as
the tunnel.
Side view of reflected shocks should be
nearly correct.
R. Chima, NASA GRC LBSI CFD Analysis

Computational Grid
7
• Grid generated using Pointwise.
• Boundary conditions added using Gridgen and GMAN.
• 144,525 points in 7 zones
Inlet Mass Flow Plug (MFP) Cold Pipe Diffuser
R. Chima, NASA GRC LBSI CFD Analysis

Bypass Exit Plate Model
8
• Bypass IML reduced to model gearbox and strut blockage (like Kim and Liou.)
• Zero thickness inviscid wall used to model bypass exit plate
• Axisymmetric exit area = total plate exit area • 4 exit plate areas were tested. Normalized exit areas Aex = 1.0, 1.1, 1.2, and 1.3
Inviscid wall Inviscid wall
Inviscid wall
R. Chima, NASA GRC LBSI CFD Analysis

Mass Flow Plug Translation
9
• Calculations throttled by translating MFP.
• Surface database translated in Pointwise, attached grids morph automatically.
• BC reset using scripts in Gridgen and GMAN. • Total translation of 1.0 inches covers the entire engine operating range.
• Much larger range tested experimentally.
R. Chima, NASA GRC LBSI CFD Analysis

Computed Results - Mach Contours
10
• WIND-US CFD code, Roe upwind scheme, SST turbulence model
• ~ 1.5 hr per case on 6 CPUs
R. Chima, NASA GRC LBSI CFD Analysis

Measured Inlet Performance (Core)
11
• Excellent recovery: 96% at M = 1.7 design point.
• Buzz boundary well below engine operating range.
• CFD was only performed for the engine operating range. • The inlet operating range was increased greatly during the experiment.
M = 1.7
ENGINE OPERATING RANGE
BUZZ
BUZZ
R. Chima, NASA GRC LBSI CFD Analysis

Core Recovery Neglecting Rake Behind Strut
12
• Axisymmetric CFD agrees with measured recovery when bottom rake behind strut is neglected.
• Black diamonds show points at same MFP position used for centerline pressure comparison later.
R. Chima, NASA GRC LBSI CFD Analysis

Flow Rate vs. Mass Flow Plug Position
13
• CFD was used to set the initial MFP travel to cover a nominal engine operating range.
The range was increased greatly during the experiment.
• Axisymmetric CFD over predicts bypass flow by 11 percent. • CFD under predicts max. core flow.
• Good prediction of mass flow variation with MFP position (slopes.)
BYPASS
CORE
TOTAL MAX. FLOW
R. Chima, NASA GRC LBSI CFD Analysis

Radial P0 Profiles at Fan Face
14
• Aex = 1.2, points at same MFP position.
• Good agreement between CFD and 7/8 rakes.
• 180 deg. rake is immediately behind a strut and measures lower P0. Not captured by axisymmetric solution.
R. Chima, NASA GRC LBSI CFD Analysis
Centerline Pressures
15
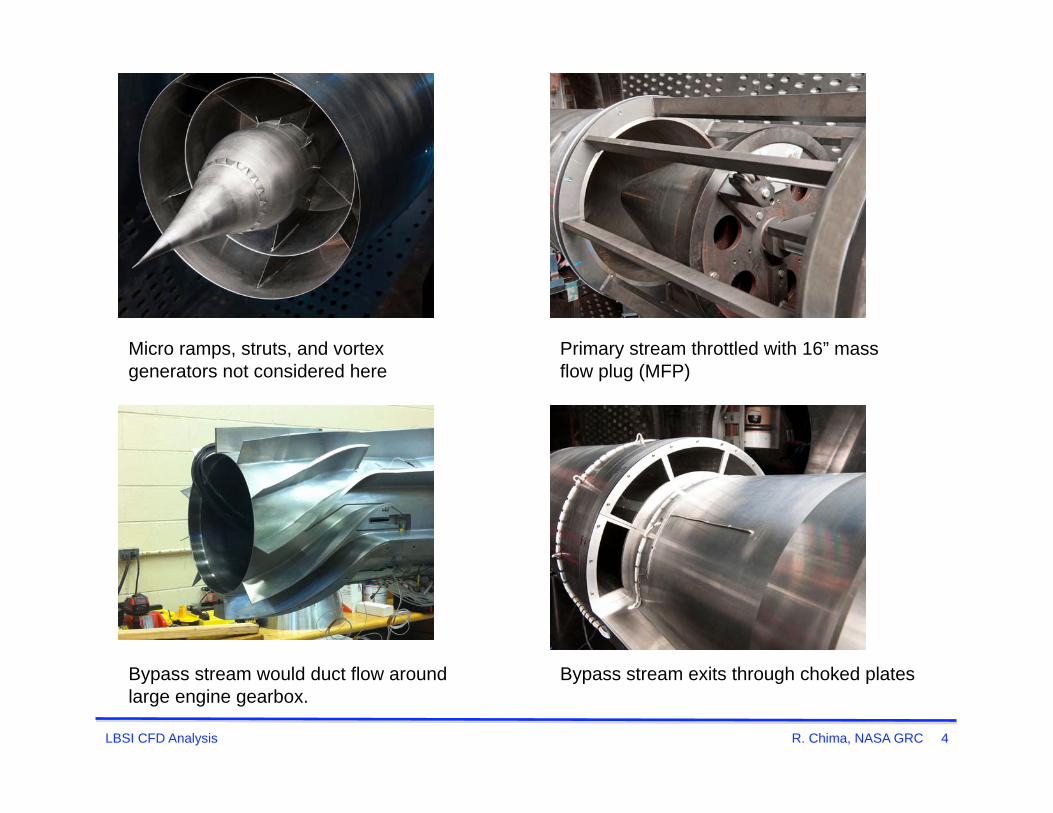
• Aex = 1.2, peak recovery
• Slight discrepancy in shock position
• Axisymmetric solution does not include strut blockage
STRUT
R. Chima, NASA GRC LBSI CFD Analysis

Schlieren Comparisons
16
• Schlieren images taken with high-speed Phantom camera at 2000 fps
• Images include shocks from micro ramps not included in CFD
Actual shock curves into cowl
Apparent shock due to
rotation of actual shock
Shocks from micro ramps
Video cooling
box and ref.
mark
R. Chima, NASA GRC LBSI CFD Analysis

Schlieren Comparison, M = 1.779
17
• Mach number reduced in 0.1 increments (using 8x6 operating points)
• MFP held fixed
• Schlieren images acquired at fixed MFP location
R. Chima, NASA GRC LBSI CFD Analysis

Schlieren Comparison, M = 1.664
18 R. Chima, NASA GRC LBSI CFD Analysis

Schlieren Comparison, M = 1.555
LBSI CFD Analysis 19 R. Chima, NASA GRC
• No schlieren image available at correct MPF position for this Mach number
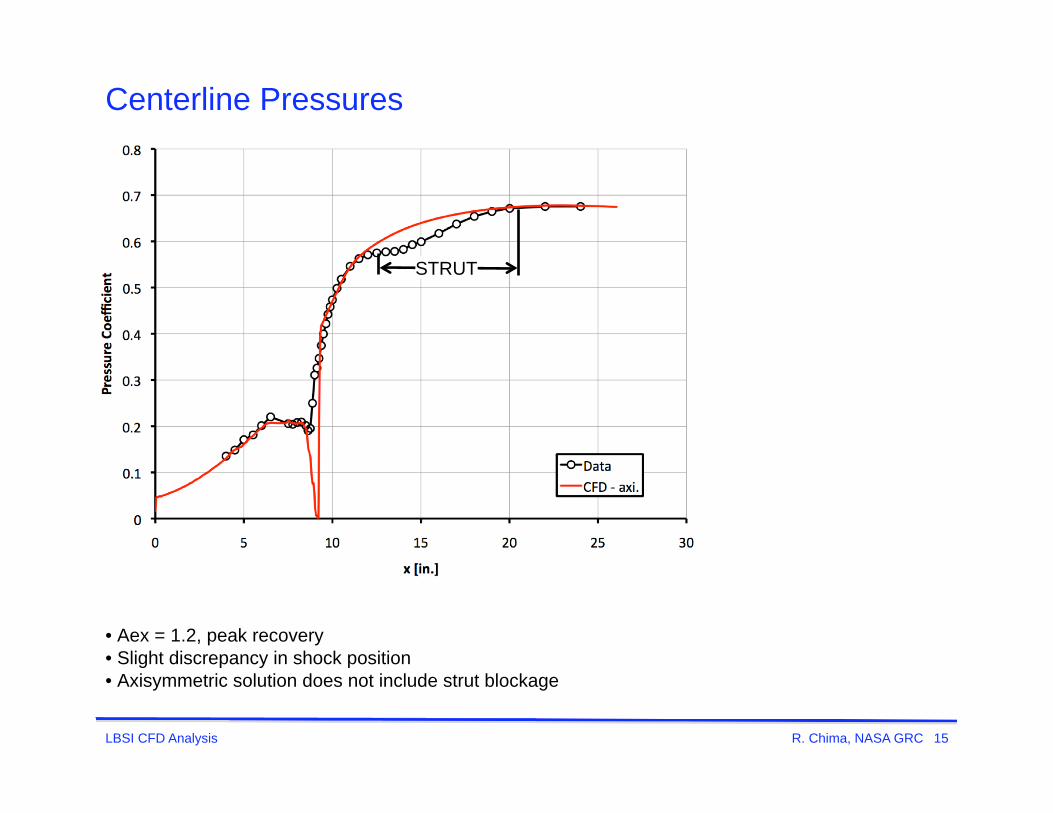
Schlieren Comparison, M = 1.452
20 R. Chima, NASA GRC LBSI CFD Analysis

Schlieren Comparison, M = 1.352
21 R. Chima, NASA GRC LBSI CFD Analysis

Schlieren Comparisons, M = 1.253
22
• Tunnel passed through this point during start up and shut down, but no data taken.
R. Chima, NASA GRC LBSI CFD Analysis

3-D Analysis - Computational Grid
LBSI CFD Analysis 23
Grid details
• 25 blocks, 24 M points
• Wall spacing 1.e-5 in. gives y+ 2. • Full 360°, allows for yaw
Grid Codes
• Main blocks - Pointwise
• Struts - turbomachinery grid code TCGRID (Chima) • Bypass channel grids sheared tangentially with custom code
• Boundary conditions - Gridgen and GMAN (WIND-US utility)
Region Blocks i j k Points
Core 2 279 121 65 4,388,670
Bypass 2 274 121 45 2,983,860
External 4 314 121 65 9,878,440
Struts 5 181 45 65 2,647,125
Core Exit 1 17 441 65 487,305
Bypass Channels 10 193 33 45 2,866,050
Bypass Exit 1 51 321 45 736,695
Totals 25 23,988,145
R. Chima, NASA GRC

Cowl
LBSI CFD Analysis 24 R. Chima, NASA GRC

Bypass Channels
LBSI CFD Analysis 25 R. Chima, NASA GRC

Centerbody and Struts
LBSI CFD Analysis 26 R. Chima, NASA GRC

WIND-US Code
LBSI CFD Analysis 27
Solution scheme
• HLLC (Harten, Lax, van Leer, Contact) upwind scheme
• minmod limiter
• SST turbulence model
Boundary conditions
• Supersonic inflow with M = 1.7
• Bypass exit choked to freestream pressure
• Core exit pressure varied to change capture ratio
Solution details
• Cases run 7,500 – 10,000 iterations with CFL = 2.0
• Core and bypass mass flow and recovery monitored for convergence
• 25 block grid run on 11 CPUs at 3.2 GHz
• 24 – 33 hours per case
R. Chima, NASA GRC

Mach Contours, M = 1.7, = 0°
LBSI CFD Analysis 28
• Capture ratio ~ 0.94
R. Chima, NASA GRC

Mach Contours, Unrolled Surfaces at Mid Span, = 0°
LBSI CFD Analysis 29
Bypass
• Straight shock
• Inner channels nearly choked • Thin wakes from vanes
Core
• Straight shock
• Very thin wakes from struts
R. Chima, NASA GRC
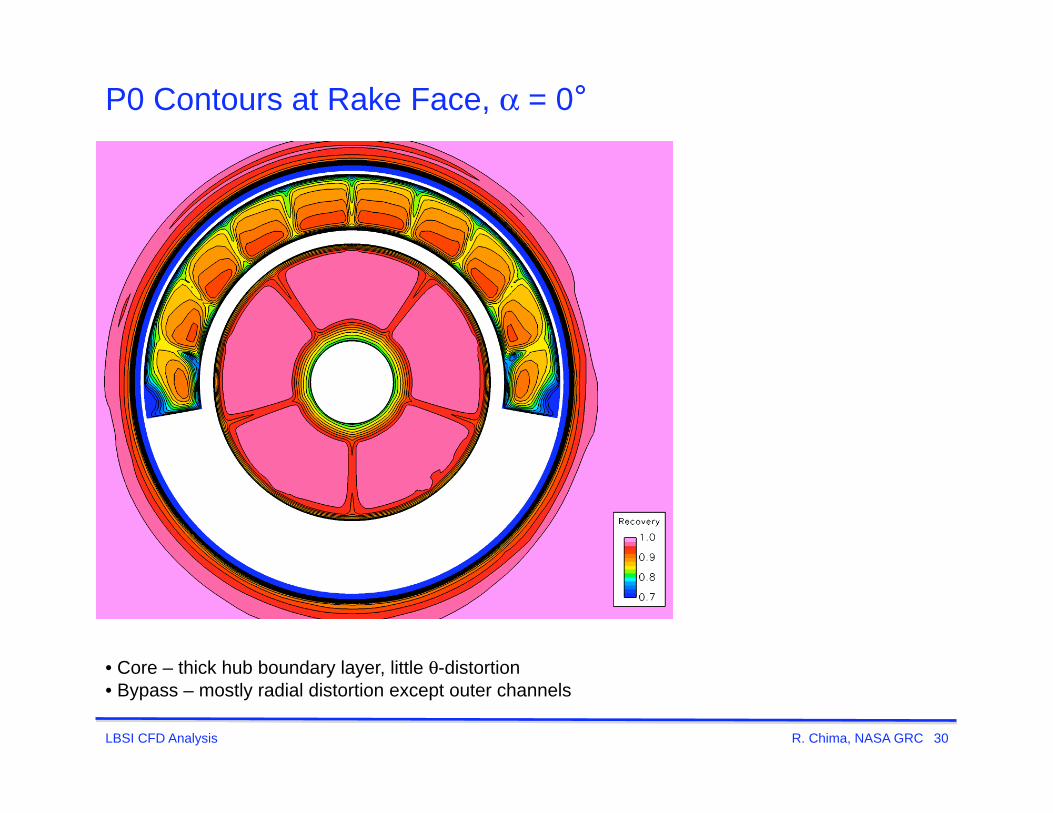
P0 Contours at Rake Face, = 0°
LBSI CFD Analysis 30
• Core – thick hub boundary layer, little -distortion
• Bypass – mostly radial distortion except outer channels
R. Chima, NASA GRC

Core Recovery vs. Capture Ratio
LBSI CFD Analysis 31
• Computed max. capture ratio > measured, but experimental bypass flow rate is not known accurately
• Computed recovery 0.3 – 0.5 points low, evaluated at rake locations
• Black diamonds show operating points compared later
R. Chima, NASA GRC

Bypass Recovery
LBSI CFD Analysis 32
• Computed bypass recovery 1 – 1.5 points low, evaluated at rake locations
• Differences probably because rakes are centered in bypass vane wakes which do not mix out sufficiently
• Differences possibly due to differences between test and flight / CFD geometries
R. Chima, NASA GRC

Rake P0 Profiles, = 0°
LBSI CFD Analysis 33
BY
PA
SS
C
OR
E
• Data and CFD show good L-R symmetry
• Bypass: CFD generally low. Rakes are in bypass vane wakes.
• Core: Excellent agreement between CFD and experiment
R. Chima, NASA GRC
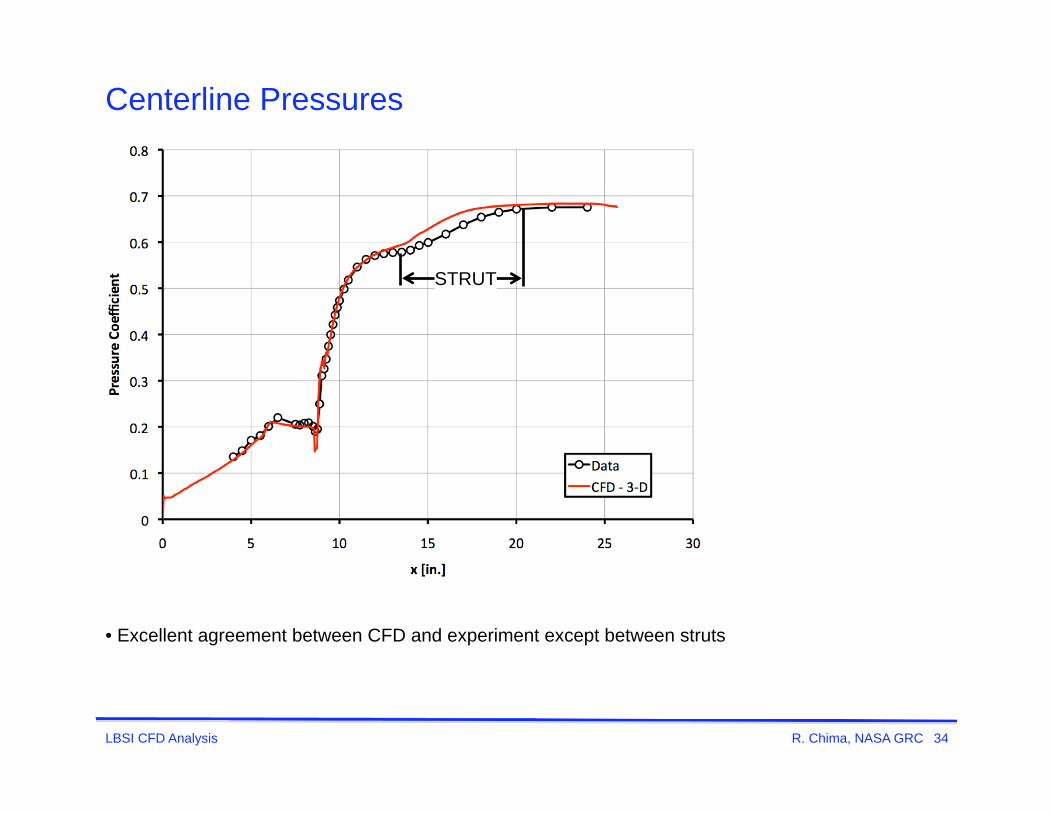
Centerline Pressures
LBSI CFD Analysis 34
• Excellent agreement between CFD and experiment except between struts
STRUT
R. Chima, NASA GRC

Mach Contours, = 5°
LBSI CFD Analysis 35
• Capture ratio ~ 0.89
5°
R. Chima, NASA GRC

P0 Contours at Rake Face, = 5°
LBSI CFD Analysis 36
• Core – thick hub boundary layer, -distortion constrained by struts
• Bypass – mostly radial distortion except outer channels
R. Chima, NASA GRC

Effect of Yaw, = 5°
LBSI CFD Analysis 37
• Yaw not studied experimentally
• Effects of yaw similar to angle of attack
TOP VIEW
5°
R. Chima, NASA GRC

P0 Contours at Rake Face, = 5°
LBSI CFD Analysis 38
• Bypass channels highly asymmetric
• Unusual circumferential distortion in core stream could affect engine operability
R. Chima, NASA GRC
Axisymmetric and 3-D calculations were made of the Gulfstream dual stream low boom inlet before
the test, and results were compared to experimental data. The following results were noted:
Experiment
• The dual stream inlet had excellent core recovery and buzz margin.
Axisymmetric CFD Results
• Predicted core recoveries were about 0.4 points high. When strut losses were omitted from the
experimental data the agreement was excellent.
• AIP profiles agreed very well with measurements, except behind the strut.
• Predicted bypass recoveries were about a point high, probably because channel walls and 3-D
effects were missing in the axisymmetric calculation.
• CFD predictions were used to determine the optimal bypass exit plate size and to set the initial
range of the MFP.
Conclusions (1/2)
LBSI CFD Analysis 39 R. Chima, NASA GRC

3-D CFD Results
• Computed shock positions compared well with schlieren images.
• Computed centerline pressures agreed very well with experimental data.
• CFD predicted a slightly higher max. capture ratio than was measured. However, the bypass mass
flow is not known accurately.
• Predicted core recoveries were 0.3 – 0.5 points low, but AIP profiles agreed very well with
measurements.
• Predicted bypass recoveries were 1 – 1.5 points low, probably due to insufficient mixing of the bypass vane wakes, and bypass rake pressure profiles tended to be low.
Additional results to be presented in two papers at the 29th AIAA Applied Aerodynamics Conference,
June 27-30, 2011, Honolulu, Hawaii.
Conclusions (2/2)
LBSI CFD Analysis 40 R. Chima, NASA GRC