Embed Size (px)
Citation preview

http://www.cag.gov.in/states/karnataka/2006
REPORT OF THE
COMPTROLLER AND
AUDITOR GENERAL OF INDIA
(CIVIL)
FOR THE YEAR ENDED 31 MARCH 2006
GOVERNMENT OF KARNATAKA


TABLE OF CONTENTS
Paragraph Number
Page Number
Preface ix
Overview xi
CHAPTER I
FINANCES OF THE STATE GOVERNMENT
Introduction 1.1 2
Summary of Receipts and Disbursements 1.1.1 2
Fiscal Reforms path in Karnataka 1.1.2 3
Fiscal Policy Statements 1.1.3 4
Road Map to Achieve the Fiscal Targets as laid
down in the Act
1.1.4 4
Mid-Term Review of Fiscal situation 1.1.5 4
Overview of the Fiscal situation of the State 1.2 5
Trends in fiscal aggregates 1.2.1 5
Audit Methodology 1.3 5
State Finances by key indicators 1.4 6
Resources by volumes and sources 1.4.1 6
Revenue Receipts 1.4.2 6
Sources of Receipts – Trends 1.4.3 9
Applications of Resources 1.5 9
Growth of Expenditure 1.5.1 9
Incidence of Revenue Expenditure 1.5.2 11
Committed Expenditure 1.5.3 12
Expenditure by allocative priorities 1.6 15
Quality of Expenditure 1.6.1 15
Expenditure on Social Services 1.6.2 16
Expenditure on Economic Services 1.6.3 17
Financial assistance to Local bodies and other
Institutions
1.6.4 18
Delay in furnishing Utilization Certificates 1.6.5 19
Non-submission of Accounts 1.6.6 19
Audit of performance of Autonomous Bodies 1.6.7 19

Audit Report (Civil) for the year ended 31 March 2006
Paragraph Number
Page Number
Misappropriations, Losses, defalcations, etc 1.6.8 19
Write-off of losses, etc 1.6.9 19
Assets and liabilities 1.7 20
Incomplete projects 1.7.1 20
Investments and Returns 1.7.2 20
Loans and Advances by State Government 1.7.3 21
Management of Cash Balances 1.7.4 21
Un-discharged liabilities 1.8 22
Fiscal Liabilities – Public Debt and Guarantees 1.8.1 22
Status of Guarantees- Contingent liabilities 1.8.2 24
Off-budget borrowings 1.8.3 25
Debt sustainability 1.8.4 25
Net availability of Borrowed funds 1.8.5 26
Management of deficits 1.9 26
Fiscal Ratios 1.10 27
Conclusion 1.11 29
CHAPTER II
ALLOCATIVE PRIORITIES AND APPROPRIATION
Introduction 2.1 37
Summary of Appropriation Accounts 2.2 37
Fulfillment of allocative priorities 2.3 38
Appropriation by Allocative Priorities 2.3.1 38
Persistent Unspent provision 2.3.3 38
Surrender of Unspent Provisions 2.3.4 38
Excess requiring regularization 2.4 39
Persistent excesses 2.4.3 40
Original and Supplementary Budget provisions 2.5 40
Unnecessary/insufficient/excessive supplementary
provisions
2.5.1 40
Excessive/unnecessary re-appropriation of funds 2.5.2 40
Un-reconciled expenditure 2.5.3 41
Errors in budgeting 2.5.4 41
ii

Table of contents
Paragraph Number
Page Number
Defective re-appropriation 2.6 41
Rush of Expenditure 2.7 41
New Service/New Instrument of service 2.8 42
Expenditure without budget provision 2.9 42
Contingency fund 2.10 42
CHAPTER III
PERFORMANCE REVIEWS
FOREST, ENVIRONMENT AND ECOLOGY DEPARTMENT
Implementation of Project Tiger 3.1 43
HOUSING DEPARTMENT
Implementation of VAMBAY and SUDP by Karnataka Slum Clearance Board
3.2 57
PUBLIC WORKS DEPARTMENT
Development and Maintenance of Major District Roads 3.3 69
URBAN DEVELOPMENT DEPARTMENT
Urban Water Supply Schemes 3.4 83
EDUCATION DEPARTMENT
Sarva Shiksha Abhiyan 3.5 93
FINANCE DEPARTMENT
Computerisation of Treasuries in Karnataka – ‘Khajane’ 3.6 106
HORTICULTURE DEPARTMENT
Working of Horticultural Farms 3.7 121
iii

Audit Report (Civil) for the year ended 31 March 2006
Paragraph Number
Page Number
CHAPTER IV
AUDIT OF TRANSACTIONS
Infructuous/Wasteful expenditure and overpayments 4.1
PUBLIC WORKS DEPARTMENT (COMMUNICATION AND BUILDINGS)
Wasteful expenditure on a road work 4.1.1 123
Avoidable/Extra/Unfruitful expenditure 4.2
FOREST, ENVIRONMENT AND ECOLOGY DEPARTMENT
Unfruitful expenditure on restoration of a lake 4.2.1 124
PUBLIC WORKS DEPARTMENT (PORTS AND INLAND WATER TRANSPORT)
Excess payment due to incorrect computation 4.2.2 125
WATER RESOURCES DEPARTMENT (MINOR IRRIGATION)
Excess payment to a contractor 4.2.3 126
Extra contractual payments 4.2.4 128
Idle investment/idle establishment/blockage of funds 4.3
PUBLIC WORKS DEPARTMENT (PORTS AND INLAND WATER TRANSPORT)
Non-execution of port development works 4.3.1 129
TOURISM DEPARTMENT
Non-implementation of project despite the receipt of Central assistance
4.3.2 130
URBAN DEVELOPMENT DEPARTMENT
Non-completion of a sewage disposal project 4.3.3 130
WATER RESOURCES DEPARTMENT (MINOR IRRIGATION)
Unproductive outlay on a minor irrigation tank 4.3.4 131
iv

Table of contents
Paragraph Number
Page Number
Violation of contractual obligation/undue favour to contractors
4.4
PUBLIC WORKS DEPARTMENT (COMMUNICATION AND BUILDINGS) & WATER RESOURCES DEPARTMENT (MINOR IRRIGATION)
Undue benefit to contractors 4.4.1 133
Regularity issues and other topics 4.5
HIGHER EDUCATION DEPARTMENT
Grant-in-aid to private degree colleges 4.5.1 134
FINANCE DEPARTMENT
Inspection of Treasuries 4.5.2 139
Abstract Contingent Bills 4.5.3 140
Personal Deposit Accounts 4.5.4 143
REVENUE DEPARTMENT
Diversion of calamity relief funds 4.5.5 145
General 4.6
Follow-up on Audit Reports 4.6.1 145
Inspection Reports outstanding 4.6.2 147
Non-receipt of stores and stock accounts 4.6.3 148
CHAPTER V
INTERNAL CONTROL SYSTEM
COOPERATION DEPARTMENT
Evaluation of Internal Control System 5.1 149
v

Audit Report (Civil) for the year ended 31 March 2006
LIST OF APPENDICES
Appendix No. Details Page
No.
1.1
Part A: Structure and form of Government accounts 165
Part B: Layout of Finance Accounts 166
Part C: List of terms used in Chapter I and basis for their calculation
167
1.2 Outcome indicators of the State’s own fiscal correction path 168 1.3 Utilisation Certificates outstanding as on 31 March 2006 169 1.4 Non-submission of accounts 171 1.5 Audit of performance of the autonomous bodies 172 1.6 Department-wise details of cases of misappropriations/
defalcations 173
1.7 Department-wise details of cases of write-off during 2005-06 174 2.1 Major heads of account in which huge provisions remained
unspent 175
2.2 Unspent provisions due to non/short release of funds 177
2.3 Persistent unspent provision in excess of Rs.25 lakh and 10 per cent or more of the provision
178
2.4 Cases where amount of unspent provision was not surrendered 180
2.5 Excess requiring regularisation 182
2.6 Persistent excesses exceeding Rs.20 lakh 183
2.7 Cases where supplementary provisions proved unnecessary 184
2.8 Cases where supplementary provisions proved insufficient 185
2.9 Cases where supplementary provisions proved excessive 186
2.10 Injudicious re-appropriation of funds 187
2.11 Statement showing the errors in budgeting 195
2.12 Cases of defective re-appropriation orders 196
2.13 Statement showing flow of expenditure during the four quarters of 2005-06
198
2.14 Cases of new service/new instrument of service 199
2.15 Expenditure without budget provision 2005-06 201
3.1 Delay in release of funds 204
vi

Table of contents
Appendix No. Details Page
No. 3.2 Shortfall in achievement during the period 2001-06 205 3.3 Statement showing the avoidable expenditure due to
unwarranted widening of roads 206
3.4 Statement showing the shortfall in crust thickness 207 3.5 Statement showing shortfall in quality control tests 209 3.6 Statement showing the IRI values of MDRs 210 3.7 Summary of findings of beneficiary survey conducted by Social
and Rural Research Institute (SRI) – IMRB International 211
3.8 Statement showing selected component-wise allocation and expenditure during 2001-04
215
3.9 Dropout rate for primary and upper primary schools 216 4.1 Statement showing the wasteful expenditure 217
4.2 Excess Payment of Family Pension 218 4.3 Continued Excess Payment of Family Pension 219 4.4 Non-receipt of GPF Recovery Schedules 220 4.5 Non-receipt of GPF Withdrawal Vouchers 221 4.6 Balances held in PD accounts at the end of 2005-06 222
4.7 Non-Reconciliation of balances in PD Account as at the end of March 2006
223
4.8 Paragraphs for which Action Taken Notes had not been received as of October 2006 (excluding General and Statistical Paragraphs)
224
4.9 Paragraphs (excluding General and Statistical) yet to be discussed by Public Accounts Committee as of October 2006
225
4.10 Year-wise breakup of Inspection Reports outstanding 226 4.11 (A) Irregularities noticed in the IRs pertaining to Sericulture
Department 227
(B) Irregularities noticed in the IRs pertaining to Judiciary Department
228
(C) Irregularities noticed in the IRs pertaining to Water Resources Department
229
(D) Irregularities noticed in the IRs pertaining to Minor Irrigation Department
230
(E) Irregularities noticed in the IRs pertaining to Public Works Department
231
5.1 Contribution of excess share capital by Government 232
vii

PREFACE
1. This Report has been prepared for submission to the Governor under
Article 151 of the Constitution.
2. Chapters I and II of this Report respectively contain audit observations on matters arising from examination of Finance Accounts and Appropriation Accounts of the State Government for the year ended 31 March 2006.
3. Chapter III deals with the findings of performance audit while
Chapter IV deals with findings of audit of transactions in various departments including the Public Works and Water Resources Departments, Autonomous Bodies, etc. Chapter V deals with comments on Internal Control System existing in a selected department in the State.
4. The Reports containing points arising from audit of the financial
transactions relating to Zilla Panchayats, Statutory Corporations & Government Companies and Revenue Receipts are presented separately.
5. The cases mentioned in the Report are among those which came to notice
in the course of test-audit of accounts during the year 2005-06 as well as those which had come to notice in earlier years but could not be dealt with in previous Reports; matters relating to the periods subsequent to 2005-06 have also been included, wherever necessary.
ix

OVERVIEW This report contains five chapters of which the first two contain the observations on the accounts of the State Government for 2005-06 and the other three contain audit comments in the form of seven reviews, one long paragraph and 18 paragraphs on selected schemes, programmes and financial transactions of the Government. A summary of main audit findings is presented in this overview.
1. Financial position of the State Government
The State ended the year 2005-06 with a revenue surplus of Rs.2,311 crore against Rs.1,638 crore in the previous year. Taxes on sales, trade etc., contributed 53 per cent of tax revenue followed by state excise (18 per cent), stamp duty and registration fees (12 per cent) and taxes on vehicles (6 per cent). Arrears of revenue stood at Rs.3,620 crore at the end of 2005-06.
Fiscal deficit for the year was Rs.3,687 crore representing two per cent of the GSDP.
Revenue expenditure (Rs.28,041 crore) as a percentage of GSDP increased from 16 per cent to 17 per cent while capital expenditure increased from two to three per cent during 2000-06. The committed expenditure on salaries, interest payments and pension consumed 39 per cent of the revenue receipts.
Outstanding liabilities of the State increased from Rs.26,571 crore in 2000-01 to Rs.52,236 crore in 2005-06 and their ratio to GSDP increased from 25 per cent to 31 per cent during the period and would be 34 per cent taking into account the off-budget borrowings (Rs.5,319 crore) of the State Government in 2005-06.
The amount guaranteed by the State Government on behalf of statutory corporations, Government companies, etc and outstanding as of March, 2006 was Rs.8,984 crore.
As at the end of 2005-06, the total investments in statutory corporations, Government companies was Rs.14,053 crore but the return (Rs.17 crore) was negligible.
(Paragraphs 1.1 to 1.10)
Against total budget provision of Rs.41,528.17 crore including (supplementary grants), actual expenditure was Rs.36,208.66 crore. Overall unspent provision of Rs.5,319.51 crore was the result of unspent provision of Rs.6,128.53 crore in 29 grants/appropriation and excess of Rs.809.02 crore in five grants / appropriation. The excess of Rs.809.02 crore required regularisation by the Legislature under Article 205 of the Constitution of India.
(Paragraphs 2.2)
xi

Audit Report (Civil) for the year ended 31 March 2006
2. Implementation of Project Tiger Project Tiger, a Centrally sponsored scheme is implemented in Bandipur National Park, Bhadra Wildlife Sanctuary and Rajiv Gandhi (Nagarahole) National Park for sustaining a viable tiger population in the State. The conservation and protection measures initiated under the project were unsatisfactory due to deficiencies in planning and inadequate release of funds. Shortage of frontline protection staff, lack of training in use of sophisticated fire arms and their supply and deficient communication network in the Reserves rendered the protection measures largely ineffective.
(Paragraph: 3.1) 3. Implementation of VAMBAY and SUDP by Karnataka Slum
Clearance Board Valmiki Ambedkar Awas Yojana was implemented in the State from August 2001 through the Karnataka Slum Clearance Board with the aim of providing shelter or upgrading existing shelter in the slum areas. Though construction of 25,841 houses was completed and 25,132 houses allotted to the beneficiaries, transfer of title in their favour had been done only in respect of 96 houses. The process was compounded by construction of 2,881 houses in non-declared areas and on private land. A Slum Upgradation and Development Programme for providing common infrastructure facilities in these areas was also under execution by the Board. Infrastructure works undertaken in four cities scheduled for completion in one year were incomplete even 14 to 25 months after the due dates as all of them were entrusted to a single contractor.
(Paragraph: 3.2) 4. Development and maintenance of major district roads The Karnataka State Public Works Department is responsible for the development and maintenance of Major District Roads in the State. Short-release of funds for execution of development works led to accumulation of liabilities to Rs.203.98 crore at the end of March 2006. Non-prioritisation of road widening works resulted in avoidable expenditure of Rs.4.02 crore as the traffic intensity of these roads did not warrant such widening. Adoption of incorrect design parameters for 26 roads costing Rs.27.73 crore resulted in construction of their pavements with less thickness and thus prone to premature failures. In 11 cases, the pavement thickness was in excess resulting in avoidable extra expenditure of Rs.10.60 crore. Execution of surface dressing works in contravention of Indian Road Congress norms resulted in wasteful expenditure of Rs.2.22 crore on 42 road improvement works. Execution of maintenance and repair works was undertaken under piecework system which was irregular and also resulted in non-enforcement of quality control checks. The quality control tests for ensuring execution of works according to prescribed standards for different stages of pavement works were also deficient.
(Paragraph: 3.3)
xii

Overview
5. Urban Water Supply Schemes Urban Water Supply Schemes were implemented in the State through the Karnataka Urban Water Supply and Drainage Board. Out of 40 schemes taken up for execution during 2001-06, only 25 had been completed. Project management and contract management were deficient resulting in avoidable extra expenditure/liability, unfruitful expenditure and excess payments aggregating Rs.5.20 crore. Water supply charges of Rs.145.04 crore due from Urban Local Bodies and consumers had not been collected by the Board. Non-release of full component of State Finance Commission grants by the Government for debt servicing led to diversion of plan funds and avoidable payment of penal interest of Rs.1.83 crore.
(Paragraph: 3.4)
6. Sarva Shiksha Abhiyan Sarva Shiksha Abhiyan aims at providing universal elementary education in a mission mode, by providing useful and relevant education for all children in the age group of 6-14 years by 2010. Implementing agencies could not absorb even the reduced level of funds released due to deficiencies in planning. The aim of having all children in schools by 2005 was not accomplished and also the trends in dropout rate indicated unlikely achievement of universal retention by 2010. Only 1,541 schools were opened against the sanction of 2,087 new schools and basic infrastructure needs were available in only 41 per cent of Government schools. While only 13 per cent of the children with special needs received assistance during 2004-05, less than one per cent of the upper primary schools had access to computer education. Neither the involvement of non-governmental organisations was as envisaged nor was the monitoring of the scheme adequate.
(Paragraph: 3.5)
7. Computerisation of Treasuries in Karnataka (Khajane) The project ‘Khajane’ was implemented with the aim of providing the details of expenditure made by the Drawing and Disbursing Officers, Controlling Officers and Chief Controlling Officers for the purpose of reconciliation, restricting payments at the treasuries to budget allocations, ascertaining the Ways and Means position of Government etc. Deficiencies in IT operations and controls existed such as ensuring correctness of payments made to Housing Development Finance Corporation; uploading of budget related data from the Finance Department package, storage of back up data off-site. Codal provisions for awarding the contracts for establishing network connectivity were not followed.
(Paragraph: 3.6)
xiii

Audit Report (Civil) for the year ended 31 March 2006
8. Evaluation of Internal Control System Internal control system is an integrated process by which an organisation governs its activities to effectively achieve its objectives. It consists of methods and policies designed to protect resources against loss due to waste, abuse and mismanagement. The Cooperation Department was established with the primary objective of organising and managing genuine cooperatives on sound lines as per basic principles of cooperation for the promotion of economic interests and welfare of the people and rendering guidance and assistance for the development of cooperative movement in the State. Evaluation of the internal control system in the Department disclosed that budgetary controls were not effective as there were instances of defective preparation of estimates and substantial funds were either not surrendered or surrendered at the end of the year. The operational controls were also not effective resulting in accumulation of arrears in audit, inspections remaining incomplete and misappropriation of Rs.81.67 crore involving departmental employees, staff and office bearers of societies. Inadequate monitoring led to accumulation of outstanding loans and interests. This was compounded by the absence of internal audit.
(Paragraph: 5.1)
9 Working of Horticultural Farms With the objective of demonstration of the cultivation of economically important horticultural crops and development of centres of propagation of planting material, the Government established 244 horticultural farms and nurseries. However, no farm policy was adopted and there was no prioritisation of potentially viable farms for development resulting in thin spreading of resources across the farms. There was low yield of fruit crops even from trees in the economic bearing period as measures for proper irrigation and other practices were not in place.
(Paragraph: 3.7)
10. Audit of Transactions Infructuous/Wasteful expenditure and overpayments
• Though the road of Bangalore-Nilgiri State Highway (SH-17) was to be converted into a four-lane carriageway, failure of Government to forestall the execution of improvement works in selected stretches in Mandya District resulted in wasteful expenditure of Rs.1.68 crore.
(Paragraph: 4.1.1) Avoidable/Extra/Unfruitful expenditure
• Defective project formulation by the Government for restoration of a polluted lake and implementation of the project by Lake Development Authority without arresting the sewage entering into the lake resulted in unfruitful expenditure of Rs.1.76 crore.
(Paragraph: 4.2.1)
xiv

Overview
• Incorrect computation of extra quantities without considering the tender quantities by the Director of Ports and Inland Water Transport Department while regulating payment to the contractor resulted in excess payment of Rs.2.18 crore.
(Paragraph: 4.2.2)
• The Divisional Officer, Minor Irrigation, Gulbarga made excess payment of Rs.3.58 crore to the contractor without regulating payments in accordance with the terms of agreement towards additional dewatering charges, diversion of water course and transportation of excavated hard rock.
(Paragraph: 4.2.3) Idle investment/idle establishment/blockage of funds
• Construction of a minor irrigation tank at Kamatnoor in Hukkeri Taluk of Belgaum district without synchronising its execution with its canal works which also breached due to non-supervision by the Minor Irrigation Division, Belgaum during execution resulted in unproductive outlay of Rs.5.51 crore.
(Paragraph: 4.3.4)
• Execution of scarcity relief works by Public Works Department and Water Resources Department through contractors and issue of food grains to them on concessional rates resulted in undue benefit of Rs.2.53 crore besides depriving direct employment to the drought affected farmers.
(Paragraph: 4.4.1) Regularity issues and other points
• While providing Grant-in-aid to the private management colleges, the Government irregularly released grants of Rs.40.48 crore to ineligible colleges and colleges without the Certificate of Accreditation. Release of grants of Rs.4.90 crore was also made due to incorrect fixation of pay and lecturers without prescribed workload.
(Paragraph: 4.5.1)
• Excess payment of family pension of Rs.1.19 crore was made by Public Sector Banks beyond the indicated period in 629 cases relating to 28 district treasuries.
(Paragraph: 4.5.2)
xv

CHAPTER I
FINANCES OF THE STATE GOVERNMENT
Summary
The State Government formulated the first Medium Term Fiscal Plan (MTFP) for the period 2000-01 to 2004-05 based on broad parameters of fiscal correction laid down by the Eleventh Finance Commission. The statutory backing for MTFP was provided by the Karnataka Fiscal Responsibility Act, 2002 (Act), which came into force from 1 April 2003. The Act, inter-alia, provided for elimination of revenue deficit and reduction of fiscal deficit to not more than three per cent of the Gross State Domestic Product (GSDP) by the end of 2005-06. The State achieved these fiscal goals one year ahead, with the year 2004-05 ending in revenue surplus of Rs.1,638 crore. Fiscal deficit increased marginally from Rs.3,600 crore in 2004-05 to Rs.3,687 crore in 2005-06. Its ratio to GSDP was less than three per cent during the years 2004-05 and 2005-06. Revenue surplus increased to Rs.2,311 crore in 2005-06.
Revenue of the State consisting of its tax and non-tax revenue, Central tax transfers and grants-in-aid from Government of India (GOI) increased by 105 per cent from Rs.14,823 crore in 2000-01 to Rs.30,352 crore in 2005-06. Taxes on sales, trade etc., was the major source of tax revenue which contributed 53 per cent followed by state excise (18 per cent), stamps and registration fees (12 per cent) and taxes on vehicles (6 per cent). Arrears of revenue increased by 91 per cent from Rs.1,894 crore in 2000-01 to Rs.3,620 crore to end of 2005-06.
Overall expenditure of the State increased by 78 per cent from Rs.19,143 crore in 2000-01 to Rs.34,163 crore in 2005-06. Revenue expenditure increased from Rs.16,685 crore in 2000-01 to Rs.28,041 crore in 2005-06 (increase:68 per cent). While plan expenditure increased from Rs.3,481 crore to Rs.5,069 crore (increase: 46 per cent) only, the non-plan expenditure increased from Rs.13,204 crore to Rs.22,972 crore (increase: 74 per cent). Interest payments at 12 per cent of revenue receipts were below the limit of 15 per cent prescribed by the Twelfth Finance Commission for the year 2005-06. The expenditure on salaries increased from Rs.4,630 crore in 2000-01 to Rs.5,932 crore in 2005-06. Pension payments constituted seven per cent of total revenue receipts in 2005-06. Subsidies paid to various corporations etc., increased from Rs.1,514 crore in 2000-01 to Rs.3,712 crore in 2005-06. Capital expenditure increased by 149 per cent from Rs.2,458 crore in 2000-01 to Rs.6,122 crore in 2005-06.
The ratio of fiscal liabilities (Rs.52,236 crore) to GSDP was 31 per cent in 2005-06 and would be 34 per cent taking into account the off-budget borrowings (Rs.5,319 crore) of the State in 2005-06.
Net Availability of borrowed funds increased during 2005-06 mainly due to consolidation and rescheduling of Central loans.
The amount guaranteed by the State Government on behalf of Statutory Corporations, Government Companies, etc and outstanding as of March, 2006 was Rs.8,984 crore.
The return from investments to Government companies continued to be meagre and was at 0.1 per cent in 2005-06 as against the weighted interest rate of 9.2 per cent on the borrowings of the State Government.

Audit Report (Civil) for the year ended 31 March 2006
1.1 Introduction
The accounts of the State Government are kept in three parts (i) Consolidated Fund, (ii) Contingency Fund and (iii) Public Account (Appendix 1.1-Part A). The Finance Accounts of the Government of Karnataka are laid out in 19 statements, presenting receipts and expenditure, revenue as well as capital, in the Consolidated Fund, the Contingency Fund and the Public Account of the State. The layout of the Finance Accounts is depicted in Appendix 1.1-Part B.
1.1.1 Summary of Receipts and Disbursements
Table 1 below summarises the finances of the Government of Karnataka for the year 2005-06 as compared to the previous year, covering revenue receipts and expenditure, capital receipts and expenditure, contingency fund transactions and public account receipts/disbursements as emerging from statement-1 of Finance Accounts and other detailed statements.
Table 1: Summary of Receipts and Disbursements (Rupees in crore)
2004-05 Receipts 2005-06 2004-05 Disbursements 2005-06 Section-A: Revenue
Non-Plan Plan Total 26,569.66♣ Revenue receipts 30,352.05 24,931.85♣ Revenue expenditure 22,972.22 5068.67 28,040.89
16,072.32♣ Tax revenue 18,631.55 9,900.24 General Services 10,023.81 12.01 10,035.82
4,472.34♣ Non-tax revenue 3,874.71 7,722.75 Social Services 5,787.97 3,110.82 8,898.79 3,878.44 State’s share of Union
Taxes and Duties 4,213.42 6,510.52♣
Economic Services 6,001.48 1,945.84 7,947.32
2,146.56 Grants from GOI 3,632.37 798.34 Grants-in-aid/Contributions 1,158.96 --- 1,158.96 Section-B: Others
-- Misc. Capital Receipts --- 4,673.68 Capital Outlay 15.53 5,806.40 5,821.93 46.85♣ Recoveries of Loans
and Advances 123.55 611.43
Loans and Advances disbursements
43.66 255.94 299.60
8,509.43 Public debt receipts 5,663.55 4,029.40 Repayment of Public Debt 810.86 --- 810.86 40.52 Contingency Fund
(recoupment) 38.91
38.91 Contingency Fund --- --- ---
36,325.19 Public account Receipts
38,025.00 35,462.75
Public account disbursements
--- --- 36,702.25
335.48 Opening Cash Balance 2,079.11 2,079.11 Closing Cash Balance 4,606.64 71,827.13 Total 76,282.17 71,827.13 Total 23,842.27 11,131.01 76,282.17
♣ Refer explanatory note no.5 below Statement-III -Sources and Applications of Funds.
Following are the significant changes in receipts and disbursements during 2005-06 over the previous year:
• Revenue receipts grew by Rs.3,782 crore due to rise in tax revenue (Rs.2,560 crore), grants from GOI (Rs.1,485 crore) and State’s share of union taxes and duties (Rs.335 crore), partly off-set by fall in non-tax revenue (Rs.598 crore).
• Revenue expenditure increased by Rs.3,109 crore. Increase was mainly under social services (Rs.1,176 crore) and economic services (Rs.1,436 crore).
• Capital outlay was more by Rs.1,148 crore. Enhanced outlay was mainly under social services sector (Rs.619 crore) and economic services sector (Rs.447 crore).
2

Chapter I - Finances of the State Government
• Public debt receipts decreased by Rs.2,845 crore due to reduction in internal debt (Rs.1,958 crore) and loans from Government of India (Rs.887 crore).
• Repayment of public debt was less by Rs.3,218 crore mainly due to consolidation and rescheduling of repayment of Central loans under Debt Consolidation Relief Facility recommended by the Twelfth Finance Commission (TFC).
• Cash balance of the State Government increased by Rs.2,528 crore.
1.1.2 Fiscal Reforms Path in Karnataka
In Karnataka, fiscal reforms and consolidation were brought to the forefront with the State Government formulating the first Medium Term Fiscal Plan (MTFP) for the period 2000-01 to 2004-05 based on broad parameters of fiscal correction laid down by the Eleventh Finance Commission (EFC). MTFP became a rolling annual document to report on the actual performance of the State against fiscal targets of the previous year and to put in place a multi-year medium term reform framework dovetailed to the budgetary exercise.
The statutory backing for MTFP was provided by the Karnataka Fiscal Responsibility Act, 2002 (Act), which came into force from 1 April 2003. The Act aims to ensure fiscal stability and sustainability, enhance the scope for improving social and physical infrastructure and human development by achieving revenue surplus, reducing fiscal deficit, removing impediments to the effective conduct of fiscal policy and prudent debt management through limits on borrowings, debt and deficits, greater transparency in fiscal operations by the use of medium-term fiscal framework.
To give effect to the fiscal management principles, the Act prescribed the following fiscal targets for the State Government.
• Elimination of revenue deficit by the end of the financial year 2005-06.
• Reduction of fiscal deficit to not more than three per cent of the estimated Gross State Domestic Product (GSDP) by the end of the financial year 2005-06.
• Limiting the total liabilities to not more than 25 per cent of the estimated GSDP within a period of 13 financial years, i.e., by the end of the financial year 2014-15.
• Maintaining outstanding guarantees within the limit stipulated under the Karnataka Ceiling to Government Guarantees Act, 1999.
Revenue and fiscal deficits may exceed the specified limits due to unforeseen demands on the State finances on account of natural calamities to the extent of actual fiscal costs attributable to the situation.
3
Audit Report (Civil) for the year ended 31 March 2006
1.1.3 Fiscal Policy Statements 2005-06
The State Government has laid the Medium Term Fiscal Plan (MTFP) for the period 2005-09 before the State Legislature along with the annual budget for the year 2005-06, which inter alia contained:
• medium term fiscal objectives of the State Government.
• evaluation of the performance of the prescribed fiscal indicators in the previous year.
• recent economic trends and prospects for growth and development.
• strategic priorities and key fiscal policies of the Government and evaluation of their consistency.
• four year rolling targets.
• assessment of sustainability relating to the revenue deficit and the use of capital receipts for productive purposes.
1.1.4 Roadmap to achieve the fiscal targets as laid down in the Act
Keeping in view the fiscal targets laid down in the Act, the anticipated annual rate of reduction of fiscal deficit of the States worked out by the Government of India for the TFC award period, the State Government has developed its own fiscal correction path indicating the milestones of outcome indicators with target dates of implementation during the period from 2004-05 to 2009-10 (Appendix 1.2).
The State achieved the fiscal targets laid down in the Act one year ahead, with the year 2004-05 ending in revenue surplus of Rs.1,638 crore. Fiscal deficit of Rs.3,600 crore was below three per cent of GSDP. Guarantees given by the State Government were within the prescribed limit. The ratio of fiscal liabilities to GSDP showed declining trend and was around 31 per cent in 2005-06 exclusive of off-budget borrowings. As a result, the State got the full benefit of incentive grants of Rs.286 crore for the EFC award period. The State also got interest relief of Rs.292 crore under Debt Consolidation and Relief Facility (DCRF) and waiver of Central loans of Rs.358 crore under Debt Write-off Scheme (DWS) for the year 2005-06.
1.1.5 Mid-term review of fiscal situation
According to the half-yearly review report placed before the State Legislature in compliance to the provisions of the Act, realisation of revenues to end of September 2005 was on target. Keeping in view additional expenditure approved in supplementary estimates, the half-yearly review acknowledged the need for expenditure restraints in the remaining period of the year. Expenditure at the year end was within the targets projected in MTFP.
4

Chapter I - Finances of the State Government
1.2 Overview of Fiscal situation of the State 1.2.1 Trends in fiscal aggregates The fiscal position of the State Government during the current year as compared to the previous year is given in Table 2:
Table 2 : Trends in fiscal aggregates (Rupees in crore)
2004-05 Serial Number Major Aggregates 2005-06 26,570* 1. Revenue Receipts (2+3+4) 30,352 16,072* 2. Tax Revenue 18,632 4,473* 3. Non-Tax Revenue 3,875 6,025 4. Other Receipts 7,845
47* 5. Non-Debt Capital Receipts Loans and Advances recovered
124
26,617 6. Total Receipts (1+5) 30,476 20,023 7. Non-Plan Expenditure (8+10+11) 23,032 19,807 8. On Revenue Account 22,972 3,794 9. Interest Payments 3,765
88 10. On Capital Account 16 128 11. Loans and Advances disbursed 44
10,194 12. Plan Expenditure (13+14+15) 11,131 5,125 13. On Revenue Account 5,069 4,586 14. On Capital Account 5,806
483 15. Loans and Advances disbursed 256 30,217 16. Total Expenditure (7+12) 34,163 3,600 17. Fiscal Deficit (16-(1+5)) 3,687 1,638 18. Revenue Surplus (1-8-13) 2,311
194 19. Primary Surplus (9-17) 78 * refer explanatory note No.5 below Sources and Applications of Funds
1.3 Audit Methodology Audit observations on the statements of Finance accounts for the year 2005-06 bring out the trends in major fiscal aggregates of receipts and expenditure; wherever necessary, analyse these in the light of time series data (Statement IV) and periodic comparisons. Major fiscal aggregates like tax and non-tax revenue, revenue and capital expenditure, internal debt and revenue and fiscal deficits have been presented as percentage to the GSDP at current market prices. The new GSDP series with 1993-94 as base as published by the Director of Economics and Statistics of the State Government have been used. For tax revenue, non-tax revenue, revenue expenditure, etc., buoyancy projections have also been provided for a further estimation of the range of fluctuations with reference to the base represented by GSDP. The key indicators adopted for the purpose are (i) resources by volumes and sources, (ii) application of resources (iii) assets and liabilities and (iv) management of deficits. Audit observations also take into account the cumulative impact of resource mobilisation efforts, debt servicing and corrective fiscal measures. The overall financial performance of the State Government as a body corporate has been presented by the application of a set of ratios commonly adopted for the relational interpretation of fiscal aggregates. In addition, selected indicators of financial performance of the Government are listed in this section; some of the terms used in this context are explained in Appendix 1.1-Part C.
5

Audit Report (Civil) for the year ended 31 March 2006
1.4 State Finances by key indicators
1.4.1 Resources by Volumes and Sources
Resources of the State Government consist of revenue receipts and capital receipts. Revenue receipts consist of tax revenue, non-tax revenue, State’s share of union taxes and duties and grants-in-aid from the Government of India (GOI). Capital receipts comprise miscellaneous capital receipts such as proceeds from disinvestments, recovery of loans and advances, debt receipts from internal sources (market loans, borrowings from financial institutions/commercial banks) and loans and advances from GOI as well as accruals from public account.
Table 3 shows that the total receipts of the State Government for the year 2005-06 were Rs.74,203 crore. Of these, revenue receipts were Rs.30,352.05 crore (41 per cent). The balance came from borrowings, receipts from contingency fund and public account.
Table 3 : Resources of Karnataka (Rupees in crore)
Revenue Receipts 30,352.05 Capital Receipts 5,787.10
Recovery of Loans and Advances 123.55 Public Debt Receipts 5,663.55
Contingency Fund 38.91 Public Account Receipts 38,025.00
Small Savings, Provident Fund, etc., 1,650.55 Reserve Funds 1,288.36 Deposits and Advances 15,926.09 Suspense and Miscellaneous 16,393.36 Remittances 2,766.64
Total Receipts 74,203.06
1.4.2 Revenue Receipts
Statement-11 of the Finance Accounts details the revenue receipts of the Government. Revenue receipts are linked to economic activity and GSDP is its natural base. Apart from the quantum and rate of growth of revenue receipts, it is equally important to look at these receipts relative to this base and its expansion over time. Overall revenue receipts, their annual rate of growth, ratio of these receipts to GSDP and their buoyancy are indicated in Table 4.
6

Chapter I - Finances of the State Government
Table 4 : Revenue Receipts – Basic Parameters
2000-01 2001-02 2002-03 2003-04 2004-05 2005-06 Revenue Receipts (RR) (Rupees in crore)
14,823 15,321 16,169 20,760 26,570 30,352
State’s own taxes (per cent) 61.0 64.3 64.6 60.5 60.5 61.4
Non-Tax Revenue (per cent) 11.2 7.2 7.9 14.3 16.8 12.8
Central Tax Transfers (per cent) 17.4 17.1 17.2 15.6 14.6 13.9
Grants-in-aid (per cent) 10.4 11.4 10.3 9.6 8.1 11.9
Rate of Growth of RR (per cent) 14.8 3.4 5.5 28.4 27.9 14.2
RR-GSDP (per cent) 14.2 14.1 13.6 15.9 17.9 18.1
Revenue Buoyancy (ratio) 1.5 0.9 0.6 2.9 2.0 1.1
State’s own taxes Buoyancy (ratio)
1.7 2.4 0.6 2.1 2.0 1.2
Revenue Buoyancy with respect to State’s own taxes (ratio)
0.9 0.4 0.9 1.4 1.0 0.9
GSDP Growth (per cent) 10.1 3.7 9.3 9.7 14.1 12.7
Revenue receipts of the State increased from Rs.14,823 crore in 2000-01 to Rs.30,352 crore in 2005-06 (105 per cent). The low growth rate of around three and six per cent during the years 2001-02 and 2002-03 was due to deficient monsoons and severe drought coupled with depressed buoyancy in Central transfers. The growth increased to around 28 per cent during the years 2003-04 and 2004-05 due to increase in collections under various components of tax revenue on account of tax reforms initiated by the State Government.
The decline in revenue receipts during 2005-06 in real terms was by six percentage points only as revenue receipts for the year 2004-05 were overstated by Rs.900 crore due to transfer of unspent balances to revenue account from public account and loans and advances (mentioned in Audit Report for the year 2004-05).
There was increase in tax revenue by Rs.2,841 crore and non-tax revenue by Rs.1,526 crore over the normative assessment made by TFC in its report.
Tax revenue of the State increased from Rs.9,043 crore in 2000-01 to Rs.18,632 crore in 2005-06. Its rate of growth, however, fell from 28 per cent in 2004-05 to 16 per cent in 2005-06 mainly due to fall in rate of growth of taxes on sales, trade etc., from 31 per cent to 13 per cent following introduction of Value Added Tax (VAT). The State Government received VAT loss compensation of Rs.1,039 crore from GOI for the period from April 2005 to February 2006. The compensation was received as part of non-plan grants from GOI.
Taxes on sales, trade etc., was the major source of State’s own tax revenue which contributed 53 per cent followed by state excise (18 per cent), stamps and registration fees (12 per cent) and taxes on vehicles (6 per cent).
7
Audit Report (Civil) for the year ended 31 March 2006
The main contributors of non-tax revenue (Rs.3,875 crore) during 2005-06 were State lotteries (Rs.1,767 crore), Non-ferrous Mining and Metallurgical Industries (Rs.325 crore), interest receipts (Rs.283 crore) and Other General Economic Services (Rs.295 crore). Non-tax revenue was however overstated to the extent of Rs.443 crore due to transfer of unspent balance of Rs.426 crore from Panchayat Raj Bodies Fund in public account to revenue account, and accounting of food subsidy of Rs.10 crore and grant-in-aid of Rs.seven crore for tourism development received from GOI as departmental receipts.
Central tax transfers for the State increased from Rs.3,878 crore in 2004-05 to Rs.4,213 crore in 2005-06. The share of the Central tax transfers in the revenue receipts, however, decreased from 15 per cent to 14 per cent. The increase in Central tax transfers (Rs.335 crore) was mainly due to increase in taxes on income other than corporation tax (Rs.109 crore), corporation tax (Rs.59 crore), service tax (Rs.105 crore), customs (Rs.42 crore) and union excise duties (Rs.17 crore).
Grants-in-aid from GOI increased from Rs.2,147 crore in 2004-05 to Rs.3,632 crore. The steep rise in receipt of non-plan grants from Rs.263 crore to Rs.1,736 crore was mainly on account of grants received towards VAT loss compensation (Rs.1,039 crore) and increase in grants for calamity relief (Rs.313 crore). Grants for State plan schemes decreased by Rs.167 crore (15 per cent), while grants for Central and Centrally sponsored plan schemes increased by Rs.185 crore (23 per cent) during 2005-06.
Arrears of revenue increased by 91 per cent from Rs.1,894 crore in 2000-01 to Rs.3,620 crore to end of 2005-06. Arrears were mainly in respect of taxes on sales, trade etc., (Rs.2,874 crore) and state excise (Rs.700 crore). State excise arrears of Rs.507 crore were outstanding for more than five years.
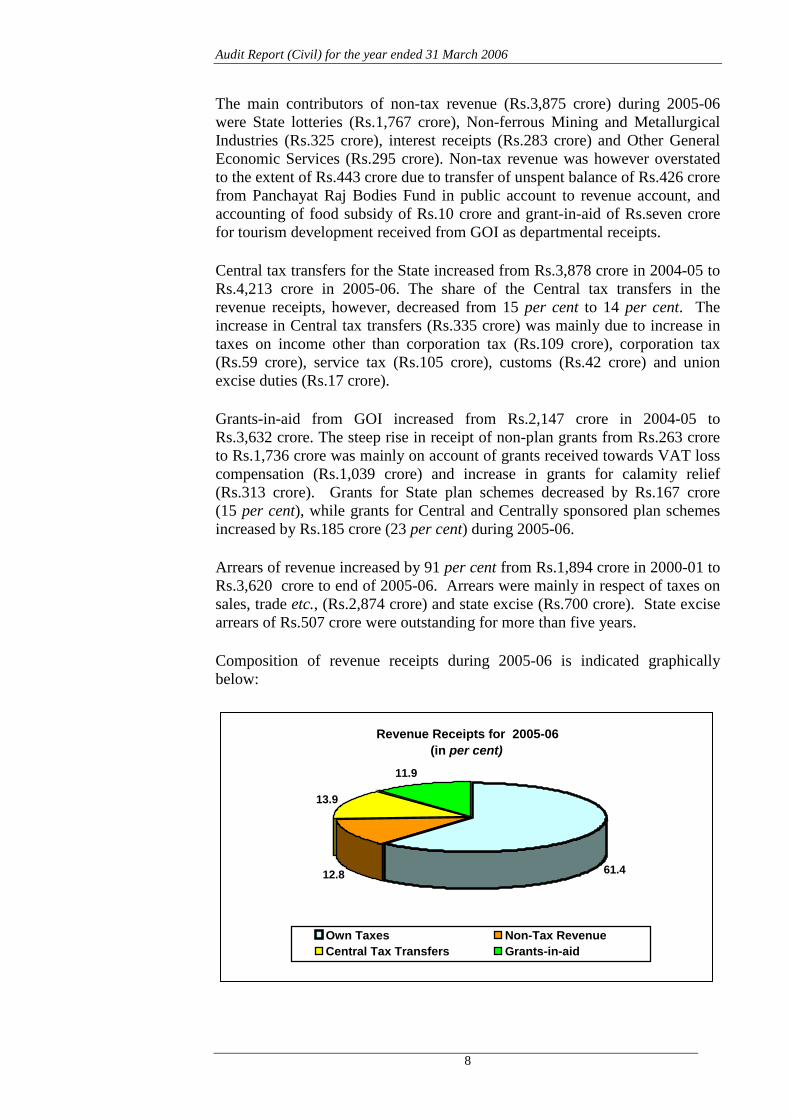
Composition of revenue receipts during 2005-06 is indicated graphically below:
Revenue Receipts for 2005-06 (in per cent)
61.412.8
13.9
11.9
Own Taxes Non-Tax RevenueCentral Tax Transfers Grants-in-aid
8

Chapter I - Finances of the State Government
1.4.3 Sources of Receipts -Trends
Sources of revenue under different heads and GSDP during 2000-2006 are indicated in Table 5.
Table 5 : Sources of Receipts: Trends (Rupees in crore)
Year Revenue Receipts
Capital Receipts Contingency Fund
Receipts
Accruals in Public Account
Total Receipts
Gross State Domestic product Non-Debt
Receipts Debt
Receipts 2000-01 14,823 101 3,371 15 24,797 43,107 1,04,541 2001-02 15,321 35 5,146 54 28,502 49,058 1,08,461 2002-03 16,169 928 5,433 8 27,879 50,417 1,18,604 2003-04 20,760 64 7,988 -- 30,513 59,325 1,30,127 2004-05 26,570 47 8,509 41 36,325 71,492 1,48,521 2005-06 30,352 124 5,664 39 38,025 74,204 1,67,399
Total receipts of the State increased by 72 per cent from Rs.43,107 crore in 2000-01 to Rs.74,204 crore in 2005-06. Debt receipts which create future repayment obligation increased by 152 per cent from Rs.3,371 crore to Rs.8,509 crore during the period 2000-05. Fiscal reforms undertaken by State Government resulted in reduction of public debt receipts to Rs.5,664 crore (33 per cent) in 2005-06.
1.5 Application of Resources
1.5.1 Growth of Expenditure Statement 12 of the Finance Accounts depicts the detailed revenue expenditure by minor heads and capital expenditure by major heads. States raise resources to perform their sovereign functions, maintain their existing nature of delivery of social and economic services, extend the network of these services through capital expenditure and investments and discharge their debt servicing obligations.
Total expenditure, its annual growth rate and ratio of expenditure to GSDP and to revenue receipts and its buoyancy in relation to GSDP and revenue receipts are indicated in Table 6 below followed by its graphic representation.
Table 6 : Total Expenditure – Basic Parameters
2000-01 2001-02 2002-03 2003-04 2004-05 2005-06 Total Expenditure (TE)* (Rupees in crore)
19,143 21,225 22,379 25,325 30,217 34,163
Rate of Growth (Per cent) 10.5 10.9 5.4 13.2 19.3 13.1 TE/GSDP Ratio (Per cent) 18.3 19.6 18.9 19.5 20.3 20.4 Revenue Receipts/TE Ratio(Per cent)
77.4 72.2 72.2 82.0 87.9 88.8
Buoyancy of Total Expenditure with
GSDP(Ratio) 1.0 2.9 0.6 1.4 1.4 1.0 Revenue Receipts (Ratio) 0.7 3.2 1.0 0.5 0.7 0.9
* Total expenditure includes revenue expenditure, capital expenditure & loans and advances
9

Audit Report (Civil) for the year ended 31 March 2006
Growth of Total Expenditure (Rupees in crore)
19,14321,225 22,379
25,325
30,21734,163
21,28518,81518,60516,685
24,93228,041
2,4582,620 3,564 4,040 5,285 6,122
0
5,000
10,000
15,000
20,000
25,000
30,000
35,000
40,000
2000-01 2001-02 2002-03 2003-04 2004-05 2005-06
Total expenditure (TE) Revenue expenditure Capital expenditure
Capital expenditure includes disbursement of loans and advances
The total expenditure increased from Rs.19,143 crore in 2000-01 to Rs.34,163 crore in 2005-06 (78 per cent). Revenue expenditure as percentage of total expenditure declined from 87 per cent in 2000-01 to 82 per cent in 2005-06. There was significant increase in the ratio of revenue receipts to total expenditure from 77 per cent in 2000-01 to 89 per cent in 2005-06, indicating that nearly 89 per cent of the State’s total expenditure was met from its revenue receipts, leaving the balance to be met from the borrowings. The buoyancy of total expenditure with reference to GSDP stood at one in 2005-06 indicating that the total expenditure grew with the same pace as that of GSDP.
Capital expenditure including loans and advances increased by 149 per cent from Rs.2,458 crore in 2000-01 to Rs.6,122 crore in 2005-06. It increased from 13 per cent of total expenditure in 2000-01 to 18 per cent in 2005-06. However, there was no visible increase in capital expenditure as a percentage of total expenditure in 2005-06 over the previous year. Capital expenditure of Rs.6,122 crore during 2005-06 included Rs.2,011 crore (33 per cent) on debt servicing. Thus, only 67 per cent of the capital outlay was towards developmental expenditure.
Trends in Total Expenditure by Activities:
In terms of activities, total expenditure could be considered as being composed of expenditure on general services including interest payments, social and economic services, grants-in-aid and loans and advances. Relative share of these components in total expenditure (including disbursements of loans and advances) is indicated in Table 7.
10

Chapter I - Finances of the State Government
Table 7 : Components of Expenditure – Relative Share (in per cent)
2000-01 2001-02 2002-03 2003-04 2004-05 2005-06 General Services 29.7 29.5 32.1 36.2 33.2 30.0 Of which interest payments 42.0 42.8 45.8 40.5 37.8 36.7 Social Services 33.6 31.3 29.6 29.2 27.2 29.3 Economic Services 31.3 34.1 32.9 28.1 35.0 36.4 Grants-in-aid 2.8 2.7 2.6 2.5 2.6 3.4 Loans and advances 2.6 2.4 2.8 4.0 2.0 0.9
The components of expenditure during 2005-06 are indicated graphically below:
The movement of relative share of these components indicates that while the share of social services in total expenditure declined from 34 per cent in 2000-01 to 29 per cent in 2005-06, the relative share of general services, considered as non-developmental, increased from 30 per cent in 2000-01 to 36 per cent in 2003-04, thereafter declined to 30 per cent in 2005-06. The share of economic services expenditure increased from 31 per cent in 2000-01 to 36 per cent in 2005-06 with inter-year variations.
Interest payments, which constituted 46 per cent in 2002-03, highest during the six-year period, declined to 37 per cent in 2005-06 on account of replacement of high cost loans to the extent of Rs.5,642 crore with low cost loans under debt-swap scheme in 2002-03 (Rs.831 crore), 2003-04 (Rs.2,017 crore) and 2004-05 (Rs.2,794 crore). Consolidation and rescheduling of Central loans aggregating Rs.7,166 crore to be repaid in 20 years with the interest rate of 7.5 per cent was another factor for reduction of interest payments in 2005-06.
1.5.2 Incidence of revenue expenditure
Revenue expenditure has the predominant share in the total expenditure. Revenue expenditure is incurred to maintain the current level of services and payment for the past obligations and as such does not result in any addition to the State’s infrastructure and service network. The overall revenue
Allocative Priorities - Trend of Expenditure 2005-06
30.0
0.9
3.4
36.4
29.3
General Services
Economic Services
Loans & Advances
Social services
Grants-in-aid andContributions
11

Audit Report (Civil) for the year ended 31 March 2006
expenditure, its rate of growth, ratio of revenue expenditure to GSDP and to revenue receipts and its buoyancy are indicated in Table 8.
Table 8 : Revenue Expenditure – Basic Parameters (Rupees in crore)
2000-01 2001-02 2002-03 2003-04 2004-05 2005-06 Revenue Expenditure (RE) 16,685 18,605 18,815 21,285 24,932 28,041 Non-Plan Revenue (NPRE) Expenditure
13,204 14,662 15,570 17,732 19,807 22,972
Plan Revenue Expenditure (PRE) 3,481 3,943 3,245 3,553 5,125 5,069 Rate of Growth (Per cent) NPRE 7.9 11.0 6.2 13.9 11.7 16.0 PRE 16.3 13.3 (-)17.70 9.5 44.2 (-)1.1 NPRE/ GSDP (Per cent) 12.6 13.5 13.1 13.6 13.3 13.7 NPRE as per cent of TE 69.0 69.1 69.6 70.0 65.5 67.2 NPRE as per cent to Revenue Receipts 89.1 95.7 96.3 85.4 74.5 75.7 Buoyancy of Revenue Expenditure with GSDP (Ratio) 0.9 3.1 0.1 1.3 1.2 1.0 Revenue Receipts (Ratio) 0.6 3.4 0.2 0.5 0.6 0.9
Revenue expenditure increased from Rs.16,685 crore in 2000-01 to Rs.28,041 crore in 2005-06 (increase: 68 per cent). While plan expenditure increased from Rs.3,481 crore to Rs.5,069 crore only (increase: 46 per cent), the non-plan expenditure increased from Rs.13,204 crore to Rs.22,972 crore (increase: 74 per cent) . The non plan revenue expenditure was at 67 per cent of total expenditure and 76 per cent of revenue receipts during 2005-06. The increase in non-plan expenditure by Rs.3,165 crore in 2005-06 over the previous year was mainly due to increase in subsidy payments (Rs.980 crore), salaries (Rs.540 crore) compensation and assignments to panchyat raj institutions and local bodies (Rs.361 crore).
1.5.3 Committed Expenditure
Expenditure on Salaries
The expenditure on salaries increased from Rs.4,630 crore in 2000-01 to Rs.5,932 crore in 2005-06 as indicated in Table 9:
Table 9 : Expenditure on Salaries (Rupees in crore)
Heads 2000-01 2001-02 2002-03 2003-04 2004-05 2005-06⊗ Expenditure on Salariesℵ 4,629.99 5,029.74 4,940.70 5,322.76 5,392.15 5,932.49 Non-plan Head 4,089.17 4,304.51 4,643.00 5,007.07 5,074.62 5,597.59 Plan Head∇ 540.82 725.23 297.70 315.69 317.53 334.90 As percentage of GSDP 4.4 4.6 4.2 4.1 3.6 3.5 As percentage of Revenue Receipts
31.2 32.8 30.6 25.6 20.3 19.5
Expenditure on salaries as a percentage of GSDP declined from 5 per cent in 2001-02 to 3.5 per cent in 2005-06. As a percentage of revenue receipts, it decreased from 33 to 20 per cent due to reform measure undertaken by the
ℵ Based on figures furnished by the Finance Department ⊗ Figures for 2005-06 based on revised estimates.
∇ Includes salaries under Centrally Sponsored Schemes
12

Chapter I - Finances of the State Government
State Government, viz., freeze on creation of posts and recruitment except in high priority departments like health, police and education. It was however around 27 per cent of revenue expenditure net of pensions and interest payments, within the limit of 35 per cent recommended by TFC.
Pension payments
Year-wise break-up of expenditure incurred on pension payments during the years 2000-2001 to 2005-06 was as under:
Table 10 : Expenditure on Pensions (Rupees in crore)
Head 2000-01 2001-02 2002-03 2003-04 2004-05 2005-06 Expenditure on Pension 1,583 1,641 1,773 1,901 2,157 2,237 As per cent of GSDP 1.5 1.5 1.5 1.5 1.4 1.3 As per cent of Revenue Receipts 10.7 10.7 11.0 9.2 8.1 7.4
The State Government estimated the pension liabilities based on the historical growth rate of pension and not on actuarial basis. Expenditure on pension payments was Rs.2,237 crore which constituted eight per cent of the total revenue receipts of the State in 2005-06. The State Government introduced contributory pension scheme to cover employees recruited after 1 April 2006. The Government, however, is yet to take action to appoint pension regulator as recommended by TFC.
Interest payments
The details of interest payments of the State Governments for the period 2000-01 to 2005-06 and its percentage with reference to revenue receipts and revenue expenditure are given in Table 11.
Table 11 : Interest Payments
Year
Revenue Receipts
Revenue Expenditure
Interest Payment
Percentage of interest payment with reference to
(Rupees in crore) Revenue Receipts
Revenue Expenditure
2000-2001 14,823 16,685 2,388 16.1 14.3
2001-2002 15,321 18,605 2,683 17.5 14.4
2002-2003 16,169 18,815 3,292 20.4 17.5
2003-2004 20,760 21,285 3,710 17.9 17.4
2004-2005 26,570 24,932 3,794 14.3 15.2
2005-2006 30,352 28,041 3,765 12.4 13.4
The ratio of interest payments to revenue receipts determines the sustainability of debt of the State. As per the recommendation of TFC, the level of interest payments relative to revenue receipts should fall to 15 per cent by 2009-10. Interest payments as a percentage of revenue receipts were 16 to 20 per cent during the years 2000-01 to 2003-04. Interest payments were below the limit of 15 per cent prescribed by TFC for the years 2004-05 (14 per cent) and 2005-06 (12 per cent). This was partly due to gain of Rs.292 crore in the nature of reduction of interest to be paid during 2005-06 under DCRF
13
Audit Report (Civil) for the year ended 31 March 2006
envisaged by TFC. Even taking into account the interest (Rs.721 crore) paid on off-budget borrowings, the percentage of interest payments relative to revenue receipts was 15 per cent in 2005-06. Despite this, interest payments during the years 2003-04 to 2005-06 ranged between Rs.3,710 crore to Rs.3,794 crore due to increase in quantum of loan from National Small Savings Funds which carried a rate of interest of 9.5 per cent during the period.
Interest liability for 2002-03, 2003-04 and 2004-05 towards retirement of high cost debt under Debt Swap Scheme was Rs.10.96 crore. The Ministry of Finance, GOI, however, worked it out at Rs.92.47 crore and advised (March 2006) RBI to debit the State finances accordingly without consulting the Accountant General (Accounts & Entitlement) who is responsible for arranging repayment of loans along with interest to GOI. This resulted in avoidable outgo of cash of Rs.53.62 crore during 2005-06 (excluding Rs.27.89 crore paid in excess under DCRF and adjusted by the GOI).
Subsidies
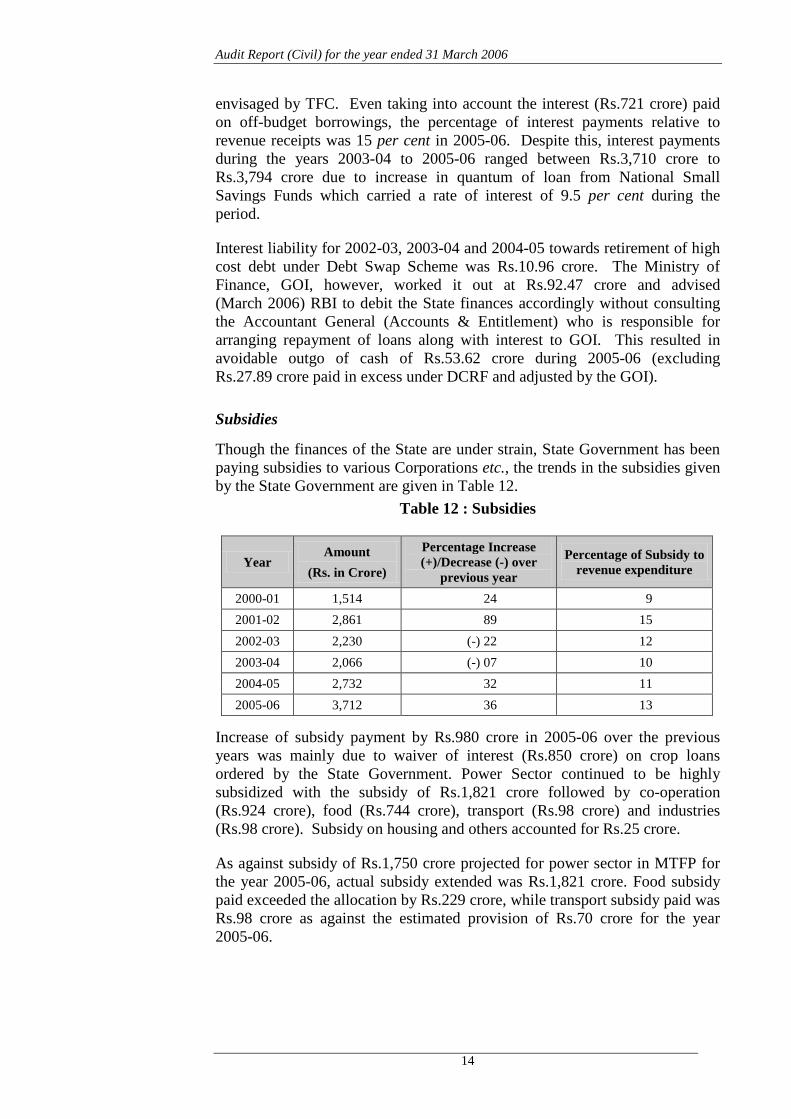
Though the finances of the State are under strain, State Government has been paying subsidies to various Corporations etc., the trends in the subsidies given by the State Government are given in Table 12.
Table 12 : Subsidies
Year Amount
(Rs. in Crore)
Percentage Increase (+)/Decrease (-) over
previous year
Percentage of Subsidy to revenue expenditure
2000-01 1,514 24 9 2001-02 2,861 89 15 2002-03 2,230 (-) 22 12 2003-04 2,066 (-) 07 10 2004-05 2,732 32 11 2005-06 3,712 36 13
Increase of subsidy payment by Rs.980 crore in 2005-06 over the previous years was mainly due to waiver of interest (Rs.850 crore) on crop loans ordered by the State Government. Power Sector continued to be highly subsidized with the subsidy of Rs.1,821 crore followed by co-operation (Rs.924 crore), food (Rs.744 crore), transport (Rs.98 crore) and industries (Rs.98 crore). Subsidy on housing and others accounted for Rs.25 crore.
As against subsidy of Rs.1,750 crore projected for power sector in MTFP for the year 2005-06, actual subsidy extended was Rs.1,821 crore. Food subsidy paid exceeded the allocation by Rs.229 crore, while transport subsidy paid was Rs.98 crore as against the estimated provision of Rs.70 crore for the year 2005-06.
14
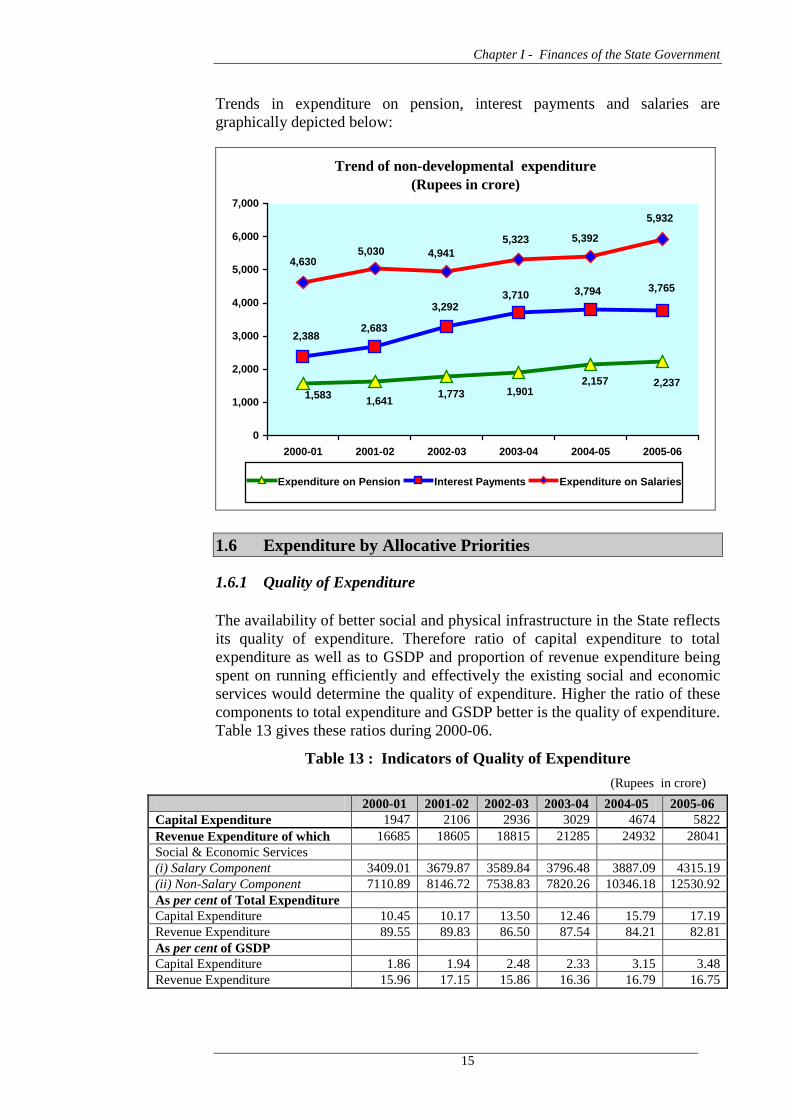
Chapter I - Finances of the State Government
Trends in expenditure on pension, interest payments and salaries are graphically depicted below:
Trend of non-developmental expenditure (Rupees in crore)
2,2371,583 1,641 1,773 1,901
2,157
3,765
2,3882,683
3,2923,710 3,794
5,932
4,9415,323 5,392
5,0304,630
0
1,000
2,000
3,000
4,000
5,000
6,000
7,000
2000-01 2001-02 2002-03 2003-04 2004-05 2005-06
Expenditure on Pension Interest Payments Expenditure on Salaries
1.6 Expenditure by Allocative Priorities
1.6.1 Quality of Expenditure
The availability of better social and physical infrastructure in the State reflects its quality of expenditure. Therefore ratio of capital expenditure to total expenditure as well as to GSDP and proportion of revenue expenditure being spent on running efficiently and effectively the existing social and economic services would determine the quality of expenditure. Higher the ratio of these components to total expenditure and GSDP better is the quality of expenditure. Table 13 gives these ratios during 2000-06.
Table 13 : Indicators of Quality of Expenditure (Rupees in crore)
2000-01 2001-02 2002-03 2003-04 2004-05 2005-06 Capital Expenditure 1947 2106 2936 3029 4674 5822 Revenue Expenditure of which 16685 18605 18815 21285 24932 28041 Social & Economic Services (i) Salary Component 3409.01 3679.87 3589.84 3796.48 3887.09 4315.19 (ii) Non-Salary Component 7110.89 8146.72 7538.83 7820.26 10346.18 12530.92 As per cent of Total Expenditure Capital Expenditure 10.45 10.17 13.50 12.46 15.79 17.19 Revenue Expenditure 89.55 89.83 86.50 87.54 84.21 82.81 As per cent of GSDP Capital Expenditure 1.86 1.94 2.48 2.33 3.15 3.48 Revenue Expenditure 15.96 17.15 15.86 16.36 16.79 16.75
15

Audit Report (Civil) for the year ended 31 March 2006
Revenue expenditure declined from 90 per cent of total expenditure in 2000-01 to 83 per cent in 2005-06, while Capital expenditure increased from 10 per cent to 17 per cent during the period. Revenue expenditure as a percentage of GSDP increased from 16 per cent to 17 per cent while Capital expenditure increased from two to three per cent.
Salary component under social and economic services sectors, as a share of revenue expenditure, declined significantly from 20 per cent in 2000-01 to 15 per cent in 2005-06.
1.6.2 Expenditure on Social Services
Given the fact that human development indicators such as access to basic education, health services and drinking water and sanitation facilities etc., have a strong linkage with eradication of poverty and economic progress, it would be prudent to make an assessment with regard to the expansion and efficient provision of these services in the State. Table 14 summarises the expenditure incurred by the State Government in expanding and strengthening social services in the State during 2000-06.
Table 14 : Expenditure on Social Services (Rupees in crore)
2000-01 2001-02 2002-03 2003-04 2004-05 2005-06 Education, Sports, Art and Culture 3488.75 3505.88 3570.72 3771.33 4362.83 4890.07 Revenue Expenditure of which 3482.61 3501.41 3564.01 3766.02 4357.91 4837.40 a) Salary component 1916.66 2104.99 2017.82 2142.56 2292.74 2606.79 b) Non Salary component 1565.95 1396.42 1546.19 1623.46 2065.17 2230.61 Capital Expenditure 6.14 4.47 6.71 5.31 4.92 52.67 Health and Family Welfare 1005.32 1085.84 1004.12 995.70 1043.91 1146.19 Revenue Expenditure of which 903.56 986.32 953.65 958.93 1035.61 1138.50 a) Salary component 535.55 559.71 570.10 581.78 573.95 616.03 b) Non Salary component 368.01 426.61 383.55 377.15 461.66 522.47 Capital Expenditure 101.76 99.52 50.47 36.77 8.30 7.69 Water Supply, Sanitation, Housing and Urban Development
782.29 769.34 743.36 1083.03 1269.27 1881.55
Revenue Expenditure of which 642.10 713.41 576.04 794.22 857.89 911.77 a) Salary component 11.51 12.47 12.02 13.34 12.86 14.69 b) Non Salary component 630.59 700.94 564.02 780.88 845.03 897.08 Capital Expenditure 140.19 55.93 167.32 288.81 411.38 969.78 Other Social Services 1154.25 1280.05 1303.35 1542.19 1532.78 2086.28 Revenue Expenditure of which 1103.64 1227.67 1232.55 1445.87 1471.34 2011.12 a) Salary component 174.73 187.59 189.40 207.16 216.59 214.12 b) Non Salary component 928.91 1040.08 1043.15 1238.71 1254.75 1797.00 Capital Expenditure 50.61 52.38 70.80 96.32 61.44 75.16 Total (Social Services) 6430.61 6641.11 6621.55 7392.25 8208.79 10004.09 Revenue Expenditure of which 6131.91 6428.81 6326.25 6965.04 7722.75 8898.79 a) Salary component 2638.45 2864.76 2789.34 2944.84 3096.14 3451.63 b) Non Salary component 3493.46 3564.05 3536.91 4020.20 4626.61 5447.16 Capital Expenditure 298.70 212.30 295.30 427.21 486.04 1105.30
In line with the Government’s commitment to increase allocation to priority sectors like health, education, water supply and social welfare, expenditure on social services increased from Rs.6,431 crore in 2000-01 to Rs.10,004 crore in 2005-06 (56 per cent).
16

Chapter I - Finances of the State Government
Out of the developmental expenditure (Rs.22,450 crore), Social Services (Rs.10,004 crore) accounted for 45 per cent during the year. General Education, Health and Family Welfare, Water Supply, Sanitation, Housing and Urban Development consumed 79 per cent of the expenditure on Social Services.
Capital expenditure on Social Services increased from Rs.299 crore in 2000-01 to Rs.1,105 crore in 2005-06 indicating improved quality of expenditure on these services. However, capital expenditure of Rs.1,105 crore in 2005-06 under Water Supply, Sanitation, Housing and Urban Development included Rs.353 crore (32 per cent) towards debt servicing, leaving only 68 per cent for developmental activities.
1.6.3 Expenditure on Economic Services
The expenditure on Economic Services includes all such expenditures as to promote directly or indirectly, productive capacity within the State’s economy. The expenditure on Economic Services (Rs.12,446 crore) accounted for 37 per cent of total expenditure of Rs.33,863 crore. Of this, Agriculture and Allied Activities, Irrigation and Flood Control, Energy and Transport (Rs.10,103 crore) consumed nearly 81 per cent of the expenditure. Major trends were as follows:
Table 15 : Economic Services Sector Expenditure (Rupees in crore)
2000-01 2001-02 2002-03 2003-04 2004-05 2005-06 Agriculture, Allied Activities 1201.71 1115.75 1100.05 1356.37 2083.71 2883.82 Revenue Expenditure of which 1169.72 1088.11 1077.10 1348.92 2064.90 2866.65 a) Salary component 401.54 422.89 413.68 430.70 420.01 459.07 b) Non Salary component 768.18 665.22 663.42 918.22 1644.89 2407.58 Capital Expenditure 31.99 27.64 22.95 7.45 18.80 17.17 Irrigation and Flood Control 1986.10 1715.62 2235.19 2060.52 3223.64 3545.50 Revenue Expenditure of which 764.71 190.76 206.73 179.06 213.91 215.81 a) Salary component 126.01 133.33 128.48 140.36 92.42 89.40 b) Non Salary component 638.70 57.43 78.25 38.70 121.49 126.41 Capital Expenditure 1221.39 1524.86 2028.46 1881.46 3009.73 3329.69 Power & Energy 939.29 2336.69 1906.92 1733.05 1896.71 1886.93 Revenue Expenditure of which 939.29 2336.69 1906.92 1733.05 1896.71 1836.93 a) Salary component 0.10 0.08 0.09 0.09 0.13 0.25 b) Non Salary component 939.19 2336.61 1906.83 1732.96 1896.58 1836.68 Capital Expenditure --- --- --- --- --- 50.00 Transport 694.57 778.28 818.87 821.64 1513.42 1786.55 Revenue Expenditure of which 404.38 513.62 395.79 311.43 617.60 756.10 a) Salary component 14.35 15.44 16.21 17.80 15.01 18.27 b) Non Salary component 390.03 498.18 379.58 293.63 602.59 737.83 Capital Expenditure 290.19 264.66 423.08 510.21 895.82 1,030.45 Other Economic Services 1166.87 1293.27 1306.24 1153.87 1844.47 2343.23 Revenue Expenditure of which 1109.89 1268.60 1215.88 1079.24 1717.39 2271.83 a) Salary component 228.57 243.37 242.04 262.68 263.37 296.58 b) Non Salary component 881.32 1025.23 973.84 816.56 1454.02 1975.25 Capital Expenditure 56.98 24.67 90.36 74.63 127.08 71.40 Total (Economic Services) 5988.54 7239.61 7367.27 7125.45 10561.95 12446.03 Revenue Expenditure of which 4387.99 5397.78 4802.42 4651.70 6510.52 7947.32 a) Salary component 770.57 815.11 800.51 851.63 790.95 863.57 b) Non Salary component 3617.42 4582.67 4001.91 3800.07 5719.57 7083.75 Capital Expenditure 1600.55 1841.83 2564.85 2473.75 4051.43 4498.71
17
Audit Report (Civil) for the year ended 31 March 2006
Out of developmental expenditure (Rs.22,450 crore), Economic Services accounted for 55 per cent (Rs.12,446 crore) during the year 2005-06. Agriculture and Allied Activities (Rs.2,884 crore), Irrigation and Flood Control (Rs.3,546 crore), Power and Energy (Rs.1,887 crore) and Transport (Rs.1,787 crore) accounted for 81 per cent.
Capital expenditure on Economic Services increased from Rs.1,601 crore in 2001-02 to Rs.4,499 crore in 2005-06 indicating improvement in quality of expenditure. However, one half of capital expenditure of Rs.3,330 crore on irrigation and flood control during 2005-06 only was available for developmental activities as it included Rs.1,658 crore (50 per cent) towards debt servicing.
Non-salary expenditure of Rs.2,575 crore on power and transport included subsidy element of Rs.1,919 crore (75 per cent) paid to electricity supply companies (Rs.1,821 crore) and transport corporation (Rs.98 crore), leaving only 25 per cent of non-salary expenditure available for developmental activities.
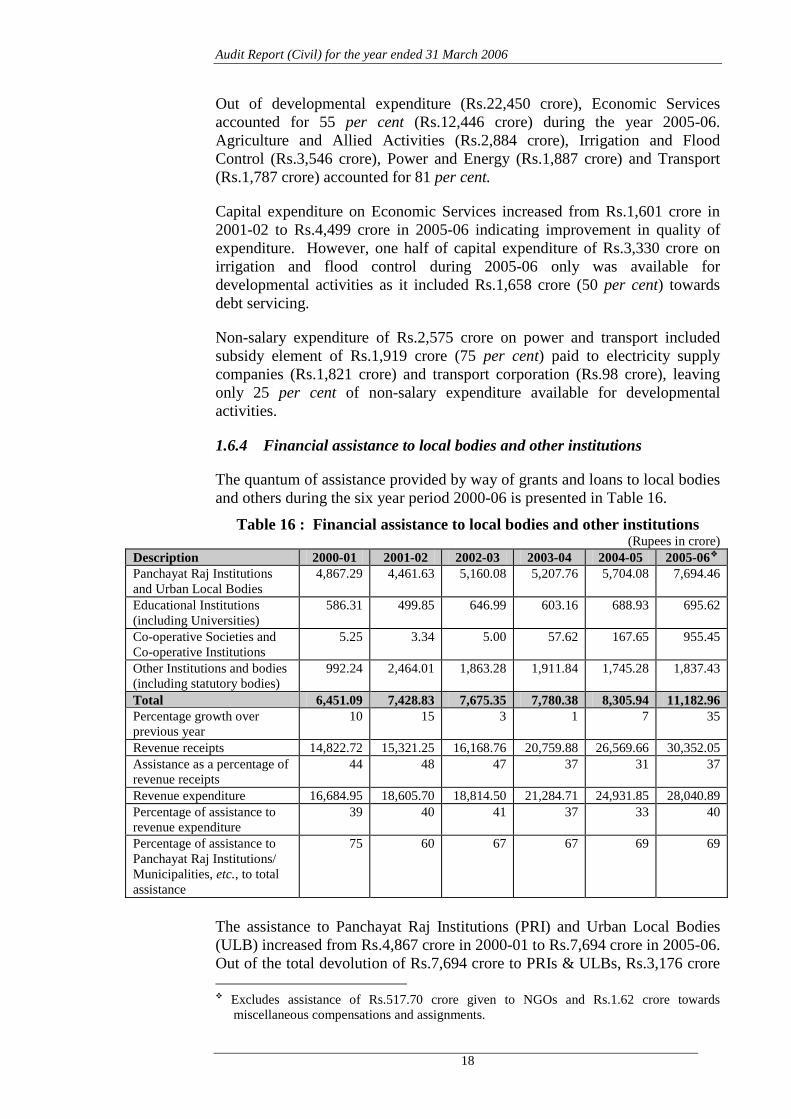
1.6.4 Financial assistance to local bodies and other institutions
The quantum of assistance provided by way of grants and loans to local bodies and others during the six year period 2000-06 is presented in Table 16.
Table 16 : Financial assistance to local bodies and other institutions (Rupees in crore)
Description 2000-01 2001-02 2002-03 2003-04 2004-05 2005-06 Panchayat Raj Institutions and Urban Local Bodies
4,867.29 4,461.63 5,160.08 5,207.76 5,704.08 7,694.46
Educational Institutions (including Universities)
586.31 499.85 646.99 603.16 688.93 695.62
Co-operative Societies and Co-operative Institutions
5.25 3.34 5.00 57.62 167.65 955.45
Other Institutions and bodies (including statutory bodies)
992.24 2,464.01 1,863.28 1,911.84 1,745.28 1,837.43
Total 6,451.09 7,428.83 7,675.35 7,780.38 8,305.94 11,182.96 Percentage growth over previous year
10 15 3 1 7 35
Revenue receipts 14,822.72 15,321.25 16,168.76 20,759.88 26,569.66 30,352.05 Assistance as a percentage of revenue receipts
44 48 47 37 31 37
Revenue expenditure 16,684.95 18,605.70 18,814.50 21,284.71 24,931.85 28,040.89 Percentage of assistance to revenue expenditure
39 40 41 37 33 40
Percentage of assistance to Panchayat Raj Institutions/ Municipalities, etc., to total assistance
75 60 67 67 69 69
The assistance to Panchayat Raj Institutions (PRI) and Urban Local Bodies (ULB) increased from Rs.4,867 crore in 2000-01 to Rs.7,694 crore in 2005-06. Out of the total devolution of Rs.7,694 crore to PRIs & ULBs, Rs.3,176 crore
Excludes assistance of Rs.517.70 crore given to NGOs and Rs.1.62 crore towards miscellaneous compensations and assignments.
18

Chapter I - Finances of the State Government
(41 per cent) were towards salaries during 2005-06 as the State Government’s functions viz., education, water supply and sanitation, housing, health and family welfare etc., remained transferred to PRIs and ULBs. The increase of Rs.788 crore in assistance to cooperative institutions during 2005-06 was on account of waiver of interest on crop loans by the Government.
The Second State Finance Commission recommended (December 2002) that 40 per cent of the Non Loan Gross Own Revenue Receipts (NLGORR) of the State comprising of all taxes, interest receipts, duties, fees and other non-loan, non-tax receipts levied and collected by the State Government should devolve to PRIs (32 per cent) and ULBs (8 per cent). However, of the total NLGOR receipts of Rs.22,507 crore, devolution to PRIs and ULBs (Rs.7,694 crore) constituted only 34 per cent during 2005-06.
1.6.5 Delay in furnishing Utilisation Certificates
Of the 690 utilization certificates (UC) due in respect of grants and loans aggregating Rs.731.60 crore paid upto 2005-06, 671 UCs for an aggregate amount of Rs.729.62 crore were in arrears. Department-wise break-up of outstanding UCs is given in Appendix 1.3.
1.6.6 Non-Submission of accounts
In order to identify the institutions which attract audit under Sections 14 and 15 of the Comptroller and Auditor General’s (Duties, Powers and Conditions of Service) Act, 1971, the Government/Heads of the Department are required to furnish to Audit every year detailed information about the financial assistance given to various institutions, the purpose of assistance granted and the total expenditure of the institutions. As of March 2006, 16 departments of the Government have not furnished details for the year 2004-05 as shown in Appendix 1.4.
1.6.7 Audit of performance of the Autonomous Bodies
The audit of accounts of eight bodies in the State has been entrusted to the Comptroller and Auditor General of India. The status of entrustment to audit, rendering of accounts to audit, issuance of separate audit report and its placement in the Legislature is indicated in Appendix 1.5.
1.6.8 Misappropriations, losses, defalcations, etc.
The State Government reported 220 cases of misappropriation, defalcation, etc., involving Government money amounting to Rs.10.03 crore upto the period 31 March 2006 on which final action was pending. The department wise breakup of pending cases is given in Appendix 1.6.
1.6.9 Write-off of losses, etc.
As reported to audit, loss due to theft, fire and irrecoverable revenue, etc., amounting to Rs.1.45 lakh in eight cases relating to three departments were written-off during 2005-06 by competent authorities. The details are given in Appendix 1.7.
19

Audit Report (Civil) for the year ended 31 March 2006
1.7 Assets & Liabilities
In Government accounting system, comprehensive accounting of fixed assets like land and buildings owned by the Government is not done. However, Government accounts do capture the financial liabilities of the Government and the assets created out of the expenditure incurred. Statement I gives an abstract of such liabilities and assets as on 31 March 2006, compared with the corresponding position on 31 March 2005. While liabilities shown in this statement consist mainly of internal borrowings, loans and advances from GOI, receipts from the public account and reserve funds; assets comprise mainly of capital outlay and loans and advances given by the State Government and the cash balances. The liabilities of the State depicted in the Finance Accounts, however, do not include pension, other retirement benefits payable to retired / retiring State employees, guarantees / letters of comfort issued by State Government and borrowings through special purpose vehicles termed off-budget borrowings. Statement I shows that liabilities grew by 13 per cent as against 12 per cent in the previous year, while the growth rate of assets remained stagnant at 22 per cent. Low priority for capital outlay and reduced spending on developmental activities had adverse effect on asset formation. Statement IV depicts the time series data on State Government finances for the period 2000-06.
1.7.1 Incomplete projects
Incomplete projects/works reflect failure on part of the State to prioritise expenditure and to spread its resources adequately over these projects. Additional Statement of Finance Accounts gives the details of these works. As reported by the departments of the State Government, there were 120 incomplete projects/works on which expenditure of Rs.3,450 crore was incurred as of 31 March 2006. Inadequate flow of funds was the reason for the stoppage works in respect of 22 projects on which an expenditure of Rs.2.23 crore had been incurred.
1.7.2 Investments and Returns
As on 31 March 2006, Government had invested Rs.14,052.53 crore in statutory corporations, rural banks, Government companies, joint stock companies and co-operatives. (Table 17).
Table 17 : Return on Investment (Rupees in crore)
Year Investment at the end of the
year
Amount of return
Percentage of return
Weighted interest rate on Government borrowing – Market
Loans (per cent)
Difference between
interest rate and return
2000-2001 4,215.27 8.9 0.2 12.1 11.9 2001-2002 4,840.34 10.6 0.2 11.1 10.9 2002-2003 6,150.37 21.3 0.4 9.9 9.5 2003-2004 7,984.19 18.0 0.2 8.6 8.4 2004-2005 10,741.40 16.7 0.2 8.5 8.3 2005-2006 14,052.53 16.9 0.12 9.2 9.1
20

Chapter I - Finances of the State Government
The return on this investment was 0.1 per cent to 0.4 per cent in the last five years, while the Government paid interest on its borrowing at the average rate of 09 - 12 per cent.
The investment of the State Government included Rs.43.94 crore in 16 Government companies which were either liquidated or under liquidation and yielded no dividend to the State. In the case of 32 companies, the cumulative loss of Rs.3,269 crore far exceeded the investment of Rs.1,887 crore made by the Government.
1.7.3 Loans and Advances by State Government
In addition to investment in corporations, companies and cooperative societies, Government has also been providing loans and advances to many of these institutions/organizations. Total outstanding loans and advances as on 31 March 2006 was Rs.5,943.57 crore (Table 18).
Table 18 : Average Interest Received on Loans Advanced by the State Government
(Rupees in crore)
2000-01 2001-02 2002-03 2003-04 2004-05 2005-06 Opening Balance 3,666.62 4,076.69 4,556.46 4,256.04 5,202.95 5,767.53 Amount advanced during the year 511.30 514.47 627.58 1,011.20 611.43 299.60 Amount repaid during the year 101.23 34.70 928.00 64.29 46.85 123.55 Closing Balance 4,076.69 4,556.46 4,256.04 5,202.95 5,767.53 5,943.58♦ Net Addition (+) / Reduction (-) 410.07 479.77 (-) 300.42 946.91 564.58 176.04 Interest Received ( Rupees in crore)
129.42 112.11 19.98 96.27 88.18 94.95
Interest received as per cent to outstanding loans and advances
3.3 2.6 0.4 2.0 1.6 1.6
Weighted interest 12.1 11.1 9.9 8.6 8.5 9.2 Difference between weighted interest and interest received (%)
8.8 8.5 9.5 6.6 6.9 7.6
♦Differs in closing balance by Rs.0.01 crore due to rounding as shown in Statement No.1.
Outstanding loans included Rs.374 crore given to two companies for implementation of voluntary retirement scheme and Rs.799 crore given to nine institutions for loan repayment. The interest earned during 2005-06 was about two per cent of the outstanding loans.
As of March 2006, recovery of Rs.1,747 crore (principal: Rs.763 crore and interest: Rs.984 crore) was over-due. In nine cases recovery of loans is remote as these companies have either been liquidated or under liquidation.
1.7.4 Management of Cash Balances
It is generally desirable that State’s flow of resources should match its expenditure obligations. However, to take care of any temporary mismatches in the flow of resources and the expenditure obligations, a mechanism of Ways and Means Advances (WMA) - ordinary and special - from Reserve
21

Audit Report (Civil) for the year ended 31 March 2006
Bank of India (RBI) has been put in place. The operative limit for normal Ways and Means Advances is reckoned on the three-year average of revenue receipts and the operative limit for special WMA are fixed by the RBI from time to time depending on the holdings of Government Securities. During the year, the limit of normal Ways and Means Advances was fixed at Rs.570 crore. The operative limit of special Ways and Means Advances varied between Rs.2.21 crore and Rs.2,810.63 crore during the year depending on the securities held by the State. Ways and Means Advances and Overdraft availed and interest paid by the State is detailed in the Table below.
Table 19 : Ways and Means Advances and Overdrafts of the State and
Interest paid thereon (Rupees in crore)
2000-01 2001-02 2002-03 2003-04 2004-05 2005-06 Ways & Means Advances Availed in the Year -- 735.88 4,045.45 4,623.92 1,462.79 -- Interest Paid -- 0.91 5.22 7.94 1.20 -- No. of days availed -- 40 170 163 61 -- Overdraft Availed in the Year -- -- 47.84 757.72 -- -- Interest Paid -- -- 0.01 0.90 -- -- Number of days -- -- 1 33 -- --
Fiscal discipline improved the liquidity position of the State. In 2004-05 the utilisation of normal Ways and Means Advances declined and the State did not avail special Ways and Means Advances and over draft. In continuation with this trend, the State Government did not avail Ways and Means Advances or over draft and maintained the minimum cash balance with RBI throughout the year.
1.8 Un-discharged Liabilities
1.8.1 Fiscal Liabilities-Public Debt and Guarantees
There are two sets of liabilities namely, public debt and other liabilities. Public debt consists of internal debt of the State and is reported in the annual financial Statements under the consolidated fund – Capital account. It includes market loans, special securities issued to RBI and loans and advances from Central Government. The Constitution of India provides that State may borrow within the territory of India upon the security of its consolidated fund, within such limits, as may from time to time, be fixed by an Act of the Legislature and give guarantees within such limits as may be fixed. Other liabilities which are a part of public account include deposits under small savings scheme, provident funds, and other deposits.
Table 20 and the graph below show the fiscal liabilities of the State, their rate of growth, ratio of these liabilities to GSDP, to revenue receipts and to own resources as also the buoyancy of fiscal liabilities with respect to these parameters.
22

Chapter I - Finances of the State Government
Table 20 : Fiscal Liabilities –Basic Parameters
(Amount Rupees in crore and Ratios in per cent) 2000-01 2001-02 2002-03 2003-04 2004-05 2005-06
Fiscal Liabilities 26,571 32,566 37,234 41,967 46,940 52,236 Rate of growth (per cent) 19.2 22.6 14.3 12.7 11.8 11.3 Ratio of Fiscal Liabilities to GSDP (Per cent) 25.4 30.0 31.4 32.2 31.6 31.2 Revenue Receipts (Per cent) 179.3 212.6 230.3 202.1 176.7 172.1 Own Resources (Per cent) 248.3 198.4 213.41 270.3 229.6 232.1 Buoyancy of Fiscal Liabilities to GSDP(ratio) 1.9 6.1 1.5 1.3 0.8 0.9 Revenue Receipts (ratio) 1.3 6.6 2.6 0.4 0.4 0.8 Own Resources(ratio) 1.3 9.9 2.0 0.4 0.4 1.2
Fiscal liabilities (Rs.52,236 crore) of the State for the year 2005-06 comprised of consolidated fund liabilities (Rs.40,049 crore) and public account liabilities (Rs.12,187 crore). Consolidated fund liabilities comprising of loans from GOI and other negotiated loans constituted 77 per cent of the total liabilities of the State, while public account liabilities viz., small savings, reserve funds and deposits constituted 23 per cent.
As per the recommendation of the TFC, all states were required to set-up a Sinking Fund for amortisation of all loans including liabilities on account of National Small Saving Fund, etc.,. The State Government had already constituted a Sinking Fund for amortisation of open market loans. However, there were no contributions to the Sinking Fund since 1999-2000 onwards. The Sinking Fund was yet to be revived.
Growth of Fiscal Liabilities vis-a-vis Revenue Receipts (Rupees in crore)
26,571
32,56637,234
41,967
46,940
52,236
30,352
14,823 15,321 16,16920,760
26,570
03,0006,0009,000
12,00015,00018,00021,00024,00027,00030,00033,00036,00039,00042,00045,00048,00051,00054,00057,00060,000
2000-01 2001-02 2002-03 2003-04 2004-05 2005-06
Fiscal Liabilities Revenue Receipts
23

Audit Report (Civil) for the year ended 31 March 2006
1.8.2 Status of Guarantees – Contingent liabilities
Guarantees are liabilities contingent on the Consolidated Fund of the State in case of default by the borrower for whom the guarantee has been extended. The maximum amount for which guarantees were given by the State and outstanding guarantees at the end of year since 2000-01 as per Statement 6 of Finance Accounts are given in Table 21.
Table 21 : Guarantees given by the Government of Karnataka (Rupees in crore)
Year Max amount guaranteed
Outstanding amount of guarantees
Percentage of maximum amount guaranteed to total
revenue receipt 2000-01 16,425 13,004 111 2001-02 20,823 12,279 136 2002-03 20,973 13,314 130 2003-04 21,225 14,179 102 2004-05 19,910 11,574 75 2005-06 20,107 8,984 66
The Karnataka Ceiling on Government Guarantees Act, 1999, provides for a cap on outstanding guarantees at the end of any year at 80 per cent of the State’s revenue receipts of the previous year. The outstanding guarantees to the end of 2005-06 constituted 34 per cent of the revenue receipts of the year 2004-05. TFC recommended setting up of Guarantee Redemption Fund through earmarked guarantee fees based on risk weighing of guarantees. The State Government had already set-up a Guarantee Reserve Fund in 1999-2000 with a corpus of Rs.one crore. During the year Rs.7.47 crore collected as guarantee fees were, however, not transferred to the Fund.
1.8.3 Off-budget Borrowings
The borrowings of a State are governed under Article 293 of the Constitution of India. In addition to the liabilities shown in Table 20, the State guaranteed loans taken by Government companies/corporations. These companies/ corporations borrowed funds from the market/financial institutions for implementation of various State plan programmes projected outside the State budget. Although the estimates of the plan programmes of the State Government projected that funds for these programmes would be met out of resources of the companies/corporations outside the State budget, in reality the borrowings of many of these concerns were ultimately the committed liabilities of the State Government termed ‘off-budget borrowings’. Though off-budget borrowings are not permissible under Article 293 (3), the State resorted to off-budget borrowings as evident by the data furnished by the Finance Department. Table 22 captures the trends in the off-budget borrowings of the State during 2000-06 while Table 23 gives the entity-wise position of borrowings.
24

Chapter I - Finances of the State Government
Table 22 : Trend in Off-budget borrowings (Rupees in crore)
Year 2000-01 2001-02 2002-03 2003-04 2004-05 2005-06 (RE)
Amount as per MTFP♠ 1,648 1,533 1,388 1,104 838 997 ♠ figures are yet to be reconciled with those of the financial institutions.
Table 23 : Entity-wise position of Off-budget borrowings (Rupees in crore)
Company/Corporation/Board
Off-budget borrowings Repayment of principal upto
2005-06
up to 2004-05
during 2005-06
Total
Krishna Bhagya Jala Nigam 3460.07 350.96 3811.03 1287.03 Karnataka Neeravari Nigam 1567.56 250.00 1817.56 245.65 Karnataka Road Development Corporation 553.76 1.75 555.51 104.84 Slum Clearance Board 186.05 0 186.05 33.80 Rajiv Gandhi Rural Housing Corporation 897.38 157.26 1054.64 91.67 Karnataka State Electronics Development Corporation Limited (Mahithi Bonds)
65.35 0 65.35 0
Karnataka Police Housing Corporation 255.56 38.92 294.48 6.27 Karnataka Land Army Corporation 143.76 0 143.76 68.23 Karnataka Renewable Energy Development Limited 105.66 0 105.66 0 Cauvery Neeravari Nigam 423.87 264.67 688.54 0 Karnataka Residential Education Institution Society 0 0 0 15.88 Karnataka Small Industrial Investment Development Corporation
863.92 77.70 941.62 2279.45
Karnataka Housing Board 0 0 0 212.63 Total 8522.94 1141.26 9664.20 4345.45
As per MTFP, the State was required to phase out off-budget borrowings. Accordingly, State Government extended budgetary support to the extent of Rs.2,007 crore to seven entities during 2005-06. Taking into account the off-budget borrowings of the State, the total liabilities at the end of March 2006 work out to Rs.57,555 crore as against Rs.52,236 crore reflected in Table 20. In view of this the ratio of fiscal liabilities to GSDP would increase to 34 per cent at the end of the year.
1.8.4 Debt Sustainability
The debt sustainability is defined as the ability to maintain a constant debt – GDP ratio over a period of time. In simple terms, public debt is considered sustainable as the rate of growth of income exceeds the interest rate or cost of public borrowings subject to the condition that the primary balance is either positive or zero.
Table 24 : Debt Sustainability – Interest Rate and GSDP Growth (in per cent)
2000-01 2001-02 2002-03 2003-04 2004-05 2005-06 Weighted Interest Rate 12.1 11.1 9.9 8.6 8.5 9.2 GSDP Growth 10.0 3.7 9.3 9.7 14.1 12.7 Interest spread -2.0 -7.4 -0.6 1.1 5.6 3.5 Quantum Spread (Rs. in crore) -531 -2,410 -223 462 2,629 1,828 Primary deficit (Rs. crore) 1,831 3,186 1,990 791 --- --- Primary surplus (Rs. crore) --- --- --- --- 194 78
GSDP growth rate exceeded the average interest rate from 2004-05 onwards.
25

Audit Report (Civil) for the year ended 31 March 2006
1.8.5 Net Availability of Borrowed Funds Another important indicator of debt sustainability is the net availability of funds after payment of the principal on account of earlier contracted liabilities and interest. Table 25 below gives the position of the receipt and repayment of internal debt and other fiscal liabilities of the State over the last five years.
Table 25 : Net Availability of Borrowed Funds
(Rupees in crore) 2000-01 2001-02 2002-03 2003-04 2004-05 2005-06
Internal Debt Receipts 2,295.58 2,969.48 3,888.52 6,531.33 6,953.68 4,994.89 Repayment (Principal + interest) 859.35 1,193.45 1,618.53 2,523.27 2,666.13 2,910.82 Net Fund Available 1,436.23 1,776.03 2,269.99 4,008.06 4,287.55 2,084.07 Net Fund Available (Per cent) 63 60 58 61 62 42 Loans and Advances from GOI Receipt 1,07,565 2,176.88 1,544.22 1,457.00 1,555.75 668.66 Repayment (Principal + Interest) 1,652.09 1,799.41 2,932.84 4,196.92 4,703.74 1,132.66 Net Fund Available (-)576.44 377.47 (-) 1,388.62 (-) 2,739.92 3,147.99 (-)464.00 Net Fund Available (Per cent) - 17 - - - - Other obligations Receipt 13,265.64 15,531.58 15,077.11 16,426.71 19,227.98 18,806.35 Repayment (Principal + Interest) 12,228.96 14,373.54 14,582.31 16,671.81 19,188.30 18,895.15 Net Fund Available 1036.68 1,158.04 494.80 (-)245.10 39.68 (-)88.80 Net Fund Available (Per cent) 8 7 3 - 0.2 - Total liabilities Receipt 16,636.87 20,677.94 20,509.85 24,415.04 27,737.41 24,469.90 Repayment (Principal + Interest) 14,740.40 17,366.40 19,133.68 23,392.06 26,558.17 22,938.63 Net Fund Available 1,896.47 3,311.54 1,376.17 1,023.04 1,179.24 1,531.27 Net Fund Available (Per cent) 11 16 7 4 4 6
Net Availability of the borrowed funds increased during 2005-06 mainly due to consolidation and rescheduling of Central loans. 1.9 Management of Deficits
The deficits in the Government accounts represent the gap between its receipts and expenditure. The nature of deficit is an indicator of prudence in fiscal management by the State. Further, the ways in which deficit is financed and resources so raised are applied, are important pointers to fiscal health.
The revenue deficit of the State, which is the excess of its revenue expenditure over revenue receipts declined from Rs.1,862 crore in 2000-01 to Rs.525 crore in 2003-04. Revenue surplus of Rs.1,638 crore in 2004-05 increased to Rs.2,311 crore in 2005-06. Fiscal deficit, which represents the total borrowing of the State and its total resource gap was Rs.3,687 crore in 2005-06. It was, however, overstated to the extent of Rs.358 crore being loans waived under the Debt Write-off Scheme but not taken into account in 2005-06. Table 26
Small savings, provident funds, reserve funds and deposits.
26

Chapter I - Finances of the State Government
and graphic representation below brings out the basic parameters of fiscal imbalance.
Table 26 : Fiscal Imbalances – Basic Parameters (Amount Rupees in crore and Ratios in per cent)
Parameters 2000-01 2001-02 2002-03 2003-04 2004-05 2005-06 Revenue deficit (RD) 1,862 3,284 2,646 525 --- --- Revenue surplus (RS) --- --- --- --- 1,638 2,311 Fiscal deficit (FD) 4,219 5,869 5,282 4,501 3,600 3,687 Primary Deficit (PD) 1,831 3,186 1,990 791 --- --- Primary Surplus --- --- --- --- 194 78 RD/ GSDP 1.78 3.02 2.23 0.40 --- --- FD/ GSDP 4.03 5.41 4.45 3.45 2.42 2.20 PD/ GSDP 1.75 2.93 1.67 0.60 0.13 0.05 RD/FD 44.1 55.9 50.1 11.7 --- ---
Fiscal Imbalances (Rupees in crore)
2,3111,638
525
2,6463,284
1,862
5,2824,501
3,600 3,687
5,869
4,219
78194
791
1,990
3,186
1,831
7000
6000
5000
4000
3000
2000
1000
0
1000
2000
3000
4000
Def
icit
S
urpl
us
Revenue Deficit / Surplus Fiscal Deficit Primary Deficit/Surplus
The years 2004-05 and 2005-06 ended with revenue surplus of Rs.1,638 crore and Rs.2,311 crore respectively and there was increase in cash balance of Rs.2,528 crore at end of 2005-06 over the previous year. Despite this, fiscal deficit did not show declining in trend during the 2005-06 due to increase in capital expenditure including loans and advances from Rs.5,285 crore to Rs.6,122 crore.
1.10 Fiscal Ratios
The finances of a State should be sustainable, flexible and non-vulnerable. Table 27 below presents a summarised position of Government Finances during the period 2000-2006, with reference to certain key indicators that help assess the adequacy and effectiveness of available resources and their application, highlight areas of concern and captures its important facts.
2000-01 2001-02 2002-03 2003-04 2004-05 2005-06
27

Audit Report (Civil) for the year ended 31 March 2006
The ratios of revenue receipts and State’s own taxes to GSDP indicate the adequacy of its resources. The buoyancy of the revenue receipts indicates the nature of the tax regime and the State’s increasing access to resources with increase in GSDP. Various ratios of expenditure management of the State indicate the quality of expenditure and its sustainability in relation to resources mobilisation.
Table 27 : Indicators of Fiscal Health (in per cent)
Fiscal Ratios 2000-01 2001-02 2002-03 2003-04 2004-05 2005-06 I. Resource Mobilisation Revenue Receipts (RR)/GSDP 14.2 14.1 13.6 15.9 17.9 18.1 Revenue Buoyancy 1.5 0.9 0.6 2.9 2.0 1.1 Own Tax/GSDP 8.6 9.1 8.8 9.7 10.8 11.1 II. Expenditure Management Total Expenditure (TE)/GSDP 18.3 19.6 18.9 19.5 20.3 20.4 Revenue Receipts /Total Expenditure 77.4 72.2 72.2 82.0 87.9 88.8 RE/Total Expenditure 87.2 87.7 84.1 84.0 82.5 82.1 Salary Expenditure on Social & Economic Services/RE
20.4 19.8 19.1 17.8 15.6 15.4
Non-salary expenditure on Social & Economic Services/RE
42.6 43.8 40.1 36.7 41.5 44.7
Capital Expenditure (CE)/TE 10.45 10.1 13.5 12.4 15.8 17.2 CE on Social & Economic Services/TE 10.2 9.9 13.1 11.9 15.4 16.5 Buoyancy of TE with RR 0.7 3.2 0.9 0.5 0.7 0.9 Buoyancy of RE with RR 0.6 3.4 0.2 0.5 0.6 0.9 Management of Fiscal Imbalances Revenue deficit (Rs. in crore) 1,862 3,284 2,646 525 --- --- Revenue Surplus (Rs. in crore) --- --- --- --- 1,638 2,311 Fiscal deficit (Rs. in crore) 4,219 5,869 5,282 4,501 3,600 3,687 Primary Deficit (Rs. in crore) 1,831 3,186 1,990 791 --- --- Primary Surplus (Rs. in crore) --- --- --- --- 194 78 Revenue Deficit/Fiscal Deficit 44.1 55.9 50.1 11.7 --- --- Management of Fiscal Liabilities Fiscal Liabilities (FL)/GSDP 25.4 30.0 31.4 32.2 31.6 31.2 Fiscal Liabilities/RR 179.3 212.6 230.3 202.1 176.7 172.1 Buoyancy of FL with RR 1.3 6.6 2.6 0.4 0.4 0.8 Buoyancy of FL with Own Receipts 1.3 9.9 2.0 0.4 0.4 1.2 PD vis-a-vis quantum spread (-)3.4 (-) 1.3 (-) 8.9 1.7 0.07 0.04 Net Fund Available (%) 11 16 7 4 4 6 Other Fiscal Health Indicators Return on Investment (Rs. in crore) 8.9 10.6 21.3 18.0 16.7 17 BCR (Rs. in crore) (-)1,140 (-) 879 (-) 645 1,571 4,879 5,483 Financial Assets/Liabilities 0.8 0.7 0.7 0.7 0.8 0.8
The ratio of revenue receipts to total expenditure increased to 89 per cent indicating that the growth of expenditure was less than the growth of revenue receipts.
Balance from Current Revenue (BCR) which became positive in 2004-05 continued to be so during 2005-06 indicating availability of resources from current revenue for meeting plan expenditure. Revenue surplus increased from Rs.1,638 crore in 2004-05 to Rs.2,311 crore. Fiscal deficit of the State increased to Rs.3,687 crore in 2005-06. Return from investments remained stagnant in 2005-06. The liabilities of the State reduced due to re-scheduling of Central loans under DCRF.
28

Chapter I - Finances of the State Government
1.11 Conclusion
BCR which turned positive during the year 2003-04 had continued to be so in 2004-05 and 2005-06. The BCR was Rs.5,483 crore, indicating the availability of money for programme spending after meeting the non-plan expenditure on revenue account. Ratio of Fiscal Deficit to GSDP was below three per cent. Revenue surplus increased from Rs.1,638 crore in 2004-05 to Rs.2,311 crore in 2005-06 and there was an increase of Rs.2,528 crore in cash balance over the previous year. Despite this, fiscal deficit did not show declining trend during 2005-06 due to increase in capital expenditure including loans and advances. Committed expenditure on salaries, interest payments and pensions consumed 39 per cent of revenue receipts. Recovery of outstanding loans and advances was meagre as also the return on investment in Government companies, corporations etc. The ratio of fiscal liability to GSDP stabilised and stood at 31 per cent. However, taking into account the off-budget borrowings of Rs.5,319 crore outstanding at the end of the year 2005-06, the ratio would be 34 per cent. Measures like rationalisation of user charges, targeting of subsidy to deserving section of the society, recovery of arrears of revenue are the best means available to ensure fiscal stability and sustainability.
29

Audit Report (Civil) for the year ended 31 March 2006
Statement I Summarised Financial Position of the Government of Karnataka
as on 31 March 2006 (Rupees in Crore)
As on 31.3.2005 Liabilities As on
31.3.2006 26,165.18 Internal Debt 30,766.71
11,762.00 Market Loans bearing interest 11,933.46 7.49 Market Loans not bearing interest 1.54 747.67 Loans from Life Insurance Corporation of India 712.94 1,092.41 Loans from other Institutions 1,291.61 12,555.61 Loans from RBI – Spl. Securities issued to National
Small Savings fund of the Central Government. 16,827.16
9,031.06 Loans and Advances from Central Government - 9,282.22 50.19 Pre 1984-85 Loans 0.07 482.62 Non-Plan Loans 118.41 8,290.62 Loans for State Plan Schemes 8,960.12 43.94 Loans for Central Plan Schemes 40.23 163.69 Loans for Centrally Sponsored Plan Schemes 163.39
41.09 Contingency Fund 80.00 6,469.68 Small Savings, Provident Funds, etc. 7,125.55 2,468.54 Reserve Funds 2,941.83 2,826.94 Deposits 2,464.73 1,020.11 Suspense and Miscellaneous balances 1,468.46
- Remittances 4.15 0.69 Remittances in transit -
48,023.29 Total 54,133.65*
Assets
30,137.91 Gross Capital Outlay on Fixed Assets - 35,959.83 10,740.04 Investments in shares of Companies, Corporations, etc. 14,051.17 19,397.87 Other Capital Outlay 21,908.66
5,767.52 Loans and Advances - 5,943.57 1,236.93 Loans for Power Projects 1,248.70 4,408.26 Other Development Loans 4,644.09 122.33 Loans to Government servants and Miscellaneous
Loans 50.78
14.25 Other Advances 20.43 35.51 Remittance balances -
2,079.79 Cash - 4,606.64 0.85 Cash in treasuries 1.18 5.28 Departmental Cash Balance including permanent
Advances 5.16
22.40 Deposits with Reserve Bank of India 50.90 - Remittances in Transit 0.08 2,029.83 Cash Balance Investments 4,204.34 21.43 Investment from earmarked funds 344.98
9,988.31 Deficit on Government Accounts 7,603.18 11,700.30 Accumulated Deficit 9,988.31 1,637.81 Deduct Revenue Surplus 2,311.16 74.18 Deduct Other adjustments 73.97
48,023.29 Total 54,133.65
This reflects an adjusting entry on account of remittances between Treasuries and Currency chest remaining unadjusted as on 31 March 2005
* The liabilities shown above do not include off budget borrowings. Please refer explanatory note No.5 below Statement No.III.
30

Chapter I - Finances of the State Government
Statement II Abstract of Receipts and Disbursements for the year 2005-06
(Rupees in crore)
2004-05 Receipts 2005-06 2004-05 Disbursements 2005-06 Non Plan Plan Total
Section-A: Revenue 26569.66 I. Revenue
receipts 30352.05 24931.85 I. Revenue
expenditure- 22972.22 5068.67 28040.89
16072.32 Tax revenue 18631.55 9900.24 General Services 10023.81 12.01 10035.82 4472.34 Non-tax
revenue 3874.71 Social Services
3878.44 State’s share of Union Taxes & Duties
4213.42 4357.91 Education, Sports, Art and Culture
3783.74 1053.66 4837.40
262.73 Non Plan grants 1735.74 1035.61 Health and Family Welfare
749.08 389.42 1138.50
1088.79 Grants for State Plan Schemes
915.28 857.89 Water Supply, Sanitation, Housing and Urban Development
87.73 824.04 911.77
795.04 Grants for Central and Centrally Sponsored Schemes
981.35 26.45 Information and Broadcasting
17.09 2.37 19.46
534.92 Welfare of Scheduled Castes, Scheduled Tribes and Other Backward Classes
261.32 414.22 675.54
68.24 Labour and Labour Welfare
43.77 22.93 66.70
785.66 Social Welfare and Nutrition
802.09 300.22 1102.31
56.07 Others 43.15 103.96 147.11 7722.75 Total 5787.97 3110.82 8898.79
Economic Services
2064.91 Agriculture and Allied Activities
2208.79 657.86 2866.65
696.86 Rural Development
145.50 630.50 776.00
46.73 Special Areas Programmes
142.45 29.00 171.45
213.91 Irrigation and Flood Control
151.20 64.61 215.81
1896.71 Energy 1822.68 14.25 1836.93 315.26 Industry and
Minerals 222.58 135.11 357.69
617.60 Transport 441.22 314.88 756.10 8.86 Science,
Technology and Environment
0.01 15.77 15.78
649.68 General Economic Services
867.05 83.86 950.91
6510.52 Total 6001.48 1945.84 7947.32 798.34 Grants-in-aid and
Contributions 1158.96 --- 1158.96
1637.81 II Revenue surplus carried over to Sec-B
2311.16
26569.66 Total 30352.05 26569.66 Total 30352.05
Section-B - Others 335.48 II. Opening Cash balance
including Permanent Advances & Cash Balance Investments & investments from earmarked funds.
2079.11 4673.68 III. Capital Outlay
15.53 5806.40 5821.93
136.21 General Services --- 217.92 217.92 Social Services
31

Audit Report (Civil) for the year ended 31 March 2006
2004-05 Receipts 2005-06 2004-05 Disbursements 2005-06 Non Plan Plan Total
--- III. Miscellaneous Capital receipts
4.92 Education, Sports, Art and Culture
2.09 50.58 52.67
8.30 Health and Family Welfare
--- 7.69 7.69
411.38 Water Supply, Sanitation, Housing and Urban Development
--- 969.78 969.78
0.66 Information and Broadcasting
--- 1.80 1.80
55.29 Welfare of Scheduled Castes, Scheduled Tribes and Other Backward Classes
--- 66.37 66.37
5.46 Social Welfare and Nutrition
--- 3.57 3.57
0.03 Other Social Services
--- 3.42 3.42
486.04 Total 2.09 1103.21 1105.30 Economic
Services
18.80 Agriculture and Allied Activities
(-) 9.45 26.62 17.17
0.93 Rural Development
0.96 --- 0.96
3009.73 Irrigation and Flood Control
3.44 3326.25 3329.69
--- Energy --- 50.00 50.00 8.87 Industry and
Minerals --- 12.10 12.10
895.82 Transport 19.04 1011.41 1030.45 117.28 General Economic
Services (-)0.55 58.89 58.34
4051.43 Total 13.44 4485.27 4498.71 46.85 IV. Recoveries of Loans
and Advances 123.55 611.43 IV. Loans and
Advances 43.66 255.94 299.60 299.60
2.25 From Power Projects
6.36 147.78 For Power Projects
--- 18.13 18.13
(-)6.75 From Government Servants
6.22 6.75 To Government Servants
2.27 0.03 2.30
37.85 From others 110.97 456.90 To Others 41.39 237.78 279.17 8509.43 V. Public debt receipts 5663.55 4029.40 V. Repayment
of Public Debt 810.86 810.86 810.86
6953.68 Internal debt other than Ways and Means Advances and Overdraft
4994.89 621.81 Internal debt other than Ways and Means Advances & Overdraft
393.36 393.36
1555.75 Loans and Advances from the Central Government
668.66 3407.59 Repayment of Loans and Advances to Central Government
417.50 417.50
40.52 VI. Contingency Fund (recoupment)
38.91 38.91 VI. Contingency Fund
--- ---
36325.19 VII. Public Account Receipts
38025.00 35462.75 VII. Public Account Disbursements
36702.25
1521.49 Small Savings and Provident funds, etc.
1650.55 936.10 Small Savings and Provident Funds etc.
994.68
569.97 Reserve funds 1288.36 104.91 Reserve Funds 815.07 17211.29 Deposits and
Advances 15926.09 17773.09 Deposits and
Advances 16294.49
Represents receipts and recoveries on capital account during 2005-06.
32

Chapter I - Finances of the State Government
2004-05 Receipts 2005-06 2004-05 Disbursements 2005-06 Non Plan Plan Total
14389.56 Suspense and Miscellaneous
16393.36 14124.50 Suspense and Miscellaneous
15871.03
2632.88 Remittances 2766.64 2524.15 Remittances 2726.98 1637.81
VIII. Revenue Surplus carried over from Section–A.
2311.16
2079.11 VIII. Cash Balance at end
4606.64
0.17 Cash in Treasuries and Local Remittances
1.26
22.40 Deposits with Reserve Bank
50.90
5.28 Departmental Cash Balance including Permanent Advances
5.16
2029.83 Cash Balance Investment
4204.34
21.43 Investment from earmarked funds
344.98
46895.28 Total 48241.28 46895.28 Total 48241.28
33

Audit Report (Civil) for the year ended 31 March 2006
Statement III Sources and Applications of Funds
(Rupees in crore) Sources
2004-2005 2005-06 26569.66* 1. Revenue receipts 30352.05
46.85* 2. Recoveries of Loans and Advances 123.55 4480.03 3. Increase in Public debt 4852.69
862.44 4. Net receipts from Public account 1322.75 585.39 Increase in Small Savings, PF, etc 655.87 (-)561.80 Net effect of Deposits and Advances (-)368.40 465.06 Increase in Reserve funds 473.29 265.06 Net effect of Suspense and Miscellaneous
transactions 522.33
108.73 Net effect of Remittance transaction 39.66
-- 5. Closing Cash Balance (Decrease) --- 1.61 6. Net effect of Contingency Fund Transaction 38.91
31960.59 Total 36689.95
Applications 24931.85* 1. Revenue expenditure 28040.89
611.43 2. Lending for development and other purposes 299.60 4673.68 3. Capital expenditure (Net) 5821.93 1743.63 4. Increase in cash Balance 2527.53
31960.59 Total 36689.95 * refer footnote 5 below. Explanatory Notes for Statement I, II and III:
1. The abridged accounts in the foregoing statements have to be read with comments and explanations in the Finance Accounts.
2. Government accounts being mainly on cash basis, the deficit on Government account, as shown in Statement I, indicates the position on cash basis, as opposed to accrual basis in commercial accounting. Consequently, items payable or receivable or items like depreciation or variation in stock figures, etc., do not figure in the accounts.
3. Suspense and Miscellaneous balances include cheques issued but not paid, payments made on behalf of the State and others pending settlement, etc.
4. There was a difference of Rs.23.55 crore (credit) between the figures reflected in the accounts and that intimated by the RBI under “Deposit with Reserve Bank”. A net difference of Rs.2.07 crore (debit) had since been reconciled and adjusted. The remaining difference of Rs.25.62 crore (credit) is under reconciliation.
5. The figures of revenue receipts (Rs.26,162.91 crore), tax revenue (Rs.15,769.13 crore), Non tax revenue (Rs.4,368.78 crore) and recoveries of loans and advances (Rs.44.60 crore), revenue expenditure (Rs.24,522.85 crore) as appearing in the Audit Report (Civil) for the 2004-05 have been corrected proforma after closure of the accounts to revenue receipts (Rs.26,569.66 crore), tax revenue (Rs.16,072.32 crore), Non tax revenue (Rs.4,472.34 crore) and recoveries of loans and advances (Rs.46.85 crore), revenue expenditure (Rs.24,931.85 crore) being the transactions relating to power subsidy not carried out in the Annual Accounts of 2004-05 in the books of accounts of AG(A&E).
34

Chapter I - Finances of the State Government
Statement IV Time Series Data on State Government Finances
(Rupees in crore) 2000-01 2001-02 2002-03 2003-04 2004-05 2005-06
PART A. RECEIPTS 1. Revenue Receipts 14,823 15,321 16,169 20,760 26,570 30,352 (i) Tax Revenue 9,043 (61) 9,853 (64) 10,440(65) 12,570 (61) 16,072(60) 18,632(61) Taxes on Agricultural Income 24 (-) 3 (-) 1 (-) 1 (-) 2 2 Taxes on Sales, Trade, etc. 5,386 (60) 5,269 (53) 5,474 (52) 6,649 (53) 8,700(54) 9,870(53) State Excise 1,523 (17) 1,977 (20) 2,094 (20) 2,334 (19) 2,806(17) 3,397(18) Taxes on vehicles 502 (6) 712 (7) 676 (6) 800 (6) 983(6) 1,105(6) Stamps and Registration fees 638 (7) 855 (9) 1,115 (11) 1,356 (11) 1,760(11) 2,213(12) Land Revenue 43 (-) 50 (1) 60 (1) 68 (-) 118(1) 117(1) Other Taxes 927 (10) 987 (10) 1,020 (10) 1,362 (11) 1,703(11) 1,928(10) (ii) Non Tax Revenue 1,660 (11) 1,094 (7) 1,278 (8) 2,958 (14) 4,473(17) 3,875(13) (iii ) State's share in Union taxes and duties 2,574 (17) 2,623 (17) 2,786 (17) 3,245 (15) 3,878(15) 4,213(14) (iv) Grants in aid from Government of India 1,546 (11) 1,751 (12) 1,665 (10) 1,987 (10) 2,147(8) 3,632(12) 2. Miscellaneous Capital Receipts (non debt) Nil Nil Nil Nil Nil Nil 3. Total revenue & Non debt capital receipts (1+2) 14,823 15,321 16,169 20,760 26,570 30,352 4. Recoveries of Loans and Advances 101 35 928 64 47 124 5. Public Debt Receipts 3,371 5,146 5,433 7,988 8,509 5,664 Internal Debt (excluding Ways & Means Advances and Overdrafts)
2,295 (68) 2,969 (58) 3,889 (72) 6,531 (82) 6,953(82) 4,995(88)
Loans & Advances from Government of India * 1,076 (32) 2,177 (42) 1,544 (28) 1,457 (18) 1,556(18) 669(12) 6. Total receipts in the Consolidated Fund (3+4+5) 18,295 20,502 22,530 28,812 35,126 36,140
7. Contingency Fund Receipts 15 54 8 -- 41 39 8. Public Account Receipts 24,797 28,502 27,879 30,513 36,325 38,025 9. Total receipts of the State (6+7+8) 43,107 49,058 50,417 59,325 71,492 74,204 PART B. EXPENDITURE/DISBURSEMENT 10. Revenue expenditure 16,685 18,605 18,815 21,285 24,932 28,041 Plan 3,481 (21) 3,943 (21) 3,245 (17) 3,553 (17) 5,125(21) 5,069(18) Non Plan 13,204 (79) 14,662 (79) 15,570 (83) 17,732 (83) 19,807(79) 22,972(82) General Services (incl. Interest Payments) 5,634 (34) 6,215 (33) 7,112 (38) 9,039 (42) 9,900(40) 10,036(36) Social Services 6,132 (37) 6,429 (35) 6,326 (34) 6,965 (33) 7,723(31) 8,899(32) Economic Services 4,388 (26) 5,397 (29) 4,803 (25) 4,652 (22) 6,511(26) 7,947(28) Grants in aid and Contributions 531 (3) 564 (3) 574 (3) 629 (3) 798(3) 1,159(4) 11. Capital Expenditure 1,947 2,106 2,936 3,029 4,674 5,822 Plan 1,705 (88) 1,899 (90) 2,734 (93) 2,930 (97) 4,586(98) 5,806(100) Non Plan 242 (12) 207 (10) 202 (7) 99 (3) 88(2) 16 General Services 48 (3) 52 (2) 76 (3) 128 (4) 136(3) 218(4) Social Services 299 (15) 212 (10) 295 (10) 427 (14) 486(10) 1,105(19) Economic Services 1,600 (82) 1,842 (88) 2,565 (87) 2,474 (82) 4,052(87) 4,499(77) 12. Disbursement of Loans and Advances 511 514 628 1,011 611 300 13. Total (10+11+12) 19,143 21,225 22,379 25,325 30,217 34,163 14. Repayments of Public Debt 521 712 1,696 3,441 4,029 811
Internal Debt (excluding Ways & Means Advances and Overdrafts)
101 (19) 231 (32) 287 (17) 780 (23) 622(15) 393
Net transactions under Ways & Means Advances and Overdraft
-- -- -- -- -- -
Loans and Advances from Government of India * 420 (81) 481 (68) 1,409 (83) 2,661 (77) 3,407(85) 418 15. Appropriation to Contingency Fund -- -- -- -- -- - 16. Total disbursement out of Consolidated Fund
(13+14+15) 19,664 21,937 24,075 28,766 34,246 34,974
17. Contingency Fund disbursements 53 8 -- 41 39 -- 18. Public Account disbursements 23,260 27,107 26,825 30,665 35,463 36,702 19. Total disbursement by the State (16+17+18) 42,977 49,052 50,900 59,472 69,748 71,676 PART C. DEFICIT/SURPLUS 20. Revenue Deficit 1-10) 1,862 3,284 2,646 525 -- --- Revenue Surplus (10-1) -- -- -- -- 1,638 2,311 21. Fiscal Deficit (3+4-13) 4,219 5,869 5,282 4,501 3,600 3,687 22. Primary Deficit (21-23) 1,831 3,186 1,990 791 --- --- Primary Surplus (23-21) --- --- --- --- 194 78 PART D. OTHER DATA 23. Interest Payments (included in revenue expenditure) 2,388 2,683 3,292 3,710 3,794 3,765 24. Arrears of Revenue (Percentage of Tax & Non-Tax
Revenue Receipts) 1,894
(18) 2,634 (24)
3,390 (29)
3,104 (20)
3604 (18)
3620 (16)
25. Financial Assistance to local bodies, etc. 6,451 7,429 7,675 7,780 8306 11183 26. Ways and Means Advances/Overdraft availed (days) - 40 171 196 61 --
35

Audit Report (Civil) for the year ended 31 March 2006
2000-01 2001-02 2002-03 2003-04 2004-05 2005-06 27. Interest on WMA/Overdraft - 0.91 5.23 8.85 1.20 - 28. Gross State Domestic Product (GSDP) 1,04,541 1,08,461 1,18,604 Φ1,30,127 ⊕1,48,521 1,67399 29. Outstanding Debt (year end) 26,571 32,566 37,234 41,967 46,940 52,236 30. Outstanding Guarantees (year end) 13,004 12,279 13,314 14,179 11,574 8,984 31. Maximum amount Guaranteed (year end) 16,425 20,823 20,973 21,225 19,910 20,107 32. Number of incomplete projects (as per material in Finance Accounts)
97 103 35 70 238 120
33. Capital blocked in incomplete projects 3,295 4,814 6,141 8813 9,496 3,450 ♦
Note: Figures in brackets represent percentages (rounded) to total of each sub heading * - Excludes Ways and Means Advances from Government of India Φ - Provisional ⊕ - Quick estimates GSDP figures for 2005-06 have been adopted as in overview of budget for 2006-07. ♦ - This includes Rs.3,243 crore invested in Upper Krishna Project now executed by Krishna Bhagya Jala Nigam Ltd, a Government Undertaking.
36

CHAPTER – II
ALLOCATIVE PRIORITIES AND APPROPRIATION
2.1 Introduction
The Appropriation Accounts prepared annually indicate expenditure (capital and revenue) on various specified services vis-à-vis those authorised by the Appropriation Act in respect of both charged and voted items of budget.
Audit of appropriation by the Comptroller and Auditor General of India seeks to ascertain whether the expenditure actually incurred under various grants is within the authorisation given under the Appropriation Act and the expenditure required to be charged under the provisions of the Constitution is so charged. It also ascertains whether the expenditure so incurred is in conformity with the law, relevant rules, regulations and instructions.
2.2 Summary of Appropriation Accounts
The summarised position of actual expenditure during 2005-06 against 29 grants/appropriations was as follows:
(Rupees in crore)
Nature of expenditure Original grant/
appropriation
Supplementary grant/
appropriation Total Actual
expenditure
Unspent Provision
(-)/ Expenditure in Excess of
Provision (+) Voted Revenue 24,752.44 2,685.74 27,438.18 24,987.23 (-) 2,450.95
Capital 5,710.54 1,294.39 7,004.93 6,192.64 (-)812.29 Loans & Advances
343.63 321.70 665.33 391.80 (-)273.53
Total Voted 30,806.61 4,301.83 35,108.44 31,571.67 (-)3,536.77 Charged Revenue 4,110.35 6.42 4,116.77 3,826.13 (-)290.64
Capital 0.25 0 0.25 0 (-)0.25 Public Debt 2,246.17 56.54 2,302.71 810.86 (-)1491.85
Total Charged 6,356.77 62.96 6,419.73 4,636.99 (-)1,782.74 Grand Total 37,163.38 4,364.79 41,528.17 36,208.66 (-)5,319.51
The overall unspent provision of Rs.5,319.51 crore mentioned above was the net result of unspent provision of Rs.6,128.53 crore in 29 grants/appropriations partly offset by excess of Rs.809.02 crore in five grants/appropriations (details vide appropriation accounts 2005-06). Detailed Appropriation Accounts were communicated to the Controlling Officers to explain the significant variations; explanations were not received (November, 2006).
37

Audit Report (Civil) for the year ended 31 March 2006
2.3 Fulfilment of allocative priorities
2.3.1 Appropriation by allocative priorities Out of unspent provision of Rs.6,128.53 crore, unspent provisions of more than Rs.100 crore occurred in eight grants, during 2005-06. Large unspent provisions were in areas like Finance, Agriculture and Horticulture, Debt Servicing, Water Resources, Public works, etc as detailed in the table below:
(Rupees in crore)
Sl. No Grant
Total Provision
Expenditure Unspent
Provision
1 1-Agriculture and Horticulture Revenue Voted 1,063.96 653.87 410.09
2 3-Finance Revenue Voted 5,620.61 4,128.28 1,492.33
3 7- Rural Development & Panchayat Raj Revenue Voted 1,112.59 954.95 157.64 Capital Voted 786.87 684.34 102.53
4
19-Urban Development Revenue Voted 1,603.69 1,344.94 258.75 Capital Voted 361.42 243.52 117.90
5
20-Public Works Revenue Voted 1,256.46 981.73 274.73 Capital Voted 1,327.21 1,218.72 108.49
6 21- Water Resources Capital Voted 3,645.34 3,353.40 291.94
7
22-Health & Family Welfare Revenue Voted 1,295.36 1,094.32 201.04
8 29- Debt Servicing Revenue Charged 4,029.34 3,764.82 264.52
Capital Charged 2,302.71 810.86 1,491.85 Total 24,405.56 19,233.75 5,171.81
Departments did not intimate reasons for unspent provisions. Heads of Account under which major part of the provisions remained unspent in these eight grants are detailed in Appendix 2.1.
2.3.2 There were unspent provisions (Rs. 8.54 crore) due to non-release of funds and non/short release of letter of credit in three grants (Appendix 2.2).
2.3.3 Persistent unspent provision In 33 cases involving seven grants there were persistent unspent provisions exceeding Rs.0.25 crore and 10 per cent or more of the provision (Appendix 2.3).
2.3.4 Surrender of unspent provisions According to rules framed by Government, the departments are required to surrender grants/appropriations or portions thereof to the Finance Department as and when savings are anticipated. However, out of total unspent provision of Rs.6,096.67 crore♦ in 27 grants/appropriations, Rs.753.63 crore (12 per cent) were surrendered on the last day of the financial year. Unspent provision of Rs.5,343.04 crore remained un-surrendered (Appendix 2.4).
♦ Excludes Rs.29.63 crore surrendered in excess in three grants and Rs.2.23 crore surrendered in full in three grants.
38

Chapter II - Allocative priorities and Appropriation
2.4 Excess requiring regularisation
2.4.1 As per Article 205 of the Constitution of India, it is mandatory for a State Government to get the excess over a grant/appropriation regularised by the State Legislature. However, the excess expenditure amounting to Rs.7,210.72♣ crore for the years 1989-90 to 2004-05 was yet to be regularised (November 2006) (Appendix 2.5).
2.4.2 The excess of Rs.809.02 crore under five grants/ appropriations during 2005-06 requires regularisation. Details are given below:
(Amount in Rupees)
Sl. No. Grant/appropriation Total Grant/ appropriation
Actual expenditure Excess
1 3 – Finance Revenue Charged 22,00,000 2,34,10,771 2,12,10,771
2 14- Revenue Revenue Voted 13,67,17,83,000 17,46,10,59,416 3,78,92,76,416 Capital Voted 11,21,00,000 27,64,20,908 16,43,20,908
3 18- Commerce and Industries
Revenue Voted 7,81,45,35,000 11,62,24,62,970 3,80,79,27,970 4 24- Energy Revenue Voted 21,27,82,51,000 21,57,90,51,055 30,08,00,055
5 25- Kannada and Culture Capital Voted 2,25,00,000 2,92,39,817 67,39,817
Total 42,90,13,69,000 50,99,16,44,937 8,09,02,75,937
Significant excesses occurred during the year under the following heads of account;
Grant 3 – ‘2071’-Pension and Other Retirement Benefits – Civil – Superannuation and Retirement Allowances – Payment of Pensionary charges to other Governments under the State Re-organisation Act, 1956 (Rs.1.92 crore).
Grant 14 – ‘2245’ – Relief on account of Natural calamities – Calamity Relief – Transfer to Reserve funds and Deposit Account – Calamity Relief Fund – Centres’ share (Rs.444.85 crore)
‘4059’- Capital Outlay on Public Works – General – Construction (Rs.16.68 crore)
♣ The amount of excess required to be regularized for 2003-04 mentioned in Audit Report for the year 2004-05 was Rs.2,817.86 crore. However, on account of rectification of misclassification in Grant No.29, the excess requiring regularization decreased by Rs.6.50 crore. The amount of excess required to be regularized for 2004-05 was Rs.1,919.02 crore. However, due to proforma correction of figures in Grant No.24 under ‘2801- Energy’ on account of book adjustments relating to power subsidy for 2004-05 not shown in annual accounts 2004-05, excess requiring regularization increased by Rs.285.66 crore.
39
Audit Report (Civil) for the year ended 31 March 2006
Grant 18 – ‘3475’ – Other General Economic Services – Transfer to Reserve Funds/Deposit accounts- Transfer of cess to the Infrastructure Initiative Fund (Rs.481.23 crore).
Grant 24 – ‘2801’ – Power – General – Assistance to Electricity Boards- Karnataka Electricity Board (Rs.65.79 crore)
Grant 25 – ‘4202’ – Capital outlay on Education, Sports, Art & Culture – Art & Culture – Other Expenditure – Buildings (Rs.0.67 crore).
2.4.3 Persistent excesses
There were persistent excesses exceeding Rs.0.20 crore during last three years in four cases involving two grants (Appendix 2.6).
2.5 Original and supplementary budget provisions
Supplementary provision (Rs.4,364.79 crore) made during the year constituted 12 per cent of the original provision (Rs.37,163.38 crore) as against 10 per cent in the previous year. The overall saving of Rs.5.319.51 crore exceeded the supplementary provision by Rs.954.72 crore (22 per cent).
2.5.1 Unnecessary/insufficient/excessive supplementary provisions
Supplementary provision of Rs.328.56 crore made in 18 grants involving 55 detailed/object heads proved unnecessary in view of aggregate unutilised provision of Rs.482.34 crore (Appendix 2.7).
In 10 grants involving 16 detailed heads, supplementary provision of Rs.588.05 crore obtained proved insufficient leaving uncovered excess expenditure of Rs.150.18 crore (Appendix 2.8).
In 16 grants involving 38 detailed heads, as against additional requirement of Rs.444.35 crore, supplementary grant for Rs.575.78 crore was obtained resulting in unutilised provision of Rs.131.43 crore (Appendix 2.9).
2.5.2 Excessive/unnecessary re-appropriation of funds
A grant or appropriation for disbursements is distributed by sub-head or detailed head or object heads under which it is accounted for. The competent executive authorities can approve re-appropriation of funds between the primary units of appropriation within a grant or appropriation before the close of the financial year to which such grant or appropriation relates. Re-appropriation of funds should be made only when it is known or anticipated that the appropriation for the unit from which funds are to be transferred will not be utilised in full or will result in unspent provision in the unit of appropriation.
40

Chapter II - Allocative priorities and Appropriation
In 68 cases, re-appropriation of funds was made injudiciously resulting in provisions remaining un-utilised/excess over provision of more than Rs.0.25 crore in each case (Appendix 2.10). Of these:
- in 13 cases, additional funds of Rs.7.14 crore provided through re-appropriation proved insufficient as the final expenditure exceeded the provision by Rs.14.62 crore.
- in 11 cases, the unutilised provisions were not properly assessed as even after the withdrawal of Rs.62.55 crore through re-appropriation, Rs.326.86 crore remained unutilised.
- in 36 cases, additional funds of Rs.57.88 crore provided by re-appropriation resulted in unutilised provision of Rs.45.82 crore and the re-appropriation proved excessive.
- in eight cases, the withdrawal of Rs.19.65 crore through re-appropriation proved injudicious as the final expenditure exceeded the net provision by Rs.18.02 crore.
2.5.3 Unreconciled expenditure To enable departmental officers to exercise proper control over expenditure, there are standing instructions of Government that expenditure recorded in their books should be reconciled with those recorded in the books of the Accountant General (Accounts and Entitlement).
During 2005-06, out of 224 Chief Controlling Officers, 46 officers had not reconciled expenditure of Rs.14,508.36 crore (41 per cent of the expenditure of Rs.35,600.31 crore incurred by them), while one officer had reconciled his expenditure figures for a part of the year.
2.5.4 Errors in budgeting Errors in budget such as obtaining supplementary provisions under the grants other than to which the original provisions were made, including net amount as gross amount in the ‘Appropriation Act’, etc involving an amount of Rs.53.85 crore were noticed. Details are in Appendix 2.11.
2.6 Defective reappropriation During 2005-06, 159 re-appropriation orders involving an amount of Rs.420.19 crore were issued. Thirty one re-appropriation orders for Rs.126.74 crore were not considered in accounts as these were found either exceeding the power of sanction or involving items of new service or not signed by competent authority or not having prior approval of Finance Department. Illustrative cases are listed in (Appendix 2.12).
2.7 Rush of expenditure The financial rules require that expenditure should be evenly distributed throughout the year. The rush of expenditure particularly in the closing months of the financial year is regarded as a breach of financial rules. The position in respect of expenditure for the four quarters and also for the month
41

Audit Report (Civil) for the year ended 31 March 2006
of March 2006 as depicted in Appendix 2.13 shows that the expenditure incurred in March 2006 in 25 cases ranged between 21 and 100 per cent of the total expenditure during the year indicating tendency to utilise the budget at the close of the financial year.
2.8 New service/New instrument of service
Article 205 of the Constitution provides that expenditure on a ‘New Service’ not contemplated in the Annual Financial Statement (Budget) can be incurred only after its specific authorisation by the Legislature. The Government has issued orders based on recommendations of Public Accounts Committee laying down various criteria for determining items of ‘New Service/New Instrument of Service’. These, inter alia, stipulate that the expenditure over the grant/appropriation exceeding twice the provision or Rupees one crore, whichever is more, should be treated as an item of ‘New Service’.
In 12 cases involving 04 grants, expenditure totalling Rs.71.26 crore which should have been treated as ‘New Service/New Instrument of Service’ was met without the approval of the Legislature (Appendix 2.14).
2.9 Expenditure without budget provision
As envisaged in the Budget Manual, expenditure should not be incurred on a scheme/service without provision of funds therefor. It was, however, noticed that expenditure of Rs.11.18 crore was incurred without provision either in original or in supplementary demand in 31 cases involving 12 grants test-checked in audit (Appendix 2.15).
2.10 Contingency Fund
The Contingency Fund of the State has been established under the Contingency Fund Act, 1957 in terms of provisions of Article 267 (2) and 283 (2) of the Constitution of India. Advances from the fund are to be made only for meeting expenditure of an unforeseen and emergent character, postponement of which, till its authorization by the Legislature would be undesirable. The fund is in the nature of an imprest and its corpus is Rs.80 crore. During the year 2005-06, 25 sanctions aggregating to Rs.54.56 crore were issued. A review of the operation of the Contingency Fund disclosed the following: • Three sanctions involving an amount of Rs.2.78 crore accorded between
July’ 2005 and March’ 2006 were not acted upon. • In 10 cases, the actual amount drawn ranged between 13 and
81 per cent of the amount sanctioned. • An amount of Rs.13.33 crore pertaining to 12 sanctions was drawn from
Contingency fund after supplementary estimates for its recoupment to the fund were passed by the Legislature.
42

43
CHAPTER III
PERFORMANCE REVIEWS This Chapter presents six performance reviews. The performance reviews are on ‘Implementation of Project Tiger’, ‘Implementation of VAMBAY and SUDP by Karnataka Slum Clearance Board’, ‘Development and Maintenance of Major District Roads’, ‘Urban Water Supply Schemes’, ‘Sarva Shiksha Abhiyan’ and ‘Computerisation of Treasuries in Karnataka (Khajane). Besides, there is one long paragraph on ‘Working of Horticultural Farms’.
FOREST, ENVIRONMENT & ECOLOGY DEPARTMENT
3.1 Implementation of Project Tiger
Highlights
‘Project Tiger’ – a Centrally sponsored scheme is implemented in Karnataka in three Tiger Reserves viz. Bandipur National Park, Bhadra Wildlife Sanctuary and Rajiv Gandhi (Nagarahole) National Park for maintaining a sustainable tiger population in these reserves. The conservation and protection measures initiated by the Department in these reserves, however, remained by and large ineffective due to deficiencies in planning, inadequate release of funds, omissions to include potential tiger habitats in the Tiger Reserves and non-observance of scheme guidelines. The budget provision made by the State Government during 2001-06 was short by Rs.2.77 crore compared to that approved in Annual Plans of Operation. The funds were also short released (Rs.4.77 crore) during the period.
(Paragraph: 3.1.6.1) Conservation and protection measures in the Protected Areas of the three Tiger Reserves were not implemented in full due to deficiencies in formulating Management Plans and Annual Plan of Operations.
(Paragraph: 3.1.7) Non-demarcation and consolidation of Bhadra Wild Life Sanctuary declared as Tiger Reserve in March 1998, non-inclusion of potential tiger habitats in the reserve and irregular diversion of wildlife areas for non-forestry purposes adversely affected the conservation measures of the reserve.
(Paragraphs: 3.1.8.1 to 3.1.8.3)

Audit Report (Civil) for the year ended 31 March 2006
44
The estimation of tiger population in the State was not carried out regularly and on a scientific basis thereby not ensuring the reliability of the data.
(Paragraph: 3.1.10) The tourism activities in the three Tiger Reserves were not carried out in accordance with the laid down guidelines.
(Paragraph: 3.1.14) Shortage of frontline protection staff, lack of training in use of sophisticated fire arms and their supply and deficient communication network in the Protected Areas rendered the protection measures largely ineffective.
(Paragraph: 3.1.15)
3.1.1 Introduction
Tiger is one of the major predators in India which keeps the population of herbivores under control which in turn allows growth of vegetation thereby saving land from denudation. Its existence also helps in checking the impairment of the ecological conditions of a given area and maintaining the balance in nature. The animal has been on the brink of extinction since the middle of twentieth century due to shrinkage of its habitat, destruction of its prey animals and its poaching for skin and body parts.
Government of India (GOI) launched (April 1973) the scheme ‘Project Tiger’ to ensure the maintenance of a sustainable population of tiger in India and to preserve for all times such areas as part of our national heritage for the benefit, education and enjoyment of future generations. In Karnataka, the Project Tiger is implemented by the Forest Department in Bandipur Tiger Reserve (BTR) (1973), Bhadra Wildlife Sanctuary (BWLS) (1998) and Rajiv Gandhi (Nagarahole) National Park, (RGNNP) (2002).
3.1.2 Organisational set-up
The Principal Secretary, Forest, Environment and Ecology Department is the administrative head at the Government level. The Principal Chief Conservator of Forest (Wildlife), Bangalore {PCCF (WL)} who is also the designated Chief Wildlife Warden under the Wildlife (Protection) Act, 1972 is responsible for the implementation of the project. The PCCF (WL) is assisted by two Field Directors, Project Tiger (FDPTs) at Mysore and Chikmagalur and three Deputy Conservators of Forests (Wildlife) (DCFs), one for each of the above three1 Tiger Reserves (TRs). The DCFs are assisted by Assistant Conservators at sub-divisional level and Range Forest Officers at Range level.
1 DCF, Bhadra Wildlife Division-Chikmagalur, DCF, Project Tiger Division-Bandipur and
DCF, Wildlife Division, Hunsur

Chapter III – Performance reviews
45
3.1.3 Audit objectives
The main Audit Objectives were to assess whether:
availability of funds was adequate and financial management efficient and effective,
project formulation was effective for achieving maintenance of sustainable tiger population,
programme management was efficient and the various conservation and protection activities undertaken yielded the desired results,
adequate and trained manpower was available and utilised efficiently,
an efficient and adequate monitoring mechanism was in place.
3.1.4 Audit criteria
The performance of the project in the State was assessed with reference to:
National Wildlife Action Plan (NWAP);
Guidelines issued by the Wildlife Institute of India;
Forest (Conservation) Act, 1980;
Wildlife (Protection) Act, 1972 and
Codes and Manuals of the Forest Department.
3.1.5 Scope and methodology of audit
The implementation of the Project in all the three Tiger Reserves in the State for the period 2001-06 was reviewed in audit between January 2006 and July 2006 by test-checking the records of the three DCFs and the FDPTs besides reviewing the records of PCCF (WL).
The audit objectives and criteria were discussed in an entry conference with the Principal Secretary, Forest, Environment and Ecology Department and PCCF (WL) in January 2006.
The audit findings relating to Project formulation and its implementation were based on the examination of various documents, data/reports. The audit findings were communicated to the Government in September 2006 for their comments and were also discussed in the exit conference held on 13 November 2006.

Audit Report (Civil) for the year ended 31 March 2006
46
3.1.6 Audit findings
3.1.6.1 Financial management
‘Project Tiger’ is a Centrally sponsored scheme for which cent per cent Central assistance is given by Government of India for non-recurring items of work and 50 per cent for recurring items. The remaining 50 per cent funds for recurring items are borne by the State Government. The funds for the Project were to be released on the basis of the approved Annual Plan of Operations (APOs) by Government of India.
Funds required for the project are provided in State Budget. On approval of the budget, the departmental officers incur expenditure either by drawing bills on treasuries to meet administrative expenditure or by drawing cheques against Letter of Credit to meet scheme expenditure.
Funds required for the project as per the approved APOs, funds released by Central and State Governments and the expenditure incurred during the period 2001-06 was as follows:
Table 1: Details of funds required, released and expenditure (Rupees in crore)
Year
Funds required as per APO Budget
provision of the State Govt
Funds allotted/ released by Govt of India
Funds to be released by
Govt of Karnataka including
State Share (Col 3 + 5)
Funds actually
released by Govt of
Karnataka
Excess (+) / Shortfall (-) in
release of funds (Col 6 – 7)
Expenditure incurred
Central State
(1) (2) (3) (4) (5) (6) (7) (8) (9) 2001-02 1.91 0.91 2.84 1.87 2.78 2.65 (-) 0.13 2.55 2002-03 2.96 0.89 2.51 2.91 3.80 2.59 (-) 1.21 2.50 2003-04 3.28 1.16 5.66 2.66 3.82 4.06 (+) 0.24 3.91 2004-05 7.62 2.10 8.40 4.84 6.94 6.19 (-) 0.75 5.32 2005-06 4.97 2.95 6.57 4.97 7.92 5.80 (-) 2.12 5.69
Total 20.74 8.01 25.98 17.25 25.26 21.29 (-) 3.97 19.97
The budget provisions made by the State Government were short (Rs.2.77 crore) of the funds required to be provided as per approved APOs during the period 2001-06. The funds released by the State Government were also short of the budget provision (Rs.4.77 crore) during all the years 2001-06 except during 2002-03. This resulted in shortfall in release of funds to the Project Authorities to that extent. There was also delay (Appendix 3.1) in release of funds by the State Government to the implementing officers by more than 6 weeks to 22 weeks despite assurance given (May-July 2000) by the State Government in the meeting of Chief Secretaries that Central funds would be made available to the implementing officers within six weeks of receipt. The State Government also did not release its share to the extent of 50 per cent due to the projects.
There was also shortfall in incurring of expenditure vis-à-vis release made to the extent of Rs.1.32 crore during all the years from 2001-02 to 2005-06 reasons for which were not on record.
All the above mentioned factors adversely affected the implementation of the programme of works as indicated in Appendix 3.2.
Delay in submission of APOs to GOI and consequential delays in release of funds by the State Government coupled with inadequacy of funds affected adversely the implementation of the project

Chapter III – Performance reviews
47
3.1.6.2 Diversion of Protected Area Development Fund (PADF)
The National Wildlife Action Plan (NWAP) formulated by GOI provided for creation of a Local Trust Fund for each Protected Area/Tiger Reserve (PA/TR) to be funded from tourism receipts such as entry fees, safari fees, penalties, etc., collected in each PA/TR. Seventy per cent of the fund is to be appropriated for community benefit programmes and the remaining 30 per cent for the management and development of each PA. A separate PADF was required to be set up and administered for each PA/TR. The Government created (2002-03) only one consolidated PADF for the entire State. The reasons for the deviations were not on record.
The revenues generated from the PAs after credit to the State Revenue Account are transferred to the fund on quarterly basis. The Government allocated the revenue so accumulated to different National Parks (NPs)/Sanctuaries. It was, however, observed that against Rs.3.88 crore collected from the three TRs, only Rs.0.70 crore was allocated to the two TRs at BTR and RGNNP. No funds were allocated to BWLS. The balance amount of Rs.3.18 crore was allotted to other NPs/Sanctuaries of the State outside the project tiger areas. The allocated amount (Rs.0.70 crore) was spent by these TRs on repairs to quarters and purchase of vehicles which was not contemplated in the NWAP.
3.1.6.3 Diversion of Central assistance
Grant of Rs.7.75 lakh was provided to RGNNP during 2003-04 for the construction of quarters, anti-poaching camps, formation of anti-poaching patrolling tracks and census work under non-recurring items. In addition, Rs.6.54 lakh was provided under the recurring head for maintenance of roads and employment of tribal people for protection duties. The entire provision of Rs.14.29 lakh under these heads were, however, diverted towards payment of outstanding wages of anti-poaching watchers engaged on daily wage basis for the reason that no separate allocation of funds was provided for the same.
Programme management
3.1.7 Preparation of Management Plans
The ‘Project Tiger’, envisages management of TRs on sound principles of scientific conservation. This includes maintaining a ‘core area’ in each TR where there would be no biotic interference like forestry operations, collection of minor forest produce, bamboo extraction, grazing of domestic cattle and any human activities including tourism so as to maintain the area in as near natural conditions as possible. The area other than the ‘core area’ called the ‘buffer area’ is available for wildlife oriented forestry purposes.
The integrated development of a TR is achieved by undertaking all necessary conservation, protection and promotional measures through long term perspective plans called ‘management plans’ (MPs) which deal with all
Funds collected under PADF were diverted for purposes other than community benefit and development/ management of Protected Areas
Deficiencies in management plans and Annual Plan of operations of three Tiger Reserves hampered long term conservation and protection measures in Protected Areas

Audit Report (Civil) for the year ended 31 March 2006
48
existing programmes and description of future programmes required to achieve the area objectives over a period of 5 to 10 years. The management plan of every TR is to be executed in annual phases after drawing up APOs. The APOs are, therefore, an overall coordinated programme of the works under the scheme and the other works to be executed under the State Sector.
In BTR and BWLS, the MPs were formulated without providing for training requirements of the working staff, buffer zone development plan, degraded habitat restoration plan and tourism management plan. Likewise, MP of RGNNP did not contemplate the training plans and the tourism management plan.
The APOs of BTR did not provide for measures to meet the demand for fuel wood, grasslands for cattle, linkage of corridors and planting fruit bearing species despite envisaged in its MP. The APOs of BTR and BWLS did not contain any action plan to eradicate weeds despite the fact that depletion of fodder due to weeds was recognised by the Department in their MPs.
The sustainable population that could be maintained in each reserve had also not been spelt out by the Department. Wildlife Advisory Board under Wildlife Protection Act, 1972 to formulate the policy of protection and conservation of Wildlife was also not constituted as of March 2006.
3.1.8 Consolidation of Tiger Reserves
3.1.8.1 Survey and Demarcation
The Wildlife (Protection) Act, 1972 provides that as soon as the Government notifies the area of a TR, the boundaries thereof shall be demarcated and consolidated after conducting a proper survey.
The entire core and buffer zone area of 492.30 sq km of BWLS had not been demarcated and consolidated as of March 2006 despite issue of final notification declaring the areas as a reserve in March 1998. No proposal was made in this regard in any of the APOs. In the absence of consolidation of the boundaries, the TRs were exposed to encroachments and trespassing detrimental to the wildlife conservation. As of March 2006, 0.39 sq km was encroached upon by public in this TR during 1997-98 to 1998-99. In BTR 12.80 hectares of land had been encroached upon by 23 families. In RGNNP, 7.04 sq km was under occupation of the tribals, as assessed in 2000. The extent to which the occupation had extended after the year 2000 had not been assessed (March 2006).
Non-consolidation of the boundaries in two TRs exposed the tiger habitats to encroachments and trespassing

Chapter III – Performance reviews
49
3.1.8.2 Inclusion of potential tiger habitats in protected areas
An area of 67.80 acres of private land situated within the core area of BWLS was rich in wildlife. The fauna has to move across this area on their way to and from the back waters of the Bhadra Reservoir. The Deputy Conservator of Forests, Bhadravathi proposed (January 1990) to acquire the area for development of Bhadra Reserve Forest. The Deputy Commissioner, Chikmagalur District dropped (June 1991) the acquisition proceedings as the department failed to remit the required land compensation to the Revenue Department. No action was taken to acquire the land which was rich in wildlife and even after its surrounding areas had been declared (1998) as Wildlife Sanctuary.
3.1.8.3 Leasing/diversion of wildlife areas
Under the Wildlife (Protection) Act, 1972, any activity in a protected area which damages and deprives wildlife of its habitat is strictly prohibited. The core zone in a sanctuary is to remain undisturbed for providing uninterrupted habitation to wildlife. Contrary to this, an area of 68.15 sq km in the core zone of RGNNP was converted as Tourism Zone.
An area of 89.94 hectares in the Buffer Zone of BWLS had been leased out (1979) for 20 years to set up Kuvempu University after issue of preliminary notification (1974) under Wildlife Protection Act, 1972 for declaring the area as a sanctuary. The area was included as part of the Sanctuary while issuing final notification in March 1998. However, the lease was further extended (August 2002) beyond February 1999 with the approval of Indian Board for Wildlife on the condition that the leased area be excluded from the reserve and another contiguous area of 339 hectares of degraded forest land added to it in lieu thereof within 90 days. The leased area was, however, neither excluded from the reserve nor was any other contiguous area added to it. This defeated the spirit of approval of the Board.
3.1.8.4 Conservation of tigers outside the Tiger Reserves
As per 2001-02 census, 401 tigers were estimated to be living in the State, of which 182 lived in TRs. Of the 219 tigers living outside the three TRs, 140 tigers lived in the territorial forest areas while 79 tigers lived in Wildlife Sanctuaries and National Parks. The guidelines of the ‘Project Tiger’ Scheme provide for undertaking of conservation measures in populated tiger areas outside the TRs. These measures would include dedicating pockets of undisturbed areas for these tigers, retention of fodder and fruit species, allowing controlled grazing within the carrying capacity of the forests and protecting the tigers from poachers.
No conservation measures had been taken by the Department despite the vulnerability of these tigers to poaching and habitat degradation. In the territorial forests of Chikmagalur Circle, three cases of tiger poaching were reported (2002) indicating lack of protection measures by the Department.
Non-inclusion of potential tiger habitats in the Tiger Reserves and irregular diversion of wildlife areas for non-forestry purposes adversely affected conservation measures
Protection measures for tigers outside the Protected Area were lacking
Audit Report (Civil) for the year ended 31 March 2006
50
3.1.9 Habitat development and restoration of degraded habitat
3.1.9.1 Grassland management
In order to maintain availability of sufficient prey species such as deer, sambar, wild boars, etc., for the tigers inside the Reserves, adequate availability of fodder for these herbivores is essential. Therefore, grasslands were to be developed within the reserve areas of TRs so as to ensure availability of fodder to herbivores. The management plans of the TRs were to include plans for raising grasslands in the Reserves.
Review of Divisional records revealed that MPs of BTR and BWLS (2001-06) did not include comprehensive proposals for raising grasslands to avoid the incidences of wild animals straying into human habitation and consequential killing of cattle, humans, etc. In the three reserves, a compensation of Rs.88.25 lakh was paid towards crop damages, cattle and human deaths in 9,323 cases during 2001-06.
Weeds such as lantana and euphotorium suppress fodder growth which is necessary for the existence of herbivores. These weeds were growing abundantly in BTR and BWLS. Lack of action to remove the weeds was attributed (January/February 2006) by the Divisional Officers to paucity of funds. However, no proposals were made by the Department in their respective APOs so that funds for the purpose could be obtained.
3.1.9.2 Desilting of water bodies
The water bodies in the Reserves are required to be desilted at regular intervals so as to ensure adequate water availability to wildlife during summer. It was observed that out of 300 water bodies available in BWLS and BTR, only 94 were desilted during 2001-06 due to paucity of funds.
3.1.9.3 Wildlife corridors
Corridors in wildlife areas are not only vital for free movement of wild animals but also for gene flow which facilitates genetic diversity and population viability. BWLS has only one narrow corridor. The existing corridors to the adjoining Kakanahosudi and Aldhara forests got blocked due to execution of irrigation projects and other human activities. No proposals had been mooted by the Department for widening the corridor or opening a new corridor. Deputy Conservator of Forests (BWLS) in reply stated (January 2006) that the matter of providing of corridor through the two forest areas would be examined. Absence of proper corridors would adversely affect conservation attempts made for the wild animals.
Measures to grow fodder crops for herbivores were not initiated for sustaining prey species
Absence of wildlife corridors adversely affected the conservation of tigers

Chapter III – Performance reviews
51
3.1.10 Estimation of tiger population
GOI issued (1997-2002) several guidelines for carrying out tiger estimation on an annual basis by involving, inter alia, retired Wildlife Wardens and experts from reputed institutions like Wildlife Institute of India, Indian Institute of Science, etc. Data was also to be compiled by the Forest Guard in his area on a daily basis by recording observations of tiger sightings, pugmarks, animal droppings, tiger-kills, etc. It would also include determining the sex ratio and age of the tigers. The quarterly/half-yearly/yearly reports on the data so generated were to be submitted to GOI.
Records revealed that no action was taken by the project authorities to compile the data on regular basis as per the GOI guidelines. Since 1997, the estimation was made on three2 occasions and the one in 2006 had partly been completed as of July 2006. The estimation of tiger population was done by using only pug mark method. The population of tigers as per these estimations conducted at BWLS, BTR and RGNNP during 1997, 1999 and 2001 was as under:
Table 2: Population of tigers
Name of the TR
1997 1999 2001
Male Female Cubs Total Male Female Cubs Total Male Female Cubs Total
BWLS 13 13 5 31 17 14 9 40 Not done
BTR 24 46 5 75 24 48 7 79 26 46 10 82
RGNNP Not done NA NA NA 55 NA NA NA 55 to 60
It would be seen that in RGNNP neither sex ratio of tigers nor number of cubs was determined during any of the estimations. The estimation for 2001 was not based on compiled data of direct tiger sightings, observation of animal droppings, tiger-kills, etc. The estimation was also made without involving experts from reputed institutions like Wildlife Institute of India, Indian Institute of Science, etc. Thus, the estimation of the number of tigers by the Department, by counting pug marks was not foolproof.
Estimation of herbivore population (prey species) in the TRs had also not been done in BTR since 1996-97, in BWLS since 2000-01 and in RGNNP since 2002-03. Consequently, the adequacy of prey-predator ratio which had a bearing on food chain in these TRs was not assessed.
3.1.11 Protection measures
To save the tigers from poaching, forest fires, communicable diseases and accidents on highways passing through TRs, the ‘Project Tiger’ envisaged setting up anti-poaching camps, undertaking of immunisation programmes, training of frontline staff in anti-poaching and fire fighting techniques, equipping the staff with arms and ammunitions, fire protection measures and constructing speed barriers and displaying sign boards on highways besides creating awareness about wildlife conservation.
2 In 1997, 1999, 2001
The estimation of tiger population in the State was not carried out regularly and on a scientific basis
Anti-poaching camps were not set up according to vulnerability of areas to forest offence cases

Audit Report (Civil) for the year ended 31 March 2006
52
3.1.11.1 Poaching of Tigers and Anti-poaching Camps
Tigers are often poached for their skin, bone and other body parts which fetch lucrative prices in global markets. In RGNNP, a case of laying metal traps for poaching tigers was booked (May 2002) by the Department on the basis of incident reported by the tourists. In BTR, a tiger aged six to seven years was poached (August 2004) in Gundre Range but the Department did not investigate the case treating it as a case of natural death although the post mortem report revealed evidence of inflicted injuries and absence of nails. In another case, forest cell of Crimes Investigation Division of Police Department, Bangalore seized (December 2005) four tiger skins in the vicinity of BTR and RGNNP. Despite occurrences of such poaching, no case of tiger poaching was recorded by the Department in these TRs indicating slackness in protection measures.
To prevent poaching, the project envisaged setting up of anti-poaching camps (APCs). Each camp was to cover a minimum area of 25 to 30 sq km. As against 67 camps3 to be set up, 81 APCs existed (March 2006) in the three reserves of BTR, BWLS and RGNNP.
Records revealed that APCs in many cases were not set up on the basis of vulnerability of the area to forest offences. In BTR, only five camps were set up in Maddur Range which registered 327 forest offence cases (FOCs) during 2001-06 while five camps were set up at AM Gudi Range, which registered only six FOCs. In RGNNP, Antharasanthe range which registered 298 FOCs during 2001-06 had only three APCs while Kallahalla Range which had 82 FOCs during 2001-06 had four APCs.
Similarly, there were wide discrepancies in deployment of frontline staff at beats in the protected areas. In BTR, two Ranges with an area of 6,125 hectare and 6,100 hectare respectively had 11 beats each, while one Range with an area of 12,050 hectares had only nine beats. In RGNNP, while one Range with an area of 5,039 hectares had 12 beats, another Range with an area of 13,647 hectares also had the same number of beats. In another Range of BTR (Maddur) near the State border where 327 FOCs had been booked during 2000-06, only 13 beats had been set up while 12 beats had been set up for AM Gudi Range which was less vulnerable with only six FOCs booked during 2002-06.
Setting up of APCs not in accordance with vulnerability of forest areas adversely affected anti-poaching activities.
3.1.11.2 Immunisation programme
Regular immunisation of the village cattle around the Reserve is required to prevent spread of communicable diseases from domestic cattle to wild animals. The details of immunisation programme carried out around BTR and BWLS during 2001-06 were not available except for 0.23 lakh out of three lakh cattle in BTR and 0.06 lakh out of 0.40 lakh cattle in BWLS carried
3 At the rate of one camp for every 30 sq km
Chapter III – Performance reviews
53
during 2005-06. The divisional officers stated that the shortfall was due to funds constraint. Shortfall in immunisation of cattle around the tiger reserves would render the wild animals vulnerable to communicable diseases.
3.1.11.3 Fire Protection measures
During the period 2001-06, forest area of 123.96 sq km was destroyed in fire in the three reserves of BTR, BWLS and RGNNP. The Project authorities tackle the forest fires by keeping and maintaining a network (4,624 kms) of fire-lines. Besides, fire watchers are deployed for preventing/controlling fires.
The Ministry of Environment and Forest (MOEF) issued (June 2000) guidelines for prevention and control of forest fires which, inter alia, would include identification and mapping of fire prone forest areas for creating a data base on forest fires and analysing their occurrence and assessing the fire damages and submission of proposal to them for releasing grants. The MOEF also suggested appointment of a ‘Fire Warden’ and constitution of a ‘Crisis Group’ at Circle and Divisional level so as to closely monitor and coordinate various preventive measures.
The Project authorities, however, had not taken action to comply with these guidelines so as to equip themselves with preventive measures and prevent forest fires. Consequently, effective fire protection measures were not in place.
3.1.12 Communication network
Communication is important for protecting forests from fire, poaching, timber felling, grazing, encroachments and other illegal activities.
3.1.12.1 Roads, vehicles and wireless sets
There was a total road network of 1,970 kms in the three TRs of which only 497 kms (BTR), 444 kms (RGNNP) and 141 kms (BWLS) were maintained annually by the Department during 2001-06. The roads were not all weather roads and their condition was poor. Sixty vehicles were available for patrolling the protected areas and for tourism. Out of 46 vehicles in BTR and RGNNP, 38 vehicles were 5 to 22 year old. In BTR, absence of roads for patrolling along the sensitive border of Karnataka-Kerala States rendered tigers vulnerable to poaching. In 2002-03, six cases of elephant poaching were reported in that area. Also in BWLS, one Range was totally cut off from the rest of the Reserve due to collapse of a bridge which had not been reconstructed for want of funds. In this Range alone (2001-06) 197 FOCs were registered which were more than 50 per cent of the total number of FOCs (346) booked in the Reserve during that period.
Against the requirement of 34 static and 24 mobile wireless sets and 188 walky-talky sets at RGNNP, only 19, 18 and 108 respectively were available. In BTR, against the requirement of 97 walky-talky sets, only 88 sets were available. The poor maintenance of the roads together with the fleet of old
Patrolling of reserves was ineffective due to poor maintenance of roads and fleet of old vehicles

Audit Report (Civil) for the year ended 31 March 2006
54
vehicles and shortage in communication equipment affected effective patrolling of the reserves.
3.1.13 Forest offence cases
As of March 2006, 1,208 FOCs in three TRs were pending finalisation of which 213 cases were more than four year old. The cases required adjudication by courts (294 cases) and disposal by Department (914 cases). National Wildlife Action Plan required the States to set up designated courts for speedy trial of wildlife and forest related offences. However, the State had not set up any designated court to try forest offences so far (October 2006).
3.1.14 Promotional activities in Tiger Reserve
Regulated, low impact tourism has the potential to act as a vital tool for gaining support for wildlife conservation. The objective of wildlife tourism is to inculcate the importance of wildlife amongst the visitors, develop empathy for nature, both animate and inanimate and provide a communion with nature, rather than to merely ensure sighting of animal species. Eco-tourism was to primarily benefit local communities in the form of generation of employment.
The GOI evolved (1998) Revised Guidelines for Wildlife Tourism in Protected Areas including TR. Records revealed that the guidelines for waste disposal and water and energy consumption were not issued in any of the three reserves. Tourist guides for briefing the tourists about the forest and wildlife were also not provided in any of the reserves. The tourist carrying capacity and vehicle carrying capacity in one (BWLS) of the three reserves had not been prescribed. The Dos and Don’ts to regulate the activities of visitors at BWLS were also not prescribed.
Thus the promotion of wildlife tourism in these TRs was not carried out as envisaged in the guidelines.
3.1.15 Human Resource Management
The position of sanctioned posts, working strength and vacant posts of the frontline staff such as Foresters, Forest Guards and Forest Watchers in the three TRs as of March 2006 was as follows:
Table 3: Details of sanctioned/working strength and vacant posts
Name of the Reserve
No. of Posts sanctioned No. of Posts filled up No. of Posts lying vacant
Forester Forest guard Watchers Forester Forest
guard Watchers Forester Forest guard Watchers
BTR 24 101 27 11 34 25 13 67 2
BWLS 17 39 7 13 32 5 4 7 2
RGNNP 39 120 40 16 55 32 23 65 8
Total 80 260 74 40 121 62 40 139 12
Activities for regulation of wildlife tourism were lacking
No action was taken to train the frontline staff in wildlife management and engage regular protection staff in TRs

Chapter III – Performance reviews
55
The frontline staff of Foresters and Forest Guards was short of sanctioned strength by 50 and 53 per cent respectively. Records also revealed that nearly 64 per cent of the Foresters and 31 per cent of forest guards in the three TRs were aged above 50 years against the average age of 18-35 years recommended by Wild Life Institute of India. Thus, old age of front line staff coupled with lack of training and non-supply of arms adversely affected the wildlife protection.
To overcome the shortage of frontline staff for wildlife protection work, each TR engaged on an average 104 persons every year during the period 2001-06 on daily wage basis. However, no action was taken to engage regular protection staff and train the front-line staff in wildlife management in the TRs.
3.1.15.1 Training of field staff
Government of India guidelines envisaged equipping the staff with sophisticated weapons including automatic and semi-automatic weapons and equipments after proper training. It was agreed during the meeting of Chief Secretaries with the MOEF, GOI (May-July 2000) that wherever necessary, training of forest staff would be organised through the State Police Department. In pursuance of this, the Project Directorate of GOI also directed (November 2000) the Chief Wildlife Wardens to organise the protection staff into viable units to ensure effective use and safe custody of sophisticated arms to be supplied by the Project Directorate.
It was observed that the frontline forest staff numbering161 were not trained in the use of sophisticated fire arms or in skills required to combat armed and mobile offenders. Semi-automatic and automatic weapons were not procured for any of the three TRs during 2001-06 for want of clearance from Ministry of Home, GOI as the viable units were not set up by the Department. Eighteen available slide action guns were issued to the three reserves (six each). However, only nine persons had been trained in their use. Lack of training and weapons left the wildlife staff ill equipped in combating poaching and other forest offences. The forest offence cases booked in the three reserves during 2001-06 were 2,305 involving an amount of Rs.40.06 lakh4 towards illegal felling of sandal wood, timber, etc.
3.1.16 Monitoring
The project guidelines stipulated preparation of monthly, quarterly, half-yearly and annual reports on physical and financial progress of works for submission to PCCF/Project Director. Further, the guidelines envisaged submission of monthly monitoring and mortality reports of tigers, annual reports on estimation of tigers, bi-annual tiger mortality and seizure reports.
4 Excludes the value of 310 cases booked in BWLS but not assessed and the value of 66 cases
booked during 2005-06 at BTR and RGNNP but not assessed
Frontline staff were not trained and provided with sophisticated weapons

Audit Report (Civil) for the year ended 31 March 2006
56
Test-check of divisional records, however, revealed that except for quarterly and annual expenditure reports, no other reports had been submitted during the period from 2001-02 to 2004-05. As a result, the implementation of programme was not monitored closely during 2001-05.
3.1.17 Conclusion
Conservation and protection measures undertaken in the three tiger reserves, for maintaining a sustainable tiger population in them, were not effective to a large extent due to deficiencies in preparing appropriate management plans, shortages in allotment and release of funds and delay in their release. The conservation measures were adversely affected due to delay in consolidation of boundaries, non-eviction of encroachers and relocation of local population in TRs, non-inclusion of potential tiger habitats and irregular diversion of wildlife areas for non-forestry purposes. The protection measures were deficient due to shortage of frontline protection staff, non-supply of sophisticated fire arms and training in their use and insufficient communication net work.
3.1.18 Recommendations
Budget allocations should be made as per approved Annual Plans of operation and released in full and in time to the Implementing Officers.
Comprehensive Management Plans need to be drawn up for each reserve covering all areas of conservation and protection which should be followed by time bound Annual Plans of operation. These plans should also provide a measure for achievement of targets against efforts made.
Demarcation and consolidation of boundaries need to be completed in all cases including all potential tiger habitats in the reserves without diverting any wildlife areas for non-forestry purposes.
Firm action need to be taken to evict encroachers and relocate the local/tribal population in the TRs.
Estimation of tiger population should be carried out on a regular and scientific basis.
Action should be initiated for engaging wildlife protection staff and train them in the use of sophisticated fire arms.
Deficiencies in communication net work need to be removed for effective protection of the protected areas.
3.1.19 The above points were referred to Government in May 2006; reply had not been received (October 2006).

Chapter III – Performance reviews
57
HOUSING DEPARTMENT
3.2 Implementation of VAMBAY and SUDP by Karnataka Slum Clearance Board
Highlights
The Valmiki Ambedkar Awas Yojana (VAMBAY), a Centrally sponsored scheme was introduced in the State in August 2001 with the aim of providing shelter or upgrading existing shelter in the slum areas. The State Government had earlier (January 2001) introduced Slum Upgradation and Development Programme providing common infrastructure facilities in these areas. Review of these schemes disclosed that houses were constructed in non-declared areas and on private land. The process of transfer of title of the houses to the beneficiaries was very low. Under SUDP, works undertaken in four cities scheduled for completion in one year were incomplete even 14 to 25 months after the due dates as all of them were entrusted to a single contractor.
Out of 26,053 houses to be constructed under VAMBAY during 2002-03 to 2005-06, 25,841 had been completed and 25,132 houses allotted to beneficiaries. However, conferment of title to the beneficiaries was completed only in respect of 96 houses. In respect of 2,881 houses constructed at a cost of Rs.13.10 crore in non-declared slums or on private lands transfer of title could not be effected.
(Paragraphs: 3.2.6.1 to 3.2.6.3)
Despite spending Rs.74.70 lakh (98 per cent of the estimated cost) during 2004-05 on a model slum under VAMBAY, the houses constructed had not been allotted even as of June 2006 thereby failing to serve as a demonstration unit.
(Paragraph: 3.2.6.4)
The Board had not recovered initial deposit of Rs.4.37 crore from VAMBAY beneficiaries as of June 2006. Control mechanism for monitoring recovery of dues from the beneficiaries was not in place.
(Paragraph: 3.2.6.5) Irregular expenditure of Rs.13.82 crore was incurred under SUDP during 2002-03 to 2005-06 on maintenance of assets in areas handed over to local bodies.
(Paragraph: 3.2.7.5) The Board had not raised demands for Rs.13.24 crore from SUDP beneficiaries on the on-site works undertaken in eight cities.
(Paragraph: 3.2.7.6)
Valmiki Ambedkar Awas Yojana Slum Upgradation and Development Programme

Audit Report (Civil) for the year ended 31 March 2006
58
3.2.1 Introduction
With the objective of improving and clearing slums in the State, the Karnataka Slum Areas (Improvement and Clearance) Act, 1973 (Act) came into force in 1974. The Act provides for removal of unhygienic and insanitary conditions prevailing in the slums, better accommodation and improved living conditions for slum dwellers, promotion of public health generally and acquisition of land for the purpose of improving, developing or re-developing slum areas, clearance of slums and rehabilitation of slum dwellers. These schemes were implemented by the Karnataka Slum Clearance Board (Board). The Government sanctioned (January 2001) Slum Upgradation and Development Programme (SUDP) for providing common infrastructure in the slum areas. Subsequently, Valmiki Ambedkar Awas Yojana (VAMBAY) a Centrally sponsored scheme was also launched in the State in August 2001 for providing shelter or upgrading shelter in these areas. As of March 2005, 1,954 slum areas had been declared under the Act. These included 560 slums on lands belonging to private persons.
3.2.2 Organisational set-up
The slum clearance and upgradation schemes were executed through the Karnataka Slum Clearance Board constituted by the State Government. The overall administrative control of the Board vests in the Principal Secretary to Government, Housing Department. The Commissioner of the Board is the Chief Executive Officer. Field work is carried out through five Divisions and 14 Sub-divisions headed by the Executive Engineers (EE)/Assistant Executive Engineers (AEE) respectively.
3.2.3 Audit objectives
The main objectives were to ascertain whether: the implementation of VAMBAY and SUDP was in accordance with their
guidelines;
houses constructed under VAMBAY were allotted as targeted and their titles transferred to the beneficiaries;
mechanism for recovery of dues from the beneficiaries was effective;
infrastructure works undertaken under SUDP were executed efficiently and effectively;
quality control mechanism for execution of infrastructure works was effective; and
mechanism for maintenance of assets was in place and effective.
Chapter III – Performance reviews
59
3.2.4 Audit criteria
The audit criteria were:
The Karnataka Slum Areas (Improvement and Clearance) Act, 1973 and the Rules framed thereunder in 1975.
Guidelines for the schemes and orders issued by Central/State Governments from time to time.
The Karnataka Transparency in Public Procurement (KTPP) Act, 1999.
Specification laid down for quality control by the Ministry of Surface Transport (MOST) for road works.
3.2.5 Scope and methodology of audit
Implementation of VAMBAY and SUDP during the period 2000-01 to 2005-06 was reviewed in audit during March-July 2006 by test-check of records of the Housing Secretariat, Board’s head office at Bangalore, three out of five Divisions and six out of 14 Sub-divisions selected by multi-stage stratified sampling method, covering 54 per cent of the total expenditure of Rs.323.36 crore.
The audit objectives and the methodology adopted for the review were discussed with the Board in the Entry Conference held in March 2006. During the course of the Review, memoranda containing audit observations based on examination of records were issued to the Board and the Divisions. The audit findings were also communicated to the Board/Government for their remarks and also discussed with the Principal Secretary to Government, Housing Department and the Commissioner of the Board during the Exit Conference held in October 2006.
Audit findings
3.2.6 Implementation of VAMBAY
The Centrally sponsored scheme, VAMBAY was launched in August 2001 with the objective of providing shelter or upgrading the existing shelter. The scheme is funded by 50 per cent Central subsidy released through the Housing & Urban Development Corporation (HUDCO) and 50 per cent by loan from HUDCO on State Government guarantee.
The scheme was implemented in three phases for which the State Government accorded administrative approval in February 2002 (Phase I) and March 2003
Bangalore, Gulbarga and Hubli-Dharwad Bangalore (No.1 & No.2), Belgaum, Bellary, Dharwad and Gulbarga

Audit Report (Civil) for the year ended 31 March 2006
60
(Phases II and III). The cost of each house was to be limited to Rs.60,000 in Bangalore and Rs.40,000 in other places.
3.2.6.1 Physical and financial progress of construction of houses
The details of funds provided and expenditure incurred during 2002-03 to 2005-06 as also target and achievement of construction of houses under the three phases as of March 2006 were as follows:
Table 1: Physical and financial progress
Year of sanction
Central subsidy
Loan from HUDCO Total Expenditure Target Achievement
(Rs. in crore) (Number of houses)
Phase I 2002-03 23.25 23.25 46.50 46.49 10,312 10,312 Phase II 2002-03 10.98 10.98 21.96 21.94 5,000 4,788 Phase III (1st half)
2002-03 13.52 13.52 27.04 27.04 6,461 6,461
Phase III (2nd half)
2002-03 6.76 6.76 13.52 13.52 3,280 3,280
Bagalkot 2002-03 2.00 2.00 4.00 4.00 1,000 1,000 Total 56.51 56.51 113.02 112.99 26,053 25,841
The number of houses constructed in 53 slums ranged between 1 to 9 covering only 3 to 30 per cent of the families living in those slums. In 12 slums, only one house was constructed in each phase. Thus, in these slums the effect of improvement as a consequence of implementation of the scheme was negligible.
3.2.6.2 Allotment of houses and conferring title
According to the scheme guidelines, beneficiaries were to be identified before commencement of construction of houses. Out of 25,841 houses constructed under the scheme under Phases I to III, 25,132 had been allotted. The remaining 705 houses were yet to be allotted (June 2006). Thus, expenditure of Rs.3.87 crore incurred on their construction remained unfruitful.
The scheme envisaged conferment of title of houses on the beneficiaries. It was, however, noticed that the process of completion of conferment of title was very slow as documentation (including registration) had been completed only in 96 out of 25,132 houses allotted (March 2006).
3.2.6.3 Execution of works in non-declared slums and slums on private land
The Act envisaged declaration of slum areas which are likely to be a source of danger to health, safety or convenience of the public on account of being low lying, insanitary, squalid, overcrowded or otherwise. Similarly, the buildings in any area used for human habitation and unfit for that purpose by being detrimental to safety, health or morals were also to be so declared. The Act also envisaged declaration of any slum area to be a slum clearance area (that
Conferment of title in favour of beneficiaries was slow as registration had been completed in only 96 out of 25,132 houses allotted
Expenditure of Rs.13.10 crore incurred on slums in non-declared/ private land was irregular

Chapter III – Performance reviews
61
is, an area to be cleared of all buildings) on being satisfied that the most satisfactory method of dealing with the conditions in the area is by clearance of such area. The Act further envisaged acquisition of any land within, adjoining or surrounding any slum area. However, according to scheme guidelines, no expenditure for land acquisition is permissible from VAMBAY funds.
It was noticed that during 2002-03 to 2005-06, 2,881 houses were constructed in 69 slums which were yet to be declared as slum areas (nine) or slum clearance areas (46) or for which acquisition proceedings were incomplete (14), as only preliminary notification calling upon owners or interested persons to show cause against such move had been issued. The expenditure of Rs.13.10 crore incurred on these houses was, therefore, irregular. The title to the house could not also be conferred on the beneficiaries, while giving possession. The execution of works on private land was also open to the risk of disputes and/or intervention by courts, etc. and consequential delay in completion.
3.2.6.4 Setting up of a model slum
The scheme envisaged, as a demonstration project, setting up of at least one model slum to be emulated by all other cities and towns in the State. For this purpose, the Board entrusted (June 2004) the work of construction of 127 houses at Laxminagar slum at Laggere in Bangalore city to Building Materials Technology Promotion Council at Rs.76.20 lakh at the unit cost of Rs.60,000. The work was stipulated to be completed within six months.
In spite of spending Rs.74.70 lakh (98 per cent) till March 2005, the houses had not been allotted (June 2006) pending Government clearance and thus, it failed to serve as a demonstration unit.
3.2.6.5 Arrears in recovery of cost of houses
According to the scheme guidelines, 50 per cent of cost of houses is required to be recovered from the beneficiaries as initial deposit (Rs.5,000) and the remaining amount (Rs.25,000/Rs.15,000) in equated monthly instalments (EMI). Since the State Government provided funds for repayment of loans borrowed from HUDCO for construction of the houses, the amounts of initial deposit and EMI recovered were to be credited to Government.
Though the Sub-divisions had maintained the Demand, Collection and Balance (DCB) registers, the Board did not have the position for the State as a whole for each year. However, according to the details of demand of initial deposits, collections and remittance to Government furnished by the Board, as of June 2006, out of Rs.13.02 crore due for the 26,053 houses taken up, the collection amounted to Rs.8.65 crore, leaving Rs.4.37 crore unrecovered. Details of realisation of EMI and its remittance to Government were not furnished. A Government of India assisted body
Model slum failed to serve as a demonstration unit as houses constructed after spending Rs.74.70 lakh (98 per cent) remained unallotted
Initial deposit of Rs.4.37 crore remained to be recovered from beneficiaries

Audit Report (Civil) for the year ended 31 March 2006
62
Thus, the maintenance of records of dues was incomplete affecting the monitoring of recoveries. The Board did not furnish reasons for non-maintenance of records but stated (October 2006) that a DCB Cell had been constituted (February 2006) to monitor the maintenance of records.
3.2.6.6 Implementation of Nirmal Bharat Abhiyan
The VAMBAY Scheme provided for a component of infrastructure development titled Nirmal Bharat Abhiyan (NBA) under which construction of community toilet complexes was to be undertaken as a basic amenity in congested metropolitan cities. The estimated cost for a 10 seat toilet complex was Rs.4 lakh at Rs.40,000 per seat. The Board constructed 588 toilet complexes of 10 seat capacity during 2002-03 to 2004-05 at a cost of Rs.23.52 crore.
The State Government exempted the works from the application of KTPP Act and the works were to be executed departmentally. The Board, however, got 19 toilet complexes with 190 seats constructed through three agencies at a cost of Rs.76 lakh. The Board did not furnish reasons for not undertaking these works departmentally.
Maintenance of 310 complexes was entrusted to Non-Governmental Organisations/other agencies on tender basis. As against Rs.39.81 lakh due from these agencies, the Board received only Rs.5.04 lakh leaving Rs.34.77 lakh unrecovered as of June 2006. Maintenance of the remaining 278 toilet complexes had not been arranged even one year after completion exposing the users to the health hazards.
3.2.6.7 Monitoring
According to the scheme guidelines, the State Government was to set up monitoring and coordination committees at the State/District/Municipal levels. The State Government constituted (October 2004) a State Level Coordination Committee (SLCC) with a Chairman and four members to look into the aspects of progress of implementation, quality of construction, transparency and speedy implementation, undertake site visits to submit feedback, follow-up action with implementing agencies and recommend changes/modifications in the scheme. SLCC was to meet as frequently as necessary to facilitate meaningful monitoring of the scheme.
SLCC held its only meeting in February 2005 and its proceedings containing several decisions/recommendations were circulated in March 2005.
Principal Secretary to Government, Housing Department Commissioner of the Board, an official from the Ministry of Urban Development and
Poverty Alleviation, and two non-officials
Maintenance for 278 toilet complexes had not been arranged

Chapter III – Performance reviews
63
3.2.7 Implementation of SUDP
The State Government sanctioned (January 2001) a Slum Upgradation and Development Programme (SUDP) to be implemented in 21 cities excluding Bangalore at a cost of Rs.274.02 crore for providing common infrastructure facilities. Of this, 80 per cent was to be met from loan provided by HUDCO on Government guarantee and the balance 20 per cent by way of subsidy from State Government over a period of four years. In Phase I, 260 slums were to be covered under the scheme at an estimated cost of Rs.65.05 crore. The works envisaged to be taken up included on-site improvement, components of community water supply, community toilets, road improvements, surface water drains, underground drainages and street lights.
During the years 2002-03 to 2005-06, the Board received funds of Rs.67.95 crore and incurred expenditure of Rs.63.98 crore, leaving Rs.3.97 crore unspent.
3.2.7.1 Selection of contractors for execution of works
For the purpose of selection of contractors for execution of works, the Board short listed (March 2002) 37 contractors. The Board invited (May 2002) item rate tenders from pre-qualified contractors for execution of works in nine cities. Among the offers received, the lowest offer was from ‘G’ for works in three cities (Bidar in category-I and Bellary and Gulbarga in category-II). The terms of the notification provided that the contractor was free to quote for all the works but he would be awarded only one work in each category. ‘G’ was awarded (December 2002) the contracts for Bidar and Gulbarga cities. The contractor was allotted the works in Bellary also as another contractor ‘P’ did not agree to execute the works at the lowest offered rate of 4.45 per cent offered by ‘G’. The works at Bellary were entrusted (March 2003) to ‘G’ at the negotiated rates at 4.41 per cent above the estimated cost.
In December 2002, the Board invited item rate tenders for execution of works in the remaining 12 cities. Among the offers received, ‘G’s offer for Hospet was the lowest, and was accordingly awarded (May 2003). Thus, ‘G’ was the contractor for works in four cities with dates of commencement between February 2003 and August 2003. The time allowed was 12 months in each case and the works were due for completion between January and August 2004. A review of the progress of works showed that the contractor had not completed any of the works in the four cities even after grant of extension of time up to November 2004 for two works as detailed below:
Loan from HUDCO: Rs.54.45 crore; Subsidy from State Government: Rs.13.50 crore
Selection of a single contractor for four cities due to improper evaluation of capacity caused delay in completion of works

Audit Report (Civil) for the year ended 31 March 2006
64
Table 2: Delay in completion of works (Rupees in crore)
Name of the city
Estimated cost of work
Amount put to tender
Date of commencement
Due date of
completion
Expenditure up to March
2006
Delay (months)
Gulbarga 6.51 6.09 01.02.2003 31.01.2004 4.29 25
Bidar 2.77 2.70 05.02.2003 04.02.2004 2.14 25
Bellary 5.59 5.31 04.05.2003 03.05.2004 4.72 22
Hospet 4.94 5.51 03.08.2003 02.08.2004 5.31 19
Audit scrutiny revealed that though the contractor fulfilled all the criteria prescribed for determining eligibility when works were separately considered, he did not satisfy them when works were considered cumulatively as under:
Table 3: Eligibility criteria for the works
(Rupees in crore)
Eligibility criteria
Category of bids Eligibility required
(Cumulative) G’s eligibility Remarks Up to
Rs.5 crore
Above Rs.5 crore but
below Rs.7 crore
Pre-qualification required during the last five years viz., (1996-97,1997-98, 1998-99, 1999-2000 & 2000-01) was the minimum annual turnover in civil engineering works at least of one financial year.
2.00 3.00 8.00
1996-97 - 10.50 1997-98 - 11.16 1998-99 - 4.99 1999-00 - 8.50 2000-01- 9.13
Did not qualify during the year 1998-99
Liquid assets and/ or availability of credit facility during last 3 years i.e., from 1998-99, 1999-2000 and 2000-01.
1.00 1.50 4.00 1998-99 - 2.99 1999-00 - 1.66 2000-01 - 4.16
Did not satisfy the condition during 1998-99 and 1999-2000.
Company’s Net Worth during last three years i.e., 1998-99, 1999-2000 and 2000-01
1.00 1.50 4.00 1998-99 - 0.29 1999-00 - 1.19 2000-01 - 5.24
Did not satisfy the conditions during 1998-99 and 1999-2000.
Further, the tender document required that the contractor must mobilise enough manpower and machinery to start works in several slums simultaneously. There was no evidence on record to show that the capacity of the contractor to tackle works simultaneously in all the four cities was evaluated and found to be adequate.
Thus, entrustment of works in more than one city to the same contractor resulted in non-completion of works and delayed the provision of intended infrastructure to the slum dwellers.
Chapter III – Performance reviews
65
The Board stated (October 2006) that it sought relaxation of retendering with a view to saving precious time and expenditure. It also stated that it had assessed net delay in completion of works for each city after excluding time taken for approval of extra items and modifications and that prescribed penalty would be imposed and recovered from the contractor’s bill. Thus, the Board’s reliance on a single contractor for execution of works in the four cities at a time was not justified and postponed the availability of infrastructure.
3.2.7.2 Non-obtaining/retention of bank guarantees
The tender conditions of successful contractors entrusted with execution of SUDP works stipulated furnishing of unconditional bank guarantees covering two per cent of the tendered amount.
For the 21 cities where SUDP works of Phase-I were entrusted to 21 contractors at tendered cost of Rs.68.21 crore between February 2003 and September 2003, the Board was required to obtain bank guarantees for Rs.1.36 crore. It was, however, noticed that it received bank guarantees for Rs.1.22 crore from only 18 contractors. Of these, confirmation from the concerned banks was obtained in respect of only three cases. The Board stated (October 2006) that necessary action was being initiated against the officials responsible for the lapse.
According to the contracts, the bank guarantees were to be released after payment of final bills or after completion of defect liability period (DLP) whichever was later. It was, however, noticed that bank guarantees in respect of eight contractors were not renewed after expiry of their validity period (December 2003 to June 2005) though works were yet to be completed (three cases) or DLP had not expired (five cases).
3.2.7.3 Deficiencies in execution of works
Out of works in 260 slums of 21 cities, execution was not taken up in 12 slums of nine cities (estimated cost: Rs.1.31 crore) due to non-completion of land acquisition proceedings, non-completion of VAMBAY houses and similar works being executed by the Karnataka Urban Infrastructure Development and Finance Corporation with external assistance. This indicated that execution of works was entrusted to contractors without ensuring availability of clear title to land or sites were otherwise ready for undertaking the construction.
It was also noticed that 84 items of works such as roads, drains, culverts, street lights, water supply, overhead tanks, electricity allotted (February 2003 to September 2003) to contractors in 34 slums of 15 cities were not executed as similar works had already been or were being undertaken by other Government agencies or local bodies (34), facilities were already existing or other proposals were under consideration (41), or legal disputes (9).
In nine slums, in respect of 11 works allotted in June 2003 to August 2003 specifications of road works were changed from asphalting to cement concrete
Preparation of estimates for SUDP works without reckoning site conditions led to works not being taken up or being modified

Audit Report (Civil) for the year ended 31 March 2006
66
paving or vice versa, all of which involved higher expenditure. Thus, as against Rs.14.45 lakh provided in the estimates, actual expenditure incurred was Rs.91.51 lakh resulting in excess expenditure of Rs.77.06 lakh (including Rs.44.95 lakh in respect of change of asphalting to cement concrete in four slums of four cities). The change from asphalting to cement concrete was made on the ground that the roads were less than 3.5/3 metre width and road rollers could not pass through such small lanes.
These indicated that preparation of estimates was also made without taking into account site conditions and also indicated absence of coordination among different agencies undertaking similar works.
3.2.7.4 Quality control
According to the tender conditions, the contractor was to conduct quality control tests to ensure that characteristics of cement, strength of cement concrete and road works conformed to prescribed specifications.
The cement used for works was to be of high strength Portland cement conforming to Indian Standard (IS) and the contractor was required to furnish laboratory certificate to that effect. In respect of 144 slums of 10 cities, cement was used in works such as paving, construction of culvert, drain, underground drainage, retaining wall, etc. However, only one certificate each was kept for eight cities and in respect of two cities (Bijapur and Gulbarga), no test reports were on record.
The minimum sample of concrete of each grade required to be tested was between one and four depending on the quantity of concrete. In respect of 139 slums of nine cities, a total of 94 laboratory test reports only were submitted. Even these did not indicate the number of samples drawn, number of cubes tested for each work/slum. Further, 61 reports produced to audit did not mention the works to which the tests related (i.e., paving, drainage, culvert, etc.) 14 did not have dates and 23 did not indicate the slum to which these related.
The terms of the contracts for road works included conducting of various tests as per MOST specifications. While in respect of eight cities, no quality control reports were on record, in respect of one city (Gadag), out of 16 slums involved, tests had been conducted for eight slums only.
3.2.7.5 Maintenance of handed over assets by the Board
According to standing instructions of Government, once the house and primary environment works are completed in the declared slums, the area should be handed over to the concerned local body. In this regard, the date on which a reference is made from the Board to the local body would be deemed as the date of handing over of the slum and responsibility of maintaining them would be of the local body. Bellary, Bidar, Gadag, Hospet, Hubli-Dharwad, Kolar, Kolar Gold Fields and Raichur Bellary, Bidar, Bijapur, Gulbarga, Hospet, Hubli-Dharwad, Kolar Gold Fields and Raichur
Quality control was inadequate
Expenditure of Rs.13.82 crore on maintenance of assets in areas handed over to local bodies was irregular

Chapter III – Performance reviews
67
It was, however, noticed that 268 slums in 21 cities where works were taken up under SUDP Phase I, included 55 slums in the cities which had been already handed over to the concerned local bodies during August 1994/ February 2000/June 2000/November 2000. An expenditure of Rs.13.82 crore was incurred on maintenance of these assets during 2002-03 to 2005-06 in these slums which was irregular.
3.2.7.6 Non-recovery of cost of on-site improvements
According to the SUDP guidelines, at least 50 per cent of the expenditure incurred on slum development/improvement works undertaken was recoverable from the beneficiaries.
The Board completed (April 2005) works in 93 slums in 8 out of 21 cities incurring expenditure of Rs.26.47 crore on on-site improvements like road works, underground drainage and electricity. Of this, a minimum of Rs.13.24 crore was recoverable from the beneficiaries. The Board had not taken steps even for issue of demand notices for effecting recoveries.
3.2.8 Other points
Avoidable payment of interest
For implementation of VAMBAY and SUDP, the Board received grants from the State Government and obtained loans from HUDCO. The loan agreement with HUDCO provided an option to the Board to seek deferment of drawal of loan instalment by paying a charge at 0.5 per cent.
The Board, however, exercised the option of deferment only once in April 2003 for second instalment of loan in respect of SUDP due to slow progress of work. Records also revealed that the Board invested Rs.259.62 crore (VAMBAY: Rs.204.17 crore, SUDP: Rs.55.45 crore) in 283 term deposits during April 2002 to March 2006. These included term deposits for Rs.160.55 crore from HUDCO loan at interest rates ranging from 10 to 13.25 per cent (uniform rate of 7.91 per cent from January 2005). As against this, interest earned on the term deposits ranged from 4 to 8.5 per cent. Thus, while interest paid on the amount was Rs.8.07 crore, interest earned up to March 2006 was Rs.3.85 crore only, resulting in excess payment of interest of Rs.4.22 crore. The Board by exercising the option of deferment of drawal of loans by payment of deferment charges of Rs.80.28 lakh, could have saved interest of Rs.3.42 crore.
The Board stated (October 2006) that according to HUDCO loan terms and conditions, if loans were not drawn within the specified time, the funds would have lapsed. This is not tenable as the terms also provided for deferment of drawal and HUDCO had not refused to grant it.
Demands for recovery of Rs.13.24 crore from SUDP beneficiaries had not been raised
Loan instalments drawn from HUDCO kept in term deposits resulted in avoidable payment of interest of Rs.3.42 crore

Audit Report (Civil) for the year ended 31 March 2006
68
3.2.9 Conclusion
Implementation of VAMBAY was deficient as transfer of title of houses to the beneficiaries was very slow, works were taken up in non-declared/private land and houses in model slum remained unallotted and hence failed to serve as a demonstration unit. Community toilets constructed were not being maintained exposing users to health hazards. A control register for watching recovery of the cost of the houses from the beneficiaries centrally had not been maintained. Under SUDP, improper selection of contractors led to delay in completion of works. The works were not taken up for want of title to land or similar works were already under execution by other agencies. Expenditure was incurred by the Board on maintenance of works even after their transfer to local bodies.
3.2.10 Recommendations
Works should be taken up only after declaration of slums and acquisition of private slums to facilitate transfer of title in favour of beneficiaries.
Transfer of title of VAMBAY houses to beneficiaries should be ensured at the time of handing over possession.
Houses constructed in the model slum should be allotted to the beneficiaries without further delay.
Arrangements for maintenance of toilet complexes should be made soon after their completion.
A control register for monitoring recovery of cost of houses from the beneficiary should be maintained centrally.
Board should not incur expenditure on maintenance works in areas transferred to local bodies.
3.2.11 The points mentioned above were referred to Government in September 2006; reply had not been received (October 2006).

Chapter III – Performance reviews
69
PUBLIC WORKS DEPARTMENT
3.3 Development and Maintenance of Major District Roads
Highlights
The Karnataka State Public Works Department is responsible for the development and maintenance of the Major District Roads in the State whose length as of March 2006 was 31,626 kms. The development of the road network and its maintenance was constrained due to inadequate release of funds. The execution of works also suffered due to non-prioritisation of improvement and widening works. The Department executed the works in contravention of Indian Road Congress norms which led to several cases of avoidable and wasteful expenditure.
There were savings due to short release of budget provision which ranged from Rs.46.06 crore to Rs.103.36 crore during the period 2002-05. Execution of works in excess of funds released led to accumulation of liabilities to Rs.203.98 crore at the end of March 2006.
(Paragraph: 3.3.6.1)
Ribbon development and encroachments were not regulated by implementing the provisions of the Karnataka Highways Act, 1964. Non-prioritisation of road widening works resulted in avoidable expenditure of Rs.4.02 crore as the traffic intensity of these roads did not warrant such widening.
(Paragraphs: 3.3.7.3 & 3.3.7.5)
Incorrect values for various design parameters were adopted in the case of 26 roads costing Rs.27.73 crore which resulted in construction of their pavements with less thickness and thus prone to premature failure. In 11 cases, the pavement thickness was in excess resulting in avoidable extra expenditure of Rs.10.60 crore.
(Paragraphs: 3.3.8.2 & 3.3.8.3)
Execution of 9.59 lakh sqm of unnecessary Surface Dressing works in contravention of Indian Road Congress norms resulted in wasteful expenditure of Rs.2.22 crore on 42 road improvement works in Bellary and Raichur divisions.
(Paragraph: 3.3.8.5)
Execution of maintenance and repair works under piecework system was irregular and resulted in non-enforcement of quality control checks.
(Paragraph: 3.3.9.2)
The quality control tests for ensuring execution of works according to prescribed standards for different stages of pavement works to the extent of 31 to 98 per cent were not carried out. No test for moisture content before and after compaction of earth was conducted.
(Paragraph: 3.3.10.1)

Audit Report (Civil) for the year ended 31 March 2006
70
3.3.1 Introduction
Major District Roads (MDR) are the arterial roads within a district connecting them with each other or with State Highways (SH) and National Highways (NH). They also act as links between rural and urban areas. The total length of MDRs in the State was 31,626 kms5 (March 2006). Public Works Department (PWD) is responsible for the development and maintenance of these MDRs.
3.3.2 Organisational set-up
The Department of Public Works is headed by Principal Secretary who is assisted by the Secretary and two Chief Engineers viz, the Chief Engineer, Communication and Buildings (South Zone), Bangalore and the Chief Engineer, Communication and Buildings (North Zone), Dharwad at the zonal level. The Chief Engineers are assisted by 10 Superintending Engineers (SEs) at circle level and 35 Executive Engineers (EEs) at the divisional level.
3.3.3 Audit objectives
The main audit objectives were to ascertain whether: the funds were utilised for intended objectives; the programme implementation was planned and prioritised; execution of works was undertaken ensuring economy and efficiency;
and quality check norms were complied with.
3.3.4 Audit criteria
The audit criteria were based on:
Compendium of Notifications issued by Government;
Relevant publications of Indian Road Congress (IRC);
Report of Committee of Ministry of Road Transport and Highways (MORTH) on ‘Norms for Maintenance of Roads in India’;
Road Traffic Census data and
Management Information System (MIS), Departmental Medium Term Fiscal Plan (DMTFP), Annual Reports, etc.
5 Single-lane – 29,741 kms; Intermediate-lane – 1,743 kms and Double-lane – 142 kms

Chapter III – Performance reviews
71
3.3.5 Scope and methodology of audit
The review covering the period 2002-06 was conducted during April-June 2006 by test-checking the records of PWD Secretariat, two CEs, six SEs6, eight EEs7 and two Quality Control divisions. Of the total expenditure of Rs.1,167.04 crore8 incurred on MDR works during the period 2002-06, an expenditure of Rs.505.33 crore (43 per cent) was test-checked in audit.
The audit objectives were discussed in an entry conference with the CE, C&B (South) on 15 March 2006. The audit methodology involved examination of documents including estimates, tenders, agreements, vouchers, etc., and discussions with the departmental officers and issue of audit enquiries. The works were selected according to category of the work and magnitude of expenditure. The audit findings were communicated to the Government (September 2006) for their remarks and also discussed with the Principal Secretary, Public Works Department during the exit conference held on 21 October 2006.
Audit findings
3.3.6 Financial Management
3.3.6.1 Budget allotment and expenditure
The funds allotted in the budget and the expenditure incurred on the development and maintenance of MDRs9 during the period 2002-06 was as under:
Table 1: Budget Provision and Expenditure (Rupees in crore)
Year Budget proposals
Budget provision
LoC released
Expenditure incurred
Excess (+)/Savings (-) in expenditure vis-à-vis
budget provision
Pending bills as at the end of the year
2002-03 258.92 244.06 173.27 185.30 (-) 58.76 198.42
2003-04 305.79 241.18 185.05 195.12 (-) 46.06 255.76
2004-05 546.87 438.52 316.06 335.16 (-) 103.36 251.10
2005-06 906.52 405.30 429.36 451.46 (+) 46.16 203.98
Total - 1,329.06 1,103.74 1,167.04 - -
Although the budget provisions were less than the budget proposals which did not incorporate the liabilities of the previous years, the funds actually released 6 Bangalore, Bellary, Dharwad, Gulbarga, Hassan, and Mysore 7 Bangalore, Bellary, Bidar, Dharwad, Hassan, Kolar, Mandya and Tumkur 8 Including Central Road Fund Works 9 Including Central Road Fund Works Year-wise break up: 2000-01-Rs.0.40 crore (18 bills); 2001-02 – Rs.0.17 crore (150 bills);
2002-03 – Rs.1.39 crore (37 bills); 2003-04 – Rs.16.48 crore (1,924 bills); 2004-05 – Rs.34.70 crore (1,986 bills) and 2005-06 – Rs.150.84 crore (4,714 bills)

Audit Report (Civil) for the year ended 31 March 2006
72
fell short of the budget provisions during the years 2002-05. This resulted in savings against budget provisions which ranged from Rs.46.06 crore to Rs.103.36 crore during the period 2002-05. As the Department carried out its works programme on the basis of budget provisions, the liabilities by way of unpaid bills accumulated to Rs.203.98 crore at the end of March 2006.
3.3.6.2 Mukhya Mantri Grameena Raste Abhivrudhi Nidhi (MMGRAN)
Government established (May 2004) Mukhya Mantri Grameena Raste Abhivrudhi Nidhi (MMGRAN) to regulate and supplement resources for maintenance and upgradation of district and rural roads. The resources of the fund constituted proceeds of Rural Road Development Cess (RRDC) and 15 per cent of the Infrastructure Development Cess (IDC) levied on sales tax, motor vehicle tax, toll on roads and bridges, agriculture produce marketing fee, etc. The fund was administered through a State Level Committee chaired by the Chief Minister at Apex level. Programme formulation and implementation monitored at district level through District Level Committees. Though the committees were constituted at State level and in all the districts of test-checked divisions, they were not functional. The Secretary, PWD stated (July 2006) that the procedure laid down were not being followed. No specific reasons were furnished.
The cess collected for MMGRAN fund is initially credited to the Consolidated Fund of the State and subsequently transferred to Public Account under the Head of Account ‘8229–Development and Welfare Fund’. Seventy per cent of the MMGRAN funds is required to be allocated for maintenance and upgradation of PWD roads including MDRs and the balance for rural roads maintained by Zilla Panchayats. The expenditure initially booked under the Major Head ‘3054 – Roads and Bridges’ is relieved at the end of the financial year, as reduction in expenditure, to the extent of funds available under the Major Head 8229.
Review of records revealed that against Rs.120.07 crore collected (2004-06) as RRDC and IDC, only Rs.86.79 crore were transferred to MMGRAN fund. Reasons for not transferring the balance amount (Rs.33.28 crore) to MMGRAN were not on record. The amount of Rs.86.79 crore lying in the fund was also not transferred to service head for road works.
Thus, MMGRAN funds were not administered according to the guidelines and the objective of setting up the fund for supplementing the resources for road works was not met.
3.3.7 Programme implementation
3.3.7.1 Project planning
The existing Village Roads (VRs) and Other District Roads (ODRs) in the district are generally upgraded to Major District Roads having regard to the traffic intensity on these roads and their connectivity with the places of
MMGRAN funds were not administered in accordance with its guidelines and Rs.86.79 crore was not utilised

Chapter III – Performance reviews
73
production and marketing as well as the highways. The MDRs are later improved and/or widened to cater to the growing traffic needs.
3.3.7.2 Upgradation of roads
As per the Government directives (November 2003) up-gradation of VRs and ODRs as MDRs can be taken up only if the traffic intensity on these roads exceeds 1,000 Passenger Car Units (PCUs) and the roads connect villages having a population of one thousand and above.
During the period 2002-06, 12,872 kms of VRs and ODRs were declared for up-gradation. Of these, 2,872 kms were declared during 2004-06 without obtaining concurrence of the Finance Department for ensuring financial commitment.
Contrary to the norms, 46 kms of five ODRs/VRs in Hassan Division were classified (January 2006) as MDRs despite low traffic intensity of only 42 to 68 PCUs and population of the connected villages ranged from 44 to 888. In Bidar Division, 34 kms of 3 ODRs/VRs were classified (September 2003) as MDRs where traffic intensity was only 312 to 833 PCUs. Similarly in Kolar Division, 147 kms of 11 VRs/ODRs were classified (January 2006) as MDRs in 78 villages without fulfilling the population criteria which ranged from 166 to 997 only. Thus, 227 km roads were classified as MDRs for upgradation in violation of the guidelines.
The unnecessary up-gradation of 34 kms of three roads in Bidar Division resulted in unjustified expenditure of Rs.21.94 lakh towards their widening.
3.3.7.3 Regulation of right of way of Major District Roads
The right of way10 of MDRs and fixing of their ‘boundary lines’ and ‘control lines’ for preventing ribbon development11 and encroachments enabling future widening is regulated under the provisions of Karnataka Highways Act, 1964 (Act).
Review of records disclosed that various provisions of the Act which came in to force from 7 August 1969 had not been made applicable as of July 2006. This included declaration of MDRs as highways and appointment of ‘Highway Authorities’ for the implementation of the Act. Consequently, ‘boundary lines’ and the ‘control lines’ of these MDRs were not fixed for preventing ribbon development and encroachments and regulating the ‘right of way’. Against the IRC norm of minimum width of 25 metres ‘right of way’ in respect of MDRs in rural areas, the actual width ranged from five to 17.5 metres for a length of 765 kms12 road.
10 The land secured and reserved for future development of the road and structures pertaining
to it 11 Ribbon Development constitutes development on either side of carriageway within the
prescribed control lines 12 In respect of four divisions viz. Bangalore, Hassan, Kolar and Mandya
Village Roads and Other District Roads were declared for upgradation to MDRs in violation of the prescribed norms
Ribbon development and encroachments were not prevented by implementing Karnataka Highways Act, 1964

Audit Report (Civil) for the year ended 31 March 2006
74
Thus, the ribbon development and encroachments were not prevented by implementing the provisions of the Act by the Government.
3.3.7.4 Non-maintenance of an updated Road Information System (RIS)
Development of MDRs included improvement and strengthening of existing roads and their widening to intermediate and double-lane carriageways according to growing traffic needs. The road works are to be prioritised according to availability of funds and executed as per IRC norms. For this, the Department is to maintain a road inventory and update it regularly with information relating to category of roads viz., single-lane, intermediate-lane and double-lane, their existing condition, the intensity of traffic, growth rate of traffic, improvements/widening needs along with details of the ordinary/special repairs carried out from time to time. Besides, details of maintenance works carried out or to be carried out at different chainages, the cost of maintenance per kilometre of road are also required to be maintained.
An Information Technology Cell was also set up (2000) by the Department for development and maintenance of an Integrated Road Information System (RIS). It was to provide data on physical features like boundaries, road network and water resources and the existing road conditions (spatial data) necessary in prioritising the development works. It would also provide information on geometrics of roads and design parameters.
Review of records in test-checked divisions revealed that the Department had not maintained and updated data either in manual or in electronic form. Consequently, the prioritisation of works for improvement/strengthening/ widening was not done on the basis of road inventory/RIS information.
3.3.7.5 Non-prioritisation of widening works
The widening works of single-lane roads to intermediate-lane/double-lane carriageways are required to be taken up as per IRC norms given below:
Table 2: Carriageway with reference to traffic intensity
Sl No. Traffic intensity
(in Passenger Car Units) Lane width (in metres)
Type of carriageway
1 Up to 2,000 3.75 Single-lane
2 2,000 to 6,000 5.50 Intermediate-lane
3 6,000 to 15,000 7.00 Double-lane
4 Above 15,000 15.00 Four-lane divided carriageway
Of the total length of 3,376 km single/intermediate-lane carriageway (comprising 205 MDRs) in the jurisdiction of eight test-checked divisions, only 381 km length was as per above norms. The remaining 2,995 km had not been upgraded to intermediate-lane (2,144 km), double-lane (788 km) and four-lane (63 km) though the traffic intensity on these roads (February 2003) required such up-gradation. On the contrary, 135.40 km roads of 10 MDRs in
Improvement and widening works were not prioritised for execution in the absence of an updated Road Information System
Non-prioritisation of road widening works resulted in avoidable expenditure of Rs.4.02 crore

Chapter III – Performance reviews
75
four divisions13 were widened (expenditure: Rs.4.02 crore) to intermediate/ double-lane carriageways although the traffic intensity norms did not warrant it. This resulted in avoidable expenditure of Rs.4.02 crore on these widening works (Appendix 3.3).
3.3.8 Execution of road works
3.3.8.1 Design of pavement
The pavement of a road is designed taking into account several factors such as the initial traffic14, the traffic growth rate, the design life, the distribution of commercial traffic over the carriageway, the Vehicle Damage Factor (VDF)15 and strength of sub-grade. Based on these factors, the cumulative number of standard axles that can be borne by the pavement up to the end of designed life, known as design traffic, is computed in terms of Million Standard Axles (MSA). Normally, a design life of 10-15 years is adopted for MDRs. Pavement thickness and its composition is to be adopted as prescribed by IRC for a given design traffic (MSA) on a sub-grade of a particular soil strength16.
Review of records in the test-checked divisions, however, disclosed that values for various parameters were not adopted correctly while working out the design traffic as discussed below:
The latest available traffic census data applicable at the beginning of the construction of improvement/widening works was not adopted.
A uniform traffic growth rate of 7.5 per cent or nine per cent was adopted to arrive at the design traffic instead of actual traffic growth rate figures available with the Department as required under IRC norms.
Instead of actual VDF values available with the Department, indicative values were adopted for working out the ‘design traffic’.
Reckoning of incorrect values resulted in working out pavement thickness less than that required as per IRC specifications affecting adversely the structural stability of the pavements for their designed life as discussed in the following paragraph.
13 Bellary, Hassan, Kolar and Mandya 14 Initial traffic is the sum total of the existing traffic at the beginning of the construction of
the road and the estimated increase in traffic during the period of construction 15 VDF is a multiplier to convert the number of commercial vehicles of different axle loads to
the number of standard axle load repetitions. It is the equivalent number of standard axles per commercial vehicle
16 The soil strength is its capacity to resist the direct penetration of traffic load which is expressed as a percentage of load carrying capacity of a standard crushed rock specimen. This is also called California Bearing Ratio value

Audit Report (Civil) for the year ended 31 March 2006
76
3.3.8.2 Structural instability of roads
Scrutiny of estimates of 38 improvement works (43 chainages of 455 kms) executed (2000-05) in eight divisions at a cost of Rs.35.13 crore for a design life of 10 years revealed that their pavement thickness was not designed correctly due to adoption of traffic growth rate of 7.5 or nine per cent against the actual growth rates ranging from (-) 2.76 to 249 per cent as per the traffic census (traffic growth as of 2002-03 over 1997-98). This resulted in execution of road works with pavement thickness which was either more or less than that required for a design life of 10 years as indicated in 38 cases in Appendix 3.4.
Out of 43 chainages in respect of 38 MDRs, shortfall in crust thickness ranged from 440 mm to 20 mm in 26 roads (348 kms) involving an expenditure of Rs.27.73 crore leading to reduced life of 0.56 to 9.81 years. In respect of 10 chainages (88 kms), crust thickness was excess which ranged from 225 mm to 10 mm. Only in two chainages (19 kms), crust thickness conformed to norms.
The roads with shortfall in their crust thickness were prone to premature failure. The excess crust thickness in 10 chainages resulted in execution of excess quantities than that required for the design life and the expenditure (Rs.6.75 crore) thereon was avoidable and the funds if saved, could have been used on other priority works.
3.3.8.3 Avoidable extra cost on improvements to roads
Improvements to Chandapur-Dommasandra Road (km 0 to 11) and Bangalore-Dommasandra Road (km 21.30 to 23) were taken up (October 2005) by Bangalore Division, as a part of the works to divert the heavy traffic on NH 7 from km 9 to 18.50 km (Central Silk Board to Electronics City) temporarily for a period of two years for facilitating construction of an elevated expressway on this stretch of the National Highway. The work entrusted to a contractor at a tendered cost of Rs.9.79 crore was still in progress (May 2006) though it was due to be completed by April 2006. An amount of Rs.2.17 crore was paid to the contactor as of March 2006.
The heavy traffic of NH 7 was also proposed to be simultaneously diverted to two other adjoining State Highways. In the estimates for the improvement works on these three State roads17, the Division had uniformly reckoned 60 per cent of the commercial vehicles plying on NH 7 in addition to the normal traffic on the respective State road (for designing crust thickness) against one third of the total traffic on the NH 7 for arriving at the designed traffic. Besides, the designed traffic for the diversion roads was only for a period of two years. However, the pavement thickness was worked by adopting the designed traffic of both normal and diverted traffic together over a period of 10 years. As a result, the Department adopted a crust thickness of
17 1) Road from Anekal-Attibele-Sarjapur-Dommasandra to Varthur (SH 35) 2) Road from Anekal-Bannerghatta to Meenakshi Temple (SH 86-A) 3) Road from Chandapura-Dommasandra / Bangalore-Dommasandra to join HKA Road
(MDR)
Adoption of incorrect values for various design parameters resulted in construction of 26 roads costing Rs.27.73 crore with less pavement thickness making them liable to premature failure
Designing excessive pavement thickness for the designed life of 10 years and execution of work with higher specifications resulted in an avoidable extra expenditure of Rs.3.85 crore

Chapter III – Performance reviews
77
815 mm for the MDR as against 630 mm required for design life of 10 years. The estimates for the improvement works were also prepared adopting higher specifications such as providing ‘Wet Mix Macadam’, ‘Dense Bituminous Macadam’ and ‘Bituminous concrete’ on the basis of the Schedule of Rates (SR) of NH Zone instead of ‘Bituminous Macadam’, ‘Water Bound Macadam’ and ‘Semi-Dense Bituminous Concrete’ as per State PWD specifications.
The Divisional Officer in reply contended (May 2006) that reckoning higher traffic was necessary in view of the traffic intensity in the surrounding industrial areas and the MDR under improvements being one of the economically important roads in and around Bangalore. The reply is not tenable as the pavement thickness of a road has to be determined only by reckoning the factual values for various parameters prescribed by IRC. Thus, estimation and entrustment of work with higher specifications with extra crust thickness of 185 mm resulted in estimated avoidable extra cost of Rs.3.85 crore.
3.3.8.4 Avoidable outlay on improvements to Bellary-Rupanagudi Road
In Bellary Division, improvements to Bellary-Rupanagudi Road (km 16 to 22) were carried out (March 2004) at a total cost of Rs.54.70 lakh which included items of maintenance work and profile correction. The Division adopted a traffic growth rate of 7.5 per cent against the existing negative growth rate of 1.89 per cent based on the latest traffic census data of 2002-03. The Divisional Officer justified (July 2006) the expenditure of Rs.30.92 lakh18 incurred on providing additional pavement contending possible increase in traffic after the improvement of the road. The reply is not tenable as the existing crust thickness of the road was sufficient to bear the traffic load and improvement work was not justified in view of negative growth rate of traffic.
3.3.8.5 Wasteful expenditure on execution of ‘Single Coat Surface Dressing’ works
‘Single Coat Surface Dressing’ work comprises application of a layer of bituminous binder sprayed on a previously prepared base followed by a cover of stone chippings properly rolled to form a wearing course. According to IRC norms this item of work is executed in specific circumstances where the completion of improvement work is likely to get delayed by more than six months but it is inevitable to allow the traffic on the freshly laid metal surface during the intervening period. This provides temporary protection to the newly laid metal from coming out due to flow of traffic.
Review of records in respect of 42 road improvement works in Bellary and Raichur divisions revealed that 9.59 lakh sqm of ‘Single Coat Surface Dressing’ was provided (2002-06) at a cost of Rs.2.22 crore. The dressing coat was unnecessary as the work was completed in all respects without interruption before the traffic was allowed on the road. This resulted in wasteful expenditure of Rs.2.22 crore. The SE, PWD Circle, Bellary and 18 Excluding expenditure incurred on maintenance items like profile correction
Unjustified improvement work to a road resulted in an avoidable expenditure of Rs.30.92 lakh
Execution of Single Coat Surface Dressing works on roads where improvement works were completed without any time lag resulted in wasteful expenditure of Rs.2.22 crore
Audit Report (Civil) for the year ended 31 March 2006
78
EE, Bellary Division in reply contended (July 2006) that this item of work was necessary for consolidating the pavement before it was laid with wearing course. The reply is not tenable as the ‘base’ and ‘sub-base’ layers of pavement are, as per IRC specifications, thoroughly consolidated by power rollers before laying wearing course.
3.3.8.6 Avoidable expenditure on widening of road
The work of improvement to the roads from Bevinakoppe to Shambhuvanahally and from Melkote to Shravanabelagola in Mandya was completed (February 2006) at a cost of Rs.4.14 crore as against the tendered cost of Rs.4.58 crore. The saving of Rs.44 lakh was due to reduction in scope of work during execution.
Review of records of Mandya Division revealed that Rs.36.11 lakh out of these savings was diverted (February 2004) on the widening of these roads from the existing width of 8.50 metres to 17 metres which was beyond the IRC requirement of nine metres for single-lane roads. The widening works were executed as per the instructions of the SE, PW Circle, Mysore and approved by CE. The Department has not replied to the avoidable expenditure of Rs.36.11 lakh.
3.3.8.7 Non-utilisation of excavated earth for embankment/shoulders
MORTH specification stipulates that material is to be obtained from approved sources, with preference given to available earth. The contractors are required to segregate the soil based on suitability. Earth is to be brought from borrow areas only if the available material is found unsuitable and not conforming to standards after undertaking Quality Control (QC) tests.
Out of 64 works (2002-06) test-checked in four divisions19, 1.89 lakh cum of available/excavated earth in respect of 24 works only was utilised for formation of embankment/ shoulders. In the remaining 40 works, no part of 4.56 lakh cum of earth available was utilised for formation of embankments and shoulders. Instead, earth (2.67 lakh cum) was obtained from burrow areas by incurring an expenditure of Rs.4.14 crore on its excavation and transportation. In none of these cases, QC tests were conducted to assess the suitability of available earth. In reply (June/July 2006), the SE, PW Circle, Bangalore and EEs contended that the earth excavated at the work sites was not suitable for embankment. The reply was not substantiated by any QC test reports proving unsuitability of the excavated/available earth.
19 Bellary, Mandya, Raichur and Tumkur
Irregular diversion of savings for widening a single-lane road beyond 8.50 metres of width resulted in avoidable expenditure of Rs.36.11 lakh
Earth for use in embankment/ shoulders was obtained from burrow areas incurring an expenditure of Rs.4.14 crore without ascertaining the suitability of the excavated earth available at the site

Chapter III – Performance reviews
79
3.3.8.8 Payment at higher rates due to adoption of NH Schedule of Rates
Improvement works of MDRs funded from Central Road Fund (CRF) are executed after obtaining administrative approval from MORTH who reimburse the expenditure incurred on such works. The execution of MDR works is generally done on the basis of PWD sanctioned Schedule of Rates (SR). MORTH have not specified any condition that the CRF works be executed on the basis of SR applicable for National Highways funded by MORTH.
Test-check of 39 CRF works executed in eight divisions during the period from 2002-03 to 2005-06 revealed that estimates of these works had been based on rates of SR of National Highways though the rates for similar items of work were available in PWD SR. This resulted in execution of MDR works at higher rates of National Highway specifications instead of at lower rates of PWD specifications. The improvement and strengthening works of MDRs in other contiguous stretches funded from State budget are executed according to State PWD specifications. Adoption of NH SR instead of PWD SR in CRF works resulted in extra expenditure of Rs.3.17 crore.
3.3.9 Maintenance of MDRs
3.3.9.1 Inadequate funding for maintenance works
As per norms fixed (2001) by MORTH the cost of maintenance and repair of MDRs per kilometre is Rs.1,40,275 for single-lane roads, Rs.1,68,330 for intermediate-lane roads and Rs.2,24,441 for two-lane roads. Details of requirement of funds as per MORTH norms, budget proposals made and grants actually provided during the period from 2002-03 to 2005-06 are as follows:
Table 3: Requirement of funds and grants actually provided (Rupees in crore)
Year Total
length in km20
Requirement as per norms
Budget proposal
Budget allocation
Expenditure incurred
Shortfall in allocation to
requirement as per norms
2002-03 28,247 404.40 95.67 106.88 98.15 297.52
2003-04 28,247 407.33 122.05 152.95 103.17 254.38
2004-05 38,247 542.59 404.28 347.18 229.77 195.41
2005-06 30,975 440.59 690.10 267.14 314.46 173.45
Total - 1,794.91 1,312.10 874.15 745.55 920.76
Records revealed that the budget proposals were not in conformity with the norms for maintenance and repairs and the shortfall in proposals vis-à-vis norms ranged from Rs.308.73 crore in 2002-03 to Rs.138.31 crore in 2004-05.
20 Position as at the beginning of each year
Adoption of the Schedule of Rates of NH in the execution of CRF works resulted in an avoidable extra expenditure of Rs.3.17 crore
Unrealistic budget proposals for maintenance grants coupled with inadequate provision of funds resulted in inadequate maintenance

Audit Report (Civil) for the year ended 31 March 2006
80
Further, the shortfall in allocation compared to the norms ranged between 36 and 73.6 per cent and funds released were even lesser than the budgetary allocations, except during 2005-06, adversely affecting the maintenance and repair works of MDRs. The reasons for unrealistic budgetary proposal, allocations and releases were not on record.
It was further observed in two divisions (Mandya and Hassan) that Maintenance and Repair funds were diverted for roads within town/ municipal limits and execution of ineligible works viz., construction of Size Stone Masonry Box Drains (Rs.6.23 crore), improvements to roads (Rs.1.42 crore), erection of high-mast street lights (Rs.0.88 crore), formation of circles and statues (Rs.0.40 crore), improvements to bus stand/helipads/temples and payment of land compensation (Rs.0.20 crore).
3.3.9.2 Execution of maintenance and repair works under piecework system
The directions of Government for execution of maintenance and repair works stipulated that works of emergent nature only shall be entrusted on piecework system and not more than two works shall be entrusted to the same agency at a time.
The works were split to avoid obtaining sanctions from higher authorities and got executed through piecework contractors without inviting tenders thereby depriving the benefit of competitive rates. The works executed through piecework contractors were not subjected to quality control checks and defect liability clauses unlike tendered contracts. In the eight test-checked divisions, all the 13,104 works sanctioned for Rs.203.20 crore were executed on piecework basis, of which 505 works (expenditure: Rs.47.48 crore) were executed by splitting them into 3,630 works and entrusted to contractors allotting 3 to 15 works at a time.
In absence of road-wise inventory and execution of repair and maintenance works in different chainages by splitting them, the Department had no control mechanism to ensure that execution of works are planned according to availability of funds and quality control checks exercised.
3.3.10 Quality control
3.3.10.1 Non-compliance with norms in conducting Quality Control tests
MORTH Specification (IV Revision) prescribed the following tests for embankment works:
One test of ‘moisture content prior to Compaction’ for every 250 cum of quantity of work executed.
One test of ‘Degree of Compaction’ for every 1,000 sqm of area of each layer compacted.
Rs.9.13 crore were diverted from MDR funds for execution of ineligible works
Execution of maintenance works under piecework system was not only irregular but also resulted in non-enforcement of quality control checks and defect liability clauses for effective maintenance
Quality of works executed was not ensured as the quality control tests were either not carried out or were short than that prescribed

Chapter III – Performance reviews
81
Tests for moisture content prior to compaction were not conducted for 4.98 lakh cum of embankment work executed in PW Circle, Bellary {under CE, C&B (North Zone)}, against 1,993 tests required as per norms. Similarly, against 1,661 tests required as per norms for 16.60 lakh sqm of compacted quantity of earth, no tests were conducted. ‘Stripping Value Tests’ to assess the degree of adhesiveness of bitumen to metal were also not conducted. Consequently, quality in execution of embankment works was not ensured.
The position of quantities of works executed, the number of tests to be carried out and actually carried out in five divisions21 of north zone is given in Appendix 3.5. The shortfall in conducting QC tests against norms in respect of gravel sub-base, Water Bound Macadam and bituminous layers ranged from 31 to 98 per cent. Thus, the required level of quality control tests for different stages of pavement works were not carried out to ensure execution of works according to prescribed standards.
3.3.10.2 Nugatory expenditure on MDR works
The Department put to use ‘Road Measurement Data Acquisition System (ROMDAS)’ for conducting Road Condition Survey (RCS), which inter alia included conducting Roughness measurements (RM)22 computed on the basis of ‘International Roughness Index (IRI)’23 values.
As per directives of MORTH, the status/condition of roads based on RM/IRI was as follows:
Table 4 : Category of roads on IRI values IRI values Category Less than six Good – Fair Greater than six but less than eight Fair – Poor Greater than eight but less than ten Poor – Bad Greater than 10 Bad – very poor
The IRI values obtained (2003) in respect of 100.30 km of MDRs in Bellary and Bidar Divisions after carrying out improvement works between May 2001 and May 2002 at a cost of Rs.3 crore ranged from 6.14 to 12.33 for a length of 65.60 kms (Appendix 3.6). Thus, these stretches could be categorised as being in poor condition. Of these, eight roads (46.60 km) recorded very high IRI values within one year from the date of completion when the defect liability period of their contracts were in force. Occurrence of high IRI values within a short period of completion of improvement works indicated poor quality of execution which could not be detected and got rectified by contractors as QC tests were not done. Consequently, expenditure of Rs.three crore (worked on proportionate basis) incurred on improvement works over the stretch of 65.60 kms of MDRs was largely nugatory.
21 Bellary Division of Bellary Circle and Belgaum, Bijapur, Chikkodi and Bagalkot divisions
of Belgaum Circle 22 It is the level of resistance offered by the riding surface to the smooth flow of traffic 23 IRI is an indicator of the degree of the roughness of the riding surface
Expenditure of Rs.three crore incurred on improvement of MDRs proved largely ineffective

Audit Report (Civil) for the year ended 31 March 2006
82
3.3.11 Conclusion
The development and maintenance of Major District Roads suffered due to inadequate release of funds, insufficient planning and non-prioritisation of works programme. Adoption of incorrect values while working out design parameters for executing individual works and slackness in carrying out quality control checks led to deficiencies resulting in wasteful, avoidable and unjustified expenditure. Maintenance works were executed under piecework system by splitting them thereby depriving the benefit of competitive rates and prevented application of quality control checks.
3.3.12 Recommendations
Action should be taken to ensure that budget provisions are made according to availability of resources and works are carried out as per actual availability of funds to ensure that liabilities are not created at the end of a financial year.
It needs to be ensured that RRDC and IDC collected under various revenue heads of account are transferred to MMGRAN in time and utilised.
The works programme including that of maintenance works is planned and prioritised using the Road Information System which should be updated regularly.
It should be ensured that estimates of individual works are prepared in accordance with IRC specifications using correct design parameters including traffic census data.
Execution of maintenance works on piecework system basis needs to be stopped to avail the benefit of competitive bidding and for ensuring quality.
Quality Control checks need to be carried out as per MORTH specifications and regularly monitored to ensure that works are executed in conformity with the prescribed standards and specifications.
3.3.13 The above points were referred to Government in September 2006; reply had not been received (October 2006).

Chapter III – Performance reviews
83
URBAN DEVELOPMENT DEPARTMENT
3.4 Urban Water Supply Schemes
Highlights
The Karnataka Urban Water Supply and Drainage Board executes water supply and drainage schemes on behalf of urban local bodies (ULB) except in Bangalore city. Funding is mainly through grants from Government and loans from Government/financial institutions. Out of the 40 schemes taken up for execution during 2001-06, only 25 had been completed. While four works had not been commenced, work on 11 more had not been completed due to land disputes, delay in execution, etc. There were deficiencies in the project management and contract management resulting in avoidable extra expenditure of Rs.5.20 crore. Water supply charges of Rs.145.04 crore due from ULBs and consumers had not been collected by the Board.
Out of 40 schemes taken up during 2001-06 for execution, work on four had not been commenced and on 11 more due for completion between November 2003 and March 2006 had not been completed. The schemes were not completed due to land disputes, delay in obtaining clearance from the Irrigation Department and in execution by the contractors.
(Paragraph: 3.4.6.1) Project management and contract management were deficient resulting in avoidable extra expenditure/liability, unfruitful expenditure and excess payments aggregating Rs.5.20 crore.
(Paragraphs: 3.4.6.2 to 3.4.6.4 & 3.4.7) As of March 2006, water supply charges of Rs.145.04 crore were due from local bodies and consumers to the Board. Of this, Rs.104.70 crore related to 2000-01 and earlier years.
(Paragraph: 3.4.8) Quality of water supplied was not tested and monitored by the Board.
(Paragraph: 3.4.9) Non-release of full component of State Finance Commission grants by the Government for debt servicing led to diversion of plan funds, avoidable payment of penal interest of Rs.1.83 crore and non-availment of rebate of Rs.22 lakh on a HUDCO loan.
(Paragraph: 3.4.10.1)
3.4.1 Introduction
Urban Water Supply Schemes (UWSS) are implemented in the State (except Bangalore city) by the Karnataka Urban Water Supply and Drainage Board

Audit Report (Civil) for the year ended 31 March 2006
84
(Board) constituted in October 1974 under the Karnataka Urban Water Supply and Drainage Board Act, 1973 (Act). These schemes are financed through grants from Central/State Governments and loans from Government/financial institutions. The Board is also responsible for providing technical guidance to the local bodies in the matter of operation and maintenance of the schemes.
3.4.2 Organisational set-up
The overall control of the Board's activities vests in the Government in Urban Development Department headed by the Principal Secretary. The management of the Board is vested with the Board of Directors, comprising 11 nominated official members, four non-Government members and headed by the Chairman. The Managing Director is the Chief Executive Officer who is assisted by two Chief Engineers, South (at Bangalore) and North (at Dharwad), the Secretary and the Chief Accounts Officer. At the field level, the operations are undertaken by the 16 Divisions headed by Executive Engineers and 49 sub-divisions headed by Assistant Executive Engineers.
3.4.3 Audit objectives
Audit objectives were to assess whether: the planning and execution of works were adequate; the economic and efficient execution of works was ensured; the operation and maintenance of water supply schemes were adequate;
and the quality of water supplied was monitored.
3.4.4 Audit criteria
For the purpose of the review, the following was considered as criteria: The Act, the scheme guidelines, the guidelines of Central Public Health
Engineering and Environmental Organisation (CPHEEO). The Budget Manual and the Karnataka Public Works Departmental Code. Tender agreements.
3.4.5 Scope and methodology of audit
Audit of the Board was conducted under Section 19(3) of the Comptroller and Auditor General’s (Duties, Powers & Conditions of Service) Act, 1971. During 2001-06, the Board undertook 40 UWSS costing Rs.257.73 crore. Audit reviewed (January to June 2006) 15 schemes costing Rs.163.92 crore (63.60 per cent) selected through simple random sampling method by test-check of records in six out of 16 divisions. Of the 15 schemes selected, 12 had been commissioned and three were on going. Besides, operation and maintenance of 17 schemes maintained by the Board were also reviewed.

Chapter III – Performance reviews
85
The audit methodology involved examination of documents relating to finances, estimation, design and drawings, agreements, memoranda of understanding (MoU) and work bills at the Board office as well as at the divisional and sub-divisional offices, site visits, discussion with the functionaries and issue of audit enquiries. Entry conference was held with the Government/Board in March 2006 represented by the Secretary to Urban Development Department, Managing Director of the Board and its other subordinate officers during which audit objectives, criteria and methodology were discussed. The audit findings were communicated to the Board and the Government and also discussed with the Head of the Department/Board in the exit conference held in September 2006.
Audit findings
3.4.6 Project management
Project management in respect of UWSS comprised identification of assured and potable sources (both surface and sub-surface sources) of drinking water, drawing up of schemes, execution and completion by the targeted dates.
3.4.6.1 Status of works
The Board took up 40 new works under UWSS for execution at a cost of Rs.257.73 crore during 2001-06, of which as of March 2006, 25 were commissioned, 11 were ongoing and the remaining four were not commenced as detailed in the table below:
Table 1 : Status of works
Year Opening balance
Schemes taken up during the
year Total
Completed during the
year
Balance of works ongoing/yet to be
commenced 2001-02 - 20 20 -Nil- 20 2002-03 20 05 25 10 15 2003-04 15 02 17 06 11 2004-05 11 09 20 06 14 2005-06 14 04 18 03 15
Though, the 11 ongoing works were scheduled for completion between November 2003 and March 2006, these were held up due to land disputes, delay in clearance from Irrigation Department and delay in execution by the contractors.

Audit Report (Civil) for the year ended 31 March 2006
86
3.4.6.2 Works undertaken without ensuring availability of funds
The work of augmentation of water supply scheme to Doddaballapur (estimated cost: Rs.22.50 crore) was approved by the Government in June 2002. The Board did not include this work in the budget estimates for 2002-03 though there was scope for including the same under category "works awaiting Government's approval". However, the Board tendered Package-I of the scheme costing Rs.9.58 crore on the ground of immediate necessity to provide drinking water to the town. Tenders were called for in July 2002 and the lowest tender of a contractor for Rs.9.93 crore was accepted. But, letter of acceptance was issued only in August 2003 after including this work in the budget estimates for 2003-04. Due to delayed issue of acceptance, the contractor demanded 15 per cent increase over tendered rates. The Board rejected the tender and awarded (January 2004) the work to another contractor through fresh tender process for Rs.11.75 crore. This resulted in an avoidable extra liability of Rs.1.82 crore to the Board.
3.4.6.3 Unfruitful expenditure on a work due to injudicious decision
With a view to increase the water supply to Gulbarga city, Government approved (October 2000) the work of remodelling the existing water supply to the city under the UWSS. This remodelling work included replacement of 900 mm dia pre-stressed concrete (PSC) pipes by 914 mm mild steel (MS) pipes for a length of three kilometers (km) from Saradgi headworks at a cost of Rs.1.94 crore as frequent leakages and bursts of PSC pipes were observed. The Board, however, did not take up this work for immediate execution. Notice inviting bids was issued only in April 2003. The work was awarded in September 2003 to contractor ‘A’ at the tendered cost of Rs.2.05 crore and the site handed over in November 2003. Meanwhile, in April/May 2003, a World Bank team identified Gulbarga city for providing assistance for improving its bulk water supply. Based on its suggestion, in July 2003, the Board furnished to Government a project report for this work (estimated cost: Rs.45.45 crore). This work included laying of 1,118 mm dia MS pipes even in the three km stretch to be covered by the former remodelling work. This World Bank aided project was approved by Government (July 2004), tenders called for in July 2004 and the work commenced in June 2005.
The contractor ‘A’ who was required to complete the remodelling work by March 2004 completed only supply of pipes by the end of April 2004. Against the measured quantity of 2,972.48 metres (cost: Rs.104.53 lakh), a part payment of Rs.92.74 lakh was made in July 2004 under the terms of contract. The Board, though fully aware of the impending World Bank Aided Project persisted with the remodelling work till November 2004 by which time the contractor had carried out earthwork excavation and laid 914 mm MS pipes for 1.55 km. In June 2006, the Board decided to remove these pipes and use them on another water supply scheme under execution by the Board through contractor 'B'.
Water supply scheme to Humnabad-Chittaguppa towns and enroute villages
Failure of the Board to include a work in the budget estimates for 2002-03 resulted in avoidable extra liability of Rs.1.82 crore
Injudicious decision of the Board resulted in unfruitful expenditure of Rs.92.74 lakh and avoidable commited liability of Rs.74.64 lakh

Chapter III – Performance reviews
87
Thus, the Board injudiciously commenced the work of laying of 914 mm MS pipes under the remodelling of water supply scheme ahead of the World Bank aided project and continued it till November 2004. This rendered the expenditure of Rs.92.74 lakh unfruitful for over two years. Had the Board stopped execution of the remodelling work at the right time in July 2003 itself, the Board could have avoided the liability incurred towards laying of pipes for a length of 1.55 km (tendered cost: Rs.39.82 lakh) and expenditure to be incurred for removal of the same (negotiated cost: Rs.34.82 lakh).
3.4.6.4 Allotment of work without obtaining forest clearance
The work of Comprehensive Water Supply Scheme to Humnabad – Chitaguppa town estimated to cost Rs.19.04 crore was approved by Government in February 2004 stipulating that the work be completed by February 2006. The Board received Government grant of Rs.9.60 crore and bank loan of Rs.7.12 crore for the work during June 2005 and entrusted a portion of work (estimated cost: Rs.5.95 crore) to a contractor in July 2005 for completion by February 2007. The contractor had not commenced the work so far (June 2006), i.e. even one year after entrustment. The delay was mainly due to the Board taking up the work without clearance of Forest Department. Besides the delay, the Board had incurred interest outgo of Rs.41.65 lakh (June 2005 to March 2006) apart from locking up of Government grant of Rs.9.60 crore.
3.4.6.5 Works executed without sanction to the revised estimates
Of the 15 test-checked schemes, in respect of three schemes, the expenditure had exceeded the sanctioned estimates by 10 to 306 per cent as detailed below:
Table 2: Revised estimates not sanctioned (Rupees in crore)
Sl. No Name of work
Original estimated cost
sanctioned/ date
Revised estimated cost submitted to Government/date
Actual expenditure/
date
Percentage of excess
expenditure Remarks
1. UWSS to Hubli-Dharwad
44.48
August 2000
63.84
November 2002
60.10
March 2006
35 The work is not yet complete
2. UWSS to Ranebennur and Byadgi
4.50
March 1990
19.42
November 2004
18.28
October 2005
306 The work was completed in February 2006
3. Augmented Water Supply Scheme to Talikot
9.42
May 1999
11.08
August 2005
10.40
February 2006
10 The work was completed in December 2005
Earthwork excavation, lowering, laying, joining, murrum bedding, etc. of 914 mm MS
pipes – Rs.39.82 lakh Earthwork excavation, removal, lifting, etc. of 914 mm MS pipes – Rs.34.82 lakh
Work taken up without obtaining clearance of land from Forest Department
Government's revised sanction was not obtained

Audit Report (Civil) for the year ended 31 March 2006
88
As per Codal provisions, when the expenditure exceeded five per cent, revised sanction of Government had to be obtained. The same was yet to be received though the Board had sent the revised estimates to Government between November 2002 and August 2005. In the absence of sanction to revised estimates in the above cases, the excess expenditure of Rs.30.38 crore incurred remained unauthorised.
3.4.7 Contract management
A review of contracts and the related works records pertaining to test-checked UWS schemes revealed the following:
3.4.7.1 Excess payment and non-utilisation of excavated soil
Technical specifications stipulated that material for embankment were to be obtained from approved sources, preference being given to available earth. The contractors were required to seggregate the excavated soil based on its suitability. Borrow areas were required to be resorted to only if the available earth was found unsuitable, i.e. not conforming to standards as per Quality Control (QC) tests. Out of 15 works test-checked, in three works of two divisions it was noticed from the bills paid that no part of 5.64 lakh cubic metres of excavated earth was utilised for formation of embankments. In the measurement books (MB), earth was shown as having been obtained from borrow areas incurring expenditure of Rs.6.40 crore. No quality control tests were conducted to ascertain the suitability of excavated/available earth. In another work executed in Bijapur division, 72,000 cubic metres (45 per cent) of excavated earth was recorded in the MB as used on the work. Even so, the claim of the contractor of having used material from borrow areas (August 2001) was accepted and the bill passed for payment. This resulted in excess payment of Rs.28.63 lakh.
3.4.7.2 Excess payment on account of additional lead charges
In respect of augmented water supply scheme to Talikot, for items of earth work, additional lead charges of Rs.16.60 per cum was provided in the data rate for carrying the excavated earth up to the dumping point to be specified by the Board at a distance of one kilometre from the site of the work. However, as no dumping point was identified for disposing of the excavated earth, the contractor dumped it near the work spot itself. The contractor was, however, paid (August 2001) additional lead charges of Rs.31 lakh which were not due to him.
Bellary and Raichur 1,69,863 cum x Rs.16.60 + 10 per cent tender premium thereon = Rs.31 lakh
Incorrect regulation of claim for embankment work resulted in excess payment of Rs.28.63 lakh to contractor. Board did not ascertain suitability of excavated earth for embankment before incurring expenditure of Rs.6.40 crore
Excess payment of Rs.31 lakh to a contractor
Chapter III – Performance reviews
89
3.4.7.3 Avoidable extra expenditure due to defective tender document
The work of "Emergency improvements in water supply scheme to Hubli-Dharwad" was approved by Government in August 2000. In the estimate prepared for this work, for the item relating to "manufacturing, providing, laying, jointing, etc., of 965 mm dia and 7.92 mm thickness Mild Steel pipes", as the Board's Schedule of Rates (SR) - 2002-03 had not provided the rate, the Board worked out a data rate of Rs.5,806.35 per metre and adopted this rate for the entire quantity of 26,590 metre required for the work as was prescribed in the Board's SR for similar items. However, while calling for tenders, in the Bill of Quantities (BOQ), the Board exhibited this item as two different items splitting up the total quantity into 16,000 metre and 10,590 metre respectively thereby providing an undue opportunity to the tenderers to quote two different rates for this item. Accordingly, the lowest tenderer quoted two rates i.e. Rs.6,425 per metre and Rs.7,070 per metre respectively for this item and the Board accepted the same without negotiating the rate discrepancy with the contractor. Hence, defective BOQ prepared by the Board led to an avoidable extra expenditure of Rs.68.31 lakh.
3.4.8 Operation and maintenance of water supply schemes
As the Board executes water supply schemes on behalf of local bodies, the Board after completion and commissioning of these schemes transfers the assets to the concerned local body for operation and maintenance in terms of the Act and instructions issued (November 1996) by Government. The following points were noticed.
3.4.8.1 The local bodies to whom five schemes were handed over during 2001-05 expressed their inability to maintain them owing to lack of technical staff and resources. Though provision existed in the Act for the Government to entrust the operation and maintenance of such schemes to the Board itself, no action had been taken so far to entrust the schemes to the Board. Non-maintenance/inadequate maintenance would expose these to the risk of being rendered non-functional and wasteful.
3.4.8.2 The Board has been vested with the responsibility of operation and maintenance of 12 water supply schemes up to bulk supply point and five schemes up to consumer point. Government directed (November 1996) the ULBs and the Board to conclude a MoU regarding the issues relating to installation of water meters at bulk supply points and remittance of water charges to the Board before the 15 of each month and to enable the Board to disconnect the water supply in case of default in remittance of water charges
Rs.7,070 – Rs.6,425 = Rs.645 x 10,590 metre = Rs.68.31 lakh Chitradurga, Chamarajnagar, Gundlupet, Gadag-Betageri and Shiggaon-Savanur Arasikere, Belgaum, Bhalki, Bidar, Bellary, Gadag-Betageri, Gulbarga, Humnabad,
Karwar, Mundargi, Tumkur and Tiptur Bethamangala, Hubli-Dharwad, Kushalnagar, Mandya, Ramanagaram-Channapatna
Defective Bill of Quantities prepared by the Board led to avoidable extra expenditure of Rs.68.31 lakh
Five water supply schemes handed over to ULBs were not maintained/ inadequately maintained
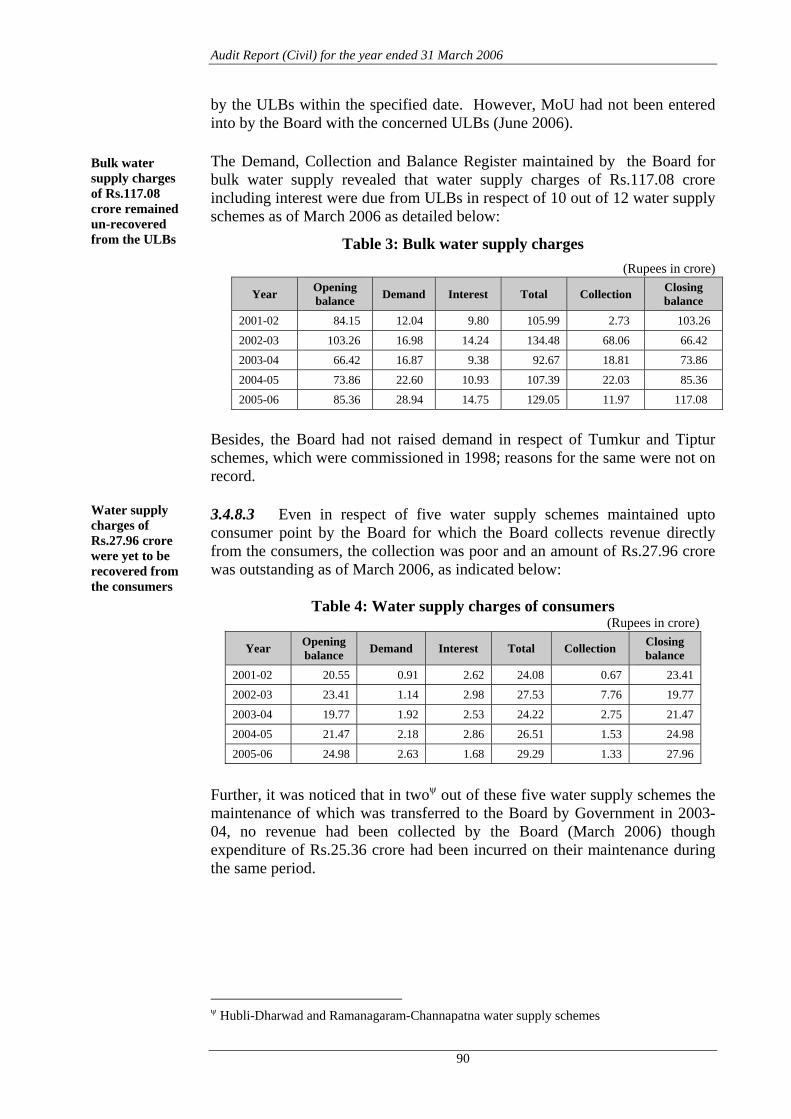
Audit Report (Civil) for the year ended 31 March 2006
90
by the ULBs within the specified date. However, MoU had not been entered into by the Board with the concerned ULBs (June 2006).
The Demand, Collection and Balance Register maintained by the Board for bulk water supply revealed that water supply charges of Rs.117.08 crore including interest were due from ULBs in respect of 10 out of 12 water supply schemes as of March 2006 as detailed below:
Table 3: Bulk water supply charges (Rupees in crore)
Year Opening balance Demand Interest Total Collection Closing
balance 2001-02 84.15 12.04 9.80 105.99 2.73 103.26
2002-03 103.26 16.98 14.24 134.48 68.06 66.42
2003-04 66.42 16.87 9.38 92.67 18.81 73.86
2004-05 73.86 22.60 10.93 107.39 22.03 85.36
2005-06 85.36 28.94 14.75 129.05 11.97 117.08
Besides, the Board had not raised demand in respect of Tumkur and Tiptur schemes, which were commissioned in 1998; reasons for the same were not on record.
3.4.8.3 Even in respect of five water supply schemes maintained upto consumer point by the Board for which the Board collects revenue directly from the consumers, the collection was poor and an amount of Rs.27.96 crore was outstanding as of March 2006, as indicated below:
Table 4: Water supply charges of consumers (Rupees in crore)
Year Opening balance Demand Interest Total Collection Closing
balance 2001-02 20.55 0.91 2.62 24.08 0.67 23.41
2002-03 23.41 1.14 2.98 27.53 7.76 19.77
2003-04 19.77 1.92 2.53 24.22 2.75 21.47
2004-05 21.47 2.18 2.86 26.51 1.53 24.98
2005-06 24.98 2.63 1.68 29.29 1.33 27.96
Further, it was noticed that in two out of these five water supply schemes the maintenance of which was transferred to the Board by Government in 2003-04, no revenue had been collected by the Board (March 2006) though expenditure of Rs.25.36 crore had been incurred on their maintenance during the same period.
Hubli-Dharwad and Ramanagaram-Channapatna water supply schemes
Bulk water supply charges of Rs.117.08 crore remained un-recovered from the ULBs
Water supply charges of Rs.27.96 crore were yet to be recovered from the consumers

Chapter III – Performance reviews
91
3.4.9 Quality control and monitoring
The CPHEEO manual prescribes that laboratories with adequate facilities and manned by qualified personnel are to be established for conducting inspection and evaluation of the suitability of water supplied from the scheme for public use and also for controlling the water treatment processes accordingly. Complete records of bacteriological and chemical analysis of water from source to the consumer point were to be maintained and reviewed. While in respect of schemes covering population up to one lakh, one sample per month was to be taken per population of 5,000, in respect of other schemes, one sample per month was to be taken per population of 10,000.
Out of 12 commissioned water supply schemes test-checked, laboratories established in respect of three schemes were non-functional since their inception. Of the remaining nine schemes, only in one scheme (UWSS to Hubli-Dharwad) the laboratory was functioning. In the other eight schemes, though the laboratories were functional, no records were kept indicating periodical collection of samples and their test results. The water supplied to Gajendragad town from a borewell commissioned in 2002 at a cost of Rs.80.48 lakh, was not found (November 2003) potable by the town municipal council (TMC). Though the TMC had taken up the matter with the Board, action taken in the matter was not made known.
Though, the operation and maintenance of these schemes had been transferred to the concerned ULBs, the Board which was responsible for providing technical guidance and ensuring supply of safe potable water to the public, had not ensured conduct of proper quality control tests.
3.4.10 Other points
3.4.10.1 Avoidable payment of penal interest
The State Government releases State Finance Commission (SFC) grants annually to the Board for debt servicing of loans borrowed from financial institutions. During 2001-06, the Government short released budgeted SFC grant by Rs.51.51 crore. Consequently, the Board diverted Rs.41.94 crore from plan funds for debt servicing leaving a balance of Rs.9.57 crore unserviced. Also, non-servicing of balance debt according to prescribed schedule led to avoidable payment (between January 2001 and March 2005) of penal interest of Rs.1.83 crore to LIC/Banks and non-availment of rebate of Rs.22 lakh on loan borrowed from HUDCO.
Water supply scheme to Gadag – Betageri commissioned in 2000-01 Water supply scheme to KR Nagar commissioned in February 2003 Water supply scheme to Talikot commissioned in October 2003
The Board failed to monitor water supply schemes handed over to ULBs to ensure supply of required quality of water to the public
Non-release of SFC grants in full led to diversion of plan funds and avoidable payment of penal interest of Rs.1.83 crore

Audit Report (Civil) for the year ended 31 March 2006
92
3.4.10.2 Non-recovery of interest on deposit works
During the period 2001-06, the Board also executed Deposit Contribution works on behalf of ULBs. Under the Codal provisions, the estimated cost of such works were to be deposited in advance with the Board by the concerned ULBs. For any excess expenditure incurred over such deposits, the Board was to charge interest at 12 per cent per annum. It was noticed from the records of the Board that in nine divisions involving 25 works, excess expenditure of Rs.3.13 crore had been incurred up to 2004-05. The Board, however, did not obtain full details such as period during which excess expenditure was incurred and principal amount recovered from time to time and also did not compute accrued interest on such excess expenditure for claiming it from ULBs. Interest recoverable on this amount for one year alone worked out to Rs.37.58 lakh.
3.4.11 Conclusion
Project management was deficient as there were instances of works being started without availability of funds and without forest clearance. Contract management was also not satisfactory as there were lapses in preparation of tender documents and regulating payments to contractors strictly according to the terms of contract. Operation and maintenance of schemes was not satisfactory as the Board left substantial amounts of water charges unrecovered from ULBs/consumers in respect of schemes maintained by it. Board did not ensure quality of water supplied to the consumers.
3.4.12 Recommendations
Tendering process should be started only after ensuring availability of funds and sites for the schemes.
The tender documents should be prepared carefully so as to ensure that the rate adopted for items of work are accurate and strictly conforming to the norms specified in the Board’s schedule of rates.
Strict compliance by the contractors with the terms of contract should be ensured by duly recording measurements in the MB and contractors’ bills admitted for payment only after referring to the MB.
The Board needs to conclude MoU with ULBs concerned to ensure prompt recoveries of water supply charges.
Board should regularly monitor quality of water supplied to consumers and place suitable controls to ensure the same.
3.4.13 The above points were referred to Government in September 2006; reply had not been received (October 2006).
Bangalore, Belgaum, Bellary, Bijapur, Gulbarga, Hubli-Dharwad, Mandya, Raichur and
Shimoga
Interest dues on deposit contribution works was not computed and claimed from ULBs

Chapter III – Performance reviews
93
EDUCATION DEPARTMENT
3.5 Sarva Shiksha Abhiyan
Highlights
Sarva Shiksha Abhiyan aims at providing universal elementary education in a mission mode, by providing useful and relevant education for all children in the age group of 6 to 14 years by 2010. The primary objective was to have all children in schools/alternative schools, by 2005. The main objective of the scheme was not achieved due to non-absorption by implementing agencies of even the reduced level of funding by Central and State Governments. Interventions by project authorities were not effective resulting in non-realisation of the norms set. Implementation of the scheme was faulty, as the implementing agencies could not absorb even the reduced level of funds released with delays ranging from three to seven months.
(Paragraph: 3.5.6) Planning was deficient as there were delays in submission of Annual Plans by the State Government. District Elementary Education Plans did not contain important components of the programme, detailed strategy and action plans to fill up gaps identified.
(Paragraph: 3.5.7) The project aim of having all children in schools by 2005 was not accomplished as 1.60 lakh children were still out of schools, as of March 2005. Trends in dropout rate indicated that the objective of universal retention by 2010 was unlikely to be achieved.
(Paragraphs: 3.5.8.1 & 3.5.8.2) Children in 2,347 habitations out of 85,543 did not have access to primary schools; similarly, children in 2,275 habitations did not have access to upper primary schools according to the norms. As against 2,087 new schools sanctioned during 2001-05, only 1,541 schools were opened. Basic infrastructure needs were available only in 41 per cent of the 43,333 Government schools.
(Paragraphs: 3.5.8.3 & 3.5.8.5)
About four lakh focus group children in aided schools were denied the facility of free textbooks and there were delays in distribution of textbooks to children in Government schools.
(Paragraph: 3.5.8.7)
Only 13 per cent of the children with special needs received assistance under Sarva Shiksha Abhiyan during 2004-05 and less than one per cent of upper primary schools had access to computer education, as of March 2005.
(Paragraphs: 3.5.8.9 & 3.5.8.10)

Audit Report (Civil) for the year ended 31 March 2006
94
The extent of involvement of Non-Governmental Organisations was not as envisaged while monitoring was inadequate.
(Paragraphs: 3.5.8.11 & 3.5.9)
3.5.1 Introduction
The Government of India (GOI) launched (January 2001) Sarva Shiksha Abhiyan (SSA) in all the 27 districts of the State, mainly to provide relevant and quality elementary education to all children in the age group of 6 to 14 years, by 2010. The SSA was a partnership among the Central, State and Local Governments, with the involvement of the community. The objectives of SSA are to:
have all children in schools/Education Guarantee Scheme (EGS) Centres/ Alternative Schools/Back-to-School Camps by 2003 (modified to 2005 in August 2005);
ensure that all children complete five years of primary schooling by 2007 (modified to 2010 in August 2005);
ensure that all children complete eight years of elementary schooling by 2010 (deleted in August 2005);
bridge gender and social category gaps at primary stage by 2007 and at elementary education level by 2010; and
achieve universal retention by 2010.
To achieve these objectives, SSA contemplated norms for 21 areas of interventions like teacher, school, classrooms, textbooks, training, research, etc.
3.5.2 Organisational set-up
SSA in the State is implemented through “Sarva Shiksha Abhiyan Samithi-Karnataka" (SSASK), a Society established in January 2001. The programme is administered by an Executive Committee (EC) chaired by the Principal Secretary (Primary and Secondary Education) and Secretaries of Departments as members. The State Project Director (SPD) is the Member Secretary of the Committee and is also responsible for operationalising and implementing the scheme in the State. At district level, the Deputy Director of Public Instruction (Administration) implements the scheme as the District Project Officer (DPO) along with the district level samithi, district implementation committee and district resource group. At block level, the Block Education Officer {Block Resource Centre (BRC)} implements the scheme. At village/school level, the School Development and Monitoring Committee is responsible for implementation.

Chapter III – Performance reviews
95
3.5.3 Audit objectives
The main objectives of audit were to examine: the efficacy of planning of various components of the programme; the adequacy of funds given for implementation and whether the utilisation
of funds was according to the approved plan; whether major interventions were carried out in accordance with the norms
prescribed such as the Teacher-Student Ratio (TSR), coverage of out-of-school children and dropout rate;
the adequacy of infrastructural facilities; involvement of Non-Governmental Organisations (NGOs); and the efficacy of the mechanism for periodic review and monitoring.
3.5.4 Audit criteria
For the purpose of examination, Audit considered the following as audit criteria, besides attempting to match the commitment of SSA to provide relevant and quality education to target group of children, with the ultimate goal: norms set in Manual of Planning and Appraisal of SSA; framework for implementation; and instructions issued from time to time.
3.5.5 Scope and methodology of audit
Audit reviewed (June to August 2005) the implementation of SSA by undertaking a test-check of records relating to the period 2001-05 in the offices of the SPD, the DPO of six districts/18 blocks and 94 schools and Gram Panchayats associated with such selected schools. Samples for test-check were selected through a multi-stage stratified sampling method. Out of total expenditure of Rs.590.59 crore in the State, expenditure of Rs.110.47 crore has been test-checked in six selected districts.
Assessment of SSA was also undertaken by Social and Rural Research Institute (SRI), a unit of IMRB International during December 2005 – February 2006. A summary of its findings is given as Appendix 3.7.
Audit communicated (June 2005) the scope of audit, objective, methodology, criteria, etc., in an entry conference with the SPD. An exit conference was also held (October 2005) to discuss the findings. The findings detailed in succeeding paragraphs take into account the response of programme implementing agencies, whose cooperation during the review is Bangalore (Urban), Belgaum, Bellary, Chitradurga, Hassan and Kolar Alur, Bangalore (South) Range 3, Belgaum City, Bellary (East), Bellary (West),
Chintamani, Chitradurga, Hassan, Hiriyur, Holenarsipura, Hosadurga, Kolar, K.R.Puram, Malur, Raibag, Sandur, Savadatti and Yelahanka
Budgeted funds were not released and even the reduced releases were not absorbed. Besides, there were instances of excess expenditure/non-utilisation/diversion of funds
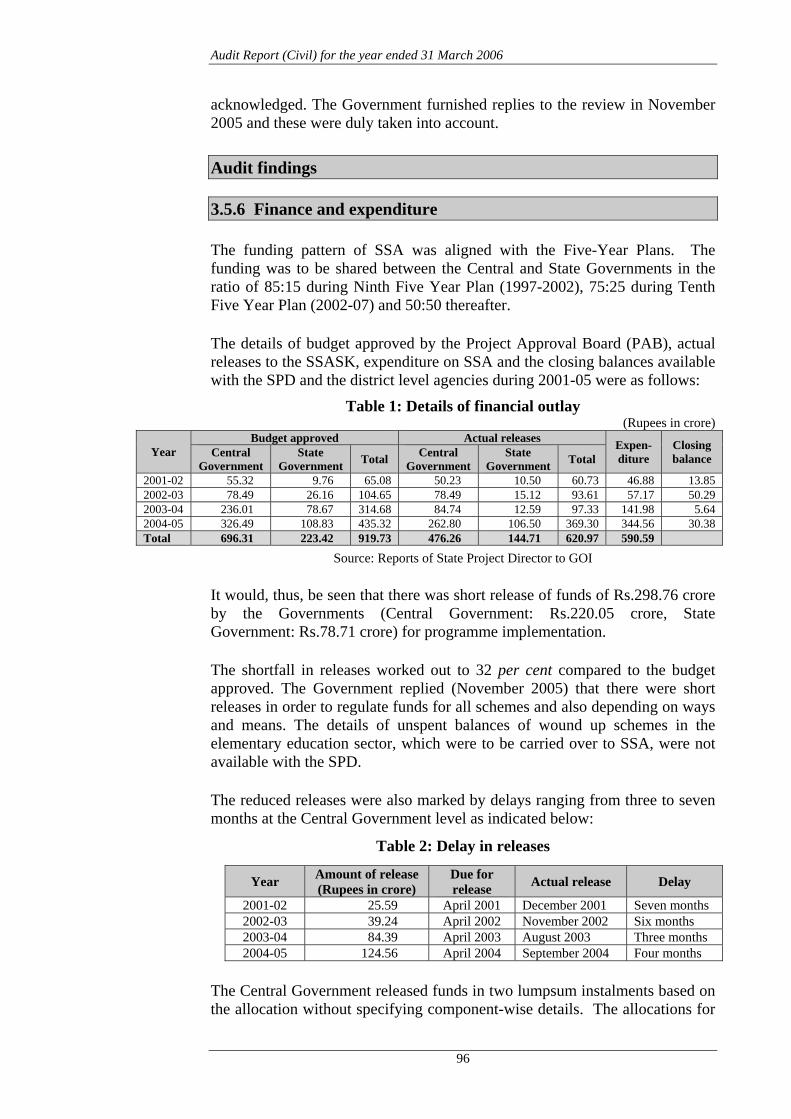
Audit Report (Civil) for the year ended 31 March 2006
96
acknowledged. The Government furnished replies to the review in November 2005 and these were duly taken into account.
Audit findings
3.5.6 Finance and expenditure
The funding pattern of SSA was aligned with the Five-Year Plans. The funding was to be shared between the Central and State Governments in the ratio of 85:15 during Ninth Five Year Plan (1997-2002), 75:25 during Tenth Five Year Plan (2002-07) and 50:50 thereafter.
The details of budget approved by the Project Approval Board (PAB), actual releases to the SSASK, expenditure on SSA and the closing balances available with the SPD and the district level agencies during 2001-05 were as follows:
Table 1: Details of financial outlay (Rupees in crore)
Year Budget approved Actual releases Expen-
diture Closing balance Central
Government State
Government Total Central Government
State Government Total
2001-02 55.32 9.76 65.08 50.23 10.50 60.73 46.88 13.85 2002-03 78.49 26.16 104.65 78.49 15.12 93.61 57.17 50.29 2003-04 236.01 78.67 314.68 84.74 12.59 97.33 141.98 5.64 2004-05 326.49 108.83 435.32 262.80 106.50 369.30 344.56 30.38 Total 696.31 223.42 919.73 476.26 144.71 620.97 590.59
Source: Reports of State Project Director to GOI
It would, thus, be seen that there was short release of funds of Rs.298.76 crore by the Governments (Central Government: Rs.220.05 crore, State Government: Rs.78.71 crore) for programme implementation.
The shortfall in releases worked out to 32 per cent compared to the budget approved. The Government replied (November 2005) that there were short releases in order to regulate funds for all schemes and also depending on ways and means. The details of unspent balances of wound up schemes in the elementary education sector, which were to be carried over to SSA, were not available with the SPD.
The reduced releases were also marked by delays ranging from three to seven months at the Central Government level as indicated below:
Table 2: Delay in releases
Year Amount of release (Rupees in crore)
Due for release Actual release Delay
2001-02 25.59 April 2001 December 2001 Seven months 2002-03 39.24 April 2002 November 2002 Six months 2003-04 84.39 April 2003 August 2003 Three months 2004-05 124.56 April 2004 September 2004 Four months
The Central Government released funds in two lumpsum instalments based on the allocation without specifying component-wise details. The allocations for

Chapter III – Performance reviews
97
key components like establishment of EGS Centres, provision for disabled children, etc., were not fully utilised and the shortfall in utilisation ranged from 50 to 100 per cent during 2001-04 (Appendix 3.8). The GOI adjusted during 2003-05, Rs.70.98 crore remaining unutilised with implementing agencies from the funds earmarked for subsequent years, resulting in loss of Central assistance.
Test-check disclosed the following instances of significant non-utilisation and diversion of funds and excess expenditure.
Table 3: Details of non-utilisation/diversion of funds and excess expenditure
Sl. No.
Components/ Activities
Particulars of diversion/ Under utilisation/Non-
utilisation
Reply of the State Government Audit observations
1. Pre-project activities
Rupees 1.28 crore allotted during 2000-02 by GOI was returned unutilised.
The balance amount was returned to SPD after undertaking all activities and without compromising on the required activities.
Pre-project activities were not undertaken fully in the six test- checked districts.
2. Establishment of EGS Centre and supply of learning aids, etc.
Rupees 1.11 crore released during 2003-04 to Kolar district was unutilised and returned to SPD.
The children were mainstreamed through other programmes and there was no necessity for opening EGS centres.
The SPD had sought allocation under EGS Centres for 2003-04 and 2005-06 also.
3. Teachers and community training
Rupees 2.34 crore released during 2003-04 to Director of State Education Research and Training was diverted for educational radio broadcast under 'Research and Evaluation'.
Second instalment of grant during 2003-04 was not released for Annual Working Plan and Budget (AWP&B) activities.
Even though there were sufficient funds under 'Research and Evaluation' remaining unutilised, funds from this component were diverted.
4. Payment to leave reserve teachers
Rupees one crore was released during 2003-04 to leave reserve teachers of Government who were not actually deployed on SSA.
Funds were utilised for payment to teachers of standard VIII in higher primary schools.
PAB had categorically rejected the proposal for payment to leave reserve teachers under SSA.
5. Salary to Government teachers
One hundred and eighteen regular Government teachers in Bangalore (Urban) district were paid salary of Rs.43.66 lakh from SSA funds during 2001-03.
Fifty nine new schools were opened and 118 excess teachers were deployed for SSA.
Existing teachers were already drawing salary from Government funds and no teachers were appointed for SSA scheme.
6. Reimbursement of sports fees, sports fund, etc.
Rupees 4.30 crore were released during 2003-04 towards reimbursement of sports fees, sports fund, library fees, etc., in violation of norms.
Government admitted having utilised the money for these activities during 2003-04 but discontinued from 2004-05.
Reasons for violation of norms were not communicated.
7. Free textbooks for special focus group children
The SPD projected requirement at the maximum permissible limit during 2003-05 to the PAB for procurement of free textbooks for special focus group children.
The higher projection in the proposal to distribute free text books was to cover the children in the aided schools.
Absence of need-based assessment resulted in release of Rs.10.61 crore in excess of actual requirement to SPD. The proposal was not implemented during the period of review.
2002-03: Rs.41.62 crore and 2003-04: Rs.29.36 crore. The excess adjustment by GOI over
the levels of closing balance indicated in Table-1 was under correspondence with the GOI

Audit Report (Civil) for the year ended 31 March 2006
98
3.5.7 Planning process
The SSA envisaged well-planned preparatory phase for a number of interventions for developing the project delivery and monitoring system. These included household surveys, community-based micro planning and school mapping, manpower assessment, training of community leaders, school level activities, setting up of Education Management Information System (EMIS), etc. GOI released an amount of Rs.3.95 crore for preparatory activities during 2000-02. Though the authorities conducted household surveys for identifying out-of-school children each year, the baseline study was taken up only during 2002-03, the report of which was not made available to Audit. Community leaders were not trained in the pre-project phase and the training started only during 2002-03. There was no evidence of man-power assessment having been carried out in the pre-project phase. The requirements of Director of State Education Research and Training and District Institutes of Education and Training were not assessed and incorporated in the plan documents. These deficiencies impacted timely preparation of annual accounts, absorption of funds, etc., adversely.
Test-check disclosed the following further deficiencies in the planning process:
The State Government submitted District Elementary Education Plans (DEEPs) for 2002-05 to the GOI, after a delay of one to seven months from the due date in March. These were also not got approved by the EC during 2001-02 to 2003-04. Rupees 1.65 crore released by SPD to Women and Child Welfare Department during 2002-03 without a detailed action plan were utilised only during 2004-05. While formulating the financial plans, funds available for similar components under various developmental programmes were not considered and specified in the State Plans or District Action Plans of the SSA. Research projects were not covered in the DEEPs. There were no strategies laid for appointment/re-deployment of teachers to meet the TSR in two test-checked districts.
Out of six test-checked districts, in four districts, the cost for activities under research and evaluation had not been assessed and projected in the Annual Plan for the year 2004-05.
The Government stated (November 2005) that detailed strategies were worked out in the Plan for 2005-06 for proper utilisation of funds and timely implementation of activities.
Prime Minster's Gramodaya Yojana, Prime Minster's Rozgar Yojana, Member of
Parliament Local Area Development, Member of Legislature Local Area Development, etc. Bellary and Chitradurga Bangalore (Urban), Bellary, Chitradurga and Kolar
The planning process suffered from a number of deficiencies

Chapter III – Performance reviews
99
3.5.8 Project implementation
Deficiencies in key interventions are mentioned below:
3.5.8.1 Coverage of children under SSA
The SSA aimed at having all children in school/EGS Centre/alternative school/‘back to school’ camp, by 2005. At the commencement of SSA (2001), the State had 94.79 lakh children of the age group 6-14 of which, 10.53 lakh children were out of school and as of March 2005, 1.60 lakh children comprising girls and boys equally were still out of school. The Government without assigning reasons for not achieving the objectives, replied (November 2005) that 1.49 lakh children had since joined schools. Thus, 11,000 children were still out of school and the project aim was not accomplished as at the end of 2005. Further, the reported figure of 11,000 children remaining out of school did not take into account the dropout factor and no year-wise targets were fixed for adequate coverage.
3.5.8.2 High dropout rate
One of the objectives of SSA was universal retention by 2010. The dropout rate at the primary level at the end of March 2005 for the State as a whole was 7.89 per cent for both boys and girls. It was marginally higher at 7.98 per cent among boys and it was 7.78 per cent among girls. While the highest dropout rate of 20.94 per cent was in Gulbarga, it was more than the State average in nearly 50 per cent of the districts (13) in the State. In four out of six test- checked districts, the dropout rate was higher than that of the State average (Appendix 3.9).
At the upper primary level, the dropout rate at the end of March 2005, for the State as a whole was 24.68 per cent. The dropout rate of boys was slightly higher at 24.78 per cent than the dropout rate for girls at 24.59 per cent. Gulbarga district had the highest dropout rate of 44.85 per cent and 12 districts had higher dropout rates than the State average (Appendix 3.9). Of the six test-checked districts, five districts had higher dropout rate than the State average. The trends in dropout rate during 2001-05 when SSA was being implemented were as indicated below:
Table 4: Trends in dropout rate
Year Primary Upper Primary (In per cent)
2001-02 11.18 32.93 2002-03 9.10 28.38 2003-04 9.10 Not available 2004-05 7.89 24.68
Decline in dropout rate from 2001-02 to 2004-05
3.29 8.25
The high percentage of dropouts in the upper primary level and the past trends pointed to the possibility of the objective of universal retention by 2010 remaining unachieved.
The project aim of having all children in schools by 2005 was not achieved
The possibility of achieving the objective of universal retention by 2010 was remote
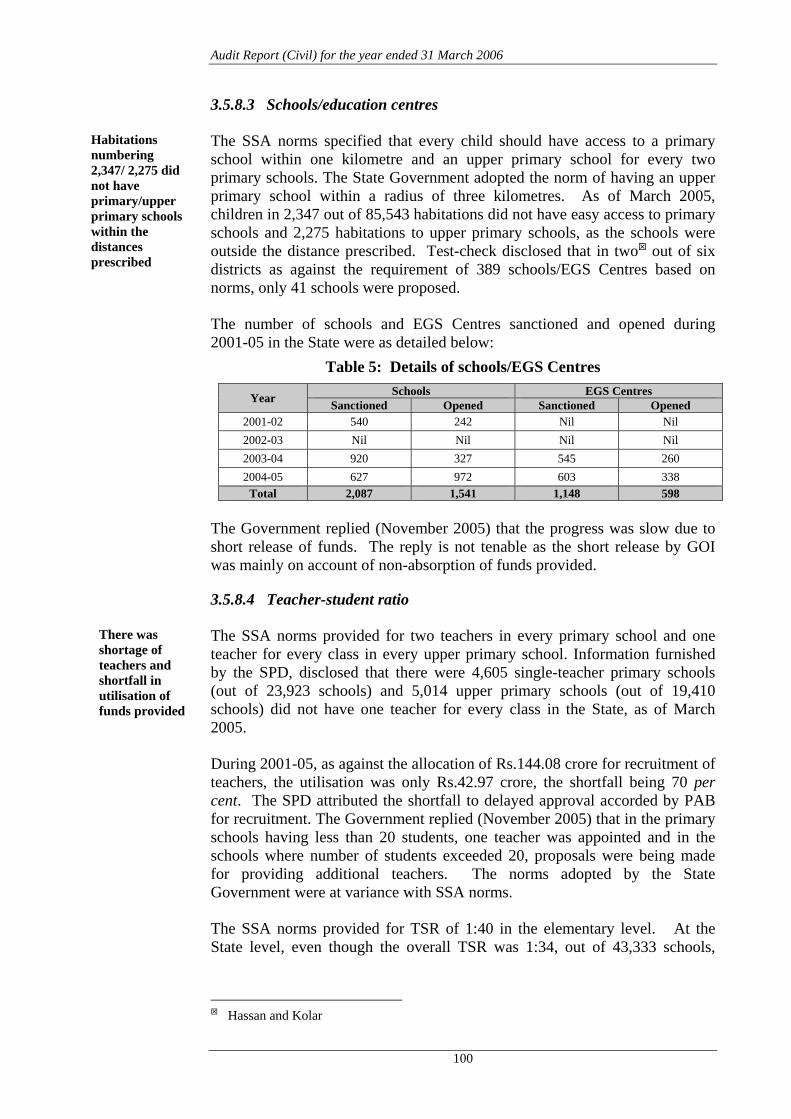
Audit Report (Civil) for the year ended 31 March 2006
100
3.5.8.3 Schools/education centres
The SSA norms specified that every child should have access to a primary school within one kilometre and an upper primary school for every two primary schools. The State Government adopted the norm of having an upper primary school within a radius of three kilometres. As of March 2005, children in 2,347 out of 85,543 habitations did not have easy access to primary schools and 2,275 habitations to upper primary schools, as the schools were outside the distance prescribed. Test-check disclosed that in two out of six districts as against the requirement of 389 schools/EGS Centres based on norms, only 41 schools were proposed.
The number of schools and EGS Centres sanctioned and opened during 2001-05 in the State were as detailed below:
Table 5: Details of schools/EGS Centres
Year Schools EGS Centres Sanctioned Opened Sanctioned Opened
2001-02 540 242 Nil Nil 2002-03 Nil Nil Nil Nil 2003-04 920 327 545 260 2004-05 627 972 603 338
Total 2,087 1,541 1,148 598
The Government replied (November 2005) that the progress was slow due to short release of funds. The reply is not tenable as the short release by GOI was mainly on account of non-absorption of funds provided.
3.5.8.4 Teacher-student ratio
The SSA norms provided for two teachers in every primary school and one teacher for every class in every upper primary school. Information furnished by the SPD, disclosed that there were 4,605 single-teacher primary schools (out of 23,923 schools) and 5,014 upper primary schools (out of 19,410 schools) did not have one teacher for every class in the State, as of March 2005.
During 2001-05, as against the allocation of Rs.144.08 crore for recruitment of teachers, the utilisation was only Rs.42.97 crore, the shortfall being 70 per cent. The SPD attributed the shortfall to delayed approval accorded by PAB for recruitment. The Government replied (November 2005) that in the primary schools having less than 20 students, one teacher was appointed and in the schools where number of students exceeded 20, proposals were being made for providing additional teachers. The norms adopted by the State Government were at variance with SSA norms.
The SSA norms provided for TSR of 1:40 in the elementary level. At the State level, even though the overall TSR was 1:34, out of 43,333 schools,
Hassan and Kolar
Habitations numbering 2,347/ 2,275 did not have primary/upper primary schools within the distances prescribed
There was shortage of teachers and shortfall in utilisation of funds provided

Chapter III – Performance reviews
101
8,536 schools did not have the prescribed ratio. In the test-checked districts
13 to 67 per cent of test-checked primary and upper primary schools did not have the required TSR.
The Government stated (November 2005) that action was being taken for rationalisation by shifting of teachers to the needy upper primary schools. The fact, however, remained that the SSA norms for this intervention were not fulfilled, as only 6,786 teachers were recruited during 2001-05 as against requirement of 7,967 teachers based on SSA norms.
3.5.8.5 Infrastructure facilities
The SSA norms provided for civil works like new buildings, toilets, drinking water facilities, electrification, etc., to improve facilities in the schools. A total sum of Rs.264.56 crore was allocated for this purpose during 2001-05 and utilisation thereagainst was Rs.221.99 crore. Basic infrastructure facilities were, however, lacking in many of the 43,333 Government schools in the State, as of March 2005, as detailed below:
Seven hundred and sixty eight schools (two per cent) did not have buildings.
Six thousand two hundred and thirty six schools (14 per cent) had only single rooms.
Nine thousand three hundred and eighty seven schools (22 per cent) did not have drinking water facility.
Nineteen thousand nine hundred and fifty four schools (46 per cent) did not have toilet facilities.
Twenty five thousand seven hundred and forty five schools (59 per cent) did not have electricity.
The Government replied (November 2005) that the gaps in infrastructure could not be filled in a short period due to restriction on ceiling of 33 per cent of allocations imposed on civil works and that convergences with other agencies were established and new proposals launched to provide certain facilities in Government schools. In view of the significant gaps in drinking water, toilet and electricity facilities, additional steps should be taken for providing them expeditiously by utilising the allocation in full.
District Total schools test-checked
Schools with teacher shortage Ratio range Percentage
Bangalore (Urban) 18 9 1:41 to 1:60 50 Belgaum 16 8 1:42 to 1:60 50 Bellary 12 8 1:44 to 1:123 67 Chitradurga 15 3 1:46 to 1:63 20 Hassan 15 2 1:44 to 1:69 13 Kolar 18 3 1:53 to 1:70 17
Many schools lacked basic facilities

Audit Report (Civil) for the year ended 31 March 2006
102
3.5.8.6 Capacity building
The norms of SSA envisaged in-service course for 20 days for a teacher every year and training for community leaders for a maximum of eight persons in a village for two days. Analysis of information made available disclosed that training up to 12 days was provided to teachers. Test-check in selected schools also disclosed that the teachers received training for six days. For the in-service teachers’ training during 2001-05, as against the total allocation of Rs.73.74 crore, utilisation was only Rs.21.70 crore, constituting 29 per cent of the allocation. The Government replied (November 2005) that in-service training could not be held during the entire year, as it would dislocate the normal functioning of schools. In view of availability of funds for in-service training, Government should find ways to provide in-service training to the envisaged level, without affecting the normal functioning of the schools.
Percentage of community leaders trained declined from 82 to 7 during 2002-03 to 2004-05. Under this component, as against the allocation of Rs.5.32 crore during 2001-05, only Rs.1.63 crore constituting 31 per cent of allocations were utilised. The Government stated (November 2005) that the community leaders trained showed a declining trend as the School Development and Monitoring Committees were being reconstituted. In view of favourable resource position for the component, Government should ensure that community leaders were trained as required.
Under SSA, a State Institute of Education, Management and Training (SIEMAT) meant for educational planning and capacity building was to be set up, with a grant up to Rs. three crore from GOI. The State Government did not even identify (July 2005) a site for the SIEMAT. The funds of Rs. one crore released by GOI during 2003-04 for the purpose were not utilised in that year, with the result, the allocation was reduced to Rs.50 lakh (September 2004). The Government replied (November 2005) that the proposal was still under consideration by the Ministry of Human Resources Development. The fact, however, remained that SIEMAT which was to provide inputs for planning and capacity building was yet to be set up, even five years after the launch of SSA.
3.5.8.7 Supply of textbooks
According to norms of SSA, free textbooks were to be supplied to all special focus group children, in case such a facility is not made available by the State Government. The SPD provided funds to the Director of Textbooks (DTB) who printed and supplied free textbooks for special focus group children in Government schools. Textbooks were not supplied free either under SSA or under any other scheme of Government, to about four lakh children in Government aided schools. Such a supply was not even planned by the SPD. There was a shortfall of 43 per cent in utilisation of funds allocated for supply of free textbooks in Government schools during 2001-05. This was mainly
Scheduled caste/tribe boys and all girls
Capacity building in teachers/ community leaders was grossly inadequate
Supply of free textbooks was denied to four lakh focus group children in Government aided schools. There was also delay in supply of free textbooks

Chapter III – Performance reviews
103
attributable to excess release of funds for supply of textbooks as mentioned in Table 3 (Paragraph 3.5.6). The Government agreed (November 2005) to consider supply of free textbooks to these children in 2006-07.
In 30 out of 77 test-checked Government schools, textbooks were supplied by the DTB after a delay of one to six months during 2004-05. Without furnishing reasons, the Government stated (November 2005) that books would be supplied on time in 2005-06.
3.5.8.8 Research activity
The research and evaluation component under SSA aimed at qualitative and quantitative inputs for planning, programme implementation and evaluation of programme interventions. Information provided by the SPD disclosed that no research activities were undertaken during 2001-03. The findings of 100 research projects for improving quality of teaching and completed (2003-05) at a cost of Rs.3.65 lakh, were not disseminated through publications to those involved in teaching. There was shortfall of 54 per cent in utilisation of funds during 2001-05, which was attributable to absence of research activities during 2001-03. The Government replied (November 2005) that while limited dissemination was made according to relevance, wider dissemination was planned. Thus, there was a need to increase research activity and its dissemination.
3.5.8.9 Coverage of children with special needs
Under the component of providing education to the children with special needs, the SSA envisaged assessment camps, development of training material, provision of aids and appliances, creation of community awareness, etc., to be consistent with the provisions of the Persons with Disabilities (Equal Opportunities, Protection of Rights and Full Participation) Act, 1995. During 2001-05, 48 per cent of funds (Rs.18.99 crore) provided for disabled children only were utilised.
The number of children with special needs identified in the State and receiving assistance declined from 33 per cent during 2002-03 to 13 per cent during 2004-05. Even though funds were available under this component, assistance was not provided during 2003-04.
Test-check of records in 94 schools disclosed that out of 144 children identified with special needs, only 46 (32 per cent) received assistance during 2001-05. The SPD did not furnish the details of aids and appliances supplied (August 2005). The Government stated (November 2005) that only those in need were given aids and appliances and the rest were provided academic support.
While there was no research activity during 2001-03, the limited activity in 2003-05 was not beneficially utilised
Only 13 per cent of the children identified as having special needs received assistance during 2004-05
Audit Report (Civil) for the year ended 31 March 2006
104
During 2003-04, 89 medical camps and during 2004-05, 146 medical camps were conducted in the State at block levels to identify children with special needs, as against 176 blocks in the State. Test-check disclosed that in 30 out of 94 schools test-checked, no medical camps were conducted during 2002-05. Without furnishing details and specific reasons for low coverage, Government stated (November 2005) that number of children identified had since been increased.
3.5.8.10 Access to computer education
The SSA provided Rs.15 lakh per district per annum for imparting computer education at the upper primary level under the component of innovative activities. Computer education was to be planned in such a manner that one or two schools in every cluster were covered so that the other schools in the cluster could avail the benefit. Out of 21.54 lakh children in 1,762 clusters having 19,410 upper primary schools in the State, only 0.55 lakh children in 190 schools constituting less than one per cent had access to computer education as at the end of 2004-05. The Government replied (November 2005) that the allocation of funds under this component of innovative activities was low and efforts were being made to cover more schools with available funds. Audit noticed that as against the total fund allocation of Rs.11.62 crore during 2001-05, Rs.8.44 crore only were utilised.
3.5.8.11 Involvement of Non-Governmental Organisations
The NGOs were not involved in the programme implementation in two of the six districts test-checked. In the other four districts, the involvement of NGOs was limited to running EGS centres and supply of aids and appliances to children with special needs, even though the SSA envisaged partnership with NGOs in capacity building, pedagogy, planning, research, etc.
At the State level, the SPD did not release any funds to NGOs during 2001-04. During 2004-05, Rs.1.25 crore was released to NGOs. Government, however, replied (November 2005) that NGOs were being involved in approved activities. The reply is not tenable in view of the position obtaining in the two test-checked districts.
3.5.9 Monitoring
Monitoring of implementation of SSA in the State was inadequate as the State level monitoring mechanism headed by the Chief Minister reviewed the progress of implementation only once (January 2002) in the last four years. Monitoring was limited to the area of utilisation of funds only. The internal audit wing set up in August 2004 had covered only 3 out of 27 districts in the State and the Internal Audit Reports were not placed before the EC, though required. Mechanism to ensure accountability was not functioning properly as Chitradurga and Hassan The science of teaching/instruction/training
Access to computer education was not available to majority of upper primary schools
Involvement of NGOs was not to the level envisaged
Monitoring was insufficient

Chapter III – Performance reviews
105
11 out of 94 schools test-checked did not maintain cash books and vouchers for expenditure, which were essential for financial monitoring. There was no provision for monitoring the academic achievements of children in the EMIS and planning process was not monitored at State level. Supervisory visits to the districts, though required, were not carried out. The block implementation committees in all three selected blocks in Kolar district did not review the implementation.
3.5.10 Conclusion
The implementing agencies could not absorb even the reduced level of funding. Planning for implementation of SSA was deficient as there were delays in initial basic surveys, which include household surveys, manpower assessment, training of community leaders, etc. One of the main objectives of SSA which was to have all children in schools/alternative schools by 2005 was not yet achieved even though the number of children out of school came down from 10.53 lakh out of 94.79 lakh children at the commencement of SSA to 1.60 lakh as of March 2005. Trends in drop out rate indicated possibility of universal retention by 2010 remaining unachieved. Capacity building among teachers and participating community leaders was inadequate. Coverage of special focus group children was not to the level envisaged. The existing monitoring mechanism was ineffective.
3.5.11 Recommendations
There is an immediate need for better fund management to ensure optimum utilisation of funds released.
The entire planning process needs to be strengthened to ensure timely submission of annual action plans.
Annual targets should be fixed for vital areas like number of new schools and teachers, infrastructure facilities and assistance to focus group children so that the overall target is achieved in time.
Special efforts should be made to enhance community participation and involvement of NGOs in programme implementation.
The existing monitoring mechanism needs to be strengthened to ensure effective implementation of the scheme.

Audit Report (Civil) for the year ended 31 March 2006
106
FINANCE DEPARTMENT
3.6 Computerisation of Treasuries in Karnataka-‘Khajane’
Highlights The project ‘Khajane’ was implemented with the aim of providing Drawing and Disbursing Officers, Controlling Officers and Chief Controlling Officers the details of expenditure for the purpose of reconciliation, restricting payments at the treasuries to budget allocations, ascertaining the Ways and Means position of Government, etc. The Project was implemented without the preparation of a comprehensive user requirement specification leading to deficiencies in Information Technology operations and controls. Codal provisions for awarding the contracts for establishing network connectivity were also not followed. Codal provisions were ignored while awarding the contract for establishing network connectivity.
(Paragraphs: 3.6.4.1 & 3.6.4.2)
The System was not able to take care of the relevant rules for adjustments of NDC bills against AC bills.
(Paragraph: 3.6.6.1)
The System was ineffective in ensuring correctness of payments made to the Housing Development Finance Corporation.
(Paragraph: 3.6.6.3)
The System either did not have proper input validations or these validations were bypassed resulting in violation of various financial and service rules.
(Paragraph: 3.6.7.2)
The System did not facilitate uploading of budget related data from the Finance Department Package.
(Paragraph: 3.6.8.3)
Inadequate security arrangement exposed the IT assets and data to risk of damage/misuse, while change control procedures were inadequate.
(Paragraphs: 3.6.9.1 & 3.6.9.2)
The back up data was not stored off-site which may lead to avoidable loss of data in case of crashes.
(Paragraph: 3.6.9.4)

Chapter III – Performance reviews
107
3.6.1 Introduction
The Department of Treasuries headed by the Director handles all cash transactions of the Government. The receipt and payment transactions are carried out through 31 District Treasuries and 184 Sub-treasuries spread over the State. On the recommendations of an Official Committee appointed in August 1997, the Government ordered (July 1999) implementation of the project ‘Khajane’ with the main objective of providing details of expenditure to Drawing and Disbursing Officers (DDOs)/Controlling Officers (COs)/Chief Controlling Officers (CCOs) for the purpose of reconciliation, facilitating Treasury Officers to restrict the payments to the budget allocations of DDOs/COs/CCOs, making available Treasury Transfer Receipts reports required by various Government departments, assisting dynamic reallocation of budget allotments and to ascertain the Ways and Means position of the Government on any day. The implementation of project commenced (January 2001) after a tripartite agreement was signed between the Director of Treasuries (DoT), Software Technology Parks of India (STPI) (Network Provider) and CMC Ltd (CMC) (System Provider). A Wide Area Network (WAN) was set up by STPI, at a cost of Rs.14.23 crore, using VSAT terminals at all the 216 locations to a central database server at Bangalore and recurring maintenance cost of Rs.2.90 crore per annum. CMC developed the application package at a cost of Rs.17.11 crore which included supply/installation of hardware, software and facilities required for running the application package at each location and maintenance of the systems for five years at a cost of Rs.6.28 crore. Rs.46.53 crore has so far been spent (September 2006) on acquisition, implementation and maintenance of the system.
3.6.2 Organisational set-up
The Department of Treasuries is headed by the Director of Treasuries. The Treasury Network Management Centre (TNMC) at Bangalore which controls the central server “KUBERA” and the hub of the KHAJANE-net is headed by a Deputy Director of Treasuries and 23 support staff. All District Treasuries, headed by District Treasury Officers (DTO), are provided with high-end server with UNIXWARE operating system and client systems ranging between 5 and 25. The sub-treasuries, headed by Sub-Treasury Officers (STO) render monthly accounts online to respective DTOs following up with vouchers and other documents.
3.6.3 Scope and methodology of audit
The audit was conducted to evaluate the efficiency and effectiveness of the system in achieving the stated objectives and to assess the adequacy of good practices of Information Technology (IT) governance along with controls built in to ensure data integrity, security of data, systems and other IT assets. A test-check of records maintained electronically and manually was conducted in

Audit Report (Civil) for the year ended 31 March 2006
108
the office of the DoT, TNMC, six24 District Treasuries and three25 Sub-treasuries. The records relating to treasury transactions in some of the offices of CCOs, COs, DDOs were also test-checked between October 2005 and February 2006. The sample data of the information contained in data tables received from TNMC in the form of an Export Dump was scrutinised using the generalised audit software – IDEA26 and SQL27. The audit findings are detailed in the succeeding paragraphs:
3.6.4 Project Management
3.6.4.1 Award of contracts for establishing network connectivity on limited tender basis
According to Karnataka Public Works Department (KPWD) Code, where the value of contract exceeded Rs.two crore, tenders were to be called for through advertisements in news papers. While the development and maintenance of the application package (cost: Rs.23 crore) was made after calling for bids from a limited number of firms, the work of establishing the WAN costing Rs.15 crore was entrusted to STPI on an on-cost basis without calling for tenders. Similarly, the work of cabling, electrification (Rs.1.22 crore) and providing services of security personnel was entrusted to STPI without availing the benefit of competitive rates.
The Department stated that STPI was a Government of India concern and that all the procurements had been done with the approval of the Committee formed for the purpose.
The fact remained that the Department did not avail the benefit of competitive rates by giving wide publicity in the news papers for larger participation of the intending bidders in the tendering process. The reply was also not tenable as STPI in turn hired the services of HCL-Comnet for setting up the network at a cost of Rs.12 crore and list of bidders for the work included companies which had participated in the tendering process for development of the application package.
3.6.4.2 Evaluation of bids
It was noticed that limited tenders were invited for development of the application package (including hardware and networking) out of the list of Total Solution Providers maintained by the Government. In view of the size and significance of the project, the Department could have obtained more competitive rates with wider publicity and by negotiating with the first two lowest bidders (HCL Info Systems and NIIT), instead of entrusting the work to CMC which was the third lowest bidder. Moreover, KPWD Code stipulated that in cases where recourse to invitation for fresh tenders could not be taken
24 Bangalore (Rural), Bangalore (Urban), State Huzur Treasury-Bangalore, Pension Payment
Treasury- Bangalore, Mandya & Tumkur 25, Doddaballapura, Hoskote and Magadi 26 Interactive Data Extraction and Analysis 27 Structured Query Language
Discrepancies in payments and award of contracts led to avoidable expenditure and deprived the department the advantage of competitive rates

Chapter III – Performance reviews
109
due to there being no prospects of getting lower favourable rates, negotiations had to be conducted by the competent authority, only with the lowest bidder. However, the rate of CMC was accepted without terms and conditions being agreed to. The offer was made at Rs.17.11 crore for the system development which included supply and installation of hardware (including local networking in each location), and training of 600 personnel in the usage of application software. No break up for various components of the system development was specified.
The Department stated that the financial evaluation of the bids was against one value quoted for all items to be supplied and hence break up was not incorporated. It further stated that as the original rate quoted by CMC and the rate at which signed by them were entirely different, they were given an opportunity to rework their break up which was approved by Government and payments were made as proposed by CMC.
It was noticed that while cost of uninterrupted power supply system (UPS) offered by HCL Info Systems (Lowest) was negotiated and brought down by Rupees one crore, after comparing with offers of NIIT and CMC, no negotiations were held with CMC. Consequently, payments were made at higher rates than those of HCL Info Systems (L1) resulting in extra payment of Rs.2.03 crore, as detailed below:
Table 1: Comparison of offers (In rupees)
Component Rate
quoted by HCL(L1)
Rate at which payment made
to CMC Difference Quantity Total
payment
District Server 2,39,972 2,89,720 49,748 30 14,92,440
SHT Server 3,85,997 4,63,561 77,564 1 77,564
Desktops 49,737 51,257 1,520 447 6,79,440
Dot-matrix printer 10,536 10,700 164 262 42,968
Application S/W 81,17,500 2,41,61,093 1,60,43,593 1 1,60,43,593
Networking 14,72,051 33,98,502 19,26,451 1 19,26,451
Grand total 2,02,62,456
It was also seen that under the tripartite agreement, 10 per cent of the contract value was to be paid only after successful pilot testing. Contrary to this, CMC was paid an advance of Rs.1.80 crore for purchase of hardware for pilot sites. The Department stated that the advance payment was in view of the good progress achieved.
It was further noticed that technical specifications as listed out in the tripartite agreement were at variance with those as per invitation to bid as specifications for UPS were not clear in the invitation to bid. Both HCL Info Systems and CMC had quoted the costlier Sealed Maintenance Free (SMF) batteries but in the tripartite agreement, it was changed to cheaper tubular batteries. Further, the bid document required supply of anti-virus software but it was not

Audit Report (Civil) for the year ended 31 March 2006
110
included in the agreement for which Rs.11 lakh were paid subsequently. The type of cabling for local networks was also not clearly spelt out in the invitation to bid and was changed to five times costlier rate subsequently.
Thus, there was an avoidable payment of Rs.2.14 crore and also unintended benefits to the vendor due to award of contract without negotiating on the rates for individual items; not insisting upon SMF batteries or obtaining discounts for supply of cheaper batteries; advance payment in contravention of the terms of the agreement; and change of specifications while executing the agreement.
3.6.4.3 Avoidable expenditure on additional functionalities
In 2003, CMC submitted a proposal for 25 additional activities and quoted Rs.39.09 lakh for their study, design and development. It was noticed that many of these activities were either already contemplated in the procedure manual issued to vendors or were discussed in the Software Requirement Specification (SRS) document which was proposed by CMC and approved as final before the pilot study. Had the SRS been finalised after pilot study, extra payment could have been avoided.
3.6.4.4 System maintenance
The contract value for Facility Management Services (FMS) payable to CMC was fixed at Rs.6.28 crore payable in 20 equal instalments of Rs.31.40 lakh at the end of each quarter. The maximum response and restoration time for the FMS was one day after the faults were reported. Penalty was to be calculated based on delay in response beyond the maximum limits mentioned and deducted from maintenance bills. As the quantum of delays was very high, the percentage deduction to be made worked out to almost 100 per cent. However, agreement restricted the penalty to five per cent only.
It was noticed that some of the problems relating to maintenance of software and hardware which kept recurring month after month were end of day problems, cheque printing problems, difficulties in the generation of reports and problems in closing of monthly accounts. The department stated that only unique problems have to be considered out of the total number of problems reported; problem reporting was not the major component of FMS; the vendor had been penalised wherever there were inordinate delays; and the help desk activity was badly affected due to high attrition rate during 2004-05.
The reply is not relevant since the problems reported affected the functioning of the system resulting in problems in closing of monthly accounts.
3.6.5 System Development
It was noticed that a structured system development approach was not adopted in executing the project as no project initiation document was prepared and no feasibility study was carried out by drawing up of a report indicating the
Delayed response time in clearing the faults indicated that the faults needed to be studied and appropriate action to be taken to address the root cause of the problems

Chapter III – Performance reviews
111
alternative solutions. A User Requirement Specification (URS) document was not brought out clearly defining the scope of the system, key features that should be included and reports to be generated. This resulted in a number of design deficiencies which adversely affected the functioning of the system (Paragraph 3.6.6).
The Department stated that when the project was conceived, use of IT in government departments was not much, and further that no standards were prescribed, no road maps were available and there were no precedents to follow. It added that ‘Khajane’ being a path-breaking project, not many of the standard practices were strictly followed and hence status documents like resources used, milestones achieved and road map, feasibility study, cost-benefit analysis were not done exactly according to the norms.
The reply is not acceptable, as the services of the experts were already available with the Department and moreover best practices for IT system acquisition and implementation were available and should have been referred to.
3.6.6 System Design
3.6.6.1 Improper development of the system for monitoring receipt of detailed contingent bills against abstract contingent bills
Test-check of the database of district treasuries for AC Bills drawn/NDC Bills submitted revealed that in three Treasuries NDC Bills were not submitted or the fact of submission not noted against AC Bills drawn by various DDOs during the period 2002-03 to 2005-06 (up to January 2006) in 3,128 cases involving Rs.517.50 crore.
Under the Manual of Contingent Expenditure, a DDO was permitted to draw only up to Rs.500 without special sanction of the controlling officer. An analysis of the database indicated that in 516 cases, the maximum amount was recorded as more than Rs.500, ranged from Rs.600 to Rs.25 lakh. This exposed the system to the risk of misuse and avoidable irregularities. The Department stated that data would be verified and necessary corrections carried out.
The NDC bills submitted to treasuries were not noted in many cases against the corresponding AC Bills drawn. Though objection was raised by the system for the previous bill irrespective of the fact whether submission of NDC bill was due or not, objections were being overruled and further AC bills passed. There was no provision for stoppage of further AC bills whenever NDC bill due was not submitted.
Thus, the system developed could not take care of the requirements of the Rules and Government Orders for effective monitoring of the submission of details of expenditure for amounts drawn on AC bills leading to non-accounting of moneys drawn from treasuries.
Non-inclusion of appropriate controls in the application system and lack of circular instructions to DDOs rendered huge sums drawn on AC bills without details of expenditure

Audit Report (Civil) for the year ended 31 March 2006
112
The Department stated that the software to cater to the needs of accepting NDC bills was under development and would be implemented from 2006-07.
3.6.6.2 Classification of transactions
Audit noticed a number of misclassifications which indicated the deficiencies in design and development of the package leading to inaccurate accounts and overstatement/understatement of receipts/expenditure.
A few examples are given below:
Though the data entry was made as ‘building expenses’, and ‘general expenses’, the reports printed for the period between July 2005 to November 2005, involving an amount of Rs.57.94 lakh in 25 cases, depicted the same as ‘other charges’ and ‘other office expenditure’. It was stated that the system discrepancy had since been rectified.
The commercial tax receipts remitted in banks other than State Bank of Mysore (SBM) were accounted for by a treasury on a single challan furnished by SBM to the treasury.
In nine cases involving Rs.215.82 crores, transactions under deposit accounts were classified under incorrect heads of account.
The data table of the classified accounts of a treasury showed that object head field was blank in 25,610 cases for the period from April 2004 to December 2005 involving an expenditure of Rs.254.72 crores. The absence of the detailed head to which these payments related, rendered the accounts already booked, inaccurate. The Department stated that in case of deposit transactions there would be no detailed heads. The reply is not tenable since all the cases cited were not deposit transactions but also included heads of account like land revenue, interest payments, pensions.
3.6.6.3 Non-generation of details required for Housing Development Finance Corporation (HDFC) payments
Payments made to HDFC relating to house building loans to Government servants during 2003-04, 2004-05 and 2005-06 were Rs.28.75 crore, Rs.22.26 crore and Rs.15.04 crore (up to November 2005) respectively. It was noticed that the system did not support generating a report for the total amount payable to HDFC every month detailing amounts due towards principal and interest, subsidy etc. As such, the demand raised by HDFC was paid without ensuring the correctness of the claim considering the rate of interest, type of loan, etc., that varied from year to year. The Department replied that, as all this exercise would not have resulted in complete elimination of manual incorporation in the ledgers, it was decided to get comprehensive software developed for the purpose of accounting HDFC deductions. The reply is not acceptable as the package did not support verification of the monthly demands of HDFC by correlating them with recoveries from salaries which were available in the system.
Absence of provision to support and determine dues of HDFC resulted in huge sums of money being paid unverified
Absence of key controls in the application package resulted in many misclassifications that made the system less dependable as also affected the true and fair nature of accounts

Chapter III – Performance reviews
113
3.6.6.4 Pension related module
Audit noticed multiple design deficiencies in the pension related module which are detailed as follows:
In the “Pension Module” pension field accepted entry of amounts without minimum and maximum limits. Negative figures were found in some cases for basic pension. Total pension amount did not match the break up details in a few cases. The commuted value could not be restricted to the prescribed limit of one-third of the pension. Many essential fields like sanction order number could be skipped as they were not mandatory. Gross service could be entered as ‘nil’ or 50 years. Net service values could not be separately entered. There was no provision for watching receipt of life certificate of social security pensioners.
The forwarding letter to the bank was not generated correctly by the system, as for example, the name of the Bank and branch did not appear; instead of the total commutation amount, the basic pension amount was shown; the symbol “<” appeared in place of reduced pension amount and the amount of family pension was not displayed.
Once a Pension Payment Order (PPO) was generated, changes to verify the mistakes in data entry in the pension module could not be carried out. Corrections were, therefore, made in manual records. In the alternative, the IDs were suspended/closed and fresh IDs created. As the suspended IDs could be revived, this exposed the system to the risk of misuse/irregularities. It was noticed that in one case, payments were made to the same person in two new PPO IDs. Although two Old Age Pension (OAP)-PPO IDs were suspended in a treasury, payments continued to be made. The Department stated that all such cases would be reviewed and excess amount, if any, would be recovered.
In a few cases enhanced family pension was continued to be paid even after due dates for restoration. In a few cases gross amounts did not tally with the break up values of payments, net amount and pay order amount did not tally, which indicated lack of appropriate controls which may lead to incorrect reports. The Department stated that the discrepancies would be looked into.
3.6.6.5 Other deficiencies
Specimen signatures of DDOs did not pop-up for compulsory check for authenticating bills presented for payment. It could be viewed only if the user chose to do so. Bills could be passed without such verification. An analysis of the table containing DDO details for each treasury revealed that a system-generated number was given to the signature of each DDO captured by scanning his specimen signature. It was found that instead of a unique number assigned for each DDO, there were 1,821 active records, which had the same GDDO code (00001). This indicated that there was a lacuna in the generation of GDDO codes. Similarly, there were 14,830 cases with a GDDO code of ‘99999’.
Lacunae in the system that may lead to risk of misuse

Audit Report (Civil) for the year ended 31 March 2006
114
3.6.7 Application control
Application controls are case specific and have a direct impact on the processing of individual transactions. These controls are used to provide assurance that all transactions are valid, authorised, complete and recorded. Audit noticed the following deficiencies in application controls.
3.6.7.1 Input control
To ensure that correct and relevant data is entered into the system to generate reliable output, a combination of controls over the input of data facilitated by proper validation checks in the system is essential. However, due to deficient input controls and insufficient validation checks, there were numerous instances of incorrect data being stored and processed by the system.
3.6.7.2 Ineffective validations provided
Validations that are provided to ensure compliance with financial and service rules, were not mandatory. Even if the user opened validation screen, options were to be ticked by exception and the user was not required to confirm each validation. Frequently occurring deficiencies in the bills could not be added by the user. As there was no compulsory sequence for various menus/screens to be navigated, various validations provided were ineffective.
The fields to record the dates of Government Order or the date of authorisation by the Accountant General (AG) for creating a DDO, accepted any future date as well. There were 1304 and 970 records of dates for Government orders and authorisation of the AG respectively that contained dates beyond the year 2050. Similarly, it was found that different designation descriptions were entered for the same DDO.
In one department, the head of the department addressed the Treasury Officers pointing out that the expenditure in district offices was wrongly shown as incurred by their Directorate at Bangalore. The treasury department replied to an audit query that misclassifications could be due to incorrect data provided by the DDOs. The reply is not tenable as the system should not have accepted bills against the head of account of the directorate from a district level officer.
There were instances where the detailed head-wise compiled accounts displayed zero in the amount column even though the related Abstract of Schedule of Payments indicated substantial sums as paid.
The inaccurate entries indicated lack of proper input validation controls or that controls in place could be bypassed. It also indicated that suitable monitoring mechanism was not in place to the review entries.
Lack of appropriate input controls rendered the system incomplete due to errors in data capture

Chapter III – Performance reviews
115
3.6.7.3 Data entry
It was noticed that during September 2003, receipts pertaining to Defence Department were booked twice by the State Bank of Mysore, Shivajinagar Branch, Bangalore, went undetected during the data capture at the treasury level resulting in an excess accounting of Rs.48,00,263. This was yet to be rectified in accounts and also necessary corrections to the database effected.
Modifications to mode of payment of pensions were not put through screens meant for the purpose but were being managed by suspending or closing the old IDs and opening new ones in their place. As the suspended IDs could also be revived, the procedure followed exposed the system to risk of irregularities as also the extent of modifications made could not be monitored.
The system did not support prompting incorrect entries made as deductions towards House Building Advances though it related the payments towards HDFC loans and vice versa. Similarly, incorrect entries of Motor Cycle Advances - principal and interest were not prompted by the system. Misclassification due to ineffective prompt by the system or lack of second level checks resulted in adverse balances under various loan heads of account, as in nine cases, misclassifications were observed involving Rs.8.78 lakh. The Department stated that the system could prevent misclassification into HDFC only and not the other way. The reply is not tenable as the system needed controls eliminating misclassifications of HDFC recoveries into HBA which resulted in adverse balances.
The above mentioned discrepancies indicated lack of proper input validations in the package and ineffective second level check of data entry with regard to the classification/capture of essential data. Action is to be taken to increase the awareness among the data entry operators and DDOs to facilitate capture of essential data and also to classify the transactions correctly to make the system more effective.
3.6.8 IT Operations
3.6.8.1 Generation of department-wise recovery particulars
Except SHT, Bangalore, none of the treasuries furnished department-wise abstract of provident fund recoveries duly tallying with overall totals of all sub-treasuries along with the figures of the district treasury. Further, in many cases, key information like full name, designation, relevant account number were either not captured in the system or ensured that they were available in the schedules at the time of passing the bills, indicating insufficient input controls and non-provision of an essential feature in the package.
Absence of important feature to generate department-wise recovery particulars
Lack of data capture controls led to many avoidable misclassifications and also affected the true and fair nature of accounts and MIS reports

Audit Report (Civil) for the year ended 31 March 2006
116
3.6.8.2 Deposit accounts module
Article 286A of Karnataka Financial Code requires that a Personal Deposit account created by debit to the Consolidated Fund should be closed at the end of each year and a fresh account opened with a nil balance in the succeeding year. The system did not have any provision for such closure of accounts.
In one treasury, the savings bank account sub-module did not work. Consequently, transactions of all such savings bank accounts were being manually processed and cheques written by hand. The lacuna in the system needs to be addressed to bring all transactions online.
Summary of transactions of a set of deposit accounts were reported to AG (A&E) through a plus and minus memorandum. The system could not, however, generate reports in respect of revenue deposits and lapsed deposits. The totals of the various columns therein were not depicted in the reports so generated. The reports would not be completely useful without the totals of each column. The lacunae made the system less user-friendly.
3.6.8.3 Inadequate controls in uploading budget allocations
Though the Finance Department (FD) had the connectivity to the network, the treasury package did not support data interchange with budget modules of FD package. A user-friendly procedure could have obviated manual intervention for conversion of data, which was currently not authenticated by any Officer from FD. The Department stated that the authentication would be obtained in future. Audit noticed that there were many cases of expenditure booked without budget provision indicating lack of key controls.
Other cases of discrepancies noticed are as follows:
The specimen signatures of the CCOs were not properly recorded in the files/ system. The letters intimating allotments were not signed by CCOs. Corrections to the data were carried out by Officers in TNMC but not got confirmed by from CCOs. Cuts and redistributions in allocation were carried out on ‘Problem Reports’, without any written documentation from CCOs. Database contained details of 23 officers in the DDO list of a department though they did not belong to that department. As the budget allocations were made by the head of the department among his DDOs, the system was exposed to risk of misuse of budget allocation by DDOs outside their department.
There was no second level check for this item of work that involved allocation of funds. The Department stated that the second level check would be introduced and action taken to avoid the discrepancy pointed out.
In respect of uploading of allocations to DDOs in the treasuries, the allocations were brought in floppies by the COs and the same was uploaded by making corrections wherever found necessary. However, the package did not support keeping an audit trail of changes made by persons
Lack of appropriate output controls rendered certain reports unreliable
Absence of certain controls in uploading the budget allocations exposed the system to risk of irregularities

Chapter III – Performance reviews
117
other than the competent authority. The uploading done in treasuries was also not being subjected to second check.
These discrepancies indicated lacunae in the procedures that exposed the system to risk of avoidable irregularities.
3.6.8.4 Maintenance of Local Masters
In the test-checked treasuries, the records from which the local masters were created were not made available. Database of pensioners existing prior to computerisation had not yet been completely created. Correctness and completeness of the data capture could not, therefore, be verified in audit. Non-availability of such records rendered rebuilding of masters difficult. It also affected the clarification of problems and settlement of claims.
3.6.9 General controls
General controls create the environment in which IT applications and related controls operate. If general controls are weak, they severely diminish the reliability of controls associated with individual IT applications i.e. application controls. Audit noticed a number of deficiencies in general controls which are detailed below:
3.6.9.1 Security of systems, data and other IT assets
Server room was not kept under lock and key in the test-checked treasuries. Line printers/ computer systems were installed in the server room and printing activities were carried on. No circular instructions regarding maintenance of server room were made available in the treasuries test-checked. A log book for monitoring the activities of server operations, its security, problems of facilities and speed of the network etc., was not maintained or was not up to date in the treasuries test-checked as required according to a circular from the Directorate.
There was no fire fighting equipment in/around the server room in many treasuries and the air conditioners were out of order in some locations. No systematic record was maintained regarding periodical maintenance/on call details in respect of hardware, V-SAT, UPS, Printers, etc. Protecting the server room and other IT assets against possible physical damage or unauthorised access needed to be considered and appropriate instructions issued.
No documents had been maintained at TNMC to indicate conducting of periodic and ongoing review of access profiles, unsuccessful log-ins etc.; fire, weather, electrical warning and alarm procedures; air conditioning, ventilation, humidity control procedures; security breach alarm process; security awareness and training programs for the TNMC as well as for the treasury organisation as a whole; need for periodical change in security service
Inadequate security arrangements exposed the system to risk of damage to IT assets and misuse of systems
Audit Report (Civil) for the year ended 31 March 2006
118
agencies; penetration test procedures and results; health, safety and environmental parameters for follow-up; staff facilities, rotates of shifts and appropriate holidays and vacation both for treasuries’ staff and the vendors’ staff; and environment aspects like procedure for disposal of e-waste. It could not be ascertained whether they were working at satisfactory levels. It was stated that these issues would be considered in consultation with the competent authorities.
In some of the treasuries test-checked, there was no mechanism to monitor the unsuccessful log-ins by unauthorised persons. Many users in various counters were leaving the system open and there was no mechanism for automatic log-off which rendered the system exposed to risk of unauthorised use. No written instructions were issued regarding change of passwords periodically and structure of passwords.
The System Administrator role was assigned to officials other than Treasury Officers in many cases. It was also observed that certain users were able to perform transactions in spite of their IDs being de-activated. There were instances where the same person worked as data entry operator, Assistant Treasury Officer, Treasury Officer and System Administrator while passing bills. Lack of clear segregation of duties and controls on user-IDs exposed the system to risk of irregularities. The Department stated that suitable instructions had been issued regarding assigning of role IDs and action was being taken to fix the bugs pointed out. No programmes to highlight the importance of security awareness had been arranged in any of the locations test-checked. Holding of such programmes to increase security awareness should be considered to avoid possible losses due to security lapses.
The receipts of IT assets were not recorded in the stock accounts as and when they were received under proper attestation. Only a printed account in a bound volume of registers maintained at TNMC was made available to audit. No account of IT assets in stock was maintained at the treasuries. Assets relating to network (Rs.13 crore) were not found to have been taken to stock. 402 desktops only were taken to stock against 624 purchased. Similarly, against 218 servers (each costing Rs.2.90 lakh) purchased, 216 were recorded in stock. There was no record of movement of equipment for repair etc., as no system of issue of gate passes was in practice. No record of annual verification of stock having been carried out in any of the years had been maintained. It was noticed that the line printers were out of order in some treasuries. Absence of proper mechanism to take the assets to stock and subjecting these to periodical physical verification exposed the assets to the risk of pilferage or misuse. It was stated that suitable instructions would be issued to all treasuries to carry out annual verification.
Improper maintenance of stock accounts could lead to pilferage/misuse of IT assets

Chapter III – Performance reviews
119
3.6.9.2 Change management controls
A number of changes to the ‘Khajane’ program had been carried out after it was installed in the year 2002. To minimise the likelihood of disruption, unauthorised alterations and errors getting into the application package, a management system which provided for the analysis, implementation and follow-up of all changes requested, was to be in place. However, no clear documents had been maintained in respect of request for change, specification of change, request to move source into test environment, completion of acceptance testing, request for compilation and move into production. Similarly, no documents were maintained to show that overall and specific security impact was determined and approved by a responsible designated officer of the Department.
The source code was not changed soon after the new tested program was replaced, even though copy of the source code was with the department. Regarding other issues, it was stated that suitable guidelines were issued (October 2006).
3.6.9.3 Inadequate training and supply of user manuals
There was no policy for training of employees on an ongoing basis taking into account uneven distribution of trained personnel due to transfer, retirement, etc. Only one training programme was conducted since the package was implemented three years ago. No refresher courses had been conducted. It was noticed that sufficient copies of user manuals were not available. The manuals prepared in the beginning were yet to be revised though new version of the application package had been released as also many new forms and changes have been brought about in the application package. Though the vendor had to supply the system administrator manuals, it has not been made available. Action needs to be taken to provide sufficient number of user-friendly updated manuals for improving the efficiency of operations. The Department also stated that appropriate recruitment and training were being considered for smooth running of the project.
3.6.9.4 Off-site storage of back up data
Back up of data was being taken at the end of each day in a weekly cycle and stored in the table-draw of a counter clerk in some of the test-checked treasuries. No instruction for storage of back up media, its location, off-site back up, etc., was available in the treasuries test-checked. Difficulties were faced as no back up was taken in one sub-treasury where there was a server crash. As per the back up policy furnished there was no off-site back up of TNMC data other than back up at Disaster Recovery Centre (DRC), Dharwad. In case of connectivity failures and crashes in TNMC, data would not be available for recovery.
The Department, however, stated that back up of TNMC data was kept at the Directorate. Further, even though back up was taken on DAT cartridges no
Lack of ongoing training system affected the efficiency of operations
Inadequate arrangements for back up could lead to avoidable loss of data and time in case of crashes
Lack of systematic change management controls could not bring out orderly documentation of changes to system

Audit Report (Civil) for the year ended 31 March 2006
120
mechanism was in place to record that the back up was actually taken and periodically tested independently for retrievability. Back up procedures needed to be reviewed for safe custody of the first copy in strong room/steel cupboards, considering storage of a second copy in off-site location as also a system for a regular check of the retrievability of the back up data.
3.6.9.5 No mechanism for internal audit of systems
No internal audit of IT Systems was being carried out periodically in any of the treasuries and TNMC. It was stated that this was being taken up. A continuous internal audit helps in proper maintenance of the systems, their efficiency and effectiveness and its security.
3.6.10 Conclusion
The process of acquisition of hardware and software for the ‘Khajane’ project was not done following the best practices which facilitate transparency and efficiency in such projects. The project was implemented without the preparation of a comprehensive URS document resulting in non-provision of some of the key features in the application software like a proper system for monitoring submission of NDC bills; adequate support for HDFC dues; and providing department-wise recovery particulars in respect of GPF, etc. The controls and validations provided could be skipped and hence were not fully effective. The environment in which the entire system was being run was not satisfactory as inadequate security of IT assets as also data was noticed.
3.6.11 Recommendations
Appropriate controls and validations should be introduced to take care of accurate data inputs and outputs.
System should support accounting of recoveries and repayments to HDFC.
Appropriate change control procedures have to be adopted to make the changes to the system more orderly and with proper authority.
The Government should come out with a comprehensive plan addressing the issue of security of IT assets which should be complemented by a proper disaster recovery plan to ensure continuity of operations in case of an adverse event.
3.6.12 The above points were referred to Government in September 2006; reply had not been received (October 2006).

Chapter III – Performance reviews
121
HORTICULTURE DEPARTMENT
3.7 Working of Horticultural Farms
3.7.1 Introduction
Horticultural farms and nurseries were established in the State with the objective of demonstration of the cultivation of economically important horticultural crops, development of places for introduction/acclimatisation and centres of propagation of planting material suitable to the requirement of the geographical area. There were 244 farms/nurseries (total area: 5,282.74 ha) under the control of the Government at the end of 2005-06. The working of the farms/nurseries is looked after by the Department of Horticulture (Department) headed by the Director under the overall supervision of the Principal Secretary to Government, Horticulture Department. It has a staff strength of 1,587 including Additional Directors, Joint Directors, Deputy Directors, Senior Assistant Directors and Assistant Horticultural Officers/Horticultural Assistants. The total expenditure on these farms incurred during 2001-06 was Rs.79.80 crore of which only Rs.20.31 crore (25 per cent) was on development and maintenance. The revenue earned was Rs.21.60 crore.
A test-check of the activities of 115 farms/nurseries, records of the Directorate and 14 out of 20 districts offices for the years 2001-02 to 2005-06 by Audit during February-April 2006 disclosed the following:
3.7.2 Lack of planning and thin spreading of resources
There was no farm policy in the Department. The Department had not fixed any norms for staff deployment in the farms. The total area covered by the 115 farms test-checked was 3,336 ha, of which 2,281 was developed as of April 2006. The total expenditure incurred by the Department during the years 2001-02 to 2005-06 on these farms/nurseries was Rs.46.10 crore. Of this, Rs.36.30 crore was incurred on salary of establishment and wages. Thus, only Rs.9.80 crore (21 per cent) were spent on development and maintenance (including on propagation) working out to an average of Rs.0.29 lakh per ha over the five-year period. The revenue realised from these farms during the said period was Rs.13.43 crore. Ten farms did not yield any revenue and eight farms produced revenue of Rs.0.38 lakh only. There was, therefore, no prioritisation for development of revenue yielding farms with reference to the area identified as fit for development, geographical features and availability of water. Instead, resources were spread too thin across all the farms. The excess staff in the farms and nurseries assessed in June 2004 was transferred to other Departments/Zilla Panchayats only in December 2005.
The Department stated (October 2006) that it had taken up an evaluation study (July 2004) through an external agency to identify feasible horticultural farms and prepared (February 2005) a farm policy which was awaiting Government’s approval.
Resources were spread thin across all the farms

Audit Report (Civil) for the year ended 31 March 2006
122
There was low yield of fruit crops even from trees in the economic bearing period. Remedial measures to overcome the effects of drought had not been taken by the Department
3.7.3 Low yield of fruit crops
The rules for disposal of crops in farms/nurseries are prescribed from time to time in Government Orders. The disposal of crops is generally done through tenders. The rules prescribe the optimum (average) net yield of the fruits per plant per season in respect of chikku, guava, mango and coconut. The actual yield is to be assessed, 30-35 days before their disposal, on the basis of selection of rows and trees at random. The quantum assessed is to be kept confidential and taken into account while accepting the highest bid.
It was noticed that in respect of 71 farms where chikku, guava and mango were raised, according to norms (last prescribed in October 2003), total yield to be obtained during the period 2001-06 was 40,245 tonnes. Against this, actual yield obtained as per records was only 5,084 tonnes (13 per cent). This resulted in potential shortfall of revenue of Rs.17.21 crore calculated on the basis of minimum rate fixed for sale for each category of crop in the respective years. It was further noticed that of the total of 1.07 lakh trees in these farms, the age of 92,775 trees was within their economic bearing period; only 14,637 guava trees had crossed that period.
The Director attributed (June 2006) the low yield of crops to drought situation in the State during 2001-04. However, audit analysis revealed that 20 farms in respect of chikku, nine in respect of guava and 11 in respect of mango had produced yield exceeding 40 per cent of the prescribed yield during this period. Despite good rainfall during 2004-05 and 2005-06 throughout the State, the yields compared to prescribed norm had not improved substantially. Remedial measures for improving irrigation facilities, replacement of unproductive plants by productive ones, keeping of bees to enhance production, etc., were not initiated (June 2006).
3.7.4 Conclusion
The Department did not have a farm policy, resultantly, no prioritisation for development of revenue yielding farms was made and resources were spread thin across the farms in the State. There was low yield of fruit crops even from trees which were in the age of economic bearing but suitable remedial measures were not taken to improve the yield and revenue realisation.
3.7.5 Recommendations Government should ensure the adoption and implementation of the farm
policy immediately. Package of practices should be adhered to in order to improve yield. Resources should be allocated to farms keeping in view their revenue
yielding potential.
3.7.6 The above points were referred to Government in August 2006; reply had not been received (October 2006).

CHAPTER IV
AUDIT OF TRANSACTIONS
Audit of transactions of the Departments of Government, their field formations as well as that of the autonomous bodies brought out several instances of lapses in management of resources and failures in the observance of the norms of regularity, propriety and economy. These have been presented in the succeeding paragraphs under broad objective heads.
4.1 Infructuous/Wasteful expenditure and overpayments
PUBLIC WORKS DEPARTMENT (COMMUNICATION AND BUILDINGS)
4.1.1 Wasteful expenditure on a road work Government failed to forestall the execution of improvement works in selected stretches of Bangalore-Nilgiri State Highway (SH 17) in Mandya district though the road was to be converted into a four-lane carriageway resulting in a wasteful expenditure of Rs.1.68 crore.
Mention on wasteful expenditure of Rs.61.39 lakh incurred on improvement works carried out from km 71.20 to 82.50 of State Highway 17 in Mandya district was made in paragraph 4.2.2 of the Report of the Comptroller and Auditor General of India for the year ended 31 March 2005 (Civil –Government of Karnataka). The wasteful expenditure was owing to the failure of Government to forestall execution of the improvement works as the road was slated for conversion into a four-lane carriageway by Karnataka Road Development Corporation Limited (KRDCL).
Further scrutiny (June/December 2005) of records of the Executive Engineer, Public Works Division, Mandya revealed that the improvement works on another stretch of the road from km 82.50 to 131 were also carried out (March 2003–January 2004) by the Division for improving its riding quality and enhancing its life by another 8-10 years. However, the existing concrete pavement and the underlying bituminous base course over a length of 28.50 kms on this stretch too, after handing over the road to KRDCL (February 2004) for conversion into four-lane carriageway, were removed (2005-06) in less than two years for improving its geometrics and carrying out necessary profile corrections. This rendered the expenditure of Rs.1.68 crore (Appendix 4.1) incurred on the improvement works wasteful.
Thus, failure of the Government to forestall the execution of improvement works to the existing road when it was being widened into a four-lane carriageway rendered further expenditure of Rs.1.68 crore incurred on improvement works wasteful.
The matter was referred to Government in May 2006; reply had not been received (October 2006).
123

Audit Report (Civil) for the year ended 31 March 2006
4.2 Avoidable/Extra/Unfruitful expenditure
FOREST, ENVIRONMENT AND ECOLOGY DEPARTMENT
4.2.1 Unfruitful expenditure on restoration of a lake Execution of work on the basis of defective project formulation for restoration of a polluted lake resulted in unfruitful expenditure of Rs.1.76 crore.
The State Government formulated (2002) a project under the National Lake Conservation Plan (estimated cost: Rs.5.54 crore) for cleaning of Bellandur lake in Bangalore South taluk which was polluted by inflow of industrial and other effluents causing rapid growth of weeds. The project involved removal of weed, oxygenation of the lake by installing compressors and diffusers and removal of pollutants in the lake by application of bio-products.
The project report did not envisage stoppage or diversion of sewage entering the lake. The project report considered that the maximum sewage entering the lake was 163 Million Litres per Day (MLD) of which only 80 MLD was being treated at the existing sewage treatment plant (STP) established by the Bangalore Water Supply and Sewerage Board (BWSSB) which was responsible for sewage disposal in the city and maintenance of the lake. This plant was, however, under repairs since 2003. Though repair and expansion of STP to 248 MLD was being undertaken by BWSSB, only 30 MLD plant was functional and the balance works were scheduled for completion only by November-December 2005. Therefore, large part of ingress of sewage into the lake was untreated.
Despite this, the Lake Development Authority, Bangalore (LDA) which took up implementation of the project, entrusted (January 2004) execution of the work to a contractor at the lowest tendered cost of Rs.3.62 crore for completion by January 2005 committing itself to the responsibility of stoppage and diversion of sewage entering into the lake in the agreement with the contractor. Failure of LDA to stop/divert the inflow promoted prolific growth of weeds in the lake. As a result, oxygenation of the lake proved inadequate and ineffective and rendered the lake non-conducive for bio-remedial treatment. The contractor complained (April 2005) against non-stoppage of sewage inflow and experts from Indian Institute of Science, Bangalore (IISc) attributed (May 2005) the failure of the project mainly to discharge of untreated sewage directly into the lake. LDA decided (April 2006) to suspend the project till stoppage of sewage inflow was achieved by suitable means and to go for arbitration regarding the contract.
Thus, project formulation was defective and entrustment of work on this basis was injudicious and rendered unfruitful the expenditure of Rs.1.76 crore (including Rs.42.50 lakh incurred on procurement of bio-products which were prone to losing potency with passage of time).
124

Chapter IV – Audit of transactions
The Government stated (July 2006) that a detailed plan was being worked out in consultation with IISc to stop the sewage inflow by diversion/constructed wetland method. However, LDA itself had admitted (July and September 2005) that diversion would pollute other bodies downstream and constructed wetlands had never been tried on such a large scale. Thus, hasty commencement of the work led to unfruitful expenditure of Rs.1.76 crore.
PUBLIC WORKS DEPARTMENT (PORTS AND INLAND WATER TRANSPORT)
4.2.2 Excess payment due to incorrect computation Incorrect computation of quantity of extra work executed resulted in excess payment of Rs.2.18 crore.
The work of construction of break water at the Karwar port for a length of 250 metres estimated to cost Rs.5.07 crore was administratively approved (April 1992) by the Government and accorded (November 1992) technical sanction by the Chief Engineer, Communication & Buildings (North), Dharwad. The work involved placing of 2.76 lakh metric tonne (MT) of stones of various categories based on the designs prepared by the Central Water Power and Research Station, Pune (CWPRS) during 1989. The work was awarded to a contractor in June 1993 at his tendered cost of Rs.7.16 crore and the work order was issued in August 1993.
Before commencement of the work, the bed levels between chainage 100 to 250 metres were found to be in the range of (-) 7 to (-) 8.95 metres, as against a maximum of (-) 7 metres adopted in the designs. The CWPRS, who inspected the site in January/February 1995, provided the final revised design in February 1998 leading to execution of additional quantities. Accordingly, the quantity of work to be executed was 3.87 lakh MT. As of June 2005, the quantity executed was 4.51 lakh MT for which Rs.18.04 crore had been paid.
Audit scrutiny revealed that during execution of the work, the contractor expressed difficulty in obtaining stones of the category of 10-12 MT and the Department permitted their substitution by stones of 7-10 MT category. Further, as against quantities to be executed using stones of both 2-3 MT and 2-4 MT categories, the contractor used stones of only 2-4 MT category.
The actual quantities executed exceeded the tendered quantities in respect of 7-10 MT and 2-4 MT categories. While regulating payment to the contractor, the Department computed extra quantities executed in respect of these categories without considering the quantities tendered which were to have been executed using stones of 10-12 MT and 2-3 MT categories. This resulted in excess payment of Rs.2.18 crore, as detailed below:
125
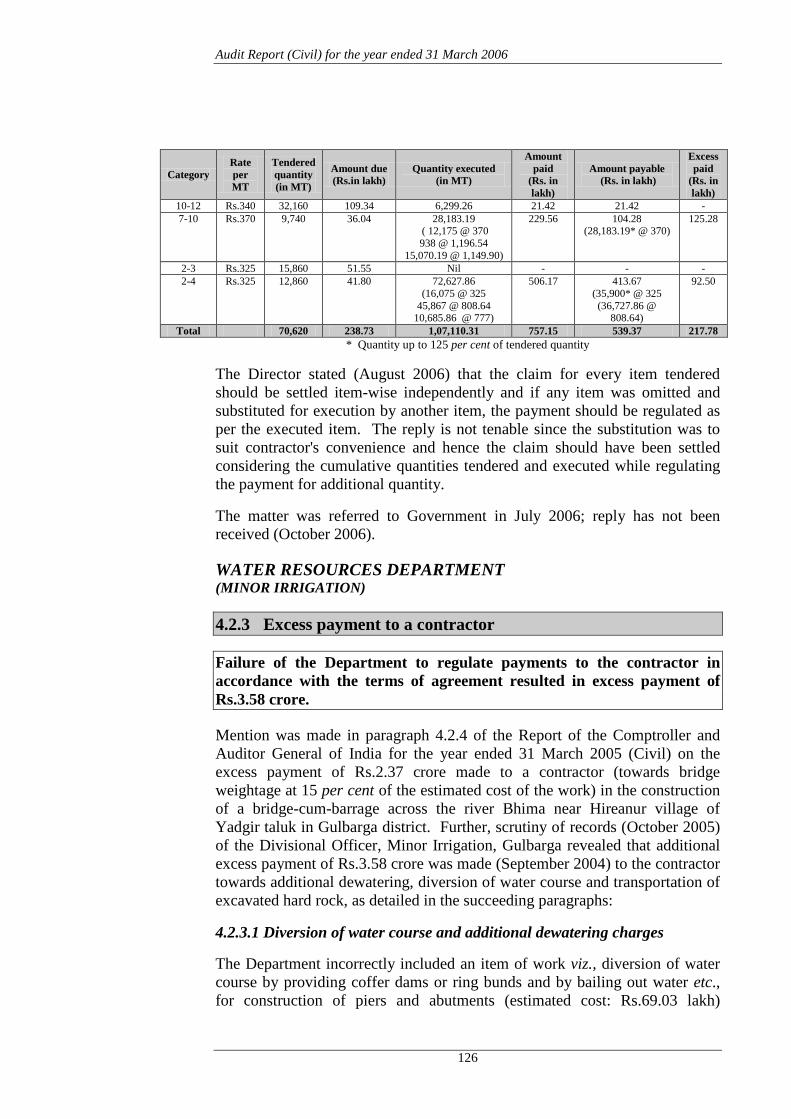
Audit Report (Civil) for the year ended 31 March 2006
Category Rate per MT
Tendered quantity (in MT)
Amount due (Rs.in lakh)
Quantity executed (in MT)
Amount paid
(Rs. in lakh)
Amount payable (Rs. in lakh)
Excess paid
(Rs. in lakh)
10-12 Rs.340 32,160 109.34 6,299.26 21.42 21.42 - 7-10 Rs.370 9,740 36.04 28,183.19
( 12,175 @ 370 938 @ 1,196.54
15,070.19 @ 1,149.90)
229.56
104.28 (28,183.19* @ 370)
125.28
2-3 Rs.325 15,860 51.55 Nil - - - 2-4 Rs.325 12,860 41.80 72,627.86
(16,075 @ 325 45,867 @ 808.64
10,685.86 @ 777)
506.17 413.67 (35,900* @ 325 (36,727.86 @
808.64)
92.50
Total 70,620 238.73 1,07,110.31 757.15 539.37 217.78 * Quantity up to 125 per cent of tendered quantity
The Director stated (August 2006) that the claim for every item tendered should be settled item-wise independently and if any item was omitted and substituted for execution by another item, the payment should be regulated as per the executed item. The reply is not tenable since the substitution was to suit contractor's convenience and hence the claim should have been settled considering the cumulative quantities tendered and executed while regulating the payment for additional quantity.
The matter was referred to Government in July 2006; reply has not been received (October 2006).
WATER RESOURCES DEPARTMENT (MINOR IRRIGATION)
4.2.3 Excess payment to a contractor Failure of the Department to regulate payments to the contractor in accordance with the terms of agreement resulted in excess payment of Rs.3.58 crore.
Mention was made in paragraph 4.2.4 of the Report of the Comptroller and Auditor General of India for the year ended 31 March 2005 (Civil) on the excess payment of Rs.2.37 crore made to a contractor (towards bridge weightage at 15 per cent of the estimated cost of the work) in the construction of a bridge-cum-barrage across the river Bhima near Hireanur village of Yadgir taluk in Gulbarga district. Further, scrutiny of records (October 2005) of the Divisional Officer, Minor Irrigation, Gulbarga revealed that additional excess payment of Rs.3.58 crore was made (September 2004) to the contractor towards additional dewatering, diversion of water course and transportation of excavated hard rock, as detailed in the succeeding paragraphs:
4.2.3.1 Diversion of water course and additional dewatering charges
The Department incorrectly included an item of work viz., diversion of water course by providing coffer dams or ring bunds and by bailing out water etc., for construction of piers and abutments (estimated cost: Rs.69.03 lakh)
126

Chapter IV – Audit of transactions
separately in the supplementary agreement for the work although the cost of providing such water diversion works stood included in the rates quoted by the contractor for excavation for piers and abutments as per the standard technical specifications contained in the agreement. The contractor was paid (September 2004) Rs.1.30 crore on this account.
Similarly, the Department paid (September 2004) Rs.1.32 crore towards additional dewatering done (2001-03) during the excavation work which too was not admissible under the agreement. The Chief Engineer, Minor Irrigation (North), Bijapur (CE) had in fact instructed (August 2002) the Divisional Officer, inter alia, to specifically incorporate a condition in the supplementary agreement to the effect that no extra payment shall be made to the contractor for dewatering, bailing out or pumping out water, etc. The supplementary agreement was, however, executed (July 2002) by the Divisional Officer without incorporating these conditions and even before the CE gave his approval to the draft agreement.
The extra contractual payments for dewatering and diversion of water course were justified by the Department on the ground that excess water had been allowed into the river (2001-03) through the irrigation canals of Upper Krishna Project (UKP) which flooded the construction site increasing the low water level at the site by one metre. The river gauging records of Central Water Commission for the period 2000-03, however, revealed that there was no observed discharge of water in the river during the period from February to May (working season) in any of these years. Further, the report of the Command Area Development Authority (CADA) authorities of UKP also indicated that no water had been released in the UKP canals during the period from April to May in any of these years. As such, the payment of Rs.2.62 crore towards dewatering and diversion of water course was, therefore, not justified. Government too, did not verify the facts while approving (October 2003) the additional financial implication on account of dewatering and diversion of water course.
4.2.3.2 Extra lead charges for conveyance of excavated hard rock
The contractor was paid Rs.80.90 lakh as extra lead charges for conveyance of the excavated hard rock (1.03 lakh cum) despite availability of dumping place within the initial lead of 50 metres as stipulated in the agreement. The contractor had not been instructed to transport the excavated hard rock beyond the initial lead. As such, there was no contractual obligation for the Department to pay extra lead charges.
4.2.3.3 Over-excavation and refilling charges
The contractor was also paid an amount of Rs.15.48 lakh as cost of over-excavation for foundation and refilling with concrete, although, as per the contractual obligations, the contractor was liable to refill the over-excavations with suitable approved material at his own cost. Failure of the Divisional Officer to enforce the terms of contract and regulate payments accordingly resulted in an excess payment of Rs.15.48 lakh to the contractor.
127

Audit Report (Civil) for the year ended 31 March 2006
The above points were referred to Government in April 2006; reply had not been received (October 2006).
4.2.4 Extra contractual payments The Department paid Rs.53.52 lakh to a contractor which was inadmissible as per terms of agreement.
The construction of a new minor irrigation tank (estimated cost: Rs.1.20 crore) near Ashtoor village in Bidar district was entrusted (June 2000) to a contractor for Rs.1.37 crore with a stipulation to complete it by December 2001. The work was completed in March 2002 at a cost of Rs.4.45 crore (November 2003). A revised estimate for Rs.4.60 crore submitted (April 2004) to Government was yet to be approved (April 2006).
Audit scrutiny (December 2005) of the records of the Executive Engineer, Minor Irrigation Division, Bidar revealed that the Department made the extra contractual payments of Rs.53.52 lakh to the contractor, as detailed below:
An amount of Rs.27.92 lakh was paid (March 2002) to the contractor towards extra lead charges for sand and rubble on the ground that these were brought from sources other than those specified in the agreement and involving longer distances. However, as per the agreement, the contractor was liable to bring suitable material at his own cost. The contractor in his representation (December 2000) had only requested the Department to identify new quarries/burrow areas for rubble and sand as the originally specified sources had submerged in standing waters. The Divisional Officer instead of following the terms of agreement paid extra lead charges of Rs.27.92 lakh to the contractor.
Further, Rs.11.43 lakh were paid (November 2002) to the contractor on the ground that water required for construction of bund and allied works was brought from a far off place involving additional distance as water was not available at the construction site. The payment was not admissible as the contractor was bound by the agreement to make alternate arrangements for water without any extra cost to Government.
The rates quoted by the contractor were inclusive of the cost of river diversion, diversion of water and cost of construction and removal of ramps for transportation of excavated material or for inspection of work or for any other reason. Accordingly, no separate payment was admissible on this account. The Department, however, paid (November 2002) Rs.14.17 lakh to the contractor for construction and removal of diversion bunds and ramps not in consonance with the terms of the agreement resulting in excess payment.
The amounts of Rs.11.43 lakh and Rs.14.17 lakh mentioned above were paid after entering into separate (18 and 24) piecework agreements with the same contractor. The works were split by the Divisional Officer to keep the value of work within his competence and avoid the tendering process.
128

Chapter IV – Audit of transactions
The above points were referred to Government in May and June 2006; reply had not been received (October 2006).
4.3 Idle investment/idle establishment/blockage of funds
PUBLIC WORKS DEPARTMENT (PORTS AND INLAND WATER TRANSPORT)
4.3.1 Non-execution of port development works Delay in relocation of families from the land acquired for port development resulted in unfruitful expenditure of Rs.97.20 lakh.
The Government acquired 113 acres and 33 guntas of land in Baithkol and Bada villages for development of the Karwar port. The port authorities took physical possession of the acquired land excepting 42 acres and two guntas where 354 families were living. For relocation of these families, 65 acres and 37 guntas of land at Shirwad, Sonarwad and Kodibag was acquired and developed by providing basic amenities at a cost of Rs.36.42 lakh. At the time of allotment of sites (December 1983) to the identified families, it was found that the number of families to be rehabilitated had risen to 586. The allottees including 26 families which had accepted alternative site did not vacate the land demanding rehabilitation of all the additional families. The State Government, therefore, accorded sanction (1995) for acquiring additional land of 18 acres and 6 guntas. Though the land was acquired at a cost of Rs.60.78 lakh including Rs.5 lakh paid during March 2002, the possession of only four acres and 17 guntas was obtained in March 2006 when the number of families was estimated to have increased to over 1,000. This rendered relocation of these families uncertain.
Delay in relocation of families postponed the use of the acquired land for development of the port, rendering the expenditure of Rs.97.20 lakh⊕ incurred for rehabilitation unfruitful.
The Director stated (August 2006) that the revenue authorities were being requested to hand over physical possession of the land to the Ports Department.
The matter was referred to Government in July 2006; reply had not been received (October 2006).
⊕ Provision of basic amenities - Rs.36.42 lakh, land acquisition (1995) - Rs.60.78 lakh including Rs.five lakh paid during March 2002
129

Audit Report (Civil) for the year ended 31 March 2006
TOURISM DEPARTMENT
4.3.2 Non-implementation of project despite the receipt of Central assistance
The State Government failed to set up tourist information kiosks for the past four years despite receiving Central assistance of Rs.27 lakh.
Under the scheme of Central financial assistance for information technology projects of the State, the State Government proposed (March 2002) to set up 25 Tourist Information Kiosks at an estimated cost of Rs.1.25 crore (State share: Rs.95 lakh, Central share: Rs.30 lakh) in places with major tourist potential. The Government of India released (March 2002) Rs.27 lakh stipulating that the project be completed by 15 May 2002. The State Government, after a delay of two and a half years, released (October 2004) the Central share of Rs.27 lakh to the Karnataka State Tourism Development Corporation (KSTDC), a State Government company for executing the work of setting up of a kiosk in Bangalore city. Audit scrutiny disclosed that the State Government did not release its share of Rs.95 lakh for the project and KSTDC had not completed even the solitary work entrusted to it so far (September 2006). This resulted in non-implementation of the project for the past four years despite receiving Central assistance, besides locking up of Government money of Rs.27 lakh with KSTDC for two years.
The matter was referred to Government in December 2005; reply had not been received (October 2006).
URBAN DEVELOPMENT DEPARTMENT
4.3.3 Non-completion of a sewage disposal project Karnataka Urban Water Supply and Drainage Board failed to construct a sewage treatment plant to supplement drainage works which resulted in non-achievement of the objective of prevention of pollution in the Kabini river rendering the expenditure of Rs.94.31 lakh unfruitful.
In order to prevent pollution of the river Kabini, the Government of India approved (July 1999) the execution of Interception and Diversion (I&D) works at Nanjangud under the National River Conservation Plan at a cost of Rs.68.32 lakh (Central share: Rs.67.37 lakh; State share: Rs.0.95 lakh). The work comprised construction of drains, sewer lines, wet well and pump house and laying of pipeline from wet well to Sewage Treatment Plant (STP) so as to convey the entire sewage of the town to the STP and utilising the treated water for irrigation. The I&D works were to be synchronised with the work of construction of STP as the sewage collected in the wet well was to be pumped to the STP. While major portion of the I&D works (estimated cost: Rs.40.21 lakh) was entrusted (March 1998) by the Karnataka Urban Water Supply and Drainage Board (Board) to a contractor at his tendered cost of Rs.52.98 lakh
130

Chapter IV – Audit of transactions
for completion by December 1999, the STP work was entrusted to another contractor only in June 2001 for completion by December 2001, though the site (cost: Rs.8.95 lakh) for it had been acquired in October 1999 and was free from human habitation then. The work on the STP was stopped soon after its commencement after incurring an expenditure of Rs.1.43 lakh, as residential buildings had sprung up in and around the area in the intervening period and the residents protested against construction of the STP.
As a result, the I&D works on which an expenditure of Rs.85.36 lakh was incurred upto 2003-04 were also stopped after construction of the wet well as an alternative site for STP had not been finalised. Owing to non-construction of STP, sewage continued to accumulate in the wet well for the past two years. However, under the Water (Prevention and Control of Pollution) Act, 1974 (Water Act) enacted by the Government of India, discharge of sewage into a stream or well or on land required the prior consent of the Pollution Control Board (PCB); compliance to this requirement of the Act was not on record in the Board.
Government contended (March 2006) that the expenditure of Rs.85.36 lakh incurred on I&D works had partially served the purpose in as much as the entire sewage of the town had been brought to the wet well point. This was not tenable as accumulation of sewage in the wet well was against the provisions of the Water Act. The Board also intimated (September 2006) that alternative site for STP had since been handed over (March 2006) by the TMC, Nanjangud and accordingly additional estimate for I&D works for Rs.93.30 lakh had since been submitted to the Government of India for approval.
Thus, non-commencement of work on the STP as soon as land was acquired in October 1999 coupled with inordinate delay of five years in acquiring alternative land resulted in expenditure of Rs.94.31 lakh on the project remaining unfruitful. Moreover, the objective of preventing pollution in the Kabini river and utilising the treated sewage for irrigation purposes was not achieved.
WATER RESOURCES DEPARTMENT (MINOR IRRIGATION)
4.3.4 Unproductive outlay on a minor irrigation tank Construction of a tank without synchronising its execution with its canal works resulted in unproductive outlay of Rs.5.51 crore for over six years on the tank work which too breached due to the failure of the Department in supervising its execution.
The construction of a minor irrigation tank (dam and allied works) at Kamatnoor in Hukkeri taluk of Belgaum district was entrusted (February 1997) to a private construction firm at a cost of Rs.two crore with stipulation to complete the work by May 1999. The tank water was to irrigate 1,482 acres of agricultural land. The tank work was completed by the firm in
131

Audit Report (Civil) for the year ended 31 March 2006
July 1999 and an expenditure of Rs.5.51 crore1 was incurred on it. The work on the right and the left bank canals had not been executed by the Department as the land required for these canals had not been acquired (October 2006).
Audit scrutiny (October 2005) of records of the Minor Irrigation Division, Belgaum revealed that the Department did not prepare a plan of action for synchronising the tank and canal works so that the investment fructified by providing irrigation to the needy population. Preliminary notification for acquiring only 3.11 acres land, against 14.77 acres required for the canal works, was issued (January 2002) which too was not actually acquired, reasons for which were not on record. Meanwhile, the tank bund completed in July 1999, on first filling itself in November 1999, breached for a length of about 100 metres and the Department referred (November 1999) the matter to Karnataka Engineering Research Station, Krishnarajasagara (KERS) for detailed investigation and recommendations to restore the bund. KERS in their reports (January 2000/July 2002) observed that the bund was constructed on weak foundation and the soil used for construction was highly unsuitable for the safety of the structure. It also suggested ascertaining the stability of the intact bund. Experts of Indian Institute of Science (IISc) also confirmed (June 2003) the substandard construction of the tank bund leading to its failure and suggested to strengthen the entire foundation strata below the breached portion and to re-lay the bund with good gravelly soil and to treat the foundation of the existing embankment to ensure its stability.
The Department while admitting its failure in supervising the execution of bund work by the firm, ordered (October 2004) a departmental enquiry which was on as of July 2006. The Department also withheld the payments due to the contractor (Rs.41.87 lakh) on account of his final bill (Rs.23.97 lakh) and security deposit (Rs.17.90 lakh) for his failures which included not using the required quality material in the bund work. The contractor filed a suit (November 2001) against the Department for the claims due to him which was disposed of (April 2002) in favour of the contractor. The Department filed an appeal (July 2005) against the judgement in the High Court which was pending as of July 2006.
Government stated (October 2006) that rectifying the defective portion of the bund and taking up of canal work was proposed at an estimated cost of Rs.1.20 crore for which loan assistance from NABARD was being sought. Meanwhile, the envisaged irrigation facilities to 1,482 acres of agricultural land could not be provided, rendering the expenditure of Rs.5.51 crore on the tank unfruitful.
1 This includes the cost of acquisition of land for the tank
132

Chapter IV – Audit of transactions
4.4 Violation of contractual obligation/undue favour to contractors
PUBLIC WORKS DEPARTMENT (COMMUNICATION AND BUILDINGS) & WATER RESOURCES DEPARTMENT (MINOR IRRIGATION)
4.4.1 Undue benefit to contractors Execution of scarcity relief works through contractors and issue of food grains to them at subsidised rates resulted in undue benefit of Rs.2.53 crore to contractors besides depriving direct employment to the drought affected agricultural labourers.
For providing relief to drought affected farmers and unemployed agricultural labourers through gainful employment, the Government issued guidelines (August 2002) for carrying out scarcity relief works by various Departments which included Public Works Department (PWD) and Water Resources Department. The guidelines, inter alia, provided for execution of budgeted and labour-intensive works as identified by the Department and approved by the respective Deputy Commissioners (DCs). The works were to be carried out departmentally by engaging labourers on muster rolls. Wage payments were to be in the form of food grains and cash in the ratio 75:25. The DCs were required to act as coordinating officers and release required food grains and cash to the divisional officers who in turn were to submit daily reports on progress of works. Utilisation certificates were to be submitted on completion of the works.
In the following two cases, the scarcity relief works were got executed through the contractors, in violation of the guidelines and issued food grains at concessional rates leading to undue benefit of Rs.2.53 crore to them. Besides, the objective of providing employment to drought affected agricultural labourers was also not achieved.
(a) Audit scrutiny (August 2004) of the records of three divisional offices showed that 399 road works (estimated cost: Rs.5.40 crore) were carried out (2002-04) as ‘scarcity relief works’ by entrusting them to contractors in contravention of the guidelines and directions issued by the DCs. Apart from cash payment of Rs.1.17 crore, the contractors were also issued 6,035 MT rice. The Department valued the rice at Rs.3.77 crore at the subsidised rate of Rs.6.25 per kg instead of at the market rate. Out of the total rice issued, 54.35 MT of rice was towards supply of construction material and hire charges of machinery such as power road rollers, tippers, etc., which did not involve engagement of labour. Execution of works through the contractors and valuation of the cost of rice at the subsidised rate of Rs.6.25 per kg besides being irregular resulted in undue benefit of Rs.1.66 crore to the contractors.
Gulbarga, Haveri and Yadgir Divisions of Public Works Department Based on the rate of rice at Rs.nine per kg applicable to Above Poverty Line (APL) families
133

Audit Report (Civil) for the year ended 31 March 2006
(b) Audit scrutiny (August 2004) of the records of two divisional offices revealed that 185 minor irrigation works (estimated cost: Rs.8.59 crore) were carried out (2002-04) as ‘scarcity relief works’ by entrusting them to contractors in contravention of the guidelines and directions issued by the DCs. The contractors were issued 3,156.32 MT rice, which was valued by the Department at Rs.1.97 crore by adopting the subsidised rate of Rs.6.25 per kg instead of at the market rate. The divisional officers stated (August 2004/ July 2005) that the rice was issued to the contractors at the instance of the respective DCs which was, however, not factual as the DCs had directed the divisional officers to execute the works departmentally. Execution of works through the contractors and issuing rice by adjusting its cost at subsidised rate of Rs.6.25 per kg resulted in undue benefit of at least Rs.86.80 lakh to the contractors.
The above points were referred to Government in June 2005; reply had not been received (October 2006).
4.5 Regularity issues and other topics HIGHER EDUCATION DEPARTMENT
4.5.1 Grant-in-aid to private degree colleges
Non-enforcement of rules pertaining to private colleges resulted in irregular and excess payments of Rs.65.76 crore. There were also instances of release of salary grants (Rs.1.07 crore) in respect of lecturers without having prescribed workload and to those engaged for teaching combinations of subjects not eligible for the grant (Rs.6.37 crore).
The Government gives grant-in-aid to colleges under private management with the objective of encouraging private enterprise in higher education. The payment of such grants was, till August 2003, subject to the rules in the Grant-in-aid Code for Collegiate Education (GIA Code). From August 2003, the Karnataka Educational Institutions (Collegiate Education) Rules, 2003 (Rules) framed under the Karnataka Education Act, 1983 (Act) govern the payment of such grants.
The administration of the Rules is vested in the Department of Collegiate Education headed by the Commissioner under the overall charge of the Principal Secretary to Government, Higher Education Department. The Commissioner is assisted by Director, Additional Director, Joint Directors, Deputy Directors, Assistant Directors and other staff.
As of March 2006, there were 300 degree colleges in receipt of grant-in-aid in the State. The total grants paid to them during the years 2001-02 to 2005-06 amounted to Rs.1,165.56 crore. A test-check of the records of the Secretariat, the Commissionerate, the Regional Offices and 154 colleges through local
Chitradurga and Haliyal Divisions of Minor Irrigation Department Considering the rate of rice at Rs.nine per kg applicable to APL families {(Rs.9 – Rs.6.25) x 3,156.32 x 1,000 = Rs.86.798 lakh)}
134

Chapter IV – Audit of transactions
visit and 146 colleges by obtaining data through correspondence for the years 2001-02 to 2005-06 was conducted during February 2006 to May 2006. The important points noticed are detailed below:
4.5.1.1 Release of grants to ineligible colleges
The GIA Code prescribed that no college except the colleges run by Scheduled Caste/Scheduled Tribe and Backward Classes would be eligible for grants during the first seven years. However, the Rules in force from August 2003 stipulated that all private educational institutions established or permitted to be established prior to 01 June 1987 and started functioning from the academic year 1987-88 and onwards shall not be eligible for the grant-in-aid. The Rules did not provide for relaxation in any case.
Twelve colleges (Dharwad-10, Gulbarga-1, Mysore-1) which were permitted in November 1986 to be established and started functioning from the academic year 1987-88 were admitted to the scheme from September 1990/November 1995. These colleges became ineligible for the grants from August 2003 after the rules came into force. However, the payment of grants to these colleges was continued, resulting in irregular payment of Rs.14.89 crore for the period from August 2003 to March 2006.
4.5.1.2 Release of grants to colleges without Certificate of Accreditation
The Rules stipulate that the payment of salary grant is subject to the college obtaining a B grade Certificate of Assessment and Accreditation once in every five years from the National Assessment and Accreditation Council (NAAC), an autonomous institution of the University Grants Commission (UGC) within the period specified by the Government from time to time. In June 2004, Government notified the dates by which degree colleges should obtain the certificate. Accordingly, for the colleges situated in urban areas excluding urban centres under the Hyderabad-Karnataka Area Development Board, the last date prescribed was 30 April 2005. • Six colleges in three regions (Bangalore-3, Mysore-2, Shimoga-1) had not
obtained the certificate even as of May 2006 and were thus, ineligible for the salary grants for 2005-06 and onwards till obtaining of the certificate. However, salary grants amounting to Rs.1.87 crore for the year 2005-06 were released to these colleges in violation of the Rules.
• Thirty-three colleges had obtained certificates during 2004-05 and 2005-06 with the grade being below ‘B’. These colleges were, therefore, ineligible for the salary grants after the receipt of the certificates. However, salary grants of Rs.23.72 crore were released to them during the two years, even after the receipt of the below 'B' grade certificates.
The release of grants in these cases was not in consonance with the Rules.
4.5.1.3 Excess payment of grants due to incorrect fixation of pay
In November 1999, Government revised the scales of pay of specified staff including teachers in the aided colleges to be in accordance with those of the
135

Audit Report (Civil) for the year ended 31 March 2006
UGC. The rules for fixation of pay provided that in respect of lecturers with five years service in the selection grade drawing pay at the sixth stage, viz., Rs.4,325 in the pre-revised scale, the pay would be fixed at Rs.14,940 in the revised scale on 01.01.1996. The benefit was also applicable to such lecturers drawing basic pay of Rs.4,325 as on 01.01.1996 but had not completed five years, as and when they completed five years in the grade. Scrutiny revealed that the benefit of fixation was extended to such lecturers who had not reached the stage of Rs.4,325 as on 1.1.1996. This resulted in excess payment of salary grants of Rs.3.83 crore (excluding allowances) during the period from January 1996 to February 2006 in respect of 369 lecturers.
4.5.1.4 Short remittance of tuition and laboratory fee
Prior to August 2003, in terms of the GIA Code, the Principals of aided colleges were authorised to collect tuition and laboratory fee from the students at rates not exceeding twice the standard rates∞. Out of the recovered amount, the fee at the standard rate was to be credited to a joint account with the Director and the fee collected in excess of the standard rate could be retained in the college account. However, with effect from August 2003, under the Rules, the entire tuition and laboratory fee collected was to be credited to the joint account. For breach of the conditions, the Commissioner/Government was empowered to stop the principal’s salary or salary grant to the college concerned.
Out of 272 colleges in respect of which data was made available, 55 colleges which collected fee at more than the standard rates during the years 2003-04 to 2005-06 remitted the entire fee collected into the joint accounts. The remaining 217 colleges which collected fee of Rs.33.58 crore during the same period remitted Rs.12.13 crore only and retained Rs.21.45 crore in violation of the Rules. Though, three⊗out of six Regional Directors had noticed the shortfall in remittances and had issued (between June 2004 and August 2006) instructions to the colleges to remit the balance, the colleges concerned had not complied with. Nevertheless, salary grants amounting to Rs.496.71 crore were released to these colleges in full during 2003-06. The release of grants without ensuring compliance with the Rules was irregular.
4.5.1.5 Release of grants in respect of lecturers without prescribed workload
According to the norms prescribed by the Department and reiterated by the Director in December 1995 for release of salary grant, there were to be a minimum of 15 students in the optional subjects and five students in languages in a college. Audit noticed that in five colleges, no work was assigned to eight lecturers for want of students for the respective subjects during 2001-06, as detailed below:
Bangalore:50, Dharwad:165, Gulbarga:49, Mangalore:47, Mysore:35, Shimoga:23 ∞ Standard rates are rates of tuition and laboratory fee prescribed for levy on students in
Government institutions ⊗ Bangalore, Gulbarga and Shimoga
136

Chapter IV – Audit of transactions
(Rupees in lakh)
Name of the Region College Subject Remarks
Number of
lecturers Amount
Gulbarga
Amareshwara Arts, Commerce and Science Degree College, Aurad
English
There were no students during the years 2001-02 to 2004-05.
01
-
Karnataka College, Bidar
English
The lecturer shown at Sl.No.1 was transferred to this college during 2005-06. No work was assigned to this lecturer. However, salary was claimed.
Nil 11.60
Shimoga
Maharaja Madakarinayaka First Grade College of Arts and Commerce, Chitradurga
Criminology
The workload was sufficient for only two lecturers. The workload for the third lecturer had been reflected as nil during the last five years (2001-02 to 2005-06).
01
12.26
SJM Arts, Commerce and Science College, Chitradurga
Geology There were no students for Geology and related combination (2001-02 to 2005-06)
05 69.24
Mysore JSS College, Mysore Sericulture
There were no students during the years 2001-02 to 2004-05
01 13.98
Total 08 107.08
Non-deployment of these lecturers to other needy aided colleges as was in vogue in the Department rendered the payment of salary grant of Rs.1.07 crore nugatory.
4.5.1.6 Release of grants in respect of teachers appointed in excess of norms
The Government, while adopting UGC scales of pay for the employees of the colleges ordered (November 1999) that the workload of a teacher in full employment should not be less than 40 hours a week, of which 16 hours for social-science teachers and 20 hours for science teachers should be the direct teaching hours. The remaining 24 and 20 hours respectively were to be engaged for assisting the students and for examination/ evaluation work. The norms also prescribed the number of hours to be worked for theory and practical classes. The Rules also stipulated that new subjects and combination of subjects permitted to be introduced with effect from 1 June 1987 were not eligible for grant-in-aid. Subjects forming part of an old combination approved earlier and introduced afresh as an independent subject and forming a new combination with such a subject were also not eligible for the grant. During test-check of records in selected colleges, Audit noticed that in four regions, the number of lecturers required for each subject in each college, as computed in audit with reference to the student strengths of combinations of subjects approved for the grant, workload prescribed per lecturer per week and actual workload to be performed for theory and practical classes worked out to 135
137

Audit Report (Civil) for the year ended 31 March 2006
to 137 in 17 colleges for the years 2001-02 to 2005-06. However, the number of lecturers on the rolls in these colleges and admitted for the purposes of salary grant were 209 to 223, as detailed below:
(Rupees in crore)
Region Number
of colleges
Number of subjects
Number of posts to be admitted
Number of posts
admitted
Excess posts
Salary paid to excess posts
Bangalore 08 07 91-93 137-143 46-50 3.09
Dharwad 03 07 24 38-41 14-17 1.89
Mysore 05 05 12 24 12 0.83
Shimoga 01 04 8 10-15 2-7 0.56
Total 17 23 135-137 209-223 74-86 6.37
The payment of salary grant of Rs.6.37 crore (excluding allowances) in respect of these ineligible posts was inadmissible.
4.5.1.7 Inspection and monitoring
The Joint Directors in charge of the six Regional Offices were responsible for audit of accounts and inspection of all the colleges as also for watching submission of periodical returns to verify fulfillment of the norms/criteria prescribed under the Code/Rules. However, no targets for inspection were fixed by the Commissioner. The Joint Directors did not point out the irregularities mentioned above during their inspection of the colleges. The Department persisted with payment of grants to 12 ineligible colleges and also made excess payment of grants to colleges as a result of incorrect pay fixation of lecturers and appointment of lecturers in excess of norms during 2001-06. Thus, inspection and monitoring of colleges by the Joint Directors was ineffective.
4.5.1.8 Recommendations
The Commissioner should arrange to review the position of number of students and assess the workload for lecturers in each college before commencement of the academic year to prevent irregular and excess payment of grants-in-aid.
The Commissioner should prescribe a check-list certifying eligibility of colleges for grants; production of accreditation certificates and compliance with Rules for operation of joint account before releasing the grants and fix responsibility at each level for release of the grant.
The above points were referred to Government in July 2006; reply had not been received (October 2006).
Bangalore, Dharwad, Gulbarga, Mangalore, Mysore and Shimoga at the respective University headquarters
138
Chapter IV – Audit of transactions
FINANCE DEPARTMENT
4.5.2 Inspection of Treasuries
Treasuries and Sub-treasuries in Karnataka are under the administrative control of Director of Treasuries, Bangalore. All district treasuries (30), sub-treasuries (185) and stamp depot were inspected by the Accountant General (Accounts & Entitlement) during 2005-06. The following major irregularities and control failures were noticed during the inspection.
4.5.2.1 Excess payment of family pension
The Karnataka Government Servants (Family Pension) Rules, 1964 provide that when a Government servant dies while in service, his/her family is entitled to family pension at double the normal rate or 50 per cent of the pay last drawn by the deceased Government servant whichever is less, for a period of seven years from the date following the date of death or till the date on which the Government servant would have attained the age of sixty-five years had he/she remained alive, whichever is earlier.
In 629 cases relating to 28 district treasuries, public sector banks made payment of family pension at enhanced rates beyond the period indicated in the Pension Payment Orders issued by the Accountant General (A&E) resulting in excess payment of Rs.1.19 crore (Appendix 4.2).
Despite being pointed out during earlier inspections, banks continued to pay family pension at higher rate in 208 cases relating to 23 treasuries resulting in further excess payment of Rs.40 lakh (Appendix 4.3).
4.5.2.2 Non-receipt of paid vouchers and recovery schedules of General Provident Fund
Paid vouchers in support of withdrawals from General Provident Fund (GPF) for Rs.24 lakh (22 cases) were not received along with the accounts sent by 11 treasuries during 2005-06 (Appendix 4.4). The omission might lead to non-accountal of the withdrawals and resultant overpayments at the time of final settlement of the accounts of the subscribers. The matter needs urgent corrective action.
Further, recovery schedules of GPF subscriptions by Government servants for Rs.58 lakh (336 cases) did not accompany the vouchers sent by 24 treasuries during 2005-06 (Appendix 4.5). This resulted in large number of missing credits in the accounts of individual subscribers, besides delay in finalisation of claims.
139

Audit Report (Civil) for the year ended 31 March 2006
4.5.3 Abstract Contingent Bills
4.5.3.1 Introduction
The Manual of Contingent Expenditure, 1958 (Manual) permitted Drawing and Disbursing Officers (DDOs) to draw contingent charges required for immediate disbursement on Abstract Contingent (AC) bills subject to rendering detailed bills to their Controlling Officers for countersignature and onward transmission to the Accountant General (Accounts and Entitlement) (AG-A&E). Controlling Officers should ensure that no amounts are drawn from the treasury unless required for immediate disbursement.
Audit conducted review of 5,557 AC bills covering Rs.37.95 crore drawn during 2001-2006 by 31 DDOs of four♣ departments in 10♠ districts during April–June 2006. Important points noticed are brought out in the succeeding paragraphs.
4.5.3.2 Non- submission/delayed submission of detailed bills
According to Rule 37(3) of the Manual, DDOs are required to send detailed bills in respect of AC bills drawn by them to their Controlling Officers before the closure of the first week of the following month in which AC bills are drawn for onward transmission to AG (A&E) by the fifteenth of the same month. Further, DDOs are also required under Rule 36(vi) to enclose with their salary bills a certificate issued by their Controlling Officers to the effect that detailed bills for all amounts of AC bills drawn prior to the current month have been rendered.
As of July 2006, 12 of the 31 DDOs test-checked in audit had not submitted detailed bills for Rs.11.08 crore drawn on 549 AC bills to their controlling officers, as detailed below:
(Rupees in crore)
Department Number of DDOs
Number of AC
bills Amount Drawn between Reasons for pendency
Watershed Development
06 495 4.92 October 2005 and March 2006
Non-receipt of sub-vouchers from field officers
Sericulture 03 46 0.43 August 2005 and March 2006
Medical & Public Health
02 04 5.12 March 2001 and March 2006
Delay in importing/ installation and commissioning of medical equipment
Transport 01 04 0.61 September 2002 and March 2005
Non-completion of works relating to computerisation of Regional Transport Offices
Total 12 549 11.08
♣ Medical & Public Health, Sericulture, Transport and Watershed Development ♠ Bangalore (R), Bangalore (U), Bidar, Davanagere, Dharwad, Gadag, Hassan, Haveri,
Karwar and Mandya
140

Chapter IV – Audit of transactions
Non-rendition of detailed accounts for advances drawn on AC bills is fraught with the risk of possible fraud/misappropriation. Nevertheless, in all these cases, Controlling Officers disregarding the system of internal control issued the certificate of submission of detailed contingent bills by the DDOs as a matter of routine.
Detailed bills submitted by five DDOs for Rs.0.92 crore drawn on 129 AC bills were pending with Controlling Officers without being forwarded to the AG (A&E), as detailed below:
(Rupees in crore)
Department Number of DDOs
Number of AC bills Amount Submitted
between Reasons for pendency
Watershed Development
01 63 0.30 October 2005 and January
2006 Delay in compliance by the DDOs to the objections raised by the Controlling Officers
Sericulture 03 60 0.60 October 2005 and April
2006
Medical & Public Health
01 06 0.02 May 2006
Total 05 129 0.92
Further, delay upto one year in forwarding detailed bills for Rs.43.25 crore drawn on 4,550 AC bills to the AG (A&E) by 28 DDOs of the test-checked departments were noticed, as detailed below:
(Rupees in crore)
Delay upto Number of AC bills Amount
One month 3,288 35.92 Six months 1,153 5.89 One year 109 1.44
Total 4,550 43.25
The delay was due to drawal of funds far in advance of requirement and in many cases to avoid lapse of budget grants.
4.5.3.3 Non-observance of procedures by Controlling Officers and Treasury Officers
Based on observations in earlier Audit Reports, the State Government, for streamlining the procedure of drawal of AC bills and their settlement, directed (September 2004) the Controlling Officers to route all detailed bills through treasuries to enable the latter to enforce the submission of detailed bills by not honouring further AC bills till the clearance of all outstanding AC bills. The treasuries were also required to build up a database of AC bills and their settlement and forward monthly/quarterly reports thereon to the Finance
Deputy Directors of Sericulture–Attibele, K.R.Pet, Magadi, Development Officer of District Watershed Development–Dharwad, District Medical Officer–Mandya and Commissioner for Transport - Bangalore
141

Audit Report (Civil) for the year ended 31 March 2006
Department. Audit scrutiny revealed that these directions were not followed in the test-checked districts, as detailed below:
Detailed bills for Rs.7.66 crore drawn on 630 AC bills by 11 DDOs between October 2004 and March 2006 were not routed through respective treasuries. Instead, Controlling Officers forwarded these bills after countersignature directly to the AG (A&E), as detailed below: (Rupees in crore)
Department Number of DDOs
Detailed bills not routed through treasuries
Number Amount
Watershed Development 5 426 2.33
Sericulture 5 203 1.83
Medical & Public Health 1 1 3.50
Total 11 630 7.66
Treasury Officers♣ in violation of the procedure honoured 379 AC bills for Rs.2.58 crore drawn between November 2004 and March 2006 by six DDOs though 64 AC bills amounting to Rs.1.02 crore drawn by them earlier were outstanding for settlement.
Treasuries also did not build up the database of AC bills and their settlement, nor did they furnish monthly/quarterly reports to the Finance Department.
4.5.3.4 Drawal of AC bills for amounts in excess of the limit prescribed
DDOs were required to obtain permission of the Finance Department for drawal of AC bills for amounts exceeding Rupees one lakh. In departments of Medical & Public Health, two DDOs, however, drew Rs.0.34 crore on three AC bills, each bill exceeding Rupees one lakh without permission of the Finance Department. Treasury Officers in clear violation of the instructions of the Finance Department also passed the bills.
One DDO of the Sericulture Department drew Rs.1.98 crore on 199 AC bills by splitting bills to avoid recourse to the Finance Department for permission.
4.5.3.5 Drawal of funds to avoid lapse of grants
As funds for Soil Conservation Works under Rural Infrastructure Development Fund (RIDF) and National Watershed Development Project for Rainfed Areas (NWDPRA) schemes were released at the end of the financial year, the Commissioner, Watershed Development Department, requested to permit DDOs to draw upto Rupees one lakh on each AC bill to facilitate speedy execution of works. The Finance Department, however, permitted drawal of funds upto Rupees five lakh on each AC bill. Seven DDOs drew Rs.4.16 crore on 364 AC bills in March 2006. However, detailed bills
♣ Bangalore (Urban), Bangalore (Rural), Bidar, Dharwad, Hassan and Mandya
142

Chapter IV – Audit of transactions
therefor had not been submitted so far (July 2006). Thus, the facility of drawal upto Rupees five lakh on an AC bill extended to the department was to avoid lapse of budget grants.
4.5.4 Personal Deposit Accounts
4.5.4.1 Introduction
The Karnataka Financial Code provides for opening of Personal Deposit (PD) Accounts with permission from Government in cases where the ordinary system of accounting is not suitable for transactions. PD Accounts created by debit to Consolidated Fund of the State should be closed at the end of the financial year. Administrators of the accounts should intimate the Treasury Officer, the balance to be transferred to the Consolidated Fund. For continuation of PD Accounts beyond the period of currency, administrators are required to seek the permission of the Finance Department. Periodical reconciliation of PD Accounts with treasury accounts is the responsibility of the administrators concerned. Fifty PD Accounts in 11 districts with an aggregate balance of Rs.30.17 crore as of March 2006 were inoperative for periods ranging from one year to three years.
4.5.4.2 Funds kept in PD Accounts
Deposits, withdrawals and balances in PD Accounts during the period 2003-06 were as detailed below:
(Rupees in crore)
Year Opening balance Receipts/Deposits Withdrawals Closing balance
2003-04 365.10 1,034.10 996.79 402.41
2004-05 402.41 1,081.50 1,099.01 384.90
2005-06 384.90 2,034.03 1,916.30 502.63
Review of 20 PD Accounts operated by 12 administrators of seven departments in six districts during 2003-06 was conducted during February-June 2006. The important points noticed are brought out in the succeeding paragraphs.
4.5.4.3 Unspent balances in PD Accounts
The balances held in the PD Accounts of 12 administrators were Rs.172.77 crore at the end of 2005-06 as shown in Appendix 4.6.
The administrators stated that the Finance Department was requested (between April and September 2006) for continuation of accounts during 2006-07 as the balance amounts were required for implementation of various ongoing schemes and completion of works in progress. Response of the Finance Department had not been communicated (October 2006).
143

Audit Report (Civil) for the year ended 31 March 2006
4.5.4.4 Reconciliation of balances
Non-reconciliation of balances by 12 administrators was noticed in respect of 19 PD Accounts (Appendix 4.7). There was a difference of (-) Rs.75.00 crore in 18 PD Accounts and (+) Rs.0.38 crore in one PD Account as of March 2006 which remained unreconciled.
4.5.4.5 Utilisation Certificate furnished for unspent Central grant held in PD Account
The Central Government grant of Rs.5.59 crore released in September 2004 for construction of student hostels credited to the PD Account of the Commissioner for Social Welfare remained unutilised as of March 2006. The Commissioner, however, had already furnished the Utilisation Certificates to the Government of India in December 2005.
4.5.4.6 Mixing of funds in PD Accounts
The Commissioner of Food & Civil Supplies credited Rs.3.73 crore (March 2006) for printing of yellow ration cards to the PD Account opened for transactions relating to sums received towards differential cost of food grains from Food Corporation of India and payments made to wholesale dealers.
Security and earnest money deposits aggregating Rs.1.02 crore received from suppliers by the Commissioner for Health & Family Welfare Services (Rs.0.92 crore) and the Deputy Commissioner, Mangalore (Rs.0.10 crore) classifiable under the minor heads ‘103’ and ‘111’ below the major head 8443-Civil Deposits were credited to the PD Accounts opened for operation of funds released for Government schemes.
4.5.4.7 Unauthorised operation of PD Account
Prior to the establishment of the Hyderabad Karnataka Area Development Board (HKADB), funds released by the Government for Hyderabad-Karnataka area development were kept in the PD Account of the erstwhile Divisional Commissioner, Gulbarga. After formation of HKADB, the Government did not permit operation of PD Account; instead ordered (June 1996) operation of deposit account under the head ‘8449-120’ for transactions of HKADB. However, contrary to Government order, District Treasury Officers, Gulbarga, Bidar, Raichur and Bellary, continued to allow HKADB to operate the PD Account of erstwhile Divisional Commissioner, Gulbarga.
The matter was referred to Government in August 2006; reply had not been received (October 2006).
144

Chapter IV – Audit of transactions
REVENUE DEPARTMENT
4.5.5 Diversion of calamity relief funds Deputy Commissioner, Chickmagalur diverted Rs.44.50 lakh from the Calamity Relief Fund to 21 non-calamity related works.
Expenditure from the Calamity Relief Fund (CRF) is required to be incurred in accordance with the norms in respect of items specified by the State Government from time to time. The norms and the list of items were revised in March 2002 and July 2003 on the basis of recommendations of the Eleventh Finance Commission. The list of items specified therein included ‘repair/restoration of immediate nature of the damaged infrastructure relating to communication, power, public health, drinking water supply, primary education and community-owned assets in the social sector’.
Audit noticed (December 2004) that the Deputy Commissioner, Chickmagalur sanctioned implementation of 21 works involving expenditure of Rs.44.50 lakh from the CRF between February 2003 and May 2004. These works were not related to repair/ restoration of damaged infrastructure caused by calamity. The works included improvements to a college building, construction of office building, temple, etc. The total expenditure of Rs.44.50 lakh thus incurred on these works was not in conformity with the prescribed norms and constituted diversion of CRF for non-calamity-related purposes.
The matter was referred to Government in July 2005; reply had not been received (October 2006).
4.6 GENERAL
4.6.1 Follow-up on Audit Reports
4.6.1.1 Action taken notes
The Hand Book of Instructions issued by the Finance Department in 2001 for speedy settlement of audit observations as also the Rules of Procedure (Internal Working), 1999 of the Public Accounts Committee provide for furnishing by all the departments of Government, detailed explanations in the form of Action Taken Notes (ATNs) to the observations featured in Audit Reports within four months of their being laid on the Table of Legislature to the Karnataka Legislature Secretariat with copies thereof to Audit Office.
The Audit Reports for the years 1995-96, 1996-97, 1997-98, 1998-99, 1999-2000, 2000-01, 2001-02, 2002-03, 2003-04 and 2004-05 were presented to the State Legislature on 27 March 1997, 14 May 1998, 1 July 1999, 3 May 2000, 24 July 2001, 22 March 2002, 28 March 2003, 21 July 2004, 18 July 2005 and 28 March 2006 respectively. Twenty-six Departments as detailed in Appendix 4.8 had not submitted ATNs for 96 paragraphs, even as of October 2006. These included the following important irregularities, which were
145

Audit Report (Civil) for the year ended 31 March 2006
featured in the Audit Reports 1999-2000 to 2003-04, the delay being over 11 to 59 months: Audit Report 1999-2000
Paragraph No.3.2: Fourth National Games - Youth Services and Sports Department
The State Government conducted the Fourth National Games during May-June 1997. Due to delay in providing budgetary support by it, major part of expenditure was met through overdrafts availed of from banks resulting in fruitless payment of interest of Rs.18.59 crore.
Audit Report 2000-01
Paragraph No.6.3: Extra contractual/excess payments and undue favours to a contractor - Commerce and Industries Department
The Chief Executive Officer and Executive Member/Chief Development Officer of the Karnataka Industrial Areas Development Board did not enforce the contractual provisions. This, compounded by departmental lapses, facilitated excess payments and undue favours aggregating Rs.17.97 crore to the contractor, causing huge financial loss to the Board.
Audit Report 2001-02
Paragraph No.3.12: Excess transfer of Additional Stamp Duty to Urban Local Bodies in Bangalore District (Urban) - Revenue Department
The State Government did not monitor transfer of Additional Stamp Duty to Urban Local Bodies resulting in misuse of authority by the District Registrar who transferred Rs.239.84 crore in excess.
Audit Report 2002-03
Paragraph No.4.1.8: Unauthorised works – Water Resources Department
The action of the Chief Engineer, Irrigation Central Zone, Munirabad to incur irregular expenditure on an irrigation canal led to an unwarranted financial burden of Rs.1.86 crore to Government.
Audit Report 2003-04
Paragraph No.4.4.8: Avoidable payment on acquisition of land – Water Resources Department
Inordinate delay in furnishing land acquisition proposals and the injudicious action of the Water Resources Department to pay interest on land compensation without taking possession of lands resulted in an avoidable expenditure of Rs.75.17 lakh and excess payment of interest of Rs.83.09 lakh.
146

Chapter IV – Audit of transactions
4.6.1.2 Paragraphs to be discussed by the Public Accounts Committee
Comments on Appropriation Accounts featured in Audit Reports for the years 1989-90 and onwards are pending discussion by the Public Accounts Committee. Details of paragraphs (excluding General and Statistical) pending discussion as of October 2006 are detailed in Appendix 4.9.
4.6.2 Inspection Reports outstanding
Lack of responsiveness of Government to Audit
The Hand Book of Instructions for Speedy Settlement of Audit Observations issued by the Finance Department provides for prompt response by the Executive to the Inspection Reports (IRs) issued by the Accountant General (AG) to ensure rectificatory action in compliance of the prescribed rules and procedures and accountability for the deficiencies, lapses, etc. noticed during the inspection. The Heads of Offices and next higher authorities are required to comply with the observations contained in the IRs, rectify the defects and omissions promptly and report their compliance to the AG, who forwards a half yearly report of pending IRs to the Secretary of the Department to facilitate monitoring of the audit observations.
Year-wise details of IRs and paragraphs outstanding and serious irregularities therein relating to Sericulture, Judiciary, Water Resources, Minor Irrigation and Public Works Departments are detailed in Appendix 4.10 and Appendix 4.11 respectively.
A review of the IRs, which were pending due to non-receipt of replies, in respect of these five departments revealed that the Heads of Offices whose records were inspected by the AG, failed to discharge due responsibility as they did not send even the initial replies in respect of 340 IRs containing 1,828 paragraphs, as detailed below:
Sl.No. Department
Initial replies not received
Number of IRs Number of paragraphs
1. Sericulture 112 353
2. Judiciary 120 323
3. Water Resources 39 288
4. Minor Irrigation 19 217
5. Public Works 50 647
Total 340 1,828
It is recommended that Government may look into this matter and see that procedure exists for (a) action against the officials who failed to send replies to the IRs/paragraphs within the prescribed time schedule; (b) action to recover loss/overpayment in a time bound manner; and (c) strengthen the system for proper response to the audit observations in the departments.
147

Audit Report (Civil) for the year ended 31 March 2006
4.6.3 Non-receipt of stores and stock accounts
Annual consolidated accounts of stores and stock are required to be furnished by various Departments to the Accountant General by 15 June of the following year. Delays in receipt of stores and stock accounts have been commented upon in successive Audit Reports. The Public Accounts Committee (1978-80) in its First Report (Sixth Assembly) presented in February 1980 had also emphasised the importance of timely submission of accounts by the Departments. Nevertheless, the delays persist. The Departments from which the stores and stock accounts had not been received by Audit as of October 2006 are mentioned below:
Serial Number Department Year(s) for which
accounts are due 1. Health and Family Welfare - (i) Director, Health and Family Welfare Services
(ii) Director of Medical Education (iii) Indian System of Medicine and Homoeopathy
2005-06 2005-06 2005-06
2. Information, Tourism and Youth Services - Director of Information and Publicity
2004-05 and 2005-06
3. Education - Director of Printing & Stationery
2005-06
4. Revenue (Registration) - Inspector General of Registration and Commissioner of Stamps
2002-03 to 2005-06
5. Public Works, Water Resources and Minor Irrigation 1998-99 to 2005-06
148

CHAPTER V
INTERNAL CONTROL SYSTEM
COOPERATION DEPARTMENT
5.1 Evaluation of Internal Control System Highlights Internal control system is an integrated process by which an organisation governs its activities to effectively achieve its objectives. It consists of methods and policies designed to protect resources against loss due to waste, abuse and mismanagement. The Cooperation Department was established with the primary objective of organising and managing genuine cooperatives on sound lines as per basic principles of cooperation for the promotion of economic interests and welfare of the people and rendering guidance and assistance for the development of cooperative movement in the State. Evaluation of the internal control system in the Department disclosed that controls in budgetary and operational areas were not effective to ensure compliance with established procedures/practices and thus prevent deviations. This was compounded by the absence of internal audit. Budgetary controls in place were ineffective as there were instances of defective preparation of estimates, non-utilisation of substantial amounts of grants, savings not being surrendered or surrendered only at the fag end of the year.
(Paragraph: 5.1.5)
Non-exercise of prescribed controls effectively, resulted in accumulation of arrears in audit, inquiries and inspections remaining incomplete and misappropriation of Rs.81.67 crore involving departmental employees, office bearers and employees of the societies.
(Paragraph: 5.1.7) Compliance with orders of appointment of liquidators for wound up societies which held Government stake of Rs.30.20 crore was not ensured.
(Paragraph: 5.1.8) Cooperative autonomy of the societies was affected by greater investment of Government share capital therein.
(Paragraph: 5.1.9) Inadequacy of internal controls led to accumulation of outstanding balances of principal and interest on loans.
(Paragraph: 5.1.12)
149

Audit Report (Civil) for the year ended 31 March 2006
Non-repayment of Government guaranteed loan by a society resulted in attachment of personal deposit accounts by the Debts Recovery Tribunal and avoidable payment of Rs.3.59 crore to financial institutions.
(Paragraph: 5.1.14.1)
5.1.1 Introduction
Internal control consists of rules, orders and procedures designed to provide management with a reasonable assurance that the entity is functioning in the manner intended and its objectives are achieved.
The primary objective of the Cooperation Department is to organise and manage genuine cooperatives on sound lines as per the basic principles of cooperation for the promotion of economic interests and welfare of the people, and to render guidance and assistance for the development of cooperative movement in the State. The standards of Internal Control in the Department are laid down in the Administrative Hand Book brought out in 1986. There were 32,382 cooperative societies in the State as of March 2006.
5.1.2 Organisational set-up
The Principal Secretary to the Government of Karnataka, Cooperation Department is overall in-charge of the Department at the Government level. The Registrar of Cooperative Societies (RCS) is the Head of the Department entrusted with administration of the Karnataka Cooperative Societies Act, 1959 (Act) as amended from time to time. RCS is assisted by 13 Additional Registrars (three at head office), 72 Joint Registrars (JRCS) (including four at head office) at regional level, 83 Deputy Registrars (DRCS) (including two at head office) at district level and 160 Assistant Registrars (ARCS) (including 14 at head office) at subdivision level. There are 112 Drawing and Disbursing Offices (DDOs) headed by RCS (1), DRCS (28), ARCS (51) and Cooperative Development Officers (32). The Director of Cooperative Audit (Director) is vested with powers to audit the societies.
5.1.3 Audit objectives
The main audit objectives were to examine whether: adequate budgetary, financial and operational controls for efficient and
effective operations and accurate financial reporting were in place and functioning;
compliance with the standards prescribed in the Legislations/Hand Book was achieved; and
internal audit was in place and effective.
5.1.4 Scope and methodology of audit
Records relating to budgetary, financial and operational controls for the period from 2001-02 to 2005-06 were test-checked during February 2006 to
150

Chapter V – Internal Control System
June 2006 at the Office of the RCS supplemented by scrutiny of records of two Additional Registrars at head office, one JRCS at Bangalore, 10 out of 28 DRCS offices and 17 out of 51 ARCS offices.
The audit methodology adopted involved examination of records relating to preparation of budget estimates, returns of expenditure and operational control of cooperative societies. The scope and methodology of audit were discussed with RCS in February 2006. Results of the test-check are brought out in the succeeding paragraphs.
Audit findings
Financial Control
5.1.5 Budgetary control
The financial rules framed by the Government including those in the Budget Manual and instructions issued by Government and RCS from time to time stipulate various control measures to ensure proper budgetary and other financial operations.
5.1.5.1 Saving and surrender of funds
The budget provision (original and supplementary) and the expenditure of the Department there against during 2001-06 were as detailed below:
Table 1: Budget provision and expenditure (Rupees in crore)
Year Plan Non-plan
Budget provision Expenditure Excess (+)/
Savings (-) Budget
provision Expenditure Excess (+)/ Savings (-)
2001-02
Revenue* 29.62 3.77 (-) 25.85 41.37 37.64 (-) 3.73 Capital# 7.83 12.98 (+) 5.15 - - - Loan 18.61 7.11 (-) 11.50 - - - Total 56.06 23.86 (-) 32.20 41.37 37.64 (-) 3.73
2002-03
Revenue* 6.32 2.44 (-) 3.88 41.63 37.52 (-) 4.11 Capital# 14.13 12.88 (-) 1.25 - - - Loan 22.89 15.20 (-) 7.69 - - - Total 43.34 30.52 (-) 12.82 41.63 37.52 (-) 4.11
2003-04
Revenue* 20.00 10.08 (-) 9.92 275.81 115.00 (-) 160.81 Capital# 7.00 1.56 (-) 5.44 - - - Loan 3.81 0.67 (-) 3.14 - - - Total 30.81 12.31 (-) 18.50 275.81 115.00 (-) 160.81
2004-05
Revenue* 88.42 63.25 (-) 25.17 206.94 179.17 (-) 27.77 Capital# 8.92 8.36 (-) 0.56 - - - Loan 7.33 4.92 (-) 2.41 - - - Total 104.67 76.53 (-) 28.14 206.94 179.17 (-) 27.77
2005-06
Revenue* 121.31 103.28 (-) 18.03 925.93 927.63 (+) 1.70 Capital# 0.84 - (-) 0.84 - - - Loan 17.29 15.42 (-) 1.87 - - - Total 139.44 118.70 (-) 20.74 925.93 927.63 (+) 1.70
* Includes subsidies # Includes share capital
Bangalore (Rural), Bangalore (Urban)-I & II, Bellary, Chickmagalur, Dakshina Kannada, Gadag, Kolar, Mysore, Tumkur
Bangalore (Urban)-I & II, Bellary, Chickmagalur, Chikkaballapur, Doddaballapur, Gadag, Hospet, Hunsur, Kolar, Mangalore, Mysore, Puttur, Ramanagaram, Tarikere, Tiptur, Tumkur
There were huge savings year after year indicating non-observance of the Budget Manual provisions in preparation of the budget
151

Audit Report (Civil) for the year ended 31 March 2006
It was noticed that out of the total revenue grants of Rs.803.35 crore received during the years 2001-02 to 2004-05, there were savings of Rs.290.74 crore. Of this, Rs.208.94 crore were surrendered as excessive or not required. However, 97 per cent (Rs.201.72 crore) of this was surrendered only in March of the relevant year defeating the objective of the provision of surrender, that is, their reallocation by way of re-appropriation or supplementary grants.
5.1.5.2 Incorrect and lumpsum provisioning
The savings under revenue, capital and loan sections were mainly due to incorrect, lumpsum or ad hoc provisioning of the funds in the budget as detailed in the table below:
Table 2: Analysis of savings (Rupees in crore)
Year Section Savings Reasons 2001-02 Revenue 24.40 Saving of Rs.24.40 crore was due to inclusion of
provision for agricultural marketing in the budget. Loan 8.00 Supplementary grant of Rs.eight crore obtained
for “loans to other cooperatives” was not utilised. 2002-03 Loan 5.71 Saving of Rs.5.71 crore was mainly due to
lumpsum provisioning of funds for loan assistance to various categories of cooperative societies, etc.
2003-04 Revenue 155.30 Out of supplementary grant of Rs.200.30 crore obtained for assistance to credit cooperatives, only Rs.45 crore was utilised resulting in saving of Rs.155.30 crore.
Capital 6.47 Saving was mainly under share capital assistance to various categories of societies.
It was also noticed that the non-plan estimates had been prepared by including provision for vacant posts which ranged between 999 (2003-04) and 1,146 (2004-05) constituting over one-third of the total number of sanctioned posts.
5.1.5.3 Reconciliation of departmental figures
In order that the departmental accounts are accurate to ensure efficient financial control, the Budget Manual requires that the consolidated accounts of the Chief Controlling Officer (Head of the Department) have to be reconciled with those recorded in the books of the Accountant General. However, wide variations were noticed between the two sets of expenditure figures as under:
Table 3 : Variation in expenditure figures
(Rupees in crore)
Year Expenditure according to Variation Accounts Department 2001-02 61.50 30.83 30.67 2002-03 68.04 26.56 41.48 2003-04 127.31 28.70 98.61 2004-05 255.70 181.71 73.99 2005-06 1,046.33 98.25 948.08
Non-completion of reconciliation of expenditure figures adversely affected the process of financial control besides carrying the risk of non-detection of a possible fraud.
Substantial part of the saving was surrendered at the fag end of the year
152

Chapter V – Internal Control System
5.1.6 Maintenance of accounts of arbitration fee
The Act provides for settlement of disputes involving the constitution, management or the business of cooperative societies, among others, by an arbitrator appointed by the RCS. The Karnataka Cooperative Societies Rules, 1960 (Rules) empower the RCS to require the parties to deposit in advance the fees determined by him. In June 2003, the RCS re-fixed the rates of fee and the share of Government and arbitrator. Accordingly, in respect of cases referred to arbitrator, one-fourth (one-fifth up to May 2003) of the fees received is to be credited to the Government account as revenue and the balance three-fourth (four-fifths up to May 2003) paid to the arbitrator. A Personal Deposit (PD) account at the District Treasury, Bangalore was operated by the ARCS (Disputes) for accounting of the fees received and payments made out of it.
Details of number of dispute cases filed and disposed of as also fee received and paid to arbitrators and to the Government account as furnished by the Department during the years 2001-02 to 2005-06 were as under:
Table 4 : Arrears in dispute cases (Rupees in crore)
Details 2001-02 2002-03 2003-04 2004-05 2005-06* Cases Fee Cases Fee Cases Fee Cases Fee Cases Fee
Opening balance 31,300 2.47 30,880 2.75 22,924 2.89 24,563 3.95 31,233 14.09 Filed/received during the year
57,957 1.45 78,436 3.13 64,360 4.77 72,638 3.55 22,049 1.98
Total 89,257 3.92 1,09,316 5.88 87,284 7.66 97,201 7.50 53,282 16.07 Disposal/Payment to arbitrators
62,414 2.09 66,439 2.18 70,648 2.90 75,602 2.09 26,019 1.68
Payment to Government
0.49 0.54 0.90 0.70 0.55
Closing balance 26,843 1.34 42,877 3.16 16,636 3.86 21,599 4.71 27,263 13.84 * Provisional (up to December 2005 only)
The figures furnished by the Department were not reliable as the closing balances of the cases and fee were not adopted as opening balance in the succeeding years. The amount remaining unpaid to arbitrators and to Government in respect of settled cases was also not made available by the Department.
In 14 offices test-checked, reconciliation between the departmental balance in the PD account and the treasury balance was in arrears for periods ranging from 23 to 3 months between April 2004 and January 2006 and the difference pending reconciliation ranged from Rs.0.03 lakh to Rs.2.32 crore.
The Department had irregularly appropriated Rs.56.04 lakh from the PD account during the year 2005-06 for meeting expenses of training and travelling/daily allowances to Government officers and centenary celebrations of the cooperative movement.
Subdivisions at Bangalore (Rural), Bangalore (Urban)-I, Bellary, Chikkaballapur, Doddaballapur, Gadag, Kolar, Mangalore, Mysore, Tiptur, Tumkur, District offices at Tumkur, Mysore and Head Office at Bangalore
There was inadequate control over preparation of arbitration fee accounts leading to their defective maintenance and diversion of funds
153

Audit Report (Civil) for the year ended 31 March 2006
Inadequate controls over preparation of arbitration fee accounts led to their defective maintenance and diversion of funds.
Operational control
5.1.7 Control over cooperative societies
In order to regulate the activities of the cooperative societies to conform to its provisions, the Act envisages audit, inquiry, inspection and levy of surcharge as instruments of control over societies by the RCS.
5.1.7.1 Arrears in audit
The Act provides that the Director shall audit or cause to be audited by a person authorised by him, by general or special order, the accounts of every cooperative society at least once in each year.
According to the data furnished by the Director, the number of societies due for audit and that actually covered during the years 2001-02 to 2005-06 were as under:
Table 5: Progress in audit of cooperative societies
Year Number of
societies due for audit
Number of societies audited
Percentage of coverage
Number of societies not
covered 2001-02 30,415 17,993 59 12,422 2002-03 31,206 20,115 64 11,091 2003-04 31,877 22,411 70 9,466 2004-05 32,259 22,511 70 9,748 2005-06 32,602 22,814 70 9,788
The Director attributed (July 2006) the arrears to non-production of books of accounts, incomplete books of accounts, books being in court, whereabouts of the societies not being known and severe shortage of staff.
The Rules prescribe fees at specified rates for conduct of the audit. In the event of a cooperative society failing to pay the fees, the said Rules also empower the Director to call upon the financing bank of the concerned society to remit the fees on receipt of demand. The unpaid amount is also liable to be recovered as arrears of land revenue.
It was noticed that despite these powers, audit fees of Rs.10 crore was outstanding for recovery from the cooperative societies as of March 2006. The Director stated (July 2006) that the financial position of some of the societies did not permit them to pay the audit fees and that some societies had brought stay of recovery on the ground that the fee was exorbitant.
5.1.7.2 Arrears in inquiry proceedings
The Act enjoins on the RCS to hold an inquiry by himself or by a person authorised by him into any matter specified by him touching the constitution,
Control over the affairs of the cooperative societies was inadequate leading to accumulation in arrears of audit, inquiries/inspections remaining incomplete and misappropriation of Rs.81.67 crore
154

Chapter V – Internal Control System
working and financial condition of a cooperative society. Such inquiry may be of his own motion but shall be held on the application by a cooperative society to which the society is affiliated or by a majority of the members of the managing committee or by not less than one-third of the total number of members of the society. The inquiry shall be completed within a maximum of 12 months including extension by six months by the State Government on the recommendation of the RCS.
The position of inquiries ordered, completed and pending during the years 2001-02 to 2005-06 was as under:
Table 6: Progress of inquiry proceedings
Year Opening balance
Ordered during the year Total Completed
during the year Closing balance
2001-02 94 98 192 114 78 2002-03 78 109 187 89 98 2003-04 98 134 232 149 83 2004-05 83 128 211 111 100 2005-06 100 83 183 70 113
It was noticed that six cases were pending for over two years and 24 cases for more than one year. The Department did not adhere to the provisions of the Act of completing the inquiry proceedings within the time period laid down therein.
5.1.7.3 Arrears in inspection
The Act provides that the RCS may, of his own motion or on the application of a creditor of a cooperative society, direct any person authorised by him to inspect the books of the society.
The position of inspection of books ordered, completed and pending during the years 2001-02 to 2005-06 was as under:
Table 7 : Progress of inspection
Year Opening balance
Ordered during the year Total Completed
during the year Closing balance
2001-02 66 172 238 172 66 2002-03 66 179 245 155 90 2003-04 90 92 182 148 34 2004-05 34 50 84 50 34 2005-06 34 87 121 96 25
No definite time frame had been fixed for completion of inspections and action thereon.
5.1.7.4 Misappropriation cases
The Act provides for recovery of loss or deficiency caused to a society by way of initiation of surcharge proceedings against the committee of management or any other person in cases of payment contrary to the Act, Rules or bye-laws of the society, deficiency caused in the assets of the society by breach of trust or
155

Audit Report (Civil) for the year ended 31 March 2006
negligence, misappropriation/fraudulent retention of money/property of the society found during an audit, inquiry, inspection or winding up of a society. According to the data furnished by the Department, the number of misappropriation cases increased from 9,821 (2003-04) to 10,079 (2005-06) involving an amount of Rs.81.67 crore in 5,923 societies by 10,569 persons. These persons included 9,318 employees of the societies, 160 departmental employees, 860 office bearers of the societies and 231 others. This was indicative of lax monitoring of the affairs of the cooperative societies by the Department.
5.1.8 Appointment of liquidators
The Act provides that where the RCS has made an order for winding up of a cooperative society, he may appoint a liquidator (from among the subordinate officers) for the purpose. The Administrative Hand Book specifies that a liquidator has to be appointed within two months from the date of such order. The RCS directed in August 1995 that the liquidator should take charge within 15 days from the date of appointment.
During the period from 2001-02 to 2005-06, the number of liquidators appointed, the number who had not taken charge and Government’s stake in the wound up societies concerned were as under:
Table 8 : Appointment of liquidators
Year Number of liquidators Government stake (Rupees in crore) Appointed Not taken charge
2001-02 3,810 757 22.91 2002-03 3,578 688 22.56 2003-04 3,265 625 25.97 2004-05 3,029 136 25.31 2005-06 2,739 186 30.20
Owing to non-assumption of charge of the societies by the liquidators, assets of the societies could not be disposed of resulting in locking up of Government investment of Rs.30.20 crore in those societies. The RCS had not ensured compliance with orders appointing liquidators.
5.1.9 Contribution of excess share capital by Government
In May 1964, Government had prescribed the terms and conditions governing the State participation in the share capital of cooperative credit societies. Accordingly, in the case of a primary agricultural credit society, the share capital contributed by the State should not exceed the contribution made by members of the society.
It was, however, noticed in four offices that in respect of each of 149 such societies, members’ contributions aggregated Rs.75.20 lakh, while Government share capital was Rs.3.65 crore, as detailed in the Appendix 5.1. Release of Government share without ensuring recovery of the members’
RCS did not ensure compliance with his orders of appointment of liquidators for societies which held Government stake of Rs.30.20 crore and were wound up
Cooperative autonomy of the societies was affected by greater investment of Government share capital therein
156

Chapter V – Internal Control System
contribution by the Department was in violation of the policy of the Government.
Since cooperatives were to be controlled by their members actively participating in setting their policies and in decision making, the excess share capital by Government also affected the cooperative autonomy of the societies.
5.1.10 Receipt of share certificates from cooperative societies
The terms and conditions of sanction of contribution of share capital investment by Government stipulate that the recipient society shall issue share certificate in the name of the Governor of Karnataka and send the same to the Government in the Cooperation Department through the RCS immediately on receipt of the sanctioned amount.
Scrutiny of investment registers maintained in the test-checked subdivisions revealed that as of March 2006 share certificates were yet to be received by the Department in respect of investment of share capital of Rs.35.63 lakh made by Government in 27 cooperative societies of three subdivisions.
This indicated that the supervision exercised by the Departmental Officers during inspection was not effective.
5.1.11 Recovery of dividend
The Act authorises a cooperative society to pay dividend to its members from the net profits available after making transfers/contributions to specified funds and in accordance with its bye-laws. According to the procedure in vogue, on declaration of dividend by societies, the concerned field officers were issuing demand notices for payment. The amount of dividend receivable by the Government from all the societies in the State which had declared dividend during the years 2001-02 to 2005-06, amount received and balance due at the end of March 2006 were as under:
Table 9 : Recovery of dividend
(Rupees in lakh)
Year Receivable Received Balance due
Number of societies Amount Number of
societies Amount
(Percentage) Number of
societies Amount
2001-02 842 155.03 784 143.49 (92.55) 61 11.54
2002-03 275 45.72 270 44.56 (97.46) 05 1.16 2003-04 737 134.44 721 126.71 (94.25) 20 7.73
2004-05 851 146.31 837 139.61 (95.42) 14 6.70
2005-06 847 168.96 51 26.62 (15.75) 806 142.34
Thus, as at the end of March 2006, Rs.1.42 crore was due from 806 societies. Though the percentage of recovery of dividend during the years 2001-02 to 2004-05 was over 90 per cent, it had reduced to less than 16 per cent during 2005-06. The age-wise break up of the outstanding amount was not furnished.
Departmental interest was not served by not recovering the declared dividend
157

Audit Report (Civil) for the year ended 31 March 2006
The departmental officers not enforcing recovery of the declared dividend from the societies did not serve the financial interest of the Department.
5.1.12 Loans and interest outstanding from cooperative societies
The Act envisages giving loans or advances to cooperative societies. The Act enables recovery of all sums due from a cooperative society as arrears of land revenue on a certificate issued by RCS. The executive duties of JRCS, DRCS and ARCS as prescribed in the Administrative Hand Book include attending to recovery of loans granted to the societies in accordance with the terms of their sanction and instructing the field staff to improve the recovery performance.
According to the procedure in vogue in the Department, Demand, Collection and Balance Registers were maintained and demand notices served as and when the instalments of principal/interest fell due. A review of such registers revealed that as at the end of March 2006, overdue instalments of loans aggregating Rs.24.96 crore granted to 4,291 cooperative societies were outstanding for recovery. Interest of Rs.31.32 crore was also outstanding from 3,654 societies as on that date. Year-wise details of demands/recovery of principal and interest were as under:
Table 10 : Principal outstanding for recovery (Rupees in crore)
Year Receivable Received Balance due
Number of societies Amount Number of
societies Amount Number of societies Amount
2001-02 956 2.77 548 0.64 706 2.13
2002-03 908 2.71 418 0.60 779 2.11
2003-04 3,974 15.91 1,568 2.27 3,264 13.64
2004-05 4,162 20.23 492 1.80 3,809 18.43
2005-06 4,698 26.92 673 1.96 4,291 24.96
Table 11 : Interest outstanding for recovery (Rupees in crore)
Year Receivable Received Balance due
Number of societies Amount Number of
societies Amount Number of societies Amount
2001-02 956 2.70 255 0.35 706 2.35
2002-03 908 2.60 418 0.38 779 2.22
2003-04 3,974 20.38 1,568 1.06 3,264 19.32
2004-05 3,561 29.35 202 2.09 3,396 27.26
2005-06 3,691 31.65 53 0.33 3,654 31.32
Reasons attributed (March 2006) by DRCS/ARCS for low pace of recoveries were drought/flood conditions and societies being under losses.
Inadequacy of internal controls led to accumulation of outstanding balances of principal and interest
158

Chapter V – Internal Control System
5.1.13 Recovery of redeemable share capital
According to the terms and conditions governing the sanction of redeemable share capital to cooperative societies under various schemes, the amount is to be recovered in instalments as stipulated under the respective schemes. Test-check revealed that in nine⊕ districts, redeemable share capital of Rs.10.60 crore due from 1,137 societies was pending recovery. The monitoring mechanism for recovery of Government dues was not adequate.
5.1.14 Other points
5.1.14.1 Avoidable payment of guaranteed amount
A cooperative society availed a loan of Rs.4.40 crore (between April 1987 and October 1998) from three financial institutions on State Government’s guarantee, for establishment of a sugar factory at Bhoosnur village in Aland taluk. After discharging liabilities towards principal of Rs.3.66 crore and interest and other charges of Rs.4.56 crore till 1994-95, the society defaulted. As a One Time Settlement (OTS), the three financial institutions agreed (January-March 2000) to the repayment of outstanding principal of Rs.1.09 crore and waiver of all interest and liquidated damages, provided the amount was paid by 31 March 2000. This was not complied with by the society or by the State Government. The State Government, however, approved (March 2002) the proposal (July 2001) of the society to obtain a loan of Rs.1.09 crore from the District Central Cooperative Bank, Bidar on Government guarantee for making repayment. But, this was also not pursued. The Debts Recovery Tribunal (DRT), Bangalore acting on an application (2000) by the consortium of the three financial institutions ordered (August 2003) the society/State Government (defendants) to pay jointly and severally Rs.2.72 crore with interest up to date of realisation to the financial institutions. As this was also not complied with, nor was an appeal preferred within 90 days available, DRT attached (July 2004) six Government accounts held by officers of the Cooperation Department and ordered release of Rs.4.68 crore in its favour. This was complied with by the Treasury between July 2004 and January 2005 releasing Rs.4.60 crore.
Audit scrutiny revealed that though both the defendants had called the applicants’ claims to be false, fictitious and frivolous in written submissions to DRT, this was not followed up by providing evidence and by way of arguments.
Thus, inadequate monitoring of repayment of principal/interest by the society and improper handling of litigation before the DRT resulted in having to suffer attachment of accounts. Also, failure to avail the benefit of OTS resulted in avoidable payment of Rs.3.59 crore to the financial institutions.
⊕ Bangalore (Rural), Bangalore (Urban), Gadag, Kolar : Rs.6.11 crore (as of March 2005) Bellary, Chickmagalur, Mangalore, Mysore, Tumkur : Rs.4.49 crore (as of March 2006)
Redeemable share capital of Rs.10.60 crore due for recovery was not recovered
Failure to avail the benefit of OTS resulted in avoidable payment of Rs.3.59 crore to financial institutions
159

Audit Report (Civil) for the year ended 31 March 2006
5.1.14.2 Delay in obtaining refund of unspent grant
The National Cooperative Development Corporation (NCDC) sanctioned (February 1999) a loan of Rs.131.40 lakh being 90 per cent of the block cost of Rs.146 lakh to the Government in the form of reimbursement finance for establishment of an Integrated Sericulture Development Project (ISDP) by a society at Kolar. The balance of Rs.14.60 lakh (10 per cent) was to be met by the members’ contribution. Though the project was to be completed and the unit commissioned by March 2001, the State Government released Rs.43.80 lakh (Rs.21.90 lakh each as share capital and term loan) only on 27 March 2001, that is, at the fag end of the project period. This amount was got credited by RCS to the account of a cooperative bank at Kolar only in June 2001 to hold it till further release orders were received. However, in March 2003, RCS reported to Government that the society had been unable to implement the project by acquiring land and collecting members’ contribution. Though Government ordered (July 2003) recall of the amount of Rs.43.80 lakh, the amount had not been refunded (May 2006).
Thus, formulation of proposal even before firming up of availability of land and capacity of the society to raise its contribution and failure to monitor the utilisation of the funds released resulted in locking up Rs.43.80 lakh for over five years.
5.1.15 Internal audit
Internal audit is an independent appraisal of operations to assess the internal financial, administrative and other controls and help implementation of policies and programmes. The Finance Department issued (December 1992) guidelines to improve the quality of functioning of Internal Audit Wing (IAW) of Government Departments to enhance fiscal discipline. However, no IAW had been constituted (March 2006) in the Cooperation Department though it has been in existence for 100 years.
5.1.16 Conclusion
Budgetary control mechanism in place was not effective as there were instances of defective preparation of estimates and huge savings which were either not surrendered or surrendered only at the fag end of the year. Operational control of cooperative societies was ineffective as there was accumulation of arrears in audit, inquiries and inspections remained incomplete and misappropriation involving departmental employees as also office bearers and employees of the societies. The recovery of outstanding balances of principal and interest was tardy because of ineffective monitoring. The internal audit system had not been introduced in the Department.
Unutilised grant of Rs.43.80 lakh remained locked up for over five years
Internal audit was not in existence
160

Chapter V – Internal Control System
5.1.17 Recommendations
Budget estimates should be prepared after assessment of requirement of funds realistically instead of making lump sum provision and provision for vacant posts.
The mechanism for control over cooperative societies should be streamlined to ensure completion of audit every year, and inquiry and inspection within a definite time frame.
The cases of misappropriation should be investigated and remedial action taken in a time bound manner to prevent their recurrence.
The recovery of dues from the societies should be effectively monitored.
Internal audit should be introduced in the Department.
5.1.18 The above points were referred to Government in August 2006; reply had not been received (October 2006). BANGALORE (USHA SANKAR) THE Principal Accountant General (Civil and Commercial Audit)
COUNTERSIGNED
NEW DELHI (VIJAYENDRA N. KAUL) THE Comptroller and Auditor General of India
161

APPENDICES


Appendices
Appendix 1.1
Part A : Structure and form of Government Accounts
(Reference: Para 1.1, Page 2)
I. Structure: The accounts of the State Government are kept in three parts (i) Consolidated Fund, (ii) Contingency Fund and (iii) Public Account.
Part I: Consolidated Fund
All receipts of the State Government from revenues, loans and recoveries of loans go into the Consolidated Fund of the State, constituted under Article 266(1) of the Constitution of India. All expenditure of the Government is incurred from this Fund from which no amount can be withdrawn without authorisation from the State Legislature. This part consists of two main divisions, namely, Revenue Account (Revenue Receipts and Revenue Expenditure) and Capital Account (Capital Receipts, Capital Expenditure, Public Debt and Loans etc).
Part II : Contingency Fund
The Contingency Fund created under Article 267(2) of the Constitution of India is in the nature of an imprest placed at the disposal of the Governor of the State to meet urgent unforeseen expenditure pending authorisation from the State Legislature. Approval of the State Legislature is subsequently obtained for such expenditure and for transfer of equivalent amount from the Consolidated Fund to Contingency Fund. The corpus of this Fund authorised by the Legislature during the year was Rs.80 crore.
Part III : Public Account:
Receipts and disbursements in respect of small savings, provident funds, deposits, reserve funds, suspense, remittances, etc., which do not form part of the Consolidated Fund, are accounted for in Public Account and are not subject to vote by the State legislature.
II. Form of Annual Accounts:
The accounts of the State Government are prepared in two volumes viz., the Finance Accounts and the Appropriation Accounts. The Finance Accounts present the details of all transactions pertaining to both receipts and expenditure under appropriate classification in the Government accounts. The Appropriation Accounts, present the details of expenditure by the State Government vis-à-vis the amounts authorised by the State Legislature in the budget grants. Any expenditure in excess of the grants requires regularisation by the Legislature.
165

Audit Report (Civil) for the year ended 31 March 2006
Part B : Layout of Finance Accounts (Reference: Paragraph 1.1, Page 2)
Statement No.1 presents the summary of transactions of the State Government –receipts and disbursements, revenue and capital, public debt receipts and disbursements, etc., in the consolidated fund and transactions under contingency fund and public account and also offers explanation giving comparative summary of transactions, including cases of large and important variations.
Statement No.2 gives the summarised position of capital outlay outside revenue account showing progressive expenditure to the end of 2005-06
Statement No.3 gives financial results of irrigation works and electricity schemes.
Statement No.4 indicates the summary of debt position of the State, which includes borrowings accounted under internal debt, Government of India loans, other obligations accounted under public account and servicing of debt.
Statement No.5 gives the summary of loans and advances given by the State Government during the year, repayments made, recoveries in arrears, etc.
Statement No.6 gives the summary of guarantees given by the State for repayment of loans, etc. raised by the statutory corporations, government companies, local bodies and other institutions.
Statement No.7 gives the summary of cash balances and investments made out of such balances.
Statement No.8 depicts the summary of balances under consolidated fund, contingency fund and public account as on 31 March 2006
Statement No.9 shows the revenue and expenditure under different heads for the year 2005-06 as a per cent of total revenue/expenditure.
Statement No.10 indicates the distribution between the charged and voted expenditure during the year.
Statement No.11 indicates the detailed account of revenue receipts and capital receipts by minor heads.
Statement No.12 gives an account of revenue expenditure by minor heads under plan and non-plan, capital expenditure by major heads under plan and non-plan.
Statement No.13 depicts the detailed account of capital expenditure incurred during and to the end of 2005-06
Statement No.14 shows the details of investment of the State Government in statutory corporations, government companies, other joint stock companies, co-operative banks and societies, etc. up to the end of 2005-06
Statement No.15 depicts the capital and other expenditure (other than on revenue account) to the end of 2005-06 and the principal sources from which the funds were provided for that expenditure.
Statement No.16 gives the detailed account of receipts, disbursements and balances under heads of account relating to debt, contingency fund and public account.
Statement No.17 presents detailed account of debt and other interest bearing obligations of the State.
Statement No.18 presents the detailed account of loans and advances given by the State, the amount of loan repaid during the year, the balance as on 31 March 2006 and the amount of interest received during the year.
Statement No.19 gives the details of earmarked balances
166

Appendices
Part C: List of terms used in the Chapter-I and basis for their calculation
(Reference: Paragraph 1.3, Page 5)
Terms Basis for calculation Buoyancy of a parameter Rate of Growth of the parameter
GSDP Growth Buoyancy of a parameter (X) with respect to another parameter (Y)
Rate of Growth of parameter (X) Rate of Growth of parameter (Y)
Rate of Growth (ROG) [(Current year Amount/ Previous year Amount)-1]*100
Development Expenditure Social Services + Economic Services Average interest paid by the State
Interest Payment/ [(Amount of previous year’s Fiscal Liabilities + Current year’s Fiscal Liabilities)/2]*100
Weighted Interest rates Actual Interest worked out / Actual amount borrowed
Interest spread GSDP growth - Weighted Interest rates Quantum Spread Debt stock * interest spread Interest received as per cent to Loans Outstanding
Interest Received [(Opening balance + Closing balance of Loans and Advances)/2]*100
Revenue Deficit Revenue Receipt – Revenue Expenditure Fiscal Deficit Revenue Expenditure + Capital Expenditure
+ Net Loans and Advances – Revenue Receipts – Miscellaneous Capital Receipts
Primary Deficit Fiscal Deficit – Interest Payments Balance from Current Revenue (BCR)
Revenue Receipts minus all Plan grants and Non-plan Revenue Expenditure excluding expenditure recorded under the major head 2048 – Appropriation for reduction or Avoidance of debt
167

Audit Report (Civil) for the year ended 31 March 2006
APPENDIX 1.2
Outcome Indicators of the State’s Own Fiscal Correction Path
(Source: Finance Department)
(Reference: Paragraph 1.1.4, Page 4)
Base Year Accounts 2003-04
2004-05 2005-06 2006-07 2007-08 2008-09 2009-10
A. STATE REVENUE ACCOUNT
1. Own Tax Revenue 12570.21 14040.64 15790.25 18009.51 20541.33 23647.76 27224.97 2. Own Non- Tax Revenue 2958.37 1984.43 2348.35 2555.23 2674.43 2930.86 3238.96 3. Own Tax + Non-tax Revenue (1+2) 15528.58 16025.07 18138.60 20564.74 23215.76 26578.62 30463.93
4. Share in Central Taxes & Duties 3244.73 3394.91 3785.32 4220.63 4706.00 5247.20 5850.63 5. Plan Grants 1456.72 2462.69 2477.75 2153.83 2167.63 2282.36 2375.72 6. Non-Pan Grants 529.85 252.82 340.93 367.68 390.14 413.35 447.35 7. Total Central Transfer (4 to 6) 5231.30 6110.42 6604.00 6742.14 7263.77 7942.91 8673.70 8. Total Revenue Receipts (3+7) 20759.88 22135.49 24742.60 27306.88 30479.53 34521.53 39137.63 9. Plan Expenditure 3552.72 4512.47 4692.33 4963.15 5541.33 5461.59 5876.14 10. Non- Plan Expenditure 17731.99 18359.93 19074.58 20576.62 21782.10 23105.96 24780.05 11. Salary Expenditure as in MTFP 5322.76 5897 5932 7186 8553 9198 9842 12. Pension 1901 2213.53 2426.82 2660.66 2917.04 3198.12 3506.28 13. Interest Payments 3710 4357.85 4834.46 5293.30 5756.42 6233.22 6750.26 14. Subsidies – General as in MTFP 389 916 1721 1741 1735 1808 1878 15. Subsidies –Power as in MTFP 1677 1415 1750 1800 1800 1800 1800 16. Total Revenue Expenditure (9+10)
21284.71 22872.40 23766.91 25539.77 27323.43 28567.55 30656.19
17. Salary + Interest+ Pensions (11+12+13)
10933.76 12468.38 13193.28 15139.96 17226.46 18629.34 20098.54
18. As percentage of Revenue Receipts (17/8)
52.7 56.3 53.3 55.4 56.5 53.9 69
19. Revenue Surplus/Deficit (8-16) 525 736.91 -975.69 -1767.11 -3156.10 -5953.98 -8481.44 B. CONSOLIDATED REVENUE ACCOUNT
1. Interest payment on off-budget borrowings and SPV borrowing made by PSUs/SPUs outside budget
1082 661 711 935 638 465
2. Consolidated Revenue Deficit (A.19 + B.4)
1818.91 314.69 1056.11 221.10 5315.98 8016.44
C. CONSOLIDATED DEBT as in MTFP
Outstanding debt and liability 41967 46563 51356 56594 63071 69554 76905 D. CAPITAL ACCOUNT 1. Capital Outlay 3029.39 4309.65 5965.41 7065.35 8349.69 9652.85 11259.34 2. Disbursement of loans and advances
1011.20 598.82 727.40 649.78 743.03 915.94 1141.18
3. Recovery of loans and advances 64.29 100.50 100.50 100.50 100.50 100.50 100.50 4. Other capital receipts - --- --- --- --- --- --- E. GROSS FISCAL DEFICIT (GFD)
55443.98 4889.21 5197.73 5093.09 3598.38 2677.40
GSDP at current prices 144739 161840 183527 208120 238229 272695 Actual/assumed nominal growth rate (Percentage)
5 5 4 5 5 5
168

Appendices
Appendix 1.3
Utilisation Certificates outstanding as on 31 March 2006
(Reference: Paragraph 1.6.5, Page 19)
(Amount: Rupees in lakh)
Sl. No. Department
Year of Payment of grant
Total grants paid Utilisation Certificates Received Outstanding
Number Amount Number Amount Number Amount
(1) (2) (3) (4) (5) (6) (7) (8) (9) I Education
2203- Technical Education 1992-93 11 6.60 - - 11 6.60 Total 11 6.60 - - 11 6.60
II Information, Tourism and Youth Services 1 2204- Sports & Youth
Services 1989-90 12 5.93 - - 12 5.93 1990-91 1 0.10 - - 1 0.10 1998-99 2 94.75 - - 2 94.75
Total 15 100.78 - - 15 100.78 2 2220- Information &
Publicity 2005-06 6 7.40 2 2.40 4 5.00 2004-05 6 6.15 - - 6 6.15
Total 12 13.55 2 2.40 10 11.15 III Kannada and Culture 1 2205- Art & Culture 1986-87 3 5.30 - - 3 5.30
1987-88 5 5.01 - - 5 5.01 1988-89 23 19.48 - - 23 19.48 1990-91 21 63.70 - - 21 63.70 1991-92 3 2.25 - - 3 2.25 1993-94 25 52.48 - - 25 52.48 1999-00 9 159.65 - - 9 159.65 2000-01 04 2.07 - - 4 2.07 2005-06 131 778.40 - - 131 778.40 2004-05 23 69.81 - - 23 69.81
Total 247 1158.15 - - 247 1158.15 2 2235- Social Security &
Welfare 1986-87 1 1.27 - - 1 1.27 1992-93 1 0.31 - - 1 0.31 1993-94 4 1.61 - - 4 1.61 1994-95 2 0.19 - - 2 0.19
Total 8 3.38 - - 8 3.38 IV Health & Family Welfare
2210- Medical and Public Health
2000-01 3 54.61 3 54.61 - - 2001-02 10 81.01 10 81.01 - - 2005-06 1 50.00 1 50.00 - - 2004-05 10 1290.53 - - 10 1290.53
Total 24 1476.15 14 185.62 10 1290.53 V Urban Development
2217- Urban Development 1993-94 6 271.52 - - 6 271.52 2001-02 5 293.84 - - 5 293.84 2002-03 2 638.00 - - 2 638.00 2005-06 8 8355.00 - - 8 8355.00 2004-05 31 36978.70 - - 31 36978.70
Total 52 46537.06 - - 52 46537.06
169

Audit Report (Civil) for the year ended 31 March 2006
(1) (2) (3) (4) (5) (6) (7) (8) (9) VI Co-operation 1 2425- Co-operation 1986-87 1 1.96 - - 1 1.96 1988-89 21 4043.52 - - 21 4043.52 1989-90 20 3551.68 - - 20 3551.68 Total 42 7597.16 - - 42 7597.16
2 3475- Other General Economic Services
1997-98 1 979.13 - - 1 979.13 1998-99 2 371.34 - - 2 371.34 2001-02 5 120.41 - - 5 120.41 2002-03 11 243.40 - - 11 243.40
Total 19 1714.28 - - 19 1714.28 VII Agriculture and Horticulture
2515- Other Rural Development Programme
1990-91 6 156.58 - - 6 156.58 1991-92 39 1233.84 - - 39 1233.84 1992-93 6 96.22 - - 6 96.22 1993-94 33 1419.37 - - 33 1419.37 1994-95 61 2327.86 - - 61 2327.86 2001-02 69 6397.50 - - 69 6397.50 2002-03 25 2536.53 - - 25 2536.53 2005-06 11 133.46 2 8.00 9 125.46 2004-05 4 207.76 - - 4 207.76
Total 254 14509.12 2 8.00 252 14501.12 VIII Planning, Statistics, Science and Technology
3425- Other Scientific Research
2002-03 2 13.50 - - 2 13.50 2005-06 4 30.02 1 2.20 3 27.82
Total 6 43.52 1 2.20 5 41.32 Grand Total 690 73159.75 19 198.22 671 72961.53
170

Appendices
Appendix 1.4
Non-submission of accounts
(Reference: Para 1.6.6 , Page 19)
Sl. No. Department Periods for which
accounts not furnished Number of
accounts due
1. Co-operation 1980-81 to 1982-83,
1983-84 to 1985-86 and 1993-94 to 2005-06
267
2. Commerce and Industries 2000-01 to 2005-06 52
3. Education 1992-93 to 2005-06 238
4. Forest, Environment and Ecology 2001-02 to 2003-04 3
5. Health & Family Welfare Services 1999-2000 to 2005-06 24
6. Labour 1999-2000 to 2005-06 7
7. Law 2001-02 to 2002-03 and 2004-05 to 2005-06 4
8. Planning 2000-01 to 2005-06 17
9. Public works and CADA 2000-01 to 2005-06 12
10. Revenue 2001-02 to 2005-06 5
11. Rural Development and Panchayati Raj 2000-01 to 2005-06 6
12. Science and Technology (State) 2000-01 to 2005-06 8
13. Urban Development 1994-95 to 2005-06 77
14. Youth Services and Sports 1999-2000 to 2005-06 17
15. Animal Husbandry & Fisheries 2003-04 to 2005-06 12
16. Social Welfare 2003-04 to 2005-06 3
Total 752
171

Audit Report (Civil) for the year ended 31 March 2006
Appendix 1.5
Audit of performance of the Autonomous Bodies
(Reference: Paragraph 1.6.7, Page 19)
Sl.No Autonomous Bodies Period of
entrustment Date of
entrustment
Years for which
accounts due
Year up to which
accounts received
Year up to which Audit
Report issued
1. Bangalore Water Supply and Sewerage Board, Bangalore
2004-05 to 2008-09 19-1-2005 2005-06 2005-06 2004-05
2. Karnataka State Khadi and Village Industries Board, Bangalore
2002-03 to 2006-07 28.11.2002 2005-06 2005-06 2004-05
3. Bangalore Development Authority, Bangalore
2005-06 to 2006-07 10-3-2006 2005-06 2005-06 2004-05
4.
Karnataka Urban Water Supply and Drainage Board, Bangalore
2005-06 17-6-2006 2005-06 2005-06 2004-05
5. Karnataka Industrial Areas Development Board, Bangalore
2004-05 to 2008-09
17-6-2005 2005-06 2005-06 2004-05
6. Karnataka State Legal Service Authority
KSLS Act, 1987 amended
in 1994 -- 2005-06 2004-05 2004-05
7. Karnataka Slum Clearance Board, Bangalore
2002-03 to 2006-07 2.9.2003 2005-06 2004-05 2004-05
8. Karnataka Housing Board, Bangalore
2001-02 to 2005-06 29.7.2003 2005-06 2005-06 2004-05
172

Appendices
Appendix 1.6
Department-wise details of cases of misappropriations/defalcations
(Reference: Paragraph 1.6.8, Page 19)
(Rupees in Lakh) Sl. No. Department No. of cases Amount
1 Horticulture 7 41.20 2 Animal Husbandry and Veterinary
Services 2 1.20
3 Commerce and Industries 7 20.13 4 Labour 7 13.92 5 Law and Parliamentary Affairs 9 3.49 6 Education 7 2.70 7 Finance 5 6.28 8 Forest, Environment and Ecology 11 265.74 9 Health and Family Welfare 20 20.18 10 Home 4 86.55 11 Information, Tourism and Youth
Services 14 32.04
12 Planning 1 1.55 13 Public Works 26 236.13 14 Water Resources 72 256.13 15 Revenue 12 10.96 16 Rural Development and Panchayat Raj 9 0.37 17 Social Welfare 4 3.37 18 Women and Child Development 3 0.88 Total 220 1002.82
173

Audit Report (Civil) for the year ended 31 March 2006
Appendix 1.7
Department-wise details of cases of write-off during 2005-06
(Reference: Para 1.6.9, Page 19)
Sl. No. Department Authority sanctioning
Write-off Brief particulars No. of Cases
Amount (in Rupees)
1 Co-operation Registrar, Co-operative Societies
Write-off of share and audit fee
5 24,700
2 Food & Civil Supplies
Desk Officer Theft in the office of the Inspector of Legal Metrology
1 88,796
Food & Civil Supplies
Commissioner Deficit of wheat in Central Warehouse
1 16,619
3 Health & Family Welfare
Under Secretary to Government
Transportation of DWDP to Chitradurga
1 14,657
Total 8 1,44,772
174

Appendices
Appendix 2.1
Major heads of account in which huge provisions remained unspent
(Reference Paragraph 2.3.1 Page 38) (Rupees in crore)
Sl. No.
Grant No.
Major Head
Areas in which major unspent provision occurred
Unspent Provision
1 1 2401 Crop Husbandry – Seeds – Supply of seeds 23.30 Crop Husbandry – Crop Insurance – New Crop
Insurance Scheme 190.64 Crop Husbandry – Other Expenditure –
Agriculture Department 42.83 2402 Soil and Water Conservation – Soil Survey and
Testing – Comprehensive Watershed Development Project (World Bank Project) 108.50
2 3 2070 Other Administrative services –other expenditure -Filling up of vacant posts (State Sector) 144.67 - Filling up of vacant posts (District Sector) 121.75 2071 Pensions and Other Retirement Benefits – Civil Pension of Employees of Local Bodies – Payments
to Muncipal Employees 51.65 Commuted value of Pensions – Other Payments 113.48 Gratuities- Other Gratuities Karnataka 136.92 2075 Miscellaneous General Services- State Lotteries-
Director of State Lotteries 919.99 3 7 2215 Water Supply and Sanitation- Assistance to Grama
Panchayats- Grama Panchayats 29.82 2515 Other Rural Development Programmes-
Assistance to Zilla Panchayats - Zilla Panchayats 115.36 4215 Capital outlay on Water Supply and Sanitation –
Water Supply – Rural Water Supply – Capital release to Grama Panchayats 101.28
4 19 2217 Urban Development- Other Urban Development Schemes - Assistance to Local Bodies, Corporations, Urban Development Authorities, Town Improvement Boards, etc - Bangalore Metropolitan Regional Development Authority 199.15
Other Expenditure – Urban Reforms Incentive Fund 21.98
General – Assistance to Local Bodies, Corporations, Urban Development Authorities, Town Improvement Boards, etc – Grants to Urban Local Bodies under TFC Grants 19.82
6215 Loans for Water Supply and Sanitation – Water Supply – Loans to Public Sector and Other Undertakings – Bangalore Water Supply and Sewerage Board 91.50
6217 Loans for Urban Development – Other Urban Development Schemes – Other Loans – Loans for Bangalore Mass Rapid Transit System 17.14
175

Audit Report (Civil) for the year ended 31 March 2006
Sl. No.
Grant No.
Major Head
Areas in which major unspent provision occurred
Unspent Provision
5 20 2059 Public Works – General – Suspense- Debits 76.31 3054 District and other Roads- Road Works – Rural
Road Works 66.40 Roads and Bridges –Transfer to Reserve Fund
Deposit Accounts - Transfer of cess to Rural Road Development Fund
161.58
5054 Capital Outlay on Roads and Bridges – State Highways – Road Works- Other Road Formation 10.88
Land Acquisition charges 15.00 District and Other Roads – Other Expenditure –
Central Road Fund Works 21.97 7615 Miscellaneous Loans – Loans to Contractors for
purchase of Machineries – Other Contractors 35.47 6 21 4701 Capital Outlay on Major and Medium Irrigation –
Major and Medium Irrigation – Commercial-UKP- Land acquisition, resettlement and rehabilitation – Lift Irrigation Scheme 12.67
Karanja Project AIBP– Other Expenditure 25.27 Medium Irrigation – Commercial- Amarja Project
– Other Expenditure 10.10 Karnataka Neeravari Nigam Limited 64.56 General – Other Expenditure- New Schemes 19.29 4702 Capital Outlay on Minor Irrigation – Surface
Water- Capital Release to Grama Panchayats 125.34 7 22 2210 Medical and Public Health – Public Health –
Prevention & control of Diseases – Malaria 11.69 - Other Expenditure – Health Nutrition &
Population Project 92.93 2211 Family Welfare- Maternity and Child Health –
Reproductive and Child Health Services – National Component 25.73
- Assistance to Zilla Panchayats - Zilla Panchayats 13.70 8 29 2049 Interest Payments - Interest on Loans & advances
from Central Government – Interest on Loans for State Plan Schemes 1093.27
- Interest on Loans for non-plan schemes 44.56 6003 Internal Debt of the State Government- Ways and
Means Advances from Reserve Bank of India- Clean and Secured Ways and Means Advances 1000.00
- Over draft with Reserve Bank of India 350.00 6004 Loans and Advances from the Central
Government- Non Plan Loans – Share of Small Savings collections 46.44
- Loans for State/Union Territory Plan Scheme – Block Loans- Normal assistance 441.87
176

Appendices
Appendix 2.2
Unspent provisions due to non/short-release of funds
(Reference: Paragraph 2.3.2, Page 38) (Rupees in crore)
Sl. No. Grant Head of account Unspent
Provision 1. 2 – Animal Husbandry and
Fisheries 2403-00-101-17 Centrally Sponsored Scheme of setting up of State Veterinary Council
0.26
2. 2403-00-104-0-12 Insurance Scheme to Sheep and Shepherds
5.00
3. 2403-00-113-0-04 Animal Husbandry, Statistics and Live Stock Census
0.34
4. 8 – Forest, Ecology and Environment
2406-00-02-110-20 Nilgiris Biosphere rescue
0.26
5. 2406-00-02-110-47 Development of Wild Life Sanctuaries and National Parks C.S.S
2.06
6 12- Information, Tourism and Youth Services
2204-00-104-11 Other Expenses
0.62
TOTAL 8.54
177

Audit Report (Civil) for the year ended 31 March 2006
Appendix 2.3
Persistent Unspent Provision in excess of Rs.25 lakh and 10 per cent or more of the provision
(Reference: Paragraph 2.3.3, Page 38) (Rupees in crore)
Sl. No. Grant No. Major Head Year
2003-04 2004-05 2005-06 1 01- Agriculture and
Horticulture 2401-796-2- Horticulture Department 0.44 0.52 0.34
(Revenue- Voted) 2401-796-1- Agriculture Department 1.64 1.44 4.38 2 02 – Animal Husbandry
and Fisheries (Revenue- Voted)
2403-101-17- Centrally sponsored scheme of setting up of State Veterinary Council
0.28 0.28 0.26
3 03 – Finance (Revenue – Voted)
2040-800-80- Technical Assistance for VAT (W&A)
1.01 1.00 5.47
2071-01-102-3- Other Payments 161.52 74.42 113.48 2071-01-104-2- Other Gratuities – Karnataka 158.52 0.93 136.93 2071-01-200-06- Adhoc Pensions to Ex-Patels 2.61 2.43 6.79 2075-103-1- Director of State Lotteries 701.35 1018.52 919.99 2216-80-103-01- Subsidy to HDFC on House
Building Loans to Government Servants 3.59 2.49 4.00
(Capital- Voted) 7610-201-02- House Building Advance to All India Service Officers
2.72 2.89 2.97
7610-202-01-Motor Conveyance Advance to Government servants including AIS Officers
4.12 3.45 3.84
7610-202-02- Motor Conveyance to MLAs 0.60 0.81 0.26 7610- 203-01- Government Departments 0.44 0.49 0.50 7610-204-01- Purchase of computers 2.08 0.60 0.95
4 6 - Infrastructure Development
5465-01-190-2 - KSIIDC – Investments 2.20 8.00 2.83 5465-01-190-2 – KSIIDC – BIAP Cell-
Investments 0.95 1.00 1.00
5465-01-190-2- KPTCL for providing power at site - Investments
5.25 5.00 11.00
5 8 – Forest Ecology & Environment (Revenue – Voted)
2406-02-110-20- Nilgiris Bio-sphere rescue 0.26 0.47 0.33
6 18 – Commerce & Industries (Revenue – Voted)
2851-102-29-Lumpsum Provision for Special Component Plan (Corporation and Companies viz LIDKAR, KVIB, KHDC & KSCDS)
5.68 2.22 1.73
2851-102-52-TSP Boards, Corporations and Apex Institutions
1.47 0.58 0.45
2851-103-44-Special Component Plan for Handloom Textiles
0.70 5.44 4.42
2851-107-1- Assistance to Sericulturist (SCP) 0.93 1.00 0.49 2852-800-43-Refund of Sales Tax to Export
Oriented Units 5.06 1.05 11.39
2885-01-101-2- Karnataka Industrial Area Development Board
11.13 6.33 4.00
(Capital – Voted) 4851-108-09-CSS Apparel Park 5.20 5.01 12.20 4852-02-800-01-Industrial Infrastructure for
Industries 14.20 8.00 3.20
6885-60-800-3- Invoking of Guarantees 1.00 1.00 1.00
178

Appendices
Sl. No. Grant No. Major Head Year
2003-04 2004-05 2005-06 7 21- Water Resources 2705-201-01-Tungabhadra Project 1.30 0.67 2.51
(Revenue – Voted) 2705-202-01- Malaprabha and Ghatta Project 1.42 1.18 1.82 2705-203-01- Cauvery Basin Project 1.19 0.73 1.52 2705-204-01- Upper Krishna Project 0.97 0.62 1.92 2705-205-01- Bhadra Project 0.83 0.40 1.25 2705-206-01- Projects 0.67 0.40 1.03
179

Audit Report (Civil) for the year ended 31 March 2006
Appendix 2.4
Cases where amount of unspent provision was not surrendered
(Reference: Paragraph 2.3.4, Page 38)
(Rupees in crore)
Sl. No.
Grant Number
Name of the Grant /Section
Amount of unspent
provision
Amount actually
surrendered
Amount not surrendered
Percentage
(1) (2) (3) (4) (5) (6) (7) 1 1 Agriculture and
Horticulture
Revenue Voted 410.09 - 410.09 100.00 Revenue Charged 0.19 - 0.19 100.00 Capital Voted 18.48 - 18.48 100.00
2 2 Animal Husbandry & Fisheries
Revenue Voted 19.95 1.85 18.10 90.73 Capital Voted 10.64 - 10.64 100.00
3 3 Finance Revenue Voted 1,492.33 23.31 1,469.02 98.44 Capital Voted 93.77 93.47 0.30 0.32
4 4 Department of Personnel and Administrative Reforms
Revenue Voted 23.26 12.83 10.43 44.84 5 5 Home and Transport Revenue Voted 21.87 8.49 13.38 61.18
6 6 Infrastructure Development
Revenue Voted 0.04 - 0.04 100.00 Capital Voted 20.82 - 20.82 100.00
7 7 Rural Development and Panchayat Raj
Revenue Voted 157.64 6.34 151.30 95.98 Capital Voted 102.53 89.00 13.53 13.20
8 8 Forest, Ecology and Environment
Revenue Voted 47.62 18.11 29.51 61.97 Revenue Charged 4.62 - 4.62 100.00 Capital Voted 0.60 0.57 0.03 5.00
9 9 Co-operation Revenue Voted 16.83 8.70 8.13 48.31 Capital Voted 2.17 0.84 1.33 61.29
10 10 Social Welfare Revenue Voted 57.94 0.21 57.73 99.64 Capital Voted 62.73 21.44 41.29 65.82
11 11 Women and Child Development
Revenue Voted 22.06 - 22.06 100.00 Revenue Charged 0.01 - 0.01 100.00 Capital Voted 10.69 - 10.69 100.00
12 12 Information, Tourism and Youth Services
Revenue Voted 5.13 1.84 3.29 64.13 Capital Voted 4.90 - 4.90 100.00
13 13 Food and Civil Supplies
180

Appendices
(1) (2) (3) (4) (5) (6) (7) Revenue Voted 2.53 1.27 1.26 49.80 Capital Voted 8.00 - 8.00 100.00
14 14 Revenue Revenue Charged 0.80 - 0.80 100.00
15 16 Housing Revenue Voted 10.14 - 10.14 100.00 Capital Voted 78.79 - 78.79 100.00
16 17 Education Revenue Voted 82.43 11.60 70.83 85.93 Capital Voted 23.36 - 23.36 100.00
17 18 Commerce and Industries
Capital Voted 51.83 - 51.83 100.00 18 19 Urban Development
Revenue Voted 258.75 - 258.75 100.00 Capital Voted 117.90 - 117.90 100.00
19 20 Public Works Revenue Voted 274.73 53.28 221.45 80.61 Capital Voted 108.49 25.67 82.82 76.34 Capital Charged 0.25 - 0.25 100.00
20 21 Water Resources Revenue Voted 8.77 7.10 1.67 19.04 Capital Voted 291.94 256.78 35.16 12.04
21 22 Health and Family Welfare
Revenue Voted 201.04 46.48 154.56 76.88 Capital Voted 75.35 39.63 35.72 47.41
22 24 Energy Revenue Charged 0.27 - 0.27 100.00 Capital Voted 17.76 - 17.76 100.00
23 25 Kannada and Culture Revenue Voted 5.78 1.69 4.09 70.76
24 26 Planning, Statistics, Science and Technology
Revenue Voted 88.82 4.85 83.97 94.54 25 27 Law
Revenue Voted 13.15 6.46 6.69 50.87 Revenue Charged 0.50 - 0.50 100.00
26 28 Parliamentary Affairs and Legislation
Revenue Voted 11.59 11.38 0.21 1.81 Revenue Charged 0.42 0.40 0.02 4.76
27 29 Debt Servicing Revenue Charged 264.52 0.04 264.48 99.98 Capital Charged 1,491.85 - 1,491.85 100.00 Total 6,096.67 753.63 5,343.04
181

Audit Report (Civil) for the year ended 31 March 2006
Appendix 2.5 Excess requiring regularisation
(Reference: Paragraph 2.4.1, Page 39) (Rupees in crore)
Year
Number of grants/
Appropria- tion
Grant/Appropriation numbers
Amount of excess required to be regularised as
commented in the Appropriation Accounts/Audit
Reports
Actual excess Remarks
1989-90 12/5 7,8,10,24,27,46,47,49,53,20,35,
56,23,45,12, Interest payments 25.89 25.89
1990-91 13/4 6,7,10,13,20,32,45,46,47,52,27,33,35,47,4 35.73 35.68 Excess reduced on account of
reconciliation of expenditure
1991-92 13/3 7,11,14,22,23,36,45,46,47,51, 57,27,24,41, 43 58.99 58.47 -do-
1992-93 12/3 6,9,27,32,34,41,43,44,45,46,50,52,25,33, 34,48 107.47 107.47
1993-94 7/3
22,36,46,49,54,13,29,49,24,43, Internal debt, Loans and advances from Central Government and Inter State Settlements
57. 47 57.47
1994-95 4/6 21,35,3,48,15,24,46,47,55 8.35 7.95 Due to erroneous budget provision
1995-96 9/2 2,33,39,43,45,49,1,46,52,21,44 27.79 27.79
1996-97 9/3 2,16,33,43,49,51,8,24,25,45,1, 21,43,44 104.40 104.40
1997-98 11 12,33,37,39,43,49,51,24,27,32, 55 84.01 84.01
1998-99 12 9,17,33,37,39,40,4,25,46,43,52 35 .86 34.74 Excess reduced on account of reconciliation of expenditure
1999-00 11/2 10, 16, 19, 33, 34, 39, 48, 49, 65, 66, 8, 43. 333 .22 333.22
2000-01 11 5, 15, 24, 35, 38, 49, 7, 10, 42, 30, 44 114.46 114.46
2001-02 10 5, 10, 13, 15, 24, 30, 35, 42, 44, 50 112.64 112.64
2002-03 3/5 53,13,60,15,30,44,55,44 1,090.49 1,090.49
2003-04 6/1 14,16,27,24,8,20,29 2,817.82 2,811.36
Reduction of Rs.6.46 crore is the net result of increase of Rs.0.04 crore due to reconciliation and decrease of Rs.6.50 crore due to rectification of misclassification.
2004-05 5/1 8,17,18,20,24,29 1,919.02 2,204.68
Excess increased due to proforma correction of Rs.285.66 crore under Grant 24 on account of book adjustments relating to power subsidy for 2004-05, not shown in the annual accounts 2004-05
Total 6,933.61 7,210.72
182

Appendices
Appendix 2.6
Persistent Excesses exceeding Rs.20 lakh
(Reference: Paragraph 2.4.3, Page 40)
(Rupees in crore)
Sl. No.
Grant &Head of Account
2003-04 2004-05 2005-06 Total Grant Expenditure Excesses Total
Grant Expenditure Excesses Total Grant Expenditure Excesses
(1) (2) (3) (4) (5) (6) (7) (8) (9) (10) (11) 1 3 - Finance
2071-01-115-2-Social Services 30.18 32.06 1.88 32.23 42.39 10.16 43.69 46.67 2.98
2071-01-115-3-Economic Services 16.86 17.09 0.23 18.01 25.55 7.54 24.40 27.14 2.74
2071-01-115-4- Capital Heads 0.18 1.05 0.87 0.20 1.83 1.63 0.27 3.00 2.73
2 18- Commerce and Industries 3475-797-01-Transfer of Cess to the Infrastructure Initiative Fund 224.00 254.11 30.11 197.62 492.86 295.24 308.92 790.15 481.23
183

Audit Report (Civil) for the year ended 31 March 2006
Appendix 2.7
Cases where supplementary provisions proved unnecessary
(Reference: Paragraph 2.5.1, Page 40)
(Rupees in crore)
Sl. No. Grant No. & Section
No. of Detailed Heads
Amount of Grant/Appropriation
Original Supplementary Expenditure Saving 1 1 (Revenue-Voted) 02 32.34 20.91 29.04 24.21
1 (Capital –Voted) 02 - 7.60 - 7.60
2 3 (Revenue –Voted) 07 7.38 22.44 5.68 24.14
3 5 (Revenue –Voted) 03 25.29 22.46 17.58 30.17
4 7 (Revenue –Voted) 01 2.80 1.00 2.20 1.60
7 (Capital –Voted) 01 - 40.00 - 40.00
5 8 (Revenue –Voted) 02 7.50 5.30 5.25 7.55
6 9 (Capital –Voted) 02 - 1.14 - 1.14
7 12 (Revenue –Voted) 01 - 2.10 - 2.10
12 (Capital –Voted) 01 - 4.90 - 4.90
8 13 (Capital –Voted) 01 - 8.00 - 8.00
9 14 (Revenue – Voted) 08 155.51 62.07 46.55 171.03
14(Capital - Charged) 01 1.37 0.26 - 1.63
10 16 (Capital –Voted) 01 - 51.00 - 51.00
11 17 (Revenue –Voted) 03 125.67 5.34 115.17 15.84
17 (Capital- Voted) 02 10.75 11.00 4.17 17.58
12 18 (Revenue –Voted) 01 - 0.50 - 0.50
18 (Capital- Voted) 04 0.20 16.85 - 17.05
13 20 (Revenue –Voted) 01 85.51 0.50 77.46 8.55
20 (Capital- Voted) 02 - 20.00 - 20.00
14 21 (Capital- Voted) 02 10.00 5.30 7.94 7.36
15 25 (Revenue –Voted) 01 4.09 1.96 3.68 2.37
16 26 (Revenue –Voted) 01 - 8.41 - 8.41
17 27 (Revenue –Voted) 04 - 9.35 - 9.35
18 28 (Revenue –Voted) 01 0.10 0.17 0.01 0.26
Total 55 468.51 328.56 314.73 482.34
184

Appendices
Appendix 2.8
Cases where supplementary provisions proved insufficient
(Reference: Paragraph 2.5.1, Page 40)
(Rupees in crore)
Sl. No. Grant No. & Section
No. of Detailed Heads
involved
Amount of Grant/Appropriation
Original Supplementary Expenditure Excess uncovered
1 1 (Revenue – Voted) 1 0.66 0.04 1.38 0.68
2 5 (Revenue –Voted) 3 596.24 10.96 649.52 42.32
3 6 (Revenue – Voted) 2 11.00 28.16 58.16 19.00
4 7 (Capital– Voted) 1 1.50 1.53 3.34 0.31
5 8 (Revenue - Voted) 1 2.55 0.36 3.02 0.11
6 14 (Revenue – Voted) 1 11.78 484.42 555.06 58.86
7 20 (Capital – Voted) 3 552.00 58.38 627.71 17.33
8 21 (Revenue – Voted) 1 0.51 0.33 1.60 0.76
9 23 (Revenue – Voted) 2 19.37 3.37 32.88 10.14
10 25 (Capital-Voted) 1 1.00 0.50 2.17 0.67
Total 16 1,196.61 588.05 1,934.84 150.18
185

Audit Report (Civil) for the year ended 31 March 2006
Appendix 2.9
Cases where supplementary provisions proved excessive
(Reference: Paragraph 2.5.1, Page 40)
(Rupees in crore)
Sl. No. Grant No. & Section No. of Detailed
Heads involved Amount of Grant/Appropriation
Original Supplementary Expenditure Saving
1 1 (Revenue-Voted) 1 7.95 10.98 13.42 5.51
2 2 (Revenue-Voted) 3 8.59 5.53 12.28 1.84
2 (Capital-Voted) 2 0.01 10.00 3.00 7.01
3 3 (Revenue-Voted) 3 8.25 6.48 12.78 1.95
4 5 (Revenue-Voted) 1 23.29 5.50 28.36 0.43
5 7 (Revenue-Voted) 1 0.95 1.05 0.95 1.05
7 (Capital-Voted) 1 105.89 119.27 211.88 13.28
6 8 (Revenue-Voted) 2 1.00 11.68 6.76 5.92
8 (Capital-Voted) 1 - 0.90 0.28 0.62
7 9 (Revenue-Voted) 2 3.50 22.57 13.25 12.82
8 11 (Revenue-Voted) 1 - 0.50 0.07 0.43
9 14 (Revenue-Voted) 3 86.64 45.40 120.28 11.76
10 17 (Revenue-Voted) 3 197.07 24.55 216.66 4.96
17 (Capital-Voted) 1 1.00 5.00 1.12 4.88
11 18 (Revenue-Voted) 4 4.52 21.87 13.08 13.31
12 20 (Revenue-Voted) 2 83.08 206.78 274.00 15.86
20 (Capital-Voted) 3 164.91 53.79 197.13 21.57
13 21 (Capital-Voted) 1 - 19.81 14.70 5.11
14 23 (Revenue –Voted) 1 - 1.00 0.56 0.44
15 26 (Revenue –Voted) 1 0.32 0.80 0.72 0.40
16 28 (Revenue –Voted) 1 0.10 2.32 0.14 2.28
Total 38 697.07 575.78 1,141.42 131.43
186

Appendices
Appendix 2.10 Injudicious re-appropriation of funds
(Reference: Paragraph 2.5.2, Page 40) (Rupees in crore)
Sl. No Head of Account
Provision (Original plus
Supplementary)
Re-appro- priation
Final Grant
Actual Expenditure
Excess (+)/ Savings (-)
(1) (2) (3) (4) (5) (6) (7) 1 2702 Minor Irrigation 01 Surface Water 101 Water Tanks 02 Maintenance and Repairs 200 Maintenance 15.63 (+)3.92 19.55 23.68 (+)4.13
2 2501 Special programmes for Rural Development
01 Integrated Rural Development programme
198 Assistance to Grama Panchayats
1 Grama Panchayats 01 Block Grants 461 Bagalkot 1.97 (+)0.61 2.58 6.38 (+)3.80
3 2501 Special programmes for Rural Development
01 Integrated Rural Development programme
198 Assistance to Grama Panchayats
1 Grama Panchayats 01 Block Grants 466 Koppal 2.03 (+)0.25 2.28 4.02 (+)1.74
4 3054 Roads and Bridges 01 National Highways 001 Direction and Administration 1 Direction 01 Chief Engineer, National
Highways – Salaries 1.45 (+)0.26 1.71 2.52 (+)0.81
5 2401 Crop Husbandry 196 Assistance to Zilla Panchayats 2 Zilla Panchayats 01 Block Grants 414 Bijapur 0.96 (+)0.01 0.97 1.67 (+)0.70
6 2401 Crop Husbandry 196 Assistance to Zilla Panchayats 2 Zilla Panchayats 01 Block Grants 451 Davanagere 1.53 (+)0.02 1.55 2.20 (+)0.65
7 3054 Roads and Bridges 01 National Highways 337 Road Works 1 Roads and Bridges 01 Execution/SLAO and
Ordinary Repairs - Salaries 8.78 (+)0.58 9.36 9.93 (+)0.57
8 2401 Crop Husbandry 196 Assistance to Zilla Panchayats 2 Zilla Panchayats 01 Block Grants 404 Kolar 1.94 (+)0.15 2.09 2.59 (+)0.50
9 2401 Crop Husbandry 196 Assistance to Zilla Panchayats 2 Zilla Panchayats 01 Block Grants 406 Tumkur 1.73 (+)0.20 1.93 2.35 (+)0.42
187

Audit Report (Civil) for the year ended 31 March 2006
(1) (2) (3) (4) (5) (6) (7) 10 2402 Soil and Water Conservation
196 Assistance to Zilla Panchayats 2 Zilla Panchayats 01 Block Grants 406 Tumkur 1.82 (+)0.97 2.79 3.14 (+)0.35
11 2401 Crop Husbandry 196 Assistance to Zilla Panchayats 2 Zilla Panchayats 01 Block Grants 403 Chitradurga 2.62 (+)0.10 2.72 3.07 (+)0.35
12 2401 Crop Husbandry 196 Assistance to Zilla Panchayats 2 Zilla Panchayats 01 Block Grants 405 Shimoga 0.95 (+)0.02 0.97 1.31 (+)0.34
13 2401 Crop Husbandry 196 Assistance to Zilla Panchayats 2 Zilla Panchayats 01 Block Grants 463 Haveri 0.72 (+)0.05 0.77 1.03 (+)0.26 Total 42.13 (+)7.14 49.27 63.89 (+)14.62
14 2401 Crop Husbandry 110 New Crop Insurance Scheme 059 Other Expenses 200.00 (-)1.00 199.00 8.36 (-)190.64
15 2217 Urban Development 05 Other Urban Development
Schemes
191 Assistance to Local Bodies, Corporations, Urban Development Authorities, Town Improvement Boards, etc.
1 Bangalore Metropolitan Regional Development Authority
07 Karnataka Coastal Management and Urban Development
101 Grants-in-Aid 325.00 (-)25.00 300.00 200.00 (-)100.00 16 3435 Ecology and Environment
60 Others 800 Other Expenditure 05 National River Conservation
Programme
132 Capital Expenses 25.35 (-)0.64 24.71 2.78 (-)21.93 17 2401 Crop Husbandry
800 Other Expenditure 1 Agriculture Department 44 New Agricultural Promotion
Scheme
106 Subsidies 27.43 (-)22.47 4.96 0.62 (-)4.34 18 2225 Welfare of Scheduled Castes,
Scheduled Tribes and Other Backward Classes
01 Welfare of Scheduled Castes 196 Assistance to Zilla Panchayats 1 Zilla Panchayat 01 Block Grants 300 Lumpsum – ZP 5.64 (-)2.59 3.05 - (-)3.05
19 2851 Village and Small Industries 103 Handloom Industries 62 Weavers Package 059 Other Expenses 20.00 (-)5.00 15.00 12.60 (-)2.40
188

Appendices
(1) (2) (3) (4) (5) (6) (7) 20 2501 Special Programmes for Rural
Development
01 Integrated Rural Development Programme
198 Assistance to Grama Panchayat
1 Grama Panchayat 01 Block Grants 407 Mysore 3.68 (-)0.75 2.93 1.40 (-)1.53
21 2401 Crop Husbandry 001 Direction and Administration 2 Horticulture Department 01 Directorate of Horticulture –
Salaries 20.96 (-)1.77 19.19 17.92 (-)1.27
22 2056 Jails 101 Jails 01 Jails 195 Transport Expenses 1.02 (-)0.02 1.00 0.30 (-)0.70
23 2202 General Education 02 Secondary Education 221 Materials and Supplies 5.62 (-)0.93 4.69 4.14 (-)0.55
24 5465 Capital Outlay on General Financial and Trading Institution
01 Investments in General- Financial Institutions
190 Investments in Public Sector and Other Undertakings
2 Investment in Bangalore International Airport Limited (BIAL) through KSIIDC
01 KSIIDC – Investments 10.86 (-)2.38 8.48 8.03 (-)0.45 Total 645.56 (-)62.55 583.01 256.15 (-)326.86
25 5465 Capital Outlay on General Financial and Trading Institution
01 Investments in General- Financial Institutions
190 Investments in Public Sector and Other Undertakings
3 Investments in Rail Infrastructure Development Corporation (Karnataka) Ltd (K-RIDE)
03 Sholapur- Gadag Gauge conversion projects
211 Investments 28.36 (+)26.36 54.72 43.36 (-)11.36 26 2401 Crop Husbandry
800 Other Expenditure 1 Agriculture Department 32 Development of Agriculture
under New Macro Management Mode
139 Major Works 18.93 (+)1.22 20.15 13.42 (-)6.73 27 2501 Special Programmes for Rural
Development
01 Integrated Rural Development Programme
198 Assistance to Grama Panchayats
1 Grama Panchayats 01 Block Grants 404 Kolar 4.81 (+)0.66 5.47 2.30 (-)3.17
189

Audit Report (Civil) for the year ended 31 March 2006
(1) (2) (3) (4) (5) (6) (7) 28 4701 Capital Outlay on Major and
Medium Irrigation
01 Major Irrigation- Commercial 317 Tungabhadra Project- Left
Bank
4 Other Expenditure 07 Distributaries 132 Capital Expenses 1.51 (+)1.31 2.82 0.40 (-)2.42
29 2501 Special Programmes for Rural Development
01 Integrated Rural Development Programme
198 Assistance to Grama Panchayats
1 Grama Panchayats 01 Block Grants 413 Belgaum 4.22 (+)0.51 4.73 2.76 (-)1.97
30 3435 Ecology and Environment 03 Environmental Research and
Ecological Regeneration
003 Environmental Education/Training/Extension
13 National lake conservation programme
139 Major works 3.70 (+)0.64 4.34 2.69 (-)1.65 31 2501 Special Programmes for Rural
Development
01 Integrated Rural Development Programme
198 Assistance to Grama Panchayats
1 Grama Panchayats 01 Block Grants 456 Chamarajnagar 2.61 (+)0.10 2.71 1.09 (-)1.62
32 2501 Special Programmes for Rural Development
01 Integrated Rural Development Programme
198 Assistance to Grama Panchayats
1 Grama Panchayats 01 Block Grants 410 Hassan 2.92 (+)0.45 3.37 1.79 (-)1.58
33 2501 Special Programmes for Rural Development
01 Integrated Rural Development Programme
198 Assistance to Grama Panchayats
1 Grama Panchayats 01 Block Grants 420 Raichur 4.18 (+)0.01 4.19 2.79 (-)1.40
34 2501 Special Programmes for Rural Development
01 Integrated Rural Development Programme
198 Assistance to Grama Panchayats
1 Grama Panchayats 01 Block Grants 451 Davanagere 2.64 (+)0.10 2.74 1.59 (-)1.15
190

Appendices
(1) (2) (3) (4) (5) (6) (7) 35 2501 Special Programmes for Rural
Development
01 Integrated Rural Development Programme
198 Assistance to Grama Panchayats
1 Grama Panchayats 01 Block Grants 463 Haveri 2.60 (+)0.34 2.94 1.63 (-)1.31
36 4701
Capital outlay on Major and Medium Irrigation
01 Major irrigation – commercial 315 Bhadra Project 4 Other Expenditure 03 Canal and Branch 381 Normal 3.01 (+)1.47 4.48 3.56 (-)0.92
37 2501 Special programmes for Rural Development
01 Integrated Rural Development programme
198 Assistance to Grama panchayats
1 Grama panchayats 01 Block Grants 403 Chitradurga 2.79 (+)0.50 3.29 2.37 (-)0.92
38 2401 Crop Husbandry 196 Assistance to Zilla Panchayats 1 Zilla Panchayats 01 Block Grants 414 Bijapur 4.14 (+)0.34 4.48 3.67 (-)0.81
39 2401 Crop Husbandry 196 Assistance to Zilla Panchayats 1 Zilla Panchayats 01 Block Grants 461 Bagalkot 3.79 (+)0.46 4.25 3.51 (-)0.74
40 2401 Crop Husbandry 196 Assistance to Zilla Panchayats 1 Zilla Panchayats 01 Block Grants 451 Davanagere 3.67 (+)0.28 3.95 3.24 (-)0.71
41 2401 Crop Husbandry 196 Assistance to Zilla Panchayats 1 Zilla Panchayats 01 Block Grants 404 Kolar 3.09 (+)0.26 3.35 2.75 (-)0.60
42 2401 Crop Husbandry 196 Assistance to Zilla Panchayats 1 Zilla Panchayats 01 Block Grants 406 Tumkur 3.83 (+)0.33 4.16 3.68 (-)0.48
43 2401 Crop Husbandry 196 Assistance to Zilla Panchayats 1 Zilla Panchayats 01 Block Grants 405 Shimoga 4.06 (+)0.37 4.43 3.97 (-)0.46
44 2402 Soil and Water Conservation 196 Assistance to Zilla Panchayats 2 Zilla Panchayats 01 Block Grants 413 Belgaum 1.38 (+)0.44 1.82 1.38 (-)0.44
45 2401 Crop Husbandry 196 Assistance to Zilla Panchayats 1 Zilla Panchayats 01 Block Grants 403 Chitradurga 2.94 (+)0.58 3.52 3.09 (-)0.43
191

Audit Report (Civil) for the year ended 31 March 2006
(1) (2) (3) (4) (5) (6) (7) 46 2401 Crop Husbandry
196 Assistance to Zilla Panchayats 1 Zilla Panchayats 01 Block Grants 418 Bellary 3.03 (+)0.25 3.28 2.86 (-)0.42
47 2851 Village and Small Industries 103 Handloom Industries 59 Deendayal Hatkarga Yojana-
KHDC
059 Other Expenses 10.95 (+)5.00 15.95 15.53 (-)0.42 48 2401 Crop Husbandry
800 Other Expenditure 1 Agriculture Department 40 Other Agricultural Schemes 100 Financial Assistance/Relief 1.20 (+)12.20 13.40 12.99 (-)0.41
49 2401 Crop Husbandry 108 Commercial Crops 1 Agriculture Department 13 Mini Mission II under
Technology mission on cotton
100 Financial assistance/relief 0.52 (+)1.00 1.52 1.15 (-)0.37 50 2402 Soil and Water Conservation
196 Assistance to Zilla Panchayat 2 Zilla Panchayats 01 Block Grants 403 Chitradurga 1.73 (+)0.16 1.89 1.54 (-)0.35
51 2401 Crop Husbandry 196 Assistance to Zilla Panchayats 1 Zilla Panchayats 01 Block Grants 463 Haveri 3.06 (+)0.24 3.30 2.95 (-)0.35
52 2401 Crop Husbandry 196 Assistance to Zilla Panchayats 1 Zilla Panchayats 01 Block Grants 456 Chamarajnagar 1.97 (+)0.25 2.22 1.87 (-)0.35
53 2401 Crop Husbandry 196 Assistance to Zilla Panchayats 1 Zilla Panchayats 01 Block Grants 402 Bangalore (Rural) 2.41 (+)0.23 2.64 2.32 (-)0.32
54 2401 Crop Husbandry 196 Assistance to Zilla Panchayats 1 Zilla Panchayats 01 Block Grants 466 Koppal 2.55 (+)0.31 2.86 2.55 (-)0.31
55 2401 Crop Husbandry 196 Assistance to Zilla Panchayats 1 Zilla Panchayats 01 Block Grants 413 Belgaum 4.94 (+)0.39 5.33 5.03 (-)0.30
56 2401 Crop Husbandry 196 Assistance to Zilla Panchayats 1 Zilla Panchayats 01 Block Grants 410 Hassan 3.00 (+)0.34 3.34 3.04 (-)0.30
57 2401 Crop Husbandry 196 Assistance to Zilla Panchayats 1 Zilla Panchayats 01 Block Grants 407 Mysore 3.21 (+)0.25 3.46 3.19 (-)0.27
192
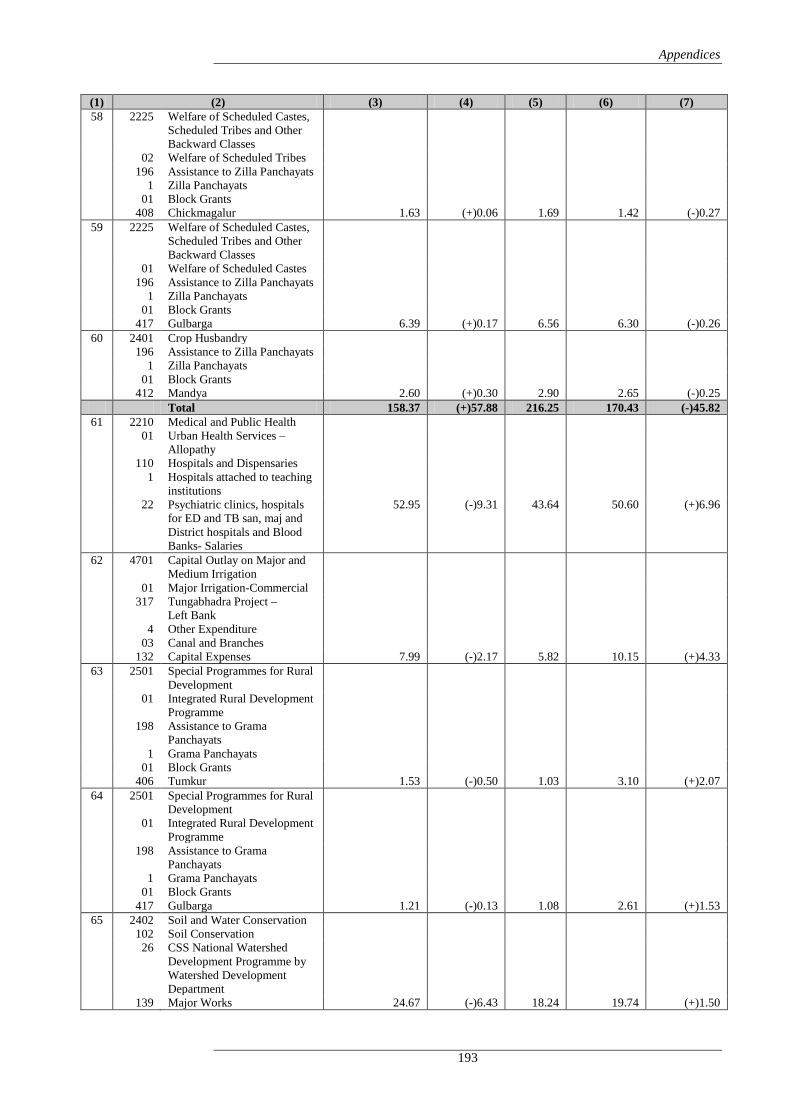
Appendices
(1) (2) (3) (4) (5) (6) (7) 58 2225 Welfare of Scheduled Castes,
Scheduled Tribes and Other Backward Classes
02 Welfare of Scheduled Tribes 196 Assistance to Zilla Panchayats 1 Zilla Panchayats 01 Block Grants 408 Chickmagalur 1.63 (+)0.06 1.69 1.42 (-)0.27
59 2225 Welfare of Scheduled Castes, Scheduled Tribes and Other Backward Classes
01 Welfare of Scheduled Castes 196 Assistance to Zilla Panchayats 1 Zilla Panchayats 01 Block Grants 417 Gulbarga 6.39 (+)0.17 6.56 6.30 (-)0.26
60 2401 Crop Husbandry 196 Assistance to Zilla Panchayats 1 Zilla Panchayats 01 Block Grants 412 Mandya 2.60 (+)0.30 2.90 2.65 (-)0.25 Total 158.37 (+)57.88 216.25 170.43 (-)45.82
61 2210 Medical and Public Health 01 Urban Health Services –
Allopathy
110 Hospitals and Dispensaries 1 Hospitals attached to teaching
institutions
22 Psychiatric clinics, hospitals for ED and TB san, maj and District hospitals and Blood Banks- Salaries
52.95 (-)9.31 43.64 50.60 (+)6.96
62 4701 Capital Outlay on Major and Medium Irrigation
01 Major Irrigation-Commercial 317 Tungabhadra Project –
Left Bank
4 Other Expenditure 03 Canal and Branches 132 Capital Expenses 7.99 (-)2.17 5.82 10.15 (+)4.33
63 2501 Special Programmes for Rural Development
01 Integrated Rural Development Programme
198 Assistance to Grama Panchayats
1 Grama Panchayats 01 Block Grants 406 Tumkur 1.53 (-)0.50 1.03 3.10 (+)2.07
64 2501 Special Programmes for Rural Development
01 Integrated Rural Development Programme
198 Assistance to Grama Panchayats
1 Grama Panchayats 01 Block Grants 417 Gulbarga 1.21 (-)0.13 1.08 2.61 (+)1.53
65 2402 Soil and Water Conservation 102 Soil Conservation 26 CSS National Watershed
Development Programme by Watershed Development Department
139 Major Works 24.67 (-)6.43 18.24 19.74 (+)1.50
193

Audit Report (Civil) for the year ended 31 March 2006
(1) (2) (3) (4) (5) (6) (7) 66 2501 Special Programmes for Rural
Development
01 Integrated Rural Development Programme
198 Assistance to Grama Panchayats
1 Grama Panchayats 01 Block Grants 414 Bijapur 1.87 (-)0.55 1.32 2.28 (+)0.96
67 2701 Major and Medium Irrigation 80 General 001 Direction and Administration 03 Chief Engineer – Irrigation
Central Zone, Munirabad- Salaries
0.62 (-)0.06 0.56 0.96 (+)0.40
68 4701 Capital Outlay on Major and Medium Irrigation
01 Major Irrigation -Commercial 340 Maskinala Project 4 Other Expenditure 03 Canal and Branches 132 Capital Expenses 0.95 (-)0.50 0.45 0.72 (+)0.27 Total 91.79 (-)19.65 72.14 90.16 (+)18.02
194

Appendices
Appendix 2.11
Statement showing the errors in budgeting
(Reference: Paragraph 2.5.4, Page 41)
(Rupees in crore)
Sl. No.
Grant under which provision was made Amount Remarks
1 18- Commerce and Industries 3.81 Provision was to be under Grant No.3 - Finance
2 04- Department of Personnel & Administrative Reforms
0.92 Provision was to be under Grant No.27 - Law
3 10- Social Welfare 0.03 Provision was to be under Grant No. 04- Department of Personnel & Administrative Reforms
4 20- Public Works 20.00 Provision was to be under Grant No.14- Revenue
5 20- Public Works 1.85 Provision was to be under Grant No.07- Rural Development and Panchayat Raj
6 27- Law 0.54 Provision was to be under Grant No.04- Department of Personnel & Administrative Reforms
7 13- Food & Civil Supplies 1.15
8 14- Revenue 24.03 Net amount was included in the Appropriation Act instead of the Gross Amount
9 19 – Urban Development 1.50
10 17 – Education 0.02 Provision was taken as Rs.2.94 crore instead of Rs.2.96 crore provided in the demands for grants
Total 53.85
195

Audit Report (Civil) for the year ended 31 March 2006
Appendix 2.12 Cases of Defective Re-Appropriation Orders
(Reference: Para 2.6, Page 41)
(Rupees in crore)
Sl. No.
No. and Nomenclature of
the Grant
Re-appropriation Order No. & Date
Total amount included in the
Re-appropriation Order
Authority issuing the re-appropriation orders Reason for rejection
1 1-Agriculture and Horticulture
FD 95 BRS 2005 B’lore dt.27.02.06
6.29 Under Secretary to Government, (FR & BCC) Finance Department
The re-appropriation order included an item of expenditure on New Service
2 2-Animal Husbandry & Fisheries
NO.AHE/Budt/Appr/7/05-06 dt.27.01.06
0.02 Director, Animal Husbandry & Veterinary Services
1. Statement NO.22A not self balanced
2.Sanction for re-appropriation not communicated
3 2-Animal Husbandry & Fisheries
No.AHF/22/FD/2006 Dt.23.03.2006
0.07 Under Secretary to Government, Animal Husbandry & Veterinary Services
1.Statement NO.22A not self balanced 2.Specific reasons not communicated 3.Sanction for re-appropriation not communicated
4 3-Finance RLP 3 EBM 2005-06/17.09.06
0.01 Controller, State Accounts Department
Sanction for re-appropriation not communicated
5 3-Finance RLP 3 EBM 2005-06/20.01.06
0.01 Controller, State Accounts Department
Sanction for re-appropriation not communicated
6 3-Finance FD 235 BRS 2006(1)/31.03.06
0.44 Under Secretary Finance Department (FR&BCC)
Internal columns does not agree, specific reason not given.
7 4-Department of Personnel & Administrative Reforms
FD 09 TE[ 2004 DT.07.04.06
0.02 Registrar, Karnataka Lokayukta, Bangalore
1. Specific reasons for savings not furnished. 2.Sanction order not signed in ink
8 4-Department of Personnel & Administrative Reforms
FD 306 BRS 2005 DT.25.05.05
0.99 Under Secretary Finance Department (FR&BCC)
1. Specific reasons for savings not furnished. 2. Sanction order not signed in ink, only xerox copy received
9 5-Home and Transport
Acct(6)19/ra/ms/2005-06/3.01.06
0.02 DGP, Commandant Cant., Home Guards, Director of Civil Defence
1. Specific reasons not communicated. 2. Internal columns does not agree.
10 5-Home and Transport
01 SEL HUN KKM NO.249/06 22.02.06
0.05 Secretary to Government, Transport Department, Karnataka
1. Specific reasons not communicated 2. Administration dept to sanction exceeding Rs.5 lakh 3. Not signed in ink
11 5-Home and Transport
FD 72 KAGAISE 2005 DT.17.08.05
0.01 Under Secretary to Government, Home Department(Police Service)
1. Not signed in ink 2. Internal columns does not agree.
12 7-Rural Development and Panchayat Raj
FD 50 BRS 2006 Bangalore dt.10.02.06
102.06 Under Secretary, Finance Department (FR&BCC)
1. Government order not signed in ink. 2. Details in the statement not clear
13 7-Rural Development and Panchayat Raj
RDP 14 AHASI 2006 B’lore dt.07.03.06
0.01 Under Secretary to Government (RDPR)
Statement is not self balanced
196

Appendices
Sl. No.
No. and Nomenclature of
the Grant
Re-appropriation Order No. & Date
Total amount included in the
Re-appropriation Order
Authority issuing the re-appropriation orders Reason for rejection
14 7-Rural Development and Panchayat Raj
FD 59 BRS 2006 B’lore dt.14.02.06
12.52 Under Secretary, Finance Department (FR&BCC)
Order includes an item of New Service
15 9-Co-operation
BUD BM 01 2005-06 DT.08.02.06
0.02 Registrar of Co-operative Societies, Karnataka
Sanction order has not been signed in ink
16 12-Information Tourism and Youth Services
VAHI TIPASA 2005-06 22696-700 DT.02.02.06
0.02 Commissioner, Information Department
Heads of the Department are informed to sanction re-appropriation not exceeding Rs.2 lakh from one detailed head to another within the major head
17 14-Revenue NO.RB 7 Bhudasa 2006 DT.25.01.06
0.12 Secretary to Government of Karnataka, Revenue Department (Land Survey)
The Government order exceeded the powers delegated to Secretary to Government, Administrative Department
18 17-Education FD 66/ BRS 2006 B’LORE DT.17.02.06
0.15 Under Secretary, Finance Department
1. Re-appropriation not admissible without provision 2. Prior approval from Planning department not taken
19 17-Education A 3/APUV 03/2005-06 DT.23.02.06
0.02 Director of Public Instruction, DSERT B’lore
1. Specific reasons not given 2. Sanction for re-appropriation not taken
20 17-Education FD 38 BRS 2005 B’LORE DT.27.12.2005
1.62 Under Secretary, Finance Department
1. Re-appropriation order not signed in ink 2. Prior approval from Planning department not taken
21 18-Commerce and Industries
DSK:Sibbandi:21:2003-04 dt.14.11.2005
0.0025 Commission for Cane Development and Director of Sugar
1. Re-appropriation not self-balanced 2. Not in prescribed form 3. Specific reasons not furnished
22 19-Urban Development
UDD 70 MNU 06 Bangalore dt.04.04.06
0.13 Under Secretary to Government, Urban Development
Re-appropriated Head of Account does not agree with Budget Estimate
23 19-Urban Development
UDD 69 MNU 06 Bangalore dt.24.03.06
0.01 -do- Statement was not self balanced
24 22-Health & Family Welfare
HFW289 PIM 2006 dt.19.09.2005
0.40 Under Secretary to Government, Health & Family Welfare Dept.
Re-appropriation order not issued by Finance Department
25 22-Health & Family Welfare
HFW 68 CGE 2006 dt.6.03.06
0.19 -do- -do-
26 22-Health & Family Welfare
HFW 74 PIM 2006 dt.29.03.06
0.20 -do- -do-
27 22-Health & Family Welfare
HFW 66 PIM 2006 dt.02.03.06
0.50 -do- -do-
28 22-Health & Family Welfare
HFW 70 HPC 2006 dt.29.03.06
0.60 -do- -do-
29 23-Labour KE 293 LIT DT.28.03.06
0.03 Secretary to Government, Labour Department
Statement was not self balanced
30 25-Kannada and Culture
SANKE E 32 KMU 2006 B’lore dt15.03.06
0.20 Karnataka Government Secretariat, Department of Archaeology and Museums , Bangalore
1. Specific reasons not furnished 2. Sanction from Finance Department not obtained
31 27-Law 48/AG/ACCOUNTS/ 2005-06 DT.26.10.05
0.0050 Advocate General, High Court of Karnataka, Bangalore
Re-appropriation not self balanced
Total 126.7375
197

Audit Report (Civil) for the year ended 31 March 2006
Appendix 2.13 Statement showing flow of expenditure during the
four quarters of 2005-06
(Reference: Paragraph 2.7, Page 41) (Rupees in crore)
Sl. No.
Head of Account
1st Quarter
2nd Quarter
3rd Quarter
4th Quarter Total March 2006
Percentage of expenditure in
March 2006 to total expenditure of
2005-06 1 2047 1.20 11.04 11.36 15.82 39.42 15.14 38.41
2 2075 0.08 10.94 11.26 1635.70 1657.98 1634.07 98.56
3 2501 2.83 13.20 9.59 34.76 60.38 21.26 35.21
4 2505 6.31 19.79 15.62 42.66 84.38 29.81 35.33
5 2506 0.23 0.40 0.46 4.77 5.86 4.15 70.82
6 2705 2.38 10.58 8.45 19.86 41.27 12.66 30.68
7 2711 0.06 0.07 0.10 0.26 0.49 0.24 48.98
8 2810 0.04 1.03 0.03 2.53 3.63 1.26 34.71
9 3425 0.47 0.25 0.87 7.23 8.82 3.37 38.21
10 3455 - 0.06 0.12 0.39 0.57 0.39 68.42
11 3604 108.68 144.83 149.78 755.67 1158.96 662.81 57.19
12 4210 - 1.41 1.69 4.58 7.68 3.47 45.18
13 4235 - 0.36 0.20 3.02 3.58 3.02 84.36
14 4402 - 4.24 4.70 11.05 19.99 7.06 35.32
15 4403 - - - 0.10 0.10 0.10 100.00
16 4405 0.13 0.28 0.29 4.86 5.56 4.80 86.33
17 4406 - - 0.06 0.71 0.77 0.56 72.72
18 4408 - - - 0.10 0.10 0.10 100.00
19 4852 - - - 6.80 6.80 3.00 44.12
20 5051 0.85 0.39 0.94 3.53 5.71 2.85 49.91
21 6211 - - - 0.35 0.35 0.32 91.43
22 6215 0.62 - 25.62 26.25 52.49 26.25 50.01
23 6416 - 0.93 1.03 3.69 5.65 3.69 65.31
24 6851 - - - 0.09 0.09 0.09 100.00
25 7610 0.70 0.44 0.25 1.09 2.48 0.66 26.61
198

Appendices
Appendix 2.14 Cases of New Service/New Instrument of Service
(Reference: Paragraph 2.8, Page 42)
(Rupees in crore) Sl. No. Grant Head of Account Budget
Provision Expenditure Excess
(1) (2) (3) (4) (5) (6) 1 3-Finance 2071-Pensions and Other Retirement
Benefits
01-Civil 101- Superannuation and Retirement
Allowances
4- Payment of Pensionary charges to other Governments under the State Re-organisation Act, 1956
02- Maharashtra 251-Pensions and Retirement Benefits 0.12 2.06 1.94
2 2071-Pensions and Other Retirement Benefits
01-Civil 104-Gratuities 2-Other Gratuities- Karnataka 04-DCRG under the Triple Benefit
Scheme 251-Pensions and Retirement Benefits 0.02 6.96 6.94
3 2071-Pensions and Other Retirement Benefits
01-Civil 104-Gratuities 2-Other Gratuities- Karnataka 05- Gratuities to Ex-
Shanbhags/Karnams/Patwaries 251-Pensions and Retirement Benefits 0.06 1.73 1.67
4 2071-Pensions and Other Retirement Benefits
01-Civil 110- Pension of Employees of Local
Bodies 1- Payment to Municipal Employees 04- Family Pensions 251-Pensions and Retirement Benefits 3.96 18.07 14.11
5 2071-Pensions and Other Retirement Benefits
01-Civil 115- Leave Encashment Benefits 2- Social Services 25- Welfare of SC, STs, & OBCs 251-Pensions and Retirement Benefits 0.23 1.54 1.31
6 2071-Pensions and Other Retirement Benefits
01-Civil 115- Leave Encashment Benefits 4- Capital Heads 01- Major and Medium Irrigation 251-Pensions and Retirement Benefits 0.27 3.00 2.73
199

Audit Report (Civil) for the year ended 31 March 2006
Sl. No. Grant Head of Account Budget
Provision Expenditure Excess
(1) (2) (3) (4) (5) (6) 7 18 – Commerce and
Industries 6860- Loans for Consumer Industries
04- Sugar 190- Loans to Public Sector and Other
Undertakings
01- Conversion of Purchase Tax into Interest Free Loans
17- Conversion in respect of Units Established under World Bank Assistance 0.50 3.37 2.87
8 20-Public Works 2059-Public Works 80- General 053- Maintenance and Repairs 4- Repairs, Maintenance and Minor
Alterations to various Departmental buildings
071- Building Expenses 0.61 9.97 9.36 9 3054- Roads and Bridges 03- State Highways 102 – Bridges 01- Repairs to Bridges 200- Maintenance 4.27 22.39 18.12
10 5054- Capital Outlay on Roads and Bridges
03- State Highways 101- Bridges 01- Construction of Bridges and Culverts
and improvements of existing ones on State Highways
172- Roads 0.20 4.45 4.25 11 5054- Capital Outlay on Roads and
Bridges 05- Roads of Inter-State or Economic
importance 337- Road Works 2- Works of Economic Importance 01- Road Works 172- Roads 1.50 6.67 5.17
12 21- Water Resources 4702- Capital Outlay on Minor Irrigation 101- Surface Water 1- Water Tanks – Construction of New
Tanks, Pick ups, etc. 06- Restoration of old and Breached
Tanks and de-silting of Tank 139- Major Works 0.09 2.88 2.79 Total 11.83 83.09 71.26
200

Appendices
Appendix 2.15 Expenditure without budget provision 2005-06
(Reference: Paragraph 2.9, Page 42) (Rupees in crore)
Sl. No. Grant Head of Account Amount
[
1 2 3 4 1 03- Finance
2039- State Excise
001- Direction and Administration 01- Commissioner for Excise and Other Establishment 499- Refunds 0.09
2 2039- State Excise 001- Direction and Administration 01- Commissioner for Excise and Other Establishment 500- Lumpsum 0.14
3 2040- Taxes on Sales, Trade, etc 001- Direction and Administration 01- Commissioner for Commercial Taxes 499- Refunds 0.09
4 2040- Taxes on Sales, Trade, etc 001- Direction and Administration 01- Commissioner for Commercial Taxes 500- Lumpsum 0.01
5 2040- Taxes on Sales, Trade, etc 101- Collection Charges 499- Refunds 0.31
6 04- Department of Personnel and Administrative Reforms
2014 – Administration of Justice 102- High court 500- Lumpsum 0.01
7 07- Rural Development and Panchayat Raj
2575- Other Special Area Programme 60- Others 001- Direction and Administration 1- Development of North Karnataka 01- Development Commissioner, Belgaum 051- General Expenses 0.02
8 2575- Other Special Area Programme 60- Others 001- Direction and Administration 1- Development of North Karnataka 01- Development Commissioner, Belgaum 195- Transport Expenses 0.02
9 08- Forest, Ecology and Environment
2406- Forestry and Wild Life 01- Forestry 102- Social and Farm Forestry 2- Other Schemes 80- Forestry and Environment Project for Eastern Plains
(OEEF)
139- Major Works 0.01 10 6406- Loans for Forestry and Wildlife 101- Forest Development and Regeneration 80- Eastern Karnataka Afforestation Project IDP 124 0.01
11 10 –Social Welfare 2225- Welfare of Scheduled Castes, Scheduled Tribes and Other Backward Classes
03- Welfare of Backward Classes 277- Education 2- Welfare of Other Backward Classes 46- Grants-in Aid to Private Post Matric Hostels and
Buildings 0.11
201

Audit Report (Civil) for the year ended 31 March 2006
1 2 3 4 12 2225- Welfare of Scheduled Castes, Scheduled Tribes and
Other Backward Classes
03- Welfare of Backward Classes 277- Education 2- Welfare of Other Backward Classes 47- Starting and improvements of Hostels – Salaries 0.05
13 12- Information, Tourism and Youth Services
2204- Sports and Youth Services 800- Other Expenditure 12- Financial Assistance to Sportspersons and wrestlers in
indigent circumstances
251- Pension and Retirement Benefits 0.10 14 17- Education 2202- General Education 01- Elementary Education 191- Assistance to Local Bodies, Corporations, etc. 2- Assistance to Other Local Bodies for Elementary
Education
03- Teaching 0.15 15 19-Urban Development 2217- Urban Development 05- Other Urban Development Schemes 191- Assistance to Local Bodies, Corporations, Urban
Development Authorities, Town Improvement Boards, etc.
2- Karnataka Urban Development 80- Coastal Management 051- General Expenses 0.36
16 2217- Urban Development 05- Other Urban Development Schemes 800- Other Expenditure 80- FRGL – 450- IE Digital Mapping Information System
for Bangalore BDA
051- General Expenses 1.03 17 6217- Loans for Urban Development 60- Other Urban Development Schemes 191- Loans to Local bodies and Corporations, etc. 2- Bangalore Metropolitan Regional Development
Authority
81- FRGL- 450 IE Digital Mapping Information System for Bangalore Development Authority (BDA)
395- Loans to PSUs and Local Bodies 2.41 18 6217- Loans for Urban Development 60- Other Urban Development Schemes 191- Loans to Local bodies and Corporations, etc. 3- Loans to Trust Boards for Information of
Layouts/Extension
80- Karnataka Infrastructural Project 395- Loans to PSUs and Local Bodies 0.87
19 20- Public Works 3054- Roads and Bridges 01- National Highways 799- Suspense 02- Credits 297- Miscellaneous Works Advances 0.24
20 22- Health & Family Welfare 2210- Medical and Public Health 01- Urban Health Services- Allopathy 110- Hospitals and Dispensaries 2- Major Hospitals 34- Urban Health Services Scheme – Salaries 0.01
21 2210- Medical and Public Health 01- Urban Health Services- Allopathy 110- Hospitals and Dispensaries 2- Major Hospitals 83- Karnataka Health Systems Project 051- General Expenses 0.34
202
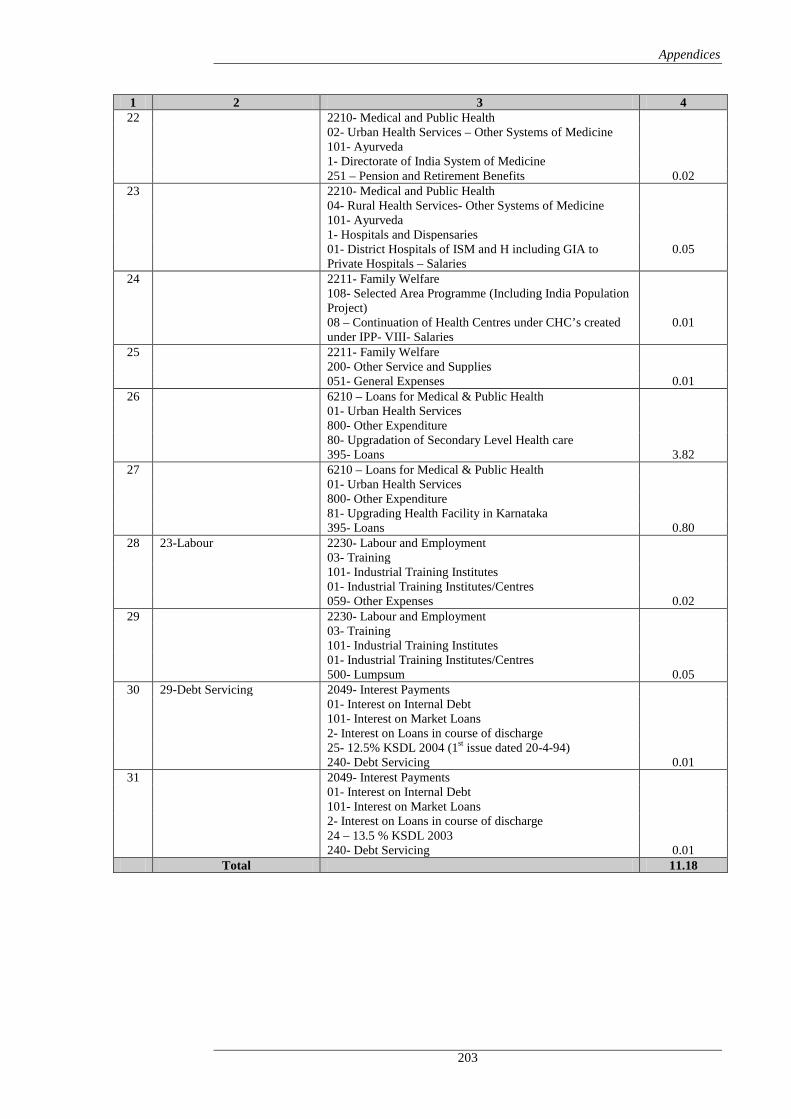
Appendices
1 2 3 4 22 2210- Medical and Public Health 02- Urban Health Services – Other Systems of Medicine 101- Ayurveda 1- Directorate of India System of Medicine 251 – Pension and Retirement Benefits 0.02
23 2210- Medical and Public Health 04- Rural Health Services- Other Systems of Medicine 101- Ayurveda 1- Hospitals and Dispensaries 01- District Hospitals of ISM and H including GIA to
Private Hospitals – Salaries 0.05
24 2211- Family Welfare 108- Selected Area Programme (Including India Population
Project)
08 – Continuation of Health Centres under CHC’s created under IPP- VIII- Salaries
0.01
25 2211- Family Welfare 200- Other Service and Supplies 051- General Expenses 0.01
26 6210 – Loans for Medical & Public Health 01- Urban Health Services 800- Other Expenditure 80- Upgradation of Secondary Level Health care 395- Loans 3.82
27 6210 – Loans for Medical & Public Health 01- Urban Health Services 800- Other Expenditure 81- Upgrading Health Facility in Karnataka 395- Loans 0.80
28 23-Labour 2230- Labour and Employment 03- Training 101- Industrial Training Institutes 01- Industrial Training Institutes/Centres 059- Other Expenses 0.02
29 2230- Labour and Employment 03- Training 101- Industrial Training Institutes 01- Industrial Training Institutes/Centres 500- Lumpsum 0.05
30 29-Debt Servicing 2049- Interest Payments 01- Interest on Internal Debt 101- Interest on Market Loans 2- Interest on Loans in course of discharge 25- 12.5% KSDL 2004 (1st issue dated 20-4-94) 240- Debt Servicing 0.01
31 2049- Interest Payments 01- Interest on Internal Debt 101- Interest on Market Loans 2- Interest on Loans in course of discharge 24 – 13.5 % KSDL 2003 240- Debt Servicing 0.01 Total 11.18
203

Audit Report (Civil) for the year ended 31 March 2006
Appendix 3.1
Delay in release of funds
(Reference: Paragraph 3.1.6.1, Page 46)
Year Name of
Tiger Reserve
Date of release of funds Amount released
(Rs. in lakh)
Delay in release of
funds (in months)
GOI GOK
2002-03 BWLS
01.08.2002 26.11.2002 15.00 3 ½ 24.09.2002 11.12.2002 35.00 2 ½ 18.12.2002 31.03.2002 12.25 3 ½
BTR 30.12.2002 25.03.2003 63.45 2 ½ RGNNP 27.09.2002 18.03.2003 7.80 5 ½
2003-04 BWLS 07.07.2003 20.09.2003 30.37 2 ½ 18.12.2003 03.03.2004 5.00 2 ½
2003-04 RGNNP 30.07.2003 17.01.2004 15.20 5 ½
2004-05 RGNNP 31.12.2004 04.03.2005 36.49 2 30.08.2004 08.11.2004 72.50 2
204

Appendices
Appendix 3.2
Shortfall in achievement during the period 2001-06
(Reference: Paragraph 3.1.6.1, Page 46)
Activity area Target Achievement Shortfall
BTR Non-Recurring Construction of Quarters 10 Nos. 3 Nos. 7 Nos. Formation of Roads 85 kms 48.50 kms 36.50 kms Establishment of Anti-Poaching Camps 3 Nos. -- 3 Nos. Construction of Check Dams/Culverts 17 Nos. -- 17 Nos. Bore well 6 Nos. -- 3 Nos. Purchases : a) Night Vision Binoculars 1 No. -- 1 No. b) Computers 2 Nos. -- 2 Nos. Eco Development Activities a) Solar Fencing 17 Nos. 4 Nos. 13 Nos. b) Soil Conservation 12 Nos. 7 Nos. 5 Nos. c) Supply of Seedlings 5,000 Nos. 2,900 Nos. 2,100 Nos. d) Silt Removal 30 kms. -- 30 kms. Recurring Road Maintenance 158 kms 83 kms 75 kms Building Maintenance 20 Nos. 9 Nos. 11 Nos. Fireline Maintenance 1,810 kms 1,403 kms 407 kms Desilting of Waterhole 20 Nos. 9 Nos. 11 Nos. Providing Jeeps to Strike Force 2 Nos. -- 2 Nos. BWLS Eco Development Water facility 10 Nos. 2 Nos. 8 Nos Training to staff 10 Camps 2 Camps 8 Nos. Non-Recurring Construction of Quarters 2 Nos. -- 2 Nos. Construction of Culverts 13 Nos. 4 Nos. 9 Nos. Construction of Bridge 1 No. -- 1 No. Solar Street Lights 7 Nos. -- 7 Nos. Purchase of Wireless Sets 40 Nos. 22 Nos. 18 Nos. Recurring Establishment of Anti-Poaching Camps 18 Nos. 12 Nos. 6 Nos. Providing Water facilities 6 Nos. -- 6 Nos. RGNNP Non-Recurring Construction of Quarters 2 Nos. - 2 Nos. Road Development 63 kms -- 63 kms Restoration of Patrolling Tracks/Areas 65 kms -- 65 kms Engagement of Tribals for Protection work 35 Nos. -- 35 Nos. Relocation of Tribals 100 Families -- 100 Families
205

Audit Report (Civil) for the year ended 31 March 2006
Appendix 3.3
Statement showing the avoidable expenditure due to unwarranted widening of roads
(Reference: Paragraph 3.3.7.5, Page 75)
Sl. No
PWD Division
Major District Road (MDR)
Stretch of MDR
widened
Traffic intensity
(in Passenger
Car Units)
Widened to intermediate-
lane/ double-lane
Expenditure on widening (Rupees in
lakh)
1 Bellary
Banni Hatti Rajapur – Metriki Road
km 0 to 8 1,306 to 1,541
Intermediate-lane
37.58
2 Hampasagara – Hadagali Road km 0 to 3 1,461 26.38
3 Hassan
Manjirabad – Kukke Subramanya Road
km 0 to 19.70 976 10.27
4 Kattaya – Hallibylu Road
km 16.35 to 19.50 1,944 3.43
5 Hagare – Halebeedu Road
km 0 to 5.81 891 20.13
6
Nelamangala-Bettadahalli-Shravanabelagola Road
km 22.40 to 32.40 1,013 40.82
7 Shravanabelagola-KR Pet Road
12.84 kms (selected reaches)
1,013 44.61
8
Tiptur Railway Station Road-Shravanabelagola Road
29.10 kms (selected reaches)
1,013 15.46
9 Kolar Balghat – Marikuppam Road
km 0 to 3 2,766
Double-lane
56.08
10 Mandya Mandya – Nagamangala Road
km 0 to 40.80 4,952 147.53
Total 135.40 402.29
206

Appendices
Appendix 3.4
Statement showing the shortfall in crust thickness
(Reference: Paragraph 3.3.8.2, Page 76)
Sl . No.
Name of the work (road)
Chainage (from – to)
Expenditure (Rs. in lakh)
Initial traffic (in Commercial Vehicles per
Day) Traffic growth rate (percentage)
Design traffic (in MSA) Design life (in years)
Design crust thickness (mm)
Shortfall (-)/ Excess
(+) in crust
thickness
As reckoned in the
estimate
As per published
census data
As per estimate
As per actuals1
As per estimate
As per actuals11
As per IRC
norms
As per estimate
-1- -2- -3- -4- -5- -6- -7- -8- -9- -10- -11- -12- -13- -14- Shortfall in pavement thickness and reduction in design life
1 Bellary-Belagal-Haraginadona
0 to 1.3 34.16 266 763 30.0 3.60 31.16 10 3.46 710 560 (-) 150 0 to 22 108.83 268 2,632 16.0 1.10 71.52 10 0.34 740 430 (-) 310
2 Bellary-Talur 16 to 22.5 26.51 638 1,807 35.9 3.00 98.81 10 1.58 860 585 (-) 275 3 HB Halli-Kudligi 0 to 5 54.59 954 1,244 48.0 12.31 122.72 10 4.55 640 200 (-) 440
4 Hadagali-Madalagatta 0 to 2.9 and 10.3 to 11.2 26.38 145 428 22.5 1.00 16.06 10 1.70 780 425 (-) 355
5 Harapanahalli-Hadagali 13.5 to 27 12.75 192 561 18.7 3.00 17.45 10 3.37 720 580 (-) 140
6 Holagundi-Hadagali-Mylara 0 to 10 43.82 413 752 12.8 7.00 17.52 10 5.47 720 650 (-) 70
7 Hospet-Kampli 0 to 3.2 79.50 3,996 3,996 66.4 2.00 150.00 10 0.47 720 640 (-) 80 27 to 31 42.52 156 3,996 249.0 2.81 150.00 10 0.58 770 490 (-) 280 27 to 31.2 42.52 8,331 8,331 247.0 1.15 150.00 10 0.19 770 490 (-) 280
8 Ittigi-Ujjini 0 to 5 34.32 181 1,627 75.2 5.00 750.37 10 1.84 820 605 (-) 215 5 to 16 64.09 1,106 1,106 19.1 2.00 35.05 10 1.37 760 540 (-) 220 30.4 to 38.4 54.87 402 1,209 30.0 6.00 49.37 10 3.57 675 550 (-) 125
9 Ittigi-Sovenahalli 0 to 14 46.82 267 446 15.3 5.00 11.74 10 5.98 765 690 (-) 75 10 Kottur-HB Halli 9.6 to 27.6 29.15 132 117 (-) 1.3 1.20 1.41 10 8.42 380 150 (-) 230
11 Kudadarahal - K Belagal 11 to 24.2 114.46 302 411 126.0 3.89 150.00 10 2.48 975 640 (-) 335
12 Link road from SH 19 to NH 63 (outer ring road)
0 to 5.2 177.27 338 2,380 128.0 6.18 150.00 10 1.82 890 755 (-) 135
13 Sandur-Navalatti 0 to 5.2 and 6.4 to 8.3 129.63 270 593 12.0 2.00 9.97 10 3.11 700 540 (-) 160
14
Siruguppa-Kenchanagudda- M Sugur
0 to 8.50 and 19.30 to 26 81.66 198 419 30.3 2.55 24.81 10 3.22 890 525 (-) 365
1 Design traffic and design life had been worked out by substitution of factual values for designed parameters in the formula prescribed in IRC 37 of 2001
207

Audit Report (Civil) for the year ended 31 March 2006
-1- -2- -3- -4- -5- -6- -7- -8- -9- -10- -11- -12- -13- -14-
15 BB Road to join BT Road 0 to 41 264.02 606 3,384 21.84 17.69 122.91 10 3.23 760 690 (-) 70
16 Bindiganavile- Kadaballi 0 to 14.5 263.33 555 465 50.01 16.20 67.35 10 6.62 790 730 (-) 60
17 Hanakere-Koppa 4 to 13.5 106.00 391 391 (-) 2.76 3.54 4.42 10 7.78 680 510 (-) 170 18 KR Pet –Akkihebbal 0 to 15.33 206.90 484 764 12.48 14.13 17.53 10 8.78 600 580 (-) 20 19 Mandya-Melkote 0 to 6 115.60 950 4,509 35.56 35.60 323.27 10 3.82 770 730 (-) 40
20 Srirangapatna-Sosale –Shivanasamudra 0 to 14.4 257.61 821 1,269 26.45 23.97 57.93 10 6.78 780 690 (-) 90
21 Aurad-Murki 0 to 22.8 60.75 225 225 8.6 1.60 4.28 10 4.74 600 450 (-) 150
22 Gattahalli-Nenmaranahalli 0 to 12 50.40 317 317 13.0 6.50 7.46 10 9.22 650 375 (-) 275
23 Tiptur-CR Patna 10 to 26 111.38 561 561 10.1 10.00 11.48 10 9.44 580 340 (-) 240 24 Yamanur-Tirlapur 3.4 to 8 36.42 179 179 5.4 1.52 2.93 10 5.83 580 510 (-) 70 25 Bidi-Kittur-Alagawadi 67 to 70 36.80 62 62 124.2 0.62 87.67 10 3.92 800 480 (-) 220 26 Belavangala-Arudi 0.25 to 18.75 60.00 545 545 5.3 7.00 15.37 15 8.27 560 465 (-) 85
Total 2,773.06 - - - - - - - - - - Achievement of excessive pavement thickness and design life
27 Adoni-Siruguppa 26.6 to 39.6 133.46 569 292 17.0 6.55 8.95 10 8.48 450 675 (+) 225 28 Udbal-Hallikhed 10.8 to 13.6 41.42 70 70 8.6 2.00 0.57 10 20.64 480 540 (+) 60 29 Chintamani-Chelur 21.4 to 28.75 100.00 424 424 14.0 13.00 10.47 10 11.24 580 630 (+) 50
30 BC Road - CC road 2 to 10.2 80.01 247 247 13.0 10.00 5.81 10 13.36 520 570 (+) 50
31 Mulbagal- K Byapalli 0 to 11.8 30.21 159 159 13.0 6.50 3.74 10 13.43 480 540 (+) 60
32 KR Nagar-Ramanathapura 31 to 36 50.00 228 228 10.1 7.00 4.66 10 12.80 560 620 (+) 60
33 Sulla-Bengeri 8 to 11 44.72 179 179 5.8 3.24 2.99 10 10.64 580 590 (+) 10
34 Tumkur-Chelur-Bukkapatna 32 to 54 104.40 578 578 7.6 17.00 10.50 10 13.81 620 650 (+) 30
35 Didaga-Dabbeghatta 75.7 to 80.5 31.75 128 128 7.6 5.65 2.32 10 17.59 540 630 (+) 90 36 Gubbi-CS Pura 0 to 10 58.90 389 389 7.6 8.00 7.06 10 10.91 500 525 (+) 25
Total 674.87 - - - - - - - - - - Pavement thickness conforming to norms but excessive design life
37 Chikmalur-Sogala 2.25 to 19.2 40.00 98 98 16.2 4.07 2.57 10 12.59 360 360 0 38 Chintamani-Chelur 1.6 to 4.1 25.14 372 372 14.0 10 9.19 10 10.48 500 500 0
Total 65.14 - - - - - - - - - - Grand Total 3,513.07 - - - - - - - - - -
208

Appendices
Appendix 3.5
Statement showing shortfall in quality control tests
(Reference: Paragraph 3.3.10.1, Page 81)
Sl . No.
Item of work
Quantity executed
Quantity of material
components Description of test
Quality control tests (in No.s)
Metal (cum)
Bitumen (MT) Prescribed Conducted Shortfall
No.s Percentage
1 Gravel sub-base
5,73,131 cum
- -
Gradation 2,868 516 2,352 82 Atterberg limits 2,808 437 2,371 84
Moisture content 2,232 434 1,798 81
Density of compacted layer
1,116 191 925 83
2
Water Bound Macadam (WBM)
2,15,389 cum
2,15,389
-
Aggregate Impact (AI) value
1,077 745 332 31
Flakiness & Elongation Indices (F&EI)
1,077 174 903 84
Grading of aggregates 200 79 121 61
Atterberg Limits for aggregates
2,154 537 1,617 75
Atterberg Limits for Gravel Blindage
7,628 149 7,479 98
3. Bituminous items of work
A Surface dressing
7,02,389 sqm 10,536 1,264
AI Value/ FI/EI 3,113 1,270 1,843 50
B
Bituminous Macadam (including Depression Filling)
46,705 cum 66,702 6,173
C
Semi Dense Bituminous Concrete
5,410 cum 32,030 840
Grading of aggregates 4,993 1,023 3,970 80
D Mix Seal Surfacing (Type B)
12,72,601 sqm 32,704 2,343
209

Audit Report (Civil) for the year ended 31 March 2006
Appendix 3.6
Statement showing the IRI values of MDRs
(Reference: Paragraph 3.3.10.2, Page 81)
Sl . No. Name of the road Chainages
Total length
(in km)
Length of road having
IRI value
of greater than 6
IRI values (range)
Proportionate expenditure on pro-rata
basis (Rs. in lakh)
Date of completion
Public Works Division, Bellary
1. Ittigi- Ujjini road km 5 to 16 10.00 7.00 6.83 to 10.66 16.86 April 2002
2 Hadagali- Uttangi km 0 to 14.60 14.60 9.60 6.15 to
6.89 25.97 May 2002
3 Ittigi- Sovenahalli road
km 15 to 16 and km 21 to 23
5.00 2.00 7.39 to 9.27 8.10 May 2002
4 HB Halli- Hampasagara road
km 5.80 to 20.90 11.9 10.00 6.14 to
10.88 26.24 May 2002
5 Gudekote- Appenahalli road
km 0 to 11.60 (selected reaches)
7.80 5.00 6.24 to 10.6 19.29 December
2001
6 Siruguppa- Deshanur- Veerapur road
km 0 to 8 8.00 4.00 8.78 28.42 May 2002
7 Bellary – Kalyandurga road
km 0.80 to 16.20 15.40 9.00 6.4 to
12.33 112.42 NA
Public Works Division, Bidar
8 Bidar Chillargi road km 7 to 13 6.00 5.00 6.14 to 8.53 17.59 May 2001
9 Matala-Salagar road km 9 to 16.90 7.90 2.00 6.25 to
9.32 8.28 January 2002
10 Hallikhed- Udbal road
km 19.50 to 25 5.5 5.00 6.20 to
8.51 19.45 February 2002
11 Hallikhed- Udbal road
km 10.8 to 16 and 19 to 22
9.2 7.00 6.80 to 11.05 17.61 March
2002
Total 100.3 65.6 300.23
210

Appendices
Appendix 3.7 Summary of findings of beneficiary survey conducted by Social and Rural
Research Institute (SRI) – IMRB International (Reference: Paragraph 3.5.5, Page 95)
In Karnataka, the Survey for the assessment of Sarva Shiksha Abhiyan (SSA) covered 270 units comprising 138 Urban Blocks and 132 Rural Villages. Findings of the Survey are summarised below:
1. Household details
1.1 Out of total 45,889 households listed, 5,564 households were covered for the study. About 29.8 per cent of the heads of the households were illiterates, about 13.9 per cent were literates but not completed primary schooling and only about 9.7 per cent of the households were graduates.
1.2 Household study revealed that about one per cent of the households had children below the age of 15 years as earning members.
2. School details
2.1 With regard to coverage of schools, 5.3 per cent of the villages and 14.5 per cent of the urban areas were still not covered under SSA. Out of 540 schools covered in 270 units, 94.7 per cent of primary schools, 81.3 per cent of upper primary schools and 90.5 per cent of high schools with upper primary sections were co-educational.
2.2 Among the schools covered, about 99.6 per cent of both primary and upper primary schools and 66.7 per cent of high schools with upper primary sections had received grants/aid under SSA funds.
3. Coverage of children under SSA
About 27 out of every 1,000 children in the age group 6-14 years comprising both boys and girls equally were out of school. In rural and urban areas, 38 and 11 out of 1,000 children respectively were out of school. More proportion of children from marginalised groups like SC and ST were out of school when compared with children from other social groups.
4. Civil works and facilities under SSA
4.1 About 1.1 per cent of primary schools did not have any building at all. Among the schools in which civil works were taken up, 39.2 per cent of primary schools, 39.3 per cent of upper primary schools and 38.1 per cent of high schools with upper primary sections reported constructing new buildings.
4.2 About 19 per cent of primary schools, 20.8 per cent of upper primary schools and 1.6 per cent of high schools with upper primary sections reported constructing separate toilets for girls in addition to existing toilets.
211

Audit Report (Civil) for the year ended 31 March 2006
4.3 About 10.1 per cent of primary schools, 10.3 per cent of upper primary schools and 1.3 per cent of high schools with upper primary sections undertook construction of compound walls for safety and security to the school environment.
4.4 For constructing water supply installations, 26 per cent of primary schools, 26.4 per cent of upper primary schools and 1.4 per cent of high schools with upper primary sections utilised the SSA funds.
4.5 About 6.7 per cent of primary schools, 7.6 per cent of upper primary sections and 1.4 per cent of high schools with upper primary sections reportedly utilised funds to construct separate libraries.
4.6 Six per cent of primary schools, 7.4 per cent of upper primary schools and 1.4 per cent of high schools with upper primary sections constructed staff room for the teachers. 8.8 per cent of primary schools, 11.2 per cent of upper primary schools and 1.1 per cent of high schools with upper primary sections reported constructing separate room for the headmaster.
5. Utilisation of grants under SSA
About 93.1 per cent of primary schools, 90.2 per cent of upper primary schools and 50 per cent of the high schools with upper primary sections had accessed school grant and almost 96.2 per cent of primary schools and upper primary schools and 35.7 per cent of high schools with upper sections had received teachers grant. About 9.9 per cent of primary schools, 13.2 per cent of upper primary schools and none of the high schools with upper primary sections had accessed the grant under provisions for disabled children.
6. Community Involvement
About 46.4 per cent of primary schools, 46.9 per cent of upper primary schools and two per cent of high schools with upper primary sections had education committees formed in the locality. It was found that 45.5 per cent of primary schools, 46.6 per cent of upper primary schools and two per cent of high schools with upper primary sections had bank accounts jointly started with the headmaster of the school. In about 72.9 per cent of schools, the community members have also been trained under SSA.
7. School infrastructure
7.1 About 1.9 per cent of primary schools, 2.6 per cent of upper primary schools and 4.8 per cent of high schools with upper primary sections were operating in kutcha structures, which are basically not structurally stable and hence not suitable for running an institution like a school.
7.2 While 86.3 per cent of primary schools, 83.2 per cent of upper primary schools and 52.4 per cent of high schools with upper primary sections reported that girl children are being given free text books, about 82.1 per cent of primary schools, 79.8 per cent of upper primary schools and 47.6 per cent of
212

Appendices
high schools with upper primary sections reported that free text books are given to SC & ST students in the schools.
8. School based schemes
8.1 34.6 per cent of primary schools, 30.3 per cent of upper primary schools and 38.1 per cent of high schools with upper primary sections reported implementing operation blackboard. ‘Mahila Samakhya’ scheme was implemented in 3.4 per cent of primary schools, 6.4 per cent of upper primary schools and 23.8 per cent of high schools with upper primary sections.
8.2 Mid-day meal scheme was reportedly implemented in 97 per cent of primary schools, 97.4 per cent of upper primary schools and 23.8 per cent of high schools with upper primary sections of the government schools visited in the State. Across the state about 56.3 per cent of the children reported that mid-day meals are being served in their schools which comprised of 73.3 per cent in rural and 39.8 per cent in urban areas.
8.3 Only 13.3 per cent of primary schools and 9.4 per cent of upper primary schools reported implementation of "Janashala" a UNICEF assisted programme to enhance the learning experience in government schools. NPEGEL – a programme to cater to special education needs of the girl children is being implemented in about 6.1 per cent of primary schools and 15.7 per cent of upper primary schools. Neither Janashala nor NPEGEL was implemented in high schools with upper primary sections.
8.4 About 58.6 per cent of primary schools, 63.7 per cent of upper primary schools and 28.6 per cent of high schools with upper primary sections in the state reported that back to school camps are being conducted.
8.5 About 79.5 per cent of primary schools, 78.7 per cent of upper primary schools and 81.0 per cent of high schools with upper primary sections reported that teaching learning materials (TLM) have been given to all the classes and about 11 per cent of primary schools, 15.7 per cent of upper primary schools and 9.5 per cent of high schools with upper primary sections reported that TLM have been given to some of the classes. No TLM have been provided in about 9.5 per cent of primary schools, 5.6 per cent of upper primary schools and 9.5 per cent of high schools with upper primary sections.
9. Impact of education schemes
21.1 per cent of parents stated that the main reason for children not being enrolled in school as they were "too young to go to school". Whereas 16.3 per cent and 13.0 per cent of parents cited reason as "I have to go to work" and "cannot afford school" respectively.
10. Quality of education.
10.1 Among those children who attend school, around 0.1 per cent said that their school does not open on time. 0.5 per cent of the children revealed that their school is not open on all days that it is meant to be open.
213

Audit Report (Civil) for the year ended 31 March 2006
10.2 About 0.1 per cent of the children reported that the teachers are very irregular to school and about 0.2 per cent reported that teachers are not so regular to the school. About 0.3 per cent of children said that the teachers do not take classes for the full duration for which the classes are meant to be taken.
11. Reach of Beneficiary schemes
About 53.1 per cent of the children said that they received free text books, 95.8 per cent (95.2 per cent in rural areas and 97 per cent in urban areas) of them reported that they received all the free text books on time.
12. Overall satisfaction level
About 76.7 per cent of the parents were extremely satisfied as compared to 0.4 per cent who said that they were not satisfied with the quality of education that their children were getting in the schools.
214

Appendices
Appendix 3.8
Statement showing selected component-wise allocation and expenditure during 2001-04
(Reference: Paragraph 3.5.6, Page 97)
Serial number Activity
Cumulative allocation (2001-04)
Cumulative achievement (2001-04)
Shortfall in achievement
(Rupees in lakh ) (in per cent )
1 EGS Centres 129.42 20.41 84.23
2 Teachers against new primary schools
421.20 0 100.00
3 Teachers against upgraded primary schools
286.20 0 100.00
4 Additional teachers 2,517.48 5.27 99.79
5 Teachers training in-service 4,663.53 1,008.25 78.38
6 Research, evaluation and Supervision
1,296.09 255.01 80.32
7 Provision for disabled children 1,221.23 241.89 80.19
8 Innovative activity (Girls/SC/ST) children
459.70 230.17 49.93
9 Community mobilisation 29.33 0 100.00
215

Audit Report (Civil) for the year ended 31 March 2006
Appendix 3.9
Dropout rate for primary and upper primary schools
(Reference: Paragraph 3.5.8.2, Page 99)
Sl. No. District
Primary school (I-V)
Upper primary school (I-VII)
2004-05 2004-05 Boys Girls Total Boys Girls Total
1. Bagalkot 5.48 4.10 4.82 22.76 23.01 22.88
2. Bangalore Rural 3.25 6.35 4.77 20.04 21.28 20.66
3. Bangalore Urban♠ 14.14 13.15 13.66 39.85 39.65 39.75
4. Belgaum♠ 10.27 9.47 9.89 24.29 26.48 25.39
5. Bellary♠ 5.87 6.78 6.31 24.19 26.39 25.29
6. Bidar 18.23 17.58 17.91 39.40 31.94 35.67
7. Bijapur 7.16 10.49 8.77 29.88 28.90 29.39
8. Chamarajanagar 8.01 8.14 8.07 20.61 19.68 20.15
9. Chikmagalur 9.44 9.12 9.28 22.10 27.99 25.04
10. Chitradurga♠ 8.80 8.85 8.83 25.55 26.94 26.24
11. Dakshina Kannada 5.57 0.12 3.01 16.46 17.31 16.89
12. Davanagere 2.21 2.83 2.52 24.20 17.89 21.05
13. Dharwad 4.95 3.12 4.06 18.08 14.98 16.53
14. Gadag 7.40 6.79 7.11 24.34 23.70 24.02
15. Gulbarga 19.23 22.74 20.94 44.03 45.66 44.85
16. Hassan♠ 6.46 4.55 5.53 22.38 27.17 24.78
17. Haveri 5.69 4.07 4.91 17.52 16.43 16.97
18. Kodagu 8.22 5.99 7.16 19.89 21.47 20.68
19. Kolar♠ 10.67 9.28 9.99 23.04 23.34 23.19
20. Koppal 10.50 11.92 11.19 28.76 28.80 28.78
21. Mandya 4.48 4.77 4.62 25.76 24.48 25.12
22. Mysore 9.53 6.35 7.98 26.06 21.20 23.63
23. Raichur 12.07 10.67 11.40 37.41 30.88 34.14
24. Shimoga 4.17 2.72 3.46 24.09 19.58 21.84
25. Tumkur 11.35 11.68 11.51 19.19 20.46 19.82
26. Udupi 0.77 3.33 2.02 10.64 15.84 13.24
27. Uttara Kannada 1.52 5.24 3.36 18.58 22.39 20.48
Total average 7.98 7.78 7.89 24.78 24.59 24.68
(♠: Test-checked districts)
216

Appendices
Appendix 4.1
Statement showing the wasteful expenditure
(Reference: Paragraph 4.1.1, Page 123)
(Amount in Rupees)
Stretch
BM provided under Mandya Package but subsequently
removed by KRDCL
SDBC provided under Mandya Package but subsequently removed
by KRDCL Quantity
(cum) Rate Amount Quantity (cum) Rate Amount
86 - 93.200 - - - 1,416.85 3,150 44,63,077 93.200 - 94 304.42 2,334 7,10,516 154.11 3,150 4,85,446 95 - 96 - - - 193.31 3,150 6,08,926 102 - 103 - - - 201.58 3,150 6,34,977 103.500 - 107.000 - - - 812.54 3,150 25,59,501
107.500-110.100 - - - 367.64 3,150 11,58,066
118.500-119.500 291.60 2,316 6,75,345 225.20 3,162 7,12,082
122.800-123.750 - - - 275.03 3,162 8,69,645
124.770-126.270 - - - 313.02 3,162 9,89,769
127-127.800 298.68 2,316 6,91,743 170.86 3,162 5,40,259 128-129 - - - 185.52 3,162 5,86,614 129.200-131 - - - 339.98 3,162 10,75,017
Total 20,77,604 1,46,83,379 Grand total: Rs.1,67,60,983 (or) Rs.1.68 crore
217

Audit Report (Civil) for the year ended 31 March 2006
Appendix 4.2
Excess Payment of Family Pension
(Reference: Paragraph 4.5.2.1, Page 139)
(Rupees in lakh)
Sl.No. District No. of cases Amount Period 1 Bagalkot 10 1.80 11/03-10/05 2 Bangalore (Rural) 16 6.62 8/94-10/05 3 Belgaum 47 7.84 5/03-6/05 4 Bellary 24 2.69 10/02-10/05 5 Bidar 36 5.98 8/03-10/05 6 Bijapur 8 2.45 12/03-2/06 7 Chamarajanagar 16 1.59 1/03-3/05 8 Chikkamagalur 14 1.41 8/02-3/05 9 Chitradurga 4 0.29 9/04-8/05 10 Davanagere 24 3.04 7/03-6/05 11 Dharwar 5 0.74 5/04-10/05 12 Gadag 10 1.71 2/03-9/05 13 Gulbarga 19 1.57 9/04-12/05 14 Hassan 36 4.19 1/04-11/05 15 Haveri 30 3.59 4/04-7/05 16 Hubli 3 0.56 7/04-7/05 17 Karwar 13 3.84 11/03-6/05 18 Kolar 34 6.50 10/01-5/05 19 Koppal 5 0.67 11/03-6/05 20 Madikeri 4 0.52 5/03-1/06 21 Mandya 22 4.55 5/03-1/06 22 Mangalore 19 3.53 4/98-11/05 23 Mysore 18 1.71 5/04-3/05 24 PPT 78 27.82 6/85-9/05 25 Raichur 43 5.55 7/04-7/05 26 Shimoga 37 4.46 1/00-5/05 27 Tumkur 34 10.98 10/02-9/05 28 Udupi 20 3.20 2/98-10/05 Total 629 119.40
218

Appendices
Appendix 4.3
Continued Excess Payment of Family Pension
(Reference: Paragraph 4.5.2.1, Page 139)
Sl.No. District No. of Cases
Amount (Rupees in lakh) Period
1 Bagalkot 1 0.27 11/04-10/05 2 Bangalore (Rural) 6 3.20 10/02-10/05 3 Bellary 3 0.62 10/04-6/05 4 Bidar 2 0.32 9/04-10/05 5 Bijapur 2 0.74 10/04-2/06 6 Chamarajanagar 2 0.20 6/04-3/05 7 Chikkamagalur 16 0.69 1/05-3/05 8 Davanagere 5 0.79 9/04-6/05 9 Dharwar 4 0.70 7/04-3/05
10 Gadag 8 2.20 7/04-9/05 11 Gulbarga 2 0.53 1/04-12/05 12 Haveri 5 0.80 7/03-7/05 13 Karwar 4 1.69 6/04-11/05 14 Kolar 17 2.11 6/03-5/05 15 Koppal 15 1.69 7/03-6/05 16 Mandya 1 0.16 1/05-7/05 17 Mangalore 1 0.35 5/04-11/05 18 Mysore 9 1.65 4/04-3/05 19 PPT 15 5.96 10/03-9/05 20 Raichur 19 3.84 7/04-7/05 21 Shimoga 60 7.68 10/04-5/05 22 Tumkur 6 1.05 1/05-9/05 23 Udupi 5 2.55 5/04-11/05
Total 208 39.79
219
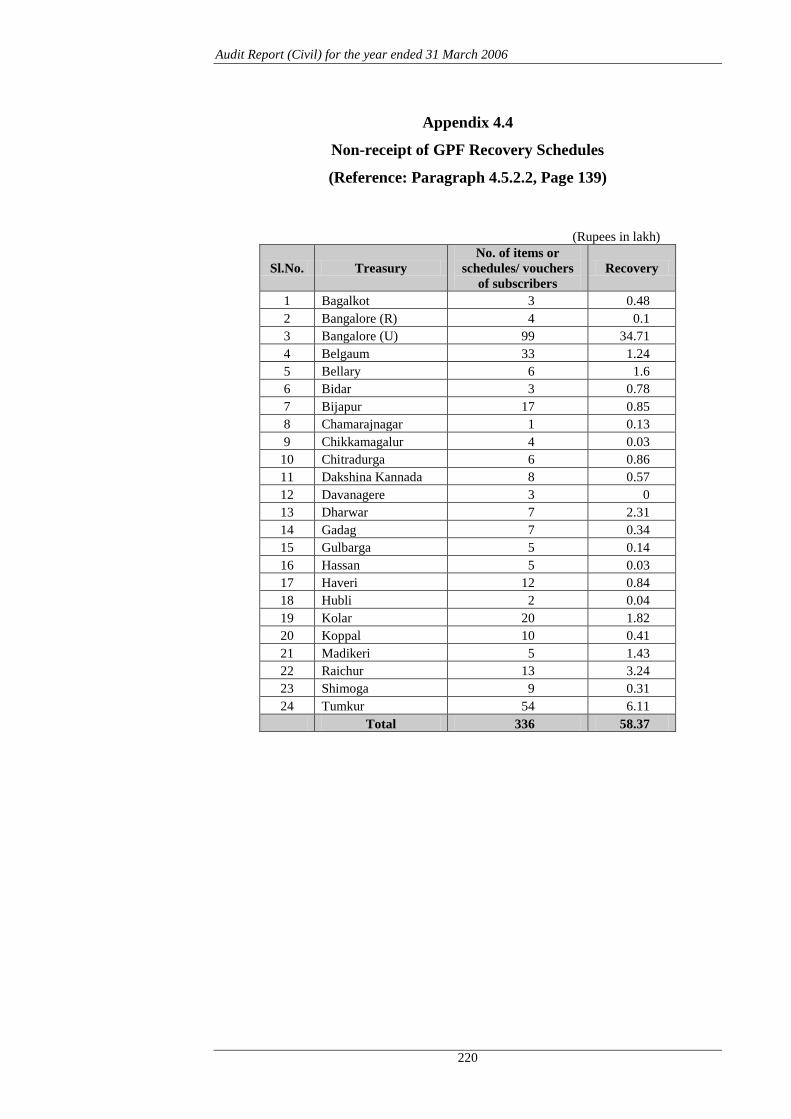
Audit Report (Civil) for the year ended 31 March 2006
Appendix 4.4
Non-receipt of GPF Recovery Schedules
(Reference: Paragraph 4.5.2.2, Page 139)
(Rupees in lakh)
Sl.No. Treasury No. of items or
schedules/ vouchers of subscribers
Recovery
1 Bagalkot 3 0.48 2 Bangalore (R) 4 0.1 3 Bangalore (U) 99 34.71 4 Belgaum 33 1.24 5 Bellary 6 1.6 6 Bidar 3 0.78 7 Bijapur 17 0.85 8 Chamarajnagar 1 0.13 9 Chikkamagalur 4 0.03
10 Chitradurga 6 0.86 11 Dakshina Kannada 8 0.57 12 Davanagere 3 0 13 Dharwar 7 2.31 14 Gadag 7 0.34 15 Gulbarga 5 0.14 16 Hassan 5 0.03 17 Haveri 12 0.84 18 Hubli 2 0.04 19 Kolar 20 1.82 20 Koppal 10 0.41 21 Madikeri 5 1.43 22 Raichur 13 3.24 23 Shimoga 9 0.31 24 Tumkur 54 6.11
Total 336 58.37
220

Appendices
Appendix 4.5
Non-receipt of GPF Withdrawal Vouchers
(Reference: Paragraph 4.5.2.2, Page 139)
(Rupees in lakh)
Sl.No. Treasury No. of items or vouchers Withdrawals
1 State Huzur Treasury 2 11.82 2 Bellary 1 0.82 3 Mandya 1 3.55 4 Bangalore (U) 1 1.13 5 Karwar 1 0.25 6 Belgaum 4 0.71 7 Mysore 3 0.67 8 Chikkamagalur 2 0.54 9 Shimoga 1 0.20
10 Koppal 1 0.10 11 Raichur 5 4.25
Total 22 24.04
221

Audit Report (Civil) for the year ended 31 March 2006
Appendix 4.6
Balances held in PD accounts at the end of 2005-06
(Reference: Paragraph 4.5.4.3, Page 143)
(Rupees in crore)
Sl. No. Administrator Balance
1. Secretary, Hyderabad-Karnataka Area Development Board, Gulbarga
38.73
2. Commissioner, Social Welfare 26.22
3. Director, Small Savings & Lotteries
(a) Account No. 1 4.69
(b) Account No 2 16.11
(c) Account No. 3 0.59
4. Commissioner, Food & Civil Supplies 13.30
5. Director, Health & Family Welfare Services 3.35
6. Commissioner, Textiles & Handlooms 0.48
7. DC, Belgaum
CRF 4.21
Miscellaneous 15.04
8. DC, Mangalore
CRF 2.15
Miscellaneous 10.30
9. DC, Gulbarga
CRF 1.02
Miscellaneous 10.47
10. DC, Madikeri
CRF 6.55
11. DC, Shimoga
CRF 2.94
Miscellaneous 8.28
12.
DC, Bangalore(U)
CRF 0.02
Miscellaneous 8.32 Total 172.77
DC: Deputy Commissioner, CRF: Calamity Relief Fund
222
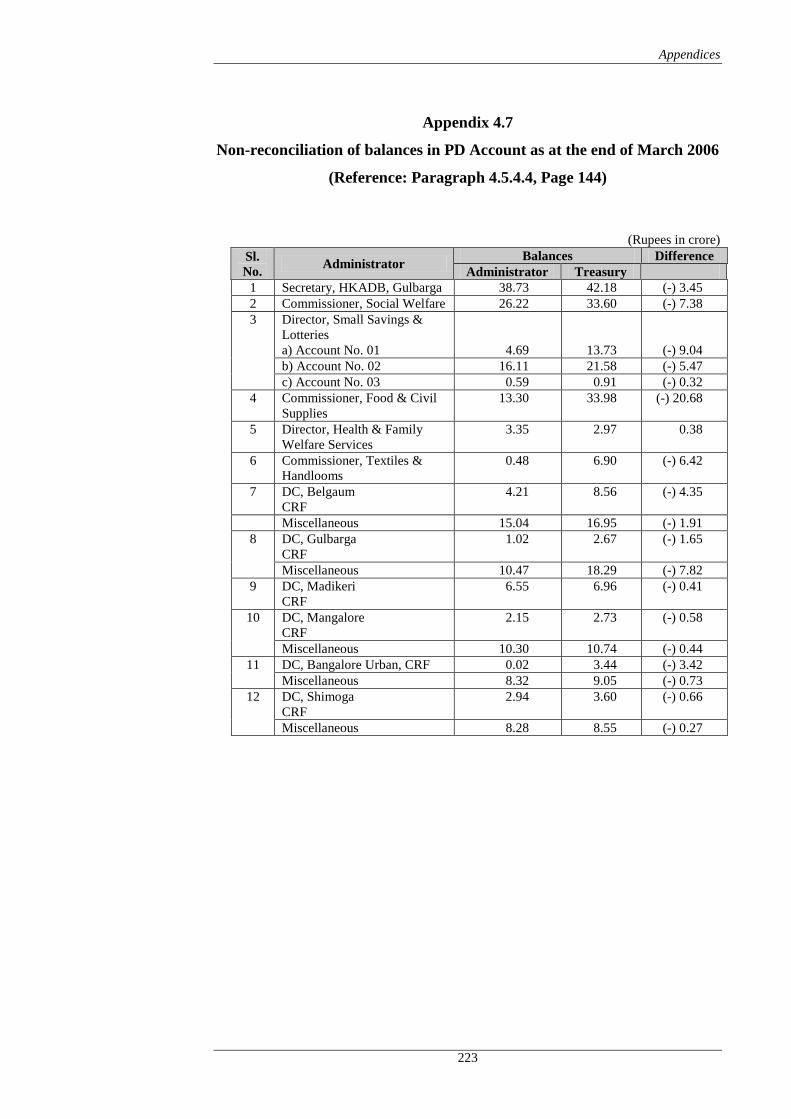
Appendices
Appendix 4.7
Non-reconciliation of balances in PD Account as at the end of March 2006
(Reference: Paragraph 4.5.4.4, Page 144)
(Rupees in crore) Sl. No. Administrator Balances Difference
Administrator Treasury 1 Secretary, HKADB, Gulbarga 38.73 42.18 (-) 3.45 2 Commissioner, Social Welfare 26.22 33.60 (-) 7.38 3 Director, Small Savings &
Lotteries a) Account No. 01 4.69 13.73 (-) 9.04
b) Account No. 02 16.11 21.58 (-) 5.47 c) Account No. 03 0.59 0.91 (-) 0.32
4 Commissioner, Food & Civil Supplies
13.30 33.98 (-) 20.68
5 Director, Health & Family Welfare Services
3.35 2.97 0.38
6 Commissioner, Textiles & Handlooms
0.48 6.90 (-) 6.42
7 DC, Belgaum CRF
4.21 8.56 (-) 4.35
Miscellaneous 15.04 16.95 (-) 1.91 8 DC, Gulbarga
CRF 1.02 2.67 (-) 1.65
Miscellaneous 10.47 18.29 (-) 7.82 9 DC, Madikeri
CRF 6.55 6.96 (-) 0.41
10 DC, Mangalore CRF
2.15 2.73 (-) 0.58
Miscellaneous 10.30 10.74 (-) 0.44 11 DC, Bangalore Urban, CRF 0.02 3.44 (-) 3.42
Miscellaneous 8.32 9.05 (-) 0.73 12 DC, Shimoga
CRF 2.94 3.60 (-) 0.66
Miscellaneous 8.28 8.55 (-) 0.27
223

Audit Report (Civil) for the year ended 31 March 2006
Appendix 4.8 Paragraphs for which Action Taken Notes had not been received as of
October 2006 (excluding General and Statistical Paragraphs) (Reference: Paragraph 4.6.1.1, Page 145)
Sl. No Department Audit Report (Civil)
1995-96 1996-97 1997-98 1998-99 1999-2000 2000-01 2001-02 2002-03 2003-04 2004-05 Total
1. Animal Husbandry & Veterinary Services - - - 1 - 1 - - - 1 3
2. Commerce and Industries - - 1 1 - 2 - - 1 - 5 3. Ecology and Environment - - - - - - 1 - - - 1 4. Education - - - - - - - 1 1 - 2
5. Food, Civil Supplies & Consumer Affairs - - - - - - - - - 1 1
6. Forest - - - - - - - 2 1 - 3 7. Finance - - - 4 2 3 2 1 2 2 16 8. Health & Family Welfare 3 2 - 1 2 3 - - 3 2 16 9. Home - - - - - - - 1 3 - 4 10. Housing 1 - - - - - - - - 1 2
11. Information, Tourism, Youth Services & Sports - - - - 1 - - 1 - - 2
12. Information Technology and Bio-technology - - - - - - - - - 1 1
13. Kannada and Culture - - - - - - - - - 1 1 14. Labour - - - - - - 1 - 1 - 2 15. Legislature Secretariat - - - - 1 - - - - - 1 16. Minor Irrigation - - 1 - - - - - 1 4 6 17. Planning - - - - 1 - - - - - 1 18. Public Works - - - - - - - - 1 1 2 19. Revenue - - 1 - - - 1 - - 1 3 20. Sericulture - - - - - - - - 1 - 1 21. Social Welfare 2 - 2 1 1 1 - - - - 7 22. Urban Development - - - - - - - - - 6 6 23. Water Resources - - - - - - - 2 2 3 7
24. Women & Child Development - - - - - - - 1 - - 1
25. Forest, Home & Transport - 1 - - - - - - - - 1
26. Health & Family Welfare, PW and RDPR - - - - - - - 1 - - 1
Total 6 3 5 8 8 10 5 10 17 24 96
224
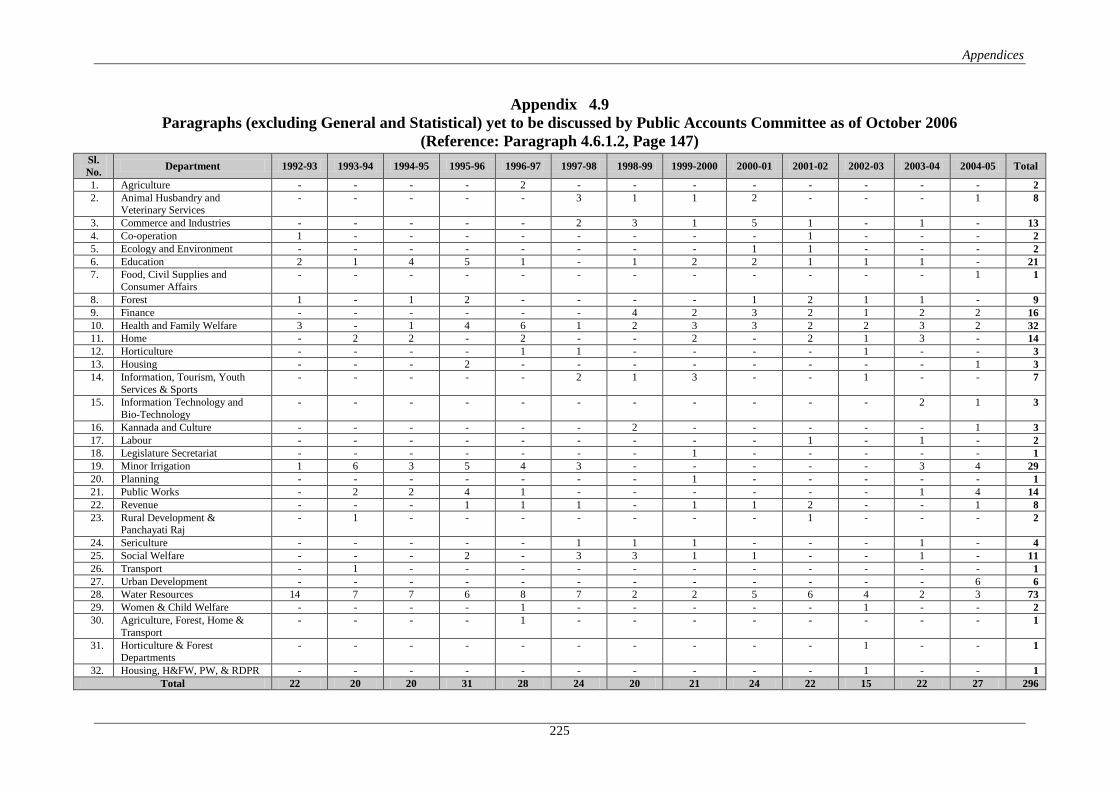
Appendices
Appendix 4.9 Paragraphs (excluding General and Statistical) yet to be discussed by Public Accounts Committee as of October 2006
(Reference: Paragraph 4.6.1.2, Page 147)
Sl. No. Department 1992-93 1993-94 1994-95 1995-96 1996-97 1997-98 1998-99 1999-2000 2000-01 2001-02 2002-03 2003-04 2004-05 Total
1. Agriculture - - - - 2 - - - - - - - - 2 2. Animal Husbandry and
Veterinary Services - - - - - 3 1 1 2 - - - 1 8
3. Commerce and Industries - - - - - 2 3 1 5 1 - 1 - 13 4. Co-operation 1 - - - - - - - - 1 - - - 2 5. Ecology and Environment - - - - - - - - 1 1 - - - 2 6. Education 2 1 4 5 1 - 1 2 2 1 1 1 - 21 7. Food, Civil Supplies and
Consumer Affairs - - - - - - - - - - - - 1 1
8. Forest 1 - 1 2 - - - - 1 2 1 1 - 9 9. Finance - - - - - - 4 2 3 2 1 2 2 16 10. Health and Family Welfare 3 - 1 4 6 1 2 3 3 2 2 3 2 32 11. Home - 2 2 - 2 - - 2 - 2 1 3 - 14 12. Horticulture - - - - 1 1 - - - - 1 - - 3 13. Housing - - - 2 - - - - - - - - 1 3 14. Information, Tourism, Youth
Services & Sports - - - - - 2 1 3 - - 1 - - 7
15. Information Technology and Bio-Technology
- - - - - - - - - - - 2 1 3
16. Kannada and Culture - - - - - - 2 - - - - - 1 3 17. Labour - - - - - - - - - 1 - 1 - 2 18. Legislature Secretariat - - - - - - - 1 - - - - - 1 19. Minor Irrigation 1 6 3 5 4 3 - - - - - 3 4 29 20. Planning - - - - - - - 1 - - - - - 1 21. Public Works - 2 2 4 1 - - - - - - 1 4 14 22. Revenue - - - 1 1 1 - 1 1 2 - - 1 8 23. Rural Development &
Panchayati Raj - 1 - - - - - - - 1 - - - 2
24. Sericulture - - - - - 1 1 1 - - - 1 - 4 25. Social Welfare - - - 2 - 3 3 1 1 - - 1 - 11 26. Transport - 1 - - - - - - - - - - - 1 27. Urban Development - - - - - - - - - - - - 6 6 28. Water Resources 14 7 7 6 8 7 2 2 5 6 4 2 3 73 29. Women & Child Welfare - - - - 1 - - - - - 1 - - 2 30. Agriculture, Forest, Home &
Transport - - - - 1 - - - - - - - - 1
31. Horticulture & Forest Departments
- - - - - - - - - - 1 - - 1
32. Housing, H&FW, PW, & RDPR - - - - - - - - - - 1 - - 1 Total 22 20 20 31 28 24 20 21 24 22 15 22 27 296
225

Audit Report (Civil) for the year ended 31 March 2006
Appendix 4.10 Year-wise breakup of Inspection Reports outstanding
(Reference: Paragraph 4.6.2, Page 147)
Year
Department of Sericulture Department of Judiciary Department of Water
Resources Department of Minor
Irrigation Department of Public
Works Number of
IRs Number of paragraphs
Number of IRs
Number of paragraphs
Number of IRs
Number of paragraphs
Number of IRs
Number of paragraphs
Number of IRs
Number of paragraphs
Upto 1995-96 96 295 39 75 27 83 48 69 58 79
1996-97 17 45 01 02 04 04 10 17 09 21
1997-98 01 03 21 52 07 09 08 15 15 21
1998-99 20 50 01 01 07 17 07 17 23 37
1999-2000 06 17 07 19 12 29 10 28 14 37
2000-01 08 15 01 11 21 93 13 49 30 71
2001-02 05 12 03 09 16 41 13 37 22 61
2002-03 02 05 08 23 18 79 17 55 40 143
2003-04 10 15 47 137 26 112 23 203 57 310
2004-05 09 25 37 91 40 316 11 130 61 753
2005-06 -- -- -- -- 01 14 -- -- -- --
Total 174 482 165 420 179 797 160 620 329 1,533
226

Appendices
Appendix 4.11
(Reference: Paragraph 4.6.2, Page 147)
(A) Irregularities noticed in the IRs pertaining to Sericulture Department
Serial number Nature of irregularities Number of
paragraphs
Amount (Rupees in
lakh) 1. Non-maintenance/improper maintenance of
initial records viz., cash book, imprest account, etc.
06 --
2. Irregular expenditure on purchase/purchase of defective machinery
10 16.11
3. Extra/excess/infructuous/wasteful/unauthorised/irregular expenditure
39 2,033.03
4. Outstanding dues/loans, advances/share capital contribution/interest
73 343.57
5. Losses due to deterioration of seeds, shortages, thefts, etc., awaiting regularisation
41 1,687.58
6. Withdrawal of funds to avoid lapse of grant and blocking of Government capital
01 --
7. Excess/Over-payment/Mis-utilisation of grants, loans and subsidies
17 17.67
8. Machinery, Spares, Furniture, etc., lying idle 20 119.01
9. Unauthorised financial aid to contractors 01 2.60
10. Non-achievement of objectives 36 5,357.60
11. Non-adherence to prescribed procedure while dealing with cash
05 0.36
12. Wanting payees' receipts/Utilisation Certificates and non-receipt of completion certificate of buildings
03 0.83
13. Unspent balances of amounts recovered but not credited to Government
05 31.16
14. Non-recovery of rent, water charges, etc., from occupants of Government residential quarters
02 2.04
15. Other miscellaneous irregularities 216 114.09
16. Non-submission of NDC bills for AC bills drawn
07 47.68
Total 482 9,773.33 Rs.97.73 crore
227

Audit Report (Civil) for the year ended 31 March 2006
(B) Irregularities noticed in the IRs pertaining to Judiciary Department
Serial number Nature of irregularities Number of
paragraphs Amount
(Rupees in lakh) 1. Non-maintenance/improper maintenance of
initial records viz., cash book, imprest account, etc.
14 0.27
2. Extra/excess/infructuous/wasteful/unauthorised/irregular expenditure
63 42.05
3. Outstanding dues/loans, advances/share capital contribution/interest
37 66.47
4. Losses due to thefts 04 0.14
5. Withdrawal of funds to avoid lapse of grant and blocking of Government capital
03 3.51
6. Excess/Over-payment/Mis-utilisation of grants, loans and subsidies
02 0.15
7. Machinery, Spares, Furniture, etc., lying idle 13 2.33
8. Non-adherence to prescribed procedure while dealing with cash
02 --
9. Wanting payees' receipts/Utilisation Certificates and non-receipt of completion certificate of buildings
05 448.32
10. Unspent balances of amounts recovered but not credited to Government
03 1.52
11. Other miscellaneous irregularities 236 260.19
12. Non-submission of NDC bills for AC bills drawn
01 41.39
13. Court deposits not lapsed to Government accounts as per KFC 1958
36 401.49
14. Unclaimed compensation amount/non-renewal of compensation amounts kept in fixed deposits at Banks after the period of maturity
03
9.58
Total 422 (includes two
sub paras)
1,277.41 Rs.12.77 crore
228

Appendices
(C) Irregularities noticed in the IRs pertaining to Water Resources Department Serial
number Nature of irregularities Number of paragraphs
Amount (Rupees in lakh)
1. Extra/excess/infructuous/wasteful expenditure due to delay in completion of work
98 19,285.96
2. Shortages/losses absolution of stores/T&P articles
42 390.32
3. Purchase expenditure without proper sanction/split purchase
37 1,775.78
4. Injudicious purchase of stores/T&P articles 07 34.67
5. Excess expenditure due to rejection of tender/non-acceptance of lowest tender
01 31.39
6. Recoveries from contractors including extra cost recoverable due to rescinding of contract
43 918.78
7. Licence fee/outstanding rent 09 9.24
8. Amount recoverable from officials due to fixation of pay
42 2,366.05
9. Unauthorised/unintended benefit to contractor
03 33.60
10. Demand collection of water rate 20 72,983.85
11. Irregular expenditure on water management 14 682.86
12. Other miscellaneous irregularities 478 8,138.61
13. Irregular purchase of stores/stock without proper sanction
02 49.45
14. Diversion of LOC 01 -- Total 797 1,06,700.56
Rs.1,067.01 crore
229

Audit Report (Civil) for the year ended 31 March 2006
(D) Irregularities noticed in the IRs pertaining to Minor Irrigation Department
Serial Number Nature of irregularities Number of
paragraphs
Amount (Rupees in
lakh) 1. Extra/excess/infructuous/wasteful/unauthorised/
irregular expenditure, Machinery/Spares lying idle
240 25,102.91
2. Irregularities in acceptance of tenders
06 271.05
3. Losses due to deterioration, shortages, theft, etc. 14 11.80
4.
Irregular expenditure on purchase/purchase of defective machinery
34 2,138.41
5. Other miscellaneous irregularities 326 3,942.77 Total 620 31,466.94
Rs.314.67 crore
230
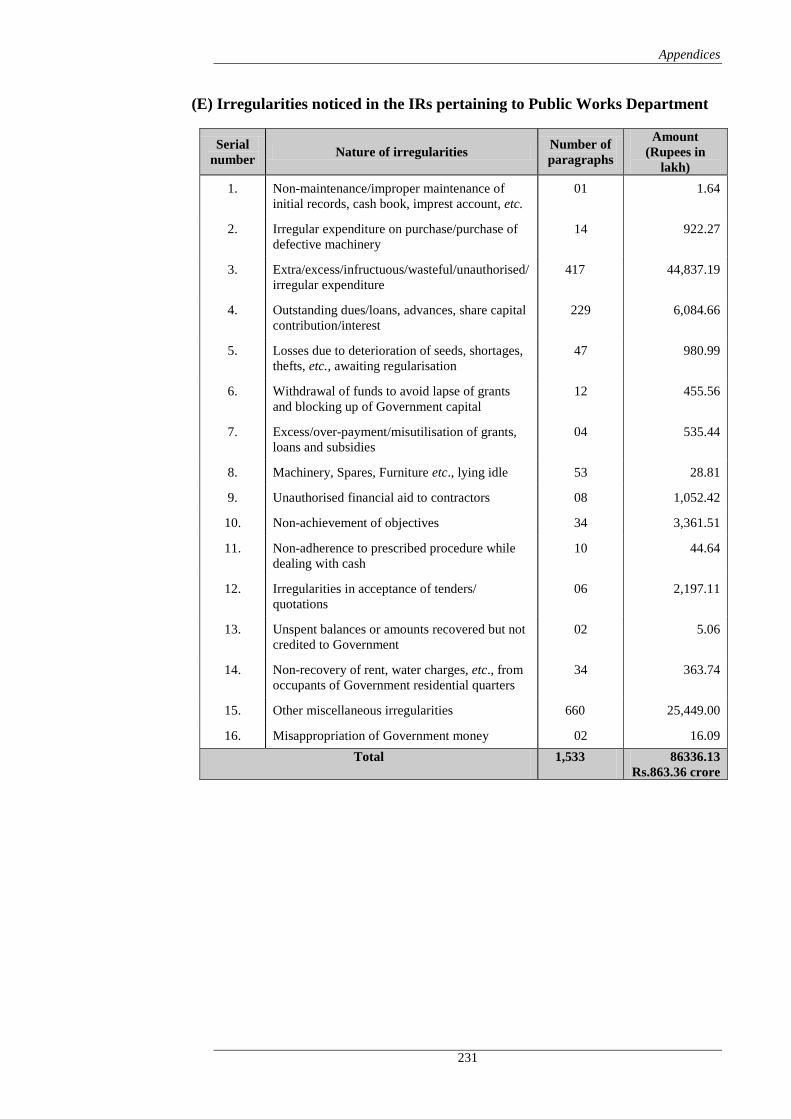
Appendices
(E) Irregularities noticed in the IRs pertaining to Public Works Department
Serial number Nature of irregularities Number of
paragraphs
Amount (Rupees in
lakh) 1. Non-maintenance/improper maintenance of
initial records, cash book, imprest account, etc. 01 1.64
2. Irregular expenditure on purchase/purchase of defective machinery
14 922.27
3. Extra/excess/infructuous/wasteful/unauthorised/irregular expenditure
417 44,837.19
4. Outstanding dues/loans, advances, share capital contribution/interest
229 6,084.66
5. Losses due to deterioration of seeds, shortages, thefts, etc., awaiting regularisation
47 980.99
6. Withdrawal of funds to avoid lapse of grants and blocking up of Government capital
12 455.56
7. Excess/over-payment/misutilisation of grants, loans and subsidies
04 535.44
8. Machinery, Spares, Furniture etc., lying idle 53 28.81
9. Unauthorised financial aid to contractors 08 1,052.42
10. Non-achievement of objectives 34 3,361.51
11. Non-adherence to prescribed procedure while dealing with cash
10 44.64
12. Irregularities in acceptance of tenders/ quotations
06 2,197.11
13. Unspent balances or amounts recovered but not credited to Government
02 5.06
14. Non-recovery of rent, water charges, etc., from occupants of Government residential quarters
34 363.74
15. Other miscellaneous irregularities 660 25,449.00
16. Misappropriation of Government money 02 16.09 Total 1,533 86336.13
Rs.863.36 crore
231

Audit Report (Civil) for the year ended 31 March 2006
Appendix 5.1
Contribution of excess share capital by Government
(Reference: Paragraph 5.1.9, Page 156)
(Rupees in lakh)
Sl. No.
Name of the sub-division
Year Number of societies in which shortfall
noticed
Government share capital contribution
Members’ share capital contribution
1. Bellary 2005-06 6 15.21 1.76
2. Hospet 2002-03 17 28.33 5.42
3. Hunsur 2002-03 24 73.54 9.44
2003-04 42 94.18 24.33
4. Mysore
2002-03 25 48.23 10.97
2003-04 28 49.61 11.42
2004-05 7 56.32 11.86
Total 149 365.42 75.20
232