Embed Size (px)
Citation preview

Compton Community College District
COLLEGE AND COMMUNITY PROFILES
EL CAMINO COLLEGE COMPTON CENTER ∙ 1111 E. ARTESIA BLVD. ∙ COMPTON, CA 90221 ∙ 310.900.1600

College and Community Profiles
Table of Contents
Section I. Maps
Trustee Boundary Map
District Map
Section II. Profile
Facts and Figures
Annual Fact Book
Section III. High Schools
Assessment Test Results
High School Enrollment Trends
High School Report Cards
Academic Milestones
Section IV. Community
District Profile
Section V. Other Reports
Acknowledgement All reports found within are a production of the Office of Institutional Research & Planning at El Camino College. The following individuals contributed to the college and community profile.
Esthela Chavez – Research Intern, El Camino College Irene Graff – Director, El Camino College Eboni Martin – Research Intern, El Camino College Marci Myers – Research Analyst, El Camino College -Compton Center Carolyn Pineda – Research Analyst, El Camino College Joshua Rosales – Research Analyst, El Camino College Mike Wilson – Research Analyst, El Camino College
Electronic copies of all documents contained within are located at: http://www.elcamino.edu/administration/ir/

nm
Special TrusteeThomas Henry
Compton Community College District
El Camino CollegeEl Camino CollegeCompton CenterCompton Center
Trustee Area 5Lowanda Green
Trustee Area 2Leslie Irving
Trustee Area 4Deborah LeBlanc
Trustee Area 3Sonia Lopez
Trustee Area 1Andres Ramos

105
405
91
405
710
110
91
110
710
110
105
710
710
5
110
105
405
Willowbrook
WestCompton
WestCarson
WalnutPark
SouthGate
SignalHill
Paramount
Montebello
Lynwood
LosAngeles
LongBeach
Lakewood
HuntingtonPark
Florence-Graham
EastCompton
Downey
Cudahy
Compton
Commerce
Carson
BellGardens
Bellflower
Bell
Compton CommunityEducational Center
Compton Community College District
Created by Carolyn Pineda/Source Data: ESRI/Printed June 13, 2008
0 0.5 1 1.5 20.25Miles

17 or younger 278 3.7% Intend to Transfer 2,298 46.2%
18 to 19 1,302 17.3% Degree/Certif. Only 549 11.0%
20 to 24 2,841 37.7% Retrain/recertif. 332 6.7%
25 to 29 1,148 15.2% Basic Skills/GED 468 9.4%
30 to 39 1,073 14.2% Enrichment 130 2.6%
40 to 49 570 7.6% Undecided 1,194 24.0%
50 or older 319 4.2%
Female 4,877 64.8% Associate of Arts 161 48.5%
Male 2,653 35.2% Associate of Science 69 20.8%Certificate 102 30.7%
Behavioral & Soc Sci 79 23.8%
Business 27 8.1%
Fine Arts 2 0.6%
Health Sci & Athletics 46 13.9%
Humanities 2 0.6%
Industry & Technology 64 19.3%
General Studies 109 32.8%
Natural Sciences 3 0.9%
Compton 1,837 24.4%
Long Beach 1,160 15.4%
Los Angeles 1,226 16.3%
Carson 565 7.5%
Lynwood 365 4.8%
Fewer than 6 units 3,173 42.1% Paramount 221 2.9%
6 to 8.5 units 1,498 19.9% Bellflower 177 2.4%
8.6 to 11.5 units 1,146 15.2% Gardena 234 3.1%
11.6 to 14.5 units 1,398 18.6% Inglewood 169 2.2%
14.6 units or more 316 4.2% Other Cal Resident 1,465 19.5%
Out of State 58 0.8%
Outside the US 54 0.7%
Full-time 1,714 22.8%
Part-time 5,817 77.2%
Tenured/Tenure Track 85 21.5%
First-time Student 2,069 27.5% Academic Temporary 184 46.5%
Returning 984 13.1% Total Faculty 269 67.9%
Continuing 4,254 56.5% Educational Administrator 12 3.0%
K-12 Special Admit 224 3.0% Other Administrator 6 1.5%
Support 98 24.7%
Professional 11 2.8%
Total Workforce 396
El Camino College Compton Center Facts and Figures - Fall 2012Total Students: 7,531
2011-12 Degrees & Certificates
Where Compton Students Reside
Faculty/Workforce
Age Educational Goal
Gender
Degrees & Certificates by Division
Ethnicity
Unit Load
Enrollment Level
Enrollment Status
African-American
40%
Amer Ind/ Alaskan
<0% Asian
7%
Latino 44%
Pacific Islander
1% White
4%
Two or more races
3%
Unknown 1%
Research and Planning April 2013

El Camino College Compton Center 2013 Annual
Fact Book
Institutional Research & Planning

Institutional Research & Planning
Irene Graff, Director
Marci Myers, Research Analyst
Compton Center
Carolyn Pineda, Research Analyst
Preston Reed, Research Associate
Joshua Rosales, Research Analyst
Mike Wilson, Research Analyst
Table of Contents
Introduction…………………………………………………………...2
El Camino College Compton Center Service Area......3
Student and Enrollment Trends……………………….…….8
Special Programs……………………………………………….....14
Success and Retention…………………………………………..25
Student Outcomes……………………………………….………..29

201
3 E
l Cam
ino
Co
llege
Co
mp
ton
Cen
ter
An
nu
al F
act
Bo
ok
2
Introduction The El Camino College Compton Center Annual Fact Book is a reference source
containing trend data about students, student outcomes, and instructional programs
and services. The data and analysis in the fact book provide background information
to facilitate policy analysis and decision making. It should be a useful tool in college
and departmental planning, grant preparation, and in the accreditation process. It is
our hope that the information provided is used to objectively evaluate programs and
practices as well as visualize the trends that affect ECC Compton Center’s current
and future operations.
Demographic and enrollment data on ECC Compton Center students was provided
by the Chancellor’s Office. Some of the data in the Special Programs section was
extracted from the college’s student database. In addition, data from the National
Student Clearinghouse was used to provide transfer destination information. The
National Student Clearinghouse is a national, non-profit organization that offers
access to enrollment and degree records.
The Fact Book was composed and assembled by Carolyn Pineda, Research Analyst
and Esthela Chavez, Research Intern. Special acknowledgement goes to Public
Relations and Marketing for providing the photographs used in this publication and
Marci Myers, ECC Compton Center Research Analyst, for creating the cover page.
Please send any comments or feedback to Institutional Research & Planning.

201
3 E
l Cam
ino
Co
llege
Co
mp
ton
Cen
ter
An
nu
al F
act
Bo
ok
3
El Camino College Compton Center Service Area

201
3 E
l Cam
ino
Co
llege
Co
mp
ton
Cen
ter
An
nu
al F
act
Bo
ok
4

201
3 E
l Cam
ino
Co
llege
Co
mp
ton
Cen
ter
An
nu
al F
act
Bo
ok
5
Enrollment by Residence
In 2008-09, over half of students enrolled at the ECC Compton Center lived within
the Compton Community College District. Beginning in 2009-10, there has been a
decrease in the number of students who resided within the district and a sharp
increase in the students who live beyond 7.5 miles of the Center. This shift is most
likely the result of students being diverted to the ECC Compton Center by
enrollment constraints at UC, Cal States and other local community colleges. In
addition, this shift may also be a reflection of the increase of El Camino College
students who are simultaneously enrolling at the ECC Compton Center in the same
term. More detail on simultaneous enrollment can be found in the Crossover
Enrollment Research Brief on the Institutional Research webpage.
0%
10%
20%
30%
40%
50%
60%
In District Out of District(within 7.5 miles
radius)
Out of District(beyond 7.5miles radius)
2008-2009 58% 33% 10%
2009-2010 42% 33% 26%
2010-2011 36% 33% 30%
2011-2012 37% 35% 28%
2012-2013 35% 35% 30%
Compton Center Enrollment by Residency 2008-09 to 2012-13

201
3 E
l Cam
ino
Co
llege
Co
mp
ton
Cen
ter
An
nu
al F
act
Bo
ok
6
Enrollment by Zip Code (7.5 mile Radius)
In the 2012-13 academic year, over 2,900 students resided in Compton. Nearly 600
students resided in Lynwood while another 347 students resided in Paramount.
Both of these cities are located within the Compton Community College District.
Students who resided outside the district were primarily from Long Beach and Los
Angeles with 1,672 and 1,390 students, respectively.
City Zip Code 2012-13 Enrollment Percent of
2012-13 Enrollment
Grand Total
13,940 100.0
Artesia 90701 11 0.1 90702 2 0.0
Artesia Total 13 0.1
Bell Total 90201 66 0.5
Bell Gardens Total 90202 0 0.0
Bellflower 90706 281 2.0
90707 9 0.1
Bellflower Total 290 2.1
Carson 90745 470 3.4 90746* 489 3.5 90749 5 0.0
Carson Total 964 6.9
Compton 90220* 1,151 8.3
90221* 1,131 8.1
90222* 616 4.4
90223* 1 0.0
90224* 11 0.1
Compton Total 2,910 20.9
Downey 90240 16 0.1
90241 38 0.3
90242 82 0.6
Downey Total 136 1.0
Gardena 90247 309 2.2
90248 61 0.4
90249 147 1.1
Gardena Total 517 3.7
Huntington Park Total 90255 57 0.4

201
3 E
l Cam
ino
Co
llege
Co
mp
ton
Cen
ter
An
nu
al F
act
Bo
ok
7
City Zip Code 2012-13 Enrollment Percent of
2012-13 Enrollment
Lakewood 90711 6 0.0
90712 82 0.6
90713 36 0.3
90714 3 0.0
Lakewood Total 127 0.9
Long Beach 90804 81 0.6
90805 991 7.1
90806 138 1.0
90807 93 0.7
90808 27 0.2
90810 188 1.3
90813 154 1.1
Long Beach Total 1,672 12.0
Los Angeles 90001 106 0.8
90002 227 1.6
90003 206 1.5
90044 295 2.1
90059* 367 2.6
90061* 189 1.4
Los Angeles Total 1,390 10.0
Lynwood Total 90262* 587 4.2
Norwalk 90650 96 0.7
90652 0 0.0
Norwalk Total 96 0.7
Paramount Total 90723* 347 2.5
Signal Hill Total 90755 22 0.2
South Gate Total 90280 183 1.3
Torrance 90501 180 1.3
90502 85 0.6
90504 179 1.3
Torrance Total 444 3.2
*District Total 4,889 35.1
Out of District Total 4,932 35.4
Total Students in 7.5 Mile Radius
9,821 70.5
*Zip codes located within the district

201
3 E
l Cam
ino
Co
llege
Co
mp
ton
Cen
ter
An
nu
al F
act
Bo
ok
8
Student and Enrollment Trends
201
3 E
l Cam
ino
Co
llege
Co
mp
ton
Cen
ter
An
nu
al F
act
Bo
ok
9
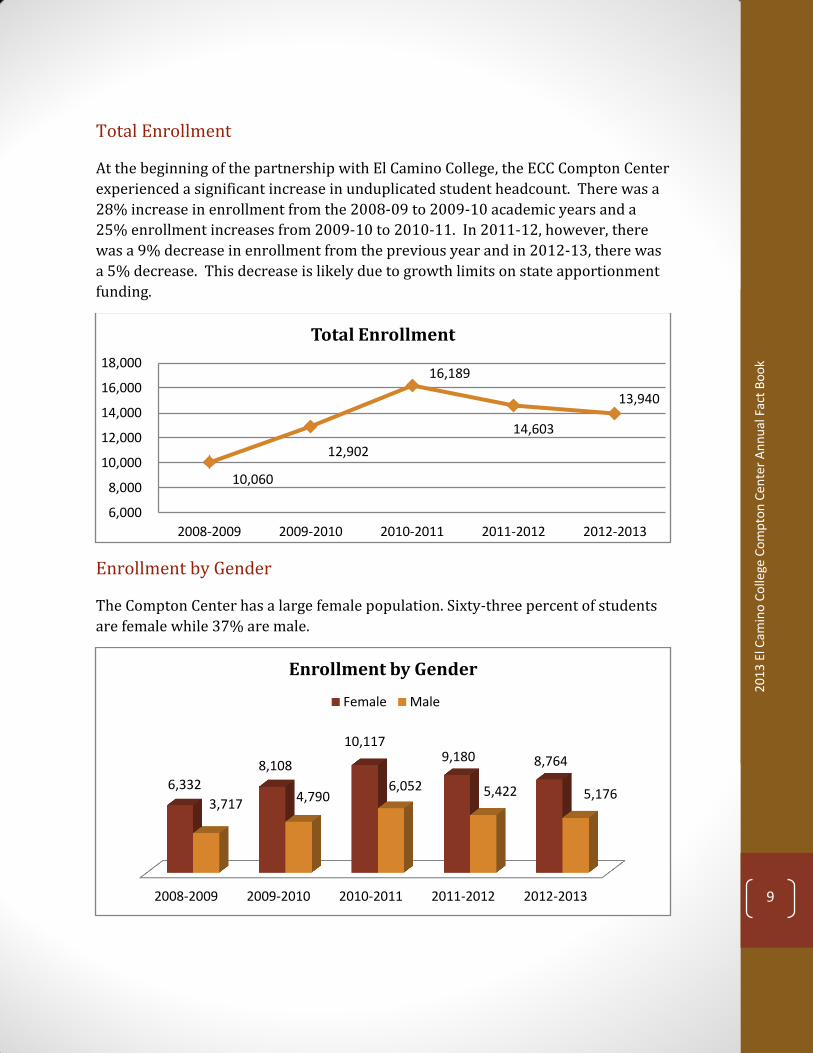
Total Enrollment
At the beginning of the partnership with El Camino College, the ECC Compton Center
experienced a significant increase in unduplicated student headcount. There was a
28% increase in enrollment from the 2008-09 to 2009-10 academic years and a
25% enrollment increases from 2009-10 to 2010-11. In 2011-12, however, there
was a 9% decrease in enrollment from the previous year and in 2012-13, there was
a 5% decrease. This decrease is likely due to growth limits on state apportionment
funding.
Enrollment by Gender
The Compton Center has a large female population. Sixty-three percent of students
are female while 37% are male.
10,060
12,902
16,189
14,603
13,940
6,000
8,000
10,000
12,000
14,000
16,000
18,000
2008-2009 2009-2010 2010-2011 2011-2012 2012-2013
Total Enrollment
2008-2009 2009-2010 2010-2011 2011-2012 2012-2013
6,332
8,108
10,117 9,180 8,764
3,717 4,790
6,052 5,422 5,176
Enrollment by Gender
Female Male

201
3 E
l Cam
ino
Co
llege
Co
mp
ton
Cen
ter
An
nu
al F
act
Bo
ok
10
Enrollment by Age
Sixty two percent of enrolled students in 2012-13 were between the ages of 18 to
24. Working adults ages 25-44 comprise 31% of enrolled student while 7% of
students are ages 45 and older. The majority of enrollment growth in the last year
was among students ages 19 or less, which increased by 5%. The largest single
group decrease was amongst students aged 35-44 at 13%. Working adults ages 25-
44 decreased by 10% in 2012-13.
Age 2008-09 2009-10 2010-11 2011-12 2012-13
19 or less 2,984 3,394 4,886 3,118 3,283
20 - 24 2,754 3,888 5,158 5,649 5,307
25 - 34 2,161 2,945 3,600 3,517 3,214
35 - 44 1,193 1,407 1,476 1,338 1,165
45 - 54 706 768 800 731 706 55+ 255 239 269 250 265
Unknown 7 261 0 0 0
Age 2008-09 2009-10 2010-11 2011-12 2012-13
19 or less 29.7% 26.3% 30.2% 21.4% 23.6%
20 - 24 27.4% 30.1% 31.9% 38.7% 38.1%
25 - 34 21.5% 22.8% 22.2% 24.1% 23.1%
35 - 44 11.9% 10.9% 9.1% 9.2% 8.4% 45 - 54 7.0% 6.0% 4.9% 5.0% 5.1%
55+ 2.5% 1.9% 1.7% 1.7% 1.9%
Unknown 0.1% 2.0% 0.0% 0.0% 0.0%
0
1,000
2,000
3,000
4,000
5,000
6,000
19 or less 20 - 24 25 - 34 35 - 44 45 - 54 55+
Enrollment by Age
2008-2009 2009-2010 2010-2011 2011-2012 2012-2013

201
3 E
l Cam
ino
Co
llege
Co
mp
ton
Cen
ter
An
nu
al F
act
Bo
ok
11
Enrollment by Ethnicity
African-American and Latino students represent the largest ethnic groups on
campus. African-Americans comprise 38% of the student population, an 11%
decrease from the previous year. Latino students make up 45% of the student
population in 2012-13, a 4% rise from 2011-12. This may reflect in part the
changes in ethnic coding that the California Community Colleges Chancellor’s Office
adopted in Fall 2009. Eight percent of the student population is Asian, which now
includes Filipinos.
*Filipino included in Asian count **As of Fall 2009, “Other” no longer reported ***New ethnic category as of Fall 2009
0% 10% 20% 30% 40% 50%
White
Unknown or Decline
Two or more races
Pacific Islander
Other
Latino
Filipino
Asian
Amer. Ind. or Alask.…
African-American
Enrollment by Ethnicity Percent of Total Population
2008-2009
2009-2010
2010-2011
2011-2012
2012-2013
Ethnic Group 2008-09 2009-10 2010-11 2011-12 2012-13
African-American 49.5% 46.5% 42.0% 40.2% 37.4%
Amer. Ind. or Alask. Native 0.3% 0.2% 0.2% 0.2% 0.2% Asian 3.0% 7.2% 8.3% 7.4% 7.8*
Filipino 2.0% * * * *
Latino 35.6% 34.0% 37.6% 41.1% 44.7%
Other 1.2% ** ** ** **
Pacific Islander 1.7% 1.4% 1.2% 1.0% 0.8%
Two or more races *** 1.8% 2.6% 2.9% 3.1%
Unknown or Decline 3.8% 4.6% 2.7% 2.1% 1.2%
White 3.0% 4.3% 5.4% 5.1% 4.8%

201
3 E
l Cam
ino
Co
llege
Co
mp
ton
Cen
ter
An
nu
al F
act
Bo
ok
12
Enrollment by Day and Evening
Sixty-three percent of students enroll in at least one daytime course while 22% are
exclusively in evening courses. Student enrollment in evening courses decreased by
7% in the last year while enrollment in daytime courses decreased by 6%. There
was also an increase in irregular courses, which include distance education. In the
last year, there was a 37% increase in students who enrolled in irregular courses.
*Irregular meeting times, including distance education.
0
1,000
2,000
3,000
4,000
5,000
6,000
Fall 2008 Fall 2009 Fall 2010 Fall 2011 Fall 2012
Daytime 3,022 4,642 5,154 5,088 4,773
Evening 1,247 1,660 1,895 1,771 1,642
Irregular* 486 478 598 425 581
Enrollment by Day and Evening

201
3 E
l Cam
ino
Co
llege
Co
mp
ton
Cen
ter
An
nu
al F
act
Bo
ok
13
Enrollment by High School
The majority of enrolled students come from local high schools within the Compton
district. The top three high schools are Compton High, Dominguez High (in
Compton) and Lynwood High School. In the last year, enrollment from Lynwood
High decreased by 15% while enrollment from King/Drew Medical Magnet
increased by 11%.
ECC Compton Center Feeder High Schools
High School 2008-09 2009-10 2010-11 2011-12 2012-13
Carson Senior High* 76 105 160 166 168
Centennial High 82 110 110 110 117
Compton Senior High 258 299 309 299 295
Dominguez High 223 286 308 299 287
Jordan Senior High* 133 184 215 196 189
King/Drew Medical Magnet 55 89 121 116 129
Locke (Alain Leroy) High 25 48 56 57 50
Lynwood High 161 186 229 171 146
Paramount High 55 70 95 113 129
*High schools outside Compton district boundaries
Other Non-District High Schools
High School 2008-09 2009-10 2010-11 2011-12 2012-13
Non District High Schools 1,160 1,787 2,643 2,423 2,430

201
3 E
l Cam
ino
Co
llege
Co
mp
ton
Cen
ter
An
nu
al F
act
Bo
ok
14
Special Programs

201
3 E
l Cam
ino
Co
llege
Co
mp
ton
Cen
ter
An
nu
al F
act
Bo
ok
15
Athletics
The ECC Compton Center offers a variety of intercollegiate sports team.
Approximately 2% of the student population participates in intercollegiate sports.
The largest male sport is football with an average 71 players per year. Women’s
soccer has been the largest female sports since it began in 2009-10; however, in
2012-13 it was surpassed by basketball with 22 players.
2008-09 2009-10 2010-11 2011-12 2012-13
Baseball 39 34 40 37 39
Basketball 21 18 27 36 38
Cross Country 27 6 12 27 0*
Football 87 64 70 67 67
Soccer 28 24 24 24 26
Track & Field 15 11 26 36 28
Totals 217 157 199 227 198 *Cross Country not offered
0
20
40
60
80
100
Baseball Basketball CrossCountry
Football Soccer Track &Field
Male Student-Athletes by Sport
2008-09 2009-10 2010-11 2011-12 2012-13

201
3 E
l Cam
ino
Co
llege
Co
mp
ton
Cen
ter
An
nu
al F
act
Bo
ok
16
2008-09 2009-10 2010-11 2011-12 2012-13
Badminton 14 8 5 5 7
Basketball 12 14 16 15 22
Cross Country 7 17 20 19 0*
Soccer N/A 24 17 20 20
Track & Field 4 1 15 14 9
Totals 37 64 73 73 58 *Cross Country not offered
0
5
10
15
20
25
Badminton Basketball Cross Country Soccer Track & Field
Female Student-Athletes by Sport
2008-09 2009-10 2010-11 2011-12 2012-13

201
3 E
l Cam
ino
Co
llege
Co
mp
ton
Cen
ter
An
nu
al F
act
Bo
ok
17
CalWORKs
CalWORKs is the community portion of the California Work Opportunity and Responsibility to Kids Act. CalWORKs funds assist single parents receiving Temporary Assistance for Needy Families (TANF) to transition off welfare and achieve long-term self-sufficiency through specialized career ladder services, including case management and on campus work study, in coordination with the Los Angeles Department of Public Social Services. Approximately 4% of the student population participates in CalWORKs. In the last year, the number of CalWORKs participants decreased by 20%.
211 278 351 320
271
349
447 444
331
250
2008-09 2009-10 2010-11 2011-12 2012-13
CalWORKs Participants
County Referral Program Participant.
Self-Initiated Program participant (SIP)

201
3 E
l Cam
ino
Co
llege
Co
mp
ton
Cen
ter
An
nu
al F
act
Bo
ok
18
Disabled Student Program and Services (DSP&S)
The ECC Compton Center established a special program to assist students with disabilities in their pursuit of a post-secondary education. The purpose of this program is to assist disabled students to perform on an equal basis with non-disabled students in an integrated campus setting. Since the partnership with El Camino has increased stability within the program, the number of students with registered disabilities has steadily increased. During the 2012-13 academic year, 423 (3%) of the ECC Compton Center students had registered disability. The most common disability is psychological disability followed by mobility impaired.
Primary Disability 2008-09 2009-10 2010-11 2011-12 2012-13
Acquired Brain Injury 9 18 15 16 20 Developmentally Delayed Learner 25 29 35 35 28
Hearing Impaired 4 2 14 8 7 Learning Disabled 12 22 21 23 21
Mobility Impaired 36 36 55 68 62
Other Disability 62 97 106 127 170
Psychological Disability 52 66 86 97 106
Speech/Language Impaired N/A N/A N/A N/A 1 Visually Impaired 4 6 4 7 8
Total 204 276 336 381 423
0 20 40 60 80 100 120 140 160 180
Visually Impaired
Speech/Language Impaired
Psychological Disability
Other Disability
Mobility Impaired
Learning Disabled
Hearing Impaired
Developmentally Delayed Learner
Acquired Brain Injury
Disabled Students Programs & Services 2008-09 2009-10 2010-11 2011-12 2012-13

201
3 E
l Cam
ino
Co
llege
Co
mp
ton
Cen
ter
An
nu
al F
act
Bo
ok
19
Extended Opportunity Program and Services (EOP&S)
Extended Opportunity Program and Services (EOP&S) is designed to assist low income and educationally disadvantaged students achieve their educational goals at the ECC Compton Center. It provides eligible students with support services in the areas of counseling, peer support, financial assistance, transferring and tutorial services. Approximately 7% of ECC Compton Center students are in EOP&S. In 2012-13, there was a 3% decrease in the number of students in EOP&S and CARE (a single parent support program for EOP&S).
312 219 141 199 239
1,173 981
603
855
788
2008-09 2009-10 2010-11 2011-12 2012-13
Extended Opportunity Programs & Services (EOP&S)
EOPS and CARE participant EOPS participant

201
3 E
l Cam
ino
Co
llege
Co
mp
ton
Cen
ter
An
nu
al F
act
Bo
ok
20
Financial Aid
An average of 40% of ECC Compton Center students received financial aid in 2012-
13. The largest Financial Aid program is the Board of Governor’s Fee Waiver
(BOGW). There were a total of 6,093 BOGW recipients in 2012-13. The second
largest program is the Federal Pell Grant with 2,930 recipients in 2012-13. For the
past 5 years, the number of students who received Federal Work Study has been
stable.
In the last three years, there was no Standard Loan reported. As of 2010-11,
Stafford Loans are part of the Direct Loan program and now fall under the category
of Federal Direct Student Loans.
Also there are no Academic Competitiveness Grant recipients reported in 2012-13,
due to the fact that this federal grant is no longer being awarded.
2008-09 2009-10 2010-11 2011-12 2012-13
30.9% 36.1%
33.2%
39.1% 39.5%
Financial Aid Students Percent of Enrollment

201
3 E
l Cam
ino
Co
llege
Co
mp
ton
Cen
ter
An
nu
al F
act
Bo
ok
21
Financial Aid Headcount
Financial Aid 2008-09 2009-10 2010-11 2011-12 2012-13 Federal Work Study 39 41 49 50 55 Percent of Student Enrollment 0.4% 0.3% 0.3% 0.3% 0.4%
Osher Scholarship
2 3 7 7
Scholarship: institutional source 12 22 1 2 0 Scholarship: non-institutional source
0 5 8 8 21
Scholarship Total 12 29 12 17 28 Percent of Student Enrollment 0.1% 0.2% 0.1% 0.1% 0.2% Stafford Loan, subsidized 174 176
Stafford Loan, unsubsidized 77 39
Federal Direct Student Loan, subsidized
171 157 104
Federal Direct Student Loan, unsubsidized
54 28 13
Loan Total 251 215 225 185 117 Percent of Student Enrollment 2.5% 1.7% 1.4% 1.3% 0.8% BOGW, Part A 746 364 440 285 145 BOGW, Part B 2,270 4,053 4,529 5,036 4,803 BOGW, Part C 739 989 1,086 1,048 1,143 Fee Waiver 1 2 4 1 2 BOGW Total 3,756 5,408 6,059 6,370 6,093 Percent of Student Enrollment 37.3% 41.9% 37.4% 43.6% 43.7% Academic Competitiveness Grant 17 20 25
Cal Grant B 91 155 181 251 247 Cal Grant C 2 7 11 15 16 EOPS Grant 807 183 90 142 119 CARE Grant 1 0 0 0 0 Chafee Grant 4 3 12 21 14 Pell Grant 1,400 2,060 2,685 2,769 2,241 SEOG (Supplemental Educational Opportunity Grant)
165 221 268 345 293
Grant Total 2,470 2,649 3,272 3,543 2,930 Percent of Student Enrollment 24.6% 20.5% 20.2% 24.3% 21.0% Grand Total 6,528 8,342 9,617 10,165 9,168
Unduplicated Student Total 3,111 4,660 5,376 5,708 5,513 Percent of Student Enrollment 30.9% 36.1% 33.2% 39.1% 39.5%

201
3 E
l Cam
ino
Co
llege
Co
mp
ton
Cen
ter
An
nu
al F
act
Bo
ok
22
Average Financial Aid Amount Awarded to Students
Financial Aid 2008-09 2009-10 2010-11 2011-12 2012-13
Federal Work Study $2,140.26 $2,793.02 $2,989.76 $2,930.00 $2,989.75
Scholarships $2,125.67 $890.31 $868.50 $991.65 $1,635.57
Loans $3,416.44 $3,158.75 $2,839.84 $3,012.31 $2,766.50
BOGW $330.98 $376.71 $398.26 $517.26 $674.50
Grants $1,825.63 $2,662.21 $2,792.34 $2,609.78 $2,729.74
Overall Average $1,029.26 $1,187.83 $1,283.71 $1,296.51 $1,370.81
0%
5%
10%
15%
20%
25%
30%
35%
40%
45%
2008-09 2009-10 2010-11 2011-12 2012-13
Financial Aid Recepients Percent of Enrollment
BOGW
Grant
Loan
Work Study
Scholarship
2008-09 2009-10 2010-11 2011-12 2012-13
$6,718,989
$9,908,879
$12,345,467 $13,262,038
$12,643,019
Financial and Scholarships Award Amounts

201
3 E
l Cam
ino
Co
llege
Co
mp
ton
Cen
ter
An
nu
al F
act
Bo
ok
23
Financial Aid Amount Awarded
Financial Aid 2008-09 2009-10 2010-11 2011-12 2012-13
Federal Work Study $83,470 $114,514 $146,498 $146,500 $164,436
Osher Scholarship $750 $1,250 $7,000 $7,000 Scholarship: institutional source
$25,508 $20,750 $200 $2,500 $0
Scholarship: non-institutional source
$0 $4,319 $8,972 $7,358 $38,796
Scholarship Total $25,508 $25,819 $10,422 $16,858 $45,796 Stafford Loan, subsidized
$604,025 $591,909
Stafford Loan, unsubsidized
$253,501 $87,223
Federal Direct Student Loan, subsidized
$516,374 $462,782 $300,400
Federal Direct Student Loan, unsubsidized
$122,590 $64,495 $23,281
Loan Total $857,526 $679,132 $638,964 $557,277 $323,681 BOGW, Part A $232,070 $109,921 $171,223 $129,207 $86,549 BOGW, Part B $791,810 $1,619,478 $1,850,722 $2,670,841 $3,342,245
BOGW, Part C $218,730 $307,097 $389,296 $493,900 $679,972
Fee Waiver $560 $728 $1,820 $1,008 $2,208
BOGW Total $1,243,170 $2,037,224 $2,413,061 $3,294,956 $4,110,974 Academic Competitiveness Grant
$9,939 $12,965 $14,790 $0
Cal Grant B $116,452 $200,274 $210,315 $282,614 $280,232
Cal Grant C $1,008 $3,672 $4,536 $6,840 $6,565
EOPS Grant $278,942 $18,300 $13,500 $17,040 $11,900
CARE Grant $250 $0 $0 $0 $0
Chafee Grant $20,000 $12,500 $35,500 $61,000 $28,750
Pell Grant $4,000,863 $6,682,679 $8,708,781 $8,726,468 $7,540,185 SEOG (Supplemental Educational Opportunity Grant)
$91,800 $121,800 $149,100 $152,485 $152,485
Grant Total $4,509,315 $7,052,190 $9,136,522 $9,246,447 $7,998,132
Grand Total $6,718,989 $9,908,879 $12,345,467 $13,115,538 $12,643,019

201
3 E
l Cam
ino
Co
llege
Co
mp
ton
Cen
ter
An
nu
al F
act
Bo
ok
24
International Students
The ECC Compton Center international student program enrolls students
originating from countries in Latin America, Europe, Africa, and the Pacific Rim. The
number of international students increased from 45 in 2011-12 to 57 in 2012-13
academic year.
Veterans
The ECC Compton Center is an approved institution of higher learning for veterans.
Assistance is provided to veterans in planning educational programs and
maintaining compliance with Veterans administration regulations. The number of
veterans remained relatively unchanged during the past year.
2012-132011-122010-112009-102008-09
57 45
96 113
151
International Students 2007-08 to 2012-13
2012-132011-122010-112009-102008-09
132 133
163 140
82
Veteran Students 2008-09 to 2012-13

201
3 E
l Cam
ino
Co
llege
Co
mp
ton
Cen
ter
An
nu
al F
act
Bo
ok
25
Success and Retention

201
3 E
l Cam
ino
Co
llege
Co
mp
ton
Cen
ter
An
nu
al F
act
Bo
ok
26
Overall Success and Retention
Looking at all courses across the curriculum; there is an average success rate of 62%
and retention rate of 77%. The success rate in 2012-13 was 65% which is above the
institution-set standard of 58%.
Basic Skills Success and Retention
Students who take basic skills courses have an average success rate of 50% and
retention rate of 70%. The average basic skills success rate is 20% below the overall
success rate and the basic skills retention rate is 9% below the overall retention
rate. In 2012-13, success rates and retention rates slightly increased by 4% and 2%,
respectively.
2008-2009 2009-2010 2010-2011 2011-2012 2012-2013
Success 59.4% 60.8% 62.0% 61.4% 65.0%
Retention 73.5% 75.2% 77.1% 77.1% 79.8%
40%
50%
60%
70%
80%
90%
Overall Success and Retention
2008-2009 2009-2010 2010-2011 2011-2012 2012-2013
Success 44.7% 48.5% 51.6% 50.5% 52.7%
Retention 65.1% 69.0% 69.6% 72.4% 73.7%
40%
50%
60%
70%
80%
90%
Basic Skills Success and Retention

201
3 E
l Cam
ino
Co
llege
Co
mp
ton
Cen
ter
An
nu
al F
act
Bo
ok
27
Transferable Success and Retention
The success rate for transfer-level courses averages 64%, slightly higher than the
overall and basic skills success rates. The average retention rate for transfer level
courses, 78%, is also slightly higher than the overall and basic skills rates. Success
and retention rates increased in the last year.
Credit/Degree Success and Retention
The average success and retention rates for non-basic skills, non-transfer courses
are lower in comparison to overall and transferable courses. Over the last five years,
credit/degree applicable courses average a 56% success rate and 75% retention
rate.
2008-2009 2009-2010 2010-2011 2011-2012 2012-2013
Success 62.8% 63.3% 64.4% 63.4% 67.8%
Retention 75.4% 76.3% 78.5% 77.8% 80.9%
40%
50%
60%
70%
80%
90%
Transferable Success and Retention
2008-2009 2009-2010 2010-2011 2011-2012 2012-2013
Success 53.1% 57.1% 57.1% 56.6% 56.4%
Retention 70.2% 74.9% 74.3% 76.6% 77.4%
40%
50%
60%
70%
80%
90%
Credit/Degree Applicable Success and Retention

201
3 E
l Cam
ino
Co
llege
Co
mp
ton
Cen
ter
An
nu
al F
act
Bo
ok
28
Career and Technical Education (CTE) Success and Retention
The average success and retention rates for CTE courses are higher in comparison
to the basic skills and credit/degree applicable courses. In the last five years, career
and technical education courses average a 65% success rate and 78% retention rate.
In the past year, success rates and retention rates increased by 6% and 5%,
respectively.
2008-2009 2009-2010 2010-2011 2011-2012 2012-2013
Success 65.5% 64.1% 63.8% 63.6% 68.3%
Retention 74.2% 76.5% 80.2% 77.8% 81.9%
40%
50%
60%
70%
80%
90%
Career and Technical Education Courses Success and Retention

201
3 E
l Cam
ino
Co
llege
Co
mp
ton
Cen
ter
An
nu
al F
act
Bo
ok
29
Student Outcomes

201
3 E
l Cam
ino
Co
llege
Co
mp
ton
Cen
ter
An
nu
al F
act
Bo
ok
30
Basic Skills Successful Course Completion
In the last year, the success rate for basic skills writing and math increased by 10%
and 13%, respectively. After a 10% increase between Fall 2009 and Fall 2011, basic
skills reading success rates decreased in the last year by 11%.
Fall 2008 Fall 2009 Fall 2010 Fall 2011 Fall 2012
Math 45.7% 44.5% 52.1% 45.7% 51.7%
Reading 52.5% 55.4% 60.2% 60.8% 54.0%
Writing 48.8% 42.8% 45.7% 42.8% 47.1%
40%
50%
60%
70%
80%
90%
Basic Skills Successful Course Completion by Subject

201
3 E
l Cam
ino
Co
llege
Co
mp
ton
Cen
ter
An
nu
al F
act
Bo
ok
31
Persistence Rates
Student persistence refers to the tracking of students over several terms.
Persistence rates are based on fall cohorts over four semesters, looking only at fall
and spring enrollment. For the fall cohorts, the tracked trends are stable for all the
cohort groups. Thirty-three percent of Fall 2011 students persisted to the 3rd
semester (Fall 2012). This is slightly higher than the institution-set standard of
32%.
For the first-time, full-time cohorts, there was a 1% increase in 2nd semester
persistence rates for the Fall 2012 cohort. The 2nd semester persistence rate
decreased slightly for the overall cohort. Overall, the first-time, full-time cohorts
have a higher persistence rate than overall fall cohorts.
0%
20%
40%
60%
80%
100%
1st semester 2nd semester 3rd semester 4th semester
Fall 2008 100% 48% 35% 28%
Fall 2009 100% 53% 36% 31%
Fall 2010 100% 53% 32% 27%
Fall 2011 100% 53% 33% 25%
Fall 2012 100% 51%
Student Persistence over Four Semesters Fall 2008 to Fall 2012 Cohorts

201
3 E
l Cam
ino
Co
llege
Co
mp
ton
Cen
ter
An
nu
al F
act
Bo
ok
32
Degrees Awarded
In 2012-13, 282 degrees and 98 certificates were awarded at the ECC Compton
Center. This exceeds the institution-set standards for degree and certificates of 199
and 77, respectively.
From 2011-12 to 2012-13, the number of degrees and certificates awarded
increased by 2%. The majority of the growth was among Associate of Arts awarded
which increased from 159 in 2011-12 to 194 in 2012-13. Certificates awarded
slightly decreased between the 2011-12 and 2012-13 academic years.
Degrees and Certificates Awarded 2008-09 to 2012-13
Degrees and Certificates 2008-09 2009-10 2010-11 2011-12 2012-13*
Associate in Arts 102 99 154 159 194
Associate in Science 48 58 53 69 88
Certificates 27 78 55 104 98
*Source: California Community College Chancellor’s office & ECC Admissions & Records. Figures prior to 2012-13 were from the Chancellor’s office Data Mart.
0%
20%
40%
60%
80%
100%
1st semester 2nd semester 3rd semester 4th semester
Fall 2008 100% 61% 43% 35%
Fall 2009 100% 67% 46% 37%
Fall 2010 100% 65% 46% 39%
Fall 2011 100% 71% 44% 37%
Fall 2012 100% 72%
First Time, Full Time Student Persistence over Four Semesters
Fall 2008 to Fall 2012 Cohorts

201
3 E
l Cam
ino
Co
llege
Co
mp
ton
Cen
ter
An
nu
al F
act
Bo
ok
33
Transfer Destinations
In 2012-13, 518 ECC Compton Center students transferred to a 4 year university which is higher than the institution-set standard of 278. For the Cal State system, transfer students increased from 88 in 2008-09 to 344 in 2012-13. The top CSU destinations in 2012-13 were Dominguez Hills and Long Beach with 169 and 55 transfers, respectively. The number of University of California transfer students increased from 11 in 2008-09 to 59 in 2012-13. The top University of California destinations for ECC Compton Center students are UCLA and UCI. In 2012-13, there were 48 ECC Compton Center students who transferred to a private institution while 67 transfers attended an out of state institution. Cal State System Name 2008-09 2009-10 2010-11 2011-12 2012-13
Cal State Poly. University, Pomona 2 2 3 9 9
Cal State University, Bakersfield 1 3 2 1 2
Cal State University, Dominguez Hills 54 75 116 143 169
Cal State University, Fullerton 4 1 4 13 7
Cal State University, Long Beach 10 22 37 78 55
Cal State University, Los Angeles 12 10 27 26 44
Cal State University, Northridge 3 10 17 27 31
San Diego State University 0 0 4 6 3
San Francisco State University 0 1 1 0 0
San Jose State University 1 2 2 0 4
Other Cal States 1 7 14 23 20
Total Cal State Transfers 88 133 227 326 344
Associate in Arts Associate in Science Certificates
102
48 27
99
58 78
154
53 55
159
69
104
194
88 98
Degrees and Certificates Awarded
2008-09 2009-10 2010-11 2011-12 2012-13

201
3 E
l Cam
ino
Co
llege
Co
mp
ton
Cen
ter
An
nu
al F
act
Bo
ok
34
UC System Name 2008-09 2009-10 2010-11 2011-12 2012-13
University of California, Berkeley 0 1 7 7 9
University of California Davis 0 3 7 0 3
University of California, Irvine 4 6 9 13 13 University of California, Los Angeles 3 3 19 18 9
University of California, Merced 0 0 3 2 1
University of California, Riverside 0 1 0 0 8
University of California, San Diego 2 5 8 7 8 University of California, Santa Barbara 1 6 8 3 2 University of California, Santa Cruz 1 2 2 5 6
Total UC Transfers 11 27 63 55 59
Private Institutions Name 2008-09 2009-10 2010-11 2011-12 2012-13
Biola University 1 1 0 4 3
Chapman University 0 0 0 0 0
Devry University 0 4 2 0 0
Loyola Marymount University 1 1 3 3 3 Mount St. Mary's College 0 4 7 9 5
National University 1 1 1 0 8
Otis College of Art and Design 0 0 2 0 0
Pepperdine University 0 0 0 0 1
University of Phoenix 3 7 9 2 6
University of Southern California 0 6 4 6 12
Other Private Institutions 3 6 15 14 10
Total Private Transfers 9 30 43 38 48
Out of State Transfers Name 2008-09 2009-10 2010-11 2011-12 2012-13
Total Out of State Transfers 42 54 71 44 67 Source: National Student Clearinghouse1
1 Beginning in 2011-12, the California Postsecondary Education Commission (CPEC) is no longer
used to report UC and Cal State transfers. National Student Clearinghouse (NSC) data is now the source for all transfer counts in this report. More details on transfer data methodology can be found in the UC and CSU Transfer Counts: CPEC vs. NSC Research Brief.

Research & Planning/LW 1 April 2013
El Camino College Compton Center Assessment Test Results New Students from High School, Fall 2008 to Fall 2012
This report displays course placement rates and numbers for new high school graduate-aged
students entering El Camino College Compton Center over 5 years. Because graduation date
information is not complete and new students to Compton Center can be of any age, the “direct
from high school” cohort is approximated as students aged 17 or 18 with a recent test score.
Students aged 17-18 represent about 30% of all examinees who enroll in Fall.
Assessment tests are offered in 5 subjects at Compton Center: Reading Comprehension, Writing
(Sentence Skills), Mathematics, Chemistry, and English as a Second Language (ESL)1. The
Math test consists of 3 different levels: Arithmetic, Elementary Algebra and College-Level Math.
Accuplacer’s computer-adaptive model diverts students to different levels of the math test
depending on early pre-test questions and on performance. Two different ESL assessments are
offered at Compton Center placing students into either non-credit or credit-level ESL courses.
Table 1 highlights the number of students, regardless of age, taking each test between March 1
and the September census date of each year listed. Students repeating the same test are counted
only once in the unduplicated counts. These test counts overall typically mirror fluctuations in
college enrollment. The number of tests continued to decrease in 2012 after reaching a 5-year
peak in 2010. This is likely due to a decrease in first-time students2. Table 1 includes all tests
administered at both ECC and Compton Center, but “tested students enrolled” (last row)
represent only those enrolled at Compton Center. The decline in “tested students enrolled” may
be influenced by the shift in student demographics (fewer new students) and a reduction in
related course sections.
Table 1: Number of Students Taking Placement Tests by Test, March-September
Test Subject Number of Students Taking Each Test or Level
2008 2009 2010 2011 2012
Reading Comprehension Reading 8,506 9,219 9,489 8,606 8,386
Sentence Skills Writing 8,491 9,196 9,481 8,604 8,406
Arithmetic Math 6,326 6,593 6,883 6,365 5,944
Algebra Math 8,684 9,242 9,635 8,818 8,565
College-level Math Math 2,061 2,289 2,380 2,097 2,245
Total Tests (duplicated) 34,068 36,539 37,868 34,490 33,546
Students Tested (unduplicated) 10,621 11,633 11,431 10,272 9,945
Tested Students Enrolled in Fall (Compton) 1,491 1,594 1,815 1,530 1,451
* Slight changes in cut scores within the college-prep and basic skills math categories in Fall 2009
1 The number of examinees in Chemistry and ESL remain too small to include in this study (2012 count < 10).
2 Compared to Fall 2011, the number of new students of all ages decreased by 4% in 2012.

Research & Planning/LW 2 April 2013
RESULTS
The Reading, Writing and Mathematics tests place students in a variety of levels depending on
test performance. For this study, placements are grouped into categories of similarly-leveled
courses. These groups are 1) transfer-level—courses that are equivalent to courses at a 4-year
institution, 2) college-preparatory—courses that immediately precede transfer-level courses, and
3) basic skills—courses defined by El Camino College as developmental or basic skills courses
(in most cases, more than one level below transfer). The specific ECC courses within each group
and their levels below transfer-level are listed in the appendix of this report.
Compton Center assessment results for the 5 years of this study are summarized below in Table 2
by number and percentage in each subject and course group. Charts tracking the placement
percentages and numbers of each subject begin on page 3. Overall, Fall 2012 showed an
increase in basic skills placements, especially in Writing.
Table 2: Assessment Test Results by Test and Course Group* for “New Freshmen”
Test
2008 2009 2010 2011 2012
(N=435) (N=424) (N=553) (N=437) (N=438)
n % n % n % n % n %
Reading **
Transfer-level 49 12.0 86 21.6 153 29.1 130 30.8 125 29.6
College-prep 73 17.8 79 19.8 127 24.1 94 22.3 92 21.7
Basic Skills 287 70.2 233 58.5 246 46.8 198 46.9 206 48.7
Total 409 398 526 422 423
Writing **
Transfer-level 39 9.5 68 16.8 110 20.8 97 23.0 94 22.2
College-prep 188 46.0 214 53.0 288 54.5 254 60.2 229 54.1
Basic Skills 182 44.5 122 30.2 130 24.6 71 16.8 100 23.6
Total 409 404 528 422 423
Math
Transfer-level 5 1.2 5 1.3 2 0.4 15 3.5 18 4.3
College-prep 123 30.6 129 34.8 227 44.2 180 42.6 170 40.5
Basic Skills 274 68.2 237 63.9 285 55.4 228 53.9 232 55.2
Total 402 371 514 423 420
Note: The “N” figures at the top represent the total number of students aged 17 or 18 who took assessment tests between March 1 and the September census date in the year noted.
* Specific courses under each “Course Group” are listed in the Appendix of this report. ** Transfer-level placements for Reading and Writing reflect only that portion of the test, and thus, general preparation in reading and writing. To qualify for enrollment in English 1A, examinees must achieve a qualifying score on both the Reading and Writing portions of the assessment test (see page 10).

Research & Planning/LW 3 April 2013
READING
Placement Rates
Reading placements overall remain stable over the last three years. On average during the 5-year
period, 46% of 17 or 18 year-old students placed into the college-prep or transfer-level in
reading.
Between 2008 and 2010, basic skills placements decreased by 23 percentage points and have
since remained level. In 2012, 49% placed into basic skills, with one out of five placing at the
English 80 level. On average, 54% of younger students placed at the basic skills reading level
between 2007 and 2011.
Table 3: Reading Assessment Test Placement Rates
Placement Numbers
As evident in Table 4, placement counts peaked, for the most part, in 2010. Since the decrease in
2011, however, reading placements have remained level. Transfer-level and college prep
placements experienced small percent decreases—4% and 2%, respectively. Conversely, basic
skills placements increased to 206, a 4% increase from 2011.
12
22 29 31 30
18
20 24 22 22
70
59
47 47 49
0.0
20.0
40.0
60.0
80.0
100.0
FA 08 FA 09 FA 10 FA 11 FA 12
Perc
en
t P
lacin
g i
nto
Cate
go
ry
Term
Reading Test Placements (%) 5-Year Trend
Transfer Level
College Prep
Basic Skills

Research & Planning/LW 4 April 2013
Table 4: Reading Assessment Test Placement Numbers
WRITING
Placement Rates
Across the 5-year period, placements into the transfer-level (English 1A) gradually increased
from 10% in 2008 to 22% in 2012. College-prep placements (English A) have also increased
over the years, but decreased by 6 percentage points in 2012 to 54%.
With the decrease in college-prep, the percent of basic skills placements (English B and C)
consequently increased in the last year. From a 5-year low point of 17% in 2011, placements
increased by 7 percentage points to 24% in 2012.
Table 5: Writing Assessment Test Placement Rates
Transfer Level College Prep Basic Skills
FA 08 49 73 287
FA 09 86 79 233
FA 10 153 127 246
FA 11 130 94 198
FA 12 125 92 206
-
50
100
150
200
250
300
350
Stu
den
t C
ou
nt
Reading Test Placements 5-Year Trend
10 17 21
23
22
46 53 55
60 54
44 30 25
17
24
0.0
20.0
40.0
60.0
80.0
100.0
FA 08 FA 09 FA 10 FA 11 FA 12Perc
en
t P
lacin
g i
nto
Cate
go
ry
Term
Writing Test Placements (%) 5-Year Trend
Transfer Level
College Prep
Basic Skills

Research & Planning/LW 5 April 2013
Placement Numbers
Similar to placement trends for reading, writing placements also decreased slightly in transfer-
level and college prep placements but increased in basic skills. In 2012, placements into
transfer-level and college prep each decreased by 3% and 10%, yielding placement counts of 97
and 254, respectively.
Basic skills did not continue its decreasing trend. Instead, placements increased by 41% with a
placement count of 100. Despite this increase in 2012, the student count was lower than its
respective 5-year average of 121.
Table 6: Writing Assessment Test Placement Numbers
ENGLISH 1A
Placement Rates
To qualify for English 1A (transfer-level reading and writing), examinees must pass both the
Reading and the Writing portions of the assessment test. The two tables above reflected
placement rates into the transfer-level course (English 1A) based only on one of these two
criteria in order to reflect academic preparation by subject. The table below shows actual course
placement rates using both the reading and writing qualifying test scores.
The rate of new entering students qualifying for English 1A has more than doubled compared to
5 years ago. In 2012, 18% of new students placed into English 1A, which is higher than the 5-
year average (13%).
Transfer Level College Prep Basic Skills
FA 08 39 188 182
FA 09 68 214 122
FA 10 110 288 130
FA 11 97 254 71
FA 12 94 229 100
-
50
100
150
200
250
300
350
Stu
den
t C
ou
nt
Writing Test Placements 5-Year Trend

Research & Planning/LW 6 April 2013
Table 7: English 1A Placement Rates
Placement Numbers
Similar to the placement rates, counts have also progressively increased over the last five years.
In 2012, English 1A placements increased by 4%, yielding a count of 77 students. The 5-year
average was 62.
Table 8: English 1A Placement Numbers
MATHEMATICS
Placement Rates
Placements into the transfer-level courses in 2012 remained the same compared to the previous
year. New students continue to place into transfer-level math at 4% (see Appendix for a
complete list of courses at this level). The period’s average rate of placement is approximately
2%.
7
12 16
18 18
0.0
5.0
10.0
15.0
20.0
25.0
FA 08 FA 09 FA 10 FA 11 FA 12
Perc
en
t in
1A
Term
English 1A Placements (%) 5-Year Trend
FA 08 FA 09 FA 10 FA 11 FA 12
English 1A 27 47 85 74 77
0
10
20
30
40
50
60
70
80
90
Stu
den
t C
ou
nt
Placements into English 1A 5-Year Trend

Research & Planning/LW 7 April 2013
As with reading and writing placements, math also experienced a decrease in college-prep and a
slight increase in basic skills placements. On average, 39% and 59% of students place into
college-prep and basic skills math, respectively.
Table 9: Math Assessment Test Placement Rates
Note: New cut scores affected some basic skills and college prep courses beginning in Fall 2009.
Placement Numbers
Of the three course groups (reading, writing and mathematics), the fewest number of tested
students placed into transfer-level math. However, this is the only course group that experienced
an increase in transfer-level placements. Placements increased by 3%, yielding a 5-year high of
18 in 2012. Most students placed into the college-prep and basic skills level at a 5-year average
of 166 and 251, respectively.
Table 10: Math Assessment Test Placement Numbers
1 1 0 4 4
31 35
44 43 40
68 64
55 54 55
0.0
20.0
40.0
60.0
80.0
100.0
FA 08 FA 09 FA 10 FA 11 FA 12Perc
en
t P
lacin
g i
nto
Cate
go
ry
Term
Math Test Placements (%) 5-Year Trend
Transfer Level
College Prep
Basic Skills
Transfer Level College Prep Basic Skills
FA 08 5 123 274
FA 09 5 129 237
FA 10 2 227 285
FA 11 15 180 228
FA 12 18 170 232
-
50
100
150
200
250
300
Stu
den
t C
ou
nt
Math Test Placements 5-Year Trend

Research & Planning/LW 8 April 2013
ENGLISH AS A SECOND LANGUAGE
Two different ESL assessments are offered at Compton Center. The Combined English
Language Skills Assessment (CELSA) is used for placement into the non-credit ESL series. The
English as a Second Language (ESL) assessment is used for placement into the credit ESL
course series and consists of a computerized reading skills test, a questionnaire, an English
writing sample, an oral interview, and an orientation to the College. However, only a very small
percentage of students aged 17-18 take the two ESL tests and are thus not included in this study.
CONCLUSION
A large percentage of younger students entering Compton Center demonstrate a need for courses
at the basic skills level. Approximately half of tested students placed into basic skills reading
and math, while 24% placed into basic skills writing. Overall, basic skills placements have
decreased over the last five years. It is unclear, however, why 2012 experienced a decrease in
college-prep and an increase in basic skills. A possible explanation may be the relaxed
enrollment restrictions at CSUs; as more students enroll at a 4-year university immediately
following high school, a greater percentage of basic skills students are diverted to Compton
Center.
This study provided a general analysis of Compton Center students coming directly from high
school (or shortly thereafter). This group tends to perform the best on average than any other age
group, so older students tend to be less prepared for college compared to students with a recent
high school experience. For example, the 5-year average placement rates for all assessed
students into basic skills reading, writing and math were 59%, 37% and 73%, respectively. In
comparison, recent high school graduates placed into the same categories of basic skills at 54%,
28% and 59%, respectively. Placement numbers overall decreased slightly for transfer-level and
college prep but increased respectively for basic skills in all three course groups.

Research & Planning/LW 9 April 2013
APPENDIX – COURSES BY GROUP
READING & WRITING
Course Group Levels Below
Transfer Reading Writing
Transfer-level -- English 1A – Reading &
Composition
English 1A – Reading & Composition
College-preparatory
1
English 84 (formerly Engl-2R) – Developmental Reading & Writing
English A – Writing the College Essay
English 7 – Speed & Power Reading
Basic Skills
2 English 82 (formerly Engl-R)
– Introduction to Reading Skills
English B – Introduction to the Composing Process
3 English 80 – Basic Language
Skills English C – Basic
English Skills
MATHEMATICS
Course Group Levels Below
Transfer Course
Transfer-level
-- Math 190 – Calculus
-- Math 160 – Business Calculus
--
Math 180 – Pre-Calculus
Math 170 – Trigonometry
Math 150 – Elem. Probability & Statistics
Math 140 – Finite Math
Math 130 – College Algebra
Math 120 – Nature of Math
Math 115 – Prob. & Stats for Elementary Teachers
Math 110 & 111 – Math for Elem. Teachers
Computer Science 1, 5, 10
College-preparatory
1
Math 80* – Intermediate Algebra for Science, Technology, Engineering, and Mathematics
Math 73* – Intermediate Algebra for General Education
Math 60 – Elementary Geometry
2 Math 40 or 41B/43* – Elementary Algebra
Basic Skills 3
Math 41A – Elementary Algebra, Part I
Math 33* – Extended Elementary Algebra, Part I
Math 25 – Pre-Algebra Review
Math 23 – Pre-Algebra
4 Math 10A-10B/12 – Basic Arithmetic Skills
* Math 80 replaced Math 70 (Intermediate Algebra) in Fall 2009. It is a Calculus-track algebra course. * Math 73 was inaugurated in Fall 2009. It is a non-Calculus track algebra course. * Math 33 and 43 (Extended Elementary Algebra, Parts I and II) replaced Math 41A and 41B (Elementary Algebra, Parts I and II) in Fall 2009.

Research & Planning/LW 10 April 2013
ENGLISH AS A SECOND LANGUAGE (ESL)
Course Group
Levels Below
Transfer
Oral (Listening/ Speaking) *
Reading Writing
Transfer-level --
English 1AX - Reading & Composition for Foreign Students
English 1AX - Reading & Composition for Foreign Students
College-preparatory
1
ESL 51C – (Advanced)
ESL 52C – (Advanced)
English A-X – Writing the College Essay
ESL 53B – (Intermediate)
ESL 51B – (Intermediate)
ESL 52B – (Intermediate)
Basic Skills 2 ESL 51A – Intro
to English Conversation
ESL 52A – Intro to Reading and Vocab. Building
ESL 53A – Elementary Grammar/Writing
Non-Credit Basic Skills
--
ESL 02A, 02B, 02C, 02D – Conversation and Grammar
ESL 03A, 03B, 03C, 03D – Reading & Writing
* Although Listening/Speaking courses indicate “levels below transfer,” they do not directly lead to a transfer-level course such as English 1A.

El Camino College Research & Planning 1 2/26/2013
High School Enrollment Trends Compton Community College District & Local Area High Schools
2002-03 to 2012-13 This report profiles recent enrollment trends from local area high schools. Featured schools include those in the Compton, Lynwood, and Paramount districts along with Carson, Jordan, Fremont, Gardena, King Drew, and Locke High Schools. The last four are schools outside the Compton Community College District (CCCD) that feed larger enrollments to El Camino College Compton Center. The first table below summarizes trends for all high schools in the study. Each high school or district is featured separately below. Enrollment trends are tracked in this report from 2002-03 through 2012-13. Source data for these trends are from the California Department of Education, Educational Demographics Unit. District-wide Trends Since 2007-08, grade 9 enrollments have decreased by over 4,000 students; this decline has prevented any significant growth at all subsequent grade levels. From 2006 to 2011, grade 12 enrollments saw steady increases by 1,169 students overall. However, this positive growth rate ended in 2012-13 with schools experiencing a slight dip in grade 12 enrollments, reversing its positive trend over the last few years.
District and High School Trends Breaking out the enrollment trends by district and high school paints a more varied picture with some schools/districts growing or remaining stable while others decline. The following tables provide enrollment levels by high school or district with the percentage annual change at the bottom of each.
2002-03
2003-04
2004-05
2005-06
2006-07
2007-08
2008-09
2009-10
2010-11
2011-12
2012-13
Grade 9 11,781 11,804 12,385 12,263 12,175 12,309 12,002 11,225 9,547 9,131 7,867Grade 10 9,611 9,774 9,806 9,656 9,774 10,307 9,607 9,514 9,108 8,402 7,451Grade 11 7,526 7,642 7,810 7,750 8,017 7,986 7,944 8,048 8,083 7,880 7,052Grade 12 5,673 6,029 5,865 5,833 5,762 6,172 6,532 6,502 6,634 6,931 6,843
4,0005,0006,0007,0008,0009,000
10,00011,00012,00013,000
Enrollment Trends (2002-03 to 2012-13) CCC District and Nearby High Schools

El Camino College Research & Planning 2 2/26/2013
Compton Unified School District Compton district includes Compton, Centennial and Dominguez High Schools. All three schools are major feeders to ECC Compton Center. Of all three schools, the dramatic growth in 2005 reflects the increase in enrollment that Compton and Centennial experienced that year. In 2012-13 the schools experienced their lowest enrollment numbers of the past ten years, decreasing from their highest enrollment in 2006 of 6,654 students to 5,534 students in 2012-13. This decline led to a decrease in enrollments of 1,120 students altogether. Centennial High peaked in enrollment in 2007-08, increasing from 1,297 students in 2004-05 to 1,447 students in 2007-08, an increase of 150 students. However in 2008-09, enrollment declined to 1,396 students and continued to plateau through 2012-13 to 1,044 students. Compton High School experienced their highest peak in enrollment in 2003-04 and experienced a dip in enrollment the following year in 2004-05, a decline of 375 students. In 2005-06, Compton experienced growth in enrollment compared to the previous year and remained steady for the next couple of years. In 2009-10, Compton began to decline in enrollment once again, decreasing from 2,530 students the previous year in 2008-09 to 2,460 students, a decrease of 70 students, and has since declined to 2,224 students, leading to a decline in enrollment of 375 students over the course of 10 years. Dominguez High School peaked in enrollment in 2006-07 at 2,687 students and has since projected an ebb and flow trend in enrollment through 2012-13. Centennial, Compton, and Dominguez High Schools
2002-
03 2003-
04 2004-
05 2005-
06 2006-
07 2007-
08 2008-
09 2009-
10 2010-
11 2011-
12 2012-
13 Grade 9 2,025 1,876 2,130 2,173 2,217 2,009 2,047 1,759 1,392 1,528 1,506 Grade 10 1,712 1,686 1,560 1,969 1,822 1,920 1,804 1,769 1,595 1,619 1,420 Grade 11 1,383 1,349 1,346 1,353 1,528 1,461 1,545 1,476 1,526 1,462 1,363 Grade 12 1,006 1,325 1,041 1,081 1,087 1,195 1,198 1,229 1,184 1,224 1,245 Total 6,126 6,236 6,077 6,576 6,654 6,585 6,594 6,233 5,697 5,833 5,534 % Change 1.8% -2.5% 8.2% 1.2% -1.0% 0.1% -5.5% -8.6% 2.4% -5.1%
Centennial High School
2002-
03 2003-
04 2004-
05 2005-
06 2006-
07 2007-
08 2008-
09 2009-
10 2010-
11 2011-
12 2012-
13 Grade 9 421 457 500 481 455 433 400 386 266 281 285 Grade 10 357 353 314 418 393 408 392 361 338 292 276 Grade 11 345 234 286 293 341 332 328 368 317 299 224 Grade 12 256 263 197 251 229 274 276 247 280 266 259 Total 1,379 1,307 1,297 1,443 1,418 1,447 1,396 1,362 1,201 1,138 1,044 % Change -5.2% -0.8% 11.3% -1.7% 2.0% -3.5% -2.4 -11.8% -5.2% -8.3%
Compton High School
2002-
03 2003-
04 2004-
05 2005-
06 2006-
07 2007-
08 2008-
09 2009-
10 2010-
11 2011-
12 2012-
13 Grade 9 863 686 754 843 834 790 828 703 654 602 507 Grade 10 674 674 565 738 711 742 692 724 668 659 571 Grade 11 530 608 481 542 584 539 573 548 610 542 569 Grade 12 402 631 424 410 420 430 437 485 464 507 487 Total 2,469 2,599 2,224 2,533 2,549 2,501 2,530 2,460 2,396 2,310 2,224 % Change 5.3% -14.4% 13.9% 0.6% -1.9% 1.2% -2.8% -2.6% -3.6% -3.7%

El Camino College Research & Planning 3 2/26/2013
Dominguez High School
2002-
03 2003-
04 2004-
05 2005-
06 2006-
07 2007-
08 2008-
09 2009-
10 2010-
11 2011-
12 2012-
13 Grade 9 741 733 876 849 928 786 819 670 472 645 624 Grade 10 681 659 681 813 718 770 720 684 589 668 573 Grade 11 508 507 579 518 603 590 644 560 599 621 570 Grade 12 348 431 420 420 438 491 485 497 440 451 499 Total 2,278 2,330 2,556 2,600 2,687 2,637 2,668 2,411 2,100 2,385 2,266 % Change 2.3% 9.7% 1.7% 3.3% -1.7% 1.2% -9.6% -12.9% 13.6% -5.0%
Lynwood Unified School District
Lynwood Unified School District (USD) includes Lynwood and Marco Antonio Firebaugh High Schools. Both Lynwood and Firebaugh are moderate feeders to Compton Center. Total enrollments for both schools were at a ten year low in 2010-11. In 2005-06, Lynwood declined from 4,905 students enrolled the previous year to 3,414 students, a decline of 1,491 students. The decrease in enrollment was due to Firebaugh opening in 2005-06, causing Lynwood enrollments to drop substantially. Firebaugh began as a 9th grade-only campus, which could explain the zero enrollments of freshmen at Lynwood High during the 2005-2007 school year. In 2007-08 Lynwood High School saw substantial growth in enrollment, a positive change of 31% from the previous year, while Firebaugh enrollment had a negative change of 11% in the same year. Lynwood has not seen growth in enrollment since 2007-08, and has steadily declined since 2008-09, leaving their enrollment in 2012-13 at 2,331, an overall loss of 2,574 students since their highest enrollment peak in 2004-05 of 4,905 students. Firebaugh has followed an ebb and flow trend, however it has progressively increased from 1,431 enrollments during its opening year in 2005-06 to 1,899 students in 2012-13, an increase of 468 enrollments. Lynwood and Marco Antonio Firebaugh High Schools Combined
2002-
03 2003-
04 2004-
05 2005-
06 2006-
07 2007-
08 2008-
09 2009-
10 2010-
11 2011-
12 2012-
13 Grade 9 1,465 1,433 1,514 1,431 1,437 1,971 1,583 1,370 659 1,186 1,129 Grade 10 1,298 1,419 1,368 1,401 1,460 1,961 1,319 1,291 1,262 1,082 1,138 Grade 11 978 1,124 1,125 1,112 1,093 887 1,027 1,104 1,181 1,090 1,018 Grade 12 853 842 898 901 840 779 1,098 997 896 1,066 945 Total 4,594 4,818 4,905 4,845 4,830 5,598 5,027 4,762 3,998 4,424 4,230 % Change 4.9% 1.8% -1.2% -0.3% 15.9% -10.2% -5.3% -16.0% 10.7% -4.4%
* 2009-10 data was not reported for Lynwood or Firebaugh, so enrollment for 2009-10 was estimated Lynwood
2002-
03 2003-
04 2004-
05 2005-
06 2006-
07 2007-
08 2008-
09 2009-
10 2010-
11 2011-
12 2012-
13 Grade 9 1,465 1,433 1,514
724 816 737 657 621 617
Grade 10 1,298 1,419 1,368 1,401 1,201 1,726 760 731 701 633 603 Grade 11 978 1,124 1,125 1,112 1,093 868 700 690 680 589 592 Grade 12 853 842 898 901 840 779 876 666 455 608 519 Total 4,594 4,818 4,905 3,414 3,134 4,097 3,152 2,823 2,493 2,451 2,331 % Change 4.9% 1.8% -30.4% -8.2% 31.0% -23.1% -10.4% -11.7% -1.7% -5.0%
Marco Antonio Firebaugh
2002-
03 2003-
04 2004-
05 2005-
06 2006-
07 2007-
08 2008-
09 2009-
10 2010-
11 2011-
12 2012-
13 Grade 9
1,431 1,437 1,247 767 634 2 565 512
Grade 10
259 235 559 560 561 449 535 Grade 11
19 327 414 501 501 426
Grade 12
222 332 441 458 426 Total 0 0 0 1,431 1,696 1,501 1,875 1,939 1,505 1,973 1,899 % Change
18.5% -11.5% 25.0% 3.4% -22.4% 31.1% -3.8%

El Camino College Research & Planning 4 2/26/2013
Paramount High School Paramount High School is a moderate feeder to Compton Center. Paramount has experienced continued growth over the past ten years. Enrollments only dipped very slightly in 2005-06, 2008-09, and 2012-13.
2002-
03 2003-
04 2004-
05 2005-
06 2006-
07 2007-
08 2008-
09 2009-
10 2010-
11 2011-
12 2012-
13 Grade 9 1,059 1,156 1,238 1,189 1,154 1,242 1,261 1,428 1,299 1,286 1,282 Grade 10 1,058 1,028 1,122 1,153 1,143 1,235 1,236 1,302 1,390 1,292 1,285 Grade 11 951 969 908 953 1,047 1,168 1,071 1,083 1,208 1,329 1,221 Grade 12 842 784 811 751 830 923 965 944 1,025 1,108 1,198 Total 3,910 3,937 4,079 4,046 4,174 4,568 4,533 4,757 4,922 5,015 4,986 % Change 0.7% 3.6% -0.8% 3.2% 9.4% -0.8% 4.9% 3.5% 1.9% -0.6%
Jordan High School (Long Beach) Jordan High School is closely situated and is a major feeder to Compton Center. Jordan saw stable growth between 2002 and 2004 followed by moderate declines. The largest decrease occurred in 2010-11 with a negative change of 6.2% and continued to drop until enrollment slightly increased in 2012-13.
2002-
03 2003-
04 2004-
05 2005-
06 2006-
07 2007-
08 2008-
09 2009-
10 2010-
11 2011-
12 2012-
13 Grade 9 1,221 1,184 1,226 1,184 1,234 1,197 1,147 1,120 1,045 1,011 983 Grade 10 1,093 1,249 1,170 1,186 1,115 1,130 1,103 1,065 1,043 917 927 Grade 11 960 1,019 1,080 997 974 980 1,035 982 911 903 880 Grade 12 861 888 907 912 805 850 819 886 802 758 813 Total 4,135 4,340 4,383 4,279 4,128 4,157 4,104 4,053 3,801 3,589 3,603 % Change 5.0% 1.0% -2.4% -3.5% 0.7% -1.3% -1.2% -6.2% -5.6% 0.4%
Carson High School Carson High School is a moderate distance from Compton Center and is a modest feeder school. After experiencing continued growth from 2002-2004, there was a slight dip in enrollment in 2005-06 which continued until 2007-08. In 2008-09, Carson enrollments grew slightly, but dipped the following year in 2009-10, and have since continued to decline. In 2012-13, enrollment was the lowest in the past ten years.
2002-
03 2003-
04 2004-
05 2005-
06 2006-
07 2007-
08 2008-
09 2009-
10 2010-
11 2011-
12 2012-
13 Grade 9 1,249 1,235 1,248 1,221 1,206 1,223 1,239 1,168 1,105 954 491 Grade 10 950 929 932 992 942 879 890 922 889 677 391 Grade 11 711 758 769 754 810 783 821 748 696 667 319 Grade 12 537 526 601 581 562 591 597 617 587 527 369 Total 3,447 3,448 3,550 3,548 3,520 3,476 3,547 3,455 3,277 2,825 1,570 % Change 0.0% 3.0% -0.1% -0.8% -1.3% 2.0% -2.6% -5.2% -13.8% -44.4%

El Camino College Research & Planning 5 2/26/2013
Gardena High School Gardena High School is closely situated and is a modest feeder to Compton Center. Enrollment for Gardena peaked in 2006-07 with 3,414 students, but declined substantially the following years. In 2012-13, there were only 1,690 students enrolled, a drastic difference from earlier years.
2002-
03 2003-
04 2004-
05 2005-
06 2006-
07 2007-
08 2008-
09 2009-
10 2010-
11 2011-
12 2012-
13 Grade 9 962 1,055 992 1,117 1,381 917 1,438 1,039 823 589 515 Grade 10 932 848 986 879 842 988 716 760 585 469 392 Grade 11 743 671 792 886 738 743 546 608 490 457 396 Grade 12 504 551 570 496 453 555 461 393 401 378 387 Total 3,141 3,125 3,340 3,378 3,414 3,203 3,161 2,800 2,299 1,893 1,690 % Change -0.5% 6.9% 1.1% 1.1% -6.2% -1.3% -11.4% -17.9% -17.7% -10.7%
King/Drew Medical Magnet High School King/Drew Medical Magnet High is a moderate distance from Compton Center and is a modest feeder school. There had been a slight decline in growth from 2003 to 2006, with a rebound in 2007-08 and 2008-09. Since 2009-10, enrollments have followed an ebb and flow trend with positive changes in enrollments in 2012-13.
2002-
03 2003-
04 2004-
05 2005-
06 2006-
07 2007-
08 2008-
09 2009-
10 2010-
11 2011-
12 2012-
13 Grade 9 572 523 467 477 529 580 479 493 526 581 489 Grade 10 406 492 481 470 408 451 475 398 435 475 445 Grade 11 436 360 437 344 339 359 410 416 332 306 405 Grade 12 293 320 283 351 323 279 315 320 354 271 307 Total 1,707 1,695 1,668 1,642 1,599 1,669 1,679 1,627 1,647 1,633 1,646 % Change -0.7% -1.6% -1.6% -2.6% 4.4% 0.6% -3.1% 1.2% -0.9% 0.8%
Locke Family of High Schools Locke High School was a modest feeder to Compton Center. Locke saw stable, even dramatic growth between 2002 and 2004. That was followed by moderate declines between 2005 and 2006. Because of the decline in enrollments and poor academic performance, Green Dot Public Schools took over Locke High School, and reopened it as six small college prep charter schools known as the Locke Family of High Schools. After the establishment of the six smaller charter high schools, Alain Leroy Locke High closed in 2011. The Locke Family of High Schools, including Animo Locke 1,2 and 3 College Preparatory Academies, Animo Locke Technology High, Animo Watts College Preparatory Academy, and Animo College Preparatory Academy have increased in enrollments by over 500 students since its reopening. However, in 2012-13, the schools experienced their first decline in total enrollment in five years. Animo Locke 1 High School substantially increased their enrollments over the last five years, gaining 640 students since its opening in 2008. Animo Locke 2 and 3 grew in enrollments from 2008-09 to 2011-12; however both schools experienced their first decline in enrollments in 2012-13. Animo Locke Technology High grew from 124 students in 2007-08 to 546 students in 2010-11; however, it experienced a slight decline in enrollment in 2011-12 and continued to drop the following year in 2012-13. Animo Watts College Preparatory has seen steady growth since its opening in 2007-08, gaining 411 students over the course of six years. However, in 2012-13, Animo Watts experienced its first dip in

El Camino College Research & Planning 6 2/26/2013
enrollment. Animo College Preparatory Academy has shown positive growth in enrollment, increasing from 117 students in 2009-10 to 482 students in 2012-13, an increase of 365 students. Alain Leroy Locke High (Closed 2011)
2002-
03 2003-
04 2004-
05 2005-
06 2006-
07 2007-
08 2008-
09 2009-
10 2010-
11 2011-
12 2012-
13 Grade 9 1,318 1,300 1,451 1,406 1,236 919 11 17 10
Grade 10 723 772 883 595 541 731 617 42 21
Grade 11 474 527 531 580 640 538 685 572 60
Grade 12 292 245 295 317 354 425 487 646 560
Total 2,807 2,844 3,160 2,898 2,771 2,613 1,800 1,277 651
% Change 1.3% 11.1% -8.3% -4.4% -6.0% -31.1% -29.0% -49.0%
Locke Family of High Schools Combined
2002-
03 2003-
04 2004-
05 2005-
06 2006-
07 2007-
08 2008-
09 2009-
10 2010-
11 2011-
12 2012-
13 Grade 9 1,318 1,300 1,451 1,406 1,236 1,182 829 796 911 916 782 Grade 10 723 772 883 595 541 731 907 859 834 981 838 Grade 11 474 527 531 580 640 538 685 837 815 925 903 Grade 12 292 245 295 317 354 425 487 646 838 814 916 Total 2,807 2,844 3,160 2,898 2,771 2,876 2,908 3,138 3,398 3,636 3,439 % Change 1.3% 11.1% -8.3% -4.4% 3.8% 1.1% 7.9% 8.3% 7.0% -5.4%
Animo Locke 1 College Preparatory Academy (Opened 2008)
2002-
03 2003-
04 2004-
05 2005-
06 2006-
07 2007-
08 2008-
09 2009-
10 2010-
11 2011-
12 2012-
13 Grade 9
169 136 170 163 172
Grade 10
189 147 175 185 Grade 11
170 160 203
Grade 12
42 283 249 Total
169 325 529 781 809
% Change
92.3% 62.8% 47.6% 3.6% Animo Locke 2 College Preparatory (Opened 2008)
2002-
03 2003-
04 2004-
05 2005-
06 2006-
07 2007-
08 2008-
09 2009-
10 2010-
11 2011-
12 2012-
13 Grade 9
163 144 165 165 129
Grade 10
160 141 240 138 Grade 11
143 258 204
Grade 12
148 227 Total
163 304 449 811 698
% Change
87.0% 47.7% 80.6% -14.0% Alain Leroy Locke 3 College Preparatory Academy (Opened 2008)
2002-
03 2003-
04 2004-
05 2005-
06 2006-
07 2007-
08 2008-
09 2009-
10 2010-
11 2011-
12 2012-
13 Grade 9
174 136 139 142 109
Grade 10
154 148 152 108 Grade 11
146 138 127
Grade 12
135 119 Total
174 290 433 567 463
% Change
66.7% 49.3% 31.0% -18.3%

El Camino College Research & Planning 7 2/26/2013
Animo Locke Technology High (Opened 2007)
2002-
03 2003-
04 2004-
05 2005-
06 2006-
07 2007-
08 2008-
09 2009-
10 2010-
11 2011-
12 2012-
13 Grade 9
124 154 122 137 145 110
Grade 10
135 158 142 138 126 Grade 11
130 150 132 114
Grade 12
117 124 112 Total
124 289 410 546 539 462
% Change
133.0% 41.9% 33.2% -1.3% -14.3% Animo Watts College Preparatory Academy (Opened 2007)
2002-
03 2003-
04 2004-
05 2005-
06 2006-
07 2007-
08 2008-
09 2009-
10 2010-
11 2011-
12 2012-
13 Grade 9
139 158 124 148 158 139
Grade 10
155 156 115 146 146 Grade 11
135 146 123 139
Grade 12
119 123 101 Total
139 313 415 528 550 525
% Change
125.2% 32.6% 27.2% 4.2% -4.5% Animo College Preparatory Academy (Opened 2009)
2002-
03 2003-
04 2004-
05 2005-
06 2006-
07 2007-
08 2008-
09 2009-
10 2010-
11 2011-
12 2012-
13 Grade 9
117 142 143 123
Grade 10
120 130 135 Grade 11
114 116
Grade 12
1 108 Total
117 262 388 482
% Change
124.0% 48.1% 24.2%
Fremont High School Fremont High School is a moderate distance from Compton Center. It sends relatively few students to the Compton Center each year. Fremont has seen a mix of growth and decline over the past ten years. The most dramatic decrease occurred in 2012-13 with a decline of over 900 enrollments.
2002-
03 2003-
04 2004-
05 2005-
06 2006-
07 2007-
08 2008-
09 2009-
10 2010-
11 2011-
12 2012-
13 Grade 9 1,910 2,042 2,119 2,065 1,781 1,988 1,979 2,052 1,787 1,080 690 Grade 10 1,439 1,351 1,304 1,011 1,501 1,012 1,157 1,148 1,075 890 615 Grade 11 890 865 822 771 848 1,067 804 794 924 741 547 Grade 12 485 548 459 443 508 575 592 470 547 785 663 Total 4,724 4,806 4,704 4,290 4,638 4,642 4,532 4,464 4,333 3,496 2,515 % Change 1.7% -2.1% -8.8% 8.1% 0.1% -2.4% -1.5% -2.9% -19.3% -28.1%
Future Trends The last set of tables and charts below show enrollment trends by school level or type. Growth/decline is represented both in real counts and as percentage of change from the previous year. Overall, Los Angeles county K-12 enrollment has been on a steady decline since 2002-03. This trend is evident in enrollment across our local school systems. Kindergarten enrollment peaked in 2001-02 followed by peaks for Elementary Schools in 2002-03 and Middle Schools in 2003-04. High school enrollment peaked in 2007-08. Overall enrollment has experienced a steady decline since 2003-04.

El Camino College Research & Planning 8 2/26/2013
Table 1: Total Enrollments by School Type
School Type 2002-
03 2003-
04 2004-
05 2005-
06 2006-
07 2007-
08 2008-
09 2009-
10 2010-
11 2011-
12 2012-
13 Kindergarten 5,464 5,267 5,179 4,886 4,591 5,187 4,472 4,666 4,447 4,641 4,594 Elementary 30,838 30,000 28,827 27,041 25,379 23,693 24,084 23,202 22,654 22,475 22,524 Middle 16,861 17,358 16,742 16,161 15,419 14,994 14,482 13,732 12,710 12,892 12,651 High School 35,590 36,221 36,853 36,389 36,471 37,620 36,909 36,027 34,398 33,005 29,213 Total 86,449 86,441 85,100 82,159 79,431 81,494 79,947 77,626 74,209 73,013 68,982
Table 2: Percentage Change from Previous Year
School Type 2003-
04 2004-
05 2005-
06 2006-
07 2007-
08 2008-
09 2009-
10 2010-
11 2011-
12 2012-
13 Kindergarten -3.6% -1.7% -5.7% -6.0% 13.0% -13.8% 4.3% -4.7% 4.4% -1.0% Elementary -2.7% -3.9% -6.2% -6.1% -6.6% 1.7% -3.7% -2.4% -0.8% 0.2% Middle 2.9% -3.5% -3.5% -4.6% -2.8% -3.4% -5.2% -7.4% 1.4% -1.9% High School 1.8% 1.7% -1.3% 0.2% 3.2% -1.9% -2.4% -4.5% -4.0% -9.7% Total 0.0% -1.6% -3.5% -3.3% 2.6% -1.9% -2.9% -4.4% -1.6% -4.7%
The following three charts graphically display enrollment trends by each school type. All schools show dramatic declines in recent years. Many of the students representing the “peak” on the middle school chart (2003-04) are now graduating in local high schools. High schools will likely experience a dip as the 2005-06 and later cohorts progress through secondary education. Compton Center leadership should consider these declines in their long term enrollment and outreach plans.
2002-03
2003-04
2004-05
2005-06
2006-07
2007-08
2008-09
2009-10
2010-11
2011-12
2012-13
Kindergarten 5,464 5,267 5,179 4,886 4,591 5,187 4,472 4,666 4,447 4,641 4,594
4,000
4,500
5,000
5,500
6,000
Enrollment Trend (2002-03 to 2012-13) Local Kindergarten

El Camino College Research & Planning 9 2/26/2013
Projected Enrollments A projection of new enrollments coming from feeder schools was developed based on high school freshmen enrollments. Using a ratio of the average Compton Center enrollments coming from each feeder school and the number of freshmen who started at each feeder school gives an indication of what each school will provide in the coming years. This model assumes other factors remain constant and that schools will continue to funnel students towards the Compton Center at the same rates as they have been. Freshman counts are used because they were found to provide more accurate outputs than senior counts when comparing to known counts of students enrolled at Compton Center based on self-reported high school of first time Compton Center students. As the below table illustrates, there is likely to be a decline in new students coming from feeder high schools over the next three years.
2002-03
2003-04
2004-05
2005-06
2006-07
2007-08
2008-09
2009-10
2010-11
2011-12
2012-13
Elementary 30,838 30,000 28,827 27,041 25,379 23,693 24,084 23,202 22,654 22,475 22,524
22,00023,00024,00025,00026,00027,00028,00029,00030,00031,000
Enrollment Trend (2002-03 to 2012-13) Local Elementary Schools
2002-03
2003-04
2004-05
2005-06
2006-07
2007-08
2008-09
2009-10
2010-11
2011-12
2012-13
Middle 16,861 17,358 16,742 16,161 15,419 14,994 14,482 13,732 12,710 12,892 12,651
12,000
13,000
14,000
15,000
16,000
17,000
18,000
Enrollment Trend (2002-03 to 2012-13) Local Middle Schools

El Camino College Research & Planning 10 2/26/2013
High School New Students per Year
Fall 2013 Fall 2014 Fall 2015 Carson Senior High 14 13 13 Centennial High 47 45 31 Compton High 119 101 94 Dominguez High 111 91 64 Gardena Senior High 99 71 57 Jordan High 60 59 55 King/Drew Medical Magnet High 45 47 50 Lynwood High 129 112 54 Paramount High 70 79 72 Total 696 620 490
*Marco Antonio Firebaugh High and Locke Family of High Schools have been excluded from this table due to insufficient data.
Map of El Camino College Compton Center Feeder High Schools

El Camino College Compton Center
Report Card for 2012 GraduatesCarson Senior High School
Course Placements
Course Retention & Success
Academic Progress
Total in First Fall
66456Total
Math Courses
% Successful (C or better)
1%23%23%
Levels Below
Carson Senior High
Reading Writing Math Reading Writing Math
All Feeder High Schools
‐123
4
Total Tested
8%69%0%
‐
54%15%
‐
13 13
0%21%0%14%64%
14
21%19%47%13%‐
229 228 231
14%54%21%
‐
34%1%11%52%
Educational Goal CSH
53%
6%9%0%31%
Total Known 32
All
42%
7%
2%22%1%
25%
470
Course Type
% Retained
CSH All CSH AllAll Courses 86% 82%
88% 83%Transferable CourseBasic Skills CoursesEnglish Courses
Voc Ed Courses
70% 65%72% 68%
72%83%77%88%
76%86%76%80%
56%67%62%69%
53%67%54%60%
Total Enrolled
6%
Units per Term15+
CSH All
4%12 ‐ 14.59 ‐ 11.56 ‐ 8.53 ‐ 5.5< 3
Fall 2012
31% 29%25% 22%23% 25%15% 18%0% 1%
Persistence
Fall to Spring
CSH All
50% 71%
56 664
56 664 56 664
0%
Intend to TransferDegree/Certif. Only
Retrain/Recertify
Basic Skills/GEDEnrichmentUndecided
Graduating class size: 630 Enrolled at CEC: 56 (9%)
11%8%
ECC Institutional Research and Planning October 2013

El Camino College High School Report Card – Background Information
The High School Report Card provides statistics on entering academic performance of new students from local area high schools. Because specific graduation date information is not always reported by applicants, “new students” are approximated in this report by age and first term at the College. The source for graduating class size is the California Department of Education’s DataQuest site. This page provides explanatory information to assist in the interpretation of the report. For each of the following sections, percentages are provided for each high school along with the average for all feeder high schools. Reports are generated for all feeder high schools that are associated with a minimum number of new fall students. Course Placements Most entering students from high school participate in a matriculation process of assessment, orientation, counseling, and educational planning. The assessment component places students into various levels of reading, writing, and mathematics (transfer or levels below transfer). A “level” represents one course in English or Math. Educational Goal Educational Goal is captured from students at the point of application for this report. Student goal often changes during the counseling process with many Undecided or Undeclared students declaring a major and educational goal after working with a counselor. Course Retention & Success The Percent Retained is the percentage of student course enrollments in which students were retained (i.e., did not drop or withdraw). The Percent Successful is the percentage of student course enrollments resulting in a C/Pass or better. Academic Progress The Units per Term table is the percentage of students who attempted a specific unit range in the fall term indicated. Full-time enrollment is defined as attempting 12 or more units. Persistence is the percentage of students enrolled their first fall term who subsequently enrolled at El Camino College the following spring semester. The High School Report Cards were created for local high school principals, counselors, and other leadership by the Office of Institutional Research & Planning on behalf of El Camino College.

El Camino College Compton Center
Report Card for 2012 GraduatesCentennial High School
Course Placements
Course Retention & Success
Academic Progress
Total in First Fall
66458Total
Math Courses
% Successful (C or better)
1%4%13%
Levels Below
Centennial High
Reading Writing Math Reading Writing Math
All Feeder High Schools
‐123
4
Total Tested
13%50%25%‐
46%29%
‐
24 24
0%24%0%8%68%
25
21%19%47%13%‐
229 228 231
14%54%21%
‐
34%1%11%52%
Educational Goal CHS
33%
5%28%0%26%
Total Known 39
All
42%
7%
2%22%1%
25%
470
Course Type
% Retained
CHS All CHS AllAll Courses 78% 82%
76% 83%Transferable CourseBasic Skills CoursesEnglish Courses
Voc Ed Courses
51% 65%52% 68%
83%88%67%72%
76%86%76%80%
45%57%40%50%
53%67%54%60%
Total Enrolled
0%
Units per Term15+
CHS All
4%12 ‐ 14.59 ‐ 11.56 ‐ 8.53 ‐ 5.5< 3
Fall 2012
31% 29%20% 22%29% 25%17% 18%3% 1%
Persistence
Fall to Spring
CHS All
78% 71%
58 664
58 664 58 664
8%
Intend to TransferDegree/Certif. Only
Retrain/Recertify
Basic Skills/GEDEnrichmentUndecided
Graduating class size: 192 Enrolled at CEC: 58 (30%)
11%21%
ECC Institutional Research and Planning October 2013

El Camino College High School Report Card – Background Information
The High School Report Card provides statistics on entering academic performance of new students from local area high schools. Because specific graduation date information is not always reported by applicants, “new students” are approximated in this report by age and first term at the College. The source for graduating class size is the California Department of Education’s DataQuest site. This page provides explanatory information to assist in the interpretation of the report. For each of the following sections, percentages are provided for each high school along with the average for all feeder high schools. Reports are generated for all feeder high schools that are associated with a minimum number of new fall students. Course Placements Most entering students from high school participate in a matriculation process of assessment, orientation, counseling, and educational planning. The assessment component places students into various levels of reading, writing, and mathematics (transfer or levels below transfer). A “level” represents one course in English or Math. Educational Goal Educational Goal is captured from students at the point of application for this report. Student goal often changes during the counseling process with many Undecided or Undeclared students declaring a major and educational goal after working with a counselor. Course Retention & Success The Percent Retained is the percentage of student course enrollments in which students were retained (i.e., did not drop or withdraw). The Percent Successful is the percentage of student course enrollments resulting in a C/Pass or better. Academic Progress The Units per Term table is the percentage of students who attempted a specific unit range in the fall term indicated. Full-time enrollment is defined as attempting 12 or more units. Persistence is the percentage of students enrolled their first fall term who subsequently enrolled at El Camino College the following spring semester. The High School Report Cards were created for local high school principals, counselors, and other leadership by the Office of Institutional Research & Planning on behalf of El Camino College.

El Camino College Compton Center
Report Card for 2012 GraduatesCompton High School
Course Placements
Course Retention & Success
Academic Progress
Total in First Fall
664154Total
Math Courses
% Successful (C or better)
1%14%21%
Levels Below
Compton High
Reading Writing Math Reading Writing Math
All Feeder High Schools
‐123
4
Total Tested
18%53%9%
‐
54%23%
‐
57 57
2%44%2%9%44%
57
21%19%47%13%‐
229 228 231
14%54%21%
‐
34%1%11%52%
Educational Goal CHS
35%
1%30%3%23%
Total Known 120
All
42%
7%
2%22%1%
25%
470
Course Type
% Retained
CHS All CHS AllAll Courses 80% 82%
80% 83%Transferable CourseBasic Skills CoursesEnglish Courses
Voc Ed Courses
67% 65%70% 68%
78%84%74%79%
76%86%76%80%
53%66%56%65%
53%67%54%60%
Total Enrolled
1%
Units per Term15+
CHS All
4%12 ‐ 14.59 ‐ 11.56 ‐ 8.53 ‐ 5.5< 3
Fall 2012
32% 29%22% 22%29% 25%15% 18%1% 1%
Persistence
Fall to Spring
CHS All
70% 71%
154 664
154 664 154 664
9%
Intend to TransferDegree/Certif. Only
Retrain/Recertify
Basic Skills/GEDEnrichmentUndecided
Graduating class size: 343 Enrolled at CEC: 154 ( )45%
11%9%
ECC Institutional Research and Planning October 2013

El Camino College High School Report Card – Background Information
The High School Report Card provides statistics on entering academic performance of new students from local area high schools. Because specific graduation date information is not always reported by applicants, “new students” are approximated in this report by age and first term at the College. The source for graduating class size is the California Department of Education’s DataQuest site. This page provides explanatory information to assist in the interpretation of the report. For each of the following sections, percentages are provided for each high school along with the average for all feeder high schools. Reports are generated for all feeder high schools that are associated with a minimum number of new fall students. Course Placements Most entering students from high school participate in a matriculation process of assessment, orientation, counseling, and educational planning. The assessment component places students into various levels of reading, writing, and mathematics (transfer or levels below transfer). A “level” represents one course in English or Math. Educational Goal Educational Goal is captured from students at the point of application for this report. Student goal often changes during the counseling process with many Undecided or Undeclared students declaring a major and educational goal after working with a counselor. Course Retention & Success The Percent Retained is the percentage of student course enrollments in which students were retained (i.e., did not drop or withdraw). The Percent Successful is the percentage of student course enrollments resulting in a C/Pass or better. Academic Progress The Units per Term table is the percentage of students who attempted a specific unit range in the fall term indicated. Full-time enrollment is defined as attempting 12 or more units. Persistence is the percentage of students enrolled their first fall term who subsequently enrolled at El Camino College the following spring semester. The High School Report Cards were created for local high school principals, counselors, and other leadership by the Office of Institutional Research & Planning on behalf of El Camino College.

El Camino College Compton Center
Report Card for 2012 GraduatesDominguez High School
Course Placements
Course Retention & Success
Academic Progress
Total in First Fall
664161Total
Math Courses
% Successful (C or better)
1%19%21%
Levels Below
Dominguez High
Reading Writing Math Reading Writing Math
All Feeder High Schools
‐123
4
Total Tested
25%42%13%‐
56%15%
‐
53 52
2%42%4%13%40%
55
21%19%47%13%‐
229 228 231
14%54%21%
‐
34%1%11%52%
Educational Goal DHS
35%
1%29%2%30%
Total Known 126
All
42%
7%
2%22%1%
25%
470
Course Type
% Retained
DHS All DHS AllAll Courses 88% 82%
88% 83%Transferable CourseBasic Skills CoursesEnglish Courses
Voc Ed Courses
72% 65%72% 68%
90%93%85%88%
76%86%76%80%
65%77%61%72%
53%67%54%60%
Total Enrolled
0%
Units per Term15+
DHS All
4%12 ‐ 14.59 ‐ 11.56 ‐ 8.53 ‐ 5.5< 3
Fall 2012
22% 29%11% 22%39% 25%28% 18%0% 1%
Persistence
Fall to Spring
DHS All
84% 71%
161 664
161 664 161 664
4%
Intend to TransferDegree/Certif. Only
Retrain/Recertify
Basic Skills/GEDEnrichmentUndecided
Graduating class size: 371 Enrolled at CEC: 161 ( )43%
11%10%
ECC Institutional Research and Planning October 2013

El Camino College High School Report Card – Background Information
The High School Report Card provides statistics on entering academic performance of new students from local area high schools. Because specific graduation date information is not always reported by applicants, “new students” are approximated in this report by age and first term at the College. The source for graduating class size is the California Department of Education’s DataQuest site. This page provides explanatory information to assist in the interpretation of the report. For each of the following sections, percentages are provided for each high school along with the average for all feeder high schools. Reports are generated for all feeder high schools that are associated with a minimum number of new fall students. Course Placements Most entering students from high school participate in a matriculation process of assessment, orientation, counseling, and educational planning. The assessment component places students into various levels of reading, writing, and mathematics (transfer or levels below transfer). A “level” represents one course in English or Math. Educational Goal Educational Goal is captured from students at the point of application for this report. Student goal often changes during the counseling process with many Undecided or Undeclared students declaring a major and educational goal after working with a counselor. Course Retention & Success The Percent Retained is the percentage of student course enrollments in which students were retained (i.e., did not drop or withdraw). The Percent Successful is the percentage of student course enrollments resulting in a C/Pass or better. Academic Progress The Units per Term table is the percentage of students who attempted a specific unit range in the fall term indicated. Full-time enrollment is defined as attempting 12 or more units. Persistence is the percentage of students enrolled their first fall term who subsequently enrolled at El Camino College the following spring semester. The High School Report Cards were created for local high school principals, counselors, and other leadership by the Office of Institutional Research & Planning on behalf of El Camino College.

El Camino College Compton Center
Report Card for 2012 GraduatesJordan High School
Course Placements
Course Retention & Success
Academic Progress
Total in First Fall
66493Total
Math Courses
% Successful (C or better)
1%12%24%
Levels Below
Jordan High
Reading Writing Math Reading Writing Math
All Feeder High Schools
‐123
4
Total Tested
9%55%12%‐
48%24%
‐
33 33
0%22%0%13%66%
32
21%19%47%13%‐
229 228 231
14%54%21%
‐
34%1%11%52%
Educational Goal JHS
53%
0%12%0%26%
Total Known 58
All
42%
7%
2%22%1%
25%
470
Course Type
% Retained
JHS All JHS AllAll Courses 75% 82%
79% 83%Transferable CourseBasic Skills CoursesEnglish Courses
Voc Ed Courses
56% 65%60% 68%
60%73%72%74%
76%86%76%80%
42%55%51%37%
53%67%54%60%
Total Enrolled
0%
Units per Term15+
JHS All
4%12 ‐ 14.59 ‐ 11.56 ‐ 8.53 ‐ 5.5< 3
Fall 2012
21% 29%7% 22%
29% 25%36% 18%7% 1%
Persistence
Fall to Spring
JHS All
62% 71%
93 664
93 664 93 664
9%
Intend to TransferDegree/Certif. Only
Retrain/Recertify
Basic Skills/GEDEnrichmentUndecided
Graduating class size: 644 Enrolled at CEC: 93 (14%)
11%15%
ECC Institutional Research and Planning October 2013

El Camino College High School Report Card – Background Information
The High School Report Card provides statistics on entering academic performance of new students from local area high schools. Because specific graduation date information is not always reported by applicants, “new students” are approximated in this report by age and first term at the College. The source for graduating class size is the California Department of Education’s DataQuest site. This page provides explanatory information to assist in the interpretation of the report. For each of the following sections, percentages are provided for each high school along with the average for all feeder high schools. Reports are generated for all feeder high schools that are associated with a minimum number of new fall students. Course Placements Most entering students from high school participate in a matriculation process of assessment, orientation, counseling, and educational planning. The assessment component places students into various levels of reading, writing, and mathematics (transfer or levels below transfer). A “level” represents one course in English or Math. Educational Goal Educational Goal is captured from students at the point of application for this report. Student goal often changes during the counseling process with many Undecided or Undeclared students declaring a major and educational goal after working with a counselor. Course Retention & Success The Percent Retained is the percentage of student course enrollments in which students were retained (i.e., did not drop or withdraw). The Percent Successful is the percentage of student course enrollments resulting in a C/Pass or better. Academic Progress The Units per Term table is the percentage of students who attempted a specific unit range in the fall term indicated. Full-time enrollment is defined as attempting 12 or more units. Persistence is the percentage of students enrolled their first fall term who subsequently enrolled at El Camino College the following spring semester. The High School Report Cards were created for local high school principals, counselors, and other leadership by the Office of Institutional Research & Planning on behalf of El Camino College.

El Camino College Compton Center
Report Card for 2012 GraduatesLynwood High School
Course Placements
Course Retention & Success
Academic Progress
Total in First Fall
66475Total
Math Courses
% Successful (C or better)
1%15%15%
Levels Below
Lynwood High
Reading Writing Math Reading Writing Math
All Feeder High Schools
‐123
4
Total Tested
33%33%19%‐
59%7%
‐
27 27
0%21%0%11%68%
28
21%19%47%13%‐
229 228 231
14%54%21%
‐
34%1%11%52%
Educational Goal LHS
63%
0%12%0%16%
Total Known 49
All
42%
7%
2%22%1%
25%
470
Course Type
% Retained
LHS All LHS AllAll Courses 78% 82%
84% 83%Transferable CourseBasic Skills CoursesEnglish Courses
Voc Ed Courses
60% 65%68% 68%
67%75%55%75%
76%86%76%80%
50%52%36%56%
53%67%54%60%
Total Enrolled
4%
Units per Term15+
LHS All
4%12 ‐ 14.59 ‐ 11.56 ‐ 8.53 ‐ 5.5< 3
Fall 2012
21% 29%13% 22%13% 25%50% 18%0% 1%
Persistence
Fall to Spring
LHS All
67% 71%
75 664
75 664 75 664
8%
Intend to TransferDegree/Certif. Only
Retrain/Recertify
Basic Skills/GEDEnrichmentUndecided
Graduating class size: 477 Enrolled at CEC: 75 (16%)
11%19%
ECC Institutional Research and Planning October 2013

El Camino College High School Report Card – Background Information
The High School Report Card provides statistics on entering academic performance of new students from local area high schools. Because specific graduation date information is not always reported by applicants, “new students” are approximated in this report by age and first term at the College. The source for graduating class size is the California Department of Education’s DataQuest site. This page provides explanatory information to assist in the interpretation of the report. For each of the following sections, percentages are provided for each high school along with the average for all feeder high schools. Reports are generated for all feeder high schools that are associated with a minimum number of new fall students. Course Placements Most entering students from high school participate in a matriculation process of assessment, orientation, counseling, and educational planning. The assessment component places students into various levels of reading, writing, and mathematics (transfer or levels below transfer). A “level” represents one course in English or Math. Educational Goal Educational Goal is captured from students at the point of application for this report. Student goal often changes during the counseling process with many Undecided or Undeclared students declaring a major and educational goal after working with a counselor. Course Retention & Success The Percent Retained is the percentage of student course enrollments in which students were retained (i.e., did not drop or withdraw). The Percent Successful is the percentage of student course enrollments resulting in a C/Pass or better. Academic Progress The Units per Term table is the percentage of students who attempted a specific unit range in the fall term indicated. Full-time enrollment is defined as attempting 12 or more units. Persistence is the percentage of students enrolled their first fall term who subsequently enrolled at El Camino College the following spring semester. The High School Report Cards were created for local high school principals, counselors, and other leadership by the Office of Institutional Research & Planning on behalf of El Camino College.

El Camino College Compton Center
Report Card for 2012 GraduatesParamount High School
Course Placements
Course Retention & Success
Academic Progress
Total in First Fall
66456Total
Math Courses
% Successful (C or better)
1%11%39%
Levels Below
Paramount High
Reading Writing Math Reading Writing Math
All Feeder High Schools
‐123
4
Total Tested
17%33%11%‐
61%28%
‐
18 18
6%53%0%12%29%
17
21%19%47%13%‐
229 228 231
14%54%21%
‐
34%1%11%52%
Educational Goal PHS
47%
3%8%0%26%
Total Known 38
All
42%
7%
2%22%1%
25%
470
Course Type
% Retained
PHS All PHS AllAll Courses 87% 82%
84% 83%Transferable CourseBasic Skills CoursesEnglish Courses
Voc Ed Courses
73% 65%72% 68%
93%98%91%91%
76%86%76%80%
78%83%68%73%
53%67%54%60%
Total Enrolled
6%
Units per Term15+
PHS All
4%12 ‐ 14.59 ‐ 11.56 ‐ 8.53 ‐ 5.5< 3
Fall 2012
12% 29%29% 22%35% 25%12% 18%6% 1%
Persistence
Fall to Spring
PHS All
70% 71%
56 664
56 664 56 664
16%
Intend to TransferDegree/Certif. Only
Retrain/Recertify
Basic Skills/GEDEnrichmentUndecided
Graduating class size: 951 Enrolled at CEC: 56 (6%)
11%0%
ECC Institutional Research and Planning October 2013

El Camino College High School Report Card – Background Information
The High School Report Card provides statistics on entering academic performance of new students from local area high schools. Because specific graduation date information is not always reported by applicants, “new students” are approximated in this report by age and first term at the College. The source for graduating class size is the California Department of Education’s DataQuest site. This page provides explanatory information to assist in the interpretation of the report. For each of the following sections, percentages are provided for each high school along with the average for all feeder high schools. Reports are generated for all feeder high schools that are associated with a minimum number of new fall students. Course Placements Most entering students from high school participate in a matriculation process of assessment, orientation, counseling, and educational planning. The assessment component places students into various levels of reading, writing, and mathematics (transfer or levels below transfer). A “level” represents one course in English or Math. Educational Goal Educational Goal is captured from students at the point of application for this report. Student goal often changes during the counseling process with many Undecided or Undeclared students declaring a major and educational goal after working with a counselor. Course Retention & Success The Percent Retained is the percentage of student course enrollments in which students were retained (i.e., did not drop or withdraw). The Percent Successful is the percentage of student course enrollments resulting in a C/Pass or better. Academic Progress The Units per Term table is the percentage of students who attempted a specific unit range in the fall term indicated. Full-time enrollment is defined as attempting 12 or more units. Persistence is the percentage of students enrolled their first fall term who subsequently enrolled at El Camino College the following spring semester. The High School Report Cards were created for local high school principals, counselors, and other leadership by the Office of Institutional Research & Planning on behalf of El Camino College.

El Camino College Compton Center
Report Card for 2012 GraduatesVista High School
Course Placements
Course Retention & Success
Academic Progress
Total in First Fall
66411Total
Math Courses
% Successful (C or better)
1%0%25%
Levels Below
Vista High
Reading Writing Math Reading Writing Math
All Feeder High Schools
‐123
4
Total Tested
25%25%25%‐
25%75%
‐
4 4
0%0%0%0%
100%
3
21%19%47%13%‐
229 228 231
14%54%21%
‐
34%1%11%52%
Educational Goal VHS
25%
13%25%13%13%
Total Known 8
All
42%
7%
2%22%1%
25%
470
Course Type
% Retained
VHS All VHS AllAll Courses 97% 82%
100% 83%Transferable CourseBasic Skills CoursesEnglish Courses
Voc Ed Courses
81% 65%89% 68%
89%100%86%100%
76%86%76%80%
67%86%57%
100%
53%67%54%60%
Total Enrolled
0%
Units per Term15+
VHS All
4%12 ‐ 14.59 ‐ 11.56 ‐ 8.53 ‐ 5.5< 3
Fall 2012
0% 29%50% 22%0% 25%
50% 18%0% 1%
Persistence
Fall to Spring
VHS All
82% 71%
11 664
11 664 11 664
13%
Intend to TransferDegree/Certif. Only
Retrain/Recertify
Basic Skills/GEDEnrichmentUndecided
Graduating class size: 46 Enrolled at CEC: 11 (24%)
11%0%
ECC Institutional Research and Planning October 2013

El Camino College High School Report Card – Background Information
The High School Report Card provides statistics on entering academic performance of new students from local area high schools. Because specific graduation date information is not always reported by applicants, “new students” are approximated in this report by age and first term at the College. The source for graduating class size is the California Department of Education’s DataQuest site. This page provides explanatory information to assist in the interpretation of the report. For each of the following sections, percentages are provided for each high school along with the average for all feeder high schools. Reports are generated for all feeder high schools that are associated with a minimum number of new fall students. Course Placements Most entering students from high school participate in a matriculation process of assessment, orientation, counseling, and educational planning. The assessment component places students into various levels of reading, writing, and mathematics (transfer or levels below transfer). A “level” represents one course in English or Math. Educational Goal Educational Goal is captured from students at the point of application for this report. Student goal often changes during the counseling process with many Undecided or Undeclared students declaring a major and educational goal after working with a counselor. Course Retention & Success The Percent Retained is the percentage of student course enrollments in which students were retained (i.e., did not drop or withdraw). The Percent Successful is the percentage of student course enrollments resulting in a C/Pass or better. Academic Progress The Units per Term table is the percentage of students who attempted a specific unit range in the fall term indicated. Full-time enrollment is defined as attempting 12 or more units. Persistence is the percentage of students enrolled their first fall term who subsequently enrolled at El Camino College the following spring semester. The High School Report Cards were created for local high school principals, counselors, and other leadership by the Office of Institutional Research & Planning on behalf of El Camino College.

El Camino College Compton Center
Report Card for 2012 GraduatesYour School Here
Course Placements
Course Retention & Success
Academic Progress
Total in First Fall
664Total
Math Courses
% Successful (C or better)
1%
Levels Below
Your School Here
Reading Writing Math Reading Writing Math
All Feeder High Schools
‐123
4Total Tested
‐ ‐
21%19%47%13%‐
229 228 231
14%54%21%
‐
34%1%11%52%
Educational Goal YSH
Total Known
All
42%
7%2%
22%1%
25%
470
Course Type
% Retained
YSH All YSH All
All Courses 82%83%Transferable Course
Basic Skills CoursesEnglish Courses
Voc Ed Courses
65%68%
76%86%76%80%
53%67%54%60%
Total Enrolled
Units per Term15+
YSH All
4%12 ‐ 14.59 ‐ 11.56 ‐ 8.53 ‐ 5.5< 3
Fall 2012
29%22%25%18%1%
Persistence
Fall to Spring
YSH All
71%
664
664 664
Intend to Transfer
Degree/Certif. Only
Retrain/RecertifyBasic Skills/GEDEnrichmentUndecided
Graduating class size: Enrolled at CEC: ( )
11%
ECC Institutional Research and Planning October 2013

El Camino College High School Report Card – Background Information
The High School Report Card provides statistics on entering academic performance of new students from local area high schools. Because specific graduation date information is not always reported by applicants, “new students” are approximated in this report by age and first term at the College. The source for graduating class size is the California Department of Education’s DataQuest site. This page provides explanatory information to assist in the interpretation of the report. For each of the following sections, percentages are provided for each high school along with the average for all feeder high schools. Reports are generated for all feeder high schools that are associated with a minimum number of new fall students. Course Placements Most entering students from high school participate in a matriculation process of assessment, orientation, counseling, and educational planning. The assessment component places students into various levels of reading, writing, and mathematics (transfer or levels below transfer). A “level” represents one course in English or Math. Educational Goal Educational Goal is captured from students at the point of application for this report. Student goal often changes during the counseling process with many Undecided or Undeclared students declaring a major and educational goal after working with a counselor. Course Retention & Success The Percent Retained is the percentage of student course enrollments in which students were retained (i.e., did not drop or withdraw). The Percent Successful is the percentage of student course enrollments resulting in a C/Pass or better. Academic Progress The Units per Term table is the percentage of students who attempted a specific unit range in the fall term indicated. Full-time enrollment is defined as attempting 12 or more units. Persistence is the percentage of students enrolled their first fall term who subsequently enrolled at El Camino College the following spring semester. The High School Report Cards were created for local high school principals, counselors, and other leadership by the Office of Institutional Research & Planning on behalf of El Camino College.

Institutional Research & Planning 2/14/2014
All Feeder High Schools Academic Milestones Report Fall 2007, 2008 and 2009 First Time Students
This is a report of the progress of new first-time students from all feeder high schools in Fall 2007, Fall 2008 and Fall 2009. New students are defined as students less than 21 years of age attending El Camino College Compton Center for the first time in each fall term and enrolled in at least 10 units. Students were tracked to determine if they achieved any of the following four academic milestones within four years: Associate Degrees and Certificates, Persistence, students completing 30 or more units and Transfer to a four-year institution. Definitions for each of these milestones appear on page two of this report. Transfer data relies on the successful matching of students across different institutions; therefore, transfer rates may be underreported by up to 10%. The chart below shows percentages of each cohort reaching each milestone. Milestone rates for all students from local high schools can be found on page 2.
Fall 2007 cohort: 61 students. Within four years of their first semester, 3 received an Associate degree or a Certificate, 17 persisted through 3 consecutive terms beginning with their first term, 18 earned 30 or more units and 5 transferred to a four-year institution.
Fall 2008 cohort: 81 students. Within four years of their first semester, 9 received an Associate degree or a Certificate, 31 persisted through 3 consecutive terms beginning with their first term, 38 earned 30 or more units and 9 transferred to a four-year institution.
Fall 2009 cohort: 84 students. Within four years of their first semester, 10 received an Associate degree or a Certificate, 41 persisted through 3 consecutive terms beginning with their first term, 36 earned 30 or more units and 10 transferred to a four-year institution.
5% 11% 12%
28%
38%
49%
30%
47%
43%
8% 11% 12%
0%
10%
20%
30%
40%
50%
60%
Fall 07 Fall 08 Fall 09
All Feeder High Schools Percent of Cohort Reaching Academic Milestones
Degrees and Certificates
Persistence
30 + Units
Transferred

Institutional Research & Planning 2/14/2014
Notes:
• This “All Feeder” report includes high schools such as Carson and Paramount for which individual reports could not be produced. These schools had too few verified enrollments (<10 per annual cohort) to permit the display of meaningful results without jeopardizing student privacy.
Definitions:
• Entering fall cohort = New Compton Center students from this high school under age 21 and enrolled in at least 10 units in their first fall term
• Associate Degree = Earned an Associate of Arts (AA) or an Associate of Science (AS) • Certificate = Earned a certificate consisting of 18 or more units • Persistence = Student was enrolled in courses during 3 consecutive terms. (Fall, Spring, Fall) • Transferred = Enrolled at a four-year institution after beginning college course work at Compton Center
Data Sources:
• California Community College Chancellor’s Office • Compton Center • National Student Clearinghouse

Institutional Research & Planning 2/14/2014
Centennial High School Academic Milestones Report Fall 2007, 2008 and 2009 First Time Students
This is a report of the progress of new first-time students from Centennial High School in Fall 2007, Fall 2008 and Fall 2009. New students are defined as students less than 21 years of age attending El Camino College Compton Center for the first time in each fall term and enrolled in at least 10 units. Students were tracked to determine if they achieved any of the following four academic milestones within four years: Associate Degrees and Certificates, Persistence, students completing 30 or more units and Transfer to a four-year institution. Definitions for each of these milestones appear on page two of this report. Transfer data relies on the successful matching of students across different institutions; therefore, transfer rates may be underreported by up to 10%. The chart below shows percentages of each cohort reaching each milestone. Milestone rates for all students from local high schools can be found on page 2.
Fall 2007 cohort: 6 students. Within four years of their first semester, 1 received an Associate degree or a Certificate, 2 persisted through 3 consecutive terms beginning with their first term, 3 earned 30 or more units and 1 transferred to a four-year institution.
Fall 2008 cohort: 7 students. Within four years of their first semester, 1 received an Associate degree or a Certificate, 3 persisted through 3 consecutive terms beginning with their first term, 5 earned 30 or more units and 1 transferred to a four-year institution.
Fall 2009 cohort: 14 students. Within four years of their first semester, 1 received an Associate degree or a Certificate, 6 persisted through 3 consecutive terms beginning with their first term, 6 earned 30 or more units and 2 transferred to a four-year institution.
17% 14% 7%
33%
43% 43% 50%
71%
43%
17% 14% 14%
0%
10%
20%
30%
40%
50%
60%
70%
80%
Fall 07 Fall 08 Fall 09
Centennial High School Percent of Cohort Reaching Academic Milestones
Degrees and Certificates
Persistence
30 + Units
Transferred

Institutional Research & Planning 2/14/2014
Academic Milestone Achievements for All Feeder High Schools:
The following chart provides the same information displayed on the previous page for all area high schools that send significant numbers of students to Compton Center (Fall 07 N=61, Fall 08 N=81, Fall 09 N=84). These figures serve as a reference for your students.
Definitions:
• Entering fall cohort = New Compton Center students from this high school under age 21 and enrolled in at least 10 units in their first fall term
• Associate Degree = Earned an Associate of Arts (AA) or an Associate of Science (AS) • Certificate = Earned a certificate consisting of 18 or more units • Persistence = Student was enrolled in courses during 3 consecutive terms. (Fall, Spring, Fall) • Transferred = Enrolled at a four-year institution after beginning college course work at Compton Center
Data Sources:
• California Community College Chancellor’s Office • El Camino College • National Student Clearinghouse
5% 11% 12%
28%
38%
49%
30%
47%
43%
8% 11% 12%
0%
10%
20%
30%
40%
50%
60%
Fall 07 Fall 08 Fall 09
All Feeder High Schools Percent of Cohort Reaching Academic Milestones
Degrees and Certificates
Persistence
30 + Units
Transferred

Institutional Research & Planning 2/14/2014
Compton High School Academic Milestones Report Fall 2007, 2008 and 2009 First Time Students
This is a report of the progress of new first-time students from Compton High School in Fall 2007, Fall 2008 and Fall 2009. New students are defined as students less than 21 years of age attending El Camino College Compton Center for the first time in each fall term and enrolled in at least 10 units. Students were tracked to determine if they achieved any of the following four academic milestones within four years: Associate Degrees and Certificates, Persistence, students completing 30 or more units and Transfer to a four-year institution. Definitions for each of these milestones appear on page two of this report. Transfer data relies on the successful matching of students across different institutions; therefore, transfer rates may be underreported by up to 10%. The chart below shows percentages of each cohort reaching each milestone. Milestone rates for all students from local high schools can be found on page 2.
Fall 2007 cohort: 12 students. Within four years of their first semester, 0 received an Associate degree or a Certificate, 5 persisted through 3 consecutive terms beginning with their first term, 5 earned 30 or more units and 1 transferred to a four-year institution.
Fall 2008 cohort: 12 students. Within four years of their first semester, 2 received an Associate degree or a Certificate, 5 persisted through 3 consecutive terms beginning with their first term, 4 earned 30 or more units and 2 transferred to a four-year institution.
Fall 2009 cohort: 18 students. Within four years of their first semester, 3 received an Associate degree or a Certificate, 7 persisted through 3 consecutive terms beginning with their first term, 8 earned 30 or more units and 3 transferred to a four-year institution.
0%
17% 17%
42% 42%
39% 42%
33%
44%
8%
17% 17%
0%
5%
10%
15%
20%
25%
30%
35%
40%
45%
50%
Fall 07 Fall 08 Fall 09
Compton High School Percent of Cohort Reaching Academic Milestones
Degrees and Certificates
Persistence
30 + Units
Transferred

Institutional Research & Planning 2/14/2014
Academic Milestone Achievements for All Feeder High Schools:
The following chart provides the same information displayed on the previous page for all area high schools that send significant numbers of students to Compton Center (Fall 07 N=61, Fall 08 N=81, Fall 09 N=84). These figures serve as a reference for your students.
Definitions:
• Entering fall cohort = New Compton Center students from this high school under age 21 and enrolled in at least 10 units in their first fall term
• Associate Degree = Earned an Associate of Arts (AA) or an Associate of Science (AS) • Certificate = Earned a certificate consisting of 18 or more units • Persistence = Student was enrolled in courses during 3 consecutive terms. (Fall, Spring, Fall) • Transferred = Enrolled at a four-year institution after beginning college course work at Compton Center
Data Sources:
• California Community College Chancellor’s Office • El Camino College • National Student Clearinghouse
5% 11% 12%
28%
38%
49%
30%
47%
43%
8% 11% 12%
0%
10%
20%
30%
40%
50%
60%
Fall 07 Fall 08 Fall 09
All Feeder High Schools Percent of Cohort Reaching Academic Milestones
Degrees and Certificates
Persistence
30 + Units
Transferred

Institutional Research & Planning 2/14/2014
Dominguez High School Academic Milestones Report Fall 2007, 2008 and 2009 First Time Students
This is a report of the progress of new first-time students from Dominguez High School in Fall 2007, Fall 2008 and Fall 2009. New students are defined as students less than 21 years of age attending El Camino College Compton Center for the first time in each fall term and enrolled in at least 10 units. Students were tracked to determine if they achieved any of the following four academic milestones within four years: Associate Degrees and Certificates, Persistence, students completing 30 or more units and Transfer to a four-year institution. Definitions for each of these milestones appear on page two of this report. Transfer data relies on the successful matching of students across different institutions; therefore, transfer rates may be underreported by up to 10%. The chart below shows percentages of each cohort reaching each milestone. Milestone rates for all students from local high schools can be found on page 2.
Fall 2007 cohort: 16 students. Within four years of their first semester, 1 received an Associate degree or a Certificate, 2 persisted through 3 consecutive terms beginning with their first term, 3 earned 30 or more units and 2 transferred to a four-year institution.
Fall 2008 cohort: 19 students. Within four years of their first semester, 5 received an Associate degree or a Certificate, 10 persisted through 3 consecutive terms beginning with their first term, 12 earned 30 or more units and 2 transferred to a four-year institution.
Fall 2009 cohort: 13 students. Within four years of their first semester, 3 received an Associate degree or a Certificate, 10 persisted through 3 consecutive terms beginning with their first term, 9 earned 30 or more units and 2 transferred to a four-year institution.
6%
26%
0%
13%
53%
77%
19%
63% 69%
13%
11% 15%
0%
10%
20%
30%
40%
50%
60%
70%
80%
90%
Fall 07 Fall 08 Fall 09
Dominguez High School Percent of Cohort Reaching Academic Milestones
Degrees and Certificates
Persistence
30 + Units
Transferred

Institutional Research & Planning 2/14/2014
Academic Milestone Achievements for All Feeder High Schools:
The following chart provides the same information displayed on the previous page for all area high schools that send significant numbers of students to Compton Center (Fall 07 N=61, Fall 08 N=81, Fall 09 N=84). These figures serve as a reference for your students.
Definitions:
• Entering fall cohort = New Compton Center students from this high school under age 21 and enrolled in at least 10 units in their first fall term
• Associate Degree = Earned an Associate of Arts (AA) or an Associate of Science (AS) • Certificate = Earned a certificate consisting of 18 or more units • Persistence = Student was enrolled in courses during 3 consecutive terms. (Fall, Spring, Fall) • Transferred = Enrolled at a four-year institution after beginning college course work at Compton Center
Data Sources:
• California Community College Chancellor’s Office • El Camino College • National Student Clearinghouse
5% 11% 12%
28%
38%
49%
30%
47%
43%
8% 11% 12%
0%
10%
20%
30%
40%
50%
60%
Fall 07 Fall 08 Fall 09
All Feeder High Schools Percent of Cohort Reaching Academic Milestones
Degrees and Certificates
Persistence
30 + Units
Transferred

Institutional Research & Planning 2/14/2014
Jordan High School Academic Milestones Report Fall 2007, 2008 and 2009 First Time Students
This is a report of the progress of new first-time students from Jordan High School in Fall 2007, Fall 2008 and Fall 2009. New students are defined as students less than 21 years of age attending El Camino College Compton Center for the first time in each fall term and enrolled in at least 10 units. Students were tracked to determine if they achieved any of the following four academic milestones within four years: Associate Degrees and Certificates, Persistence, students completing 30 or more units and Transfer to a four-year institution. Definitions for each of these milestones appear on page two of this report. Transfer data relies on the successful matching of students across different institutions; therefore, transfer rates may be underreported by up to 10%. The chart below shows percentages of each cohort reaching each milestone. Milestone rates for all students from local high schools can be found on page 2.
Fall 2007 cohort: 11 students. Within four years of their first semester, 0 received an Associate degree or a Certificate, 2 persisted through 3 consecutive terms beginning with their first term, 3 earned 30 or more units and 0 transferred to a four-year institution.
Fall 2008 cohort: 18 students. Within four years of their first semester, 1 received an Associate degree or a Certificate, 5 persisted through 3 consecutive terms beginning with their first term, 8 earned 30 or more units and 0 transferred to a four-year institution.
Fall 2009 cohort: 16 students. Within four years of their first semester, 0 received an Associate degree or a Certificate, 7 persisted through 3 consecutive terms beginning with their first term, 4 earned 30 or more units and 1 transferred to a four-year institution.
0%
6%
0%
18%
28%
44%
27%
44%
25%
0% 0% 6%
0%
5%
10%
15%
20%
25%
30%
35%
40%
45%
50%
Fall 07 Fall 08 Fall 09
Jordan High School Percent of Cohort Reaching Academic Milestones
Degrees and Certificates
Persistence
30 + Units
Transferred

Institutional Research & Planning 2/14/2014
Academic Milestone Achievements for All Feeder High Schools:
The following chart provides the same information displayed on the previous page for all area high schools that send significant numbers of students to Compton Center (Fall 07 N=61, Fall 08 N=81, Fall 09 N=84). These figures serve as a reference for your students.
Definitions:
• Entering fall cohort = New Compton Center students from this high school under age 21 and enrolled in at least 10 units in their first fall term
• Associate Degree = Earned an Associate of Arts (AA) or an Associate of Science (AS) • Certificate = Earned a certificate consisting of 18 or more units • Persistence = Student was enrolled in courses during 3 consecutive terms. (Fall, Spring, Fall) • Transferred = Enrolled at a four-year institution after beginning college course work at Compton Center
Data Sources:
• California Community College Chancellor’s Office • El Camino College • National Student Clearinghouse
5% 11% 12%
28%
38%
49%
30%
47%
43%
8% 11% 12%
0%
10%
20%
30%
40%
50%
60%
Fall 07 Fall 08 Fall 09
All Feeder High Schools Percent of Cohort Reaching Academic Milestones
Degrees and Certificates
Persistence
30 + Units
Transferred

Institutional Research & Planning 2/14/2014
Lynwood High School Academic Milestones Report Fall 2007, 2008 and 2009 First Time Students
This is a report of the progress of new first-time students from Lynwood High School in Fall 2007, Fall 2008 and Fall 2009. New students are defined as students less than 21 years of age attending El Camino College Compton Center for the first time in each fall term and enrolled in at least 10 units. Students were tracked to determine if they achieved any of the following four academic milestones within four years: Associate Degrees and Certificates, Persistence, students completing 30 or more units and Transfer to a four-year institution. Definitions for each of these milestones appear on page two of this report. Transfer data relies on the successful matching of students across different institutions; therefore, transfer rates may be underreported by up to 10%. The chart below shows percentages of each cohort reaching each milestone. Milestone rates for all students from local high schools can be found on page 2.
Fall 2007 cohort: 8 students. Within four years of their first semester, 1 received an Associate degree or a Certificate, 2 persisted through 3 consecutive terms beginning with their first term, 1 earned 30 or more units and 1 transferred to a four-year institution.
Fall 2008 cohort: 15 students. Within four years of their first semester, 0 received an Associate degree or a Certificate, 6 persisted through 3 consecutive terms beginning with their first term, 6 earned 30 or more units and 3 transferred to a four-year institution.
Fall 2009 cohort: 10 students. Within four years of their first semester, 1 received an Associate degree or a Certificate, 5 persisted through 3 consecutive terms beginning with their first term, 3 earned 30 or more units and 2 transferred to a four-year institution.
13% 0%
10%
25%
40%
50%
13%
40%
30%
13%
20% 20%
0%
10%
20%
30%
40%
50%
60%
Fall 07 Fall 08 Fall 09
Lynwood High School Percent of Cohort Reaching Academic Milestones
Degrees and Certificates
Persistence
30 + Units
Transferred

Institutional Research & Planning 2/14/2014
Academic Milestone Achievements for All Feeder High Schools:
The following chart provides the same information displayed on the previous page for all area high schools that send significant numbers of students to Compton Center (Fall 07 N=61, Fall 08 N=81, Fall 09 N=84). These figures serve as a reference for your students.
Definitions:
• Entering fall cohort = New Compton Center students from this high school under age 21 and enrolled in at least 10 units in their first fall term
• Associate Degree = Earned an Associate of Arts (AA) or an Associate of Science (AS) • Certificate = Earned a certificate consisting of 18 or more units • Persistence = Student was enrolled in courses during 3 consecutive terms. (Fall, Spring, Fall) • Transferred = Enrolled at a four-year institution after beginning college course work at Compton Center
Data Sources:
• California Community College Chancellor’s Office • El Camino College • National Student Clearinghouse
5% 11% 12%
28%
38%
49%
30%
47%
43%
8% 11% 12%
0%
10%
20%
30%
40%
50%
60%
Fall 07 Fall 08 Fall 09
All Feeder High Schools Percent of Cohort Reaching Academic Milestones
Degrees and Certificates
Persistence
30 + Units
Transferred

Institutional Research and Planning/JR21 1 October 2013
El Camino College Compton Center & Compton Community College District Profile 2013
Introduction The purpose of this data compilation is to highlight the characteristics of the Compton
Community College District (CCCD) community and the El Camino College Compton Center
student community to provide baseline background information for the Compton Center’s
enrollment management planning. The data included below will include demographics for the
Compton Community College District, incoming student demographic data, and projections for
future populations.
Data Sources Data sources include the U.S. 2010 Census for general demographics, the 2011 5-year American
Community Survey for economic and educational estimations, and California Department of
Education data for school API, rankings and graduation data. Chancellor’s Office MIS data and
local data are used for student enrollment trends. Finally, projections for future populations
compiled by Economic Modeling Specialists, Inc (EMSI) from the California Labor Market
Information Department are included.
District Profile The Compton Community College District includes the cities of Compton, Lynwood, and
Paramount, along with small portions of the cities of Bellflower, Lakewood, Long Beach, and
Carson. The district also includes portions of the unincorporated areas of Willowbrook, West
Rancho Dominguez, and East Rancho Dominguez. According to the 2010 US Census, the
combined population of these cities was over 277,000 people. The largest population comes
from Compton. Table 1 shows the population and percentage of the district population for each
city and unincorporated area. Though not entirely within the CCCD, the unincorporated county
areas are included as part of the district population because the district encompasses a sizeable
portion of these areas. Bellflower, Lakewood, Long Beach, and Carson are not included here
because the district only touches a small fraction of these cities.
TABLE 1: DISTRICT POPULATION BY CITY
City Population Percent
Compton 96,455 34.8%
Lynwood 69,722 25.2%
Paramount 54,098 19.5%
E Rancho Dominguez 15,135 5.5%
W Rancho Dominguez 5,669 2.0%
Willowbrook 35,983 13.0% Source: US Census 2010

Institutional Research and Planning/JR21 2 October 2013
Since different age groups use the college resources in different ways, Figure 1 shows the
percentage of different age group populations provided by each city. The people in the 10-17
age range are people who will be entering college in the next few years. College age students are
18-24 and represent the population who make up the majority of the College’s new students.
The population 25 years and older often continue to make use of the college as they complete
their studies, return for retraining, or develop personal interests. During the 2012-13 school year,
the 25 and older group accounted for 30% of the unduplicated students who enrolled in the
college, while 70% were in the normal college age range.
The population of the Compton Community College District is relatively young. The oldest
region, West Rancho Dominguez, has a median age of 32.9 years and is the least populous
region. The most populous region, Compton, has a median age of 28 which means that half the
population of that city is under 28 years old. The relative percentage that each place provides for
each age group is similar, indicating all of the areas are aging at about the same rate.
FIGURE 1: POPULATION BY PERCENTAGE OF DISTRICT AGE GROUP BY CITY
Source: US Census 2010
In terms of race/ethnicity, the district is now almost three-quarters Latino and 22% African-
American. All other groups make up less than 5% of the district combined. Latinos make up
76% of the college age population and that proportion goes up to 79% for the group age 10-17 so
the relative percent of Latinos is increasing for younger age groups.
28 27.8 28.6 26.1
32.9
28.2
0
5
10
15
20
25
30
35
0%
5%
10%
15%
20%
25%
30%
35%
40%
Media
n A
ge
Perc
ent
of
Dis
tric
t popula
tion*
Pop 10-17
College Age
Over 25
Median Age

Institutional Research and Planning/JR21 3 October 2013
FIGURE 2: DISTRICT COLLEGE AGE POPULATION BY ETHNIC GROUP
Source: US Census 2010
Student Profile Students who first came to El Camino College Compton Center during Falls 2010, 2011, and
2012 are analyzed to determine the characteristics of students entering the Compton Center.
Table 2 shows the top cities where new students reside.
TABLE 2: STUDENT POPULATION BY CITY
City City Rank
Percent N=3,224
Compton 1 27.2%
Los Angeles* 2 16.1%
Long Beach** 3 15.4%
Lynwood 4 5.8%
Carson** 5 4.9%
Gardena* 6 2.6%
Paramount 7 2.6%
Torrance* 8 2.5%
Bellflower** 9 2.3%
Inglewood* 10 1.7%
Hawthorne* 11 1.5%
South Gate* 12 1.4%
Downey* 13 1.3%
Lakewood** 14 1.1%
San Pedro* 15 1.1% *Cities fall outside the District boundaries.
**Portions of the city fall within District boundaries. Source: Local data
All Other 4%
Latino 76%
African American
20%

Institutional Research and Planning/JR21 4 October 2013
Less than 40% of the new first-time students come from within the District boundaries. Over
15% come from Los Angeles which borders the district to the northwest. Compton, which
accounts for 35% of the District’s college age population, makes up 27% of the new student
population. Lynwood, the District’s second most populous city provides less than 6% of the new
students to the college.
College age population is used as a comparison with new students because 70% of all new
students are within the 18-24 year old range.
Ethnically, new students are not the same as their proportions of the college age population
within the district boundaries (Figure 3). Latinos and African-Americans share an equal
proportion of the new student population with 45% and 44%, respectively which means African-
American students are enrolling in higher numbers than their relative populations. Asian, White,
and Multi-ethnic students each comprise about 3% of the new student population.
FIGURE 3: ETHNICITY OF NEW STUDENTS
Source: Local data
Feeder High Schools Students come to El Camino College from schools throughout Southern California. Of the 5,276
new students who first came to El Camino College Compton Center during the 2010-2012 Fall
terms, only 47 % (2,304 students) have identifiable high schools (most students have
“unidentified Public HS”) coded in their files. Of the students with an identified high school,
36% (819 students) come from within a district school (see Appendix A). However 53% (1,210
students) come from schools traditionally considered “feeder schools”. In terms of outcomes,
these feeder schools are toward the lower end of the spectrum based on state rankings of API
(Table 3). The state API ranking is based on a scale of 1-10 with 10 being awarded to schools
with the highest achievement in terms of standardized test targets. Ten of the top 15 feeders rank
in the bottom 30% (1,115 students) in state rank. Only one school ranks in the top 30% in state
rank.
Pacific Islander
1%
African-American
44%
Asian 3%
Multi-Ethnic 3%
Latino 45%
White 3%
Other 1%

Institutional Research and Planning/JR21 5 October 2013
Marco Antonio Firebaugh Senior High School is in the Compton Community College District,
but this relatively new school is not included among the top feeders. The belief is that more
students are coming from this school but coding issues currently make it difficult to track these
students.
TABLE 3: NEW ENROLLMENTS BY HIGH SCHOOL: TOP 15 FEEDERS
High School Fall 2010 Fall 2011 Fall 2012 Total 2012
API Rank %UC
Eligible
Compton High 81 74 75 230 1 20.4
Dominguez High 85 66 77 228 1 17.3
Jordan High* 65 43 41 149 2 18.8
Lynwood High 49 35 34 118 1 27.3
Gardena High* 31 28 30 89 1 24.9
Centennial High 30 29 25 84 1 20.8
King/Drew Medical Magnet
20 30 33 83 6 45.7
Paramount High 21 34 21 76 4 25.4
Carson High* 37 11 20 68 2 22.1
Polytechnic High*
23 21 19 63 5 50.7
David Starr Jordan High*
14 24 22 60 1 28.3
Narbonne High* 18 20 17 55 3 26.8
Torrance High* 8 18 13 39 8 46.8
Warren High* 8 16 11 35 7 40.9
San Pedro High* 12 9 13 34 3 25.6
*High Schools fall outside District boundaries. Source: Local Data & CDE downloadable data
Because not all students could be matched to a school, students were matched by location to
determine the school district associated with their addresses. This method allowed us to match
over 95% of the students with a school district (Table 4). While most students attend their local
school, these numbers are estimates only since actual attendance cannot be confirmed. Compton
Unified School District is where almost 30% of the new students reside. Twenty-seven percent
live in areas associated with the Los Angeles Unified School District. Long Beach, Lynwood,
and Paramount Unified School Districts are also home to many students. Table 4 shows
Compton Center first time enrollments by school district residence along with district API. API
scores below 800 can be considered low performing, which is the majority of the school districts
where students live. Three school districts score below 700.

Institutional Research and Planning/JR21 6 October 2013
TABLE 4: NEW ENROLLMENTS BY HIGH SCHOOL DISTRICT RESIDENCE High School District API Students
Compton Unified 697 1553 Los Angeles Unified 656 1422 Long Beach Unified 784 804 Lynwood Unified 711 316 Paramount Unified 765 202
Centinella Valley 698 118 Bellflower Unified 795 103 Torrance Beach Unified 869 102 Downey Unified 804 88 Inglewood Unified 719 79
Source: Local Data & US Census Data & CDE Data
Student Socioeconomics Because we have limited data for individual student socioeconomic status unless the student
applies for financial aid, location-based data from the US Census is tied to a student based on the
home address provided by the student (Figure 4). Only students living in Los Angeles County
are included.
Eighty-two percent of new Compton Center students come from areas in Los Angeles County
where less than 25% of the population over 25 years has earned a BA or higher degree. This
indicates new students may be lacking the social capital necessary to achieve in college.
Associated with this is the relatively low economic status of many of the students.
Approximately 67% of the new students live in areas where the median household income is less
than $50,000. The lowest income bar represents those people who are below the Federal poverty
line for a family of four (2%).
FIGURE 4: AVERAGE HOUSEHOLD INCOME OF AREAS WHERE STUDENTS RESIDE
Source: American Community Survey 5-year Estimates, 2011
0% 10% 20% 30% 40% 50% 60% 70% 80% 90% 100%
<25K
25K-34,999
35K-49,999
50K-74,999
75K-99,999
100K+

Institutional Research and Planning/JR21 7 October 2013
Future Projections The district as a whole is projected to increase in population by about 1% through 2020. The
population increase is expected to be the result of an aging of the population and will be uniform
throughout the District. Each of the cities is expected to experience an eight to nine percent
increase in the population 20 years and older (Figure 5). At the same time, each district city is
expected to see a decline of 12% in the population under 20 years old.
FIGURE 5: ESTIMATED DISTRICT CITY POPULATION CHANGE BY AGE GROUP, 2010-2020
Source: EMSI Projection Estimates
The expected change would affect all ethnic groups (Figure 6), but the local African-American
population will see the greatest relative decline, especially in the younger age groups. Asians
and Latinos are expected to see a decline in the younger age groups, but unlike the other major
race groups, their adult populations are expected to see an increase. The change in White and
Asian population is minor since together, these groups make up less than 3% of the District
population. The relatively minor decline in Latino population under 20 and the growth in the
population over 20, coupled with the declining African-American population means Latinos are
expected to become an even larger part of the District. Currently, Latinos comprise 73% of the
total District population.
-12% -12% -12%
8% 9% 8%
-15%
-10%
-5%
0%
5%
10%
Compton Lynwood Paramount
Under 20
20+

Institutional Research and Planning/JR21 8 October 2013
FIGURE 6: ESTIMATED DISTRICT POPULATION CHANGE BY ETHNICITY, 2010-2020
Source: EMSI Projection Estimates
Based on 9th
grade enrollments in local schools and the rates at which feeder schools have been
providing students to the Compton Center, we will expect to see declining enrollments coming
from our local feeders for the next few years unless mitigating steps are taken (Table 5). This
will continue in the coming years with the projected decline in local populations under the age of
20. These projections are based on available information which includes self-reported high
school. As mentioned earlier, only 44% of new students have an identifiable high school.
Therefore, these numbers may increase with improved record keeping. Also, these projections
are based on the assumption that schools continue funneling students to the Compton Center at
consistent rates regardless of external factors.
TABLE 5: ESTIMATED NEW ENROLLMENTS BY HIGH SCHOOL, 2013-2015
New Students per Year
High School Fall 2013 Fall 2014 Fall 2015
Carson 14 13 13
Centennial 47 45 31
Compton 119 101 94
Dominguez 111 91 64
Gardena 99 71 57
Jordan 60 59 55
King/Drew 45 47 50
Lynwood 129 112 54
Paramount 70 79 72
Total 696 620 490 Source: Local Data & CDE Data
-23%
-40%
-14% -10% -10%
-5%
7% 12%
-50%
-40%
-30%
-20%
-10%
0%
10%
20%
Under 20
20+

Institutional Research and Planning/JR21 9 October 2013
APPENDIX A