Embed Size (px)
Citation preview
Compressive Strength and Modulus of Elasticity of Masonry Prisms
by
Felix Ip, B. Eng., P. Eng.
A thesis submitted to
the Faculty of Graduate Studies and Research in partial fulfillment of
the requirement for the degree of Master of Engineering
Department of Civil and Environmental Engineering
Carleton University Ottawa, Ontario August 18,1999
@ copyright 1999, Felix Ip

National Library 1+m ofCanada Bibliothéque nationale du Canada
Acquisitions and Acquisitions et 8ibliographic Services services bibliographiques
395 Weilingtori Street 395. rue Wellington OnawaON K1A ON4 OliawaON K 1 A W CaMda Canada
The author has granted a non- exclusive licence allowing the National Library of Canada to reproduce, loan, dismbute or se1 copies of this thesis in microfom, paper or electronic formats.
The author retains ownership of the copyight in this thesis. Neither the thesis nor substantial extracts fiom it may be printed or otherwise reproduced without the author's permission.
L'auteur a accordé une licence non exclusive permettant à la Bibliothèque nationale du Canada de reproduire, prêter, distribuer ou vendre des copies de cette thèse sous la fome de microfiche/nlm, de reproduction sur papier ou sur f omt électronique.
L'auteur conserve la propriété du droit d'auteur qui protège cette thèse. Ni la thèse ni des extraits substantiels de celle-ci ne doivent être imprimés ou autrement reproduits sans son autorisation.

Abstract
Two important elements in structural engineering are the strength and the
stiffness of the structure. In masonry, the primary components are, first of all, strong
and stiff masonry units, and secondly, the relative weak and "soft" mortar.
Masonry units typicaHy have compressive strengths ranging €rom 30 MPa to
over 100 MPa in North America, and the standard compressive strength of the mortar
is in the range of 10 to 25 MPa. Their respective moduli of elasticity when tested
independently are significantly different as well, although it is generally accepted that
the units are much stiffer than the mortars.
When these two components are put together to form structural eiements, the
overall strength and modulus are two pieces of important data that are needed by
engineers to design for the strength and deformation of the structure properly.
The research program for this thesis is composed of computer simulation
studies and laboratory testing. The computer simulation was designed to study the
behaviour of the masonry model with respect to the strength and modulus of elasticity
using data obtained from the Phase 1 testing program. Parametric analysis of the
mode1 behaviour was also conducted to examine the effects of different input
parameters for the simulation model.

The second part of the research program consisted of laboratory testing of
combinations of different strengths masonry units and mortar mixes. The testing
program was designed to study high and low strength masonry units in combination
with two strength extremes of mortar mixes. 'ïhis thesis studied the envelope of this
range of high strength unithigh strength mortar, high strength unitllow strength
rnortar? low strength unithigh strength mortar and low strength unit/low strength
mortar combinations.
The test results were compared with other recent published test results and
Canadian Standards.
The findings of this testing program clearly demonstrate the need for a better
understanding of the mortadmasonry unit interface, and a better measuring technique
for the deformation of mortar joints within a masonry prism assemblage. The
properties of the mortar are changed due to the moisture absorption by the unit, and
this change alone is significant enougn to alter al1 the properties of the mortar when
compared with the non-absorptive specimens prepared for standard mortar testing.
Measuring rnethods using strain gauges across the mortar joints are unreliable due to
the physical size of the strain gauges in comparison to the joint itself.

Acknowledgements
The author wishes to express his deepest gratitude and appreciation to his
supervisor Professor G. T. Suter for his guidance and teaching throughout the entire
research and reporting program- The author also wishes to extend his gratitude to
Professor S. Kennedy for his guidance and cooperation in reviewing and helping to
select an appropriate finite element program for the research.
The author also wishes to express his sincere appreciation towards Mr. K.
McMartin and his staff for their assistance in the laboratory testing phase of the
program.
The author further expresses his appreciation to the Department of Civil and
Environmental Engineering of Carleton University for the crucial firiancial support
for the duration of this Master's Program, and to the National Research Council for
the generous support at the early stage of the laboratory testing program.
The author especially wishes to express his heartfelt appreciation to his loving
wife, and his children for their unconditional love, encouragement, and support
throughout the years.

Table of Content
1 INTRODUCTION ..................................................................... 1
............................................................................................ 1.1 The Basic Challenge 1
........................................................................................ . l 2 Research Test Program 4
1.3 Preliminary Test Program .................................................................................... 4
1.4 Computer Simulation Program .................................................................... 6
............................................................................................... 1.5 FinalTestPro,gam 7
......................................... 2 RECENT RESEARCH RESULTS 9
3 PRELIMINARY TEST PROGRAM .................................... 15
3.1 General ............................................................................................................... 15
3 -2 Materials ......................................... .................................................................. 16
3.3 Mortar Mixes ........................... ... ..................................................................... 18
3.4 Compressive Test Specimens .......................................................................... 2 0
................................................ 4 COMPUTER SIMULATION 2 1
4.1 General ............................................................................................................... 21
4.2 Basic Simulation Approaches ............................................................................ 21
............................................................................................. 4.3 Material Properties 26
4 .4 Computer Simulation Modeling Procedure ....................................................... 4 4
5 FINITE ELEMENT ANALYSIS THEORY ..................... ... 52
...... 6 COMPUTER SIMULATION RESULTS .......... ........ 56
6.1 Genenl Observation .......................................................................................... 56
6.2 Parametric Analysis ...................... .... ....................................................... 63
. ................................. 7 FINAL TEST PROGRAM PHASE 1 73
7.1 Prism Construction and Testing ............................ .. ...................................... 75
7.2 Test Procedures of Mortars ................................................................................ 77
7.3 Test Procedures for Ohio Stone ..................... ... ............................................ 80
8 PHASE 1 TEST RESULTS ................................................... 81
8.1 Properties of Mortars ......................................................................................... 81
8.2 Properties of Ohio Stone ................................................................................ 86
....................................................... .................................. 8.3 Prisrn Test Result .... 87
9 FINAL TEST PROGRAM . PHASE II ............................... 95
9.1 Mortar Mixes and Masonry Units ................................................................ 95
9.2 Propenies of Mortar Mixes ................................................................................ 96
9.3 Construction of Prisms ....................................................................................... 96
9.4 Test Procedure .................................... ............................................................. 98
10 PHASE KI TEST ESULTS ................................................. 108
1 O . 1 Properties of Masonry Units ...................... .... .......................................... 108
10.2 Properties of Strong Mortar ........................ .................................... ...... 1 1 1
10.3 Propenies of Weak Mortar ............................................................................... I I I
10.4 Compressive Test Results of Prisms ................................................................ 114
11 DISCUSSION OF RESULTS .e............................................ 124
1 I . 1 Phase 1 Testing ................................................................................................. 124
1 1.2 Computer Simulation Results ......................................................................... 126
1 1.3 Phase II Testing ............................................................................................... 128
12 CONCLUSIONS ................................................................... 137

APPENDIX A .................................................................................... 142
. ........................................................... Materials used in final test program Phase I 142
.......................................................... Materials used in final test p r o g m - Phase II 143
APPENDIX B .................................................................................... 144
................................................................................... Proposed Estimating Formula 144
Cornparison of moduli of elasticity between Brook's proposed estimation
............................................................. formula and Phase i1 fina1 test results 145
................................................................................. REFERENCES 146

List of tables
Description Page No.
Table 1 Average compressive strength of prisms ...................................... 1 16
Table 2 Average modulus of elasticity of prisms ..................................... 1 16
Table 3 Range of moduli of elasticity of prisms ...................... .. ....-... -... 116
Table 4 Compressive strength comparison of CSA estimations
and Phase II test results ................................................. . ............ 13 1
Table 5 Moduli of elasticity comparison of CSA estimations
and Phase II test results ............................................................... 135
Table Al Mortar mix proportions for Phase I test program ..... . . .. . . . . . . . . . . . . . . . . . 142
Table B 1 Mortar mix proportions for Phase II test program .................... .... 143
List of figures
Fig . 1
Fig . 2
Fig . 3
Fig . 4
Fig . 5
Fig . 6
Fig . 7
Fig . 8
Fig . 9
Fig . 10
Fig . 11
Fig . 12
Fig . 13
Fig . 14
Fig . 15
Schematic diagram of stress-strain curves of masonry unit. mortar and
........................................................................................... pnsm assemblage 2
Typical arrangement of test prism ............................................................... 24
Basic cornputer mode1 for simulation ................................................... 25
Typical arrangement for modulus of rupture test of masonry unit
........................................................................... on simply supported beam 29
Schematic diagram for split-tensile test of a Stone unit ............................... 33
.......................................................... Cornputer mode1 for split-tensile test 34
........................................................ Contour of X-direction stress intensity 35
................................................... Principal stress directions and magnitude 36
.............. Principal stress plot to identify the directions of the stresses only 37
Effective stress of masonry unit and mortar under vertical
................................................................................... compression of pnsm 39
3-D mode1 used in computer simulation ...................................................... 45
................................ Computer mode1 showing the sizes of finite elements 46
.......................... Stress-strain relationship of elements representing mortar 47
................ Stress-strain relationship of elements representing masonry unit 48
Diagram showing the loading pattern and planes of symmetry ................... 49

Fig . 16 Typical displacement vector of edges of the elements
under compression .......... ... .......................................................................... 5 1
.......................... Fig . 17 Schematic diagram of Newton-Raphson iteration process 53
.......................................... . Fig 1 8 Iteration process for Newton-Raphson solution 55
......... Fig . 19 Computer simulation showing the direction of displacernent vectors 58
Fig . 20 Enlarged portion showing the deformation at monar joint interface ........... 59
Fig . 2 1 Principal stresses of elements showing the tensile stress of the masonry
unit near the joint interface ......................................................................... 60
F i g 22 Principal stresses of elements showing the magnitude of stresses with
proportional length of arrows ................................................................. 6 1
....... . Fig 23 X-axis stress contour with Poisson's ratio of masonry unit being 0.20 65
Fig . 24 X-axis stress contour with Poisson's ratio of masonry unit being 0.10 ....... 66
.................. Fig . 25 X-ais stress contour with Poisson's ratio of mortar being 0.10 68
.................. . Fig 26 X-axis stress contour with Poisson's ratio of mortar being 0.20 69
Fig . 27 X-mis stress contour with modulus of elasticity of masonry unit
set at 54 500 MPa ........................................................................................ 71
Fig . 28 X-axis stress contour with modulus of elasticity of masonry unit
set at 100 000 MPa ....................................................................................... 72
.............................................. . Fig 29 Typical prism layout in Phase 1 test program 74
.................................... . Fig 30 Typical strain gauge locations on mortar specimen 78
Fig . 3 1 Stress-strain relationship of 11218 mortar for 50 mm cube specimen .......... 82

vii
Fig . 32
Fig . 33
Fig . 34
Fig . 35
Fig . 36
Fig . 37
Fig . 38
Fig . 39
Fig . 40
Fig . 41
Fig . 42
Fig . 43
Fig . 44
Fig . 45
Fig . 46
....... Stress-strain relationship of 11218 mortar for 100 mm cube specimen .83
Stress-strain relationship of 1/0.25/3 rnortar for 50 mm cube specimen ..... 84
Stress-strain relationship of 110.2513 mortar for 100 mm cube specimen .. .82
Stress-strain curves of Ohio stone on top and bottom fibre of the simply
............................................................................ supported beam specimen 86
Stress-strain relationships of Ohio Stone prîsm ~ 4 t h 1 /2/8 mortar .............. 88
Stress-strain relationships of Ohio stone pnsm with 110.23/3 mortar ......... 89
Average stress-strain relatiorships of Ohio stone and 112/8 rnortar in
......................... ................................. vertical and horizontal directions ... 92
Average stress-strain relationships of Ohio stone and 1/0.25/3 mortar in
vertical and horizontal directions ................................................... 93
Typical prism arrangement in Phase II test program .......................... .... 100
Schematic arrangement of LVDTs on the test prism for
..................................................................................... strain measurement 1 04
..................................... S tress-strain relationship of restoration brick ... 1 0 9
Stress-strain relationship of flagstone unit ....................................... .. ..... 1 I O
.................................. Stress-strain relationship of strong (1 /0.5/4) mortar 1 12
Stress-strain relationship of weak (113110) mortar ..................................... 1 12
Stress-strain curves for flagstone prisms with strong mortar ..................... 1 17
Fig . 47 Stress-strain curves for flagstone prisrns with weak mortar ...................... 1 17

viii
Fig. 48 Stress-strain curves of brick prisms with strong mortar ............................ 1 18.
Fig. 49 Stress-strain curves of brick prisms with weak rnortar ....................-......... 1 18

List of Photographs
Phcto 1
Photo 2
Photo 3
Photo 4
Photo 5
Photo 6
Photo 7
Photo 8
Photo 9
Photo 10
Photo 1 1
Photo 12
Photo 13
Photo 14
Typical mounting of strain gauge using epoxy glue on the unit .............. 27
Arrangement of strain gauges on trial prism ........................................... 28
.............................. Beam specimen for simply supported bearn testing 30
............... Location of strain gauge on simply supported beam specirnen 31
Typical failure plane on the specimen as expected in split-tensile test ... 32
Split specimen afier failure .................................................................... 33
50 mm cube rnortar specimen being prepared in a non-absorptive
plastic mould ........................................................................................... 41
Strain gauge mounted on cube specimen to determine the stress-strain
................................................... relationship during compressive testing 42
LVDT mounting instrumentation to determine the modulus of
elasticity of mortar on a cylindrical specimen ......................................... 43
Different sizes of rnortar spccimens with strain gauges ......................... 78
Prism assemblages with ail strain gauges comected to
data-recording computer ......................................................................... -79
Photograph showing the mortar mix was dry-rnixed thoroughly before
water was added ....................................................................................... 99
.......................... Typical construction progress of prism with flagstone 101
Typical construction progress of prism with restoration bricks ............. 102
Photo 15 Close-up view of mortar joints showing the moisture
.................................................................................. absorption process 103
Photo 16 Typical arrangement of LVDTs mounted on the special frames ........... 105
Photo 17 Fixed length timber spacers are used to ensure constant
........................................................................................ LVDT spacing 106
............................................... Photo 18 Prism arrangement in loading machine 1 0 7
......... Photo 19 LVDT mounted on 75 mm diameter x 150 mm mortar specimen 113
Photo 20 Typical brick prism failure mode ..................................................... 1 2 0
Photo 2 1 Typical brick prism exploding at failure ........................................... 121
Photo 22 Typical flagstone prism failure mode ................................................... 122
Photo 23 Typical Stone prism explosion at failure ................................................ 123

List of symbols
Vector of applied loads.
Coefficient matrix.
Tangent manix.
Vector of restoring loads corresponding to the element intemal.
Vector of unknown DOF (degree of freedom) values.
Subscript representing the current equilibrium iteration.
Modulus of elasticity of prism.
Compressive strength of brick.
Compressive strength of mortar.
Compressive strength of prism.
Ratio of rnoduli of elasticity between brick and mortar.
Water absorption percentage (%).
MegaPascal (N/mm2).
GigaPascal(1 O' ~ / m r n ~ ) .

1 Introduction
Two important pieces of data in any structural element are the strength and the
modulus of elasticity of the material. In Engineered Masonry, these two cornponents
are the compressive strength, f ',, and modulus of elasticity, E,, of the element. The
compressive strength is important because it determines the bearing capacity of the
element; the modulus of elasticity is important because it provides the estimate of
de formation of the element under loading.
Full size testing can be done to obtain these data, however, full size testing
programs are typically too expensive to be conducted, and in some cases, impractical
because of other limitations. Pnsms testing in the p s t has been proven to be cost-
effective and to provide some measure of correlation with full size testing. The
Canadian Standards ~ssociat ion ' also recognises this test method to reflect the
compressive strength and the modulus of eiasticity of the structural element.
1.1 The Basic Challenge
Typical compressive strengths of masonry units produced in Canada are
relatively high. They are usually of the order of 60 MPa and up, but the strength of
the mortar, on the other hand, is very low. Typical compressive strengths of Type "S"
or Type "N" mortars are about 12.5 MPa and 9.5 MPa respectively according to
Canadian standards. The modulus of elasticity of masonry units is also relatively high

when compared with the rnodulus of elasticity of typical mortar that is used in the
structure. When a typical masonry element is built, the masons combine the masonry
units with mortar to form that structural element. When these two different materials
with vastly different properties are combined to form the structural element, the
properties of the combined element are not readily identifiable.
Fig. 1 shows a schematic diagrarn of the relationships of the stress-strain
curves of masonry unit, mortar and the pt-isrn assemblage made of these hvo
components as expected from past experience. A prism assemblage is a tenn used to
describe the small element constructed with several masonry units and mortar in stack
Fig. 1 Schematic diagram prism assemblage.
of stress-strain curves of masonry unit, mortar and
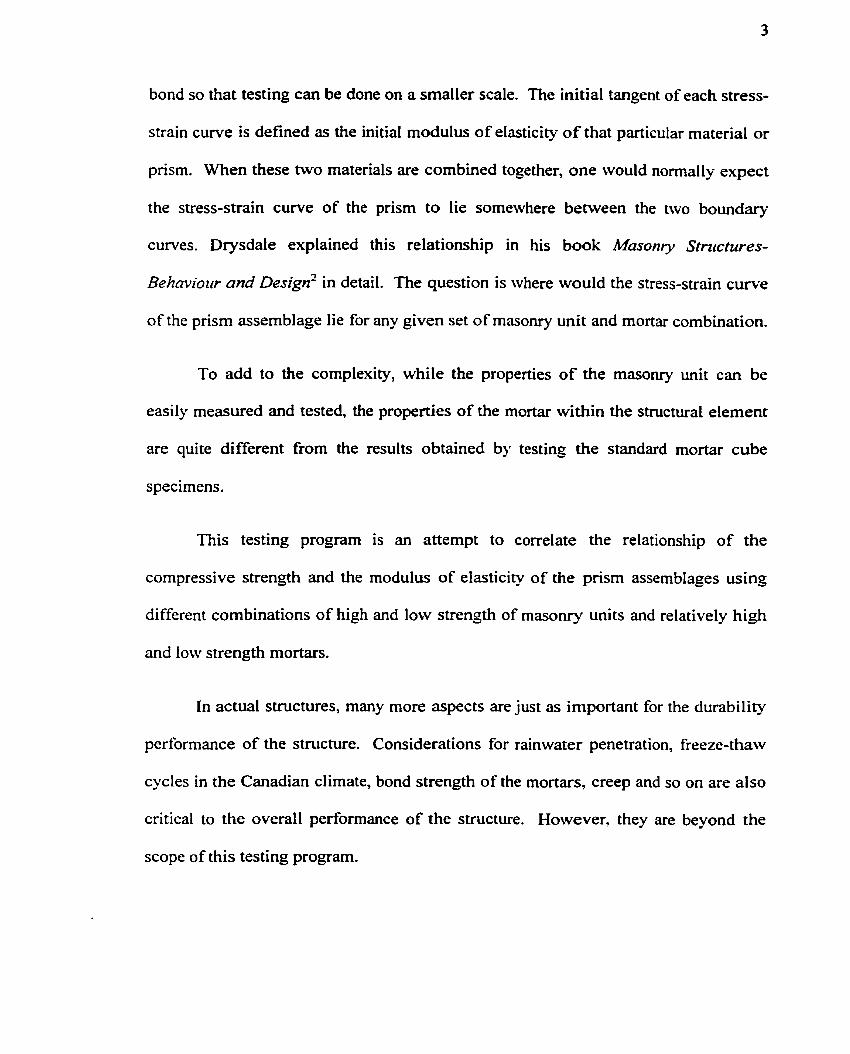
bond so that testing c m be done on a smaller scale. The initial tangent of each stress-
strain curve is defined as the initial modulus OP elasticity of that particular material or
prism. When these two materials are combined together, one wvould nomally expect
the stress-strain curve of the pnsm to lie somewhere between the two b o u n d q
curves. Drysdale explained t his relationshi p in his book Masonry Structures-
Behuviotcr and ~ e s i g d in detail. The question is where would the stress-strain curve
of the prism assemblage lie for any given set of masonry unit and mortar combination.
To add to the cornplexity, while the properties of the masonry unit c m be
easily measured and tested, the properties of the mortar within the structural element
are quite different from the results obtained by testing the standard mortar cube
specimens.
This testing prograrn is an attempt to correlate the relationship of the
compressive strength and the modulus of elasticity of the prism assemblages using
different combinations of high and low strength of masonry units and relatively high
and Iow strength mortars.
In actual structures, many more aspects are just as important for the durability
performance of the structure. Considerations for rainwater penetration, freeze-thaw
cycles in the Canadian climate, bond strength of the mortars, creep and so on are also
critical to the overall performance of the structure. However. they are beyond the
scope of this testing prograrn.

1.2 Research Test Program
Due to a limited amount of research results available, (Chapter 2 of this thesis
outlines some of the recent published results by other researchers), there are many
variables that need to be pre-deterrnined before actual testing could take place.
Therefore the research program was split into the foflowing tluee different stages:
1. Preliminary test program to determine the testing criteria;
2. Computer simulation of the prisrns using a finite element analysis program;
3. Final laboratory testing to determine the strength and the modulus of elasticity
of masonry prisms.
1.3 Preliminary Test Program
Unlike ready-mixed concrete which is plant mixed and therefore usually quite
reliable and consistent in terms of its slump, air content, compressive strength, and
other properties throughout a project, mortar for masonry work is usually site rnixed,
and in many smali projects even hand-mixed in a wheelbarrow; its properties are
therefore highly variable.
The waterkement ratio, or more often in the masonry industry the
watedbinder ratio when both Portland cernent and hydrated lime are used as the
binding materiais, is only one of the variables that would affect the strength and
modulus of elasticity of the mortar. The watedbinder ratio is defined as the ratio
between the weight of water to the total weight of cernent and lime. The labourer

hand-mixes the mortar and adds variable amounts of water to the mortar mix based on
his experience and the amount of moisture present in the sand. The mason adds
additional water to the mortar as required by the construction conditions and
reternpers it as necessq ; this creates another variable- The contractor uses different
brands of cernent or lime on the same job, or different batches of bulk sand with
different moisture content; al1 this contributes to the variability of the mortar strength
and its modulus of elasticity. Even storing the bulk sand on site without proper
protection against the weather elements would seriously affect the moisture content of
the sand, and therefore, ultimately affect the waterhinder ratio.
In general, however, it can be concluded that the compressive strength of
mortar increases with an increase in cernent content and decreases with an increase of
sand, water or air content. Retempering is usually associated with a decrease in
mortar compressive strength. The amount of the reduction in strength depends on the
amount of water added and the time between mixing and retempering. It is this
variability of mortar that may affect the overall performance of the masonry wall or
structural elements. Although this is widely accepted as the norm, there are very few
quantitative research reports available for reference.
Therefore, a first preliminary test program was carried out to prepare different
mortar mixes and test their strengths to determine which mixes would be better suited
for the final test prograrn.

With CO-operation from the National Research Council of Canada (NRC), the
early stage of testing which consisted of mixing different batches, storage of
specimens? and the subsequent compression testing of those mortar specimens, were
al1 carried out at the Montreal Road campus of the National Research Council in
Ottawa, Ontario.
1.4 Computer Simulation Program
A computer finite element analysis program was used to simulate different
scenarios or properties of the materials, and examine the changes in strength and
modulus of the prism. With the advance of computer technologies, it is both viable
and cost-effective to simulate different scenarios to check against laboratory testing.
Unfortunately, there are so many commercial "finite element analysis"
prograrns available with vastly different capacities and bct ions , that the task of
selecting a suitable program was not easy. Some programs can only handle elastic
analysis; some programs can only handle two-dimensional simulations; some limit the
material properties to metals; others have a tedious user interface; and others are just
not capable of computing large triangular matrices-
Afier evaluating different programs in the computer laboratory of the
Department of Civil and Environmental Engineering of Carleton University and
discussions with faculty members, the final decision was to use the program designed
by ANSY S. This computer program can handle three-dimensional problems, non-

Iinear analysis, and most importantly, has a "concrete" element type that can simulate
cracking and cnishing of the element.
The simulation, first of all, consisted of the simple circular area and square
area to confirm the stress flow and displacement pattern of split-tensile testing of a
circular mortar cylinder and a cubic specimen of masonry unit. This was done to
confirm that the simulation inputs are representative for preparation of the final
simulation process.
The final process \vas to simulate the behaviour of the masonry prism
assemblages with different masonry unit and mortar properties.
1.5 Final Test Program
The final test program was to test suitable prism assemblages with different
combinations of masonry units and mortars. The task included the selection of
suitable low and high strength masonry uni& to match with the appropriate sofi and
strong mortars. These different combinations would give good upper and lower
boundaries of the possible spectrum of strengths and moduli of elasticity of the prism
assemblages.
The final testing program itself was further divided into two stages. Stage 1
included testing different prisms using very high and low strength mortars with the
same masonry units, and mounting sufficient strain gauges for strain measurement
during compressive testing. The properties of the masonry units and mortars were

also separately tested. The data recorded were used to determine which mortar and
masoruy units were to be used in the second stage of the final test program.
Stage II of the final test program included building and testing five prisms for
each combination of different masonry units and mortars. These combinations were
high strength mortar with high strength unit, high strength mortar with low strength
unit, low strength mortar with high strength unit, and finally low strength mortar with
low strength unit. Different masonry units were considered to arrive at the final
seiection of hvo units. Over 20 different mortar mixes were tested to finally choose
two mixes for the final program.

With shrinking financial resources and ever-advancing computing power.
cornputer simulation is becoming more and more usehl to researchen. J.G. ~ots - '
and many others started to use "finite element analysis" prograrns to simulate the
interaction of mortar/masonry unit interface of prisms. The approach by Rots was to
compare the effect on masonry prisms using the modulus of elasticity of mortar and a
very low modulus neoprene material in-between the masonry units. The author
proposed an estimating formula for the relationship between the vertical stress of the
prism to the horizontal stress in the masonry unit. Unfortunately the author appeared
to have used the basic compressive strength of the mortar as obtained from traditional
non-absorptive mould specimens without taking into account the change in properties
of mortar after moisture was absorbed by the masonry units in the prisms. Although
the author concluded "that the edge effecrs md non-hornogeneozts deformation are
important factors that cannot be ignored in rnasonry materials cliaracterization, " the
author did not quantify such edge effect and switched to reporting other aspects of the
masonry structures.
S. Stocki, H. Bierwirth and H. ~upfer ' fint reported in 1994 at the Tenth
International Brick and h4asonry Association Conference (IBMAC) that the testing

of the same mortar using different testing methods could yield drastically different
results. They utilised a unique steel loading bnish to virtually eliminate the frictional
effect of regular ngid loading platens. They reported that the compressive strength of
mortars obtained from the traditional testing method must be used carefully as the
non-absorptive specimens and the aspect ratio of the specimens always
underestimated the actual compressive strength of the rnortar joints. In certain
conditions the strength of the mortar joints could be as much as four times the
strength obtained from typical traditional cube specirnens tested according to the
German testing standards. This result was obtained by testing rnortar joint specimens
cut out from prism assemblages utilizing the steel wire loading platens to eliminate
the frictional effect of the traditional loading platens. They were one of the very few
who actually reported quantitatively the increase in mortar joint strength compared
with the traditional cube specimen strengths.
S. Stockl, K. Beckhaus and TH. FritscheS were again arnong the first to report
the characteristics of actual bed joints in test prisms. They concluded that the
modulus of elasticity of the same mortar could Vary as much as ten times depending
on the test method used. The type of test specimen, the production method of the test
specimen, the size of test specimen, and the measurement system were just several
factors affecting the measured results of the rnodulus of elasticity of the same mortar.
The y furt her concl uded that ' 'anyune onolyzing masonry behuviour for example by
means offnite elemenfs " should take the differences into account to avoid "getting
zm-ealistic cnlczrlation resrdts using wrong material laws. n >

Australian researchers A. W. Page, and D. S. Brooks6 expressed a similar
common philosophy of underestirnating the strength of masonry structures when
prism testing results were compared against the Australian code. They revealed that
when using the Australian code method to estimate the masonry structure's strength
based on the correlation between the compressive strength of masonry unit and mortar
type would typically result in a much lower strength than actual field tested results.
Since the code method of estimation does not reflect the workmanship, site conditions
and other factors, it generally tends to be much more conservative. These researchers
recommended the use of prism testing to accurately reflect the actual workmanship
and the actual materials used at a particular project site. They did not propose,
however, any estimating formula that could be used to estimate the strength or
modulus of elasticity in the event that prism testing is not feasible for that particular
project.
G. T. Suter and E. M. F. ~ a g u i b ' suggested Poisson's ratio of brick masonry is
between 0.16 to 0.20 between bedding planes. They used computer 3-D modelling
together with reviewing other previous research results in reaching their conclusion.
They concluded the modulus of elasticity parallel to its bed planes was srnaller than
that perpendicular to its bed planes. This anisotropic nature of masonry structures
makes any estimating process much more complex than a simple empirical formula
could cover.

A. W. Hendry8 also confirmed the seemingly straightfonvard compression test
on a masonry unit was not simple at all. Depending on the rate of loading, capping
material used, and aspect ratio of the testing specimen, the test results wouId Vary. He
suggested a loading rate between 7 MPaImin to 40 MPa/min would be appropriate for
consistent "a statistically sign~@cant but not Imge variation in apparent strength. "
The capping material and its thickness also atiected the strength of the masonry units.
Grinding the testing specimen flat was discussed as an option, however not
recommended due to the inherent nature of the workmanship difficulties and machine
limitations.
Hendry also noted the tensile strength of a rnasonry unit was best based on a
split-tensile test because of its uniform tensile stress distribution throughout the entire
depth of specimen. He went on to suggest other researchers use the split-tensile test
result to calculate the compressive strength of the same unit.
He further pointed out that the worhanship factor was the most important
factor among any others in masonry structures. Incomplete filling of joints would
inevitably give rise to inaccurate results. To ensure proper workmanship,
professional masons were employed to construct the prisrn assemblages at different
phases of the final test prograrn of this thesis. A purpose-made timber jig was
empfoyed in the final test program to ensure a uniform joint thickness of prisms was
achieved.

The testing method could also significantly affect the test results. R. G.
Drysdale & H. E. won$ suggested that the test prisms should be at least four units
high to avoid the frictional influence of loading platen restraint. The final test prisms
of this thesis were al1 eight units high to allow for the Linear Variable Displacement
Transducers (LVDT) to be mounted on specially made mounting frames.
L. Binda et. al." concluded that "the use of strain gauges for displacement
detecrion in the case of s m d specimens and sofi materids with high porosiîy muy
give unreliable results due to the intience of the glue st%fess. " This is particularly
true for mortar joints regardless of the strength of the mortar. She also concurred with
Stock1 that loading platens consisting of steel bnishes would be the most successful
device to avoid platen confinement in compressive testing.
J.J. Brooks and B. H. Abu ~ a k e r " recently published their findings afier
reviewing 184 sets of modulus/strength data. They proposed an empirical formula
relating the modulus of brick pnsms to the strength of their components, Le. the
mortar and unit. In their proposed formula, they included the water absorption of the
unit as one of the variables, together with the strengths of the mortar and unit. With
that many factors that could influence the modulus of the prisms, they claimed that
with their proposed formula they could predict the modulus with better accuracy.
They reported an error coefficient of about 26% when compared with the British
Standards and the corresponding Euro-Code. This was, according to the authors, a
drastic improvement from any other currently used estimation methods. Appendix B

highlights the fomulae proposed in their report, and presents the corresponding
estimation of the modulus of elasticity for the materials used in Phase II of the final
testing program.

3 Preliminary Test Program
3.1 General
In order to understand the behaviour of mortar, different batches of mortar
were prepared and tested in this prelirninary testing phase of the program. This
preliminary test program was critical in selecting suitable mixes for the final test
program; mortars with different proportions of ingredients were made and tested at
seven days after the specimens were prepared.
The mortars were prepared with assistance from the National Research
Council (NRC); the mixes were prepared in the mechanical mixer at NRC using white
Type 10 Portland cernent, Type 'S' hydrated lime, and aggregate sand from a local
quarry. While proprietary masonry cements are popular among masons in the
construction industry because of their good workability, they contain different filler
materials that are not listed in the manufacturer's published material data. It is
because of their proprietary secrecy that the true composition of masonry cements
cannot be identified, and hence this type of cernent was judged unsuitable for the
research purposes in this thesis.

3.2 Materials
In order to control the variables for the entire testing program, the materials
used were carefully selected and maintained. Throughout the testing program. Type
10 white Portland cernent from the same manufacturer was used.
Since mortar is usually exposed to weather, in Canada freezing of moisture
within the mortar is inevitable during winter months. For the durability of the mortar
it is important to have a minimum of 8 to 10% air content within the hardened mortar
to allow the moisture to have the space to freeze within the mortar without
prematurely failing the mortar. Initially, air-entrainment agent originally developed
for reinforced concrete was added to the trial mixes in an attempt to produce the
desired air content.
Different mixes using different proportions of Portland cement, hydrated lime
and sand aggregate with air-entrainment agent were tested for air content, among
other plastic properties. The measurement of the air content of the rnortar was done
using the portable laboratory air content measuring instrument available at NRC. The
instrument is based on the theory that air volume expands with a reduction of pressure;
the measurement of volume expansion was indirectly measured by the linear
potentiometer at different pressure settings. Unfortunately, the measurements were
not reliable, as different readings were recorded for mortars with exactly the same
proportion of ingredients. The inconsistency of air content in the mortar was first
attributed to the fact that the air-entrainment agent was originally developed for
reinforced concrete rnistures, and the dosage needed for a mortar batch was very
small and therefore very difficult to administer accurately. The second factor that led
to the inconsistent measurement was that the equipment was later found to be
malfunctioning by NRC laboratory staff.
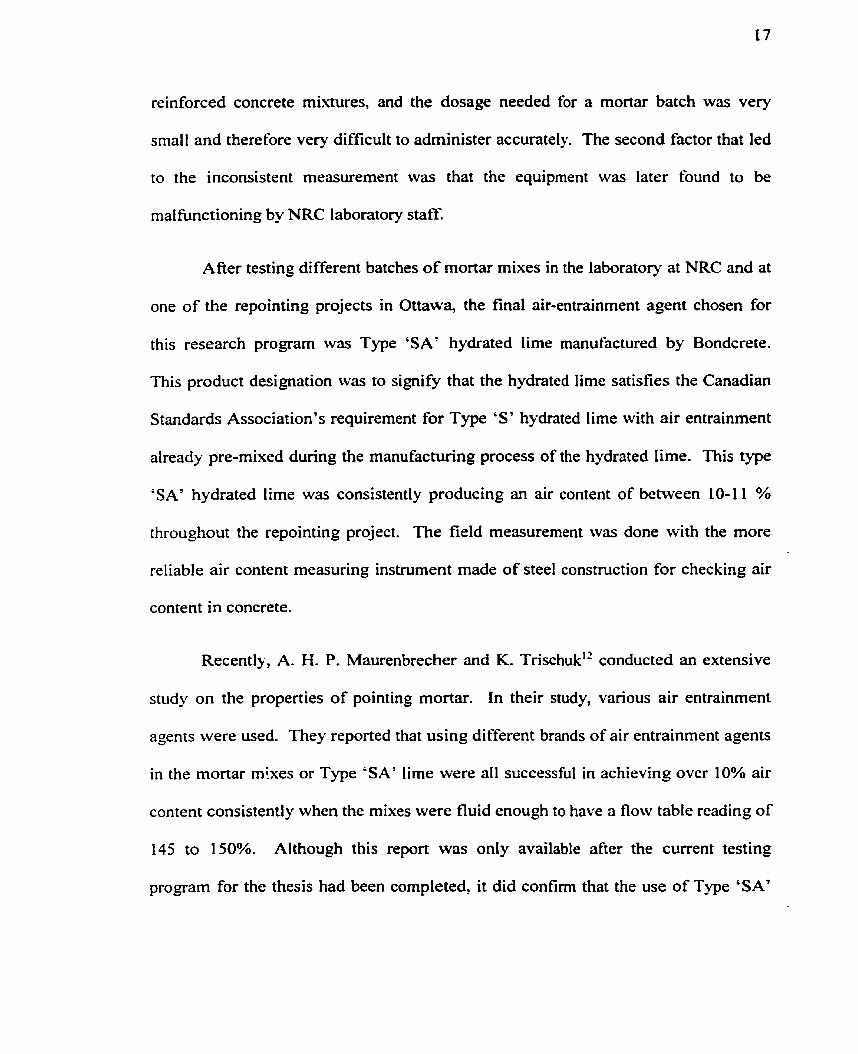
After testing different batches of mortar mixes in the laboratory at NRC and at
one of the repointing projects in Ottawa, the final air-entrainment agent chosen for
this research program was Type 'SA' hydrated lime manufactured by Bondcrete.
This product designation was to signify that the hydrated lime satisfies the Canadian
Standards Association's requirement for Type 'S' hydrated lime with air entrainment
aiready pre-mixed during the manufacturing process of the hydrated lime. This type
'SA' hydrated lime was consistently producing an air content of between 10-1 1 %
throughout the repointing project. The field rneasurement was done with the more
reliable air content measuring instrument made of steel construction for checking air
content in concrete.
Recently, A. H. P. Maurenbrecher and K. Trischuk" conducted an extensive
study on the properties of pointing mortar. In their study, various air entrainment
agents were used. They reported that using different brands of air entrainment agents
in the mortar mixes or Type 'SA' lime were al1 successful in achieving over 10% air
content consistently when the mixes were fluid enough to have a flow table reading of'
145 to 150%. Although this report was only available after the current testing
program for the thesis had been completed, it did confirm that the use of Type 'SA'

lime was an etrective method to ensure proper air content in ail the mortar mixes used
in the final test program.
The aggregate sand used throughout the entire testing program was river sand
ihat was wvell graded with a gradation within the Canadian Standards Association's
upper and lower gradation limits.
3.3 Mortar Mixes
The initial trial mixes of mortar ranged from a pure cementlsand mix to a
cement/lime/sand mix. Pure cementhand mixes ranged from a ratio of 1:3 to 1 :7.5 to
obtain the high and low limits of compressive strength, whereas the cementllime/sand
mixes ranged frorn 1:0.25:3 to 1:3:10 to obtain high and low limits. Watedbinder
ratios were recorded after the mixes achieved bedding mortar consistency; they
ranged from 0.9 for high cernent content mixes for the 1:3 cementkand mix or
1:0.25:3 cementAimelsand mix, to 1.25 for high sand content mixes on the other end
of the spectrum. Since the air content is important in regular site work in the
Canadian clirnate, the pure cement/sand mixes were elirninated for the final testing
program due to the inconsistency of air content measurement whm using an air-
entrainment agent. Type 'SA' lime was used throughout the final test program in
order to achieve a consistent air content in the rnortar. Therefore, al1 mortar types
used in the final test program were Portland cement/lime/sand (PCIWS) mixes.

Plastic properties of the mortar mixes were also recorded, although they were
just recorded to ensure that the laboratory mixes werc similar to the actual field mixes
by masons. Each workable mix had a 135% to 160% flow table reading. Air contents
were initially measured with the portable air content measuring instrument at M C ,
but were later concluded to be not reliable as the instrument \vas not functioning
properly at the time of testing. An air meter designed for measuring air-content for
concrete was finally used to measure the air content; it consistently recorded 10 to
1 1% for al1 mortar mixes using Type 'SA' hydrated lime.
A Vicat cone penetration test was also performed for each of the preliminary
trial mixes. The test is a measure of workability of the mortar by measuring the
penetration depth of a conically shaped metal head that was released from the top
surface of the wet mortar in a fixed size container. This test gave some indication of
the workability of the mortar; any mortar mixes that had a cone penetration test result
of less than 20 mm were considered as having poor workability and were therefore
rejected. Mortar specimens obtained from these low workability mixes were also
likely to have visible horizontal separation cracks at half height of the specimen
showing the distinct different lifts during the moulding of the specimens. This clearly
suggested that the standard tempering procedure during moulding was not adequate
when the mortar was too dry due to low workability.

3.4 Compressive Test Specimens
Six 50 mm cube specimens were prepared for each rnortar rnix using non-
absorptive moulds. Al1 specimens were moist cured for six days using polyethylene
wrapping which effectiveiy achieved 100% humidity inside the wrapping; this was
followed by one day of laboratory curing at about 50% relative humidity and 20" to
22" C before testing. Al1 compressive testing of mortar cube specimens was done
directly on the platens of a universal testing machine without capping materials
placed on the specimen, and with al1 specimens rotated 990" to ensure the rough top
surface of the specirnens was not in contact with the loading platens.
The compressive strengths of the mortar ranged from 1.8 MPa for the
1/3/10(PC/L/S) mix to 18.0 MPa for the 1/0.25/3(PC/LIS) mix. The mixes selected
for the final test program were a IB/lO(PC/L/S) rnix for the low strength mortar and a
1/0.5/4(PC/L/S) mix for the high strength mortar.

4 Computer Simulation
1
4.1 General
With the advance of computer technologies, the finite element analysis
technologies are becoming increasingly more powerful and readily available. Many
of the commercially available finite element programs can simulate the behaviour of
many civil engineering structures so that a better understanding of the structures can
be achieved without physically testing the full size, or even the reduced model, of the
structures. However, a basic understanding of material properties must fint be
achieved prior to the use of computer programs in order to perform a realistic
simulation.
4.2 Basic Simulation Approaches
There are many different approaches to simulate the behaviour of masonry
structures. The most common appr~aches'~~". -' are:
1. Equivalent homogeneous material or macro-simulation approach - this
approach assumes an equivalent homogeneous material of the masonry
structure despite the well documented fact that both m a s o q units and mortar
behave quite anisotropically;

Smear line elenent approach - this approach utilizes line elements
representing horizontal and vertical joints of the masonry structure; and
Detailed definition or micro-simulation approach - this approach defines
mortar and masonry units with clear boundaries and their individual properties.
These different simulation methods offer different degrees of accuracy and
therefore should be used according to the requirements of individual situations. The
first approach offers a general behaviour simulation of the structure and is better
suited for studying large size structures. The second approach offers a better accuracy
of the behaviour of a masonry structure and is suitable for simulation of an individual
element of the structure such as a wall with openings to study the concentration of
stress. The last approach studies the detailed interaction between mortar and masonry
units and is rnost suitable for the current study as it provides the most detailed
accuracy during simulation.
Fig. 2 shows the typical prism used in the final test program. It consists of
eight masonry units, together with a compressive fibre material on top and bottom of
the prism to reduce the frictional effect of the platen during loading. No strain gauges
were mounted on the prisms during the final Phase II test program as it was clear
from the Phase 1 testing results that:
a) The strain gauges mounted on the masonry units of the prisms yielded the
same results as those mounted on the masonry units during individual

compressive testing. Therefore, the modulus of elasticity of the masonry units
was measured with the strain gauges mounted on the individual units during
compressive testing of the units only.
b) The srnailest practical size of strain gauge used was 5 mm long with a plastic
rnounting base plate of 10 mm length. Therefore, the 10 mm thick standard
mortar joints used in the final Phase II test program were just too small for
strain gauges to be mounted on them without interference between the edges
of the gauges and the masonry units. Smaller gauges of 2 mm length were
available but not suitable for a porous materials like mortar that might have
significant localized voids.
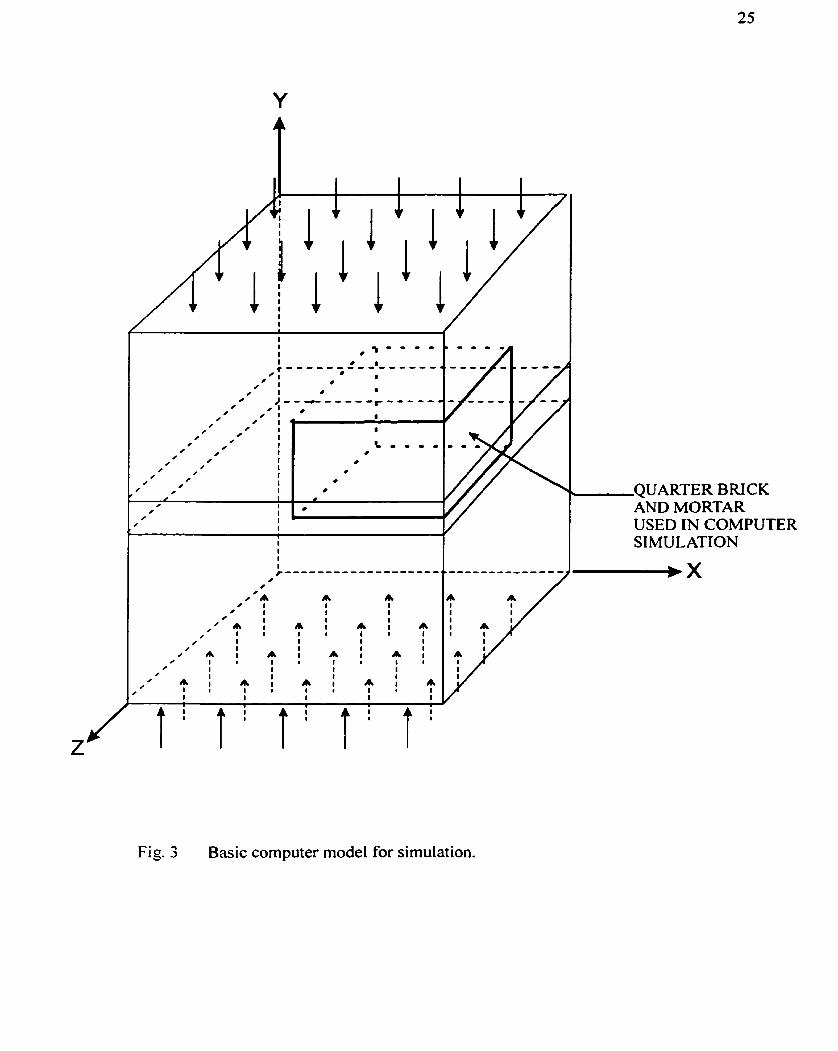
For cornputer simulation work, it was not necessary to deal with the entire
prism. Due to symmetry, the simulation only needed to model one-quarter of the
masonry unit and one-eighth of the mortar joint. Fig. 3 shows the cornputer model
used in the cornputer simulation.

Applied Load
Location of measuring - point using LVDT's
Location of measuring point using LVDT's
Reaction Table
Fig. 2 Typical arrangement of test prism.
/ USED IN COMPUTER
Fig. 3 Basic computer mode1 for simulation.
SIMULATION
4.3 Material Properties
Using the ANSYS finite element program, the basic properties of the masomy
unit and the mortar were entered into the program. The basic properties for the
rnasonry unit for the purpose of computer simulation were defined as compressive
strength, modulus of elasticity, modulus of rupture, and Poisson's ratio. Several other
properties might affect the actual site condition, but were not essential in the
cornputer simulation; some of these are the rate of absorption, the moisture content,
and size of pores within the units. Although these factors may affect the properties of
the prism assemblages at actual job sites, they were not critical in the computer
simulation simply because the computer program did not have the capability to
actually simulate the process of mortar hardening and water absorption.
The compressive strength of rnasonry units was determined by the normal
compressive testing of 50 mm cubes in the case of a Stone unit, and half bricks of
different units in the case of brick units. The moduli of elasticity of the units were
deterrnined by strain gauges mounted on the specirnens during compressive testing,
and also on some masonry prisms to confirm the results from the compressive testing
in the Phase 1 of the final testing. A third set of strain gauges was mounted on the
small beam specimen for the modulus of rupture test in Phase 1 of the final testing
program to confirm the modulus of the masonry unit. Photo 1 shows a typical strain
gauge mounting with epoxy compound on the surface of the beam specimen. Photo 2
shows the typical strain gauge arrangement on the prism assemblages.

Photo 1 Typical mounting of strain gauge using epoxy glue on the unit.

Photo 2 Arrangement of strain gaugcs on trial prisrn.

The modulus of rupture of masonry units was determined by using a combination of
two different methods. The first method was using a two-point loading on simply
supported beams of dimensions 50 mm x 50 mm x 300 mm, and the second method
was split-tensile testing using a line load across the top of the specimen of a 50 mm
cube specimen. Fig. 4 s h o w a schematic test arrangement of a simply supported
beam specimen and Photo 3 shows the actual testing arrangement of the beam
specimen on the testing machine. Two-point loading ensured a uniform bending
moment between the two loading points.
Fig. 4 Typical arrangement for modulus of rupture test of masonry unit on simply supported beam.

Photo 4 shows the top view of the beam specimen indicating the location of the strain
gauge mounred at the top fibre of the specirnen that lies between the two loading
points. Photo 5 shows the failure plane of the specimen after failure; a clean failure
plane was to be expected for ail t ende stress failures of the beam specimen.
Photo 3 Beam specimen for simply supported beam testing.
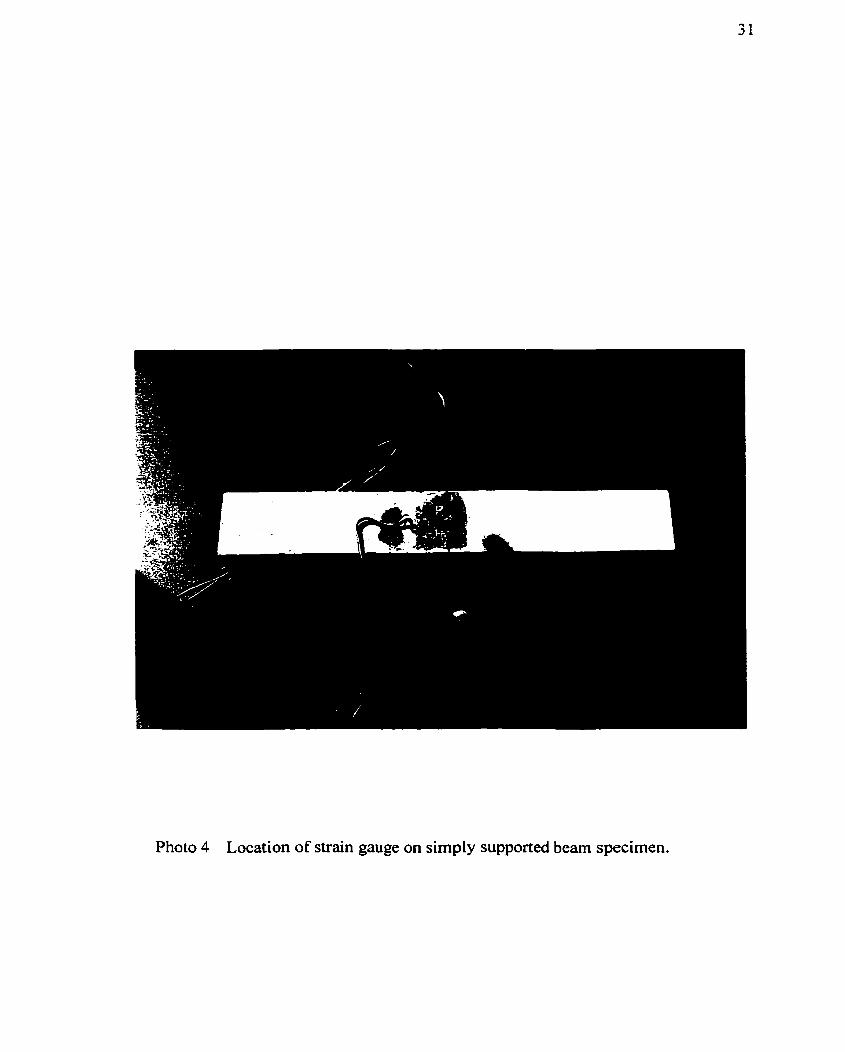
Photo 4 Location of strain gauge on sirnply supported beam specimen.

Fig. 5 shows the schematic test arrangement for the split-tensile test of a Stone
masonry unit and Photo 6 shows the actual failed specimen after testing. In order to
verify the computer modeling procedures, a simple model of the spiit-tensile test was
used in the finite element analysis program to check against the known theoretical
concept. Fig. 6 is the finite element computer simulation of the split-tensile test
model. The loading was in the Y-direction with a negative value as indicated by the
downward arrow, and the model was restrained at the centre of the area at the bottom
as indicated by the chevrons. The stress contour was plotted in Fig. 7 as the intensity
of the stress in the X-direction; Fig. 8 plots the principal stresses of each
Photo 5 Typical failure plane on the specirnen as expected in split-tensile test.

Applied load I
Fig. 5 Schematic diagram for split-tensile test of a Stone un
Photo 6 Split specimen after failure.

Fig. 6 Computer mode1 for split-tensile test.

ANSYS 5 . 3 AUG 17 1998 13:08:59 NODAL SOLUTIO STEO=1 SUB =1 TIME=l SX R S Y S = O
( AVG
DMX =. 849E-03 SMN =-. 87684 SFNB=-2.205 SMX =.146073 SMXB=. 917596
Fig. 7 Contour of X-direction stress intensity.

ANSYS 5.3 AUG 17 19 13:05:07 VECTOR S T E P = l SUB =1 TIME=1 S
Fig. 8 Principal stresses directions and magnitude.

L ANSYS 5 . 3 -_ -- --- - - __ - AUG 17 1 9 9 t
t 13:06:03 VECTOR
1 STEP=1 SUB =i
Fig. 9 Principal stress plot to identify the directions of the stresses only.

element centroid. This plot shows the magnitude of the stresses in proportion to the
intensity of the stress, that is the longer the arrow, the higher the stresses. The
direction of the arrow pain also indicates whether the element is in compression or
tension. The arrows pointing towards the centroid are the compression stresses and
those pointing away from the centroid are the tensile stresses experienced by that
element. This plot demonstrates the tensile stresses experienced in the X-direction
when the downward loading is applied in the middle of the area. For clarity, the same
principal stress is re-plotted in Fig. 9 using the same length of arrows to show the
directions of the stresses only.
The property that was not actually obtained by tests was the Poisson's ratio; it
was initially entered as O. 15 based on previously documented results".
The basic properties of mortar are defined as compressive strength, modulus of
elasticity and Poisson's ratio. The modulus of npture of the mortar was not
considered essential as the failure rnechanism of the prisms was always initiated by
the splitting of the masonry units, whereas the mortar joints were still under a tri-axial
compression state' just prior to the failure of the prism. Fig. 10 shows the schematic
relationship of this phenomenon of the equivalent tri-axial compression state of the
mortar. As the prism was subjected to uni-axial vertical loading, the mortar would
attempt to expand laterally because of the Poisson's effect, however, the masonry unit
did not expand at the same rate due to its much higher modulus of elasticity.
Therefore, if good bonding was achieved at the bed joints between the masonry units

and mortar, the masonry units were restricting the lateral expansion of the mortar.
This restriction results in a lateral bi-axial compression confinement pressure thus
subjecting the mortar to tri-axial compression. Similar to reinforced concrete, the
compressive strength would increase significantly when lateral-confining pressure
was applied.
The reverse was true. however, for the masonry units; the lateral expansion of
the mortar acted as the tensile forces on the masonry units, thus the masonry unit was
undergoing a uni-axial compressive and bi-axial tensile stress state. The net result
was the pnsm would fail by the tensile splitting of the masonry units once the units
exceeded their modulus of rupture. This applied loading would then be considered as
VERT. LOADING
BI-LATERAL TENSION & UNI-AXIAL COMP.
- - - . - a - . - . - 2 0 -
0 - 0
I ' 1 '1 '1 '1 '1 ' VERT. LOADING
Fig. 10 Effective stress of masonry unit and mortar under vertical compression of prism.

the ultimate strength of the prism. This phenomenon is also referred to as the indirect
tensile testing of prism assemblages by some researchers.
Similarly, the compressive strength of the mortar was determined by the
compressive strength of standard 50 mm cube specimens from non-absorptive plastic
rnoulds as shown in Photo 7. The modulus of elasticity of the mortar was also
determined by strain gauges mounted both on cube specimens and on joints of prisms
as shown in Photo 8, and also by a Linear Variable Displacement Transducer (LVDT)
mounted on a 3" diameter x 6" high cylindrical specimen as shown in Photo 9.
Poisson's ratio was assurned as 0.15 f om previous research data-
The compressive strengths of masonry uni& and mortars are two of the most
tested properties for typical projects simply because the specimens are reiatively easy
and inexpensive to prepare when compared with testing for other properties. Most
irnportantly, they are reasonably reliable strength indicators for commercial or
research laboratories.
Other properties, however, are seldom tested, because they are either very
espensive to carry out or often very unreliable. The preparation work for testing
using strain gauges is both expensive and, at times, erroneous if the gauges are not
prepared properly. Before the strain gauge can be mounted on the specimen, the
surface of the base material must be sanded, thoroughly cleaned, and treated with
epoxy resin to fifi the voids on the surface. The strain gauge must then be carefully
applied on the surface of the epoxy resin under specific manufacture's instructions.

The data transrnitting wiring is then soldered ont0 the conducting terminals before the
strain gauge readings c m be recorded with another remote recording machine or
cornputer. The strain gauge will simply give erroneous result if any one, or any
combination, of the preparation procedures is not followed correctly. Another
possible area of concern is that the epoxy resin fills the voids of the base material and
may have altered the properties of the base material somewhat.
Photo 7 50 mm cube rnortar specimen being prepared in a non-absorptive plastic mould.

Photo 8 Strain gauge mounted on cube specimen to determine the stress- strain relationship during compressive testing.
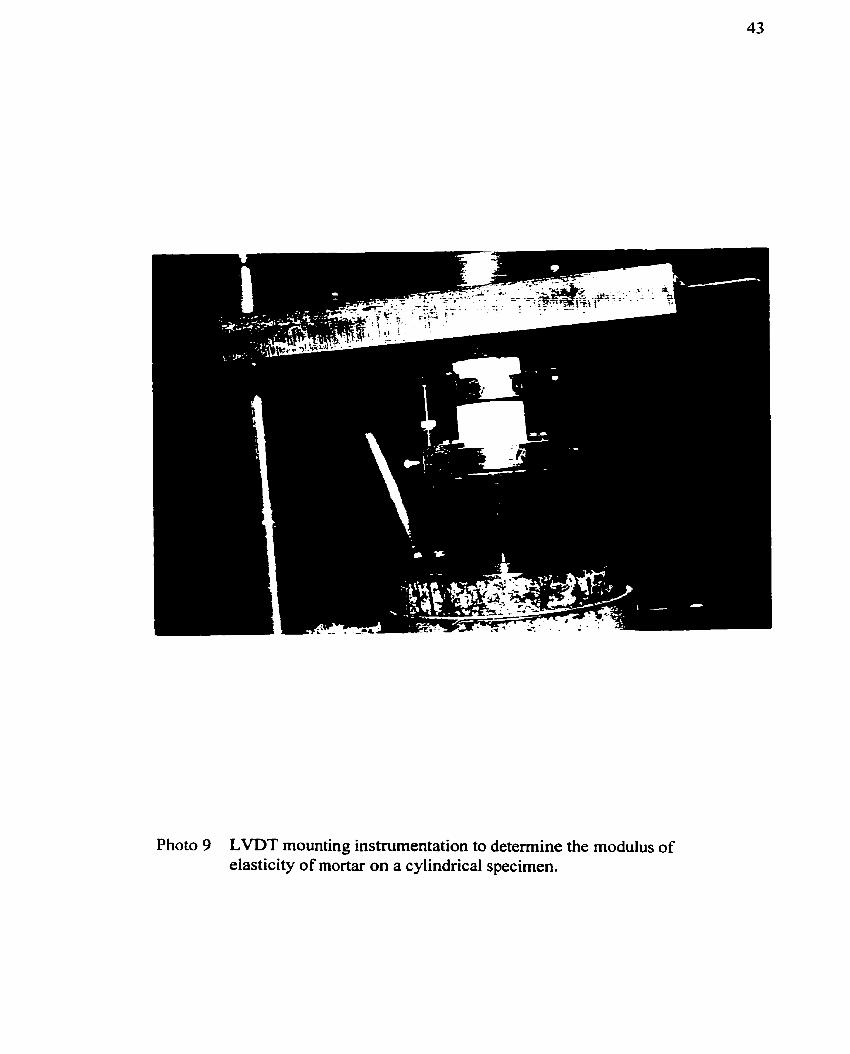
Photo 9 LVDT mounting instrumentation to determine the modulus of elasticity of mortar on a cylindrical specirnen.

4.4 Cornputer Simulation Modeling Procedure
Only a quarter of the masoxuy unit and one-eighth of the mortar joint were
needed for simulation of a prism assemblage because of symmetry. Thecefore, the
CO-ordinates of the corners for the masonry unit and the mortar were entered into the
computer to form two comecting solid volumes. The volume representing the mortar
was fitted with elements that had the properties of rnortar. The volume representing
the masonry unit was hirther divided into two regions. Al1 these two regions were
fitted with elements that had the same properties of the masonry unit. The volume
closer to the mortar, however, was fitted with smaller elements, and the volume
further away from the mortar was fitted with larger elements. This would provide
better computation accuracy near the mortadunit interface plane. Fig. 1 1 indicates the
three regions of the computer model represented by the three different volumes. Fig.
12 shows the element configuration in the model.
Each type of elements was defined with its own properties in terms of its
respective uni-axial compressive strength, cracking tensile stress or modulus of
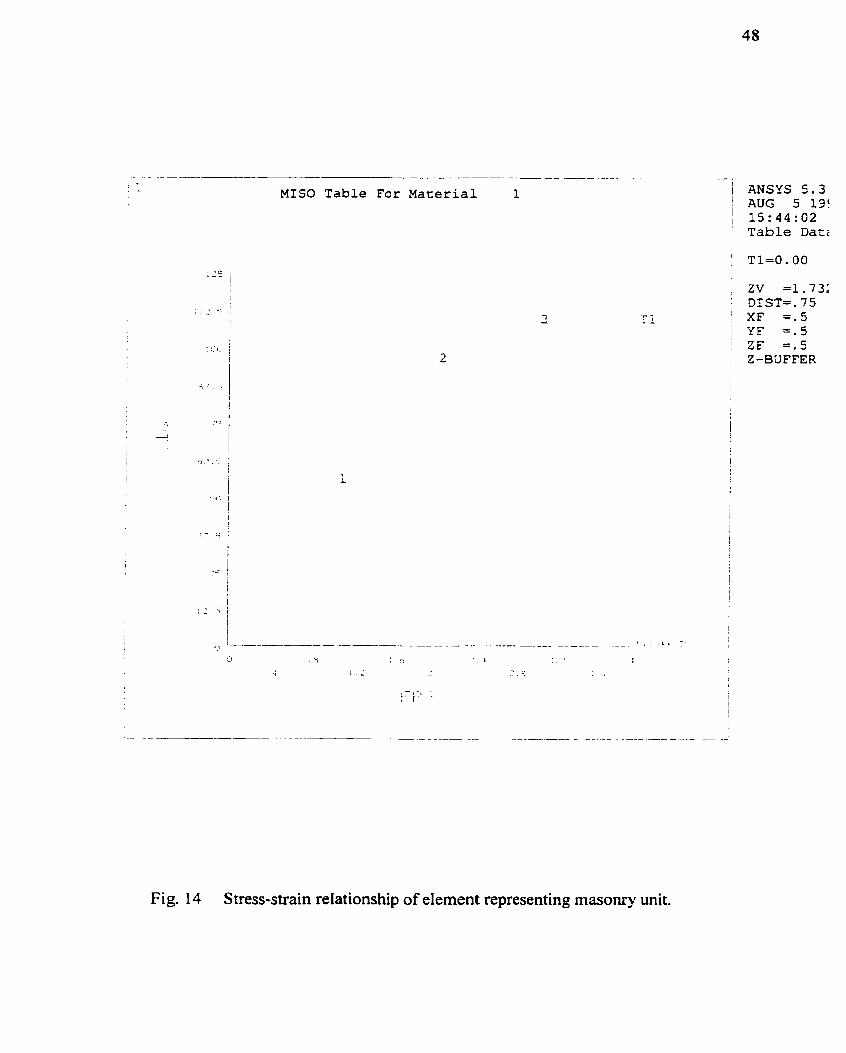
rupture, initial modulus of elasticity and stress-strain relationship. The stress-strain
relationships were al1 multi-linear approximations. Fig. 13 shows one of the multi-
linear stress-strain curves approximating the non-linear characteristic of masonry unit,
and Fig. 14 shows a typical stress-strain relationship of mortar.

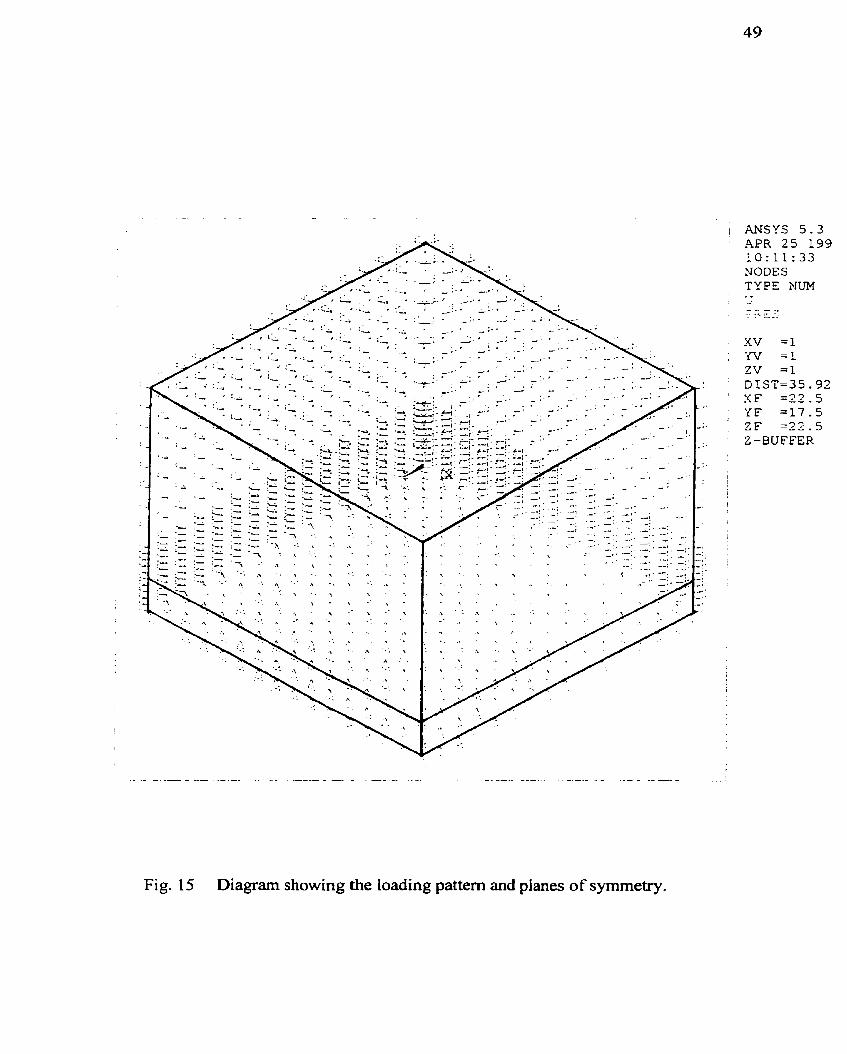
The three principal X-Y, X-2, and Y-Z planes were assigned as planes of
symmetry for the simulation. The appiied Ioading was on the top surface of the
model, in the negative Y-direction representing the compressive loading. Fig. 1 5
shows the direction of loading pressure indicated by the downward arrows and the
planes of symrnetry indicated by the chevrons.
Fig. 1 1 3-D model used in cornputer simulation.

Fig. 12 Cornputer mode1 showing the sizes of finite elements.

MIS0 Table For Material 2 ANSYS 5.3 AUG 6 199r 15:20:30 Table Data
Fig. 13 Stress-strain relationship of elements representing mortar.
-4PR 2 5 199 10:11:33 NODES TYPE NUM - 7
Fig. 15 Diagram showing the loading pattern and planes of symmetry.

The simulation was carried out in sub-steps of 1 MPa increments until the
mode1 failed due to non-convergence of differential equations. The final loading was
then funher sub-divided into 0.1 MPa increments to obtain the failure pressure to the
nearest 0.1 MPa. This compressive loading would then be defined as the ultimate
strength of the prism in the computer model. Since the elements defined in the
simulation contained no steel reinforcement, as soon as they reached either the
cracking stress (modulus of rupture) or the crushing stress (ultimate compressive
stress), the matrix equations would fail to converge and this signaled the program to
terminate fiirther calculations.
Fig. 16 shows typical displacement vectors of the elements in the mode1 under
compressive loading from the Y-direction. The results are discussed in later chapters.
In order to study the effect on the failure strength of the model due to changes
in properties of different individual components, the input variables were changed and
the failure pressures recorded. These changes were carried out systematically one
variable at a time.
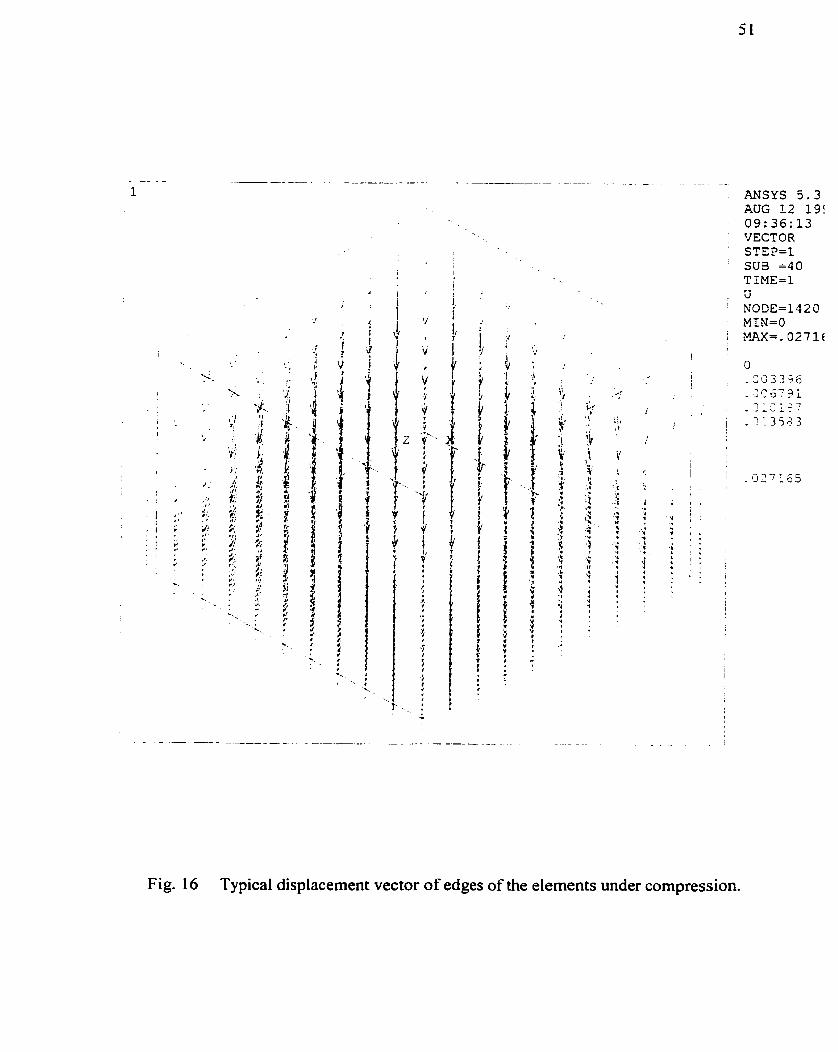
ANSYS 5 . 3 AUG 12 19: O9:36: 1 3 VECTOR STEP=1 SUB =40 TIME=l U NODE=1320 MIN=O MAX=. 0271~
O ~ ~ - 3 ) - . ~ b d 336
. G C 0 7 3 i - v 3 : = ' 7 . 2 ; 3 5 4 3
- 9 2 7 2 0 5
Fig. 16 Typical displacement vector o f edges of the elements under compression.

5 Finite Element Analysis Theory I The Finite Element Analysis uses a "discretization" process wiih the following
set of simultaneous equations to equate the interna1 forces with the extemal applied
loads:
where [KI = coefficient matrix
{u} =vector of unknown DOF (degree of freedom) values
{F. } = vec tor of applied loadç
This set of equations would be correct if the matrixes are al1 linear. However,
if the simulation were to be non-linear, this simple matrix solution would give rise to
incorrect accumulation of computational errors.
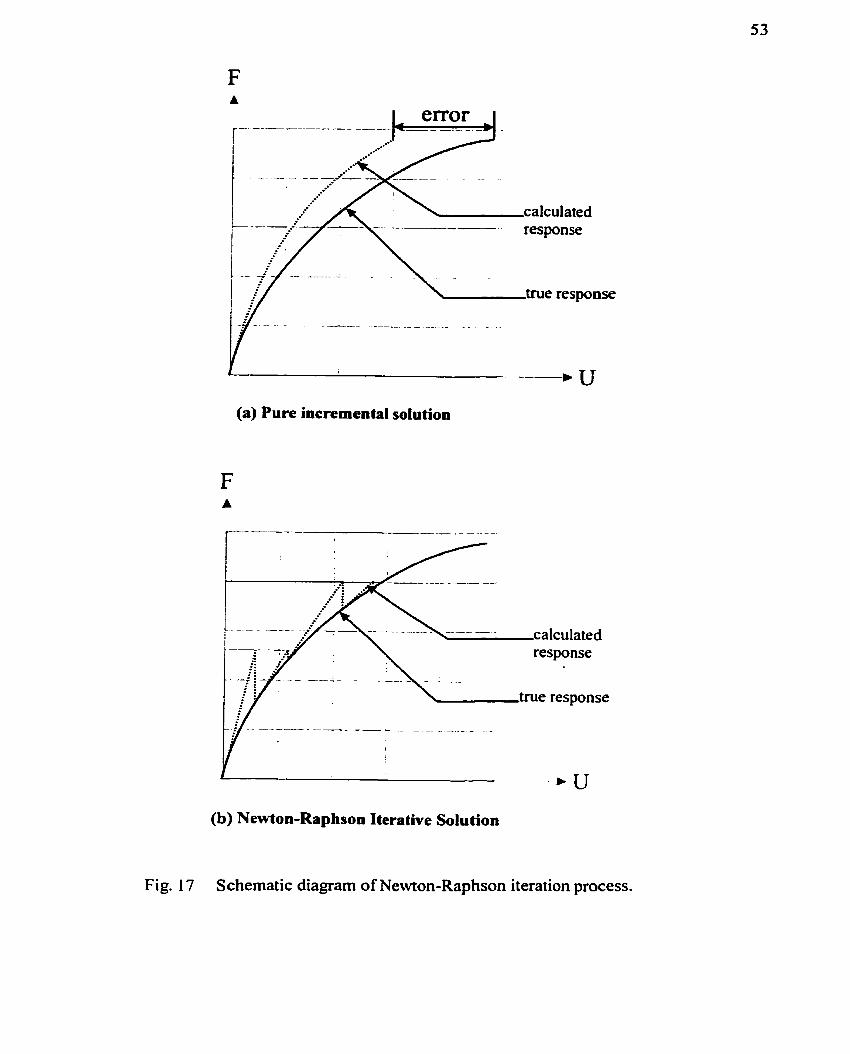
Fig. 17(a) shows the relationship of the assumed true response and the
calculated responses. An iteration process is therefore required to overcome this
shortcoming of straight simulation and Fig. 17(b) shows the general schematic of the
iteration process.
calculated response
true response
-- --.. . .- - .. -. . - . - . - - . .
(a) Pure incremental solution
- - -, u (b) Newton-Raphson Iterative Solution
Fig. 17 Schematic diagram of Newton-Raphson iteration process.

When the coefficient matrix [KI is itself a function of unknown DOF values,
then the original matrix equations become non-linear equations. The Newton-
Raphson method is an iterative process of solving the non-linear equations and can be
written as:
where [KT]= Tangent matrix
i = subscript representing the current equilibrium iteration
{F;"'}= vector of restoring loads corresponding to the element interna1
loads.
The rnatrixes [ ~ r ] a n d ma are evaluated based on the values given by (ui),
and the term IF')- {F,"} represents the residual vector or sornetirnes referred to as the
out-of-balance load vector. This is the amount of out-of-equilibrium from the system.
Fig. 18 shows the graphical relationship of a single solution iteration of a single
Degree of Freedom (DOF) model.
In this case, [KT] represents
restoring force matrix calculated
1 the tangent of the stiffness matrix, { is the
frorn the element matrix, and { u i ) is the
displacement matrix of the system. As seen from the graph, the tangent solution does
not represent the actual response, and therefore an iteration process is necessary for

the solution to converge. The solution obtained at the end of each iteration process
represents the load level { F U } . The final converged solution would be in equilibrium,
and in such case, the restoring load vector {F;"'} computed frorn the current stress state
would equal the applied load vector {F"} within the acceptable toIerance.
The ANSYS program implements this Newton-Raphson procedure and the
program would go through al1 the intermediate steps until convergence is reached for
each load step. Since rnasonry prisms typically behave in a non-linear manner, this
method is necessary for accurate simulations. The convergence criterion was set at
1 o - ~ , a relative small value in order to ensure the computation error did not exceed the
simulation errors.
response
U
Fig. 18 Iteration process for Newton-Raphson Solution.

6 Cornputer Simulation Results
6.1 General Obsewation
The computer model was to simulate the behaviour of the rnasonry prism
under vertical compressive loading until faiture. Fig. 19 shows the displacement
nodes of the elements in the model as simulated using the ANSYS finite element
analysis program. It shows the displacement of the nodes of the elements is changing
gradually from the vertical negative Y-direction near the top to the lateral direction
n e z the horizontal X-Z plane. Fig. 20 shows the enlarged portion of the deformation
of the mode1 at the joint interface. The negative Y-direction (downward) pressure
causes the vertical dimension to decrease? and this deformation is directly related to
the strain measurernent. At the same time, the Poisson's effect causes the X- and the
2-direction dimensions to increase. However, the rate of increase depends on the
modulus of elasticity of the elements; that is, the elements with a lower modulus of
elasticity would expand laterally more than the those with a higher modulus of
eIasticity.
Fig. 21 shows the directions of the principal stresses of each element at its
centroid. Each element has three pairs of arrows representing its three principal
stresses. The arrows pointing away from the centroid of the element represent the
tensile stresses, whereas those arrows pointing towards the centroid of the element

would indicate compressive stresses. Fig. 22 shows the same plot of principal
stresses except the magnitude of the stresses are scaled, in other words, the higher the
stresses, the longer the line benveen the arrows, and vice versa.
From these plots it is clear that those elements near the masonry unit/mortar
interface but inside the mortar have al1 three principal stresses pointing to their
respective centroid of the elements. indicating compressive stresses in al1 three
principal directions. This matches exactly the theory of the equivalent tri-axial
compression stress of the mortar.
The elements just above the unit/mortar interface representing the masonry
units al1 show compressive stresses in the Y-direction parallel to the loading.
However, for the ones near the symmetry planes of the masonry unit, arrows are
pointing away from the centroid of the elements indicating tensile stresses are present
in the hvo principal stresses perpendicular to the loading pressure. When the tensile
stress in these elements exceeds the input criterion of the modulus of rupture, the
elements in the simulation would "crack" and the simulation would stop due to non-
convergence of the triangular matrix. This clearly explains the laboratory observation
that the failure mode of prisms is always the splitting of the masonry units and not the
compressive failure of the mortar.

. . . . . . .- ..-.... ..-. ................. - -.- .-.- *
- t / s . . . , t;. . .

ANSYS 5 - 3 SEP 9 1998 08:45;32 NODAL SOLUTIC CiTEP=1 SUB =40 TmE=1 u m RSYS=O D m =,O27165 SLZX =,O27165
Fig. 20 Enlarged portion showing the deformation at mortar joint interface.

AUG 11 199 17:10:57 VECTOR STEP=l SUB =40 TIME=1 s
Fig. 21 Principal stresses of elements showing the tensile stress of the masonry unit nea. the joint interface.

; ANSYS 5.3 1 SEP 9 1998 08:S2:51 VECTOR STEP=L SüB =40 TIHE=l s
P R I N 1
P R I N 3
Fig. 22 Principal stresses of elements showing the magnitude of stresses with proportional length of arrows.

The failure strength of the prism in the simulation is dependent on any of the
following three conditions: it depends on the modulus of rupture of the masonry unit,
the compressive strength of the masonry unit and of the mortar. The computer mode1
would indicate prism failure when the integration points on the elements do not
converge, and this non-convergence will occur when:
a) the compressive stress in the elements exceeds its respective pre-defined
maximum strength of either the mortar or masonry unit, or,
b) the tensile stress of the elements exceeds the input value for the modulus of
rupture of the masonry unit. This usually occurred just above the
unithortar interface.
Using the basic compressive strength of the standard 50 mm cube non-
absorbent specimens, the simulation result will produce a non-convergent result once
the compressive stress of the mortar reaches the input compressive strength data.
This occurs because the computer program interprets this compressive stress as the
"cmshing" stress of the element, thereby generating non-controllable displacements
of the nodes. The program will indicate locaI failure of the mortar, and will halt the
simulation. This will occur once the loading pressure exceeds the compressive
strength of the mortar, even though laboratory testing clearly reports that a much
higher strength can be achieved. As previously stated, earlier research work has
observed that, the failure of a prism is initiated by the splitting of masonry units when
they reach their modulus of rupture stress. The crushing strength of the mortar can be

much higher than that recorded by testing the non-absorptive specimens t'ur two
reasons. First, the monar is experiencing an effective tri-axial compressive pressure;
second, the moisture absorption during setting would increase the mortar strength
considerably. Therefore, in order to allow the simulation to continue until the
phenornenon of splitting of masonry unit could be achieved, with no other data being
available for the effective lateral confining pressure of the mortar, the crushing stress
of the mortar was eventualiy omitted in the simulation.
When the monar tries to expand laterally under vertical loading, and with
good bonding behveen mortar and unit, the net effect is a tensile stress being
developed in the masonry unit at or very close to the joint interface. The computer
simulation ciearly demonstrates this phenornenon in agreement with actual laboratory
testing and the previously reported failure mechanism when the crushing strength of
the mortar is omitted. The result is that the simulation will stop only when the tensile
stress of the elements representing the masonry unit exceeds its pre-determined
modulus of rupture.
6.2 Parametric Analysis
In order to gain a better understanding of the different factors influencing the
ultimate strengths of the prisms that are not norrnally tested in laboratory, different
simulations using different constants were conducted and the results were anaiyzed.
The possible parameters that can be changed are Poisson's ratio of masonry unit,

Poisson's ratio of mortar, the modulus of elasticity of masonry unit, and the modulus
of elasticity of mortar.
6.2.1 Change in Poisson's Ratio
Poisson's ratio of the masonry unit and the mortar is a piece of data that is not
normally tested for and reported in traditional compressive testing, but is important in
computer simulation as it influences the lateral expansion of the masonry unit and the
mortar under compressive loading. Based on previous research results, the initial
Poisson's ratios were chosen as 0.15'' for both masonry units and mortar.
Fig. 23 shows the maximum tensile stress of the rnasonry elements near the
interface was 1.9 MPa as indicated in the red zones of the plot, with Poisson's ratio of
masonry unit being set at 0.20. Fig. 24 shows the maximum tensile stress of the
masonry elements was 2.7 MPa, with every other parameter being constant but
Poisson's ratio of the masonry unit changed to O. 10. These simulations indicated that
when Poisson's ratio of the masonry unit was reduced, the tensile stress of the
elements in the masonry unit, in the horizontal directions, increased. When the prism
is subjected to vertical loading, the masonry units and the mortar will expand laterally
at different rates due to their different moduli of elasticity even if their Poisson's
ratios are the same. Therefore, if Poisson's ratio of the masonry unit is reduced, the
difference in the rate of lateral expansion is further increased causing an increase in
tensile stress of the masonry unit.

Fig. 23 X-axis stress contour with Poisson's ratio of masonry unit being 0.20.

ANSYS 5.3 MAY 8 1938 14: 59: 16 ELEHEEJT SOLUT STEP=l SUB =40 TIHE=I Sl I NOA' DMX =. 03161 SMN =-3- 826 SMX = Z - 676
Fig. 24 X-axis stress contour with Poisson's ratio of masonry unit being 0.10.

This ultimately reduces the compressive strength of the pnsm as the tensile stresses in
the masonry would reach the modulus of rupture at a much faster rate.
Fig. 25 shows the tensile stress near the mortadrnasonry unit interface with
Poisson's ratio of the mortar being 0.10. Fig. 26 shows the same interface with
Poisson's ratio of the rnortar increased to 0.20. The X-mis stress plots fiom the two
different simulations revealed the tensile stress in the masonry unit increased from 1.0
M'Pa to 3.8 MPa just by changing the value in Poisson's ratio of mortar. This is just
the reverse of the previous parameter. As Poisson's ratio of the mortar increases, so
does the difference in the lateral expansions of the mortar and the masonry units.
This increase of the difference causes the increase of the tensile stress in the masonry
unit.
It can be concluded that the higher the difference of Poisson's ratios between
the masonry unit and the mortar, the faster the prism would fail. This result is
important as this relationship would explain one aspect that contributes to the
variability of masonry structures simply because traditional strength testing of the
masonry unit or mortar simply does not reflect variations of Poisson's ratio of the unit.
Without the proper material data, the commonly obtained data of the compressive
strengths of masonry unit and rnortar are insufficient to understand the complete
behaviour of the prisms.

,LL*ZG-- 1-1 SOI-T- T 8 b 'T- rn

BFJSYS 5.3 EAY 15 1938 09:29:56 NODAL SOLUTION STEP=l S m =40 m = 1 SX (-%WC) RSYS=O DHX =-O30835 SLIN =-6-283 SHX =3-84
Fig. 26 X-axis stress contour with Poisson's ratio of mortar being 0.20.
6.2.2 Change in Modulus of Elasticity
The effect of changes in Young's modulus of the masonry unit was exarnined
next. The result showed that the higher the Young's modulus of unit, the higher the
tensile stress in the unit along the interface. Fig. 27 shows the plot of the nodal stress
in the X-a.xis for rnodulus of unit being set at 54 500 MPa, and Fig. 28 shows the
corresponding plot when the modulus of unit was set at LOO 000 MPa. With the lower
modulus of elasticity, the tensile stress was only 0.17 MPa, while the higher modulus
elasticity caused the tensile stress to increase to 2.4 MPa. The reverse is tme for
modulus of mortar. The simulation revealed the higher the Young's modulus of
mortar, the lower the tensile stress in the Stone along the interface. It appears that the
relative difference between the masonry unit and the mortar caused the increase or
decrease in the tensile stress in the masonry unit. The higher the relative difference,
the higher the tensile stress.

Fig. 27 X-axis stress contour with modulus of elasticity of masonry unit set at 54 500 MPa.

Fig. 28 X-axis stress contour with moduius of elasticity of masonry unit set at 100 000 MPa.
ANSYS 5.3 AUG 11 1998 09: 39: 31 NODAL S O L m I i STEP=1 SVB 140 m = 1 SX (AV( RSYS=O D m =- 016473 SIM =-3- 448 SEX =2-182

7 Final Test Program - Phase I
The results of the computer simulation of a masonry prism suggested that the
interface of the mortar and the unit was the key investigation area. The principal
stresses of the elements chanpd from tri-axial compression in the mortar, to bi-axial
tension in the masonry just above the joint interface. A test prograrn to investigate the
relationship of the modulus of elasticity of the prism and across the mortar section
was therefore developed.
Since there was an other research program being canied out with Ohio stone at
the National Research Council WC), it was decided to use the same Ohio stone to
compare with their findings. Ohio stone is a type of sandstone used quite frequently
in the Ottawa area. This sandstone exhibits a fairly homogeneous behaviour within
the stone units compared with limestone which is more layered and therefore behalves
quite differently in orthogonal directions. The size of Ohio stone unit was chosen
such that both strain gauges and DEMEC points could be mounted on the stone
surface to obtain Young's modulus of the stone. The recorded value can then be used
to compare with values obtained from other different measuring methods, as well as
with NRC's value. Fig. 29 shows the arrangement of the prisms for the phase 1 of the
final test prograrn.

1 L 1 0 mm fibre
ctr.
gauge in transverse direction
Fig. 29 Typical prism layout in Phase 1 test program.

7.1 Prism Construction and Testing
The size of the Stone unit was 100 mm x 100 mm x 80 mm; IO-mm length
strain gauges were mounted on opposite faces of the unit. Furthemore, two DEMEC
discs were mounted at 50 mm spacing, also on opposite faces of the same unit, for
direct strain rneasurements using a 50 mm DEMEC gauge. Strain gauge data were
recorded during compressive testing along with its associated loading, with the on-
line data recording computer connected to the compression testing machine. At the
sarne time, the 50 mm DEMEC gauge was used to obtain strains at varies stress levels.
These two sets of strain measurements were compared against each other, as well as
against the results supplied by NRC.
The thickness of mortar joints was chosen as 20 mm to allow for the mounting
of strain gauges across the mortar joints. This relatively thick joint was needed for
the installation of suitable size strain gauges directly on the mortar joints without
interference of the masonry units; 5-mm length gauges with 10 mm base plastic
mounting plates were used throughout. This allowed the strain gauges to have a
minimum 2 to 3 mm spacing between the ends of the strain gauge bases and the
unitlmortar joint interfaces of the prisms. Another pair of strain gauges were mounted
in the transverse direction at the centre of the mortar joint to record the strain in the
orthogonal direction of the loading.
Two different strengths of mortar, one with extremely high strength of 25.5
MPa and the other with relatively low strength o f 5.3 MPa, were selected in this

Phase 1 test program. The mortar mix proportions were obtained from earlier test
results: the high strength mortar of 25.5 MPa was achieved with the mix of 1/0.25/3
(PC/L/S), representing 1 part o f white Portland cernent, 0.25 part of Typs 'S' hydrated
lime and 3 parts of sand, while the low strength mortar of 5.3 MPa was achieved with
a 1/2/8 (PC/L/S) mixture. The mortar mixes and the prisms were prepared and
constructed by an experienced mason to ensure good workrnanship. The prisms were
then wrapped with plastic for moist curing for 7 days, and laboratory condition curing
for another 21 days before the fint compressive testing sequence. The laboratory
conditions were at about 20 to 22O C and 35 to 50 % relative humidity.
Instead of loading the prisms to its ultimate strength and failure, these prisms
were loaded to approximately 25 percent of the estimated ultimate capacity based on
the preliminary data supplied by NRC. The prisms were unloaded prior to repeating
another two cycles of loading and unloading.
The testing was carried out on a Tinius-Olsen 400-kip universal testing
machine in the Structural Laboratory of Carleton University. The loading was
applied at a rate of 0.05 kN per second but halted at every 1.5 kN interval for the 50
mm DEMEC measurements across the mortar joints and on the Stone to be taken. A
200 mm DEMEC measurement for the overall strain of the prisms was also recorded
at the same loading levels.


Fig. 30 Typical strain gauge locations on mortar specimen.
Photo 13 Different sizes of mortar specimen with strain gauges.

As mentioned earlier, 5 mm strain gauges were mounted on the mortar joints in
vertical and horizontal directions on the prisms to obtain the stress-strain relationships,
and the approximate value of Poisson's ratio of the mortar. Photo L 1 shows the prism
assemblage with al1 the strain gauges connected into the data-recording computer.
Photo 1 1 Prism assemblages with al1 strain gauges connected to data- recording computer.
7.3 Test Procedures for Ohio Stone
The properties of Ohio stone were measured using different testing methods
and specimen types. The first test involved compressive tests on 50 mm cube
specimens with two 10-mm strain gauges mounted on opposite sides to obtain the
stress-strain relationship and the compressive strength of the stone. The second
involved 50 mm x 50 mm x 200 mm sirnply supported beam specimens loaded at two
points to obtain the modulus of rupture of the stone; 10 mm strain gauges were also
mounted on the top compression fibre and bottom tension fibre to compare the stress-
strain relationship of the stone obtained by other methods. The third test involved
split-tensile tests on 50 mm cube specimens to compare the modulus of rupture
obtained from the beam specimens. The fourth involved the mounting 10 mm strain
gauges on the stone units of the prisms to measure the stress-strain relationship of the
stone unit during the compression tests of the prisms.

8 Phase I Test Results
8.1 Propertiesof Mortars
The stress-strain relationships of the mortars are plotted in Figs. 3 1 to 34. The
plots are the average value of the two strain gauges mounted on opposite sides of each
specimen. Fig. 3 1 shows the stress-strain relationship of the 1/2/8 mortar on a 50 mm
cube specimen and Fig. 32 is the relationship on a 100 mm cube specimen of the
same mortar mix; Fig. 33 shows the stress-strain relationship of the 1/0.25/3 mortar
on a 50 mm cube specimen and Fig. 34 shows the relationship on a 100 mm cube
specimen.
For the 1/2/8 mortar, the maximum strength of the 50 mm cube specimen was
5.3 MPa and of the 100 mm cube was 4.6 MPa, representing 86% of the 50 mm cube.
This is consistent with previous findings that the size of cube specimens affects the
ultimate strength of the sarne mortar mix.

StressStnin Cuwe for 112/8 Mortar for 50 mm Cube
I
O 500 1 O00 1500 2000 2500 3000
Stnin (x IO* mrnlmm)
Fig. 3 1 Stress-strain relationship of 11218 mortar for 50 mm cube specimen.

Fig. 32 Stress-strain relationship of l/2/8 mortar for 100 mm cube specimen.
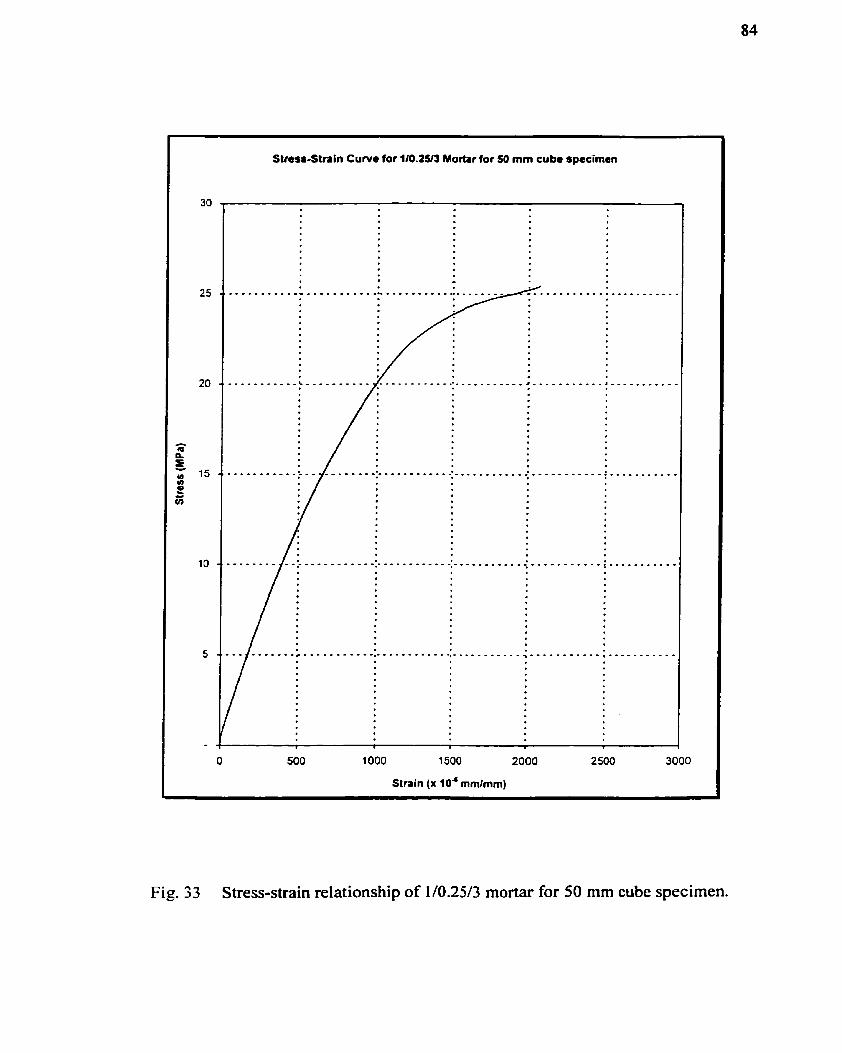
Curve for 110.2513 Mortar for 50 mm cube specimen
Strain (x l o J mmlmm)
Fig. 33 Stress-strain relationship of 1/0.25/3 mortar for 50 mm cube specimen.

Fig. 34 Stress-strain relationship of 1/0.25/3 mortar for 100 mm cube specimen.

For the 110.2513 mortar, the maximum strength of the 50 mm cube specirnen
was 25.5 MPa and of the 100 mm cube specimen 19.7 Mpa, representing 77% of the
50 mm cube strength-
8.2 Properties of Ohio Stone
The compressive strength of the 50 mm cube Ohio stone specirnen was
detennined as 58.0 MPa. The modulus of rupture of the Ohio stone was calculated as
2.8 MPa for the two-point simply supported beam testing. This value was in good
agreement with the results from the average value of 2.9 MPa obtained from the split-
tensile tests for three 50 mm cube specimens. Fig. 35 shows the plot of the suess-
Stress-Strain Relationslzip of Ohio stone in sirnpIy supported beam test
Comp. Strain - - - - - - Tens. Strain
-600 -400 -200 O 200 400 600
Strain (x 10-6 mmlmm)
Fig. 35 Stress-strain curves of Ohio stone on top andbottom fibre of the simply supported bearn specimen.
strain relationship of the stone, recorded by the strain gauges that were mounted on
the beam specimen.
The initial modulus of elasticity for the Ohio stone was also obtained as 8.0
GPa. The modulus of elasticity was well within other measuring methods used in this
thesis, as well as within the reported result from M C .
8.3 Prism Test Result
Phase 1 of the test program recorded several different stress-strain relationships
of Ohio stone and rnortars, in addition to the overall relationship for the prisms. Fig.
36 shows the different stress-strain relationships of the prism constructed with the
weak rnortar and Fig. 37 shows the matching stress-strain relationships of the prism
made with strong rnortar. Each figure has three different sets of data representing
DEMEC gauges at different locations of the prisms.
The first set, consisting of 50 mm DEMEC data, was used to determine the
modulus of elasticity of the Ohio stone only; six measuring points were averaged to
plot each data point on the curve. The second set, consisting of 50 mm DEMEC data,
was used to determine the modulus of elasticity of the section across the rnortar joints.
Four data points were recorded for the average value used for each point of the plot.
The third set of data was plotted using 200 mm DEMEC data to measure the overall
strain deformation of the prisms; only two measuring points were available for the
average value used to plot the graph.

Stress-strain curve for weak mortar with 200m Demec & 50mm Demec gauges
-C- MOmm Dcmdc for tbc pnsm -
AV for 50mm Drn*r for pnwn
+ 5 i h m k ~ - on sconc n
Fig. 36 Stress-strain relationships of Ohio Stone prism with 1/2/8 mortar.

Stress-strain curve for strong mortar with 200mrn Demec & 50rnm Demec gauges
- - -
Fig. 37 Stress-strain relationships of Ohio Stone pnsm with 110.2513 mortar.

The forth set of data points were the weighted average of al1 50 mm DEMEC
points as shown on the plots in Fig. 36 and Fig. 37, used to compare the modulus of
elasticity of the prisms obtained from the 200 mm DEMEC points. Both curves
confirmed a good match of the initial modulus of elasticity of the prisms between two
different sets of DEMEC data points. It was decided, therefore, in the phase II of the
final test program, only the measurement across the 200 mm length would be needed
to obtain the overall modulus of elasticity for the pnsms.
These two plots also showed the initial modulus of elasticity of both prisms
were approximately the same regardless of the mortar strengths. Both test results
showed the initial moduli of elasticity of the prisms were in the range of 7 800 MPa.
When compared with the basic modulus of elasticity of the Ohio stone, the initial
modulus of elasticity of the prisms did not appear to be affected by the strength, nor .
the modulus of elasticity, of the mortar.
Six strain gauges were mounted on each of the prisms to record the modulus of
elasticity of Ohio stone. The average modulus of the stone of these six sets of data
was 8.0 GPa. This was in good agreement with the 2-point load simply supported
beam test, and was also in good agreement with the separate testing carried out by the
National Research Council of Canadal2. This good agreement of results led to the
conclusion that strain gauges could be omitted in phase II of the test program.
Therefore, in phase II of the final test program, the measurement of the modulus of
elasticity for the masonry units would be done with the strain gauges rnounted on the

compressive testing specimens only and no strain gauges would be used on the
masonry units of the prisms.
Fig. 38 shows the plots of th: average values of stress-strain relationship of
Ohio stone as well as the vertical and the transverse directions of rnortar, using the
strain gauge data recorded during the compression testing of the pnsm made with
1/2/8 mortar. The modulus of elasticity of the mortar is interpreted as about 5.5 GPa,
and together with the transverse direction strain data, the value of Poisson's ratio is
calculated as about 0.14; this value is also in good agreement with the value of O. 15
used in the Finite Element Analysis simulations.
Fig. 39 shows similar plots of the strain gauge data of the Ohio stone prism
made with the U0.2513 mortar. The rnodulus of elasticity of Ohio stone was again
consistent with other tests conducted. However, the modulus of elasticity of the
mortar for this strong mortar was interpreted as 14.0 GPa with Poisson ratio recorded
as approximately 0.14.
The moduli of elasticity of these two different mortars are very different.
Furtherrnore, the values also differ quite significantly from the values obtained from
the compressive testing of their respective non-absorptive cube specimens.

Stress-straia relationship of Ohio Stone and 1/2/8 mortar
200 400 600 800 1000 1200 1400 1600
Strain (x 10" mmlmm)
--- Vertical strain gauges on rnortar --- Horizontal strain gauges on monar
- - - - - . . - - - - - - - - .- -- - - - -- - - .. - . . - - . .. . - -
Fig. 38 Average stress-strain relationships of Ohio Stone and 1/2/8 mortar in vertical and horizontal directions.

L
Stress-strain relationship of Ohio stone and 1/0.25/3 mortar
-- - - - - - - - - -
Vertical strain gauges on Ohio Stone --- Vertical ~train gauges on rnortar --- Horizontal ~train gauges on mortar
- - - - . --
n c3 r w Vi rn 2 Gî
-500 O 500 1 O00 1500
Strain (x 1 o - ~ mrnhm)
\
Fig. 39 Average stress-strain relationships of Ohio stone and 1/0.25/3 morta. in vertical and horizontal directions.

This is to be expected as it is well documented that the mortar strengths of
absorptive specirnens, and in the joints, are always higher than those of the non-
absorptive specimens. This response is further explained in detail in the recent
published papers authored by Stockl, Biewirth, and Kupfer4, and Stockl, Beckhaus
and ~ritsche'. They reported that not only the compressive strength measured in the
actual mortar joints can be four times that of the strength obtained from regular non-
absorptive specimens, the modulus of elasticity of the same mortar can differ up to
ten times depending on the testing method chosen.
They have suggested multiplying the standard test results obtained in
accordance to the German Standard D M 18555 by four to estimate the compressive
strength of the mortar joint; in this they have accounted for the effect of the water
absorption process of' the brick unit, and of the friction on the ngid loading platen.
However, they still have not proposed any formula for estirnating the effective lateral
confinement pressure experienced by the mortar.

9 Final Test Program - Phase II
9.1 Mortar Mixes and Masonry Units
After the results of the phase 1 test data had been reviewed, it was decided that
the range of the mortar strengths should be 2.0 MPa for the fow-end, and about 15
MPa for the high-end strength. These values are closely related to the Type "O"
rnortar for the low strength and Type "MW monar for the high strength mortar. Type
"K" mortar was not being considered as it would be a purely "lime/sand" mortar mix
and not likely to be representative for modem masoruy work.
Since the low-strength of the masonry unit was to have a low compressive
strength and most sandstones have compressive strengths of 65 MPa and higher, the
decision was made to select a solid restoration style clay brick. Afier searching '
several sources, it was decided to choose an American restoration brick with an
average compressive strength of about 30 MPa. This type of brick was newly
manufactured to the sizes and shapes of older bricks for the restoration of heritage
buildings, hence the name of restoration brick. As a high strength masonry unit of
about 100 MPa, a sandstone flagstone from a nearby quarry from the Province of
Quebec was selected. These two strength levels provided good lower and upper
strength limits for the masonry units.

9.2 Properties of Mortar Mixes
Further trial mixes of mortar with different compositions were prepared and
tested prior to the final composition being decided. The final mix for the low strength
mortar was 1/3/10 (PC/L/S), with a waterhinder ratio of 1.2. This mix produced an
average of 2.1 MPa compressive strength at 28 days and would be referred as the low
strength mortar. The high strength mix was 1/0.5/4 (PC/L/S), with a waterhinder
ratio of 0.9. This rnix produced an average of 14.4 MPa compressive strength at 28
days and would be referred to as the high strength mortar. As it was not the
controlling factor of failure for the prisms, the modulus of rupture for the mortar was
no longer tested in the phase II program. The mortars were mixed in a wheelbarrow
by a professional mason, who measured the portions of each component into the
wheelbarrow, dry mixed the mixture, and then added the pre-determined amount of
water slowiy while rnixing the mortar.
9.3 Construction of Prisms
For compati bi lity reasons, the dimensions of the flagstone units were chosen
as 90 mm x 90 mm x 30 mm to closely match the sizes of a quater of a brick. To
ensure good quality of cutting, both flagstone and restoration bricks were cut by a
local commercial cutting facility in Ottawa. The final dimensions of the restoration
bricks were 90 mm x 90 mm x 27 mm thick due to the thickness of the cutting blade.
The mason mixed one batch of mortar at a tirne, using the wheelbarrow
available at the laboratory as shown in Photo 12. Both the fiagstone prisms and the

restoration brick prisms were constnicted using the same batch of mortar. The
procedure was then repeiited for the other mortar. Six prisms for each combination
were constructed al1 in the same day.
The prisms were eight units high, with standard 10 mm joint thickness. In
order to ensure good quality of workmanship, the same professional mason who
prepared the mortar was retained to constmct these prisms. A jig marked with the
height of each unit was used throughout the construction of prisms to ensure
uniformity of the joints. Fig. 40 shows the typical arrangement of prisrns while
Photos 13 and 14 show typical prism construction of flagstone and restoration bricks.
Photo 15 is a close-up view of several joints of the flagstone prism to show the
moisture being drawn fiom the mortar into the flagstone. This moisture absorption
process enhances bonding benveen the mortar and the masonry units. However, this
same process also alters the properties of the mortar in the prism assemblages.
The prisms were then stored in the laboratory wrapped in plastic for 7 days of
moist curing, and then under laboratory conditions of about 20" C and 30 to 50
percent relative humidity for another 20 days.
One prism from each combination was trial tested on the Wh day after
construction to record the approsirnate failure loading of each combination. This
information was used to predict the final failure load of each combination of prisms.
The final testing of prisms was carried out on the 28" or 29'h day afier construction.
Since the properties o f the masonry units do not change, but the mortar strength will

increase over time, the prisms with the same mortar mix were tested on the same day.
That is, al1 £ive stone prisms with weak mortar and al1 five brick prisms with the same
mortar were tested on the 28" day, and al1 ten prisms with strong monar were tested
on the 2gth day.
9.4 Test Procedure
The prisms were tested in the 400-kip universal testing machine at the
Structural Laboratory of Carleton University with two sets of LVDTs mounted on
frames. These metal frames were custom-made by a local tool and die Company to
ensure precise a l i m e n t of anchoring points and therefore accurate LVDT recording.
Fig. 41 shows the schematic arrangement of prisms and the location of LVDTs for the
recording of the stress-strain relationship of the prism, and Photo 16 shows the
mounting frame with the LVDT already in place. The mounting frames were spaced
consistently at 200 mm by inserting a set of fixed length timber spacers behveen
frames for each prism as shown in Photo 17. Each pnsm was then tested with 12 mm
fibreboard behveen end platens of the testing machine as shown in Photo 18. Each
prism was subjected to the same loading rate of 0.05 kN per second to ensure a
consistent loading rate for each prism. The loading and LVDT displacements were
recorded at every second interval during the testing period of each prism, with the
cornputer program for LVDT recordings pre-programmed to have 200 step
increments per inch accuracy.

Photo 12 Photograph showing the mortar mix was dry-mixed thoroughly before water was added.

Applied Load
Location of measuring point using LVDT's
Location of measuring , point using LVDT's
Reaction Table
Fig. 40 Typical prism arrangement in Phase II test program.

Photo 13 Typical construction progress of prism with flagstone.

Photo 14 Typical construction progress of prism with restoration bricks.

Photo 15 Close-up view of mortar joints showing the moisture absorption process.

onar
Point
Reaction Table
l
-Fibre board
Fig. 41 Schematic arrangement of LVDTs on the test prism for strain measurement.

Photo 16 Typical arrangement of LVDTs mounted on the special frames.

Photo 17 Fixed length timber spacers are used to ensure constant LVDT spacing.

Photo 18 Prism arrangement in loading machine.

10 Phase II Test Results
10.1 Properties of Masonry Units
The primary properties of the masonry units used in the final testing program
are presented in the next sections.
10.1.1 Restoration Brick
The compression tests were carried out with the Tinius-Olsen 400-kip
universal testing machine in the Structural Laboratory of Carleton University. The
compressive strength of the restoration brick was 33.0 MPa obtained by averaging the
compressive test results of three 5Omm cube specirnens. The modulus of elasticity of
the brick was 14.0 GPa calculated from the stress-strain data recorded with the strain
gauges mounted on the brick specimens during compressive stren-g$h testing. Fig. 42
shows a typical plot of the stress-strain relationship of the brick. The tensile strength
of the brick was 4.0 MPa calculated from split-tensile tests on two 57 mm x 90 mm x
90 mm specimens. This represents 12% of the compressive strength of the brick.
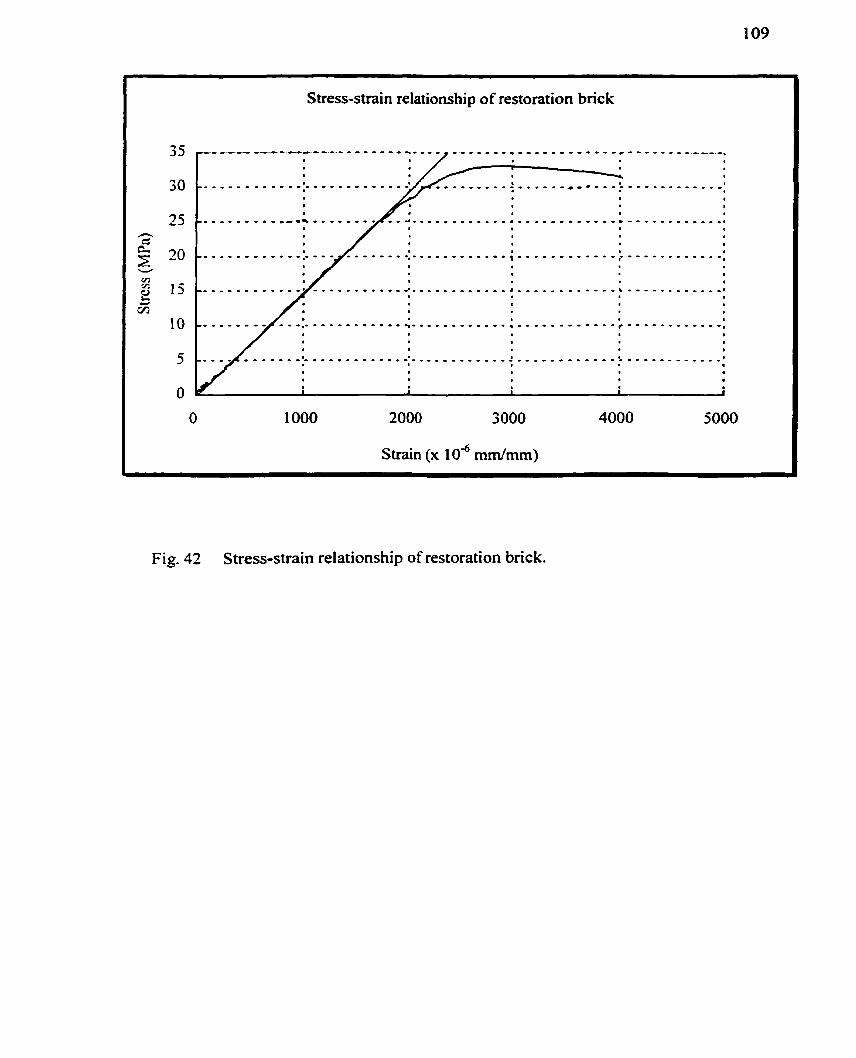
Fig. 42 Stress-strain relationship of restoration brick.
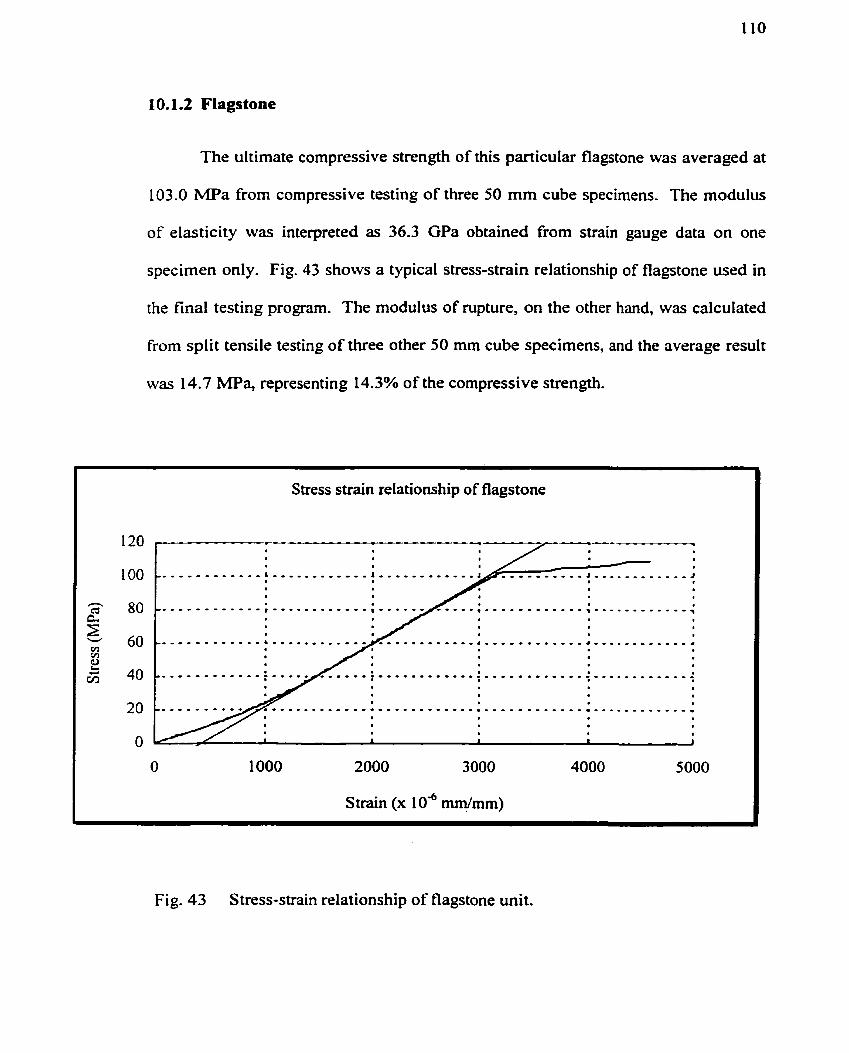
Flagstone
The ultimate compressive strength of this particular
103.0 MPa from compressive testing of three 50 mm cube
of elasticity was interpreted as 36.3 GPa obtained from
flagstone was averaged at
specimens. The modulus
strain gauge data on one
specimen only.
the final testing
Fig. 43 shows
program. The
a typical
modulus
stress-strain relationship of flagstone used in
of rupture, on the other hmd, was calculated
from split tensile testing of three other 50 mm cube specimens,
was 14.7 MPa, representing 14.3% of the compressive strength.
and the average result
Stress strain relationship of flagstone
2000 3000
S train (x 1 0' mm/mm)
Fig. 43 Stress-strain relationship of flagstone unit.

10.2 Properties of Strong Mortar
The 28-day compression test result of the strong mortar (U0.94) revealed that
the average compressive strength of six 50 mm cube specimens was 14.4 Mpa; this
result was confirmed by compressive testing of 75 mm diameter by 150 mm high
cylinders. The stress-strain relationship of the cylinder testing is shown in Fig. 44 and
the ultimate strength was 13.7 MPa. The modulus of elasticity of the mortar was
interpreted using this stress-strain relationship recorded with the LVDT mounted on
the cylinder specimen during the compression test. Photo 19 shows the testing set up
of the LVDT on a cylinder specimen; the average modulus of elasticity was
deterrnined as 10.8 GPa.
10.3 Properties of Weak Mortar
Fig. 45 shows the stress-strain relationship of the weak mortar; based on 75
mm diameter by 150 mm high cylinders, the compressive strength of this mortar was
1.9 MPa while its Young's modulus was interpreted as 8.0 GPa. The average
compressive strength of six 50 mm cube specimens was, however, averaged as 2.1
MPa.

Stress-strain curve for 1 /OS14 mortar
Strain (x 1 o4 mm/mm) -
Fig. 44 Stress-strain relationship of strong ( 1 /O.5/4) mortar.
Stress-strain curve of l/S/I O mortar
4000 6000
Strain (x 1 0" mmhm) -
Fig. 45 Stress-strain relationship of weak (l/Y 1 0) mortar.
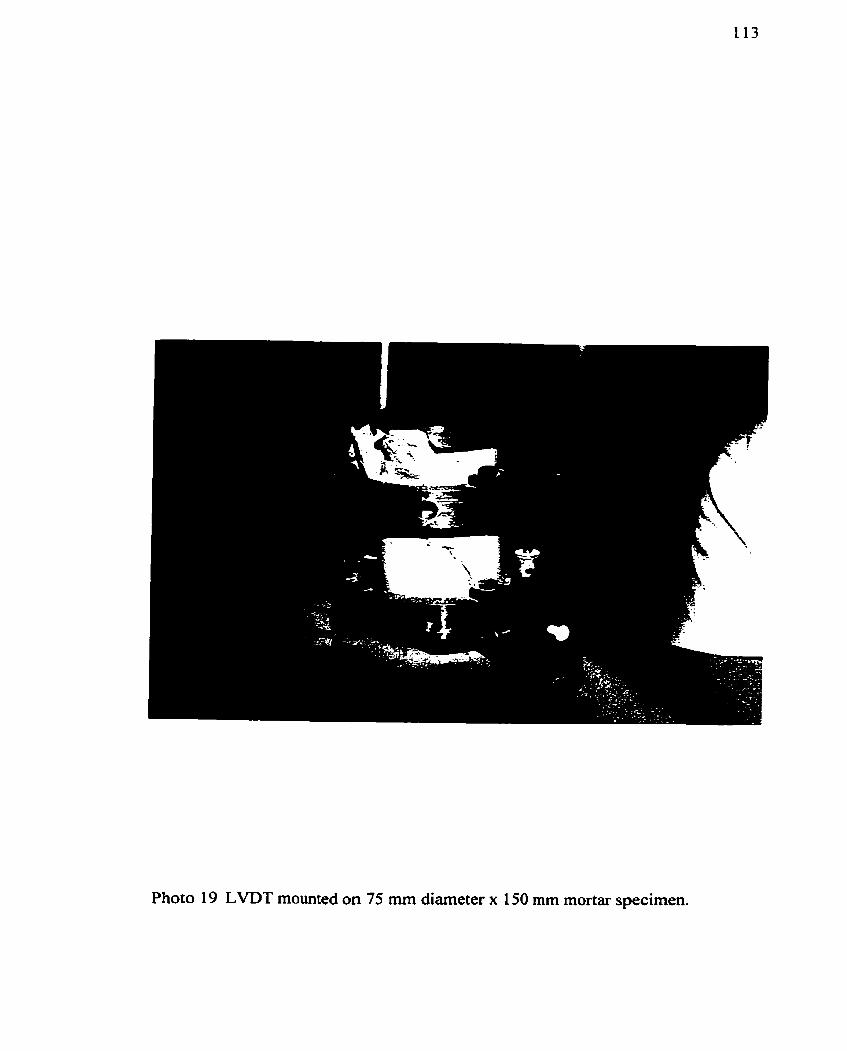
Photo 19 LVDT mounted on 75 mm diameter x 150 mm mortar specimen.

10.4 Compressive Test Results of Prisms
The final test resutts of the prisms are plotted in Figs. 46 to 49. The computer
prograrn used in the collection of data had fixed increment steps for the LVDT
displacements. The accuracy of the LVDT recording by the cornputer was limited to
200 divisions per inch, Le. a continuous interpretation of the displacement of the
LVDT was not possible. This resulted in data points which were tmncated down to
the lower increment or rounded up to the next higher increment, and caused slight
zigzagging of data points along the curves.
Fig. 46 shows the plots o f the stress-strain relationships of the prisms for the
flagstone with strong mortar. The average compressive strength of the prisms was
4 1 .O MPa and the average modulus of elasticity was 1 1.3 GPa. Al1 five stress-strain
curves were extremely similar and so were their ultimate strengths, indicating very
low variability among these prisms.
Fig. 47 shows the stress-strain relationships of the prisms for the flagstone and
weak mortar. The compressive strength of the prisms \vas averaged as 34.0 MPa, and
the associated initial moduli of elasticity were interpreted as between 4.8 GPa and
10.2 GPa with a mean value of about 7.4 GPa. Although al1 five stress-strain curves
were also very similar with very low variability among these prisms, the
interpretation of the modulus of elasticity could be very subjective depending on the
individual engineer. The stress-strain curves of these prisms did not exhibit a typical

ascending and slow descending before failure; they followed a fairly consistent
smaller modulus of elasticity once the stresses passed beyond 6.0 MPa. FinalIy,
sudden rupture took place at fairly similar ultimate failure stresses.
The average ultimate strength of the brick prisms with strong rnortar was 13.8
MPao and the moduli of elasticity could be interpreted between 4.3 and 7.1 GPa with
an average of 5.7 GPa as shown in Fig. 48. Prism 1 was discarded in the averaging
due to a pre-cracked condition in one of the bed joints. The bottom sections of the
stress-strain curves were discarded in the determination of moduli.
The average compressive strength of the brick prisms with weak mortar was
1 1 .O MPa, and the moduli of elasticity were between 2.8 GPa and 5.7 GPa depending
on the interpretation of the initial tangent of the curves as shown in Fig. 49. This set
of data was the least consistent in terms of their ultimate strengths and their moduli of
ehsticity, although the average was interpreted at 4.3 GPa.
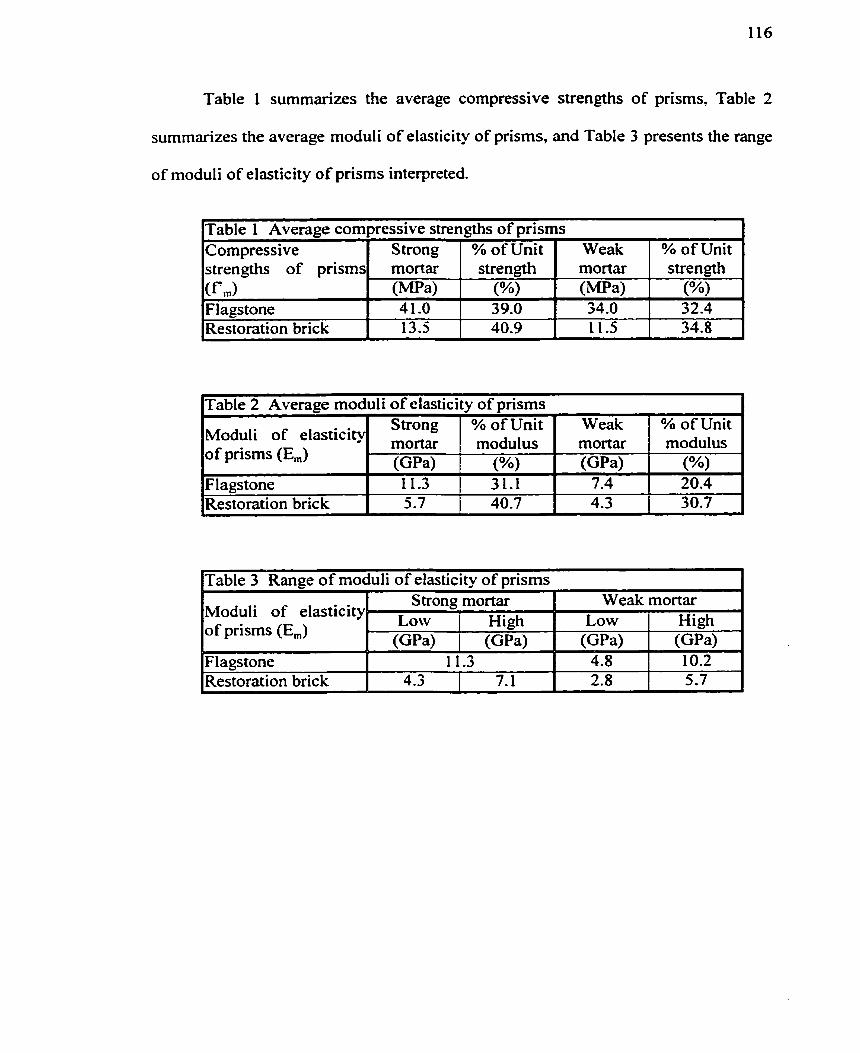
Table 1 summarizes the average compressive strengths
summarizes the average moduli of elasticity of prisms, and Table
of moduli of elasticity of prisms interpreted.
of prisms, Table 2
3 presents the range
% of Unit strength
Table 1 Average compressive strengths of prisms Weak mortar ( M W
Compressive strengths of prisms (Fm)
Table 2 Average moduli of elasticity of prisms
Table 3 Range of moduli of elasticity of prisms
Flagstone Restoration brick
Strong rnortar ( M W
% of Unit modulus
("A) 1
20.4 30.7
Moduli of elasticity of prisms (E,)
Flagstone Restoration brick
% of Unit strength
(%)
Weak mortar (GPa)
7.4 4.3
Moduli of elasticity of prisms (E,)
Flagstone Restoration brick
34.0 11.5
41.0
Strong monar (GW 11.3 5.7
S trong mortar
39.0
% of Unit modulus
(%) 31.1 40.7
Weak mortar Low
(GPa) Low
(GPa) 4.8 2.8
High ( G W
13.5
High ( G W 10.2 5.7
40.9
11.3 4.3 7.1

Fig. 46 Stress-strain curves for flagsstone pnsms with strong mortar.
Stress-strain curves of stone pnsms with 1/3/10 mortar
0.004 0.006
Strain (mrnhm)
- - --
Fig. 47 Stress-~train curves for flagstone prisms with weak mortar.

Fig. 48 Stress-strain curves of brick prisms with strong mortar.
Stress-strain curves of brick prisrns with 1/3/10 rnortar
0.004 0.006
Strain (mm/mm)
Fig. 49 Stress-strain curves of brick prisms with weak mortar.

Photos 20 and 21 show two typical failed brick prisms, and Photos 22 and 23
show some typical failed stone prisms. In al1 cases, the splitting of the masonry units
is very clear, agreeing with the reported failure mechanism of masonry prisms. Photo
23 fùrther captured the instant of the failure of a prism. The sudden release of energy
caused the near explosion of the stone units.

Photo 20 Typical brick pnsm faiiure mode.

Photo 2 1 Typical brick prism exploding at failure.

Photo 22 Typicai flagstone prism îàilure mode.

Photo 23 Typical Stone prism explosion at failure.

II Discussion of Results
1 1 .l Phase I Testing
Since the phase 1 test program was only designed to help arrive at the
parameters for the phase II test program, there were an insufficient number of prisms
built to have any statistical reliability. However, the knowledge gained was still
valuable in designing the phase II test program.
First of all, the modulus of elasticity of the masonry units was consistent
behveen different test methods. Therefore, it was not necessary to use strain gauges
on the masonry units on the prisms in phase II testing to obtain the modulus of
eiasticity of the units. The modulus of elasticity of masonry units could be
determined from simple compressive testing of units, with strain gauges mounted on
the test specimens.
Secondly, the determination of the modulus of elasticity of mortars proved to
be much more complicated than this testing program could measure. Therefore, the
attempt to measure the modulus of elasticity of the mortar in the prisms was omitted
due to lack of suitable instrumentation and equipment available at the time of testing.
This phenomenon was later confirmed by the German researcher ~tockl ' .~ after the
testing program for the thesis was completed. Stock1 et al. concluded that there
appear to be three different zones across the vertical plane of the mortar joint in a

prism. The top zone, the middle zone and the bottom zone each had its own distinct
properties in tenns of their compressive strengths and moduli of elasticity. They
compared the results by testing the bed joint mortar taken from the actual prism and
loaded with steel brush platen to eliminate the frictional effect of the platens and
effects from non-absorptive specimens.
It was due to unique "clipsn utilised in their testing program they were able to
obtain the modulus of elasticity of the mortar across the bed joints in the prisms.
They concluded that the modulus of elasticity of the sample taken out from bed joint
mortar was 5 to 15 times higher than the results obtained from specimens prepared
using regular non-absorptive moulds for the sarne mortar mix. This explains the
unexpected result of the phase 1 test prism with high strength mortar which actually
had a higher modulus of elasticity in the mortar joint than that of the overall prism.
The test prism with low strength mortar was so low in compressive strength, the
modulus of elasticity of the mortar in the bed joint actually exceeded the overall value
of the prism.
Thirdly, the use of 200 mm DEMEC gauges for the measurement of the
modulus of elasticity of prisms was confirmed by the weighted average of the 50 mm
DEMEC gauges. The results obtained using these two different DEMEC gauges were
exactly the same; i.e., the 200 mm DEMEC gauges proved to be just as effective as
the weighted average of 50 mm DEMEC gauge measurernents in measuring the
overall modulus of elasticity of prisms. Therefore, LVDT's with proper mounting
frames with anchoring points spaced at 200 mm could be used to obtain the modulus
of elasticity of the prisms.
Fourthly, the modulus of rupture value of the masonry units was essential for
the computer simulation, but neither the compressive strength nor the modulus of
rupture of the mortar played a role. The modulus of rupture of masonry units was a
piece of important data needed in the computer simulation to detennine the failure
load of the prisms, but the ultimate compressive strength of mortar derived from the
non-absorptive moulds was not needed.
11.2 Cornputer Simulation Results
The computer simulation provided a valuable tool in understanding the
behaviour of the masonry pnsms, especially when different parameten could be
entered to simulate different situations. Unfortunately, however, there are just not
enough research data available to fully utilize the finite element analysis program to
understand the behaviour of the mortar and unit interface in the prisms. In their
separate respective tests, Beckhaus and Fritsche2' measured the modulus of elasticity
with the same mortar type in the bed joints of prisms and found startling results when
compared with the current German code. Beckhaus found the rnodulus was averaging
4500 MPa while Fritsche found the rnodulus was between 700 to 1200 MPa
depending on whether the voids in the bricks were taken into account or not.
Compared to the estimated value of 11 000 MPa that the German code allowed for
that combination of brick and mortar, Beckhaus and Fritsche's results were extremely

low. They representing only approximately 35% to 10% of the code provision, thus
making the computer simulation in this thesis very difficult as there are simply too
rnany unknown variables. Until a better understanding of the properties of mortar in
the actual bed joint is achieved in ternis of its strength and modulus, simulating the
true behaviour of prisms in cornputer programs is virtually impossible.
The A N S Y S finite element analysis program has the capability of simulating
crushing failure of the elements, and the program checks the stress of every element
to find if any reaches the crushing stress that was input. When the element reaches the
crushing stress, the program would interpret that element has cracked. Since the
computer program does not have the capability to account for the effective lateral
compressive pressure provided by the masonry units, the increase in crushing strength
of the mortar is not being accounted for in the simulation. Thus when the elements in
the mortar reach the specified crushing stress, the program would interpret that the
mortar has failed, thus prematurely halting the simulation process. The crushing
strength of the mortar \ a s eventually deleted altogether from the input data in order
to achieve more realistic prism strengths.
The moduli of elasticity for masonry units and mortars were needed to
simulate the deformation of the model. The modulus of rupture of the rnasonry unit
was needed to simulate the splitting (cracking) failure of the model. Since the
elements did not have any reinforcing steel, any "cracking" of an element would
cause non-convergence failure of the program. Therefore, as far as the simulation

using finite element analysis program is concemeâ, the modulus of rupture of the unit
is the most important piece of data required.
However, it was clear from the simulation results that it was the combination
of the properties of masonry unit and mortar that determines the strength and the
modulus of elasticity of the prism. Isolating the properties of individual elements in
the pnsm simply did not yield rneaningful results. This emphasizes the need to devise
testing prograrns to give proper input data for the cornputer simulation process to
work properly in the future.
1 f .3 Phase Il Testing
The compressive strength o f the prisms in the phase 11 test program depended
mainly on the tensile strength of the masonry unit, but not so much on the strength of
the mortar. The prism always failed by tensile splitting of the masonry units in
laboratory testing; however, the tensile strength of the masonry unit can be correlated
with the compressive strength of the units. The flagstone prisms had average
compressive strengths between 34.0 to 41.0 MPa with the associated low and high
mortar strengths of 2.1 M'Pa and 14.4 MPa. The ratio of the high strength to low
strength mortar is 685%, but the increase of the strength of the prisms is only 20.6%.
The low strength restoration brick prisms exhibited a similar relationship. The
average compressive strengths o f the brick prisms were avenging 1 1.5 MPa with the
low strength mortar and 13.5 MPa with the high strength mortar. An increase of only

14.7% in prism compressive strength was obtained while the mortar strength
increased 685% as noted before.
The strengths of the prisms represent 33.0% of the flagstone unit strength
when low strength mortar was used and 39.8% when high strength mortar kvas used;
similarly, the strengths of the prisms represent 35.5% of the strength of the restoration
bricks with the low strength mortar and 40.9% with the high strength mortar.
This relative minor influence of mortar strength on pnsm strength is in
agreement with the statement made by S. I. Lawrence, and G. T. caoI6 that "there is
n general misconception among practitioners that increasing the quantity of cernent
will reszrit in higher strength. " There is the same general misconception that a
stronger mortar will result in a stronger structure. In order to increase the strength of
the mortar, more cement is usually added to the mortar. This will not only reduce the
workability of the mortar, it will also increase the shrinkage of the mortar thus
increasing the risk of separation cracking behveen the mortar and the units at both bed
joints and head joints. This separation cracking, if developed, would be harmfùl to
the structure as water may penetrate into the joints. Freeze-thaw problems and other
water related problems could occur. Therefore, the compatibility between mortar and
masonry unit is much more important than mortar compressive strength alone.
Compatibility such as water absorption rate of masonry units and workability of
mortar to ensure good bonding is much more important than the increase of the
strength of the mortar.
Furthemore, the current Canadian standard" for unit strengths of over 90
MPa and Type S rnortar, provides for a strength of 25 MPa as specified in Table 3 of
CSA S304.1-M94, the prisms built with flagstone and the strong mortar achieved 41
MPa which is well in excess of the CSA standard's 25 MPa requirement. Even with
the low strength mortar, the stone prism strength was averaging at 34 MPa. Note
however, that CSA requirernent is intended for solid bricks. The Standard recognizes
that stone units may not behave exactly the same as solid bricks and requires the
designer to carry out prism testing to find the appropriate compressive streagth. The
same holds true for the prisms built with restoration brick; the interpolation of Table 3
from CSA S304.1-M94 leads to a specified compressive strength of prisms of 11.5
MPa for 33 MPa bricks and Type S rnortar. The test results of the brick prisms made
with low strength mortar, which had a compressive strength of less than 2.0 MPa,
aIready achieved this strength. This shows the current Canadian Standard is
conservative in ternis of assessing the compressive strength of the prisms. This
consemative assessment of the ultimate strength of the structure is necessary for the
safety of the structure when no prism testing program is conducted for a particular
project. Table 4 summarizes the measured results in this thesis and the CSA
provisions.

I
Table 4 Compression strength cornparison of CSA estimations and Phase II test results
P r im Combination 1 CSA estimates / test 1 Difference 1
results
By testing prisms with either DEMEC gauges or LVDTs, the overall
deformational behaviour of prisms can be studied, but this information still does not
yield a proper understanding of the behaviour of the mortar at the interface. In the
phase 1 testing, the modulus of elasticity recorded by the strain gauges mounted in the
mortar joints of the 1/0.25/3 mortar actually showed a higher modulus than the Ohio
stone, and therefore, the prisms. This phenornenon can only be understood with the
aid of Stockl's recently published paper. Further detailed studies of the bed joint
rnortar must be developed in order to gain a better understanding of the mortar joint
behaviour.
F1agstone
Restoration Brick
Unlike the strength of the prisms, which were between 30-40% of the strength
of the masonry unit, the interpretation of the moduli of elasticity of the prisms was
much more subjective. In many cases, the interpretation could be made within a wide
range and a single value of modulus for that particular combination of masonry unit
and mortar could not be assigned without knowledge of the variability. The
variability increased as the compressive strengths of the individual components
( M W 25.0 NIA
Strong mortar ~ e a k rnortar
1 I 1
(MPa) 4 1 .O 34.0
(%) -39.0 NIA
Strong mortar rnortar
11.3 N/A
13.5 11.5
- 16.3 N/A
decreased. The least variable set of data for the modulus was found in the high
strength unitktrong mortar combination, and the greatest variable set was found in the
low strength unitheak mortar combination. However, the average initial modulus of
elasticity appears to be the in the same range for a given masonry unit regardless of
the mortar strengths.
The wide range of modulus of elasticity of prisms clearly indicates the
difficulties researchers face in their attempt to determine the prism modulus
accurately. As discussed earlier, the strengths of mortars increased quite significantly
in the prisms compared with the traditional cube strengths from non-absorptive
specimens. An increased strength of mortars would inevitably increase the modulus
of elasticity of the mortar.
Stock1 et. al. concluded that different specimen types or testing methods would
produce different moduli of elasticity for the sarne mortar. The rneasured values of
the modulus of elasticity of mortar made with non-absorptive moulds were very much
different from the results obtained from testing the actual mortar joints. The -
difference was attributed to the moisture absorption process of the monar in the joints
of the prism, and it was this difference which caused the basic properties of the mortar
obtained from the non-absorptive moulds to be virtually useless.
Although water absorption appears to be a simple process, it depends on many
different factors. Firstly, it depends on the water content of the mortar. Obviously if
the mortar is too dry, there is an insufficient amount of water that cm be absorbed by

the units. On the other hand, if the mortar is too wet, the mortar wiii be too sofi even
after some of the water is absorbed by the units. Water absorption also depends on
the rate of absorption of the masonry units, the environmental conditions such as
temperature and relative humidity at the job site, and moisture lost by evaporation. C.
~ e a l l " explains these factors in detail in her book "Masonry Design and Deraifing".
The extra strength gained by adding too much Portland cernent to the rnortar
may even have an adverse affect on the overall performance of the prism. An
excessive amount of cement usually reduces the workability of the mortar and thereby
increases the chance of poor workmanship in both head and bed joints. Furthemore,
even if the joints were forrned properly, the shrinkage due to an excessive cernent
content might cause separation cracking in the joints. A11 these would contribute to a
worse overall performance of the structure than with relative low strength mortar but
good bonding between the mortar and the masonry units.
The modulus of mortar itself was extremely difticult to measure accurately. L.
Binda et al." also stated that the measurement of the mortar modulus was difficult
using conventional testing methods and hence developed a totally different method to
measure the modulus of elasticity of masonry prisms. Their use of electronic speckle
pattern interferometry (ESPI) offered good agreement with the strain gauge
measurement on mortar specimens, therefore this technique may become a useful tool
in measuring the modulus of elasticity of mortar in view of the fact that direct
measurements were so difficult.

J.J. Brooks and B.H. Abu Baker" proposed a simple estimating formula for
the modulus of elasticity for clay brick prisms. Using their formula, the estimated
modulus of elasticity for the brick/strong mortar prisms would have been 1 1.9 GPa
assuming 10% water absorption by the bricks. The measured range for this
combination in this thesis was between 4.0 to 6.0 GPa; this represents close to a 295%
and 198% over-estimation of the actual measured values. When compared with the
bricWweak mortar prisms, the estimating formula would have given the modulus of
the prisms as 5.2 GPa, which lies within the measured range of between 3.8 GPa to
6.4 GPa. Appendix B shows the calculation of the moduli of elasticity of different
bricWmortar combinations. Stone prisms were not compared as the proposed formula
was developed for brick prisms. However, the large error percentage for the
bricldstrong mortar combination further confirms the need for more systematic
research on the modulus of elasticity of masonry.
The current Canadian standard" allows the moduli of elasticity be estimated
by multiplying the compressive strength of prisms by 850 for clay bricks. Using this
estimating method, the modulus of elasticity of the prisms with the restoration
bricldstrong mortar combination would be 11.5 GPa (850 x 13.5MPa) compared to
the test result of 5.7 GPa, and 9.8 GPa for the bricldweak mortar combination with the
measured result of 4.3 GPa. The CSA does require prism testing be done for
estimating the modulus of elasticity for Stone masonry structures. Table 5 shows the
cornparison of the average moduli of elasticity of prisms from the phase II test results
and the CSA estimations. The Canadian Standard's estimating method is clearly not
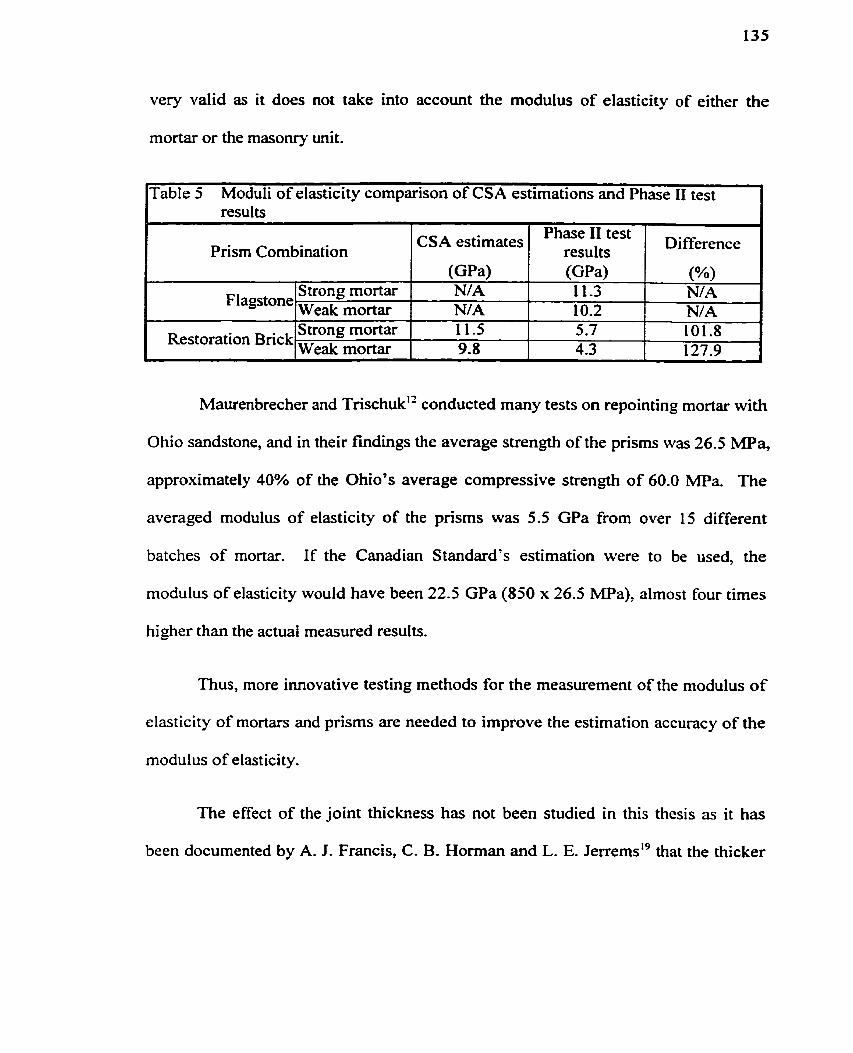
very valid as it does not take into account the modulus of elasticity of either the
mortar or the masonry unit.
TabIe 5 Moduli of elasticity cornparison of CSA estimations and Phase II test resul ts
v
Maurenbrecher and ~rischuk" conducted many tests on repointing mortar with
Prism Combination
Ohio sandstone, and in their findings the average strength of the pnsms was 26.5 MPa,
F lagstone
Restoration Brick
approximately 40% of the Ohio's average compressive strength of 60.0 MPa. The
CSA estimates
( G W N/A N/A 11.5 9.8
S trong mortar Weak mortar S trong mortar Weak mortar
averaged modulus of elasticity of the prisms was 5.5 GPa from over 15 different
batches of rnortar. If the Canadian Standards estimation were to be used, the
Phase II test results ( G W 11.3 10.2 5.7 4.3
modulus of elasticity would have been 22.5 GPa (850 x 26.5 MPa), almost four times
Di fference
(%) NIA N/A 101.8 127-9
higher than the actual measured results.
Thus, more innovative testing methods for the measurement of the modulus of
elasticity of mortars and prisms are needed to improve the estimation accuracy of the
modulus of elasticity.
The effect of the joint thickness has not been studied in this thesis as it has
been documented by A. I. Francis, C . B. Horman and L. E. J e r r e rn~ '~ that the thicker

the joints, the lower the strength of the prism; the current Canadian Standard to some
extent recognizes this effect as the standard joint thickness is specified as 10 mm.

12 Conclusions
With the relatively recent development of high strength concrete, it is tempting
for designers to '3ump" to the conclusion that a higher monar compressive strength
will automatically yield a higher overall strength of an element in masonry structures.
With the results of this research, however, it is clear that this may not necessarily be
true. Based on the results of this research, the following conclusions c m be drawn:
1. The compressive strength of prisms is influenced very little by the strength of the
mortar. When the compressive strength of the mortar was increased 685%, the
increase of prism strengths were only 20.7% and 14.7% for stone prisms and brick
prisms respectively. Therefore, the structural engineer should specify the proper
mortar for good compatibility with the masonry units, good workability, suitable
water retention, and suitable air content, without umecessarily over-designing the
strength of the mortar.
2. The influence of the mortar strength on the modulus of elasticity of prisms is
again very small. The brick prisms had virtually the same initial tangent modulus
of elasticity for both high and low strength mortars. Furtherrnore, the initial
tangent modulus of elasticity for the stone prisms were also very similar
regardless of mortar strengths, although modulus for the prisrns with low strength
mortar started to fa11 off quite rapidly at a relatively low stress level. This thesis

shows that the modulus of elasticity of prisrns is mainly controlled by the
properties of the masonry units.
3. The interpretation of the moduli o f elasticity for the prisms is very subjective.
Until there is a reliable method of measuring the properties of the mortar in the
prism, the interpretation will always be subjected to a high degree of variability
even when al1 the individual components rernain unchanged.
4. The process of water absorption during laying and curing reduced the
waterhinder ratio of the mortar and significantly changed the properties of the
hardened mortar in the prisms. The relatively minor increase in compressive
strength and the similarity of the moduli of elasticity of the prisms suggests that
the properties of the hardened mortars may be very similar despite their difference
in properties when tested using non-absorptive moulds. The true properties of the
hardened mortars remain very difficult to determine.
5 . The computer simulation confirmed the flow of forces and stresses within the
prism and the cracking mechanism of the pnsm in agreement with laboratory
observations. The computer simulation confirmed that the modulus of rupture of
the masonry unit is the most important piece of information required in initiating
the failure of prisms.
6. The computer simulations confirmed that the critical properties of the mortar are
Poisson's ratio and modulus of elasticity, and not the compressive strength of the
mortar. As observed from laboratory testing, the failure mechanism of the prisms
is always initiated by the splitting of the masonry units. This observation led to
the omission of the mortar's compressive strength in order to simulate the proper
failure mechanism. Therefore, the compressive strength is irrelevant as far as the
computer simulation is concerned, at least until the effective confining pressure of
the mortar can be quantified.
7. Other important factors for the computer simulation are the relative differences of
the Poisson's ratio between masonry units and rnortar, and the relative difference
of the moduli of elasticity between masonry units and mortar. The Iarger the
difference of their relative Poisson's ratios, the lower the compressive strength of
the prism. The same holds m e for modulus of elasticity, i.e. the larger the
difference, the lower the strength of the prism.
8. The lack of measuring techniques of the mortar properties in the bed joints makes
it difficult to assign proper values for a computer simufation. Any attempt to
assign a simple value to the mortar would be wrong. Although the mortar is
understood to be experiencing uniaxial compressive stresses during a simple
compressive loading of a prism, the effective confining pressure of the mortar
cannot be assigned as there is no quantifiable value available at the present time.
9. Finally, the current CSA Standard, similar to other countries' standards and the
Australian Standard reported by Page and Brooks6, underestimates the strength of
the prism assemblage with certain masonry unithortar strength combinations to

ensure safe design of stmctural elements, yet generally overestimates the modulus
of elasticity of the prisms. While the CSA Standard restricts the use of the simple
estimating formula for the modulus of elasticity of masonry to clay bricks and
concrete unit, the Standard's formula does not take into account either the
modulus of elasticity of the unit or the mortar. The current work has shown that a
better understanding of the mortar joint properties is needed to accurately estimate
the modulus of elasticity of prisms.
Future research is recornrnended in the following areas:
1. Since the properties of mortar in the prisrns are changed significantly by the
moisture absorption process, there is a need for better testing procedures to
measure the properties of mortar properly. This includes the measurement of the
compressive strength as well as the modulus of elasticity of the hardened mortar.
2. Although it is generally accepted that the mortar in the prism assemblage is
subjected to tri-axial compressive pressures when the prism is loaded uni-axially,
there appears to be little if any research undenvay to quantify the equivalent
lateral confining pressure. This information, if avaiiable, will definitely enhance
the understanding of the prism behaviour by either cornputer simulation or
laboratory testing.
3. Poisson's ratio of both the masonry units and mortars are also important to
determine the uItirnate strength and modulus of elasticity of prisms in the
cornputer simulation. Therefore funire research should include the study of the
variability of Poisson's ratio especially within a hardened mortar joint close to and
away from the unit interface.
4. The recording of strain using LVDT's was carried out with an accuracy of 200
divisions; this resulted in al1 the stress-strain curves not being smooth but rather
"toothed". The cornputer program used for data recording should be refined to
achieve better accuracy of the strain data.

1 Appendix A
Materials used in final test prograrn - Phase I
Masonry Unit:
Ohio stone
S ize: lOOmm x lOOmm x 80 mm
Supplier: Plouffe Park, Public Works Canada Materials Depot
Cernent:
Manufacturer: Federal Cernent Ltd.
Type: Type 10
Colour: White
Lime:
Manufacturer: Bondcrete
Type : Type SA (Type S with Air entrainment)
Sand:
Manufacturer: George Drummond Ltd.
Type: Aggregate sand for construction
Table Al Mortar mix proportions for Phase 1 test program Mortar Type 1 Cernent 1 Lime 1 Sand 1 Waterhinder ratio - -
1 ~ t r o n e mortar 1 1 1 0.25 1 3 0.89 1 V 1 1 1 1
- -
8 Weak mortar 1 1 1 0.90 1 2
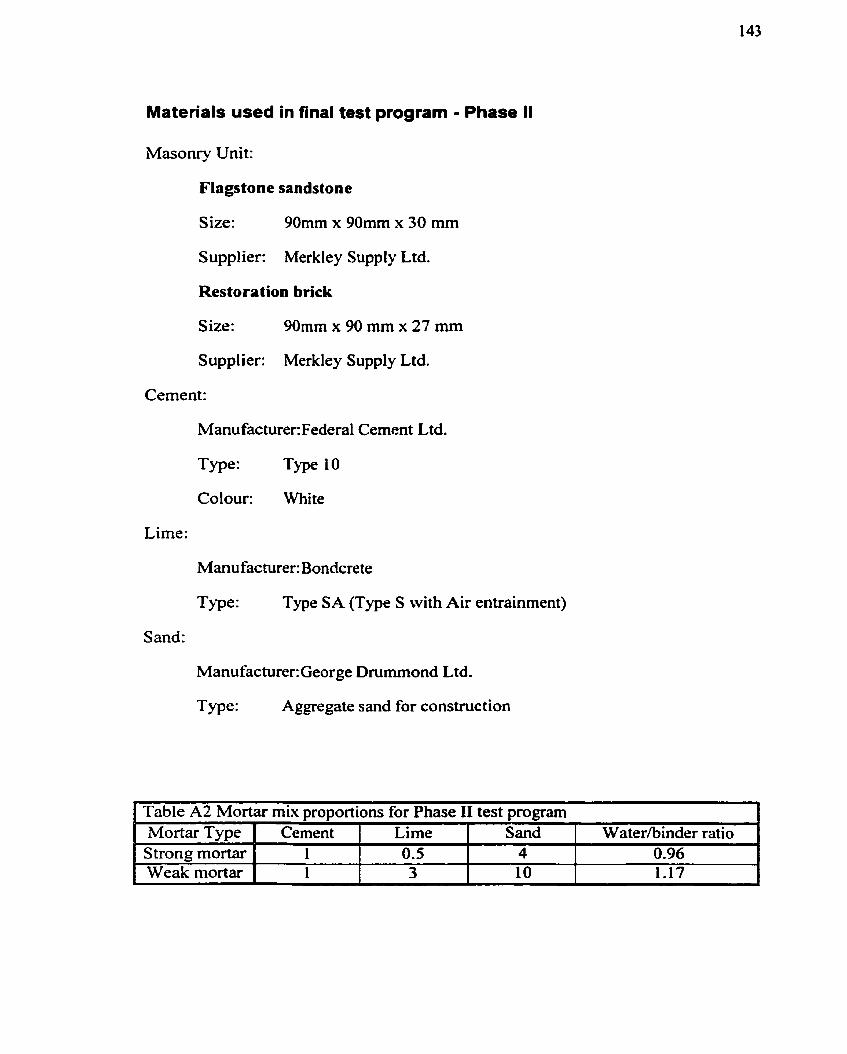
Materials used in final test program - Phase II
Masonry Unit:
FIagstone sandstone
S ize: 90mm x 90mm x 30 mm
Supplier: Merkley Supply Ltd.
Restoration brick
S ize: 90mm x 90 mm x 27 mm
Supplier: Merkley Supply Ltd.
Cernent:
Manufacturer: Federal Cernent Ltd.
Type: Type 10
Colour: White
Lime:
Manufacturer: Bondcrete
Type: Type SA (Type S with Air entrainment)
Sand:
Manufacturer:George Drummond Ltd.
Type: Aggregate sand for construction
Table A2 Mortar mix proportions for Phase II test program 1
Mortar Type 1 Cernent Strong mortar Weak mortar
Lime 1 Sand 1 Waterlbinder ratio I 1
0.5 3
4 10
0.96 1.17

Appendix B
Proposed Estimating Formula
J.J. Brooks and B.H. Abu Baker" proposed an estimating formula for the rnodulus of elasticity in their paper published in Novernber 1998. Their formula is as fo1lows:
Where:
E, = Modulus of elasticity of prism.
f, = Compressive svength of brick.
y,= Ratio of moduli of elasticity between brick and mortar.
& = Compressive strength of mortar.
and
y, = (1 - 0.016 W, )/(1 - 0.029 W, ) for masonry cured continuously under polyethylene.
Where:
W, = Water absorption percentage (%)
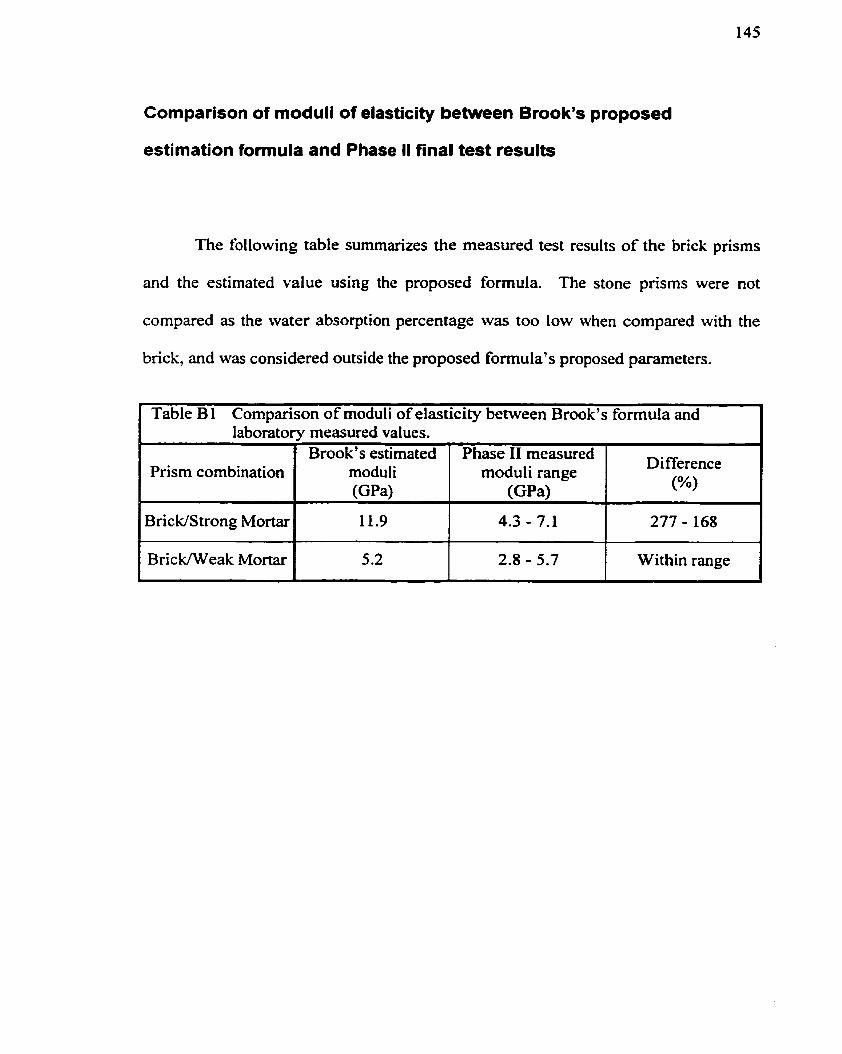
Comparison of moduli of elasticity between Brook's proposed
estimation formula and Phase II final test results
The following table summarizes the measured test results of the brick prisms
and the estimated value using the proposed formula. The stone pnsms were not
compared as the water absorption percentage was too low when compared with the
brick, and was considered outside the proposed formula's proposed parameters.
Table B 1 Comparison of moduli of elasticity between Brook's formula and laboratorv measured values.
Bric WS trong Mortar I 11.9 1 4.3-7.1 1 277-168
-
- - - -
BricWeak Mortar 1 5.2 1 2.8 - 5.7 / Within range
Prism combination Brook's estirnated
moduli ( G W
Phase II measured moduli range
(GPa)
Difference (W

References
4
Masonry S369.1-M90, "Method of Test for Compressive Strength of Masonry Prisms", Canadian Standard Association.
Drysdale, R.G., Hamid, A. A., Baker, L. R., "Masonry Strtrctrrre-Behaviotrr and Design ", Chapter 5, Prentice Hall, Inc., 1994.
Rots, J.G., "Cornputer Simulafion of Masonry Fracture: Continzrttm and Discontinuum Models ", pp. 93-1 03, Proceedings of the International Symposium on Computer Methods in Structural Masonry Swansea, UK, Apnl 1 99 1.
Stockl, S., Bienvirth, H., and Kupfer, H., "The influence of Test Method on the Resirlts of Compression Tests on Mortar ", Proceedings, 10" IBMAC, University of Calgary, pp. 1397- 1406, 1994.
Stockl, S., Beckhaus, K., and Fritsche, TH., "Influence of Test Method on the Reszllts of Deformation Menswements on Uniaxially Loaded Mortar Specimens ", Masonry International Vol 12, No 1, 1998, pp. 32-38.
Page, A. W., and Brooks, D. S., "Load Bearing Masonry - A Review ", Proceedings of the 7Ih International Brick Masonry Conference, pp. 8 1-99: i985.
Suter, G. T., and Naguib, E. M. F., "Effect of Brick Stiyness Orrhorrapy on the Lateral Stress in Stuck-Bonded Brick Masonry Prisms ", Proceedings, Fourth North American Masonry Conference, paper 18, 1987.
Hendry, A. W., "Testing Methods in Masonry Engineering", Proceedings, Fourth North American Masonry Conference, paper 49, 1987.
Drysdale, R. G., & Wong, H. E., "lrirerpretation of the Compressive Strcngth of Masonry Prisms ", Proceedings o f the 7'h International Brick Masonry Conference, 1985.
Binda, L., Facchini, M., MirabelLa Roberti, G. Tiraboschi, C., "Ekctronic speckle intcrferometry for the deformation measlirement in masonry testing ", Construction and Building Materials 12 (1 998) pp. 269-28 1, 1998.
Brooks, J.J., and Abu Baker, B. H., "The Modlrlrrs of Elasticity ofMasonryW, The British Masonrv Societv Journal. Vol. 12. No. 2. November 1998.
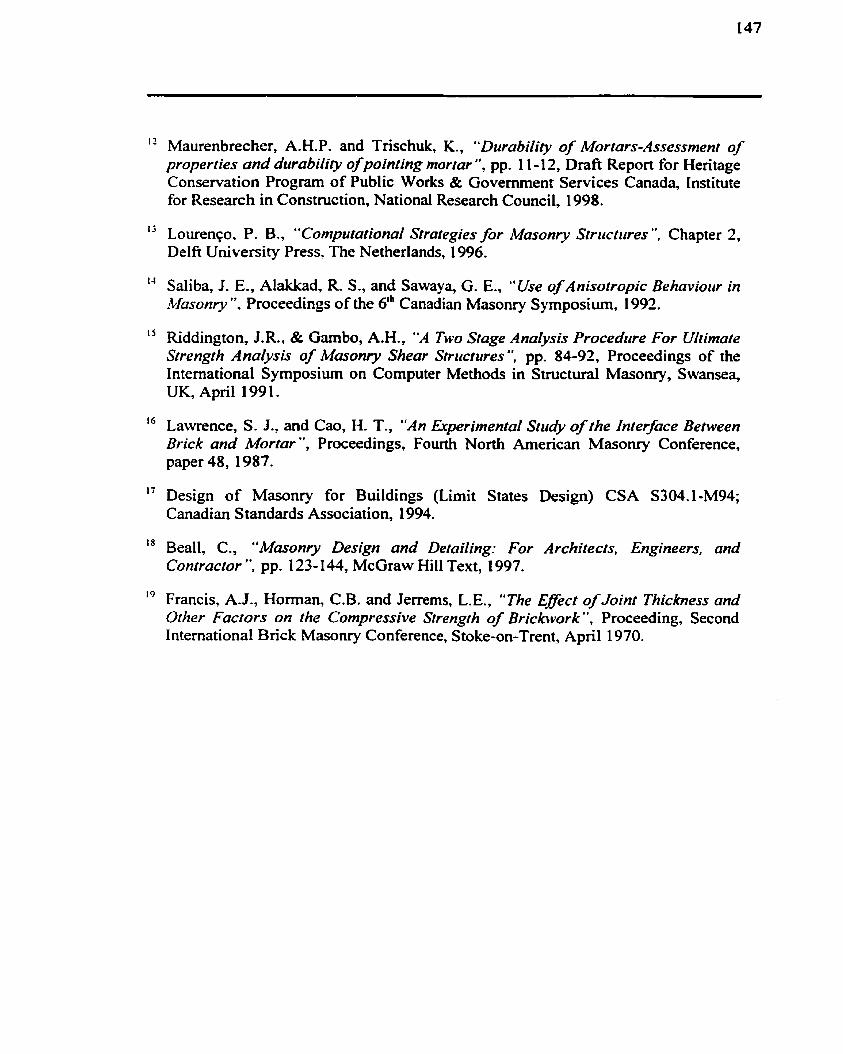
" Maurenbrecher, A.H.P. and Trischuk, K., "Durability of Mortars-Assessrnent of properties and durabilily of pointing rnortar ", pp. 1 1-1 2, Drafi Report for Hentage Conservation Program of Public Works & Government Services Canada, Institute for Researc h in Construction, National Research Council, 1 998.
' Lourenço. P. B., "Computational Strategies for iMasonry Strttcfures ", C hapter 2, Delfi University Press, The Netherlands, 1996.
1 -1 Saliba, J. E., Alakkad, R. S., and Sawaya, G. E., "Use of Anisotropic Behaviotrr in Mosonry ". Proceedings of the 61h Canadian Masonry Symposium, 1992.
1 S Eddington, J.R., & Gambo, A.H., "A Two Stage Analysis Procedure For Uftimate Strength Analysis of Mmonty Shear Strrtctttres", pp. 84-92, Proceedings of the International Symposium on Computer Methods in Structural Masonry, Swansea, UK, April 199 1.
16 Lawrence, S. J., and Cao, H. T., "An Experimental Study of the Interface Betrveen Brick and Mortar ", Proceedings, Fourth North American Masonry Conference, paper 48, 1987.
l 7 Design of Masonry for Buildings (Limit States Design) CSA S304.1-M94; Canadian Standards Association, 1994.
" Beall, C., "1Maronry Design and Detailing: For Archiîectsl Engineers, and Contractor ", pp. 123-1 44, McGraw Hill Text, 1997.
19 Francis, A.J., Horman, C.B. and Jerrems, L.E., "The Effecf ofJoint Thickness and Other Factors on the Compressive Strength of Brickwork ", Proceeding, Second International Brick Masonry Conference, Stoke-on-Trent, April 1970.