Embed Size (px)
Citation preview

29
Article
Nihon Reoroji Gakkaishi Vol.44, No.1, 29~38(Journal of the Society of Rheology, Japan)©2016 The Society of Rheology, Japan
1. INTRODUCTION
Polymer foams are light-weight, and can absorb deformation energies largely. Such characteristic properties originate from the mesoscopic structure of polymer foams.1,2) Polymer foams consist of pores and matrices, and the properties strongly depend on the degree of expansion.3-9) Well expanded foams are very light and the energy absorption properties are very good. However, their moduli are low and thus they cannot keep their forms under high loadings. On the other hand, slightly expanded foams have high moduli but they cannot absorb the energy so much. If we tune the degree of expansion, it would be possible to realize the good balance between the weight and modulus. Moderate expansion would be suitable when we want to use polymer foams as structural materials.10)
Because the characteristic mechanical properties of foams originate from the mesoscopic structure, the mesoscopic models are useful to examine polymer foams. Gibson and Ashby 1,11-13) proposed a simple model for the mechanical properties of well-expanded foams. They modeled a well-expanded foam as a lattice like structure, and calculated the macroscopic mechanical properties from the mechanical
properties of a unit cell. In the Gibson-Ashby model, the compressive behavior of well-expanded foams can be characterized by three different regions. If the applied compressive strain is small, bars which compose the cells deform weakly. The foam behaves as a linear elastic body, and we observe the linear elasticity region as the first region. The Young’s modulus of the foam becomes much smaller than the base solid. If the applied stress becomes large, the buckling of bars occurs and the cells deform nonlinearly. This process is called as the collapse of cells, and the characteristic point where the collapse starts is called as the collapse point. Because the collapsed cells become compact, the strain is released when one cell layer is collapsed. As a result, the stress is almost constant in the second region. The second region is commonly called as the plateau region. For convenience, we call the second region as the collapse region instead of the plateau region, in what follows. Finally, if all the cells are collapsed, the stress increases rapidly as the strain increases. In the third region region, the compressive behavior is dominated by one of the collapsed and densified cells, and thus the third region is called the densification region. These three regions are widely observed in experiments, and thus the Gibson-Ashby model is accepted as a standard model which describes the mechanical behavior of well-expanded foams semi-quantitatively.
Compressive Behavior of Moderately Expanded Low Density Polyethylene (LDPE) Foams
Takashi Uneyama, Tetsuhiro Honda, Toshiro IgarasHI, and Koh-hei nItta†
Institute of Science and Engineering, Kanazawa University, Kakuma, Kanazawa 920-1192, Japan
(Received : October 2, 2015)
We investigated the compressive behavior of moderately expanded low density polyethylene (LDPE) foams. Moderately expanded LDPE foams have polydisperse cell size and wall thickness distributions, both of which are considered to be approximately monodisperse for well-expanded foams The compressive stress-strain curves showed three different regions (the linear elasticity, collapse, and densification regions) which are commonly observed for well-expanded foams. Unlike well-expanded foams, the stress of the moderately expanded LDPE foams in the collapse region was not constant. The relative density dependence of the Young’s modulus and collapse stress was different from that for well-expanded foams. These properties would originate from the polydisperse cell strength distribution. To explain these experimental data, we propose a simple model which incorporates the distribution of the cell strength. Our model showed that the cell strength distribution strongly affects the compressive behavior. Key Words: Low density polyethylene / Foam / Compression
† E-mail: [email protected]

30
Nihon Reoroji Gakkaishi Vol.44 2016
Although the Gibson-Ashby model explains the behavior of well expanded polymer foams semi-quantitatively, the validity of the model is limited only for well-expanded foams. Almost unexpanded foams can be simplified as base solids which contain some small pores inside them.14) However, the mechanical behavior of the moderately expanded foams is not trivial. As far as the authors know, there are few works 8,10) to study mechanical properties of moderately expanded polymer foams. In this work, we prepare moderately expanded low density polyethyle (LDPE) foams with various degrees of expansion and perform compression tests. We show that the degree of expansion for moderately expanded LDPE foams can be controlled systematically, and they can be treated as model moderate expanded foams. The compressive stress-strain curves for moderately expanded LDPE foams exhibit three different regions as predicted by the Gibson-Ashby model. However, the moderately expanded foams show non-constant stress in the collapse region, which cannot be explained by the Gibson-Ashby model. We propose a simple model which incorporates the distribution of the cell strengths15-25), to explain the experimental results.
2. EXPERIMENTAL
To prepare moderately expanded LDPE foams, we used the chemical foaming agent. As the base solid, we use LDPE (0434RP, Prime Polymer) with the weight average molecular weight Mw = 7.8 × 10⁴, the polydispersity index Mw /Mn = 3.4, the density r s = 9.2 × 10² kg/m3, and the melting point Tm = 118 °C. The LDPE powders were supplied by Union Peck. As the foaming agent, we used 4,4'-oxybisbenzene-sulphonohydrazide (OBSH) supplied as powders by Sankyo Kasei. OBSH degradates at T > 160 °C (which is above the melting point of LDPE). Both LDPE and OBSH were used as received. We mixed LDPE and OBSH powders by mixers (SUNVIGOR SML-G15, Sun, and HBH450R, Hamilton Beach), and then pressure-molded into a sheet between two aluminum sheets, at 120 °C and 20 MPa by a pressure-molding machine (Technosupply). Then the sheet was heated to T = 200 °C for 8 minutes to thermally degradate OBSH in a molten LDPE matrix. (During this expansion process, the sheet expanded almost only in the normal direction.) Finally, the foamed sheet was gradually cooled to the room temperature. We changed the weight fraction of OBSH to control the degree of expansion. The thickness of unfoamed sheets was also controled to prepare the foamed sheets with approximately 3 mm thickness.
The degree of expansion was evaluated from the relative
density 1) which is defined as the ratio of the density of the foam r* to that of the base solid r s. The relative density r*/r s of an LDPE foam was approximately calculated from the heights of the sheet before and after the foaming process:
(1)
Here hs and h0 are the heights of the LDPE sheet before and after the foaming process, respectively. The right hand side of eq (1) corresponds to the inverse of the expansion ratio. Typical well-expanded foams have the relative density r */r s ~< 0.1, whereas in this work we study foams with r */r s ~> 0.2. Because the amount of gas produced by the thermal degradation of OBSH is proportional to the mass of OBSH, we can expect the following simple relation holds between the expansion ratio and the weight fraction of OBSH in the unfoamed LDPE sheet:
(2)
where K is a constant and wOBSH is the weight fraction of OBSH. Fig. 1 shows the relation between the expansion ratio and the OBHS weight fraction. We confirmed that eq (2) holds reasonably for wOBSH ~< 2.5 wt%, and thus our LDPE foams are considered to be almost ideally expanded.
The foamed LDPE sheets were cut into square specimens (20 mm × 20 mm) for the uniaxial compression tests. We performed the compression tests using a universal testing machine (Autograph AG-IS, Shimadzu) with a 10kN load cell and a compression test jig, under a constant compression speed 0.017 mm/s at room temperature (25 °C).
1
2
3
4
5
0 1 2 3 4
Expa
nsio
n ra
tio h
0/h s
Weight fraction of OBSH wOBSH / wt%
Fig. 1. The relation between the expansion ratio h0/hs (the inverse of the relative density r */r s) and the weight fraction of OBSH wOBSH. Symbols represent the experimental data and the dashed line represents the fitting to the linear relation (eq (2)).

31
UNEYAMA • HONDA • IGARASHI • NITTA : Compressive Behavior of Moderately Expanded Low Density Polyethylene (LDPE) Foams
3 RESULTS AND DISCUSSIONS
3.1 Pores
To observe the mesoscopic structure, we cut the moderately expanded LDPE foam sheets and take pictures of cross sections by microscopes (EZ4D, Leica, and DS130U, Klein and Ross). Typical pictures for LDPE foams with different relative densities ( r */r s = 0.67, 0.50, 0.33, and 0.25) are shown in Fig. 2. The typical pore size is of the order of 0.1 mm, which is much larger than the spherulite size. (A typical spherulite size is of the order of μm.) Each pore in pictures is fitted by an ellipse, and the major and minor axis of pores are measured. We define the average pore radius R as the average of the semimajor and semiminor axis a and b:
(3)
Here, ⟨…⟩ represents the statistical average. To quantify the pore shapes, we also calculate the average aspect ratio A defined as
(4)
We show the relative density dependence of the average cell size and aspect ratio in Fig. 3. As observed in Fig. 3, pores become slightly larger and less spherical as the relative density decreases. However, the relative density dependence of the average pore radius and aspect ratio is not strong. For moderately expanded foams, thus the average pore radius and
aspect ratio may be approximately treated being independent of the relative density. This pore structure data and the OBSH content dependence of the expansion ratio indicates that our moderately expanded LDPE foams have stable and nearly ideal pore structures. Therefore, the LDPE foams can be utilized as model systems of moderately expanded foams.
However, it should be noted here that the pore radius data shown in Fig. 3(a) are mean values and the pore size is not monodisperse. In addition, there are distributions for the wall thickness, because the spatial distribution of pores is inhomogeneous. As we will discuss later, the distributions of the cell size and wall thickness play a central role in macroscopic mechanical properties of moderately expanded foams.
3.2 Compressive Behavior
We show the compressive (nominal) stress-strain curves for moderately expanded LDPE foams in Fig. 4. For comparison, the compressive stress-strain curve for the unexpanded base LDPE is also shown. We can observe that the moderately expanded LDPE foams exhibits three regions, as in the case of a well-expanded foam. We consider that these three regions
Fig. 2. Pictures of cross sections of LDPE foams with different relative densities (a) r */r s = 0.67, (b) r */r s = 0.50, (c) r */r s = 0.33, and (d) r */r s = 0.20.
0
0.1
0.2
0.3
0.4
0 0.2 0.4 0.6 0.8 1
Ave
rage
por
e ra
dius
R / m
m
Relative density ρ*/ρs
−
(a)
0.6
0.8
1
1.2
1.4
0 0.2 0.4 0.6 0.8 1
Ave
rage
asp
ect r
atio
A
Relative density ρ*/ρs
(b)
−
Fig. 3. The relative density dependence of (a) the average radius R- and (b) the average aspect ratio A- of pores.

32
Nihon Reoroji Gakkaishi Vol.44 2016
correspond to the linear elasticity, collapse, and densification regions. Therefore, roughly speaking, the compressive behavior of the moderately expanded LDPE foams is similar to one of the well expanded foams. However, the stress-strain curves cannot be simply explained by the Gibson-Ashby model.1) In the followings, we examine the compressive behavior in detail.
We fit the small strain regions of compressive stress-strain curves by s* = E*e to obtain the Young’s moduli of the LDPE foams. We show the Young’s moduli obtained from the compressive stress-strain curves in Fig. 5. Because the magnitude of stress is considerably low at the linear elasticity region, the values of Young’s moduli are hard to be precisely estimated. The data in Fig. 5 can be roughly fitted to the following power-law type relations for small and large r*/r s regions, respectively,
(5)
The fitting of the experimental data gives a = 2.3 and 1.3 for small and large relative density regions, respectively. The Gibson-Ashby model gives the exponent a = 3 for closed-cell foams.11) This is much different from our experimental result for the moderately expanded closed-cell LDPE foams. Thus we consider the moderately expanded polymer foams behave in a qualitatively different way from the Gibson-Ashby model. Our result seems to be rather close to a = 2, which is the exponent for open-cell foams by the Gibson-Ashby model. But the exponent a = 2 has been already reported for closed-cell polymer foams. The data for the moderately expanded HDPE foams by Zhang et al 5) show the exponent a = 2.
The collapse stress is useful to study the nonlinear behavior of the polymeric foams. We fit the collapse region by s* = D*
c e + s*
0 with D*c and s*
0 being fitting parameters, and estimated the collapse stress as s*
c = E*s*0 /(E
* - D*c). The collapse stress thus
estimated is shown in Fig. 6. The LDPE foams are expected to behave as elastic foams, and thus the collapse corresponds to the buckling deformation of cells. The Gibson-Ashby model 1) gives a simple relative density dependence for foams with low relative densities,
(6)
If the relative density is not sufficiently low, the contribution of the walls is not negligible. In such a case, the relative density dependence is revised as follows:1)
(7)
10-1
100
101
10-1 100
Col
laps
e st
ress
σc*
/ M
Pa
Relative density ρ*/ρs
Fig. 6. The collapse stress of the moderately expanded LDPE foams. Symbols represent the data determined from the compressive stress-strain curve, the dashed line represent the theoretical curve of the Gibson-Ashby model (eq (7)), and the gray solid curve represents the simple power-law type relation s*
c ∝ ( r*/r s)
b with b = 2.9.
100
101
102
10-1 100You
ng’s
mod
ulus
E*
/ MPa
Relative density ρ*/ρs
Fig. 5. The Young’s moduli of the moderately expanded LDPE foams. Symbols represent the data determined from the compressive stress-strain curve. The dashed and gray solid lines represent the power-law type relations E* ∝ ( r
*/r s)a with a = 2.3 and 1.3, respectively.
0 2 4 6 8
10 12 14
0 0.2 0.4 0.6 0.8 1
Com
pres
sive
stre
ss σ
* / M
Pa
Compressive strain ε
ρ*/ρs = 1.00 0.67 0.50 0.40 0.33
Fig. 4. The compressive stress-strain curves of the moderately expanded LDPE foams with various relative densities r */r s. (r
*/r s = 1 corresponds to the unexpanded LDPE sample.)

33
UNEYAMA • HONDA • IGARASHI • NITTA : Compressive Behavior of Moderately Expanded Low Density Polyethylene (LDPE) Foams
The experimental data for the low relative density region in Fig. 6 can be fitted well with eq (7). However, for large r*/r s, the experimental data deviates from the prediction of the Gibson-Ashby model. For large r */r s, rather, the following simple power law form can fit the data well:
(8)
Here b is an empirical exponent, and the fitting to the experimental data in Fig. 6 gives b = 2.9. Interestingly, the power law with the exponent b = 3 was predicted by Gibson and Ashby 11) for cells which consists of walls. However, as mentioned, the Young’s modulus behave in a different way as the Gibson-Ashby model. This apparent inconsistency means that the compressive behavior of the moderately foamed LDPE foams cannot be simply explained by the simple Gibson-Ashby model.1,11) The crossover of the relative density dependence from eq (7) to eq (8) occurs around r*/r s ≈ 0.3. (The relative density dependence of the Young’s modulus also changes around this crossover value.) Gibson and Ashby1) claimed that their model is valid for r*/r s < 0.3. This upper bound for the relative density almost coincides to our crossover point.
We can observe clear deviation from the Gibson-Ashby model in the collapse region. The stress of a moderately expanded LDPE foams is not constant and gradually increases in the collapse region. Because the LDPE foams examined in this work are the closed-cell foams, the contribution of the gas inside pores may not be negligible. The stress caused by compression of gas has the form 1),
(9)
where patm = 1.013 × 10⁵ Pa is the atmospheric pressure. s*gas
is a monotonically increasing function of ε, and thus one may expect that the finite gradient in the collapse region is due to the gas contribution. To examine how the gas contribution is large, we show the calculated results of the gas contribution in Fig. 7. The stress by the gas was found to be much smaller and negligible, except the large strain regions where the gas pressure diverges (ε ≈ 1 - r*/r s). Thus this led us to conclude that the gas contribution is not important for the compressive behavior of the moderately expanded LDPE foams. In our present experimental data, the stress did not diverge at ε = 1 - r */r s. This means that the gas goes out from the foam during the compression. Since the gas permeability of the LDPE is rather high, in particular under large pressure difference, the contribution of gas will be ignored even at rather high strain regions. In other words, the moderately
expanded LDPE foams can be treated as open-cell foams when we consider the gas inside the foams.
From the arguments shown above, the Gibson-Ashby model cannot reasonably explain our experimental data in the linear elasticity and collapse regions. A possible reason which causes this apparent inconsistency is that the pore size and wall thickness of a moderately expanded LDPE foam is not monodisperse. Namely, the cells in a moderately expanded foam have different strength. This is in contrast to the case of well expanded foams, where the pore size and wall thickness are almost monodisperse. Because the Gibson-Ashby model considers only a single cell in a foam to calculate macroscopic properties, it implicitly assumes that all the cells in the foam are almost the same. This assumption seems not to be reasonable for moderately expanded foams. If the cells are not monodisperse, the Young’s modulus of the foam will be an average values of Young’s moduli of cells. This may be one reason why the relative density dependence of the Young’s modulus of moderately expanded LDPE foams were qualitatively different from the prediction by the Gibson-Ashby model. We will propose a possible model to incorporate the distribution of cells in the next section.
If we further compress the foam after the collapse is completed, the densification region appears. In the densification region, the stress-strain curves have a constant gradient. This is qualitatively different from the phenomenological form proposed by Gibson and Ashby 1),
(10)
0 2 4 6 8
10 12 14
0 0.2 0.4 0.6 0.8 1
Com
pres
sive
stre
ss σ
* / M
Pa
Compressive strain ε
ρ ρs = 0.670.500.33
*/
Fig. 7. The contribution of the gas pressure to the compressive stress-strain curve. Solid curves represents the experimental stress-strain curves for r */r s = 0.67, 0.50, and 0.33. Dotted curves represent the theoretical stress-strain curves by the gas inside foams by eq (9).
34
Nihon Reoroji Gakkaishi Vol.44 2016
with eD being the densification complete strain. (The stress by eq (10) diverges at e = eD.) Thus we again find that our experimental data cannot be explained by the Gibson-Ashby model. In the case of well expanded foams, the Young’s moduli and the collapse stresses of foams are much smaller than the Young’s modulus of the base solid. Thus the stress apparently diverges at the densification region where the foam behaves like the base solid. However, in the case of moderately expanded foams, the Young’s modulus and the collapse stress are comparable to the Young’s modulus of the base solid. Therefore, in the densification region, the stress by the compression of the base solid is observed instead of the apparent divergence.
4. MODEL
The experimental results in the previous section showed that moderately expanded LDPE foams exhibit three different regions as predicted by the Gibson-Ashby model for well expanded foams.1,11-13) The stress at the collapse region is not constant, although the Gibson-Ashby model predicts the constant stress. This implies that the compressive behavior of moderately expanded polymer foams is qualitatively different from one of well expanded foams. In this section, we propose a simple model which can explain the compressive behavior of moderately expanded polymer foams.
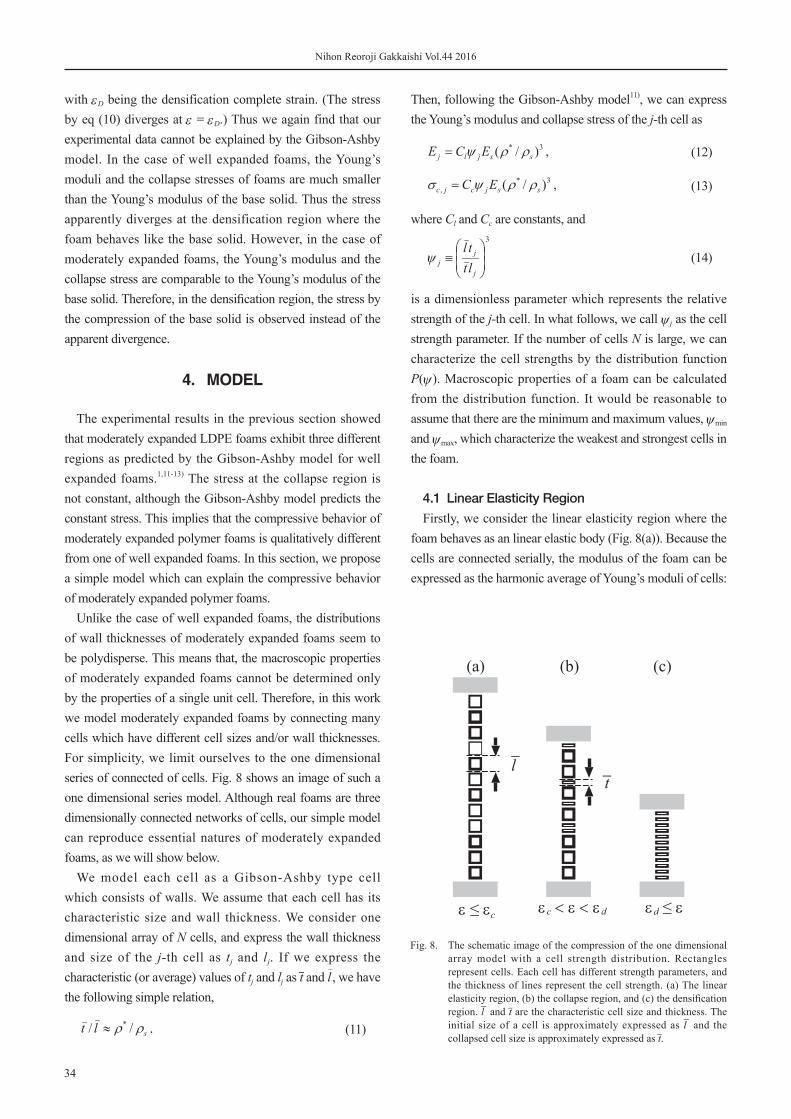
Unlike the case of well expanded foams, the distributions of wall thicknesses of moderately expanded foams seem to be polydisperse. This means that, the macroscopic properties of moderately expanded foams cannot be determined only by the properties of a single unit cell. Therefore, in this work we model moderately expanded foams by connecting many cells which have different cell sizes and/or wall thicknesses. For simplicity, we limit ourselves to the one dimensional series of connected of cells. Fig. 8 shows an image of such a one dimensional series model. Although real foams are three dimensionally connected networks of cells, our simple model can reproduce essential natures of moderately expanded foams, as we will show below.
We model each cell as a Gibson-Ashby type cell which consists of walls. We assume that each cell has its characteristic size and wall thickness. We consider one dimensional array of N cells, and express the wall thickness and size of the j-th cell as tj and lj. If we express the characteristic (or average) values of tj and lj as t
_ and l
-, we have
the following simple relation,
. (11)
Then, following the Gibson-Ashby model11), we can express the Young’s modulus and collapse stress of the j-th cell as
(12)
(13)
where Cl and Cc are constants, and
(14)
is a dimensionless parameter which represents the relative strength of the j-th cell. In what follows, we call y j as the cell strength parameter. If the number of cells N is large, we can characterize the cell strengths by the distribution function P(y ). Macroscopic properties of a foam can be calculated from the distribution function. It would be reasonable to assume that there are the minimum and maximum values, ymin and ymax, which characterize the weakest and strongest cells in the foam.
4.1 Linear Elasticity Region
Firstly, we consider the linear elasticity region where the foam behaves as an linear elastic body (Fig. 8(a)). Because the cells are connected serially, the modulus of the foam can be expressed as the harmonic average of Young’s moduli of cells:
(a) (b) (c)
ε ≤ εc εd ≤ εεc < ε < εd
lt
−−
Fig. 8. The schematic image of the compression of the one dimensional array model with a cell strength distribution. Rectangles represent cells. Each cell has different strength parameters, and the thickness of lines represent the cell strength. (a) The linear elasticity region, (b) the collapse region, and (c) the densification region. l- and t
_ are the characteristic cell size and thickness. The
initial size of a cell is approximately expressed as l- and the collapsed cell size is approximately expressed as t
_.

35
UNEYAMA • HONDA • IGARASHI • NITTA : Compressive Behavior of Moderately Expanded Low Density Polyethylene (LDPE) Foams
(15)
From eqs (12) and (15), the Young’s modulus can be expressed as
(16)
We can further rewrite eq (16) by using the distribution function P(ψ) as
(17)
Eq (17) relates the distribution of the cell strength parameters to the macroscopic Young’s modulus. Comparison of this result with eq (5) gives the following relation:
(18)
Eq (18) implies that the cell strength distribution depends on the relative density.
4.2 Collapse Region
Secondly, we consider the collapse region where cells are collapsed by the elastic buckling (Fig. 8(b)). The collapse point corresponds to the point where the weakest cell collapses. Therefore, the collapse stress of the foam is not determined as the average. It is rather a property of just the weakest cell in the array. This is qualitatively different from the behavior in the linear elasticity region. The collapse stress of the foam can be expressed as
(19)
The cell strength parameter dependence in eq (19) is qualitatively different from one in eq (17). Thus the relative density dependence of the collapse stress can be different from that of the Young’s modulus.
In the collapse region, some fraction of cells are collapsed and some others remain not collapsed. The stress becomes the same as the collapse stress of the weakest non-collapsed cell. Therefore, the distribution of ψ directly corresponds to the distribution of the stress in the collapse stress in the collapse region. If the distribution is broad, the stress of the collapse region will depend on the strain strongly. It will result in a large gradient in the collapse region. Therefore we conclude that the gradient in the collapse region increases as the relative density increases. This is qualitatively consistent with experimental results.
The fraction of collapsed cells can be related to the cumulative distribution function of y ,
(20)
The cell becomes compact if it is collapsed. As a roughly estimate, the height of a cell changes from l
- to t
_. The
collapsed cells are expected to have much larger modulus than uncollapsed cells, and thus they cannot be further compressed in the collapse region. Then, the effective strain which non-collapsed cells feel become different from the applied strain. We consider the situation where the cells which have the cell strength smaller than y are collapsed. If we approximate the Young’s moduli of uncollapsed cells by E*, the uncollapsed cells are linearly deformed and the height becomes l
-(1 - s*/E*).
Thus we have the following relation:
(21)
Eqs (11) and (21) give the following expression for the cumulative distribution as a function of the strain and stress:
(22)
Here ed ≈ 1 - r*/r s is the densification strain. The stress s* in eq (22) should be balanced to the collapse stress of the cell which has the strength y . Thus we have
(23)
From eqs (19), (22) and (23), the strain in the collapse region can be expressed as a function of the stress:
(24)
By inverting eq (24), we obtain the stress as a function of the strain. (We do not show the explicit form of the stress because it contains the inverse function and thus is not intuitive.)
Because the experimental data obey the Gibson-Ashby type relative density dependence, it would be reasonable to set ymin to be independent of the relative density,
(25)
The collapse of the foam completes when the strongest cell collapses. Naively, we expect that this point corresponds to the densification point. If we express the densification stress as s*
d, we have
(26)
36
Nihon Reoroji Gakkaishi Vol.44 2016
From eq (26), we find that the densification stress s *d
becomes larger than the collapse stress s*c, unless the cells are
monodisperse.
4.3 Densification Region
Thirdly, we consider the region where all the cells are collapsed (Fig. 8(c)). If we further compress the foam after all the cells are collapsed, collapsed cells are compressed and we will observe large stress. Gibson and Ashby considered that this densification is due to the direct compression of the base solid. For the case of a well expanded foam, the Young’s modulus of the base solid Es is much larger than the Young’s modulus of the foam, and thus we observe very rapid increase of the stress in the stress-strain curve. However, in the case of a moderately expanded foam, the Young’s modulus of the base solid Es is slightly larger than the Young’s modulus of the foam E*. Thus the densification behavior of moderately expanded foams can be different from one of well-expanded foams.
Gibson and Ashby1) considered that the densification region is to replace the foam by the fully densified state which is just the same as the base solid. Following this picture, we calculate the stress-strain relation for the densification region. The height of the specimen is approximately equal to that of the unfoamed sheet, hs. The nominal strain is related to the specimen height h as e = (h0 - h)/h0. The effective strain which the densified foam (the base solid) feels is estimated as
(27)
where e d ≡ (h0 - hs)/h0 is the densification strain. The stress can be expressed as the sum of the densification stress s *
d which is required to keep the cells collapsed, and the stress of the compressed base solid.
(28)
Eq (28) predicts that the gradient of the stress-strain curve in the densification region becomes Es( r
*/r s)-1. However, as observed in Fig. 4, the dependence of the gradient in the densification region to the relative density is rather weak. This means that, the picture by the Gibson and Ashby is too simple to explain the mechanical behavior in the densification region.
In this work, we employ another simple picture in which stress is supported only by some contact points and/or contact lines in cells. Because the moderately expanded polymer foams have polydisperse cell strength, they can be considered as mechanically heterogeneous materials. We expect that the stress distribution in the densification region will be
heterogeneous, and only some parts of the base solid support the stress. This situation is somewhat similar to the force chains observed in granular materials.26,27)
In our model, cells consist of walls and thus the contact lines support the stress. We expect that the number of contact lines per cell (the number of force chains per cell) is approximately constant. Roughly estimate, the regions around contact lines are elastically deformed. The volume of the deformed region per contact line is of the order of l
- t _ 2. Then,
the elastic free energy density f is estimated as
(29)
Eq (29) gives the following expression for the effective Young’s modulus of the densified foam:
(30)
The stress can be calculated in the same way as the previous case. Finally we have
(31)
with Cd being a constant. Eq (31) predicts that the gradient of the stress-strain curve in the densification region is Cd Es, which is independent of the relative density. The experimental result in Fig. 4 seems to be consistent with this prediction, and thus we consider that the stress is supported only by some fractions of the base solid around the contact lines.
4.4 Examples
Our model suggests that the compressive behavior of moderately expanded foams strongly depends on the cell strength distribution. It would be worth considering the case of the monodisperse cell strength distribution, just as the Gibson-Ashby model, as an example. If the distribution of the cell strength is near monodisperse, the distribution function and the cumulative distribution function are simply expressed as
(32)
(33)
where Θ(x) is the Heaviside step function. From eqs (17) and (32), the Young’s modulus becomes
(34)
and from eqs (24) and (33), the stress in the collapse region becomes
37
UNEYAMA • HONDA • IGARASHI • NITTA : Compressive Behavior of Moderately Expanded Low Density Polyethylene (LDPE) Foams
(35)
Eq (35) means that the stress becomes almost constant in the collapse region. Thus our model reduces to the Gibson-Ashby model11), in the linear elasticity and collapse regions.
The explicit compressive behavior for polydisperse cell strength distributions is generally not simple nor analytically tractable. As another example, we calculate the stress-strain curves for a simple hypothetical cell strength distribution:
(36)
Here, m ≥ 0 is a power-law exponent and Z is the normalization factor defined as
(37)
In the case of m = 0, eq (36) reduces to the uniform distribution 18), and at the limit of ymin, ymax→1, eq (36) reduces to the monodisperse distribution (eq (32)). From eqs (17) and (36), the Young’s modulus is calculated as
> 0),
= 0). (38)
By integrating eq (36), we can obtain the explicit expression for the cumulative distribution F(ψ). From eq (24) and the expression for the cumulative distribution, the relation between the strain and stress in the collapse region becomes
(39)
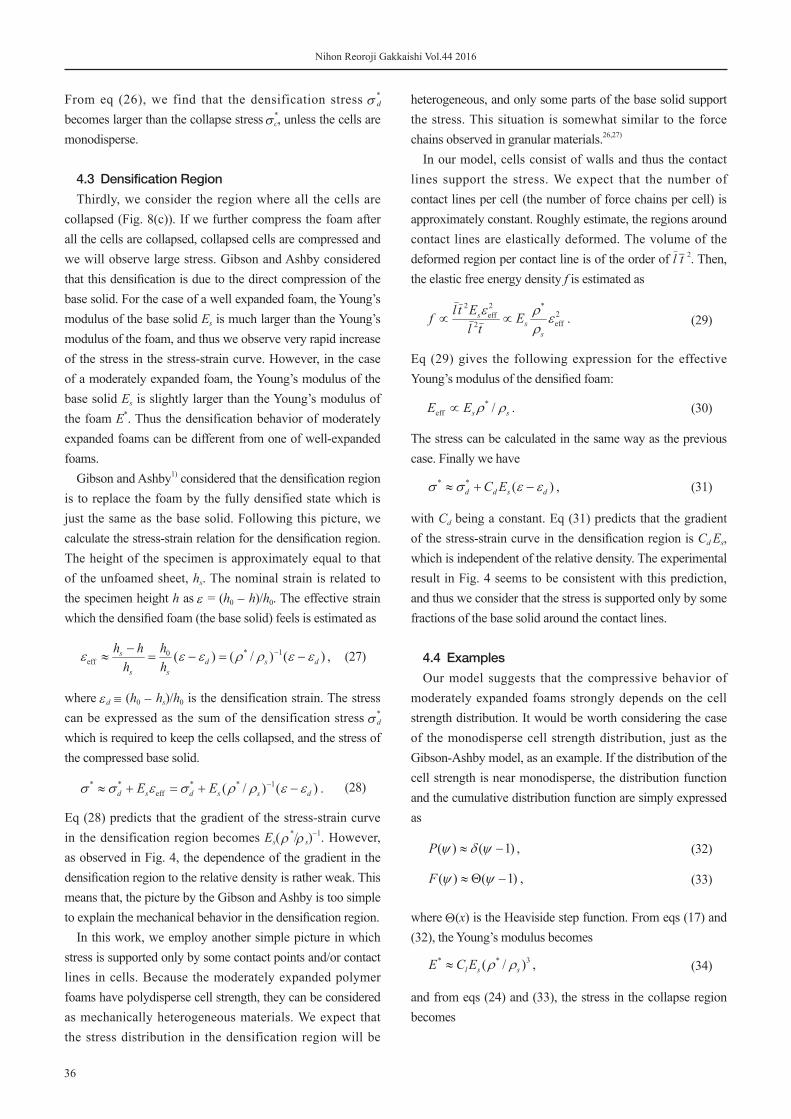
From eqs (31), (38), and (39), the full compressive stress-strain curve the for a hypothetical power-law type cell strength distribution can be constructed. As a demonstration, Fig. 9 shows the compressive stress-strain curves calculated for different relative densities ( r
*/r s = 2/3, 1/2, and 1/3). The model parameters are set as Cl = 1, Cc = 0.1, Cd = 1, ymin = 0.5, ymax = 2, and m = 2. For comparison, the stress-strain curves for the monodisperse distribution (the Gibson-Ashby type model) are also shown. The forms of the stress-
strain curves for the power-law type cell strength distribution look qualitatively similar to what obtained by experiments. The Young’s modulus for the power-law type cell strength distribution becomes different from one for the monodisperse distribution. In Fig. 9, we can observe that the stress of the power-law type cell strength distribution is not constant in the collapse region, as expected. This behavior is qualitatively different from the case of the monodisperse cell strength distribution. The effect of the cell strength distribution seems to increase as the relative density increases (at least apparently). Although the direct comparison of the data in Fig. 9 with the experimental data in Fig. 9 is impossible (because the parameters in the model are not tuned to fit experimental results), we consider that our model together with the power-law type cell strength distribution captures the essential features of the moderately expanded polymer foams.
5. CONCLUSIONS
We prepared moderately expanded LDPE foams with various relative densities, which can be utilized as models of moderately expanded polymer foams. To study the compressive behavior, the compressive stress-strain curves of moderately expanded LDPE foams were measured. The stress-strain curves showed three different regions; the linear elasticity, collapse, and densification regions, just like well-expanded foams. However, unlike well-expanded foams, the stress of the moderately expanded LDPE foams in the collapse
0
0.02
0.04
0.06
0.08
0 0.2 0.4 0.6 0.8 1
σ* /Es
ε
ρ*/ρs = 2/3 1/2 1/3
Fig. 9. The relation between the reduced compressive stress s */Es and the compressive strain e . Solid curves denote by the model with a hypothetical cell strength distribution. The parameters in the model are set as Cl = 1, Cc = 0.1, Cd = 1, y min = 0.5, y max = 2, and m = 2. The relative densities are r */r s = 2/3, 1/2, and 1/3. The open and filled circles represent the collapse and densification points, respectively. Dotted curves are the compressive stress-strain curves for the monodisperse distribution with the same parameters.

38
Nihon Reoroji Gakkaishi Vol.44 2016
region was not constant. This is qualitatively inconsistent with the stress-strain curve predicted by the Gibson-Ashby model. The relative density dependence of the Young’s modulus was not consistent with the prediction of the Gibson-Ashby model.
To explain the experimental data, we considered a simple model in which a moderately expanded foam was modeled as a one dimensional array of cells. By assuming the distribution for the cell strength, the relative density dependence of the Young’s modulus and the strain dependence of the stress in the collapse region can be reasonably explained. We calculated stress-strain curves for the hypothetical power-law type cell strength distribution, and found that the calculated stress-strain curves have similar forms to the experimental curves. These results suggest that the cell strength distribution strongly affects the compressive behavior of moderately expanded foams.
ACKNOWLEDGMENT
This work was supported by Grant-in-Aid (KAKENHI) for Young Scientists B 25800235. TU thanks Prof. Yukihiro Nishikawa (Kyoto Institute of Technology) for helpful comments.
REFERENCES 1) Gibson LJ, Ashby MF, Cellular Solids: Structure and Properties
(Cambridge University Press, 1999), 2nd ed. 2) Ashby MF, Materials Selection in Mechanical Design (Elsevier,
2011), 4th ed. 3) Rodrigue D, Zhang Z, Ait-Kadi A, Can J Chem Eng, 80, 1214
(2002). 4) Zhang Y, Rodrigue D, Ait-Kadi A, J Appl Polym Sci, 90, 2111
(2003). 5) Zhang Y, Rodrigue D, Ait-Kadi A, J Appl Polym Sci, 90, 2120
(2003).
6) Zhang Y, Rodrigue D, Ait-Kadi A, J Appl Polym Sci, 90, 2130 (2003).
7) Zhang Y, Rodrigue D, Ait-Kadi A, J Appl Polym Sci, 90, 2140 (2003).
8) Archer E, Harkin-Jones E, Kearns MP, Fatnes AM, Polym Eng Sci, 44, 638 (2004).
9) Zakaria Z, Ariff ZM, Sipaut CS, J Vynyl Additive Tech, 15, 120 (2009).
10) Barzegari MR, Rodrigue D, J Appl Polym Sci, 113, 3103 (2009).
11) Gibson LJ, Ashby MF, Proc R Soc Lond A, 382, 43 (1982). 12) Ashby MF, Mettallurg Trans A, 14A, 1755 (1983). 13) Ashby MF, Phil Trans R Soc A, 364, 15 (2006). 14) Mackenzie JK, Proc Phys Soc B, 63, 2 (1950). 15) Zhu HX, Windle AH, Acta Mater, 50, 1041 (2002). 16) Meguid SA, Cheon SS, El-Abbasi N, Fin Elem Anal Design,
38, 631 (2002). 17) Viot P, Iordanoff I, Bernard D, Polym Sci Ser A, 50, 679 (2008). 18) Kenesei P, Kádár C, Rajkovits S, Lendvai J, Scr Mater, 50,
295 (2004). 19) Shen H, Oppenheimer SM, Dunand DC, Brinson LC, Mech
Mater, 38, 933 (2006). 20) Viot P, Bouix R, Iordanoff I, Laraillade JL, Composite Struct,
92, 585 (2010). 21) Redenbach C, Schklyar I, Andrä H, Int J Eng Sci, 50, 70
(2012). 22) Maheo L, Viot P, Bernard D, Chirazi A, Ceglia C, Schmitt V,
Mondain-Monval O, Composites B, 44, 172 (2013). 23) Ceglia G, Mahéo L, Bernard D, Chirazi A, Ly I, Mondain-
Monval O, Schmitt V, Eur Phys J E, 35, 31 (2012). 24) Ma Y, Su X, Pyrz R, Rauhe JC, Acta Mech Solid Sin, 26, 559
(2013). 25) Zhang CY, Tang LQ, Yang B, Zhang L, Huang XQ, Fang DN,
Comput Mater Sci, 79 (2013). 26) Peters JF, Muthuswamy M, Wibowo J, Tordesillas A, Phys
Rev E, 72, 041307 (2005). 27) Majmudar TS, Behringer RP, Nature, 435, 1079 (2005).


![[Engelberg] Compressive Sensing](https://img.dokumen.tips/doc/110x75/55cf9985550346d0339dc8ee/engelberg-compressive-sensing.jpg)