Embed Size (px)
Citation preview
PHYSICAL REVIEW E 68, 056409 ~2003!
Compressional and shear wakes in a two-dimensional dusty plasma crystal
V. Nosenko,* J. Goree,† and Z. W. MaDepartment of Physics and Astronomy, The University of Iowa, Iowa City, Iowa 52242, USA
D. H. E. DubinDepartment of Physics, University of California at San Diego, La Jolla, California 92093, USA
A. PielInstitut fur Experimentelle und Angewandte Physik, Christian-Albrechts Universita¨t, Kiel, Germany
~Received 9 July 2003; published 24 November 2003!
Wakes composed of compressional and shear waves were studied experimentally in a two-dimensionalscreened-Coulomb crystal. Highly charged microspheres suspended in a plasma settled in a horizontal mono-layer and arranged in a triangular lattice with a repulsive interparticle potential. Wakes were excited by amoving spot of Ar1 laser light. Depending on the laser spot speed, compressional waves formed a Mach coneand multiple lateral or transverse wakes, similar to ship wakes on the water surface, due to a combination ofacoustic and dispersive properties. Shear waves, however, formed only a Mach cone, due to their nearlyacoustic, i.e., dispersionless character. The experimental results show agreement with a recently developedtheory and with molecular dynamics simulations, which assume a binary Yukawa interparticle potential. Agenerally useful method is presented for calculating the real part of the dispersion relation of the compressionalwaves based on the analysis of the spatial structure of a phonon wake. Fitting the resulting dispersion relationprovides an independent measure of the interparticle potential, parametrized by the screening parameterk andparticle chargeQ.
DOI: 10.1103/PhysRevE.68.056409 PACS number~s!: 52.27.Lw, 82.70.Dd, 52.35.Fp, 52.27.Gr
oc
ththha
inw
rsrehl
de
gltheaatio
i
oriththetheanve
erake
e, aoundssorom
I. INTRODUCTION
A moving disturbance can produce waves in a varietyphysical systems. Under certain circumstances, theyform a wake pattern, which is stationary as viewed inmoving frame. The structure of this wake depends onwave characteristics of the medium and the speed and sof the moving disturbance.
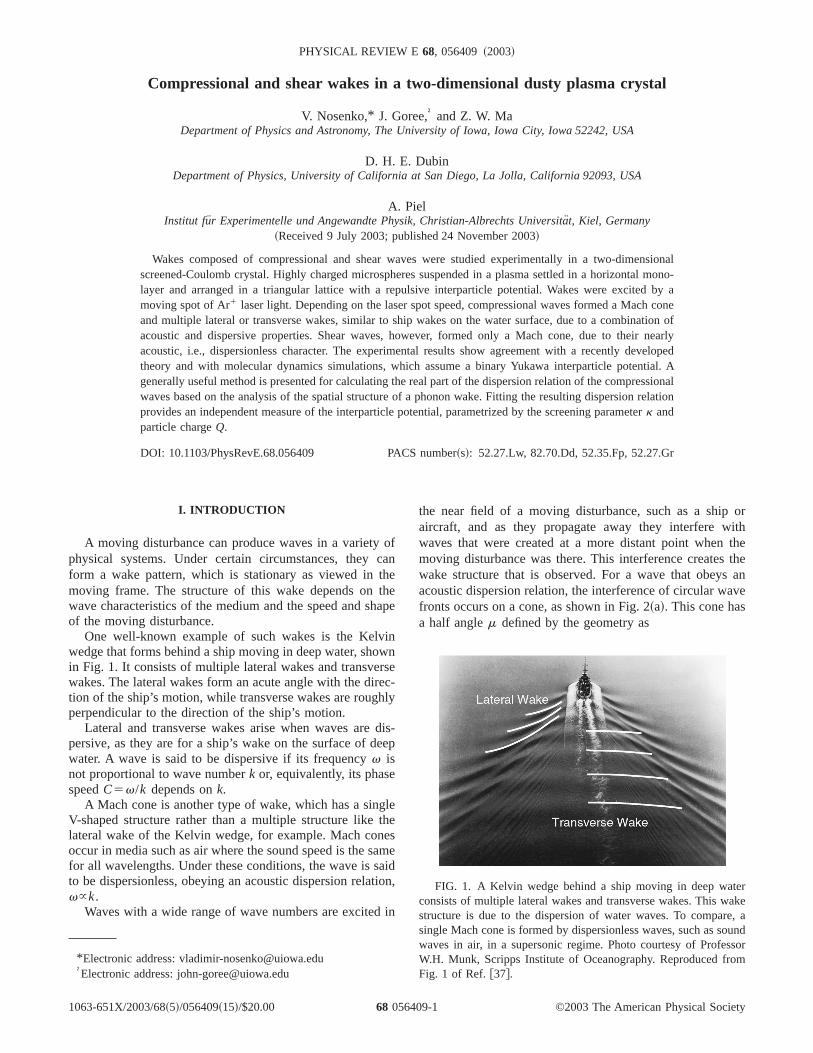
One well-known example of such wakes is the Kelvwedge that forms behind a ship moving in deep water, shoin Fig. 1. It consists of multiple lateral wakes and transvewakes. The lateral wakes form an acute angle with the dition of the ship’s motion, while transverse wakes are rougperpendicular to the direction of the ship’s motion.
Lateral and transverse wakes arise when waves arepersive, as they are for a ship’s wake on the surface of dwater. A wave is said to be dispersive if its frequencyv isnot proportional to wave numberk or, equivalently, its phasespeedC5v/k depends onk.
A Mach cone is another type of wake, which has a sinV-shaped structure rather than a multiple structure likelateral wake of the Kelvin wedge, for example. Mach conoccur in media such as air where the sound speed is the sfor all wavelengths. Under these conditions, the wave is sto be dispersionless, obeying an acoustic dispersion relav}k.
Waves with a wide range of wave numbers are excited
*Electronic address: [email protected]†Electronic address: [email protected]
1063-651X/2003/68~5!/056409~15!/$20.00 68 0564
faneepe
nec-y
is-ep
eesmeidn,
n
the near field of a moving disturbance, such as a shipaircraft, and as they propagate away they interfere wwaves that were created at a more distant point whenmoving disturbance was there. This interference createswake structure that is observed. For a wave that obeysacoustic dispersion relation, the interference of circular wafronts occurs on a cone, as shown in Fig. 2~a!. This cone hasa half anglem defined by the geometry as
FIG. 1. A Kelvin wedge behind a ship moving in deep watconsists of multiple lateral wakes and transverse wakes. This wstructure is due to the dispersion of water waves. To comparsingle Mach cone is formed by dispersionless waves, such as swaves in air, in a supersonic regime. Photo courtesy of ProfeW.H. Munk, Scripps Institute of Oceanography. Reproduced frFig. 1 of Ref.@37#.
©2003 The American Physical Society09-1

itseoe
aln
iffifidr
einmio
ng
ou
rly
dthe
n-
m-
ee
m-erethis
ex-r-
idves.o
cedent
eary in
2D
ncy
nmegna
arThe
ga-of
NOSENKOet al. PHYSICAL REVIEW E 68, 056409 ~2003!
sinm5C0 /U, ~1!
whereU is the speed of the supersonic disturbance andC0 isthe sound speed. The wake in a dispersive medium exhibmore complicated structure, as we will explore in this pap
In solids, phonon wakes are of interest in the fieldsseismology and materials science. In seismology expments, Mach cones have been excited in a borehole@1#. Mo-lecular dynamics~MD! simulations of a bcc tungsten crystwith a moving dislocation exhibit a shear-wave Mach co@2#.
Wakes in solids have not been studied as completelywakes in fluids. Possible reasons include experimental dculties of makingin situ measurements in the interior oordinary solids. Moreover, the time scales in ordinary solare fast, as determined by the sound speed. In this papeuse a kind of solid that avoids these difficulties.
A dusty plasma crystal is a model system that is wsuited for makingin situ observations of waves and wakessolids. It is a suspension of micron-size particles in a plasThe particles are highly charged, and due to mutual repulsand the plasma’s weaker radial electric fields, they arrathemselves in a regular pattern@3–6#. Here we will reportresults for a two-dimensional~2D! triangular lattice withhexagonal symmetry. The experimental conditions forparticles were similar to those in Ref.@7#, where the inter-
FIG. 2. Experimental apparatus.~a! Phonon wakes are excited ia 2D lattice by the radiation force of a moving laser bea~b! Polymer microspheres are levitated above the lower electroda capacitively coupled rf plasma. The particles settle in a sinhorizontal layer, arranged in a triangular lattice with hexagosymmetry.
05640
ar.fri-
e
as-
swe
ll
a.ne
r
particle potential was experimentally shown to be neaYukawa: U(r )5Q(4pe0r )21 exp(2r/lD), where Q is theparticle charge andlD is the screening length. The sounspeed in this lattice is of the order of a few cm/s andinterparticle spacing is typicallya50.2–1 mm. This allowsdirect imaging of the entire plasma crystal, including its iterior, and observation of motion at a microscopic level.
This lattice is characterized by two dimensionless paraeters: the screening parameterk5a/lD , which is typically'1 @8#, and the Coulomb coupling parameterG5Q2/4pe0akT, whereT is the kinetic temperature of thparticles ~which may differ considerably from that of thplasma electrons and ions@4#!. WhenG@1, as in our experi-ments, the lattice is referred to as strongly coupled.
The elastic properties of an isotropic 2D lattice are copletely defined by two independent elastic constants. Thare several pairs of parameters that one may choose forpurpose, as for the case of an isotropic 3D body. Forample, the two Lame´’s coefficients may be used for this pupose@9#.
The wake in a solid is more complex than that in a flubecause solids can support several different types of waA 2D crystalline lattice can vibrate in its plane with twkinds of sound waves, compressional and shear~i.e., trans-verse!. In the compressional wave, the particles are displafrom their equilibrium positions in a direction parallel to thwave vectork. In the shear wave, the particles’ displacemeis perpendicular tok.
The dispersion relations of both compressional and shwaves in dusty plasmas have been derived theoreticallRefs.@10–17# and verified experimentally in Refs.@18–21#.Shown in Fig. 3 is the theoretical dispersion relation for atriangular Yukawa lattice reproduced from Ref.@12#. The fre-quency is normalized by a 2D analog of plasma freque
.inlel
FIG. 3. Theoretical dispersion relation for a 2D triangulYukawa lattice. It has two modes, compressional and shear.shear wave has less dispersion, i.e.,v is more nearly}k over awide range ofk than the compressional wave. The wave’s propation directionQ is measured with respect to the primitive vectorthe lattice. Reproduced from Fig. 3 of Ref.@12#.
9-2

limearvs--ib
,
pe
iveaanglli-
ssie
anthre
te-in
veitng
thee
-c
rese
it
tots,
rvaify
rtlin
ela
ef.withichain
--
t
uc-nceThe
ef theer, aby
d
ofto-re-
in, andgo-rgec-the
utaticm,ter.diuslip.the
COMPRESSIONAL AND SHEAR WAKES IN A TWO- . . . PHYSICAL REVIEW E 68, 056409 ~2003!
v05Q/(4pe0ma3)1/2, where m is the particle mass. Thecompressional and shear modes both have an acousticat long wavelengths, wherev}k, as can be seen in thlower-left corner of Fig. 3, where the dispersion relationsstraight lines. In this acoustic limit, the transverse wasound speedCT is about five times lower than the compresional wave sound speedCL for typical experimental parameters. For shorter wavelengths, both kinds of waves exhdispersion, so thatv is not proportional tok. Compressionalwaves have much more dispersion than the shear wavesyond the acoustic limit. The values ofka50.6 and 1.5 markthe onset of compressional wave’s dispersion and its dedence on the lattice orientation, respectively, as shownFig. 3. The lattice orientation is measured as the angleQbetween the wave’s propagation direction and the primitvector of the lattice. Unlike compressional waves, shwaves are unable to propagate in an ordinary liquid or gShear waves can propagate in a strongly coupled liquid oif the wavelength is comparable to the interparticle spacina@14,17,22#, in which case they are heavily damped by cosional viscosity.
The dispersion relation of compressional waves in a duplasma has a combination of both acoustic and dispercharacteristics. Correspondingly, a wake composed of thwaves will have a structure containing both a Mach conemultiple lateral and transverse wakes. This dual nature ofwake structure will be demonstrated in this paper usingsults from experiment, theory, and simulation.
Mach cones in dusty plasmas were theoretically predicby Havneset al. @23,24#. In a 3D dusty plasma, wakes composed of compressional waves might be excited by a movboulder in Saturn’s rings, as studied by Brattliet al. @25#using a fluid simulation. In a 2D lattice, Mach cones habeen observed experimentally using two methods of exction: by the Coulomb force from charged particles movispontaneously beneath a 2D lattice@26,27#, and by the radia-tion force from a spot of focused laser light swept acrosslattice @28,29#. Wakes composed of compressional wav@25–28# have a structure resembling multiple nested conwhereas wakes composed of shear waves have a singlestructure, as predicted by Ma and Bhattacharjee@30# andobserved experimentally in Ref.@29#.
Mach cones have a larger opening angle for compsional waves than for shear waves. This distinction arifrom the different sound speeds,CL@CT . With its slowersound speed, the shear wave generates a Mach cone wsmaller opening angle, according to Eq.~1!.
Recently Dubin presented a theory@12# explaining thephonon wake structure behind a charge moving relative2D plasma crystal. This theory explained the experimenresults of Ref.@26#, and predicted additional types of wakewhich we will investigate here.
In this paper, we report an experiment intended to obseand measure supersonic and subsonic wakes created inplasma crystal by a moving spot of laser light, and to verthe theoretical predictions of Ref.@12#. Experimental resultsof this paper were obtained in the same experiment repoin our previous paper, Ref.@29#. Here, we present additionaexperimental and simulation results; our analysis now
05640
it
ee
it
be-
n-in
ers.ly
tyvesede-
d
g
a-
ess,one
s-s
h a
aal
e2D
ed
-
cludes calculation of the wake’s full wave field using ththeory of Ref.@12#. A method of calculating an experimentadispersion relation for a wave is developed, using onlysnapshot of the wakes.
II. THEORY OF PHONON WAKESIN A 2D PLASMA CRYSTAL
To explain the phonon wake structure, the theory of R@12# considers waves, both compressional and shear,various wave numbers and directions of propagation, whare excited by a moving disturbance. Waves with a certwave numberk propagate with a phase speedC(k)[v/k,where the wave frequencyv(k) is determined by the wave’sdispersion relation. In the acoustic limitC(k)5C, but atshorter wavelengths,C(k) depends onk. Because the medium is dispersive, Eq.~1! must be modified so that it expresses a Mach condition for only one value ofk at a time:C(k)5Usin@Q(k)#, which means that waves with differenwave numbersk propagate at different anglesQ(k). Phasemixing of the various excited waves gives rise to constrtive and destructive interference. The resulting interferepattern determines the appearance of the phonon wake.waves are assumed to be linear in this theory.
The theory of Ref.@12# predicts that the phonon wakstructure in a 2D plasma crystal depends on the speed omoving disturbanceU and the crystal’s screening parametk. For U.C the resulting wake consists of a Mach conemultiple-cone lateral wake, and a narrow wake formedumklapp phonons~phonons from beyond the first Brillouinzone of the lattice!. ForU,C the Mach cone disappears anis replaced by a transverse wake. The effect ofk is to changethe scale length of the wake. For a fixedU.C, the scalelength increases roughly ask22/3 for k21.1.
III. EXPERIMENTAL METHOD
We used the experimental setup of Fig. 2~b!, which wasdescribed previously in Ref.@29#. A plasma was producedusing a capacitively coupled rf discharge. We used 20 Wrf power at 13.56 MHz, with an amplitude of 84 V peakpeak. The self-bias voltage was261 V. To reduce the damping rate, we used Ar at a pressure of only 15 mTorr, corsponding to a gas drag, which is accurately modeled@31# bythe Epstein expression, ofn52.9 s21.
A monolayer of polymer microspheres was suspendedthe plasma sheath above the discharge’s lower electrodethey arranged themselves in a triangular lattice with hexanal symmetry. The particles acquired a high negative chaby collecting electrons and fewer ions. In the vertical diretion, the particles were levitated by a balance betweenCoulomb force and gravity.
In the horizontal direction, they repelled each other bwere confined by the plasma’s natural ambipolar electrostfields. Our lower electrode is flat out to a radius of 10.7 cwhere there is an elevated lip at the electrode’s perimeThe particle suspension, however, had a much smaller raof 2.5 cm, so that the radial fields were not due to theThese radial fields arise naturally due to gradients in
9-3
d
NOSENKOet al. PHYSICAL REVIEW E 68, 056409 ~2003!
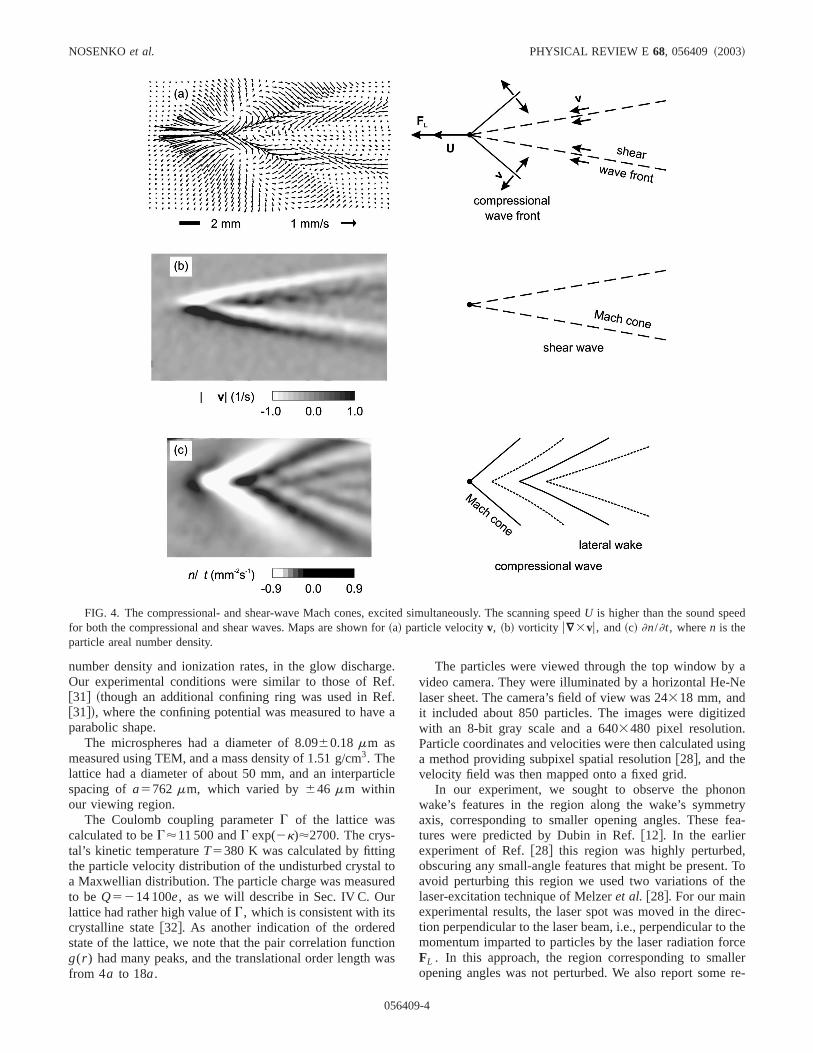
FIG. 4. The compressional- and shear-wave Mach cones, excited simultaneously. The scanning speedU is higher than the sound speefor both the compressional and shear waves. Maps are shown for~a! particle velocityv, ~b! vorticity u“3vu, and~c! ]n/]t, wheren is theparticle areal number density.
gefefe
ic
torer
diow
aNe
ed
sing
ontryfea-
,. Tohe
rec-the
rceller
re-
number density and ionization rates, in the glow discharOur experimental conditions were similar to those of R@31# ~though an additional confining ring was used in R@31#!, where the confining potential was measured to havparabolic shape.
The microspheres had a diameter of 8.0960.18mm asmeasured using TEM, and a mass density of 1.51 g/cm3. Thelattice had a diameter of about 50 mm, and an interpartspacing ofa5762 mm, which varied by646 mm withinour viewing region.
The Coulomb coupling parameterG of the lattice wascalculated to beG'11 500 andG exp(2k)'2700. The crys-tal’s kinetic temperatureT5380 K was calculated by fittingthe particle velocity distribution of the undisturbed crystala Maxwellian distribution. The particle charge was measuto be Q5214 100e, as we will describe in Sec. IV C. Oulattice had rather high value ofG, which is consistent with itscrystalline state@32#. As another indication of the orderestate of the lattice, we note that the pair correlation functg(r ) had many peaks, and the translational order lengthfrom 4a to 18a.
05640
e...a
le
d
nas
The particles were viewed through the top window byvideo camera. They were illuminated by a horizontal He-laser sheet. The camera’s field of view was 24318 mm, andit included about 850 particles. The images were digitizwith an 8-bit gray scale and a 6403480 pixel resolution.Particle coordinates and velocities were then calculated ua method providing subpixel spatial resolution@28#, and thevelocity field was then mapped onto a fixed grid.
In our experiment, we sought to observe the phonwake’s features in the region along the wake’s symmeaxis, corresponding to smaller opening angles. Thesetures were predicted by Dubin in Ref.@12#. In the earlierexperiment of Ref.@28# this region was highly perturbedobscuring any small-angle features that might be presentavoid perturbing this region we used two variations of tlaser-excitation technique of Melzeret al. @28#. For our mainexperimental results, the laser spot was moved in the dition perpendicular to the laser beam, i.e., perpendicular tomomentum imparted to particles by the laser radiation foFL . In this approach, the region corresponding to smaopening angles was not perturbed. We also report some
9-4

wod
wathto
atta
ceravth
erle
an
dprwg-de
osl-.t,r
freiois
ars
in
ugnaehed
tint,
ionthehear
wne
uc-
far
COMPRESSIONAL AND SHEAR WAKES IN A TWO- . . . PHYSICAL REVIEW E 68, 056409 ~2003!
sults using, as an alternative method, a laser spot thatmoved in the direction of the laser beam. The latter methis similar to that of Ref.@28# except that we used a reducelaser power so that the region behind the moving spotnot perturbed much. At its focus in the vacuum chamber,Ar1 laser beam had a power of 0.6 W, which we reducedas little as 0.12 W for our slowest scanning speeds, to avmelting the lattice.
We recorded a digital movie, consisting of ten frames30 frames/s, as the laser spot was scanned across the laThe video was synchronized to the motion of the laser beusing the triggering scheme of Ref.@28#. This allowed us toaverage the data from over 100 scans, under the sameditions, to improve the signal-to-noise ratio. The scans wrepeated at an interval of 5.9 s, allowing the crystal to hsufficient time to relax after the disturbance created byprevious scan.
We verified, by using a side-view video camera, that thwas no out-of-plane buckling of our 2D lattice. The particmotion was thus restricted to be in the horizontal planeour plasma crystal was truly 2D.
IV. EXPERIMENTAL AND THEORETICAL RESULTS
A. Review of previous results
In Ref. @29#, we reported a measurement of sound speefor the same experiment where we obtained the resultssented below. Pulses of compressional and shear waveslaunched in the lattice to measure the sound speeds usinmethods of Refs.@33,21#. The pulses were excited by stimulating the particles with an Ar1 laser sheet that was choppeon and off. The sound speeds of the two modes were msured to beCL524.261.7 mm/s andCT55.460.5 mm/s,for the compressional and shear waves, respectively.
The ratio of the two sound speeds,CL /CT54.4860.52,is expected for our experimental conditions. This value cresponds tok51.1960.28, according to the theory of wavein a Yukawa crystal@13,20#. The particle charge is then caculated to beQ5212 70061200e using the method of Ref@20# based on the theory of Ref.@13#. As an independent teswe also used a variant of the resonance method of measuparticle charge @34#, which gave a lower value oQ528800e. We believe this resonance method is less pcise than methods relying on the wave dispersion relatfor a purely 2D lattice with an interparticle potential thatnearly Yukawa, like ours.
In Ref. @29#, we excited both compressional- and shewave Mach cones simultaneously when we swept the laspot in the direction of the laser beam, as in Ref.@28#, at areduced laser power so that the region behind the movspot was not perturbed by defect generation~Fig. 4!. Thelaser beam, which had a power of 0.24 W, was swept throthe lattice with a speed higher than both the compressioand shear-wave sound speeds. When we increased thetation laser power to 0.6 W and the rf power to 30 W, tshear Mach cone disappeared, replaced by a disorderegion behind the moving spot, as in Ref.@28#.
Experimentally, compressional waves can be disguished from shear waves using three kinds of maps. Firs
05640
asd
seoid
tice.m
on-eee
e
d
s,e-erethe
a-
r-
ing
-n,
-er
g
hl-
xci-
re-
-in
a map of particle velocityv, the two modes differ in thedirection of the particle motion as compared to the directof the wave propagation. These directions are parallel incompressional wave and they are perpendicular in the s
FIG. 5. The test of the phonon wake linearity. Maps are shofor ]n/]t, where n is the particle number density, to reveal thcompressional waves. Experimentally observed were~a! the doublewake and~b!,~c! two separate single wakes. The double-wake strture in ~d! was synthesized as a linear superposition of~b! and~c!.The linear superposition in~d! is similar to the experimental wakein ~a!, which means that the experimental wake is linear, in itsfield.
9-5

e
s
-r
r-
NOSENKOet al. PHYSICAL REVIEW E 68, 056409 ~2003!
FIG. 6. Four different types ofphonon wakes depending on thspeed of scanningU as comparedto the compressional wave’sound speed CL : ~a! U/CL
52.14, ~b! U/CL51.17, ~c!U/CL50.87, ~d! U/CL50.49. Werefer to the latter two as ‘‘sub-sonic,’’ although they are supersonic with respect to the sheawave. Maps are shown for the paticle speedv.
heine
le
a
o
ityeth
ngtiolee
-
onyobyacare
te
igs.lyual-that
arak,hingifi-for
lin-D
of
Weueonaletheof
be-ichtheture
ach
wave. For example, we can clearly distinguish tcompressional-wave Mach cone with its bigger openangle and the shear-wave Mach cone with its smaller oping angle in Fig. 4~a!, based on the direction of the particmotion in the cones’ wings.
Second, compressional waves appear in a map of]n/]t,where n is the particle areal number density. In the lineapproximation,]n/]t52n(“•v). The ]n/]t map in Fig.4~c! shows a compressional-wave Mach cone. This typemap, also called a numerical Schlieren map@28#, is effectivefor detecting compressive particle motion.
Third, shear waves appear in a map of the vorticu“3vu. The u“3vu map in Fig. 4~b! shows the shear-wavMach cone. The vorticity of the Mach cone demonstratesthe motion has significant shear.~Unlike a fluid, however,our medium is elastic, and it oscillates without breakibonds after it is perturbed. Thus, although the particle mohas a momentary vorticity, there is no vortex with particcirculation.! In analyzing our experimental images of thphonon wakes, we will use theu“3vu maps to reveal theshear waves, and]n/]t or “•v maps to reveal the compressional waves.
B. Test of linear superposition
We performed a test to verify that linear superpositioccurs. Such a test is valuable to verify whether the theorRef. @12#, which relies on linear superposition, is valid. To dthis, we excited two identical wakes simultaneouslysweeping two laser spots in parallel through the lattice. Ewake consisted of the compressional- and shear-wave Mcones, and multiple-cone compressional wake. The compsional component of the double-wake is shown in Fig. 5~a!.In two separate experiments, an individual wake was exci
05640
gn-
r
f
at
n
of
hchs-
d,
by blocking one or the other laser beam, as shown in F5~b! and 5~c!. A double-wake structure was then artificialsynthesized by adding up the maps of the two individwakes, as shown in Fig. 5~d!. The experimental and synthesized double-wake structures are similar, which meanslinear superposition is occurring in Fig. 5~a!.
This test proves linearity only in the far field, i.e., not nethe excitation spot. In the near field the linearity might breas the particle speedv reaches relatively high values witv/CL in the range of 0.12–0.23, depending on the scannspeed. Previously, nonlinear effects were found to be signcant for the compressional waves in a 2D plasma crystalthe wave amplitudesv.0.07CL @33#. Nonlinearity in thenear field can, however, affect the wake structure in theear far field, as we will demonstrate in Sec. V using a Msimulation.
The linearity of the wakes implies that Dubin’s theorywakes in a 2D plasma crystal@12# is applicable in the farfield. We compare our experimental results to this theory.performed the above test of linearity only for a single valof the scanning speed, corresponding to a compressiMach numberU/CL of 1.38. Nevertheless, as we will sebelow, the experimentally observed wakes agree withtheory@12#, which is essentially linear, in the entire rangethe scanning speeds that we used.
C. Wake results from experiment and theory
We observed several distinct types of phonon wakeshind the moving laser spot, depending on its speed, whwas varied from supersonic to subsonic with respect tosound speed of the compressional waves. The wake strucwas mostly just a single cone when the compressional MnumberM5U/CL was @1 and !1, as in Figs. 6~a! and
9-6

at
COMPRESSIONAL AND SHEAR WAKES IN A TWO- . . . PHYSICAL REVIEW E 68, 056409 ~2003!
FIG. 7. A compressional-wave Mach conethe speed of scanningU/CL52.14. Maps areshown for~a! particle speedv, ~b! vectors of par-ticle velocity v, ~c! experimental and~e! theoret-ical values of]n/]t, wheren is the particle num-ber density,~d! experimental and~f! theoreticalvalues of vorticityu“3vu.
te
ecs.
he-om
heele
thob
sheas
e
s
d atar-
llycanted,othand
esakeof
og-ris-’sres.
e tothisnot
6~d!, respectively. The wakes had a more complicamultiple-cone structure whenM'1, as in Figs. 6~b! and6~c!, for slightly supersonic and subsonic conditions, resptively. Below we will analyze the structure of these wake
First we examine a strongly supersonic wake atU52.14CL in Fig. 7. The wake’s structure, as shown in tvelocity maps of Figs. 7~a! and 7~b!, contains both compressional and shear wakes, but the latter are much less prnent at such a high Mach number. Comparing the]n/]t mapof Fig. 7~c!, which shows the compressional wake to tu“3vu map of Fig. 7~d!, showing the shear wake, we sethat most of the particle motion in the far field is attributabto compressional waves. Shear motion is present only withe near-field region of the laser spot and in a very narrangle behind the spot. This small angle is as expected,cause for these conditionsU/CT58.6 so that Eq.~1! predictsm'7° for the shear waves. The compressional wake hamultiple-cone structure; we identify the first cone as tMach cone and the second cone, at a smaller angle,lateral wake. We also show theoretical results in Figs. 7~e!and 7~f!, computed using Dubin’s theory of Ref.@12# withthe same parameters as in the experiment. These includrameters describing both the dusty plasma~i.e., particlechargeQ, interparticle spacinga, and screening lengthlD)and the laser beam, which is assumed to have a Gausprofile with a full width at half maximum of 0.36 mm.
05640
d
-
i-
inwe-
a
a
pa-
ian
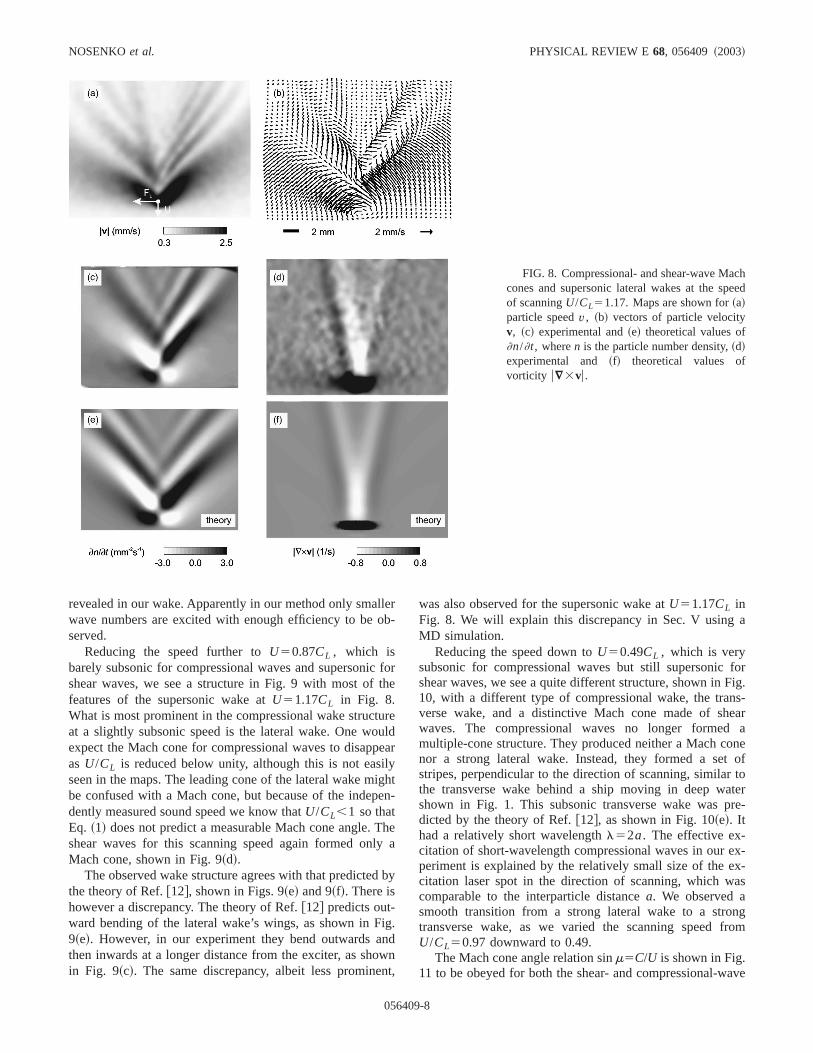
Reducing the speedU to a barely supersonic 1.17CL inFig. 8, we again see a multiple compressional wake, anthis lower speed we can also more easily identify a shewave Mach cone. The latter is visible in theu“3vu map ofFig. 8~d!. The compressional wake’s structure is generasimilar to that at the higher Mach number except that weidentify a larger number of lateral wakes and, as expecthe opening angle of the Mach cone is larger. For bwaves, the wake structures observed in the experimentpredicted by theory in Figs. 8~e! and 8~f! show a close re-semblance.
The multiple-cone structure of compressional wakarises from the wave dispersion. The compressional wstructure consists of a Mach cone followed by a serieslateral wakes. Previously, Melzeret al. @28# identified thelateral wakes as additional Mach cones, but we now recnize that they are lateral wakes, similar to ship’s wakes, aing from the wave’s dispersion as predicted by Dubintheory of Ref. @12#. Depending on the conditions, in ouexperiment we observed various numbers of lateral wakThere are three such wakes in Fig. 8~a! at U51.17CL , andfive at U51.07CL .
The single Mach cone structure of shear wakes is duthe nearly dispersionless character of shear waves. Whilewave does have dispersion for large wave numbers, it is
9-7
cheed
NOSENKOet al. PHYSICAL REVIEW E 68, 056409 ~2003!
FIG. 8. Compressional- and shear-wave Macones and supersonic lateral wakes at the spof scanningU/CL51.17. Maps are shown for~a!particle speedv, ~b! vectors of particle velocityv, ~c! experimental and~e! theoretical values of]n/]t, wheren is the particle number density,~d!experimental and ~f! theoretical values ofvorticity u“3vu.
lleob
fth
tuu
peilyige
Thly
d
ign
own
a
forFig.ns-ear
aone
ofto
aterre-
ex-x-as
ngrom
ave
revealed in our wake. Apparently in our method only smawave numbers are excited with enough efficiency to beserved.
Reducing the speed further toU50.87CL , which isbarely subsonic for compressional waves and supersonicshear waves, we see a structure in Fig. 9 with most offeatures of the supersonic wake atU51.17CL in Fig. 8.What is most prominent in the compressional wake strucat a slightly subsonic speed is the lateral wake. One woexpect the Mach cone for compressional waves to disapas U/CL is reduced below unity, although this is not easseen in the maps. The leading cone of the lateral wake mbe confused with a Mach cone, but because of the indepdently measured sound speed we know thatU/CL,1 so thatEq. ~1! does not predict a measurable Mach cone angle.shear waves for this scanning speed again formed onMach cone, shown in Fig. 9~d!.
The observed wake structure agrees with that predictethe theory of Ref.@12#, shown in Figs. 9~e! and 9~f!. There ishowever a discrepancy. The theory of Ref.@12# predicts out-ward bending of the lateral wake’s wings, as shown in F9~e!. However, in our experiment they bend outwards athen inwards at a longer distance from the exciter, as shin Fig. 9~c!. The same discrepancy, albeit less promine
05640
r-
ore
reldar
htn-
ea
by
.dn
t,
was also observed for the supersonic wake atU51.17CL inFig. 8. We will explain this discrepancy in Sec. V usingMD simulation.
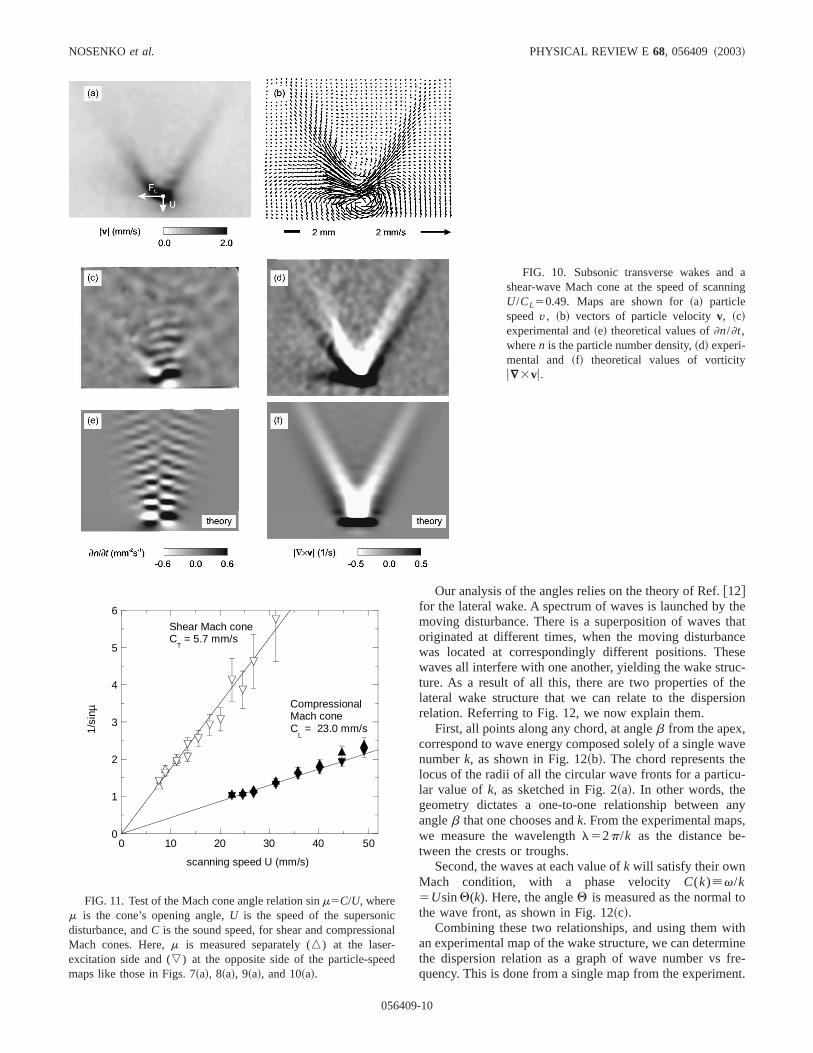
Reducing the speed down toU50.49CL , which is verysubsonic for compressional waves but still supersonicshear waves, we see a quite different structure, shown in10, with a different type of compressional wake, the traverse wake, and a distinctive Mach cone made of shwaves. The compressional waves no longer formedmultiple-cone structure. They produced neither a Mach cnor a strong lateral wake. Instead, they formed a setstripes, perpendicular to the direction of scanning, similarthe transverse wake behind a ship moving in deep wshown in Fig. 1. This subsonic transverse wake was pdicted by the theory of Ref.@12#, as shown in Fig. 10~e!. Ithad a relatively short wavelengthl52a. The effective ex-citation of short-wavelength compressional waves in ourperiment is explained by the relatively small size of the ecitation laser spot in the direction of scanning, which wcomparable to the interparticle distancea. We observed asmooth transition from a strong lateral wake to a strotransverse wake, as we varied the scanning speed fU/CL50.97 downward to 0.49.
The Mach cone angle relation sinm5C/U is shown in Fig.11 to be obeyed for both the shear- and compressional-w
9-8

ar-
COMPRESSIONAL AND SHEAR WAKES IN A TWO- . . . PHYSICAL REVIEW E 68, 056409 ~2003!
FIG. 9. Subsonic lateral wakes and a shewave Mach cone at the speed of scanningU/CL
50.87. Maps are shown for~a! particle speedv,~b! vectors of particle velocityv, ~c! experimen-tal and~e! theoretical values of]n/]t, wheren isthe particle number density,~d! experimental and~f! theoretical values of vorticityu“3vu.
Tig
sinTseet
eeac2Dda
vediFor
theeseiblere,de-
toap-vesis-the
thean
ghsghtex.
ined
Mach cones, over a wide range of scanning speeds.anglem was measured from speed maps, like those in F7~a!, 8~a!, 9~a!, and 10~a!. The slope in Fig. 11 givesCT55.760.4 mm/s andCL523.061.0 mm/s. These valueare consistent with the preliminary measurements uscompressional- and shear-wave pulse propagation.sound speed measurements made from the Mach conebased on more experimental data. The values of the scring parameter and the particle charge, calculated usingmethod of Ref.@20# based on the theory of Ref.@13# usingthe sound speeds from the Mach cone angles, arek51.4560.24 andQ5214 10061000e, respectively.
V. DETERMINING THE DISPERSION RELATIONFROM A 2D WAKE STRUCTURE
Below we will present a generally useful method of dtermining the dispersion relation from an experimental msurement of the wake. This method is applicable to a lodisturbance in a monolayer or to a 3D wake if it has asymmetry. This method relies on maps of the wakes, anassumes nothing about the interparticle potential. It doessume that the wake’s structure is determined by the wadispersion. We developed this method so that it yields apersion relation, calculated from the experimental data.the plasma crystal, the resulting experimental dispersion
05640
hes.
ghearen-
he
--
al
its-’ss-r
e-
lation is shown to be useful for calculating the values ofkandQ.
A. General method
Because the wake structure in the far-field results frominterference of waves of different wave numbers, and thwave numbers all obey the dispersion relation, it is possto determine the dispersion relation from the wake structuas we shall do here. This is the opposite of the processscribed in Ref.@12#, where the dispersion relation is usedpredict the wake structure. It is possible to adopt eitherproach because the far-field wake contains linear wawhose structure is determined by a combination of the dpersion relation and the conditions in the near field wherewaves are excited.
Our approach, sketched in Fig. 12, relies on measuringangle of the wave fronts of the lateral wake. We start withexperimental map of the particle speed like Fig. 8~a!, orsome other parameter such as]n/]t. Next, we manuallydraw contours of the wave fronts, i.e., the crests and trouof the lateral wake pattern. We also draw a pair of strailines to identify the Mach cone, if one exists, and its apThus we obtain a diagram like Fig. 12~a!. In this diagram, wethen measure various angles and distances, as explabelow.
9-9
aing
NOSENKOet al. PHYSICAL REVIEW E 68, 056409 ~2003!
FIG. 10. Subsonic transverse wakes andshear-wave Mach cone at the speed of scannU/CL50.49. Maps are shown for~a! particlespeedv, ~b! vectors of particle velocityv, ~c!experimental and~e! theoretical values of]n/]t,wheren is the particle number density,~d! experi-mental and ~f! theoretical values of vorticityu“3vu.
thethatcese
uc-heion
aveeu-
any,-
o
ithine
fre-nt.
icn
ed
0
1
2
3
4
5
6
0 10 20 30 40 50
1/si
nµ
scanning speed U (mm/s)
Shear Mach coneC
T= 5.7 mm/s
CompressionalMach coneC
L= 23.0 mm/s
FIG. 11. Test of the Mach cone angle relation sinm5C/U, wherem is the cone’s opening angle,U is the speed of the supersondisturbance, andC is the sound speed, for shear and compressioMach cones. Here,m is measured separately (n) at the laser-excitation side and (,) at the opposite side of the particle-spemaps like those in Figs. 7~a!, 8~a!, 9~a!, and 10~a!.
05640
Our analysis of the angles relies on the theory of Ref.@12#for the lateral wake. A spectrum of waves is launched bymoving disturbance. There is a superposition of wavesoriginated at different times, when the moving disturbanwas located at correspondingly different positions. Thewaves all interfere with one another, yielding the wake strture. As a result of all this, there are two properties of tlateral wake structure that we can relate to the dispersrelation. Referring to Fig. 12, we now explain them.
First, all points along any chord, at angleb from the apex,correspond to wave energy composed solely of a single wnumberk, as shown in Fig. 12~b!. The chord represents thlocus of the radii of all the circular wave fronts for a particlar value ofk, as sketched in Fig. 2~a!. In other words, thegeometry dictates a one-to-one relationship betweenangleb that one chooses andk. From the experimental mapswe measure the wavelengthl52p/k as the distance between the crests or troughs.
Second, the waves at each value ofk will satisfy their ownMach condition, with a phase velocityC(k)[v/k5UsinQ(k). Here, the angleQ is measured as the normal tthe wave front, as shown in Fig. 12~c!.
Combining these two relationships, and using them wan experimental map of the wake structure, we can determthe dispersion relation as a graph of wave number vsquency. This is done from a single map from the experime
al
9-10
er
COMPRESSIONAL AND SHEAR WAKES IN A TWO- . . . PHYSICAL REVIEW E 68, 056409 ~2003!
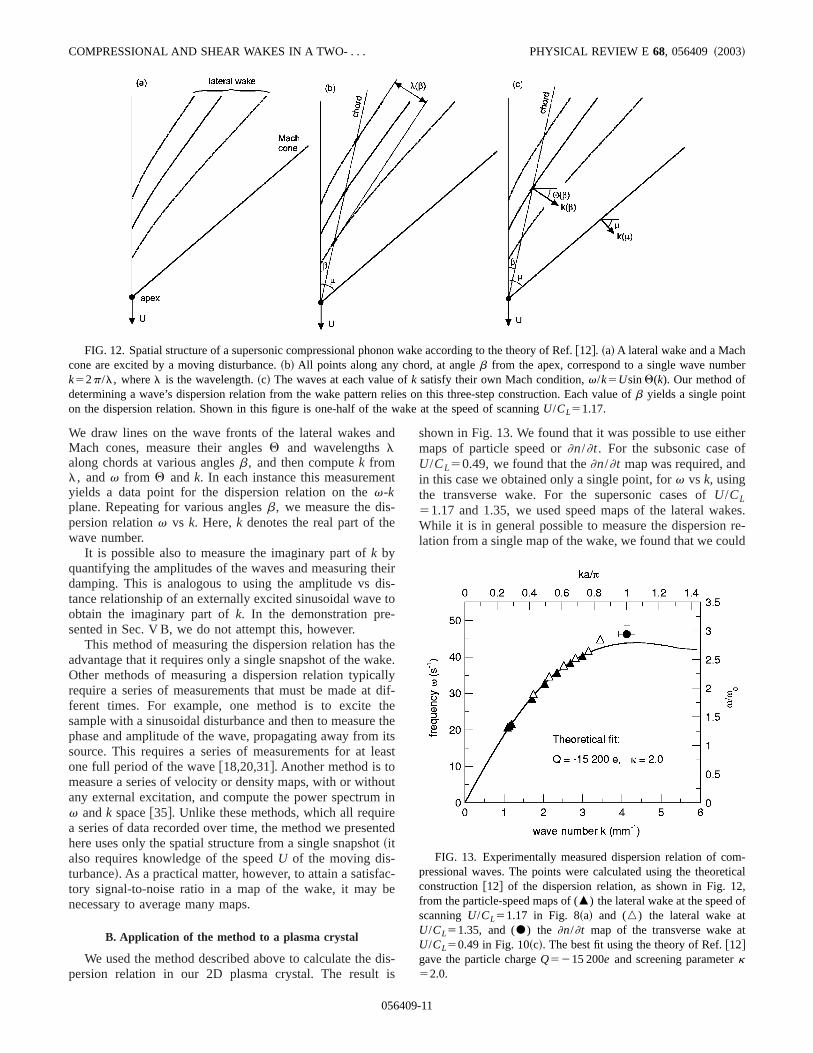
FIG. 12. Spatial structure of a supersonic compressional phonon wake according to the theory of Ref.@12#. ~a! A lateral wake and a Machcone are excited by a moving disturbance.~b! All points along any chord, at angleb from the apex, correspond to a single wave numbk52p/l, wherel is the wavelength.~c! The waves at each value ofk satisfy their own Mach condition,v/k5UsinQ(k). Our method ofdetermining a wave’s dispersion relation from the wake pattern relies on this three-step construction. Each value ofb yields a single pointon the dispersion relation. Shown in this figure is one-half of the wake at the speed of scanningU/CL51.17.
n
n
-e
heist
-
thakallt dth
ti
le
ou
en
ot
acbe
di
herf
kes.re-ld
m-tical2,f
t
We draw lines on the wave fronts of the lateral wakes aMach cones, measure their anglesQ and wavelengthslalong chords at various anglesb, and then computek froml, andv from Q andk. In each instance this measuremeyields a data point for the dispersion relation on thev-kplane. Repeating for various anglesb, we measure the dispersion relationv vs k. Here,k denotes the real part of thwave number.
It is possible also to measure the imaginary part ofk byquantifying the amplitudes of the waves and measuring tdamping. This is analogous to using the amplitude vs dtance relationship of an externally excited sinusoidal waveobtain the imaginary part ofk. In the demonstration presented in Sec. V B, we do not attempt this, however.
This method of measuring the dispersion relation hasadvantage that it requires only a single snapshot of the wOther methods of measuring a dispersion relation typicrequire a series of measurements that must be made aferent times. For example, one method is to excitesample with a sinusoidal disturbance and then to measurephase and amplitude of the wave, propagating away fromsource. This requires a series of measurements for atone full period of the wave@18,20,31#. Another method is tomeasure a series of velocity or density maps, with or withany external excitation, and compute the power spectrumv andk space@35#. Unlike these methods, which all requira series of data recorded over time, the method we presehere uses only the spatial structure from a single snapsh~italso requires knowledge of the speedU of the moving dis-turbance!. As a practical matter, however, to attain a satisftory signal-to-noise ratio in a map of the wake, it maynecessary to average many maps.
B. Application of the method to a plasma crystal
We used the method described above to calculate thepersion relation in our 2D plasma crystal. The result
05640
d
t
ir-o
ee.yif-
ehetsast
tin
ted
-
is-s
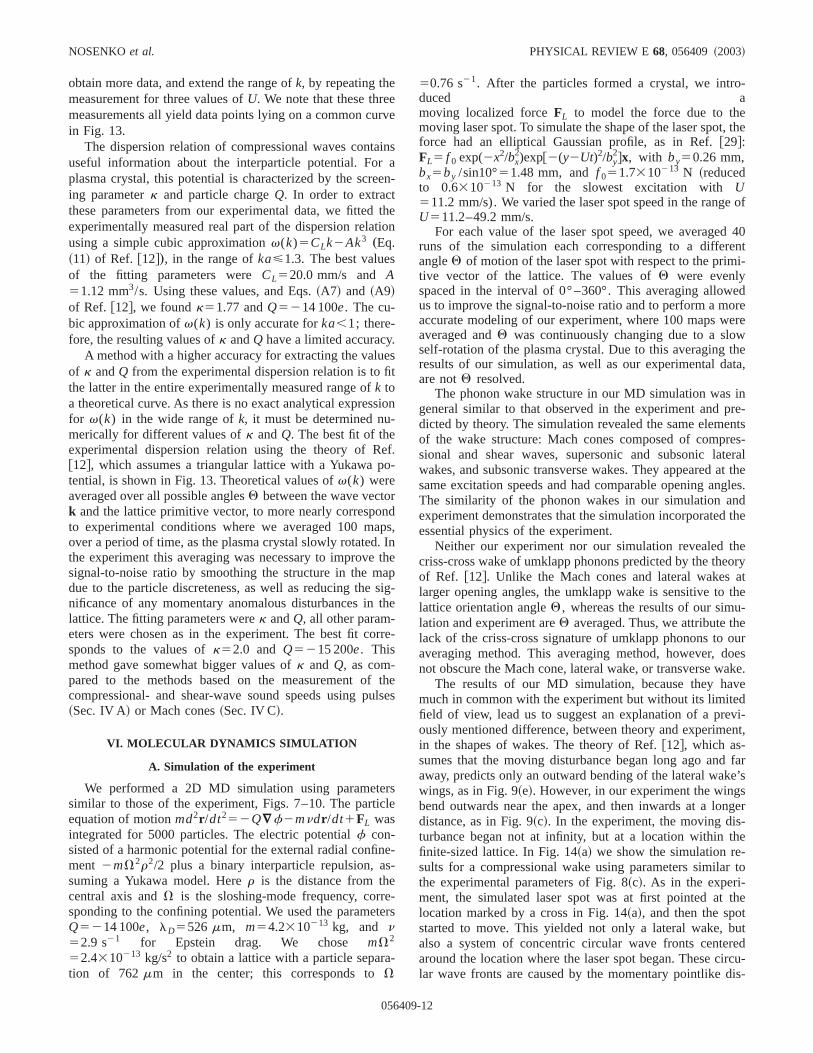
shown in Fig. 13. We found that it was possible to use eitmaps of particle speed or]n/]t. For the subsonic case oU/CL50.49, we found that the]n/]t map was required, andin this case we obtained only a single point, forv vs k, usingthe transverse wake. For the supersonic cases ofU/CL51.17 and 1.35, we used speed maps of the lateral waWhile it is in general possible to measure the dispersionlation from a single map of the wake, we found that we cou
FIG. 13. Experimentally measured dispersion relation of copressional waves. The points were calculated using the theoreconstruction@12# of the dispersion relation, as shown in Fig. 1from the particle-speed maps of (m) the lateral wake at the speed oscanningU/CL51.17 in Fig. 8~a! and (n) the lateral wake atU/CL51.35, and (d) the ]n/]t map of the transverse wake aU/CL50.49 in Fig. 10~c!. The best fit using the theory of Ref.@12#gave the particle chargeQ5215 200e and screening parameterk52.0.
9-11
erv
inae
ttio
.efit
sio-
eo
rnp
. Itasth
rr
tul
rscl
nes-
e-te
a-
-
, the
e of
40enti-
edoreerewtheta,
inre-
entsres-teralt thegles.
ndthe
heoryatthe-eouroesake.vedvi-ent,
fare’ssnger-he-r to
thetut
redircu-is-
NOSENKOet al. PHYSICAL REVIEW E 68, 056409 ~2003!
obtain more data, and extend the range ofk, by repeating themeasurement for three values ofU. We note that these thremeasurements all yield data points lying on a common cuin Fig. 13.
The dispersion relation of compressional waves contauseful information about the interparticle potential. Forplasma crystal, this potential is characterized by the screing parameterk and particle chargeQ. In order to extractthese parameters from our experimental data, we fittedexperimentally measured real part of the dispersion relausing a simple cubic approximationv(k)5CLk2Ak3
„Eq.~11! of Ref. @12#…, in the range ofka<1.3. The best valuesof the fitting parameters wereCL520.0 mm/s andA51.12 mm3/s. Using these values, and Eqs.~A7! and ~A9!of Ref. @12#, we foundk51.77 andQ5214 100e. The cu-bic approximation ofv(k) is only accurate forka,1; there-fore, the resulting values ofk andQ have a limited accuracy
A method with a higher accuracy for extracting the valuof k andQ from the experimental dispersion relation is tothe latter in the entire experimentally measured range ofk toa theoretical curve. As there is no exact analytical expresfor v(k) in the wide range ofk, it must be determined numerically for different values ofk andQ. The best fit of theexperimental dispersion relation using the theory of R@12#, which assumes a triangular lattice with a Yukawa ptential, is shown in Fig. 13. Theoretical values ofv(k) wereaveraged over all possible anglesQ between the wave vectok and the lattice primitive vector, to more nearly correspoto experimental conditions where we averaged 100 maover a period of time, as the plasma crystal slowly rotatedthe experiment this averaging was necessary to improvesignal-to-noise ratio by smoothing the structure in the mdue to the particle discreteness, as well as reducing thenificance of any momentary anomalous disturbances inlattice. The fitting parameters werek andQ, all other param-eters were chosen as in the experiment. The best fit cosponds to the values ofk52.0 and Q5215 200e. Thismethod gave somewhat bigger values ofk and Q, as com-pared to the methods based on the measurement ofcompressional- and shear-wave sound speeds using p~Sec. IV A! or Mach cones~Sec. IV C!.
VI. MOLECULAR DYNAMICS SIMULATION
A. Simulation of the experiment
We performed a 2D MD simulation using parametesimilar to those of the experiment, Figs. 7–10. The partiequation of motionmd2r /dt252Q“f2mndr /dt1FL wasintegrated for 5000 particles. The electric potentialf con-sisted of a harmonic potential for the external radial confiment 2mV2r2/2 plus a binary interparticle repulsion, asuming a Yukawa model. Herer is the distance from thecentral axis andV is the sloshing-mode frequency, corrsponding to the confining potential. We used the parameQ5214 100e, lD5526 mm, m54.2310213 kg, and n52.9 s21 for Epstein drag. We chose mV2
52.4310213 kg/s2 to obtain a lattice with a particle separtion of 762mm in the center; this corresponds toV
05640
e
s
n-
hen
s
n
f.-
ds,nhepig-e
e-
heses
e
-
rs
50.76 s21. After the particles formed a crystal, we introduced amoving localized forceFL to model the force due to themoving laser spot. To simulate the shape of the laser spotforce had an elliptical Gaussian profile, as in Ref.@29#:FL5 f 0 exp(2x2/bx
2)exp@2(y2Ut)2/by2#x, with by50.26 mm,
bx5by /sin10°51.48 mm, andf 051.7310213 N ~reducedto 0.6310213 N for the slowest excitation withU511.2 mm/s). We varied the laser spot speed in the rangU511.2–49.2 mm/s.
For each value of the laser spot speed, we averagedruns of the simulation each corresponding to a differangleQ of motion of the laser spot with respect to the primtive vector of the lattice. The values ofQ were evenlyspaced in the interval of 0° –360°. This averaging allowus to improve the signal-to-noise ratio and to perform a maccurate modeling of our experiment, where 100 maps waveraged andQ was continuously changing due to a sloself-rotation of the plasma crystal. Due to this averagingresults of our simulation, as well as our experimental daare notQ resolved.
The phonon wake structure in our MD simulation wasgeneral similar to that observed in the experiment and pdicted by theory. The simulation revealed the same elemof the wake structure: Mach cones composed of compsional and shear waves, supersonic and subsonic lawakes, and subsonic transverse wakes. They appeared asame excitation speeds and had comparable opening anThe similarity of the phonon wakes in our simulation aexperiment demonstrates that the simulation incorporatedessential physics of the experiment.
Neither our experiment nor our simulation revealed tcriss-cross wake of umklapp phonons predicted by the theof Ref. @12#. Unlike the Mach cones and lateral wakeslarger opening angles, the umklapp wake is sensitive tolattice orientation angleQ, whereas the results of our simulation and experiment areQ averaged. Thus, we attribute thlack of the criss-cross signature of umklapp phonons toaveraging method. This averaging method, however, dnot obscure the Mach cone, lateral wake, or transverse w
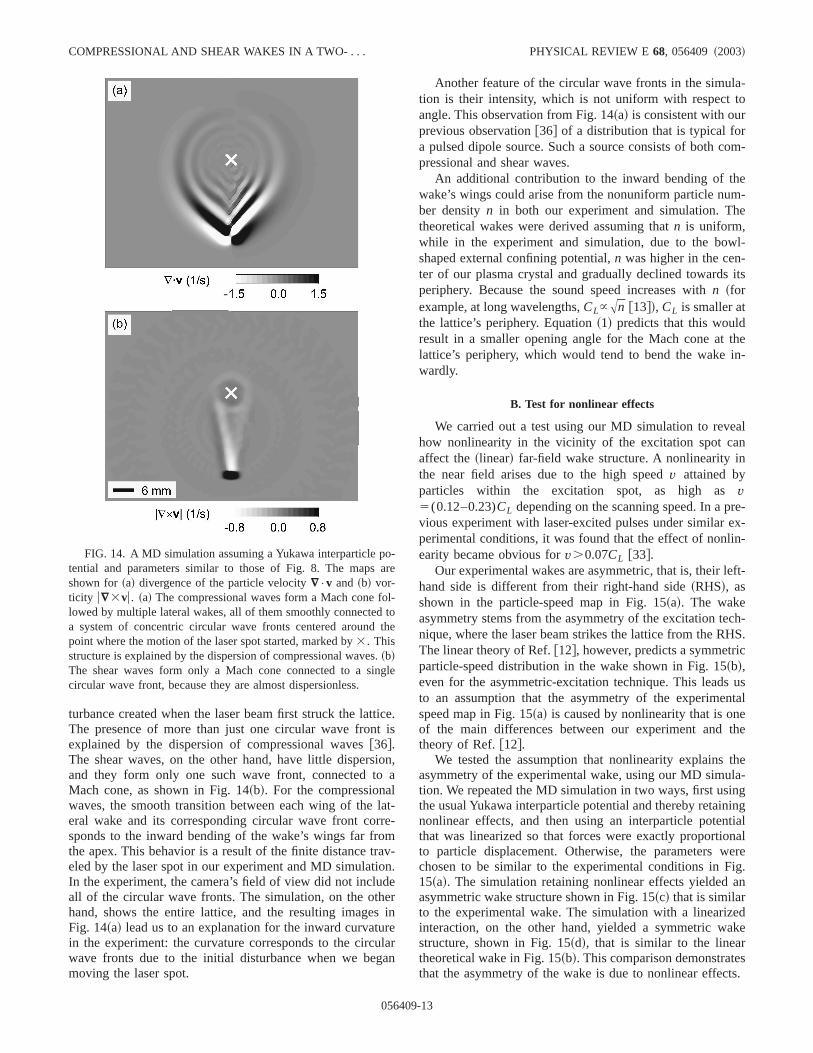
The results of our MD simulation, because they hamuch in common with the experiment but without its limitefield of view, lead us to suggest an explanation of a preously mentioned difference, between theory and experimin the shapes of wakes. The theory of Ref.@12#, which as-sumes that the moving disturbance began long ago andaway, predicts only an outward bending of the lateral wakwings, as in Fig. 9~e!. However, in our experiment the wingbend outwards near the apex, and then inwards at a lodistance, as in Fig. 9~c!. In the experiment, the moving disturbance began not at infinity, but at a location within tfinite-sized lattice. In Fig. 14~a! we show the simulation results for a compressional wake using parameters similathe experimental parameters of Fig. 8~c!. As in the experi-ment, the simulated laser spot was at first pointed atlocation marked by a cross in Fig. 14~a!, and then the spostarted to move. This yielded not only a lateral wake, balso a system of concentric circular wave fronts centearound the location where the laser spot began. These clar wave fronts are caused by the momentary pointlike d
9-12
tict
io
llarem
avondeesre
ula
la-o
om-
em-e
l-
its
thein-
aln
re-ex-in-
eft-
ch-HS.c
usntalethe
thela-ngingtialnalereig.an
edke
sts.
o-a
ol-tth
.ng
COMPRESSIONAL AND SHEAR WAKES IN A TWO- . . . PHYSICAL REVIEW E 68, 056409 ~2003!
turbance created when the laser beam first struck the latThe presence of more than just one circular wave fronexplained by the dispersion of compressional waves@36#.The shear waves, on the other hand, have little dispersand they form only one such wave front, connected toMach cone, as shown in Fig. 14~b!. For the compressionawaves, the smooth transition between each wing of theeral wake and its corresponding circular wave front corsponds to the inward bending of the wake’s wings far frothe apex. This behavior is a result of the finite distance treled by the laser spot in our experiment and MD simulatiIn the experiment, the camera’s field of view did not incluall of the circular wave fronts. The simulation, on the othhand, shows the entire lattice, and the resulting imageFig. 14~a! lead us to an explanation for the inward curvatuin the experiment: the curvature corresponds to the circwave fronts due to the initial disturbance when we begmoving the laser spot.
FIG. 14. A MD simulation assuming a Yukawa interparticle ptential and parameters similar to those of Fig. 8. The mapsshown for~a! divergence of the particle velocity“•v and ~b! vor-ticity u“3vu. ~a! The compressional waves form a Mach cone flowed by multiple lateral wakes, all of them smoothly connecteda system of concentric circular wave fronts centered aroundpoint where the motion of the laser spot started, marked by3. Thisstructure is explained by the dispersion of compressional waves~b!The shear waves form only a Mach cone connected to a sicircular wave front, because they are almost dispersionless.
05640
e.is
n,a
t--
-.
rin
arn
Another feature of the circular wave fronts in the simution is their intensity, which is not uniform with respect tangle. This observation from Fig. 14~a! is consistent with ourprevious observation@36# of a distribution that is typical fora pulsed dipole source. Such a source consists of both cpressional and shear waves.
An additional contribution to the inward bending of thwake’s wings could arise from the nonuniform particle nuber densityn in both our experiment and simulation. Ththeoretical wakes were derived assuming thatn is uniform,while in the experiment and simulation, due to the bowshaped external confining potential,n was higher in the cen-ter of our plasma crystal and gradually declined towardsperiphery. Because the sound speed increases withn ~forexample, at long wavelengths,CL}An @13#!, CL is smaller atthe lattice’s periphery. Equation~1! predicts that this wouldresult in a smaller opening angle for the Mach cone atlattice’s periphery, which would tend to bend the wakewardly.
B. Test for nonlinear effects
We carried out a test using our MD simulation to revehow nonlinearity in the vicinity of the excitation spot caaffect the~linear! far-field wake structure. A nonlinearity inthe near field arises due to the high speedv attained byparticles within the excitation spot, as high asv5(0.12–0.23)CL depending on the scanning speed. In a pvious experiment with laser-excited pulses under similarperimental conditions, it was found that the effect of nonlearity became obvious forv.0.07CL @33#.
Our experimental wakes are asymmetric, that is, their lhand side is different from their right-hand side~RHS!, asshown in the particle-speed map in Fig. 15~a!. The wakeasymmetry stems from the asymmetry of the excitation tenique, where the laser beam strikes the lattice from the RThe linear theory of Ref.@12#, however, predicts a symmetriparticle-speed distribution in the wake shown in Fig. 15~b!,even for the asymmetric-excitation technique. This leadsto an assumption that the asymmetry of the experimespeed map in Fig. 15~a! is caused by nonlinearity that is onof the main differences between our experiment andtheory of Ref.@12#.
We tested the assumption that nonlinearity explainsasymmetry of the experimental wake, using our MD simution. We repeated the MD simulation in two ways, first usithe usual Yukawa interparticle potential and thereby retainnonlinear effects, and then using an interparticle potenthat was linearized so that forces were exactly proportioto particle displacement. Otherwise, the parameters wchosen to be similar to the experimental conditions in F15~a!. The simulation retaining nonlinear effects yieldedasymmetric wake structure shown in Fig. 15~c! that is similarto the experimental wake. The simulation with a linearizinteraction, on the other hand, yielded a symmetric wastructure, shown in Fig. 15~d!, that is similar to the lineartheoretical wake in Fig. 15~b!. This comparison demonstratethat the asymmetry of the wake is due to nonlinear effec
re
oe
le
9-13

le.e
d-re
e
NOSENKOet al. PHYSICAL REVIEW E 68, 056409 ~2003!
FIG. 15. The role of nonlinearity in thewake’s asymmetry. The maps show the particspeedv for ~a! the experimental wake of Fig8~a!, ~b! linear theoretical wake predicted by ththeory of Ref.@15#, ~c! the results of a MD simu-lation with a Yukawa interparticle potential, an~d! the results of a MD simulation with a linearized interparticle potential. The parameters asimilar to those of Fig. 8. The linear wakes in~b!and ~d! are symmetrical; the asymmetry of thwakes in~a! and ~c! is caused by nonlinearity inthe vicinity of the excitation spot.
thx
tehihe
i
dlommerpo
th
or
d
e
es.ingthe
by a
thea
llyela-s-tal,
er
fulorkart-he
-
These nonlinearities are localized in the near field, yetwake in the far field is also asymmetric. This can be eplained simply because the waves in the far field originain the near field. Waves in the far field are linear, and for treason we used only the wake structure in the far field wcalculating the compressional wave’s dispersion relationFig. 13.
VII. SUMMARY
We observed and measured the phonon wakes formecompressional and shear waves in a 2D screened-Coucrystal. Our experimental system was a 2D dusty plascrystal, arranged in a triangular lattice with a repulsive intparticle potential. The wakes were excited by a moving sof the Ar1 laser light.
The experimentally observed phonon wakes agreed infar field with the linear theory of Ref.@12# and a 2D MDsimulation, both of which assume a Yukawa interparticle ptential. We observed additional types of phonon wakes pdicted by the theory of Ref.@12#, the subsonic lateral antransverse wakes, which were not previously reporteddusty plasma experiments. The phonon wake structure is
05640
e-dsnn
byb
a-t
e
-e-
inx-
plained by the dispersive properties of the constituent wavWe developed a generally useful technique of calculat
the dispersion relation of compressional waves, based onanalysis of the spatial structure of phonon wakes createdmoving disturbance, according to the theory of Ref.@12#. Anadvantage of this technique is that a single snapshot ofwake is sufficient to calculate the dispersion relation inwide range of wave numbers. By fitting the experimentameasured dispersion relation to a theoretical dispersion rtion assuming a particular interparticle potential, it is posible to characterize the potential. For our plasma crysthis method yielded values of the screening parameterk andparticle chargeQ that agreed with those obtained by othmethods.
ACKNOWLEDGMENTS
We thank A. Bhattacharjee and S. Nunomura for helpdiscussions and L. Boufendi for TEM measurements. Wat Iowa was supported by NASA, NSF, and the U.S. Depment of Energy. D.H.E.D. acknowledges support from tNSF ~Grant No. PHY-9876999! and ONR ~Grant No.N00014-96-1-0239!. A.P. acknowledges the DFG for supporting his sabbatical leave under Grant No. Pi185/21-1.
@1# N. Cheng, Zh. Zhu, C.H. Cheng, and M.N. Tokso¨z, Geophys.Prospect.42, 303 ~1994!.
@2# P. Gumbsch and H. Gao, Science283, 965 ~1999!.@3# J.H. Chu and I. Lin, Phys. Rev. Lett.72, 4009~1994!.@4# H. Thomaset al., Phys. Rev. Lett.73, 652 ~1994!.@5# Y. Hayashi and K. Tachibana, Jpn. J. Appl. Phys., Part 233,
L804 ~1994!.@6# A. Melzer, T. Trottenberg, and A. Piel, Phys. Lett. A191, 301
~1994!.@7# U. Konopka, G.E. Morfill, and L. Ratke, Phys. Rev. Lett.84,
891 ~2000!.@8# A. Homannet al., Phys. Rev. E56, 7138~1997!.@9# F. Behroozi, Langmuir12, 2289~1996!.
@10# F.M. Peeters and X. Wu, Phys. Rev. A35, 3109~1987!.@11# R.S. Crandall, Phys. Rev. A8, 2136~1973!.@12# D.H.E. Dubin, Phys. Plasmas7, 3895~2000!.
9-14
ett
el
je
.
o
T.
ys.
tt.
as
. E
ci.
and
oc.
COMPRESSIONAL AND SHEAR WAKES IN A TWO- . . . PHYSICAL REVIEW E 68, 056409 ~2003!
@13# X. Wang, A. Bhattacharjee, and S. Hu, Phys. Rev. Lett.86,2569 ~2001!.
@14# P.K. Kaw and A. Sen, Phys. Plasmas5, 3552~1998!.@15# M.S. Murillo, Phys. Rev. Lett.85, 2514~2000!.@16# M. Rosenberg and G. Kalman, Phys. Rev. E56, 7166~1997!.@17# G. Kalman, M. Rosenberg, and H.E. DeWitt, Phys. Rev. L
84, 6030~2000!.@18# J.B. Pieper and J. Goree, Phys. Rev. Lett.77, 3137~1996!.@19# A. Homann, A. Melzer, S. Peters, R. Madani, and A. Pi
Phys. Lett. A242, 173 ~1998!.@20# S. Nunomura, J. Goree, S. Hu, X. Wang, and A. Bhattachar
Phys. Rev. E65, 066402~2002!.@21# S. Nunomura, D. Samsonov, and J. Goree, Phys. Rev. Lett84,
5141 ~2000!.@22# H. Ohta and S. Hamaguchi, Phys. Rev. Lett.84, 6026~2000!.@23# O. Havnes, T. Aslaksen, T.W. Hartquist, F. Li, F. Melands”,
G.E. Morfill, and T. Nitter, J. Geophys. Res.100, 1731~1995!.@24# O. Havnes, F. Li, T. Aslaksen, T.W. Hartquist, G.E. Morfill,
Nitter, and V. Tsytovich, J. Vac. Sci. Technol. A14, 525~1996!.@25# A. Brattli, O. Havnes, and F. Melandso”, Phys. Plasmas9, 958
~2002!.
05640
.
,
e,
@26# D. Samsonovet al., Phys. Rev. Lett.83, 3649~1999!.@27# D. Samsonov, J. Goree, H.M. Thomas, and G.E. Morfill, Ph
Rev. E61, 5557~2000!.@28# A. Melzer et al., Phys. Rev. E62, 4162~2000!.@29# V. Nosenko, J. Goree, Z.W. Ma, and A. Piel, Phys. Rev. Le
88, 135001~2002!.@30# Z.W. Ma and A. Bhattacharjee, Phys. Plasmas9, 3349~2002!.@31# B. Liu, J. Goree, V. Nosenko, and L. Boufendi, Phys. Plasm
10, 9 ~2003!.@32# S. Hamaguchi, R.T. Farouki, and D.H.E. Dubin, Phys. Rev
56, 4671~1997!.@33# V. Nosenko, S. Nunomura, and J. Goree, Phys. Rev. Lett.88,
215002~2002!.@34# Th. Trottenberg, A. Melzer, and A. Piel, Plasma Sources S
Technol.4, 450 ~1995!.@35# S. Nunomura, J. Goree, S. Hu, X. Wang, A. Bhattacharjee,
K. Avinash, Phys. Rev. Lett.89, 035001~2002!.@36# A. Piel, V. Nosenko, and J. Goree, Phys. Rev. Lett.89, 085004
~2002!.@37# W.H. Munk, P. Scully-Power, and F. Zachariasen, Proc. R. S
London, Ser. A412, 231 ~1987!.
9-15