Embed Size (px)
Citation preview

Comprehensive Studies on Amino Acid BasedOrganometallic L-Threoninum Cobalt (Ii) Sulfate(Ltcs) Single CrystalS V ASHVIN SANTHIA ( [email protected] )
NESAMONY MEMORIAL CHRISTIAN COLLEGE https://orcid.org/0000-0001-8009-6564B ANEEBA
NESAMONY MEMORIAL CHRISTIAN COLLEGES VINU
Arts and Science College,NAGERCOILR SHEELA CHRISTY
NESAMONY MEMORIAL CHRISTIAN COLLEGE
Research Article
Keywords: Crystal growth, Optical constants, , NLO properties, Mechanical behavior, Antimicrobial assay
Posted Date: March 6th, 2021
DOI: https://doi.org/10.21203/rs.3.rs-279768/v1
License: This work is licensed under a Creative Commons Attribution 4.0 International License. Read Full License

COMPREHENSIVE STUDIES ON AMINO ACID BASED ORGANOMETALLIC
L-THREONINUM COBALT (II) SULFATE (LTCS) SINGLE CRYSTAL
S.V.ASHVIN SANTHIA1*, B.ANEEBA2, S.VINU3, R.SHEELA CHRISTY4
1* Department of Physics and Research Centre, Nesamony Memorial Christian College, Marthandam,
Reg.No: 18123112132036, Affiliated to Manonmaniam Sundaranar University, Abishekapatti, Tirunelveli,
Tamil Nadu, India.
2 , 4 Department of Physics and Research Centre, Nesamony Memorial Christian College, Marthandam, Tamil
Nadu, India.
3 Department of Physics, Govt. Arts and Science College, Nagercoil, Tamil Nadu, India.
*Corresponding authors: [email protected], [email protected]
ABSTRACT
By the most widely used slow evaporation technique at room temperature, L-Threoninum Cobalt (II)
Sulfate Heptahydrate (LTCS) materials were grown for various applications. The structure of orthorhombic
LTCS was identified by X-Ray Diffraction studies (Powder X-Ray Diffraction and Single crystal X-Ray
Diffraction), this analysis has also reported the crystallinity, cell parameters (a= 5.35, b= 7.93, c=13.71), and
space group (non-centrosymmetric) of the grown material. Functional groups were affirmed by FTIR
analysis. Optical analysis straightforwardly confirms LTCS crystals has greater optical transparency, and
Eg= 5.6 eV demonstrates the appropriateness of prepared crystals to optical applications. The mechanical
properties were validated with the aid of Vickers' microhardness measurement and that also suggests LTCS
belongs to the class of hard material. In this respect, the SHG efficiency of the LTCS crystal grown is 1.25
times greater than that of the KDP crystal because Co+ ions boost the SHG efficiency of LTCS and it was
tested by Kurtz and Perry's technique. Electrical results documented the good conducting properties of LTCS
crystal. The LTCS substance used to treat fungal and bacterial infections and this bacterial and fungal
destroying property was validated by an antimicrobial assay.
Keywords
Crystal growth, Optical constants, , NLO properties, Mechanical behavior, Antimicrobial assay.
1 INTRODUCTION
In the newest scenario, crystal growth plays an interdisciplinary activity in numerous areas of
physics, chemistry, and molecular biology due to its notable benefits. In the age of informatics; in multi-
disciplinary nature of technology (information) is handled at high speed by integrated circuits built on a
single crystal. On the other hand, in microelectronics, communication technology, energy and space
technology single crystal with high quality is required, because single crystals are capable of changing their
properties under the influence of light, electric and magnetic field, temperature and pressure, etc. Among
various organic and inorganic materials, semi-organic materials cater to an innumerable scope in various
practical applications. At present amino acids combined with a variety of inorganic materials single crystals
can be formed and they have received broad attention for the above-mentioned applications, because in the
zwitterionic state amino acid may produce an added betterment in various practical applications
[1,2]. Unlike other amino acids, L-threonine is capable of forming compounds with organic and inorganic
compounds, and also it is an essential amino acid often used to support the production of connective tissue
[3, 4]. Inorganic Cobalt (II) Sulfate has lot of applications such as preparation of pigments and manufacture
of other cobalt salts etc., and also it may play a vital role in various biological activities [5, 6].
2 MATERIALS AND METHODS
2.1 Materials and crystal growth
A comfortable slow evaporation solution growth mechanism was used at a constant temperature for
the production of high quality LTCS material. The equimolar ratio of L-Threonine and Cobalt (II) Sulfate
heptahydrate was chosen to take for the production of LTCS substance and it is dissolved in the solvent
(distilled water). For the removal of contaminants, the very well mixture solution was filtered and wrapped in
perforated foil, and preserved in uninterrupted condition for evaporation. The high transparency LTCS single
crystal was gathered after 25-30 days without defects, and is being shown in Fig.1.

.
Fig. 1 Photograph of LTCS single crystal
2.2 Characterization techniques
Only for the determination of unit cell parameters of the titular crystals, the Bruker Kappa APEXII
X-ray diffractometer was used. By using the XPERT-PRO diffractometer with Cu kα radiation (λ= 1.5406
Å), the crystallinity of the LTCS crystal was checked. Functional groups of the LTCS crystals are trialed by
Thermo Nicolet Avatar 370 spectrometers in the frequency region 400-4000 cm-1. By UV-1700 Series
Spectrophotometer optical character of LTCS crystal was measured in the range of 200-800 nm. The
mechanical behavior of LTCS was investigated by an HMV-2T microhardness tester. The mechanical
behavior of grown crystals was validated by an HMV-2T microhardness tester. By the Tonghui TH2826
Precision LCR Meter, the dielectric behavior was observed. To assess the presence of antibacterial activity of
LTCS was carried out by the Agar disk diffusion method with aminoglycoside antibiotics Amikacin as a
control for antibacterial activity and Nystatin was used as a control for fungicide activity studies of the grown
material.
3 RESULTS AND DISCUSSION
3.1 Single crystal X-ray diffraction analysis (SXRD)
The data obtained from SXRD measurement are unit cell parameters, crystal system, and space
group. A system with orthorhombic structured LTCS was identified along with this analysis and also SXRD
confirms the LTCS crystal belongs to non-centrosymmetric space group P212121. The unit cell parameters of
grown sample collected from SXRD measurement are presented in Table 1.

Table 1 Structural parameters of LTCS crystal
Crystal property Parameter
Crystal System Orthorhombic
Space group P212121
Unit cell parameter
a=5.35 , b=7.93 ,
c=13.71
Volume of the unit cell 581Å3
Radiation wavelength λ=0.71073Å
3.2 Powder X-ray diffraction analysis (PXRD)
The grown LTCS crystal has been subjected to PXRD measurement because it provides information
about the symmetry of unit cell, atom position, and displacements of crystalline material via the position and
intensities of the diffraction reflection [7, 8]. The crystalline nature of LTCS and material’s purity were
confirmed by an accurate description of line profile shapes as shown in
Fig. 2.
Fig. 2 Powder XRD pattern of LTCS crystal

3.3 FTIR analysis
FTIR is a non-destructive powerful analytical technique for producing a unique fingerprint of the
sample. Herein the bonding structure and the diverse functional groups for the synthesized crystal were
analyzed by FTIR technique. The resulting FTIR spectrum of LTCS has been illustrated in Fig.3 and it shows
that LTCS molecules exist in the zwitter ionic state due to the presence of amine group, carboxylate group,
and hydrogen bonding [9]. The observed wavenumbers and the proposed assignments of the LTCS crystal’s
FTIR spectrum band are given in Table 2.
Fig.3 FTIR spectra of LTCS crystal

Table 2 FTIR assignments of the LTCS crystal
Wave number Functional group
3585.74 O-H Symmetric stretching
3170.76 NH3+ asymmetric stretching
3032.43 NH3+ stretching
2980.45 CH3 symmetric stretching
2858.90 O-H stretching
2054.46 CH3 stretching
1621.85 NH3+ asymmetric bending
1474.72 NH3+ symmetric bending
1405.95 CO2- symmetric stretching
1353.97 CH3 bending
1293.20 CH3 bending
1250.02 CH3 bending
1180.45 and 1111. 68 NH3 rocking
1042.11 C-N stretching
930.16 C-C stretching
860.59 CO2- bending
774.23 COH torsion
696.66 CO2- Wagging vibration
557.52 C-C-N group deformation vibration
479.96 NH3 torsional mode

3.4 UV-Visible spectral analysis
The improvements that light travels throughout the substance by altering its vector of propagation or
strength with a specific material are described as the optical characteristics of that substance [10]. Including a
very well, the most important optical properties: absorption, propagation, reflection, and refraction. Some
optical constants such as refractive index (n) and extinction coefficient (K) are correlated with these
properties and can be calculated by calculating the reflectance of a material. The transmittance spectrum of
the LTCS crystal in Fig. 4.1 shows a wide transparency window from 235 to 800 nm and no absorbance in
the entire wavelength indicating that the LTCS crystal possess greater optical transparency and the prepared
crystals were suitable for NLO applications [11-13]. In this present work the value of Eg=5.6 eV obtained
from
Fig. 4.2. The optical absorption coefficient (α) and Eg according to Tauc’s relationship is given by [14]
2.303 1log
t T 1
where T is the transmittance and t is thickness of crystal.
)( g
nh A h E 2
where A is a constant, Eg the optical band gap, h the plank’s constant and ν the
frequency of incident photons and value of n is depend upon the nature of transition.

Fig. 4.1 Transmission spectra of LTCS crystal
Fig. 4.2 Plot of (αhν)2 versus Photon energy (hν) of LTCS crystal
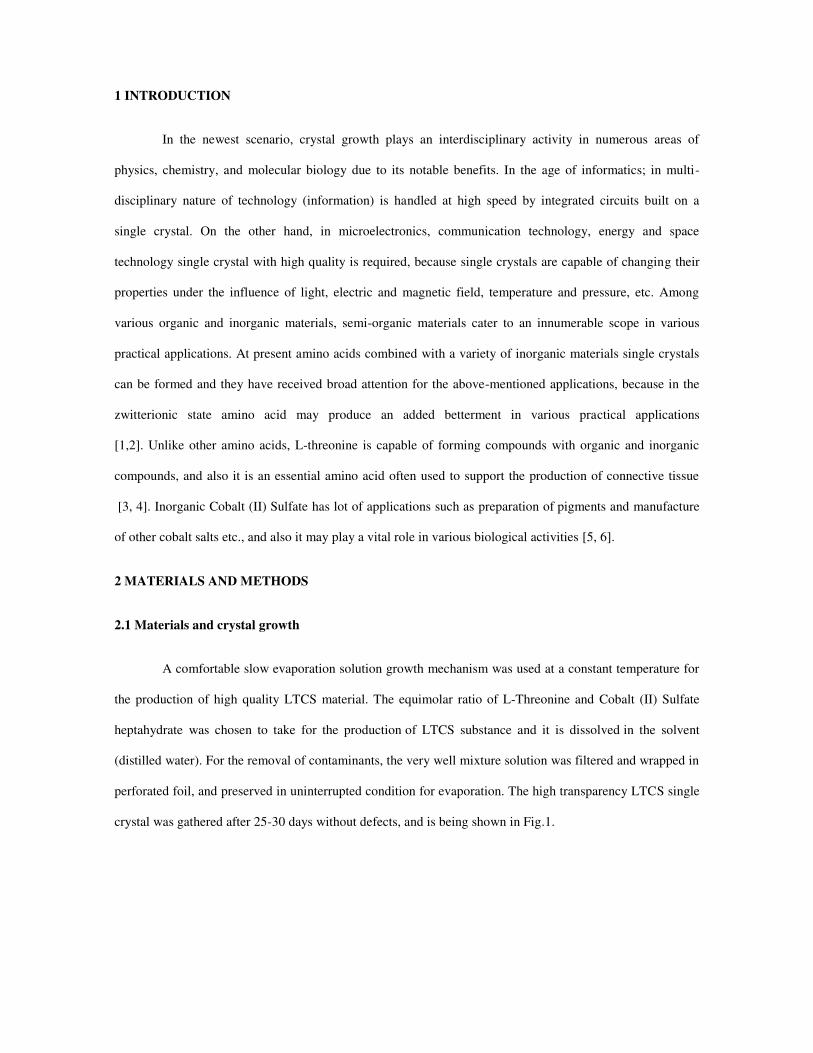
The absorption loss (K) due to propagation of the electromagnetic wave is shown in Fig. 4.3 and it
shows K is not constant, but still depends strongly on the frequency of light. The obtained n of the grown
crystal plotted against photon energy as shown in Fig. 4.4.It is observed from the figure that, n values are
between 0.9 and 1.6. This confirms the high transmittance nature of the grown material [15, 16]. The
following formulas are used for calculating K and refractive index.
4K
3
4
where R is reflectance, t is thickness of crystal.
21 3 10 3
2 1
R R Rn
R
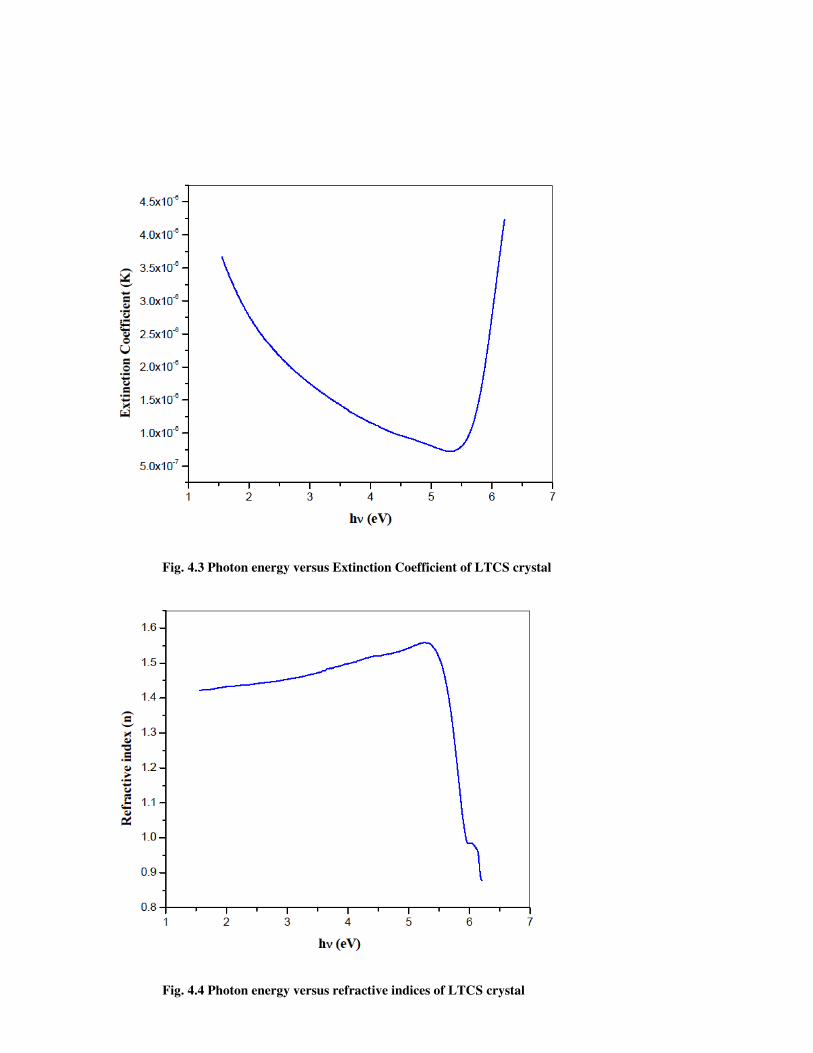
Fig. 4.3 Photon energy versus Extinction Coefficient of LTCS crystal
Fig. 4.4 Photon energy versus refractive indices of LTCS crystal
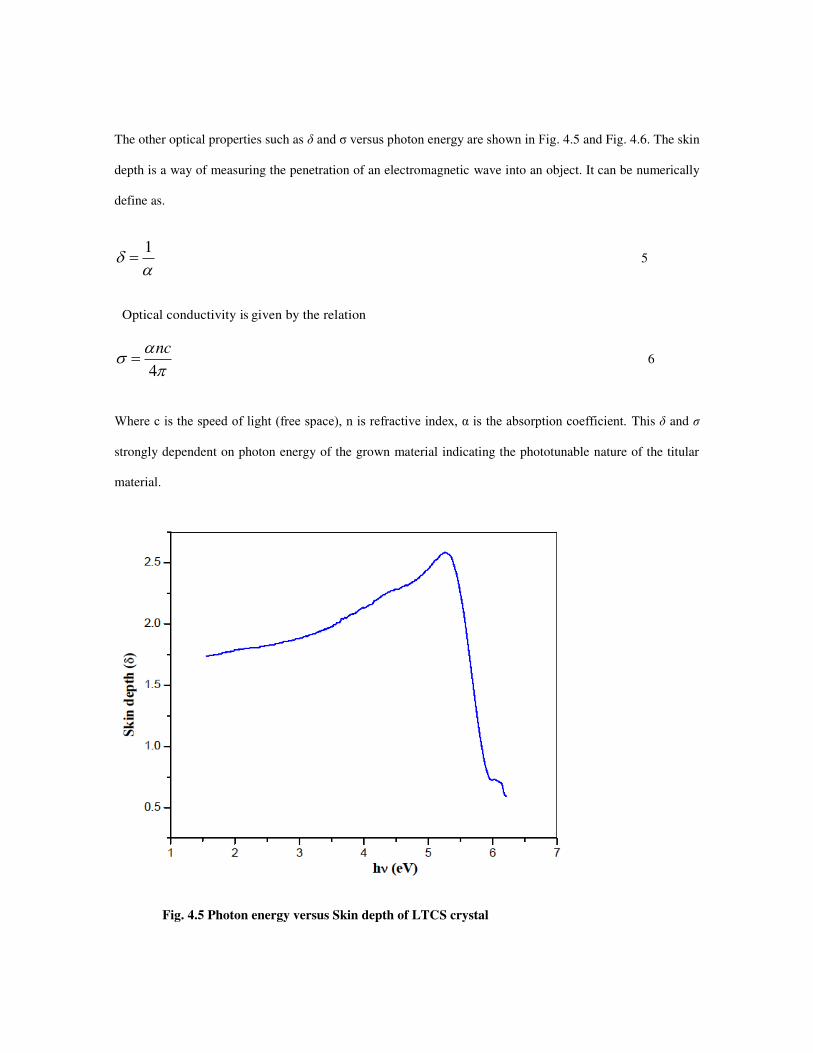
The other optical properties such as δ and σ versus photon energy are shown in Fig. 4.5 and Fig. 4.6. The skin
depth is a way of measuring the penetration of an electromagnetic wave into an object. It can be numerically
define as.
1
5
Optical conductivity is given by the relation
4nc
6
Where c is the speed of light (free space), n is refractive index, α is the absorption coefficient. This δ and σ
strongly dependent on photon energy of the grown material indicating the phototunable nature of the titular
material.
Fig. 4.5 Photon energy versus Skin depth of LTCS crystal

Fig. 4.6 Photon energy versus optical conductivity of LTCS crystal
3.5 Hardness measurement
Hardness is a simple parameter to measure the resistance of the material to permanent deformation.
For most materials hardness measurements can be made at low loads < 200 gram is called microhardness.
This low load hardness is a major parameter to evaluate the mechanical property such as Hardness (Hv),
Fracture toughness (Kc), Brittleness index (Bi), Yield strength (σv), Stiffness constant (C11) of the material by
varying the load below 200 gram [17,18]. With the help of this simple and popular non-destructive
measurement the mechanical characterizations of the LTCS material was studied. The indentations on the
LTCS crystal were carried out under different loads between 25 g and 100g. When the loaded indenter is
pressed on the surface of the material it creates dislocations and the movement of dislocation is obstructed by
impurities, other dislocations, grain boundaries, some intrinsic properties of the materials, and the like. Thus,
if the material high quality, defect free, the hardness is high. The mechanical parameters of the titular
material are presented in Table 6.3.
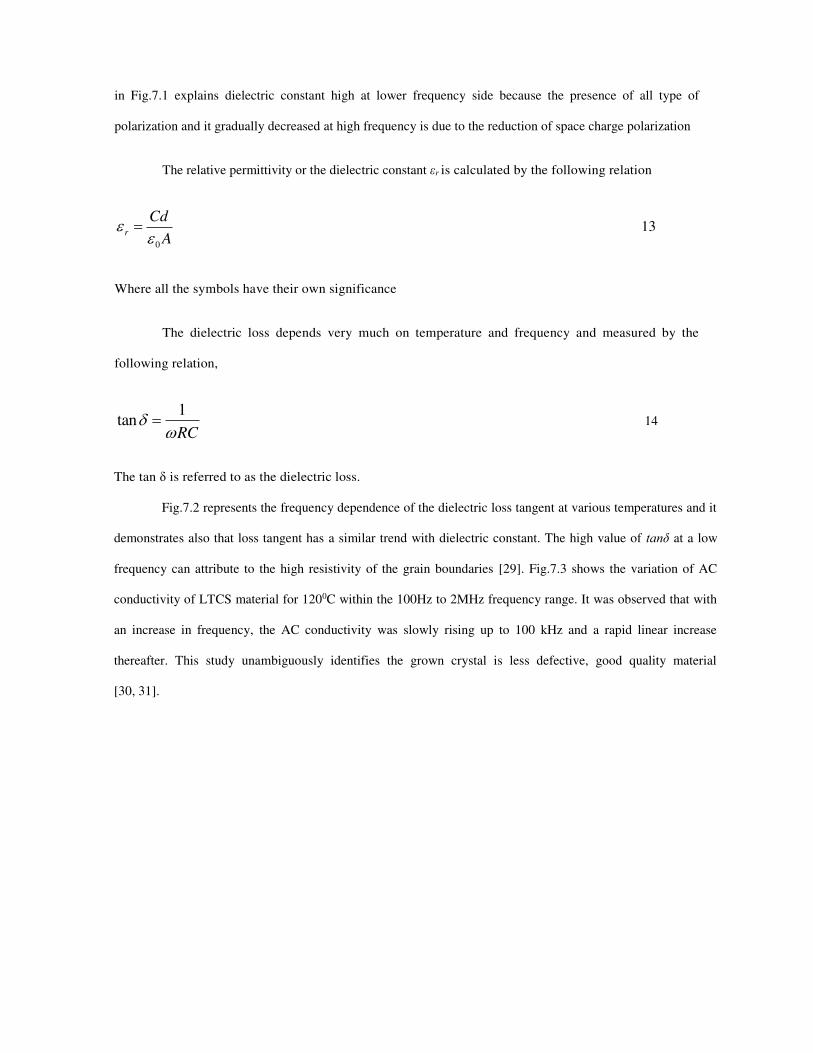
For LTCS material Hv increase with rising load indicates RISE (reverse indentation size effect
RISE) which is presented in Fig.5.1. The work hardening coefficient (n) value of LTCS crystal is 3.7, which
is obtained from Fig.5.2, and it confirms that LTCS is a soft material category. The Vickers hardness number
is thus calculated using the relation [19]

2H 1.8544P / d 7
Where P is the applied load in kg and d is the diagonal length of the indentation mark in mm.
Fig. 5.1 Hardness versus load P of LTCS crystal
Fig. 5.2 Log P versus Log d of LTCS crystal

Fracture toughness is the property of materials able to resist the fracture and the following relation is
used to calculate Kc (Fracture toughness),
3/2c
PK
C 8
Increase in Kc with applied load indicates high mechanical stability of the LTCS material (Fig.5.3).
Fig. 5.3 Fracture toughness versus load P of LTCS crystal
Fig.5.4 shows decrease in brittleness index (Bi) with increase in load indicates LTCS material is suitable for
device fabrication. Brittleness index (Bi) can be calculated by the following relation,
vi
c
HB
K 9

Fig.5.4 Brittleness index versus load P of LTCS crystal
In device manufacturing and construction technology, yield strength seems to be a very significant
mechanical property and it is calculated by using the relation [20, 21].
2
12.5( 2)1 ( 2)
2.9 (1 ( 2))
n
vv
H nn
n
for n > 2 10
3v
v
H for n < 2 11
where n is the microhardness index.
The increase in yield strength (Fig. 5.5) indicates the selection of materials for the field of
engineering.

Fig. 5.5 Yield Strength versus load P of LTCS crystal
The stiffness constant C11 can determine using Wooster’s empirical formula,
7/411 ( )
vC H 12
Due to the high bonding nature of grown material, stiffness constant (C11) increased by increasing load
(Fig.5.6).

Fig. 5.6 Stiffness constant versus load P of LTCS crystal
Table 4 Mechanical parameters of LTCS crystal
Load P (g)
(HV) (kg/mm2)
(KC)
(×104kg/m-3/2)
(Bi)
(×10-2m-1/2)
(σv) (GPa)
(C11)
(×10-14Pa)
25
33.75
0.760
44.360
0.413
4.725
50
48.85
1.521
32.103
0.599
9.026
100
72.65
3.043
23.872
0.891
18.07
3.6 SHG measurement
The titular material was illuminated by the Q-switched Nd: YAG laser of λ=1064nm and the output
energy (green light of λ = 532 nm) were analyzed for the nonlinear SHG efficiency of the LTCS. Thus,
obtained results were compared with standard reference KDP [22-24]. It is evident from the observation that
Co+ ion raises the SHG performance of grown LTCS crystal because the results obtained were 1.25 times
higher than that of standard KDP crystal and it confirms LTCS can be used for numerous NLO applications
[25,26].
3.7 Dielectric studies
The dielectric analysis is indispensable for characterizing the electrical properties of the crystal and it also
provides information related to the nature of defects in the crystal [27,28]. The frequency dependent plot of εr
in Fig.7.1 explains dielectric constant high at lower frequency side because the presence of all type of
polarization and it gradually decreased at high frequency is due to the reduction of space charge polarization
The relative permittivity or the dielectric constant εr is calculated by the following relation
0r
Cd
A
13
Where all the symbols have their own significance
The dielectric loss depends very much on temperature and frequency and measured by the
following relation,
1tan
RC
14
The tan δ is referred to as the dielectric loss.
Fig.7.2 represents the frequency dependence of the dielectric loss tangent at various temperatures and it
demonstrates also that loss tangent has a similar trend with dielectric constant. The high value of tanδ at a low
frequency can attribute to the high resistivity of the grain boundaries [29]. Fig.7.3 shows the variation of AC
conductivity of LTCS material for 1200C within the 100Hz to 2MHz frequency range. It was observed that with
an increase in frequency, the AC conductivity was slowly rising up to 100 kHz and a rapid linear increase
thereafter. This study unambiguously identifies the grown crystal is less defective, good quality material
[30, 31].

Fig.7.1 Plot between dielectric constant and log f of LTCS crystal
Fig.7.2 Plot between dielectric loss and log f of LTCS crystal

Fig.7.3 Plot between ac conductivity and log f of LTCS crystal
3.8 Antimicrobial activity
The microorganism used for study the antibacterial activity of the LTCS material is Pseudomonas
aeruginosa and Staphylococcus aureus. Pseudomonas aeruginosa causes wide variety of infections in humans
such as urinary tract infections, respiratory system infections, soft tissue infections etc. Staphylococcus aureus is
the leading cause of skin and soft tissue infections [32, 33]. Fig.8.1 (a & b) shows the inhibitory activity
produced by two different pathogenic bacteria Pseudomonas aeruginosa and Staphylococcus aureus. After
incubation, the zone of inhibition surrounding the disc was measured in millimeter and the obtained results are
presented in Table 5. Among the two bacteria, Staphylococcus aureus showed high antibacterial activity
(31 mm) than the control (28 mm) and also Pseudomonas aeruginosa have nearly equal activity of control.
According to the results of this study, LTCS crystal has substantial antibacterial activity on Staphylococcus
aureus than Pseudomonas aeruginosa. However, in this present study confirms the grown material is used to
treat various bacterial infections produced by the given microorganism [34-36].
To access the antifungal activity of the grown sample using Candida albicans and Aspergillus flavus as
test organisms. Some health problems caused by Aspergillus flavus include allergic reactions, lung infections,
and infections in other organs. Candida albicans is not problematic at normal levels, when it grow

uncontrollably the healthy bacteria levels are minimized this causes fungal infections in humans [37].
Antifungal susceptibility activity of LTCS crystal is shown in Fig.8.2 (a & b) and the obtained results are
presented in Table 5 and this study confirms the grown material makes high resistance to the most prevalent
opportunistic fungal pathogens Aspergillus flavus than Candida albicans. In the context of above concern, the
grown material is used to treat wide verity of fungal infection.
Table 5 Growth inhibition zones of LTCS crystal
Microorganisms Control (mm) LTCS (mm)
Bacteria
Pseudomonas aeruginosa
Staphylococcus aureus
29
28
28
31
Fungus
Candida albicans
Aspergillus flavus
16
20
16
22

Fig.8.1 Antibacterial activity of LTCS crystal for two bacterial pathogens (a) ZOI of Pseudomonas
aeruginosa (b) ZOI of Staphylococcus aureus
Fig.8.2 Antifungal activity of LTCS crystal for two fungal pathogens (a) Candida albicans (b) Aspergillus
flavus
4. CONCLUSIONS
By using one of the oldest and most widely used slow evaporation crystal growth technique LTCS
materials were grown. Diffraction studies (PXRD and SXRD) revealed the degree of structural order
(crystallinity), cell parameters (a=5.35, b=7.93, c=13.71), structure (orthorhombic), and space group (non-

centrosymmetric) of the LTCS grown material. Functional groups were affirmed by FTIR analysis. Optical
analysis unambiguously affirmed LTCS crystal possess greater optical transparency and Eg=5.6 eV, this
confirms the suitability of the prepared crystals for NLO applications. With the help of Vickers’s
microhardness measurement the mechanical properties were confirmed and also it confirms that LTCS belongs
to the hard material category. For LTCS crystal’s SHG measurement unambiguously identifies Co+ ion raises the
SHG efficiency of 1.25 times higher than that of standard KDP crystal. LTCS’s conducting properties were
affirmed by electrical studies. The grown material has resistance about some bacteria and fungi which was
confirmed by disc diffusion method.
Acknowledgement
The writers wish to express their gratitude to SAIF IIT, Chennai, Archbishop Casimir Instrumentation
Center (ACIC), Tiruchirappalli, Ayya Nadar Janaki ammal College, Sivakasi, for the facilities given for different
analyses.
References
[1] N. Bhuvaneswari, S. Nalini Jayanti, Effect of l-threonine on optical and electrical properties of TTZS
crystal. Mater.Today.5,3378-3389 (2018). https://doi.org/10.1016/j.matpr.2017.11.582
[2] Xiaoting Wang, Ruiying Li, Aogang Liu, Caipeng Yue, Shimin Wang, Jiajia Cheng, Jinpeng Li, Zhongyi
Liu , Syntheses, crystal structures, antibacterial activities of Cu (II) and Ni(II) complexes based on terpyridine
polycarboxylic acid ligand. J. Mol. Struct. 1184, 503-511 (2019). https://doi.org/10.1016/j.molstruc.2019.02.072.
[3] A.A. Al-Sagan, S. Khalil, M.P. Smith, The Benefit of L-Threonine Supplementation on Growth
Performance, Carcass Characteristics, Intestinal Morphology and Litter Quality of Broilers. Rev. Bras. Cienc.
Avic. 20, 753-758 (2018). http://dx.doi.org/10.1590/1806-9061-2018-0764.
[4] S.V.Ashvin Santhia, B.Aneeba, S.Vinu, R.Sheela Christy, Amal M.Al-Mohaimeed, Dunia A.Al Farraj,
Studies on physicochemical and antibacterial deeds of amino acid based L-Threoninum sodium bromide. Saudi
J. Biol. Sci. 27, 2987-2992 (2020). https://doi.org/10.1016/j.sjbs.2020.09.020.
[5] L. M. Cavaco, H. Hasman, M. Stegger, P. S. Andersen, R. Skov, A. C. Fluit, T. Ito, F. M. Aarestrup,
Cloning and occurrence of czrC, a gene conferring cadmium and zinc resistance in methicillin-resistant

Staphylococcus aureus CC398 isolates. Antimicrob. Agents Chemother. 54, 3605-8 (2010).
https://doi.org/10.1128/AAC.00058-10.
[6] D. A. Abila Darling., S. E Joema, Antibacterial activity, optical, mechanical, thermal, and dielectric
properties of L-phenylalanine fumaric acid single crystals for biomedical, optoelectronic, and photonic
applications. J. Mater. Sci.: Mater. 31, 22427–22441 (2020). https://doi:10.1007/s10854-020-04744-2
[7] M.Rajkumar, M.Saravanabhavan, A.Chandramohan, Synthesis, structural, thermal, mechanical, second
harmonic generation efficiency and laser damage threshold studies of 4-dimethylaminopyridinium-3,5-
dicarboxybenzoate trihydrate single crystal. Opt. Mater.72, 247-256 (2017).
https://doi.org/10.1016/j.optmat.2017.06.011
[8] A.Priyadharshini, S.Kalainathan, Synthesis, crystal growth and characterization of third order NLO active
single crystal: 2-(4-ethylbenzylidene) malononitrile (EBM). J. Phys. Chem. Solids.123, 59-69 (2018).
https://doi.org/10.1016/j.jpcs.2018.07.011
[9] S. Masilamani, A. Mohamed Musthafa, P. Krishnamurthi, Synthesis, growth and characterisation of a
semiorganic nonlinear optical material: l-threonine cadmium chloride single crystals. Arab. J. Chem. 10, 3962-
3966 (2017). https://doi.org/10.1016/j.arabjc.2014.06.003
[10] M. Abila Jeba Queen, K.C. Bright, S. Mary Delphine , P. Aji Udhaya, Spectroscopic investigation of
supramolecular organometallic compound L-threonine cadmium acetate monohydrate. Spectrochimica Acta Part
A: Molecular and Biomolecular Spectroscopy. 228, 117802 (2020). https://doi.org/10.1016/j.saa.2019.117802
[11] Roniel L.Araújo, Manoel S.Vasconcelos, Carlos A.Barboza, José X.Lima Neto, Eudenilson
L.Albuquerque, Umberto L.Fulco, DFT calculations of the structural, electronic, optical and vibrational
properties of anhydrous orthorhombic L-threonine crystalsComput. Theor. Chem. 1170, 112621 (2019).
https://doi.org/10.1016/j.comptc.2019.112621
[12] J.H. Joshi, S. Kalainathan, D.K. Kanchan, M.J. Joshi, K.D. Parikh, Effect of L-threonine on growth and
properties of ammonium dihydrogen phosphate crystal. Arab. J. Chem. 13, 1532-1550 (2020). https://www.x-
mol.com/paperRedirect/492742

[13] J.Chandrasekaran, P.Ilayabarathi, P.Maadeswaran, Crystal growth and characterization of L-valine
cadmium acetate a semiorganic NLO crystals. Opt. Commun. 285, 3872-3876 (2012).
http://dx.doi.org/10.13005/ojc/290416
[14] J. Tauc, Amorphous and liquid semiconductors, J. Tauc Ed.Plenum, New York, 1974.
[15] P.Karuppasamy, T.Kamalesh, K.Anitha, MuthuSenthil Pandian, P.Ramasamy, SunilVerma, Design and
growth of novel organic molecular Quinoline 4-nitrophenol (QNP) single crystals: For Nonlinear optical (NLO)
applications. J. Mol. Struct. 1210, 128036 (2020). https://doi.org/10.1016/j.molstruc.2020.128036
[16] B. Aneeba, S.V. Ashvin Santhia, S. Vinu, R. Sheela Christy, Dunia A. Al Farraj, Noorah A. Alkubaisi,
Influence of most reactive inorganic cation in the optical and biological activities of L-Lysine
monohydrochloride crystal. Saudi J. Biol. Sci. 27, 2961-2967 (2020). https://doi.org/10.1016/j.sjbs.2020.07.018
[17] T.UmaDevi, N.Lawrence, R.Ramesh Babu, K.Ramamurthi, Growth and characterization L-prolinium
picrate single crystal:a promising NLO crystal, J. Cryst.Growth. 310, 116-123 (2008).
https://doi.org/10.1016/j.jcrysgro.2007.10.011
[18] Suresh, Sagadevan, Synthesis, growth and characterization of L-threonine zinc acetate (LTZA) NLO single
crystal. Optik (Stuttg.). 125, 4547-4551(2014). https://doi.org/10.1016/j.ijleo.2014.02.008
[19] S.Masilamani, A.Mohamed Musthafa ,P.Krishnamurthi, Synthesis, growth and characterisation of a
semiorganic nonlinear optical material: L-threonine cadmium chloride single crystals. Arab. J. Chem. 10, S3962-
S3966 (2017). https://doi.org/10.1016/j.arabjc.2014.06.003
[20] S.A.Martin Britto Das, G.Bhagavannarayana, S.Natarajan, Growth and characterization of new potential
NLO material from the amini acid family L-prolinium picrate. J. Cryst.Growth. 310 ,3535-3559 (2008).
https://doi.org/10.1002/crat.200610850
[21] A. P. Arthi, M. Sumithra Devi, K. Thamizharasan, Structural, Microhardness, Photoconductivity, and
Dielectric Properties of Tris(thiourea) Cadmium Sulphate Single Crystals. Solid State Phys.
2014, 5 (2014). https://doi.org/10.1155/2014/153272
[22] S. E. Allen Moses,S Tamilselven, S. M. Ravi Kumar, G.Vinitha,Tejaswi Ashok Hegde,M. Vimalan, S.
Varalakshmi,S. Sivaraj , Synthesis,Growth and physicochemical properties of new organic nonlinear optical

crystal L-threonium tartarate(LTT) for frequency conversion. Materials Science for Energy Technologies. 2,
565-574 (2019). https://doi.org/10.1016/j.mset.2019.05.003
[23] R.Subhashini, S.Arjunan, B.Gunasekaran, Synthesis of a metal coordinated amino acid based nonlinear
single crystal, Bis(L-threonine)zinc(II) using the solution growth technique and its physicochemical properties. J.
Phys. Chem. Solids. 135, 109077 (2019). https://doi.org/10.1016/j.jpcs.2019.109077
[24] S. Chennakrishnan, S. M. Ravi Kumar, C. Shanthi, R. Srineevasan, T. Kubendiran, Dsivavishnu, M.
Packiya Raj, Synthesis of the semi-organic nonlinear optical crystal L-glutamic acid chloride and investigation
of its growth and physiochemical properties. J. Taibah Univ. Sci. 11, 955-965 (2017).
https://doi.org/10.1016/j.jtusci.2017.01.001
[25] S.K.Kurtz, T.Perry, A powder technique for the evaluation of nonlinear optical material, J.Appl.Phys. 39,
3798-3813 (1968). https://doi.org/10.1063/1.1656857
[26] N.Bhuvaneswari, S. Nalini Jayanti, Effect of l-threonine on optical and electrical properties of TTZS
crystal. Mater. Today. 5, 3378-3389 (2018). https://doi.org/10.1016/j.matpr.2017.11.582
[27] ImranKhan, MohdAnis, UmarBhati, Influence of L-lysine on optical and dielectric traits of cadmium
thiourea acetate complex crystal. Optik.170, 43-47 (2018). https://doi.org/10.1016/j.ijleo.2018.05.076
[28] G.Ramesh Kumar, S.Gokul Raj, Amit Saxena, A.K. Karnal, R. Mohan, Thenneti Raghavalu, Deuteration
effects on structural ,thermal, linear and nonlinear properties of L-threonine single crystal. Mater. Chem. Phys.
108, 359-363 (2008). https://doi.org/10.1016/j.matchemphys.2007.10.015
[29] Redrothu Hanumantharao, S.Kalainathan ,Growth, spectroscopy, dielectric and nonlinear optical studies of
novel organic NLO crystal: L-Threonine formate. Spectrochimica Acta Part A: Molecular and Biomolecular
Spectroscopy. 94, 78-83 (2012). https://doi.org/10.1016/j.saa.2012.03.062
[30] G.R.Dillip, G.Bhagavannarayana, P.Raghavaiah, B.Deva Prasad Raju, Effect of magnesium chloride on
growth, crystalline perfection, structural, optical, thermal and NLO behavior of γ-glycine crystals. Mater. Chem.
Phys. 134, 371-376 (2012). https://doi.org/10.1016/j.matchemphys.2012.03.004

[31] M. Packiya raj, S.M. Ravi Kumar, R. Srineevasan, R. Ravisankar, Synthesis, growth, and structural,
optical, mechanical, electrical properties of a new inorganic nonlinear optical crystal: Sodium manganese
tetrachloride (SMTC). J. Taibah Univ. Sci. 11, 76-84 (2017). https://doi.org/10.1016/j.jtusci.2015.08.006.
[32] V.Revathi, K.Karthik, Physico-chemical properties and antibacterial activity of Hexakis (Thiocarbamide)
Nickel(II) nitrate single crystal. Chemical Data Collections. 21, 100229 (2019).
https://doi.org/10.1016/j.cdc.2019.100229
[33] V. Revathi, K. Karthik, Hakimeh Mahdizadeh, Antibacterial activity and physico-chemical properties of
metal-organic single crystal: Zinc (Tris) thiourea chloride. Chemical Data ollections. 24, 100279 (2019).
https://doi.org/10.1016/j.cdc.2019.100279
[34] B. Deepa , P. Philominathan, Enhanced NLO and antibacterial properties of nicotinic acid-doped KDP
crystals: synthesis, growth and characterization. Mater. Res. Innov.21, 86-90
(2017). https://doi.org/10.1080/14328917.2016.1191794
[35] S Priya, K. Balakrishnan, P. Surendran, A. Lakshmanan, P. Geetha, P. Rameshkumar, , Hegde, Tejaswi , G.
Vinitha, Raj, Antony, Investigations on Structural, Mechanical, Optical, Electrical, Third-Order Nonlinear
Optical and Antibacterial Activity of 4-Aminopyridine Monophthalate Single Crystal. J. Electron. Mater. 50,
1-12(2020). https://doi.org/ 10.1007/s11664-020-08497-w
[36] Fatma Mohamed A. Abid, JoazaizulfazliJamalis, Subhash Chander, Roswanira Abd Wahab, Deepak P.
Bhagwat, Murugesan Sankaranarayanan, Synthesis, characterization, in silico and antifungal studies of
thiazolidine analogues.21, 100219 (2019). https://doi.org/10.1016/j.cdc.2019.100219
[37] B. Aneeba, S.V. Ashvin Santhia, R. Sheela Christy, Fahad A. Al-Misned, Hamed A. El-Serehy, S. Vinu,
Polychromatic luminescence and improved antifungal performance of succinic acid in the lattice of L-Lysine
monohydrochloride. Saudi J. Biol. Sci. 28, 395-399 (2021). https://doi.org/10.1016/j.sjbs.2020.10.021.

Figures
Figure 1
Photograph of LTCS single crystal
Figure 2

Powder XRD pattern of LTCS crystal
Figure 3
FTIR spectra of LTCS crystal

Figure 4
4.1 Transmission spectra of LTCS crystal 4.2 Plot of (αhν)2 versus Photon energy (hν) of LTCS crystal 4.3Photon energy versus Extinction Coe�cient of LTCS crystal 4.4 Photon energy versus refractive indices ofLTCS crystal 4.5 Photon energy versus Skin depth of LTCS crystal 4.6 Photon energy versus opticalconductivity of LTCS crystal
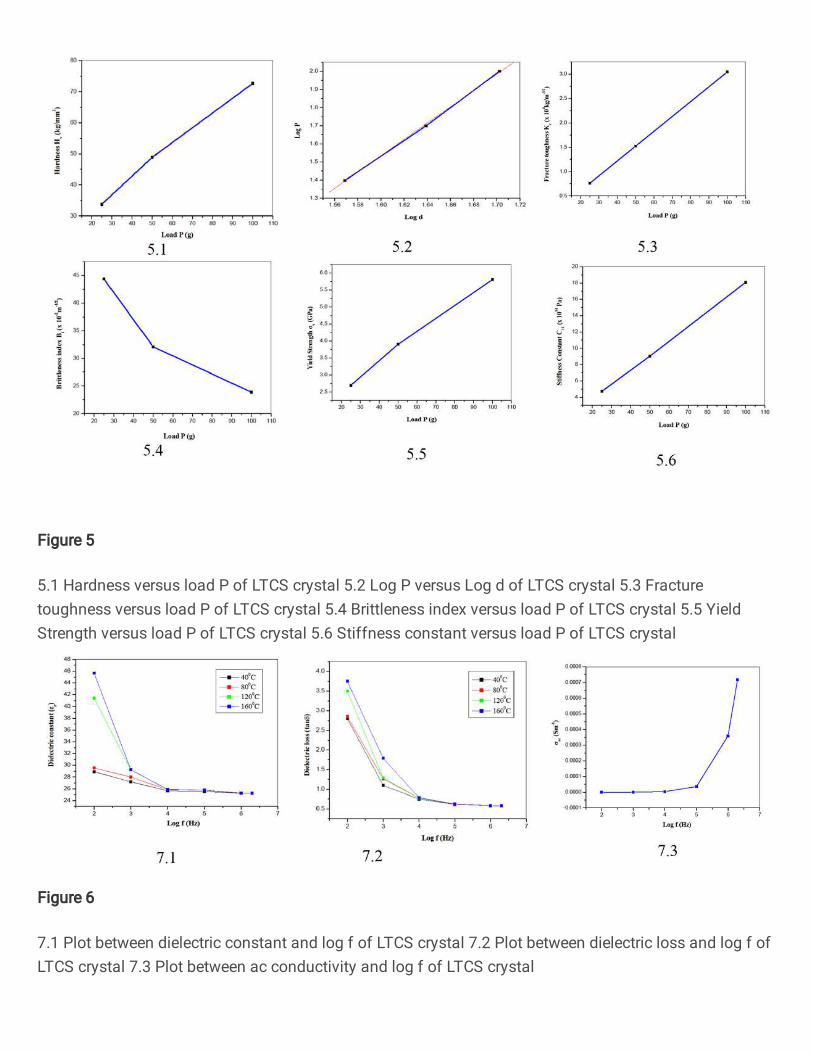
Figure 5
5.1 Hardness versus load P of LTCS crystal 5.2 Log P versus Log d of LTCS crystal 5.3 Fracturetoughness versus load P of LTCS crystal 5.4 Brittleness index versus load P of LTCS crystal 5.5 YieldStrength versus load P of LTCS crystal 5.6 Stiffness constant versus load P of LTCS crystal
Figure 6
7.1 Plot between dielectric constant and log f of LTCS crystal 7.2 Plot between dielectric loss and log f ofLTCS crystal 7.3 Plot between ac conductivity and log f of LTCS crystal

Figure 7
8.1 Antibacterial activity of LTCS crystal for two bacterial pathogens (a) ZOI of Pseudomonas aeruginosa(b) ZOI of Staphylococcus aureus 8.2 Antifungal activity of LTCS crystal for two fungal pathogens (a)Candida albicans (b) Aspergillus