Embed Size (px)
Citation preview

Comprehensive Induction Training Manual

Division: CUSTOMER CARE Document Type: MANUAL Document Title: COMREHENSIVE INDUCTION TRAINING MANUAL Document No: 26-09-2012 Revision Date: 26/09/2012 Issue: 01

3ACM Gold - Comprehensive Induction Training Manual - October 2012 v1
Comprehensive Induction Training Manual
Table of ContentsChapter 1: Introduction 4 1.1 Foreign Exchange as a Financial Market 4 1.2. Foreign Exchange in a Historical Perspective 5 1.3. Main Stages of Recent Foreign Exchange Development 5 1.4. Factors Caused Foreign Exchange Volume Growth 8 Business Internationalization 8 Increasing of Traders Sophistication 8 Developments in Telecommunications 8 Interest Rate Volatility 9 Increasing of Corporate Interest 9 Computer and Programming development 9
CHAPTER 2: Kinds of Major Currencies and Exchange Systems 10 2.1. Major Currencies 10 The U.S. Dollar 10 The Euro 10 The Japanese Yen 10 The British Pound 10 The Swiss Franc 11 2.2. Kinds of Exchange Systems 11 Dealing Systems 11 Matching Systems 11 Direct Dealing 12
CHAPTER 3:Kinds of Foreign Exchange Market 13 3.1. Spot Market 13 3.2. Futures Market 15 3.3. Forward Market 15 3.4. Currency Options 16
CHAPTER 4 Technical Analysis 18 4.1. The Ground rules of Technical Analysis 18 Price 18 A reverse bearish currency 19 The structure of cycles 19 The two gauging measures of a cycle; period and phase 20 Volume and Open Interest 20

4 Copy Right Protected ACM Gold and Forex Trading (PTY) Ltd. ™
ACM Gold Comprehensive Induction Training on Forex Trading
4.2. Types of charts 21 Candlestick Chart 21 Bar Chart 22 Line Chart 23 4.3. Trends, Support and Resistance 24 Kinds of Trends 24 Percentage Retracement 25 The Trendline 26 Lines of Support and Resistance 27 4.4. Trend Reversal Patterns 28 Head-And-Shoulders 28 Signals Generated by the Head-and-shoulders Pattern 29 Inverse Head and Shoulder Pattern 30 Double Top 30 A typical double-top Formation 31 Signals Provided by the Double Top Formation 31 Rounded Top and Bottom Formations 32 Double Bottom 32 A typical double-bottom Formation 32 Triple Top and Triple Bottom 33 A typical triple-top Formation 33 The opposite is true for the triple bottom 33 A typical triple-bottom Formation 34 Diamond Formation 34 A scheme of a diamond reversal formation 34 4.5. Trend Continuation Patterns 35 Wedge Formation 35 A falling wedge 35 Triangle Formation 36 A Bullish symmetrical Triangle 36 A typical ascending Triangle 37 An expanding Triangle 38 Rectangle Formation 38 A typical Bullish Rectangle 38 A typical Bearish Rectangle 39 Flag formation 39 Pennant Formation 39 A Bear Flag Formation 40 Bullish Pennant 40 Bearish Pennant 41 4.6. Gaps 41 Breakaway Gaps 41 Exhaustion Gaps 42 Runaway Gaps 42 Trading Signals for Runaway Gaps 42 Common Gaps 43 4.7. Mathematical Trading Methods (Indicators) 43 Moving Averages 43 Trading Signals of Moving Averages 44 Moving Average Convergence-Divergence (MACD) 45 Stochastics 46 The Relative Strength Index (RSI) 47 Bollinger Bands 48
CHAPTER 5 49Fundamental Analysis 49 5.1. Economic Fundamentals 49 Theories of Exchange Rate Determination 49 Purchasing Power Parity 49 The PPP Relative Version 49 Theory of Elasticities 50 Modern Monetary Theories on Short-Term Exchange

5ACM Gold - Comprehensive Induction Training Manual - October 2012 v1
Rate Volatility 50 The Portfolio-Balance Approach 50 Synthesis of Traditional and Modern Monetary Views 50 5.2. Economic Indicators 51 The Gross National Product (GNP) 51 The Gross Domestic Product (GDP) 51 Consumption Spending 52 Investment Spending 52 Government Spending 52 Net Trade 52 Industrial Production 52 Capacity Utilization 52 Factory Orders 53 Durable Goods Orders 53 Business Inventories 53 Construction Indicators 53 Diagram of construction of private housing 54 InflationIndicators 54 Producer Price Index (PPI) 55 Consumer Price Index (CPI) 55 GrossNationalProductImplicitDeflator 55 Gross Domestic Product Implicit 55 Commodity Research Bureau’s Futures Index (CRB index) 55 The “Journal of commerce” Industrial Price Index (JoC) 56 Merchandise Trade Balance 56 Employment Indicators 56 Employment Cost Index (ECI) 57 Consumer Spending Indicators 57 Auto Sales 57 Leading Indicators 58 Personal Income 58 5.3. Financial and Socio-political Factors 58 The Role of Financial Factors 58 Political events and Crises 59
CHAPTER 6 60Fibonacci Analysis and Elliott Waves Theory 60 6.1. Fibonacci Analysis 60 6.2. The Elliott Waves 60 Basics of Wave Analysis 60 The basic Elliott Wave pattern 61 The larger pattern in detail 61 A complete market cycle 62 Wave extensions 62 Wave extensions 63 The Diagonal Triangles 63 A bullish patter 63 A bearish pattern 64 Failures (Truncated Fifths) 65
Chapter 7 66Foreign Exchange Risks 66 7.1. Exchange Rate Risk 66 7.2. INTEREST-RATE RISK 66 7.3. Credit Risk 67 7.4. Country Risk 67
Notes 68
6 Copy Right Protected ACM Gold and Forex Trading (PTY) Ltd. ™
ACM Gold Comprehensive Induction Training on Forex Trading
Chapter 1: Introduction
1.1 Foreign Exchange as a Financial Market
Currency exchange is very desirable for both the company and individual traders who generate handsome returns on forex trading - a peerless and distinctive financialmarket which provides unprecedentedopportunity tomakeabove-average returnswhencompared to traditional financial instruments.Spotcommodities such as spot gold and spot silver operate in an almost indistinguishable way to forex pair instruments and therefore, the material detailed in this induction training guide is applicable to both, although the focus here on out will be orientated towards spot foreign exchange products.
Thefollowingfeaturesmakeforexuniqueincomparisontoallothersectorsoftheworldfinancialsystem:
● Exceptionallyhighefficiencyandparticularlylowcostsrelativetootherfinancialmarkets;
● Accessibility to all traders promptly, in the major currencies;
● Sure-firequantityandliquidityofthemajorcurrencies;
● Increased consideration for several currencies, around the clock;
● The facility to leverage funds and use of modern-day market makers to utilize the heftiest, 4 trillion a dollar a day market;
● Business hours which empower traders to deal after normal hours or during national holidays intheircountry,findingmarketsabroadopen.(24hours5andhalfdaysaweek).
The goal of this extended induction training manual is to primarily introduce you to the basics of technical and fundamental aspects of foreign exchange in a hands-on way, and acts as a guide to the most preeminent answers on the classic questions as why are currencies being traded, who are the traders, what currencies do they trade, what makes rates move, what tools are used for the trade, how a currency’s performance can be predicted and where the germane information may be attained from.
This training manual should however, be used in conjunction with the basic induction training manual, as they work hand in hand. Since the fundamental theory concepts and core trading concepts have been discussed and explained in the basic induction manual, there is no need to repeat them here, and it is assumed you have already gained an understanding of them. If not, please refer back to the basic introduction manual.
Albeit by no means is this orientation guidebook all-encompassing and conclusive. It is intended to give you a very basic, but wide-ranging outline of the key components that model the world of forex trading.
Becoming a successful trader necessitates extensive study, familiarity, knowledge of not only theory, but the trading platform and tools you will need to have full control over. Further to this you will need to be taughthowtomastertradingself-controldiscipline.Thisinductionmanualisnotintendedtofulfilthoserequirements. In order to accomplish this, it’s highly advisable, in actual fact necessary to invest in a real, professional course such as the one provided by the renowned University of Forex and Gold. Should you be interested, please contact [email protected] in order to order your copy.
Trading Spot Forex and Commodities at its core is about the effective control and supervision of two of themostprimalandsignificantemotions;fearandgreed.
The nature of trading being what it is, merely trading on a demonstration account will never be a true confirmationastowhetheryouhavewhatittakestomakeitbig.Operatingwithrealcapitalatstakein
7ACM Gold - Comprehensive Induction Training Manual - October 2012 v1
the market has a tremendous effect on how a trader behaves and therefore, the only way to truly grow is to go live. It is therefore, essential to open a live trading account as early on in your trading career as possible in order to truly appreciate the markets. Any capital loss at inception needs to be factored in as part of the cost of doing business; what is vital is to persevere and ensure that one takes all the experience and knowledge used during this phase and continue trading and build your trading portfolio one step at a time.
The experience attained during that process however, can never be taken away, and you will need strength, belief and conviction to follow through because as with any profession, there is a ladder to climb and trying to cut corners will only result in failure and disappointment – a true ace has to pass through every level successfully, knowing full well that this requires time and effort.
1.2. Foreign Exchange in a Historical PerspectiveCurrency trading has a lengthy past and can be traced back to the ancient Middle East and Middle Ages when foreign exchange started to shape up after the international merchant bankers invented bills of exchange,whichweretransferablethird-partypaymentsthatpermittedflexibilityandgrowthinforeignexchange dealings.
The modern foreign exchange market characterized by the subsequent periods of increased unpredictability, and relative stability formed itself in the twentieth century.
By the mid-1930s London came to be the foremost centre for foreign exchange, and the British pound served as the currency to trade and to keep as a reserve currency. Because foreign exchange was traded on the telex machines, or cable, back then, the pound was given the nickname “cable”.
In 1930, the Bank for International Settlements was established in Basel, Switzerland, to supervise the financialeffortsofthenewlyindependentcountries,whicharoseaftertheWorldWarI,andtoprovidefinancialrelieftocountriesgoingthroughtemporarybalanceofpaymentsdifficulties.
After the World War II, where the British economy was wrecked, and the United States was the only country unscathed by war, U.S. dollar became the principal currency of the entire globe. Nowadays, currencies all over the world are commonly quoted against the U.S. dollar.
1.3. Main Stages of Recent Foreign Exchange Development
The key phases of the further development of the Forex in modern times were:
● Signing of the Bretton Woods Accord;
● Constitution of the international monetary fund (IMF);
● Emergencyofthefree-floatingforeignexchangemarkets;
● Formation of currency reserves;
● Constitution of the European Monetary Union and the European Monetary Cooperation Fund of the Euro as a currency.
The Bretton Woods Accord was signed in July 1944 by the United States, Great Britain, and France, which decided to make the currency market stable, predominantly by reason of governmental controls on currency values. In order to implement it, two key goals were emphasized to provide the pegging (backing of prices) of currencies and to establish the International Monetary Fund (IMF).
8 Copy Right Protected ACM Gold and Forex Trading (PTY) Ltd. ™
ACM Gold Comprehensive Induction Training on Forex Trading
In accordance to the Bretton Woods Accord, the major trading currencies were pegged to the U.S. dollar inthesensethattheywerepermittedtofluctuateonly1%oneithersideofthatrate.Whenacurrencyexceeded this range, marked by intervention points, the central bank responsible had to buy it or sell it, and thus bring it back into range. In turn, the U.S. dollar was pegged to gold at $35 per ounce. Hence, the U.S. dollar became the world’s reserve currency.
The purpose of IMF is to confer with one another to sustain a stable system of buying and selling the currencies, so that payments in foreign money can come about between countries smoothly and timely.
TheIMFloansmoneytomemberswhofinditdifficulttomeetfinancialobligationstoothermembers,ontheconditionthattheyassumeeconomicreformstowipeoutthesedifficultiesfortheirowngoodandthebenefitoftheentiremembership.IntotalthemainresponsibilitiesoftheIMFare:
● To encourage international cooperation by making available the means for members to consult and join forces on international monetary issues;
● To facilitate the development of international trade and thus aid high levels of employment and real income among member nations;
● To facilitate stability of exchange rates and organized exchange agreements, and [to] discourage competitive currency depreciation;
● To foster a multifaceted system of international payments, and to pursue the elimination of exchange restrictions that hinder the growth of world trade;
● Tomakefinancialmeansavailabletomembers,onatemporarybasisandwithadequateprecautions, to enable them to correct payment imbalances without resorting to measures destructive to national and international prosperity.
To reach these goals the IMF uses such tools as Reserve tranche, which allows a member to draw on its own reserve asset quota at the time of payment, Credit tranche drawings and stand-by arrangements are thestandardformofIMFloans,thecompensatoryfinancingfacilityextendsmonetaryhelptocountrieswithprovisionalproblemsgeneratedbyreductionsinexportrevenues,thebufferstockfinancingfacilitywhich is geared toward helping the stocking up on primary commodities in order to secure price stability inaspecificcommodityandtheprotractedfacilitydesignedtoassistmemberswithfinancialproblemsinamounts or for periods exceeding the scope of the other facilities.
Since1978free-floatingofcurrencieswereofficiallyauthorizedbytheInternationalMonetaryFund.Thatis the currency may be traded by anybody, and its value is a function of the current supply and demand forces in the market, and there are no explicit intervention points that have to be considered.
Of course, the Federal Reserve Bank occasionally intervenes to change the value of the U.S. dollar, but nospecificlevelsareeverimposed.Unsurprisingly,free-floatingcurrenciesareintheheaviesttradingdemand.Free-floatingisnotthesinequanonconditionfortrading.Liquidityisalsoarequisitecondition.
Currency reserves for international transactions are tools for people and corporations to protect investments in times of economic or political turmoil. Right after the World War II the U.S. dollar became the reserve currency worldwide. Currently, there are other reserve currencies: the euro and the Japanese yen.Theportfolioofreservecurrenciesmaychangedependingonspecificinternationalconditions,forinstance, it may include the Swiss franc.
The formation of the European Monetary Union was the outcome of a long and uninterrupted series of post-World War II efforts focused on creating closer economic cooperation among the capitalist European nations. The European Community (EC) commission’s ceremoniously stated objectives were to improve the inter-Europeaneconomiccooperation,createaregionalareaoffiscalstability,andfunctionas“apole of stability in world currency markets.”

9ACM Gold - Comprehensive Induction Training Manual - October 2012 v1
Thefirststepsinthisinnovationweretakenin1950,whentheEuropeanPaymentUnionwasfoundedtofacilitate the inter-European settlements of international trade transactions. The reason of the community was to promote inter-European trade in general, and to get rid of restrictions on the trade of coal and raw steel, in particular.
In 1957, the Treaty of Rome established the European Economic Community, with the same signatories as the European Coal and Steel Community. The stated goal of the European Economic Community was to abolish customs duties and any barriers against the transit of capital, services, and people among the member nations. The EC also started to raise common tariff barriers against outsiders.
The European Community consists of four executive and legislative bodies:
1. The European Commission is the executive body responsible for creating and observing the enforcement of the policies. It lacks an enforcement arm and resultantly; the commission must depend on individual governments to enforce the policies. There are 23 subdivisions, such as foreign affairs, competition policy, and agriculture. Each country selects its own representatives for four-year tenures. The commission is based in Brussels and comprises of 17 members.
2. The Council of Ministers makes the main policy decisions. It is composed of ministers from the 12 member nations. The presidency is held for six months by each of the members, in alphabetical order. The meetings are held in Brussels or in the capital of the nation holding the presidency.
3. The European Parliament reviews and adjusts legislative proposals and has the power to embrace or reject budget proposals. It consists of 518 elected members. It is based in Luxembourg, but the assemblies take place in Strasbourg or Brussels.
4. The European Court of Justice settles disagreements between the EC and the member nations. It consists of 13 members and is based in Luxembourg.
In 1963, the French-West German Treaty of Cooperation was signed. This pact was designed not only to end centuries of bellicose enmity, but also to settle the post-war reconciliation between two major foes. The threat required that West Germany would lead economically through the cold war, and France, the former diplomatic dynamo, would provide the political leadership. The premise of this treaty was obviously correctinanenvironmentdefinedbyapredictablelong-termcontinuingcoldwarandadividedGermany.Later in this chapter, we discuss the implications for the modern era of this immensely expensive accord.
A conference of national leaders in 1969 set the objective of establishing a monetary union within the European Community. This goal was supposed to be realized by 1980, when a common currency was planned to be used in Europe. The reasons for the proposed common currency unit were to rouse inter-European trade and to link the individual member economies in order to contend successfully with the economies of the United States and Japan.
In 1978, the nine members of the European Community sanctioned a new course of action for stability—the European Monetary System. The new system was actively established in 1979. Seven countries were then full members—West Germany, France, the Netherlands, Belgium, Luxembourg, Denmark, and Ireland. Great Britain did not join in all the arrangements, and Italy adhered under special conditions. Greece joined in 1981, Spain and Portugal in 1986. Great Britain joined the Exchange Rate Mechanism in 1990.
The European Monetary Cooperation Fund was established to control the EMS’ credit arrangements. In order to increase the receipt of the ECU, countries that hold more ECU deposits, or accept as loan repayment more than their share of ECU, receive interest on the excess ECU deposits, and vice versa. The interest rate is the weighted average of all the EMS members’ discount rates.
10 Copy Right Protected ACM Gold and Forex Trading (PTY) Ltd. ™
ACM Gold Comprehensive Induction Training on Forex Trading
In1998, theEurowasannouncedasanall-Europeancurrency.Hereare theofficial locking ratesofthe 11 participating European currencies in the euro (EUR). The rates were propositioned the EU CommissionandapprovedbyEUfinanceministersonDecember31,1998,aheadofthelaunchoftheeuro at midnight, January 1, 1999.
The real starting date was Monday, January 4, 1999. The conversion rates are:
1 EUR = 40.3399 BEF 1 EUR = 1.95583 DEM
1 EUR = 166.386 ESP 1 EUR = 6.55957 FRF
1 EUR = 0.787564 IEP 1 EUR = 1936.27 ITL
1 EUR = 40.3399 LUF 1 EUR = 2.20371 NLG
1 EUR = 13.7603 ATS 1 EUR = 200.482 PTE
1 EUR = 5.94573 FIM
The euro bills are supplied in values of 5, 10, 20, 50, 100, 200, and 500 euros. Coins are issued in values of 1 and 2 euros, and 50, 20, 10, 5, 2, and 1 cent.
1.4. Factors Caused Foreign Exchange Volume Growth
Foreign exchange trading is basically conducted in a decentralized manner, with the exceptions of currency futures and options. Foreign exchange has undergone spectacular growth in volume ever since currencieswereallowedtofloatfreelyagainsteachother.Whilethedailyturnoverin1977wasU.S.$5billion, it increased to U.S. $600 billion in 1987, reached the U.S. $1 trillion mark in September 1992, and at around $1, 5 trillion by the year 2000. Today, around 2012/13 the daily volume is over $4 trillion and still growing. It is well known now as being the biggest traded and speculated market in the world.
Thekeyfactorsthatinfluenceonthisspectaculargrowthinvolumeareindicatedbelow.
For foreign exchange, currency volatility is a prime factor in the growth of volume. In fact, volatility is a sinequa(essentialingredient)fortrading.Theonlyinstrumentsthatmaybeprofitableunderconditionsof low volatility are currency options.
Business Internationalization
Inrecentdecades,thebusinessworldcompetitionhasintensified,causingaworldwidequestformoremarkets and cheaper raw materials and labour. The velocity of economic internationalization picked up even more in the 1990s, owing to the fall of Communism in Europe and to up-and-down economic and financialdevelopmentinbothSoutheastAsiaandSouthAmerica.Thesechangeshavebeenprogressivetoward foreign exchange, since more transactional layers were added.
Increasing of Traders Sophistication
Advances in technology, computer software, and telecommunications and increased experience have increasedtheleveloftraders’sophistication.Thisboostedtraders’confidenceintheirabilitytobothmake profits and properly handle the exchange risks.Therefore, trading sophistication led towardvolume upturn.
Developments in Telecommunications
11ACM Gold - Comprehensive Induction Training Manual - October 2012 v1
The launch of automated dealing systems in the 1980s, of matching systems in the early 1990s, and of Internet trading in the late 1990s completely transformed the way foreign exchange was run. The dealing systems are on- line computer systems that connect banks on a one-to-one basis, while matching systems are electronic brokers. They are dependable and much faster, allowing traders to conduct more concurrent trades. They are also more secure, as traders are able to see the deals that they execute. The dealingsystemshadasignificantroleinexpandingtheforeignexchangebusinessduetotheirreliability,speed, and safety.
Interest Rate Volatility
Economic internationalizationhadasignificantbearingon interest ratesaswell.Economicsbecamemuchmoreinterconnected,andthatmagnifiedtheneedtochangeinterestratesfaster.Interestratesare generally changed in order to modify the growth in the economy, and interest rate differentials have a considerable impact on exchange rates.
Increasing of Corporate Interest
Avictoriousperformanceofaproductorserviceoverseasmaybepulleddownfromtheprofitpointofview by contrary foreign exchange conditions and vice versa. Proper handling of the foreign exchange may boost the overall International performance of a product or service. Excellent handling of foreign exchange generally adds substantially to the rate of return. Consequently, interest in foreign exchange has increased in the past decade. Many corporations are making use of currencies not only for hedging, but also get the most out of opportunities that exist solely in the currency markets.
Computer and Programming development
Computers play a major role at many stages of effecting foreign exchange. In addition to the dealing systems, matching systems concurrently connect all traders around the world, electronically replicating thebrokers’market.Thenewofficesystemsgrantfullaccountingcoverage,ticketwriting,backofficeprocessing, and risk management implementation at a fraction of their previous fee. Cutting-edge software makes it possible to produce all types of charts, enhance them with sophisticated technical studies,andputthemattraders’fingertipsonacontinuousbasisataratherregulatedcost.
12 Copy Right Protected ACM Gold and Forex Trading (PTY) Ltd. ™
ACM Gold Comprehensive Induction Training on Forex Trading
CHAPTER 2:
Kinds of Major Currencies and Exchange Systems
2.1. Major Currencies
The U.S. Dollar
The United States dollar is the world’s chief currency. All currencies are generally quoted in U.S. dollar terms.Underconditionsofinternationaleconomicandpoliticalconflict,theU.S.dollaristhemainsafe-haven currency which was proven exceptionally well during the Southeast Asian calamity of 1997-1998.
The U.S. dollar became the leading currency as the Second World War ended, and was at the core of the Bretton Woods Accord, as the other currencies were essentially pegged against it. The introduction of the euro in 1999 moderated the dollar’s importance only somewhat.
The major currencies traded against the U.S. dollar are the Euro, Japanese yen, British pound, and Swiss franc.
The Euro
The euro was created to become the leading currency in trading by simply being quoted in American terms. Like the U.S. dollar, the euro has a strong international presence stemming from members of the European Monetary Union. The currency remains beset by unequal growth, high unemployment, and governmentresistancetostructuralchanges.Thepairwasalsoweighedin1999and2000byout-flowsfrom foreign investors, particularly Japanese, who were driven to liquidate their losing investments in euro- denominated assets. Furthermore, European money managers rebalanced their portfolios and lessened their euro exposure as their needs for hedging currency risk in Europe waned.
The Japanese Yen
The Japanese yen is the third most traded currency in the world; it has a much smaller international presence than the U.S. dollar or the euro. The yen is very liquid around the world, virtually around the clock. The natural demand to trade the yen focused mostly among the Japanese keiretsu, the economic andfinancialconglomerates.
The yen is much more sensitive to the fortunes of the Nikkei index, the Japanese stock market, and the real estate market. The attempt of the Bank of Japan to puncture the double bubble in these two markets hadanegativeeffectontheJapaneseyen,althoughtheimpactwasfleeting.
The British Pound
Until the end of World War II, the pound was the currency of reference. Its nickname, cable, is taken from the telex machine, which was used to trade within its glory days. The currency is profoundly traded
13ACM Gold - Comprehensive Induction Training Manual - October 2012 v1
against the euro and the U.S. dollar, but has a spotty presence against other currencies. The two-year stint with the Exchange Rate Mechanism, between 1990 and 1992, had a soothing effect on the British pound, as it generally had to follow the deutsche mark’s vacillations, but the crisis conditions that triggered the pound’s withdrawal from the ERM had a psychological effect on the currency.
Precedingtheintroductionoftheeuro,boththepoundandthedollarbenefitedfromanymisgivingsaboutthe currency convergence. After the introduction of the euro, Bank of England is endeavouring to bring the high U.K. rates closer to the lower rates in the euro zone. The pound could join the euro in the early 2000s, provided that the U.K. referendum is positive.
The Swiss Franc
The Swiss franc is the only currency of a major European country that does not belong to the European Monetary Union or to the G-7 countries. Although the Swiss nation is relatively small, the Swiss franc is one of the four major currencies, closely approximating the strength and quality of the Swiss economy andfinance.SwitzerlandhasaverycloseeconomicrelationshipwithGermany,andthusto theeurozone. Therefore, in terms of political insecurity in the East, the Swiss franc is favoured generally over the euro.
Characteristically, it is believed that the Swiss franc is a stable currency. In fact, from a foreign exchange point of view, the Swiss franc closely resembles the patterns of the euro, but lacks its liquidity. As the demand for it surpasses supply, the Swiss franc can be more unpredictable than the euro.
2.2. Kinds of Exchange Systems
Dealing Systems
Dealing systems are on-line computers that link up the contributing banks around the world on a one-on-one basis. The performance of dealing systems is characterized by speed, reliability, and safety. Accessing a bank through a dealing system is much quicker than making a phone call. Dealing systems are uninterruptedly being improved in order to offer all-out support to the dealer’s main function: trading. Thesoftwareisveryunswervinginpickingupthebigfigureoftheexchangeratesandthestandardvaluedates. In addition, it is tremendously precise and fast in getting in touch with other parties, switching among conversations, and accessing the database. The trader is in non-stop visual contact with the information exchanged on the monitor. It is easier to see than hear this information, especially when hopping between conversations.
Most banks use an arrangement of brokers and direct dealing systems. Both approaches reach the same banks, but not the same parties, because corporations, for instance, cannot deal in the brokers’ market. Traders develop personal relationships with both brokers and traders in the markets, but select their trading medium based on price quality, not on personal feelings. The market share between dealing systems and brokers varies based on market conditions. Fast market conditions are advantageous to dealing systems, whereas regular market conditions are more favourable to brokers.
Matching Systems
Unlike dealing systems, on which trading is not nameless and is conducted on a one-on-one basis, matching systems are anonymous and individual traders deal against the rest of the market, similar to dealing in the brokers’ market. However, different from the brokers’ market, there are no individuals to bring the prices to the market, and liquidity may be limited at times. Matching systems are well-suited for
14 Copy Right Protected ACM Gold and Forex Trading (PTY) Ltd. ™
ACM Gold Comprehensive Induction Training on Forex Trading
trading smaller amounts as well.
The dealing systems characteristics of hustle, trustworthiness, and security are reproduced in the matching systems. In addition, credit lines are automatically managed by the systems. Traders input the total credit line for each counter party. When the credit line has been reached, the system automatically refutes dealing with the particular party by presenting credit restrictions, or shows the trader only the price made by banks that have open lines of credit. As soon as the credit line is restored, the system allows the bank to deal again. In the inter-bank market, traders deal directly with dealing systems, matching systems, and brokers in a complementary fashion.
Direct Dealing
Direct dealing is based on trading interchange. A market maker—the bank or Broker making or quoting a price—expects the bank that is calling to counter with respect to making a price when called upon. Direct dealing provides more trading prudence, as compared to dealing in the brokers’ market. Sometimes traders take advantage of this feat.
Direct dealing used to be conducted mostly telephonically. Dealing errors were problematic to prove and even more so to settle. In order to increase dealing safety, most banks intercepted the phone lines through which trading was conducted. This measure was effective in recording all the transaction details and aiding the dealers to assign the responsibility for errors justly.
15ACM Gold - Comprehensive Induction Training Manual - October 2012 v1
CHAPTER 3
Kinds of Foreign Exchange Market
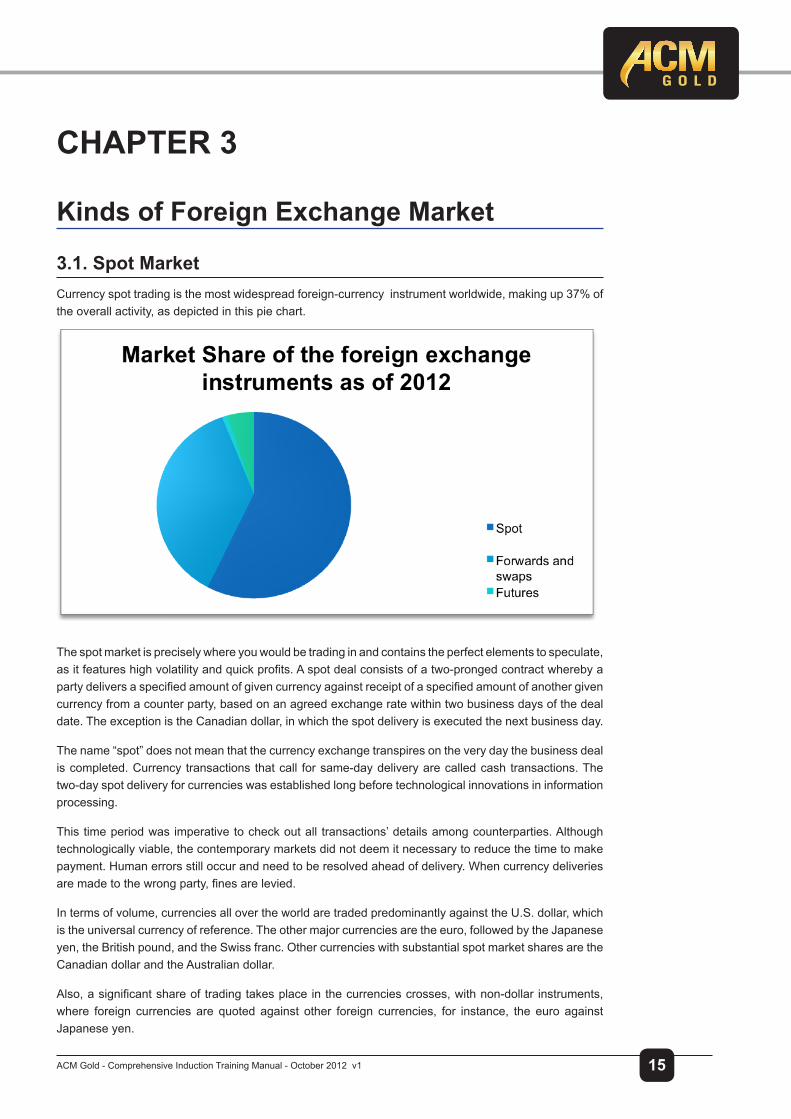
3.1. Spot MarketCurrencyspottradingisthemostwidespreadforeign-currencyinstrumentworldwide,makingup37%ofthe overall activity, as depicted in this pie chart.
The spot market is precisely where you would be trading in and contains the perfect elements to speculate, asitfeatureshighvolatilityandquickprofits.Aspotdealconsistsofatwo-prongedcontractwherebyapartydeliversaspecifiedamountofgivencurrencyagainstreceiptofaspecifiedamountofanothergivencurrency from a counter party, based on an agreed exchange rate within two business days of the deal date. The exception is the Canadian dollar, in which the spot delivery is executed the next business day.
The name “spot” does not mean that the currency exchange transpires on the very day the business deal is completed. Currency transactions that call for same-day delivery are called cash transactions. The two-day spot delivery for currencies was established long before technological innovations in information processing.
This time period was imperative to check out all transactions’ details among counterparties. Although technologically viable, the contemporary markets did not deem it necessary to reduce the time to make payment. Human errors still occur and need to be resolved ahead of delivery. When currency deliveries aremadetothewrongparty,finesarelevied.
In terms of volume, currencies all over the world are traded predominantly against the U.S. dollar, which is the universal currency of reference. The other major currencies are the euro, followed by the Japanese yen, the British pound, and the Swiss franc. Other currencies with substantial spot market shares are the Canadian dollar and the Australian dollar.
Also,asignificantshareoftradingtakesplaceinthecurrenciescrosses,withnon-dollar instruments,where foreign currencies are quoted against other foreign currencies, for instance, the euro against Japanese yen.

16 Copy Right Protected ACM Gold and Forex Trading (PTY) Ltd. ™
ACM Gold Comprehensive Induction Training on Forex Trading
Therearenumerousreasonswhycurrencyspottradingissoattractive.Profits(orlosses)arerealizedquickly in the spot market, attributable to market unpredictability. Moreover, since spot deals are settled in but two business days, the time exposure to credit risk is narrowed to some degree.
Turnoverinthespotmarkethasbeenswellingradically,thankstothecombinationofinherentprofitabilityand reduced credit risk. The spot market is characterized by high liquidity and branded extremely volatile. Volatility is thedegree towhich thepriceofcurrencyfluctuateswithinacertainperiodof time.Free-floatingcurrencies,suchastheeuroorJapaneseyen,tendtobevolatileagainsttheU.S.dollar.
In an active global trading day (24 hours), the euro/dollar exchange rate may change its value 18,000 times.Anexchangeratemay“fly”200pipsinamatterofsecondsifthemarketgetswindofasignificantevent. On the contrary, however, the exchange rate may maintain stability for extended periods of time, evenexceedingofanhour,whenonemarketisjustaboutfinishedtradingandwaitingforthenextmarketto take over. This is a common occurrence toward the end of the New York trading day.
Since California failed in the late 1980s to provide the link between the New York and Tokyo markets, there is a technical trading gap between around 4:30pm and 6pm EDT. In the United States spot market, the majority of deals are executed between 8am and twelve noon, when the New York and European marketsoverlap.Theactivityplummetssharplyintheafternoon,over50%infact,whenNewYorklosesthe international trading support. Overnight trading is limited, as very few banks have overnight desks. Most banks send their overnight orders to branches or other banks that operate in the active time zones.
The major traders in the spot market are the commercial banks and the investment banks, followed by hedgefundsandcorporatecustomersandfinally,agrowingnumberofindividualtraders.Intheinter-bankmarket,themajorityofthedealsareinternational,reflectingglobalexchangeratecompetitionandcutting-edge telecommunication systems.
Nevertheless, corporate customers tend to focus their foreign exchange activity domestically, or to trade through foreign banks operating in the same time zone. Although the hedge funds’ and corporate customers’ business in foreign exchange has been rising, banks maintain their position as the chief trading force.
Thebottomlineisimportantinallfinancialmarkets,butincurrencyspottradingtheantesalwaysappeargreater as a result of world-wide demand.
Theprofitandlosscanbeeitherrealizedorunrealized.Therealizedprofitandlossisasureamountofmoneynettedwhenapositionisclosed.Theunrealizedprofitandlossconsistsofanunsureamountofmoney that an outstanding position would approximately generate if it were closed at the current rate.
17ACM Gold - Comprehensive Induction Training Manual - October 2012 v1
Theunrealizedprofitandlosschangesconstantlyintandemwiththeexchangerate.
3.2. Futures Market
Currencyfuturesarespecifictypesofforwardoutrightdeals,whichoccupy,ingeneral,asmallpartoftheforex market. Because they are derived from the spot price, they are derivative instruments.
Theyarespecificwithregardtotheexpirationdateandthesizeofthetradeamount.Whereforwardoutright deals—those that mature past the spot delivery date—will normally mature on any valid date in the two countries whose currencies are being traded, standardized amounts of foreign currency futures mature only on the third Wednesday of March, June, September and/or December.
There is a row of characteristics of the currency futures market, which makes it attractive. It is open to all market participants, individuals included. This is different from the spot market, which is nigh on closed to individuals - except high net-worth individuals—because of the size of the currency amounts traded. It isacentralmarket,justasefficientasthecashmarket,andwhilethecashmarketisquitedecentralized,trading of futures takes place under one roof. It eliminates the credit risk because the Chicago Mercantile Exchange Clearinghouse acts as the buyer for every seller, and vice versa. In turn, the Clearinghouse minimizesitsownexposurebyrequiringtraderswhomaintainanon-profitablepositiontopostmarginsequal in size to their losses.
Moreover, currency futures afford several benefits for traders because futures are special types offorward outright contracts, corporations can use them for hedging purposes. Although the futures and spot markets trade closely together, certain differences between the two occur, generating arbitraging opportunities.Gaps,volume,andopeninterestaresignificanttechnicalanalysisdevicessolelyavailableinthefuturesmarket.Yettheirsignificanceextrapolatestothespotmarketaswell.
Becauseofthesebenefits,currencyfuturestradingvolumehassteadilyattractedanextensivevarietyof players.
For traders outside the exchange, the prices are accessible from on-line monitors. The most popular pages are found on Bridge, Telerate, Reuters, and Bloomberg. Telerate presents the currency futures on composite pages, while Reuters and Bloomberg display currency futures on individual pages shows the convergence between the futures and spot prices.
3.3. Forward Market
The forward currency market consists of two instruments: forward outright deals and swaps. A swap deal is unusual among the rest of the foreign exchange instruments in that it involves two deals, or legs. All the other transactions involve only one deal. In its original form, a swap deal is the combination of a spot deal and a forward outright deal.
This market generally includes only cash transactions. Hence, currency futures contracts, albeit a special breed of forward outright transactions, are isolated and analysed separately.
In the forward market, there is no standard regarding the settlement dates, which range from 3 days to 3 years. Volume in currency swaps longer than one year tends to be light but, technically, there is no impediment to making these deals. Any date past the spot date and within the above range may be a forward settlement, so long as it is a valid business day for both currencies. The forward markets are dispersed markets, with players around the world entering into a variety of deals, either on a one-on-one basis or through brokers. On the contrary, the currency futures market is a centralized market, in which allthedealsareexecutedontradingfloorsprovidedbydifferentexchanges.

18 Copy Right Protected ACM Gold and Forex Trading (PTY) Ltd. ™
ACM Gold Comprehensive Induction Training on Forex Trading
While in the futures market only a handful of foreign currencies may be traded in multiples of consistent amounts, the forward markets are inclusive of any currencies in any amount. The forward price encompassestwosignificantparts:thespotexchangerateandtheforwardspread.Thespotrateisthemain building block. The forward price is derived from the spot price by modifying the spot price with the forward spread, so it follows that both forward outright and swap deals are derivative instruments. The forward spread is also known as the forward points or the forward pips. The forward spread is necessary foradjustingthespotrateforspecificsettlementdatesdifferentfromthespotdate.Consequently,thematurity date is another formative aspect of the forward price. Just as in the case of the spot market, the left side of the quote is the bid side, and the right side is the offer side.
3.4. Currency Options
A currency option is an agreement between a buyer and a seller that gives the buyer the right, but not the compulsion,totradeaspecificamountofcurrencyataprearrangedpriceandwithinapredeterminedperiod of time, regardless of the market price of the currency; and gives the seller, or writer, the obligation to deliver the currency under the predetermined terms, if and when the buyer wants to exercise the option.
Currencyoptionsaredistinctive trading instruments, equally fit for speculationandhedging.Optionsallow for a comprehensive customization of each individual strategy, a quality of vital importance for the sophisticated investor. More factors affect the option price relative to the prices of other foreign currency instruments.Unlikespotor forwards,bothhighand lowvolatilitymaygenerateaprofit in theoptionsmarket. For some, options are a cheaper vehicle for currency trading. For others, options mean added security and exact stop-loss order execution.
The biggest options trading centre is the United States, followed by the United Kingdom and Japan. Options prices are based on, or derived from, the cash instruments. Therefore, an option is a derivative instrument. Options are usually mentioned vis-a-vis insurance and hedging strategies. Often, however, tradershavemisconceptionsregardingboththedifficultyandsimplicityofusingoptions.Therearealsomisconceptions regarding the capabilities of options.
In the currency markets, options are available on either cash or futures. It follows, then, that they are traded either over-the-counter (OTC) or on the centralized futures markets.
The majority of currency options, around 81 percent, are traded over- the-counter. The over-the-counter market is similar to the spot or swap market.
Corporations may call banks, and banks will trade with each other either directly or in the brokers’ market. Thistypeofdealingallowsformaximumflexibility:anyamount,anycurrency,anyoddexpirationdate,any time. The currency amounts may be even or odd. The amounts may be quoted in either U.S. dollars or foreign currencies.
Any currency may be traded as an option, not only the ones available as futures contracts. Therefore, traders may quote on any exotic currency, as required, including any cross currencies.

19ACM Gold - Comprehensive Induction Training Manual - October 2012 v1
The expiration date may be quoted anywhere from several hours to several years, although the bulk of dates are concentrated around the even dates—one week, one month, two months, and so on. The cash market never closes, so options may be traded literally around the clock.
Trading an option on currency futures will entitle the buyer to the right, but not the obligation, to take physical possession of the currency future. Unlike the currency futures, buying currency options does not require an initiation margin. The option premium, or price, paid by the buyer to the seller, or writer, reflectsthebuyer’stotalrisk.
However, upon taking physical possession of the currency future by exercising the option, a trader will have to deposit a margin.
Seven major factors have an impact on the option price:
1. Price of the currency
2. Strike (exercise) price.
3. Volatility of the currency.
4. Expiration date.
5. Interest rate differential.
6. Call or put.
7. American or European option style.
Now that we have gained a basic perspective of the various type of markets traded within foreign exchange, just bear in mind that we are ultimately going to be trading the spot foreign exchange markets, as well as spot Gold and Silver.
The concepts that we are about to introduce, in the form of Technical and Fundamental analysis can be transposed to any of the above markets and more. The reason for this is that they are universal in ‘language’ and learning how to read charts as well as fundamental movements are universally applicable.
The key difference is that with the spot forex market, the exceptionally high volume and volatility make it thestarofallmarketsallowingunbeatableprofitpotential,extremelylowcostoftransactingandsmoothtrading and analysis being an OTC market with a 24 hour constant cycle.

20 Copy Right Protected ACM Gold and Forex Trading (PTY) Ltd. ™
ACM Gold Comprehensive Induction Training on Forex Trading
CHAPTER 4
Technical Analysis
4.1. The Ground rules of Technical Analysis
Technical analysis is appointed to analyse market movement (the movement of prices, volumes and open interests) using the information obtained for a past time. Mainly, it is the chart study of past behaviour ofcurrency’spricesinordertoforecasttheirfutureperformance.Itisoneofthemostsignificanttoolsavailable for the forecasting of financial markets. Such analysis has been an increasingly utilizedforecasting tool over the last two centuries.
Themainstrengthoftechnicalanalysisistheflexibilitywithregardtotheunderlyinginstrument,regardingthe markets and regarding the time frame. A trader who deals several currencies but specializes in one may easily apply the same technical expertise to trading another currency. A trader who specializes in spot trading can make a smooth transition to dealing currency futures by using chart studies, because the same technical principles apply over and over again, regardless of the market. Finally, different players have different trading styles, objectives, and time frames.
Technical analysis is easy to compute what is important while the technical services are becoming increasingly sophisticated and reasonably priced.
Prior to this historic open market intervention, technical analysis provided ample selling signals.
Price
The Fundamental Principles of Technical Analysis are based on the Dow Theory with the following main thesis:
1 Thepriceisacomprehensivereflectionofallthemarketforces.Atanygiventime,allmarketinformationandforcesarereflectedinthecurrencyprices.
2 Price movements are historically repetitive.
3 Price movements are trend followers.
4. The market has three trends: primary, secondary, and minor. The primary trend has three phases: accumulation, run-up/run-down, and distribution. In the accumulation phase, the shrewdest traders enter new positions. In the run-up/run-down phase, the majority of the marketfinally“sees”themoveandjumpsonthebandwagon.Finally,inthedistributionphase,thekeenesttraderstaketheirprofitsandclosetheirpositionswhilethegeneraltrading interest slows down in an overshooting market. The secondary trend is a correction to the primary trend and may retrace one- third, one-half or two-thirds from the primary trend.
5. Volumemustconfirmthetrend.
6. Trendsexistuntiltheirreversalsareconfirmed.Thisillustrationbelowshowsexampleof reversals in a bearish currency market. The buying signals occur as prices break a significantresistancewhenthecurrencyexceedstheprevioushighs.

21ACM Gold - Comprehensive Induction Training Manual - October 2012 v1
A reverse bearish currency
Cycles of currency price change are the propensity for events to repeat themselves at roughly the same time and are an important ground to justify the Dow Theory.
Cycleidentificationisapowerfultoolthatcanbeusedinboththelongandtheshortterm.Thelongertheterm,themoresignificanceacyclehas.Theillustratorbelowshowsaseriesofthreecycles.Thetopof the cycle (C) is called the crest, and the bottom (T) is known as the trough. Analysts measure cycles from trough to trough.
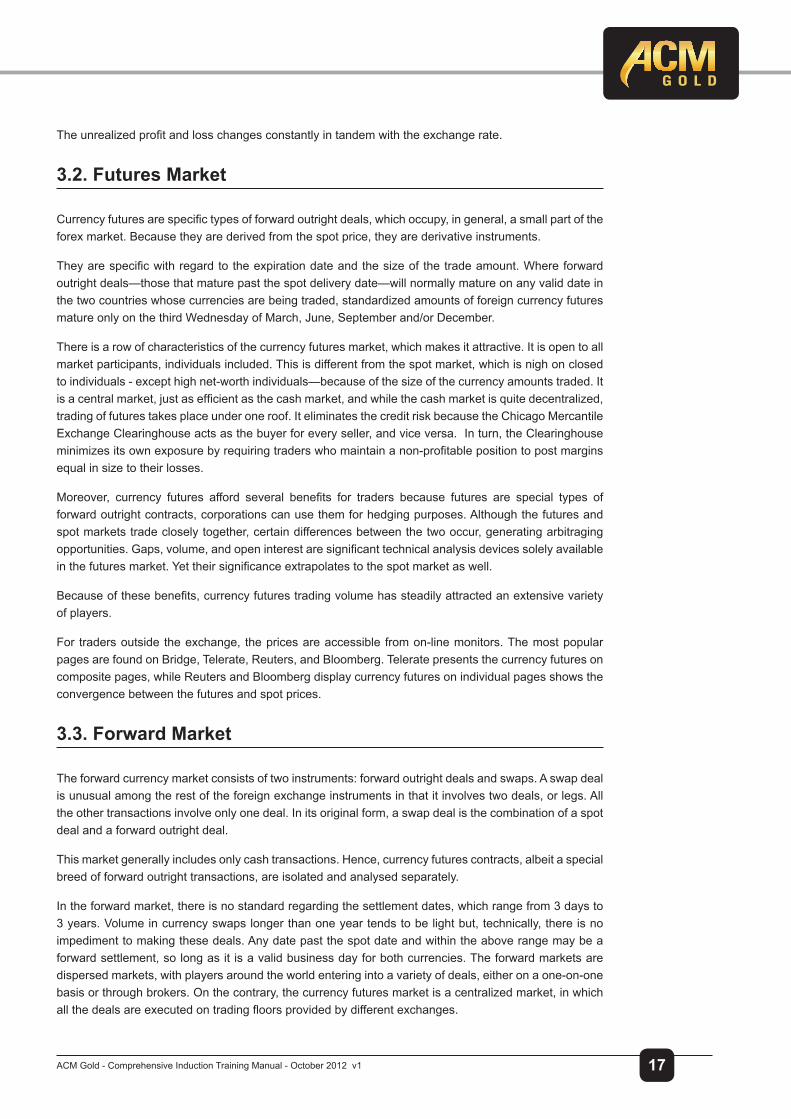
Cycles are gauged in terms of amplitude, period, and phase. The amplitude shows the height of the cycle; the period shows the length of the cycle; the phase shows the location of a wave trough.
The structure of cycles
22 Copy Right Protected ACM Gold and Forex Trading (PTY) Ltd. ™
ACM Gold Comprehensive Induction Training on Forex Trading
The two gauging measures of a cycle; period and phase
Volume and Open Interest
Volume consists of the total amount of currency traded within a period of time, usually one day. For example, by year 2012, the total foreign currency daily trading volume was $4 trillion. But traders are naturallymoreinterestedinthevolumeofspecificinstrumentsforspecifictradingperiods,becauselargetrading volume suggests that there is interest and liquidity in a certain market, and low volume warns the trader to veer away from that market.
The risks of a low-volumemarket are usually very difficult to quantify or hedge. In addition, certainchart formations require heavy trading volume for successful development. An example is the head-and-shoulder formation. Therefore, despite its obvious importance, volume is not easy to quantify in all foreign exchange markets.
Onemethodtoestimatevolumeistoextrapolatethefiguresfromthefuturesmarket.Anotheris“feeling”the size of volume based on the number of calls on the dealing systems or phones, and the “noise” from the brokers’ market.
Open interest is the total exposure, or outstanding position, in a certain instrument. The same problems thataffect volumearealsopresenthere.As itwasalreadymentioned, figures for volumeandopeninterest are available for currency futures. If you have access to printed or electronic charts on futures, you will be able to see these numbers plotted at the bottom of the futures charts.
Volumeandopeninterestfiguresareavailablefromdifferentsources,althoughonedaylatesuchasthenewswires (Bridge Information Systems, Reuters, Bloomberg), newspapers (the Wall Street Journal, the Journal of Commerce), Weekly printed charts (Commodity Perspective, Commodity Trend Service).

23ACM Gold - Comprehensive Induction Training Manual - October 2012 v1
4.2. Types of charts
Candlestick Chart
The candlestick chart is closely related to the bar chart. It also consists of four major prices: high, low, open, and close. In addition to the common readings, the candlestick chart has a set of particular interpretations. It is also easier to view and hence the most popular type of chart to analyze on:

24 Copy Right Protected ACM Gold and Forex Trading (PTY) Ltd. ™
ACM Gold Comprehensive Induction Training on Forex Trading
The opening and closing prices form the body of the candlestick. To indicate that the opening was lower than the closing, the body of the bar is left blank. In its original form, the body was colored red. Current standard electronic displays allow you to keep it blank or select a color of your choice. If the currency closesbelow itsopening, thebody is filled. In its original form, thebodywascoloredblack, but theelectronicdisplaysallowyoutokeepitfilledortoselectacolorofyourchoice.
Just as with a bar chart, the candlestick chart is unable to trace every price movement during a day’s activity.
Bar Chart
Althoughnotaspopularasthecandlechart,itcanstillproveuseful.Itconsistsoffoursignificantpoints:
● The high and the low prices, which are united by a vertical bar;
● The opening price, which is marked with a little horizontal line to the left of the bar;
● The closing price, which is marked with a little horizontal line to the right of the bar.
This is an example of a bar chart:
The opening price is not always important for analysis.
An advantage of this chart is that, unlike line charts, the bar chart is able to plot price gaps that are formed in the currency futures market. Although the currency futures market trades around the clock, physically it is open for only about a third of the trading day. (Chicago IMM is open for business 7:20 am to 2 pm CDT.) Therefore, price gaps may occur between two days’ price ranges. Incidentally, the bar chart is the chart of choice among currency futures traders.
25ACM Gold - Comprehensive Induction Training Manual - October 2012 v1
Line Chart
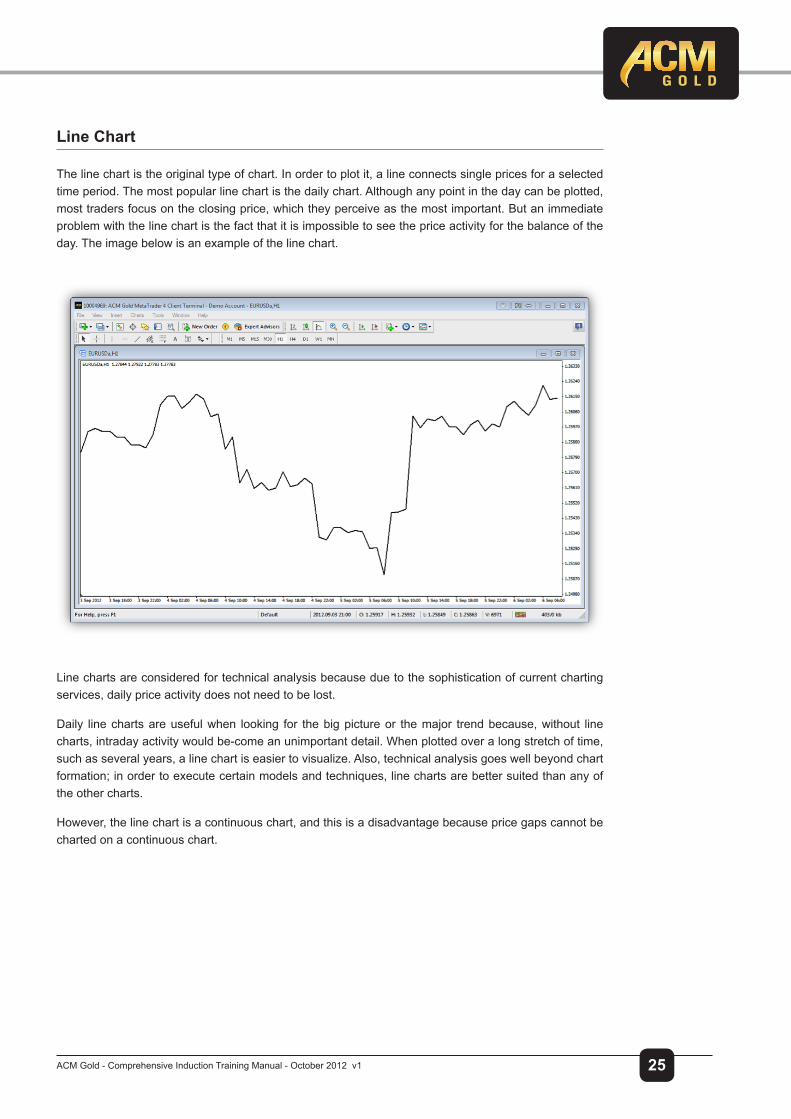
The line chart is the original type of chart. In order to plot it, a line connects single prices for a selected time period. The most popular line chart is the daily chart. Although any point in the day can be plotted, most traders focus on the closing price, which they perceive as the most important. But an immediate problem with the line chart is the fact that it is impossible to see the price activity for the balance of the day. The image below is an example of the line chart.
Line charts are considered for technical analysis because due to the sophistication of current charting services, daily price activity does not need to be lost.
Daily line charts are useful when looking for the big picture or the major trend because, without line charts, intraday activity would be-come an unimportant detail. When plotted over a long stretch of time, such as several years, a line chart is easier to visualize. Also, technical analysis goes well beyond chart formation; in order to execute certain models and techniques, line charts are better suited than any of the other charts.
However, the line chart is a continuous chart, and this is a disadvantage because price gaps cannot be charted on a continuous chart.
26 Copy Right Protected ACM Gold and Forex Trading (PTY) Ltd. ™
ACM Gold Comprehensive Induction Training on Forex Trading
4.3. Trends, Support and Resistance
Kinds of Trends
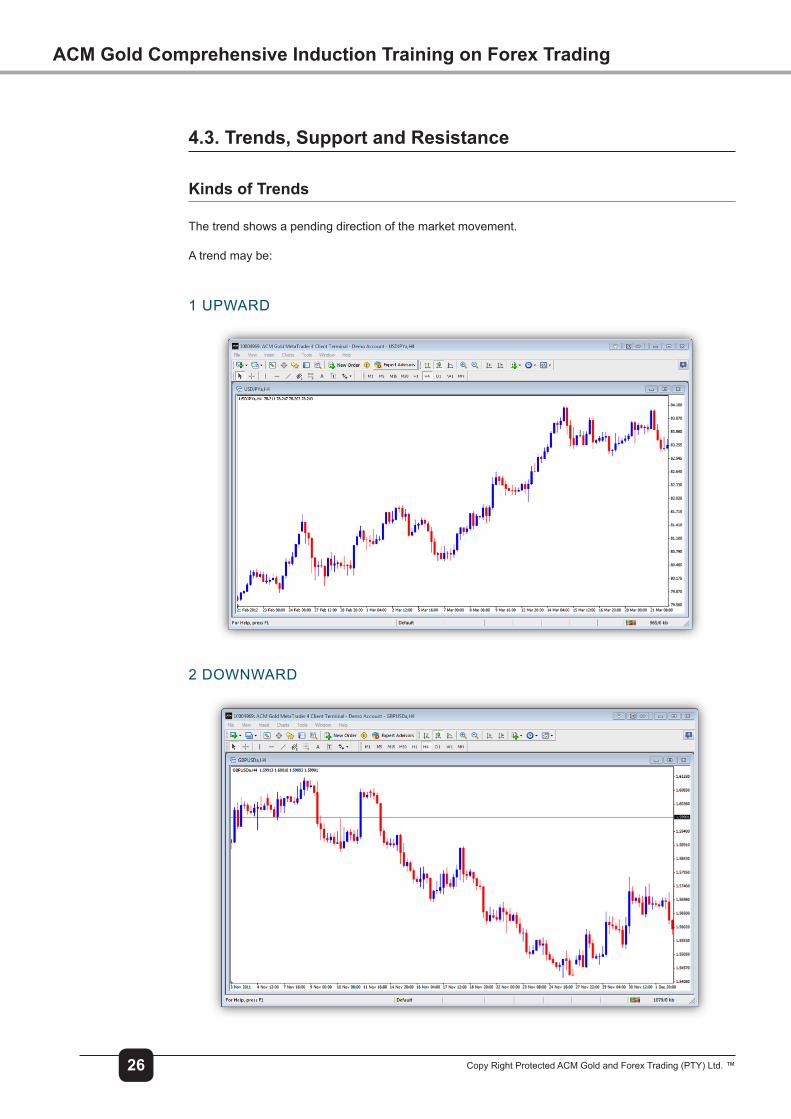
The trend shows a pending direction of the market movement.
A trend may be:
1 UPWARD
2 DOWNWARD
27ACM Gold - Comprehensive Induction Training Manual - October 2012 v1
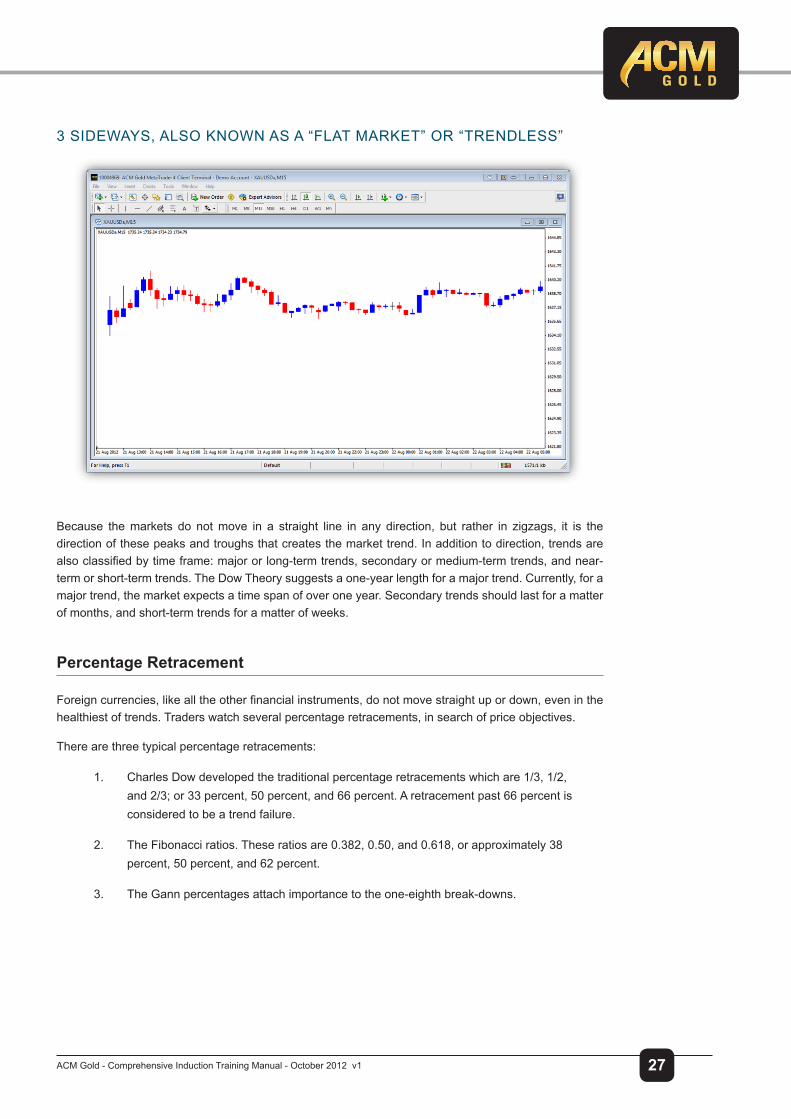
3 SIDEWAYS, ALSO KNOWN AS A “FLAT MARKET” OR “TRENDLESS”
Because the markets do not move in a straight line in any direction, but rather in zigzags, it is the direction of these peaks and troughs that creates the market trend. In addition to direction, trends are alsoclassifiedbytimeframe:majororlong-termtrends,secondaryormedium-termtrends,andnear-term or short-term trends. The Dow Theory suggests a one-year length for a major trend. Currently, for a major trend, the market expects a time span of over one year. Secondary trends should last for a matter of months, and short-term trends for a matter of weeks.
Percentage Retracement
Foreigncurrencies,likealltheotherfinancialinstruments,donotmovestraightupordown,eveninthehealthiest of trends. Traders watch several percentage retracements, in search of price objectives.
There are three typical percentage retracements:
1. Charles Dow developed the traditional percentage retracements which are 1/3, 1/2, and 2/3; or 33 percent, 50 percent, and 66 percent. A retracement past 66 percent is considered to be a trend failure.
2. The Fibonacci ratios. These ratios are 0.382, 0.50, and 0.618, or approximately 38 percent, 50 percent, and 62 percent.
3. The Gann percentages attach importance to the one-eighth break-downs.

28 Copy Right Protected ACM Gold and Forex Trading (PTY) Ltd. ™
ACM Gold Comprehensive Induction Training on Forex Trading
The Trendline
A trendline is the natural development in tracking a trend. It simply consists of a straight line connecting the significanthighs(peaks)orthesignificantlows(troughs.)Followinginthetracksofthetrenddirections,thetrendlinesmaybeclassifiedas:
RISING TRENDLINES:
DECLINING TRENDLINES:
29ACM Gold - Comprehensive Induction Training Manual - October 2012 v1
Todrawatrendlineonlytwopointsarenecessaryandthethirdoneisthecontactpointconfirmation.The currency maintains its general direction and velocity. A trend line exists until it is broken as a result ofasignificantmoveofthepriceupordown.Hence,evenafterconfirmation,thebreakoutisstilllikelyto be followed by a period of consolidation. It is relatively rare for a trend line to suddenly reverse its direction. If a consolidation period does indeed occur, the longer it lasts, the steeper the following rally will be. Breakouts from uptrend lines tend to test the strength of the former support line, now turned into a resistance line.
Apricefilterof3%servesusuallytotestthevalidityofthebreakout.
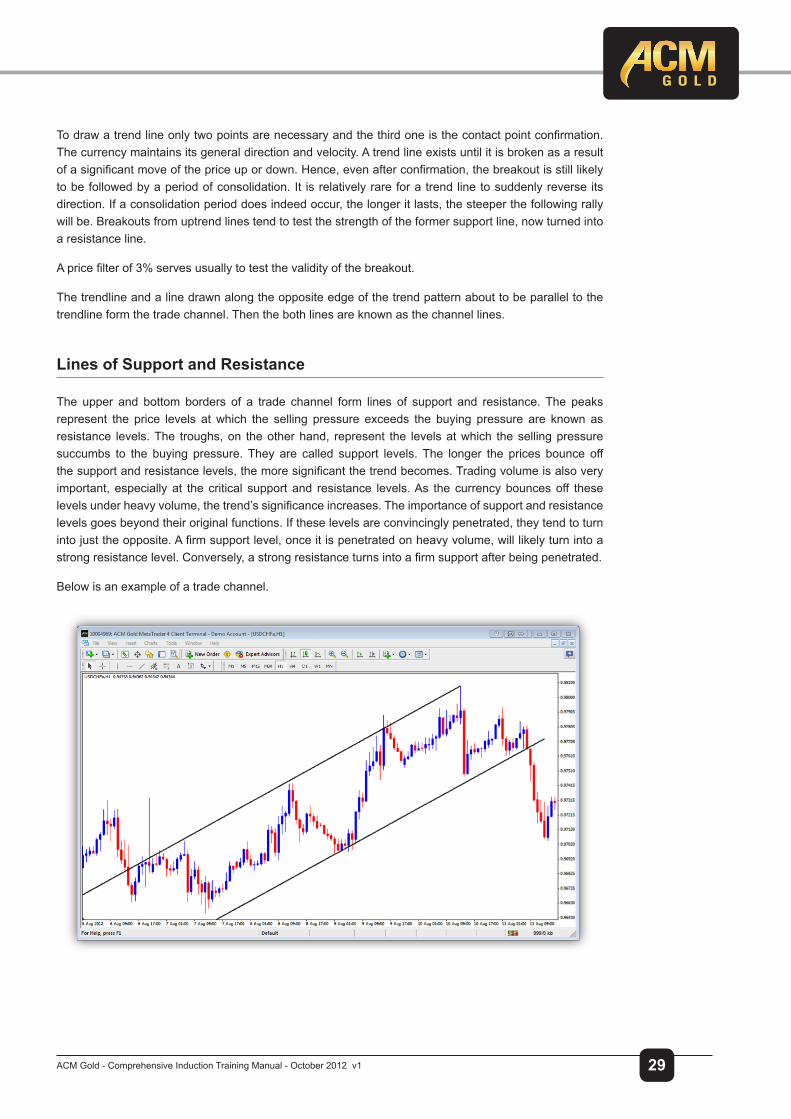
The trendline and a line drawn along the opposite edge of the trend pattern about to be parallel to the trendline form the trade channel. Then the both lines are known as the channel lines.
Lines of Support and Resistance
The upper and bottom borders of a trade channel form lines of support and resistance. The peaks represent the price levels at which the selling pressure exceeds the buying pressure are known as resistance levels. The troughs, on the other hand, represent the levels at which the selling pressure succumbs to the buying pressure. They are called support levels. The longer the prices bounce off thesupportandresistancelevels,themoresignificantthetrendbecomes.Tradingvolumeisalsoveryimportant, especially at the critical support and resistance levels. As the currency bounces off these levelsunderheavyvolume,thetrend’ssignificanceincreases.Theimportanceofsupportandresistancelevels goes beyond their original functions. If these levels are convincingly penetrated, they tend to turn intojusttheopposite.Afirmsupportlevel,onceitispenetratedonheavyvolume,willlikelyturnintoastrongresistancelevel.Conversely,astrongresistanceturnsintoafirmsupportafterbeingpenetrated.
Below is an example of a trade channel.

30 Copy Right Protected ACM Gold and Forex Trading (PTY) Ltd. ™
ACM Gold Comprehensive Induction Training on Forex Trading
And this is an example of the support turned into resistance:
4.4. Trend Reversal Patterns
Chartformationsaregenerallysortedonthebasisoftheirsignificancetothecurrenttrendoftheunderlyingcurrency. Formations signalling the end of the trend are known as reversal patterns. Conversely, chart formationsthatconfirmthattheunderlyingcurrencytrendisintactarecalledcontinuationpatterns.
Themostsignificanttrendreversalpatternsare:
1. Head-and-shoulders and inverse head-and-shoulders.
2. Double tops and double bottoms.
3. Triple tops and triple bottoms.
Head-And-Shoulders
The head-and-shoulder’s pattern is one of the most reliable and well- known chart formations. It consists ofthreeconsecutiverallies.Thefirstandthirdrallies—theshoulders—haveaboutthesameheight,andthe middle one—the head—is the highest. All three rallies are based on the same support line (or on the resistance line in the case of the reversed head-and-shoulder’s formation), known as the neckline.

31ACM Gold - Comprehensive Induction Training Manual - October 2012 v1
Prior to point A, the neckline was a resistance line. Once the resistance line was broken, it turned into asignificantsupportline.Thepricebouncedoffittwice,atpointsBandC.ThenecklinewaseventuallybrokeninpointD,underheavyvolume,andthetrendreversalwasconfirmed.Asthesignificantsupport line was broken, a retracement could be expected to retest the neckline (E), now a resistance line again. If the resistance line held, the price was expected to eventually decline to around level F, which was the price target of the head-and-shoulder’s formation. The target was approximately equal in amplitude to the distance between the top of the head and the neckline. The price target was measured from point D, where the neckline was broken. (See the dotted lines).
Signals Generated by the Head-and-shoulders Pattern
The head-and-shoulder’s formation provides excellent information:
1. The support line. This is based on points B and C.
2. The resistance line. After giving in at point D, the market may retest the neckline at point E.
3. The price direction. If the neckline holds the buying pressure at point E, then the formation provides information regarding the price direction: diametrically opposed to the direction of the head-and-shoulders (bearish).
4. Thepricetarget.Thisisprovidedbytheconfirmationoftheformation(bybreakingthrough the neckline under heavy trading volume).
One of the main requirements of the successful development of this formation is that the breakout through the neckline occurs under heavy market volume. A breakout on light volume is a strong warning that it is a false breakout and will trigger a sharp backlash in the currency price. The time frame for this chart formation’s evolution is anywhere from several weeks to several months. The intraday chart formations arenotreliable.Thelongertheformationtimeis,themoresignificanceshouldbeattachedtothispattern.The target is unlikely to be reached in a very short time frame. Whereas there is no immediate suggestion regarding the length of target reaching time, common sense would link it to the duration of development of the chart pattern.
It is reasonable to emphasize the importance of measuring the target from the point where the neckline was broken. There is a tendency among new technicians to measure the target price not only from under the neckline but also from the middle of the formation. This may happen as they measure the height of the head. Most head-and-shoulder’s formations, of course, look different from that in this picture below. Pricesfluctuateenoughtoforegoanypossibilityofaclean-lookingchartline.Also,thenecklineisseldoma perfectly horizontal line.

32 Copy Right Protected ACM Gold and Forex Trading (PTY) Ltd. ™
ACM Gold Comprehensive Induction Training on Forex Trading
Inverse Head and Shoulder Pattern
The inverse head-and-shoulder’s formation is a mirror image of the previous pattern. Therefore, you can apply the same characteristics, potential problems, signals, and trader’s point of view from the preceding presentation. The underlying currency broke out of the downtrend ranged by the xx’-yy’ channel. The currency retested the previous resistance line (the rally number 3), now turned into a support line. Among the three consecutive rallies, the shoulders (1 and 3) have approximately the same height, and the head is the lowest. Prior to point A, the neckline was a support line. Once this line was broken, it turned into asignificantresistanceline.Thepricebouncedoffthenecklinetwice,atpointsBandC.ThenecklinewaseventuallybrokenatpointD,underheavyvolume.Asthesignificantresistancelinewasbroken,aretracement could be expected to retest the neckline (E), now a support line again. If it held, the price was expected to eventually rise to around level F, which is the price target of the head-and-shoulder’s formation.
The price objective is approximately equal in amplitude to the distance between the top of the head and the neckline, and is measured from the breakout point D.
Double Top
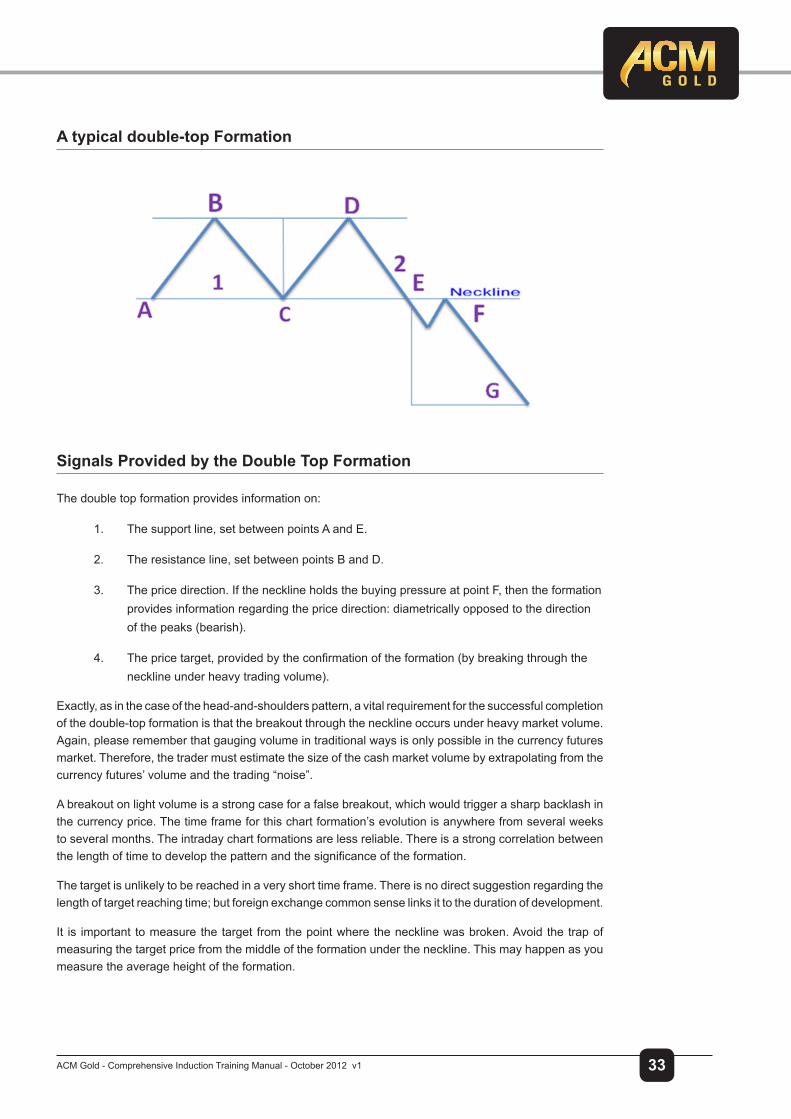
Another very reliable and common trend reversal chart formation is the double top. As the name clearly and succinctly describes, this pattern consists of two tops (peaks) of approximately equal heights. A parallel line is drawn against a resistance line that connects the two tops. We should think of this line as identical to the head-and-shoulders’ neckline. As a resistance line, it is broken at point A. It turns into a strong support for price level at C, but eventually fails at point E. The support line turns into a strong resistance line, which holds the market backlash at point F. The price objective is at level G, which is the average height of the double top formation, measured from point E.
33ACM Gold - Comprehensive Induction Training Manual - October 2012 v1
A typical double-top Formation
Signals Provided by the Double Top Formation
The double top formation provides information on:
1. The support line, set between points A and E.
2. The resistance line, set between points B and D.
3. The price direction. If the neckline holds the buying pressure at point F, then the formation provides information regarding the price direction: diametrically opposed to the direction of the peaks (bearish).
4. Thepricetarget,providedbytheconfirmationoftheformation(bybreakingthroughtheneckline under heavy trading volume).
Exactly, as in the case of the head-and-shoulders pattern, a vital requirement for the successful completion of the double-top formation is that the breakout through the neckline occurs under heavy market volume. Again, please remember that gauging volume in traditional ways is only possible in the currency futures market. Therefore, the trader must estimate the size of the cash market volume by extrapolating from the currency futures’ volume and the trading “noise”.
A breakout on light volume is a strong case for a false breakout, which would trigger a sharp backlash in the currency price. The time frame for this chart formation’s evolution is anywhere from several weeks to several months. The intraday chart formations are less reliable. There is a strong correlation between thelengthoftimetodevelopthepatternandthesignificanceoftheformation.
The target is unlikely to be reached in a very short time frame. There is no direct suggestion regarding the length of target reaching time; but foreign exchange common sense links it to the duration of development.
It is important to measure the target from the point where the neckline was broken. Avoid the trap of measuring the target price from the middle of the formation under the neckline. This may happen as you measure the average height of the formation.
34 Copy Right Protected ACM Gold and Forex Trading (PTY) Ltd. ™
ACM Gold Comprehensive Induction Training on Forex Trading
Rounded Top and Bottom Formations
The rounded top and bottom, also known as saucers consist of a very slow and gradual change in the directionofthemarket.Thesepatternsreflecttheindecisionofthemarketattheendofatrend.Thetrading activity is slow. It is impossible to know when the formation is indeed completed, and not for a lack of trying. Like any other consolidation pattern, the longer it takes to complete, the higher the likelihood of a sharp price move in the new direction.
Double Bottom
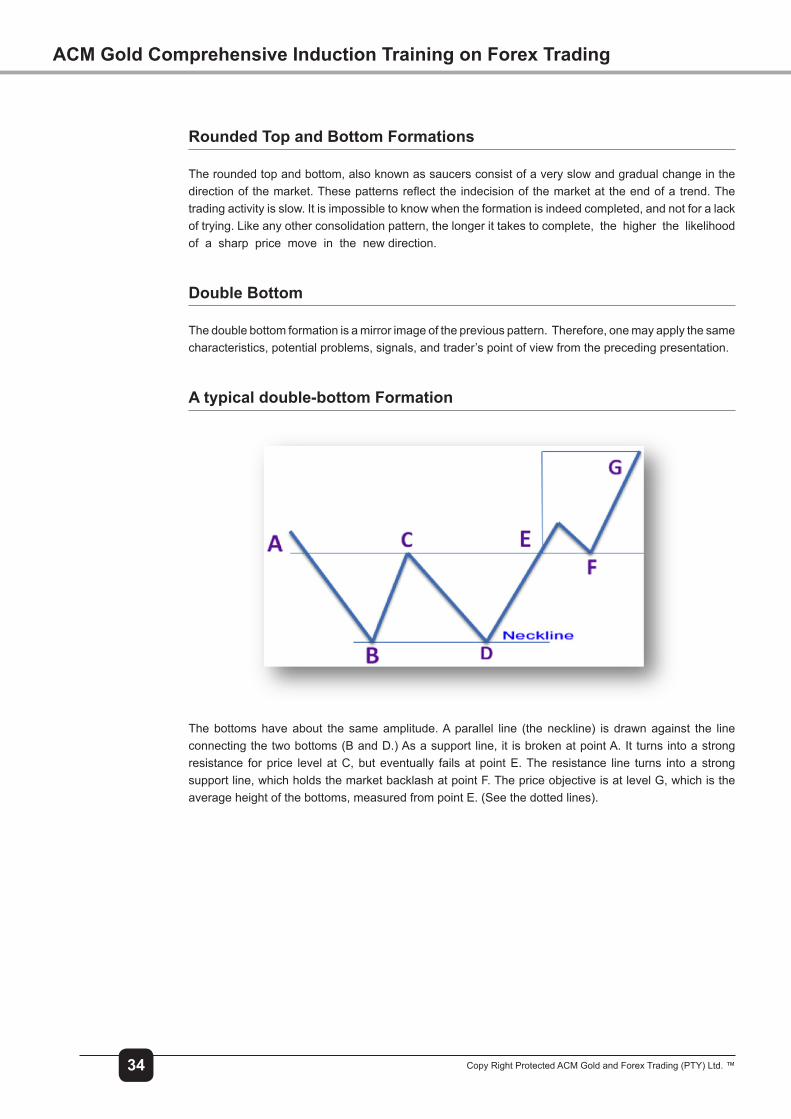
The double bottom formation is a mirror image of the previous pattern. Therefore, one may apply the same characteristics, potential problems, signals, and trader’s point of view from the preceding presentation.
A typical double-bottom Formation
The bottoms have about the same amplitude. A parallel line (the neckline) is drawn against the line connecting the two bottoms (B and D.) As a support line, it is broken at point A. It turns into a strong resistance for price level at C, but eventually fails at point E. The resistance line turns into a strong support line, which holds the market backlash at point F. The price objective is at level G, which is the average height of the bottoms, measured from point E. (See the dotted lines).
35ACM Gold - Comprehensive Induction Training Manual - October 2012 v1
Triple Top and Triple Bottom
The triple top is a hybrid of the head-and-shoulders and double-top trend reversal formations. Conversely, the triple bottom is a hybrid of the inverse head-and-shoulders and double-bottom formations. Consequently, they have the same characteristics, potential problems, signals, and trader’s point of view as the double top or double bottom, respectively.
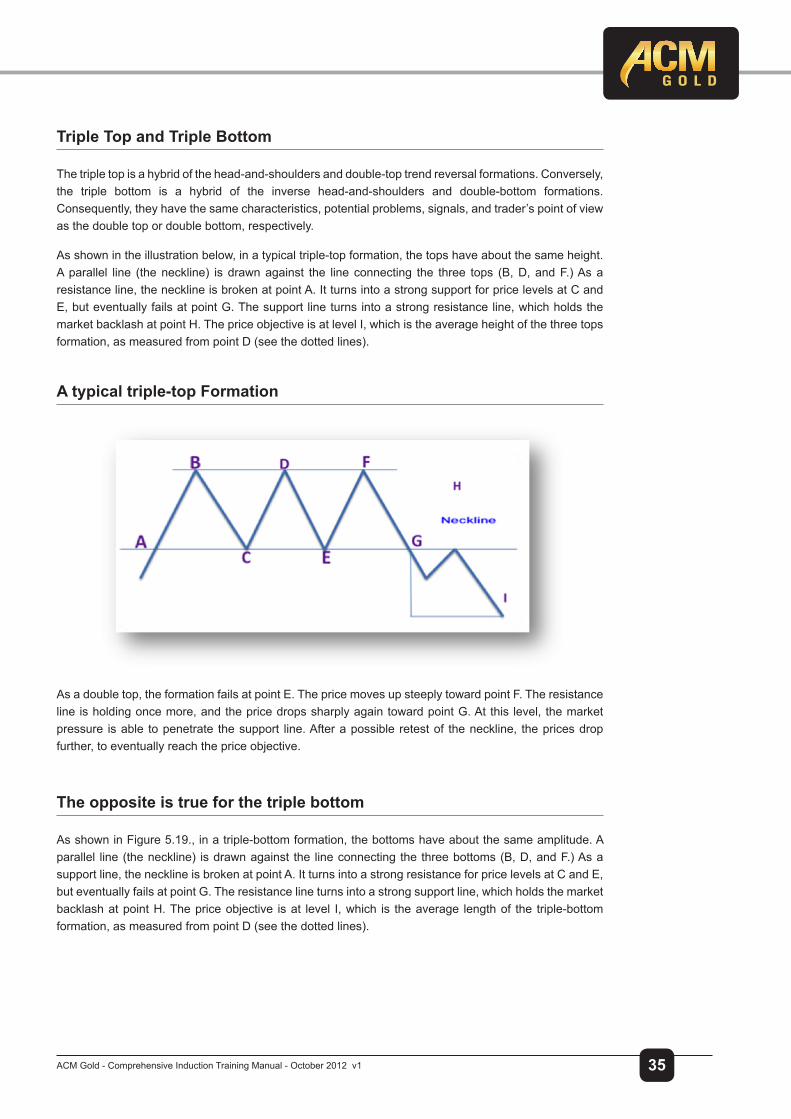
As shown in the illustration below, in a typical triple-top formation, the tops have about the same height. A parallel line (the neckline) is drawn against the line connecting the three tops (B, D, and F.) As a resistance line, the neckline is broken at point A. It turns into a strong support for price levels at C and E, but eventually fails at point G. The support line turns into a strong resistance line, which holds the market backlash at point H. The price objective is at level I, which is the average height of the three tops formation, as measured from point D (see the dotted lines).
A typical triple-top Formation
As a double top, the formation fails at point E. The price moves up steeply toward point F. The resistance line is holding once more, and the price drops sharply again toward point G. At this level, the market pressure is able to penetrate the support line. After a possible retest of the neckline, the prices drop further, to eventually reach the price objective.
The opposite is true for the triple bottom
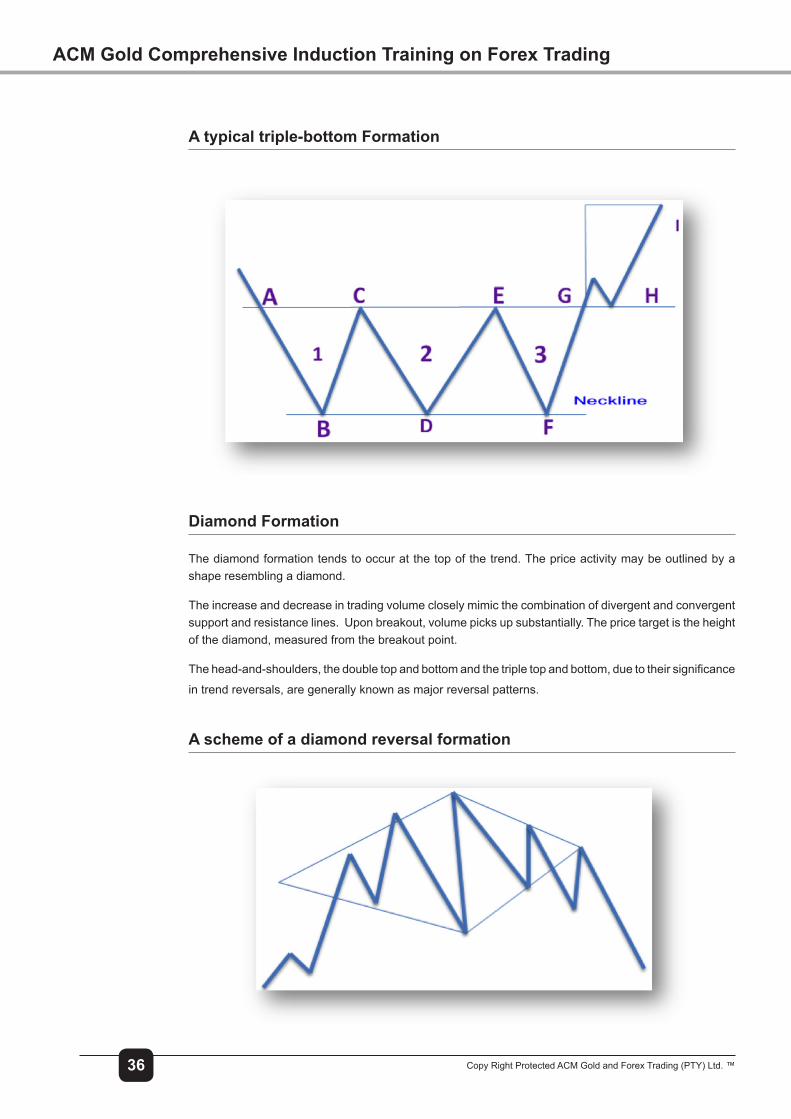
As shown in Figure 5.19., in a triple-bottom formation, the bottoms have about the same amplitude. A parallel line (the neckline) is drawn against the line connecting the three bottoms (B, D, and F.) As a support line, the neckline is broken at point A. It turns into a strong resistance for price levels at C and E, but eventually fails at point G. The resistance line turns into a strong support line, which holds the market backlash at point H. The price objective is at level I, which is the average length of the triple-bottom formation, as measured from point D (see the dotted lines).
36 Copy Right Protected ACM Gold and Forex Trading (PTY) Ltd. ™
ACM Gold Comprehensive Induction Training on Forex Trading
A typical triple-bottom Formation
Diamond Formation
The diamond formation tends to occur at the top of the trend. The price activity may be outlined by a shape resembling a diamond.
The increase and decrease in trading volume closely mimic the combination of divergent and convergent support and resistance lines. Upon breakout, volume picks up substantially. The price target is the height of the diamond, measured from the breakout point.
Thehead-and-shoulders,thedoubletopandbottomandthetripletopandbottom,duetotheirsignificance
in trend reversals, are generally known as major reversal patterns.
A scheme of a diamond reversal formation

37ACM Gold - Comprehensive Induction Training Manual - October 2012 v1
4.5. Trend Continuation Patterns
Technical analysis provides charts that reinforce the current trends. These chart formations are known as continuation patterns. They consist of fairly short consolidation periods. The breakouts occur in the same direction as the original trend.
The most important continuation patterns are:
1. Wedges
2. Triangles
3. Rectangles
4. Flags
5. Pennants
Wedge Formation
The wedge formation is a close relative of the triangle and the pennant formations. It resembles both the shape and the development time of the triangles, but it really looks and behaves like a pennant without a pole. The wedge is markedly sloped, and the breakout occurs in the direction opposite to its slope, but similar to the direction of the original trend. The signal we receive from the wedge formation is direction only. There is no reliable price objective. Depending on the trend direction, there are two types of wedges: falling and rising.
A falling wedge

38 Copy Right Protected ACM Gold and Forex Trading (PTY) Ltd. ™
ACM Gold Comprehensive Induction Training on Forex Trading
Triangle Formation
Triangles can be visualized as pennants with no poles. There are four types of triangles: symmetrical, ascending, descending, and expanding (broadening).
Asymmetricaltriangleconsistsoftwosymmetricallyconvergingsupportandresistancelines,definedbyatleastfoursignificantpoints.Thiscanbeseeninthediagrambelow.Thetwosymmetricallyconverginglines suggest that there is a balance between supply and demand in the foreign exchange market. Consequently, a break may occur on either side. In the case of a bullish symmetrical triangle, the breakout will occur in the same direction, qualifying the formation as a continuation pattern.
THIS IS A MARKET EXAMPLE OF A BEARISH TRIANGLE.
A Bullish symmetrical Triangle
Asdepictedintheabovediagram,theconverginglinesaresymmetrical.ThedeclininglineisdefinedbypointsB,D,andF.TherisingsupportlineisdefinedbypointsA,C,E,andG.Thepricetargetiseither(1) equal to the width of the base of the triangle BB’, measured from the breakout point H (HH’); or (2) at the intersection of line BI (which is a parallel line to the rising line AG) with the price line.
Trading volume will visibly decrease toward the end of the triangle, suggesting the ambivalence of the market. The breakout is accompanied by a rise in volume.
39ACM Gold - Comprehensive Induction Training Manual - October 2012 v1
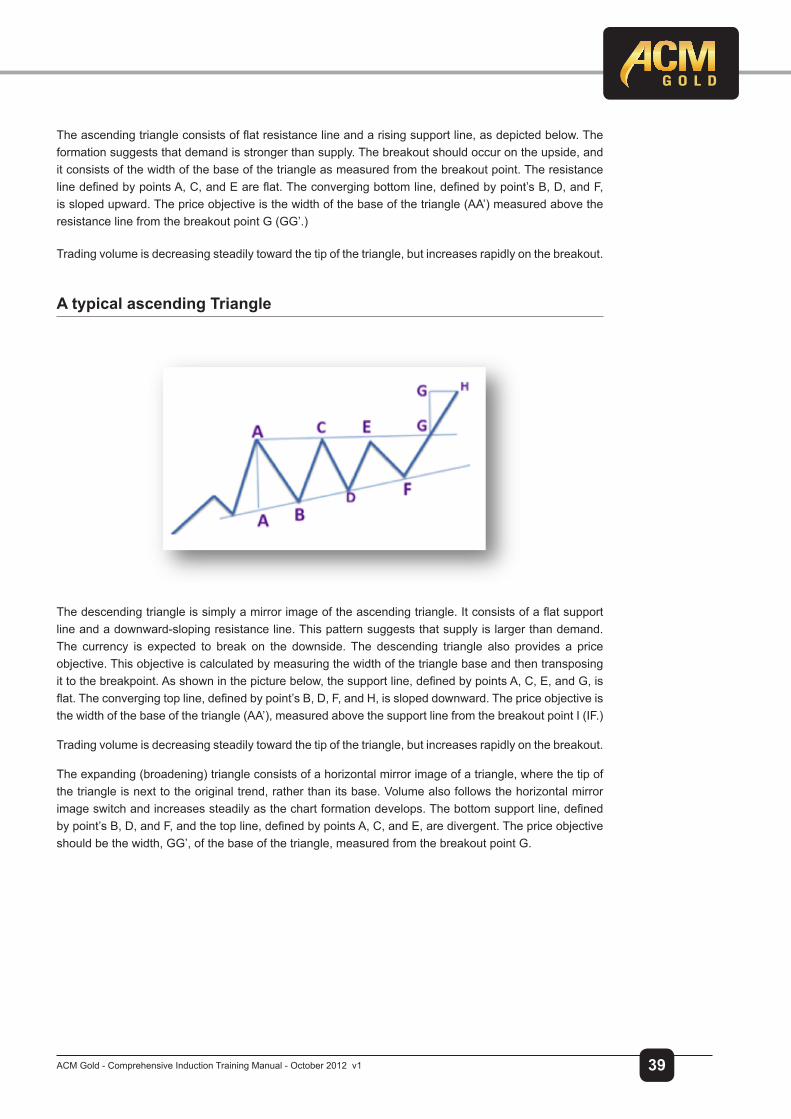
Theascendingtriangleconsistsofflatresistancelineandarisingsupportline,asdepictedbelow.Theformation suggests that demand is stronger than supply. The breakout should occur on the upside, and it consists of the width of the base of the triangle as measured from the breakout point. The resistance linedefinedbypointsA,C,andEareflat.Theconvergingbottomline,definedbypoint’sB,D,andF,is sloped upward. The price objective is the width of the base of the triangle (AA’) measured above the resistance line from the breakout point G (GG’.)
Trading volume is decreasing steadily toward the tip of the triangle, but increases rapidly on the breakout.
A typical ascending Triangle
Thedescendingtriangleissimplyamirrorimageoftheascendingtriangle.Itconsistsofaflatsupportline and a downward-sloping resistance line. This pattern suggests that supply is larger than demand. The currency is expected to break on the downside. The descending triangle also provides a price objective. This objective is calculated by measuring the width of the triangle base and then transposing ittothebreakpoint.Asshowninthepicturebelow,thesupportline,definedbypointsA,C,E,andG,isflat.Theconvergingtopline,definedbypoint’sB,D,F,andH,isslopeddownward.Thepriceobjectiveisthe width of the base of the triangle (AA’), measured above the support line from the breakout point I (IF.)
Trading volume is decreasing steadily toward the tip of the triangle, but increases rapidly on the breakout.
The expanding (broadening) triangle consists of a horizontal mirror image of a triangle, where the tip of the triangle is next to the original trend, rather than its base. Volume also follows the horizontal mirror imageswitchandincreasessteadilyasthechartformationdevelops.Thebottomsupportline,definedbypoint’sB,D,andF,andthetopline,definedbypointsA,C,andE,aredivergent.Thepriceobjectiveshould be the width, GG’, of the base of the triangle, measured from the breakout point G.

40 Copy Right Protected ACM Gold and Forex Trading (PTY) Ltd. ™
ACM Gold Comprehensive Induction Training on Forex Trading
An expanding Triangle
Rectangle Formation
Alsoknownasatradingrange(orcongestion),therectangleformationreflectsaconsolidationperiod.Upon breakout, it is likely to continue the original trend. Its failure will change it from a continuation to a reversal pattern. This pattern is easy to spot, as it can be considered a minor side-ways trend.
If it occurs within an uptrend and the breakout occurs on the upside, it is called a bullish rectangle. The price objective is the height of the rectangle. As the illustration below shows, the currency moves betweenwell-defined,flatsupportandresistancelevels.Avalidbreakoutmayoccuroneithersidefromthis consolidation period. The price target (GH) is equal to the height of the rectangle (G’H), measured from the breakout point H.
If the consolidation occurs within a downtrend and the breakout continues the original trend, then it iscalledabearishrectangle.Asshownbelow,thecurrencymovesbetweenwell-defined,flatsupportand resistance levels. A valid breakout may occur on either side of this consolidation period. The price objective (HG’) is equal in size to the height of the rectangle (GH), measured from the breakout point H.
A typical Bullish Rectangle

41ACM Gold - Comprehensive Induction Training Manual - October 2012 v1
A typical Bearish Rectangle
Flag formation
Theflagformationprovidessignalsfordirectionandpriceobjective.Thisformationrepresentsabriefconsolidation period within a solid and steep upward or downward trend. The consolidation itself is bordered by a support line and a resistance line, which are parallel to each other or very mildly converging, makingitlooklikeaflag(parallelogram)andtendtobeslopedintheoppositedirectionfromtheslopeoftheoriginaltrend,orissimplyflat.Theprevioussharptrendresemblesaflagpole.
Iftheoriginaltrendisgoingdown,theformationiscalledabearishflag.Astheillustrationbelowshows,theoriginaltrendissharplydown.TheflagpoleismeasuredbetweenpointsAandB.Theconsolidationperiod occurs between the support line B to E and the resistance line C to D. When the price penetrates the support line at point E, the trend resumes its fall, with the price objective F, measured from E. The pricetargetisofaboutequalamplitudewiththeflagpole’slength(AtoB),measuredfromthebreakoutpoint through the support line (B to E.)
Pennant Formation
Thepennantsareclosely related to theflags.Thesameprinciplesapply.Thesoledifference is thatthe consolidation area better resembles a pennant as the support and resistance lines converge. If the original trend is bullish, then the chart pattern is a bullish pennant. In the illustration below, the pennant pole is A to B.
The pennant-shaped consolidation is framed by C, B, and D. When the market breaks through the resistance line B to D, the price objective is E. The amplitude of the target price is D to E, and it is equal to the pennant pole A to B. The price target measurement starts from the breakout point.
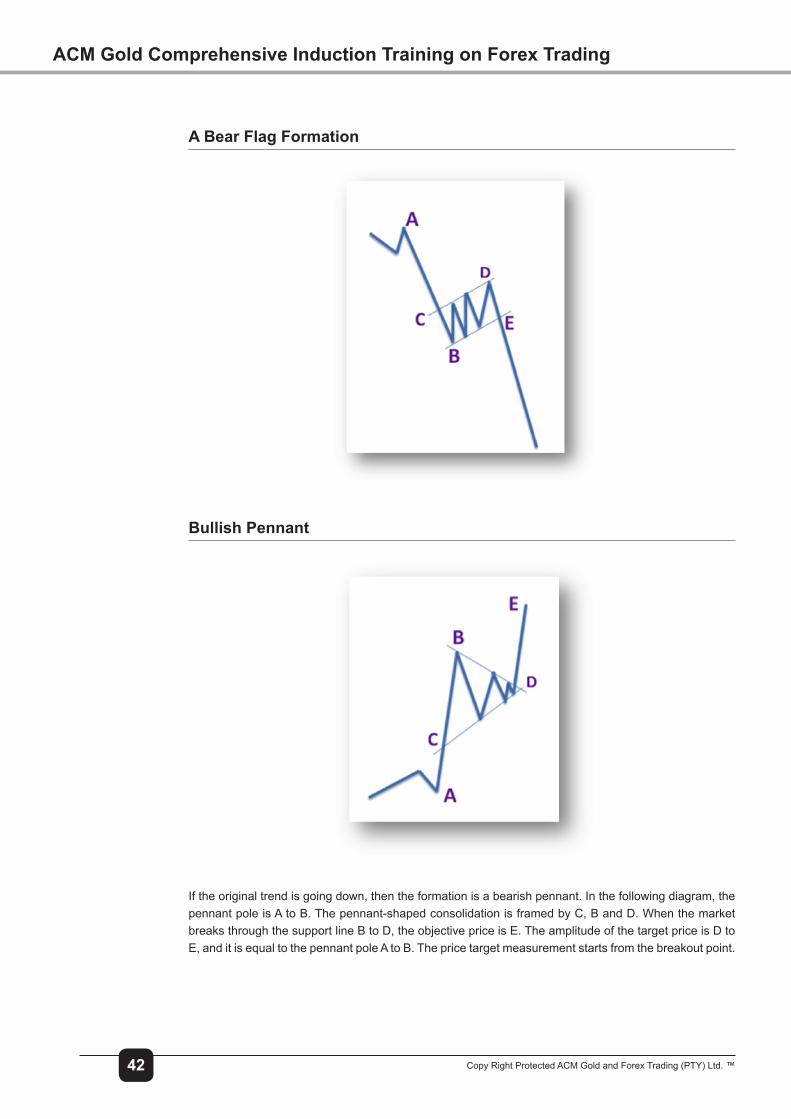
42 Copy Right Protected ACM Gold and Forex Trading (PTY) Ltd. ™
ACM Gold Comprehensive Induction Training on Forex Trading
A Bear Flag Formation
Bullish Pennant
If the original trend is going down, then the formation is a bearish pennant. In the following diagram, the pennant pole is A to B. The pennant-shaped consolidation is framed by C, B and D. When the market breaks through the support line B to D, the objective price is E. The amplitude of the target price is D to E, and it is equal to the pennant pole A to B. The price target measurement starts from the breakout point.

43ACM Gold - Comprehensive Induction Training Manual - October 2012 v1
Bearish Pennant
4.6. GapsAn opening outside the previous day’s or other period’s range generates a price gap.
Price gaps, as plotted on bar charts, are very common in the currency futures market. Although currency futures may be traded around the clock, their markets are open for only about a third of the trading day. For instance, the largest currency futures market in the world, the Chicago IMM, is open for business 7:20 am to 2:00 pm CDT. Since the cash market continues to trade around the clock, price gaps may occur between two days’ price ranges in the futures market.
There are four types of gaps: common, breakaway, runaway, and exhaustion.
Breakaway Gaps
Breakaway gaps occur at the beginning of a new trend, usually at the end of long consolidation periods. They may also appear after the completion of some chart formations that tend to act as short-term consolidations. Breakaway gaps signify a brisk change in trading sentiment, and they occur on increasingly heavy trading. Traders are understandably frustrated by consolidations, which are rarely profitable.Therefore, a breakout from the slow lane is embracedwith optimismby the profit-hungrytraders. The price takes a secondary place to participation. As always, naysayers follow the initial breakout. Sooner rather than later, the pessimists have no choice but to join the new move, thus creating more volume.
Breakawaygapsarenot likelytobefilledduringthebreakoutandforthedurationofthesubsequentmove.Intime,theymaybefilledduringanewmoveontheoppositeside.
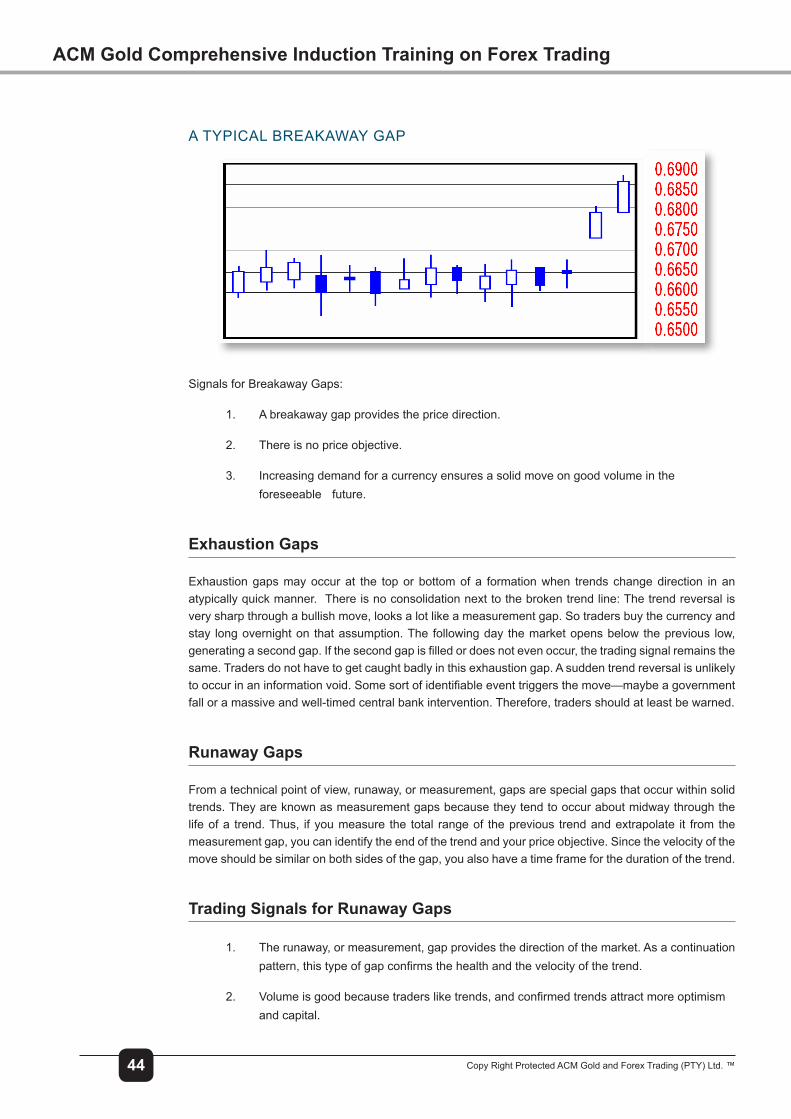
44 Copy Right Protected ACM Gold and Forex Trading (PTY) Ltd. ™
ACM Gold Comprehensive Induction Training on Forex Trading
A TYPICAL BREAKAWAY GAP
Signals for Breakaway Gaps:
1. A breakaway gap provides the price direction.
2. There is no price objective.
3. Increasing demand for a currency ensures a solid move on good volume in the foreseeable future.
Exhaustion Gaps
Exhaustion gaps may occur at the top or bottom of a formation when trends change direction in an atypically quick manner. There is no consolidation next to the broken trend line: The trend reversal is very sharp through a bullish move, looks a lot like a measurement gap. So traders buy the currency and stay long overnight on that assumption. The following day the market opens below the previous low, generatingasecondgap.Ifthesecondgapisfilledordoesnotevenoccur,thetradingsignalremainsthesame. Traders do not have to get caught badly in this exhaustion gap. A sudden trend reversal is unlikely tooccurinaninformationvoid.Somesortofidentifiableeventtriggersthemove—maybeagovernmentfall or a massive and well-timed central bank intervention. Therefore, traders should at least be warned.
Runaway Gaps
From a technical point of view, runaway, or measurement, gaps are special gaps that occur within solid trends. They are known as measurement gaps because they tend to occur about midway through the life of a trend. Thus, if you measure the total range of the previous trend and extrapolate it from the measurement gap, you can identify the end of the trend and your price objective. Since the velocity of the move should be similar on both sides of the gap, you also have a time frame for the duration of the trend.
Trading Signals for Runaway Gaps
1. The runaway, or measurement, gap provides the direction of the market. As a continuation pattern,thistypeofgapconfirmsthehealthandthevelocityofthetrend.
2. Volumeisgoodbecausetradersliketrends,andconfirmedtrendsattractmoreoptimismand capital.

45ACM Gold - Comprehensive Induction Training Manual - October 2012 v1
3. This is the only type of gap that also provides a price objective and a time frame. These characteristics are also useful for developing hedging strategies.
Common Gaps
Commongapshavetheleasttechnicalsignificanceofallthetypesofgaps.Theydonotindicateatrendstart, continuation, reversal, or even a general direction of the currency other than in the very short term. Common gaps tend to occur in relatively quiet periods or in illiquid markets. When price gaps occur in illiquid markets, such as distant currency futures expiration dates, they must be completely ignored. The entries for distant expiration dates in currency futures are made only on a closing basis, and they do not reflectanytradingactivity.
Nevertradeinanilliquidmarketbecausegettingoutofitisverydifficultandexpensive.Whengapsoccurwithinregulartradingranges,thewordonthestreethasbeenthat,“Gapsmustbefilled.”.Commongapsare short term. When currency futures open higher than yesterday’s high, they are quickly sold, targeting the level of the previous day’s high.
4.7. Mathematical Trading Methods (Indicators)
The mathematical trading methods provide a more objective view of price activity. In addition, these methods tend to provide signals prior to their occurrence on the currency charts. The tools of the mathematical methods are moving averages and oscillators.
Moving Averages
A moving average is an average of a predetermined number of prices over a number of days, divided by the number of entries. The higher the number of days in the average, the smoother the line is. A moving average makes it easier to visualize currency activity without daily statistical noise. It is a common tool in technical analysis and is used either by itself or as an oscillator.
As one can see from this image below, a moving average has a smoother line than the underlying currency. The daily closing price is commonly included in the moving averages. The average may also be based on the midrange level or on a daily average of the high, low, and closing prices.
An example of three simple moving averages consisting of periods: 10 (read), 20 (green) and100 (purple)
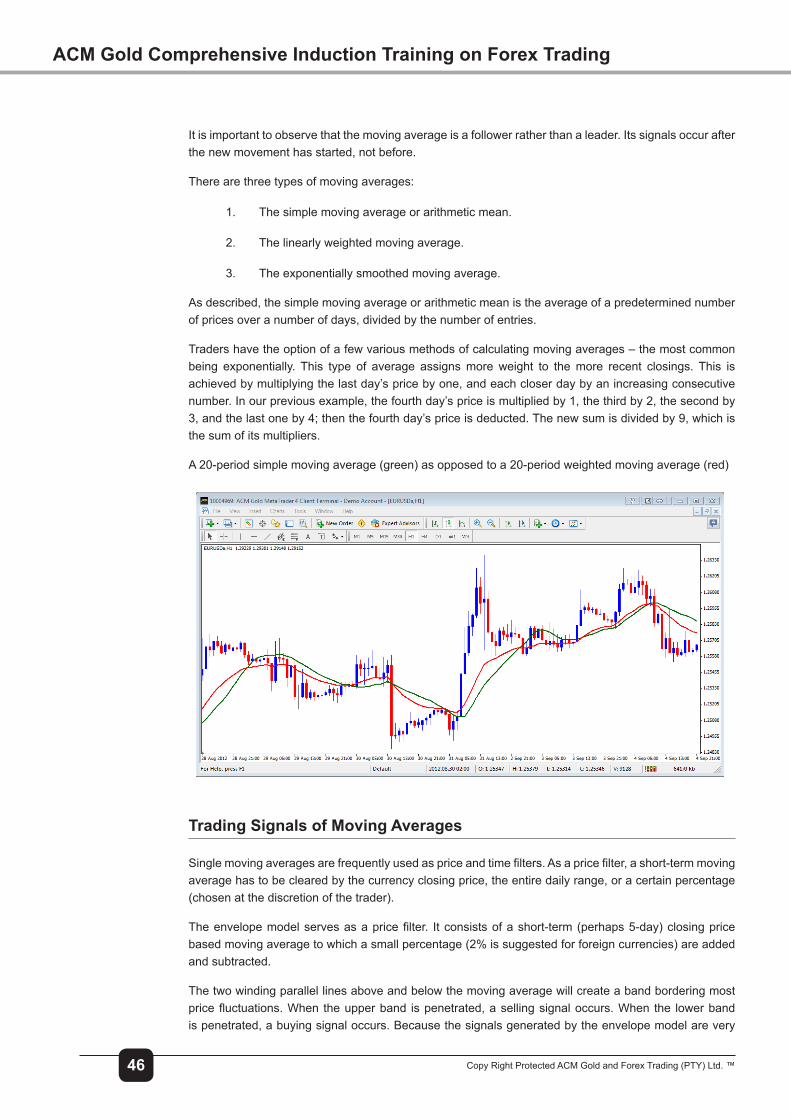
46 Copy Right Protected ACM Gold and Forex Trading (PTY) Ltd. ™
ACM Gold Comprehensive Induction Training on Forex Trading
It is important to observe that the moving average is a follower rather than a leader. Its signals occur after the new movement has started, not before.
There are three types of moving averages:
1. The simple moving average or arithmetic mean.
2. The linearly weighted moving average.
3. The exponentially smoothed moving average.
As described, the simple moving average or arithmetic mean is the average of a predetermined number of prices over a number of days, divided by the number of entries.
Traders have the option of a few various methods of calculating moving averages – the most common being exponentially. This type of average assigns more weight to the more recent closings. This is achieved by multiplying the last day’s price by one, and each closer day by an increasing consecutive number. In our previous example, the fourth day’s price is multiplied by 1, the third by 2, the second by 3, and the last one by 4; then the fourth day’s price is deducted. The new sum is divided by 9, which is the sum of its multipliers.
A 20-period simple moving average (green) as opposed to a 20-period weighted moving average (red)
Trading Signals of Moving Averages
Singlemovingaveragesarefrequentlyusedaspriceandtimefilters.Asapricefilter,ashort-termmovingaverage has to be cleared by the currency closing price, the entire daily range, or a certain percentage (chosen at the discretion of the trader).
Theenvelopemodelservesasapricefilter. Itconsistsofashort-term(perhaps5-day)closingpricebasedmovingaveragetowhichasmallpercentage(2%issuggestedforforeigncurrencies)areaddedand subtracted.
The two winding parallel lines above and below the moving average will create a band bordering most pricefluctuations.When theupperband ispenetrated,asellingsignaloccurs.When the lowerbandis penetrated, a buying signal occurs. Because the signals generated by the envelope model are very
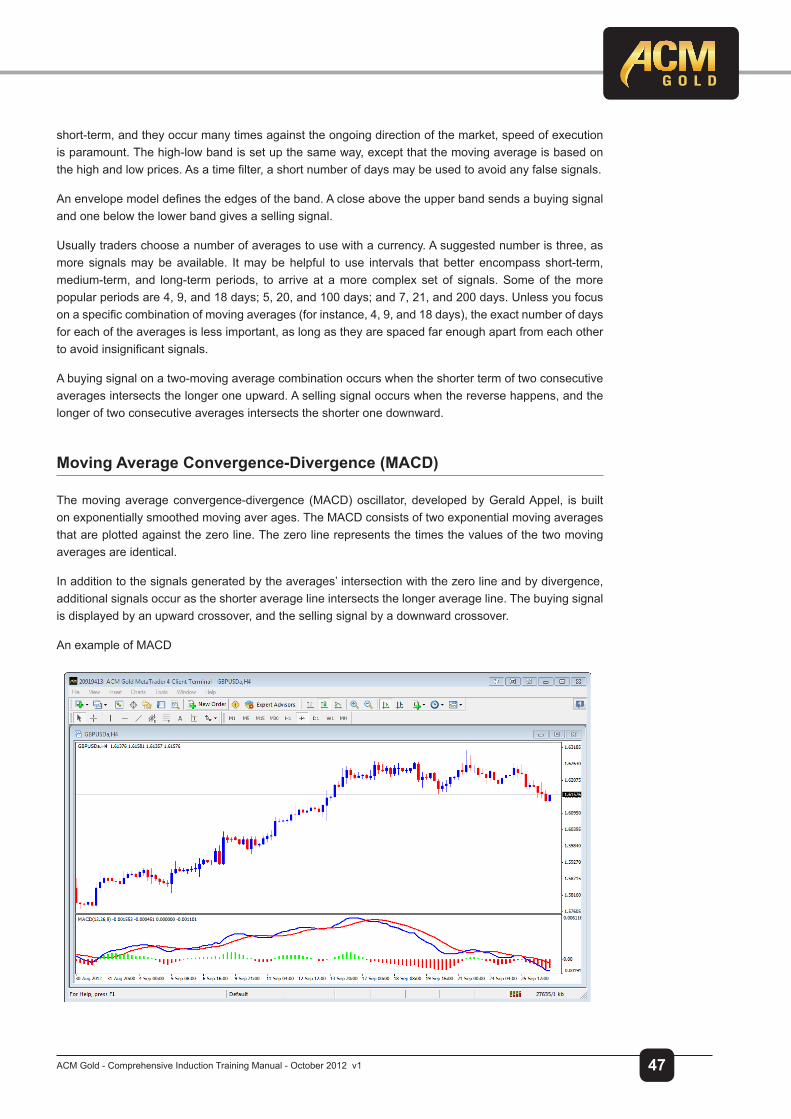
47ACM Gold - Comprehensive Induction Training Manual - October 2012 v1
short-term, and they occur many times against the ongoing direction of the market, speed of execution is paramount. The high-low band is set up the same way, except that the moving average is based on thehighandlowprices.Asatimefilter,ashortnumberofdaysmaybeusedtoavoidanyfalsesignals.
Anenvelopemodeldefinestheedgesoftheband.Acloseabovetheupperbandsendsabuyingsignaland one below the lower band gives a selling signal.
Usually traders choose a number of averages to use with a currency. A suggested number is three, as more signals may be available. It may be helpful to use intervals that better encompass short-term, medium-term, and long-term periods, to arrive at a more complex set of signals. Some of the more popular periods are 4, 9, and 18 days; 5, 20, and 100 days; and 7, 21, and 200 days. Unless you focus onaspecificcombinationofmovingaverages(forinstance,4,9,and18days),theexactnumberofdaysfor each of the averages is less important, as long as they are spaced far enough apart from each other toavoidinsignificantsignals.
A buying signal on a two-moving average combination occurs when the shorter term of two consecutive averages intersects the longer one upward. A selling signal occurs when the reverse happens, and the longer of two consecutive averages intersects the shorter one downward.
Moving Average Convergence-Divergence (MACD)
The moving average convergence-divergence (MACD) oscillator, developed by Gerald Appel, is built on exponentially smoothed moving aver ages. The MACD consists of two exponential moving averages that are plotted against the zero line. The zero line represents the times the values of the two moving averages are identical.
In addition to the signals generated by the averages’ intersection with the zero line and by divergence, additional signals occur as the shorter average line intersects the longer average line. The buying signal is displayed by an upward crossover, and the selling signal by a downward crossover.
An example of MACD
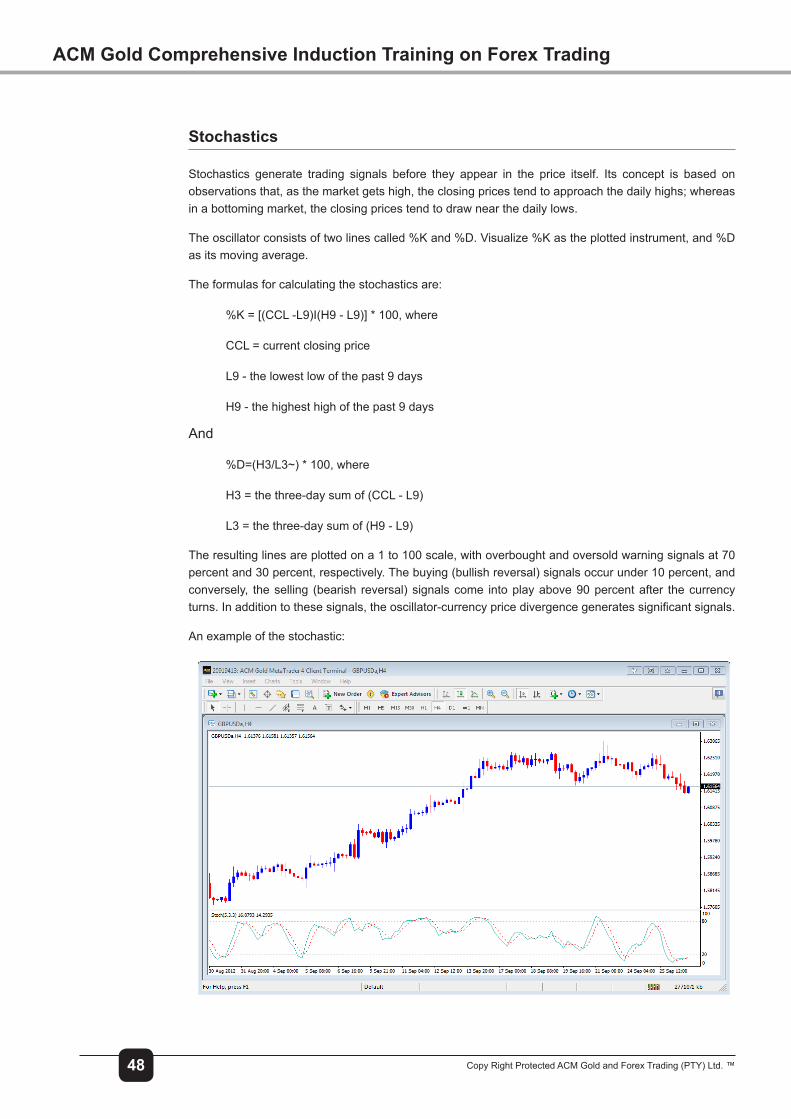
48 Copy Right Protected ACM Gold and Forex Trading (PTY) Ltd. ™
ACM Gold Comprehensive Induction Training on Forex Trading
Stochastics
Stochastics generate trading signals before they appear in the price itself. Its concept is based on observations that, as the market gets high, the closing prices tend to approach the daily highs; whereas in a bottoming market, the closing prices tend to draw near the daily lows.
Theoscillatorconsistsoftwolinescalled%Kand%D.Visualize%Kastheplottedinstrument,and%Das its moving average.
The formulas for calculating the stochastics are:
%K=[(CCL-L9)I(H9-L9)]*100,where
CCL = current closing price
L9 - the lowest low of the past 9 days
H9 - the highest high of the past 9 days
And
%D=(H3/L3~)*100,where
H3 = the three-day sum of (CCL - L9)
L3 = the three-day sum of (H9 - L9)
The resulting lines are plotted on a 1 to 100 scale, with overbought and oversold warning signals at 70 percent and 30 percent, respectively. The buying (bullish reversal) signals occur under 10 percent, and conversely, the selling (bearish reversal) signals come into play above 90 percent after the currency turns.Inadditiontothesesignals,theoscillator-currencypricedivergencegeneratessignificantsignals.
An example of the stochastic:
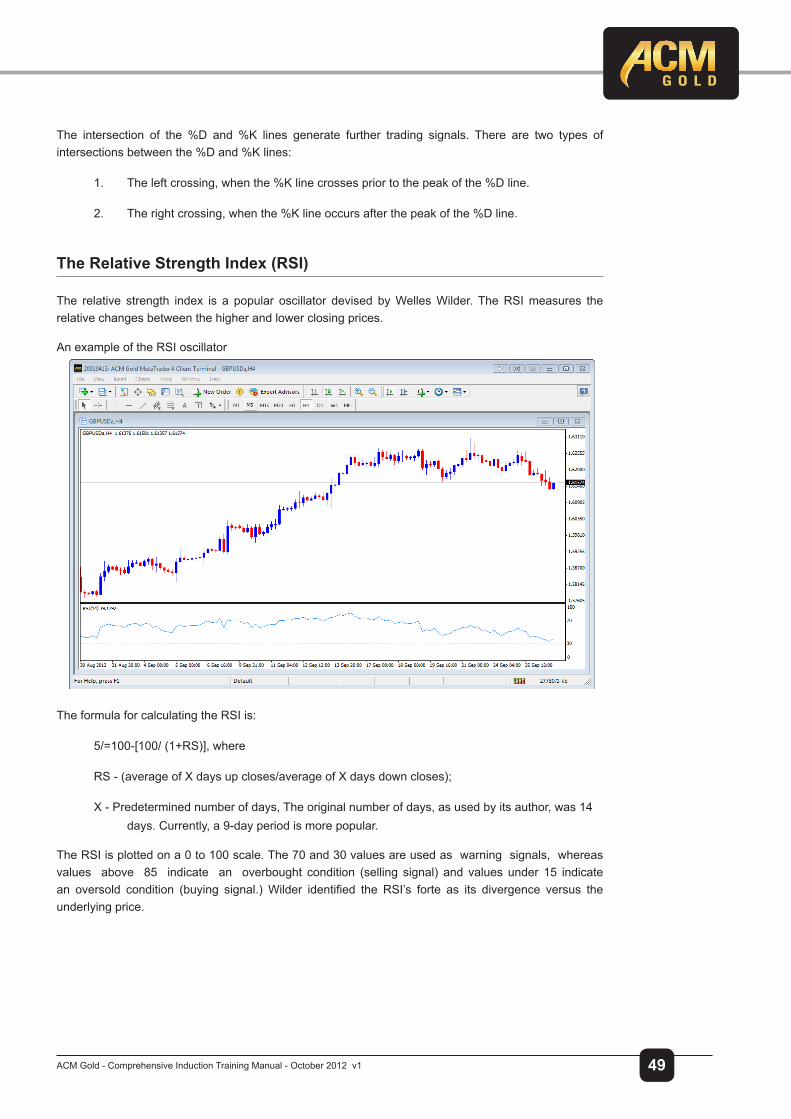
49ACM Gold - Comprehensive Induction Training Manual - October 2012 v1
The intersection of the %D and %K lines generate further trading signals. There are two types ofintersectionsbetweenthe%Dand%Klines:
1. Theleftcrossing,whenthe%Klinecrossespriortothepeakofthe%Dline.
2. Therightcrossing,whenthe%Klineoccursafterthepeakofthe%Dline.
The Relative Strength Index (RSI)
The relative strength index is a popular oscillator devised by Welles Wilder. The RSI measures the relative changes between the higher and lower closing prices.
An example of the RSI oscillator
The formula for calculating the RSI is:
5/=100-[100/ (1+RS)], where
RS - (average of X days up closes/average of X days down closes);
X - Predetermined number of days, The original number of days, as used by its author, was 14 days. Currently, a 9-day period is more popular.
The RSI is plotted on a 0 to 100 scale. The 70 and 30 values are used as warning signals, whereas values above 85 indicate an overbought condition (selling signal) and values under 15 indicate an oversold condition (buying signal.)Wilder identified the RSI’s forte as its divergence versus theunderlying price.
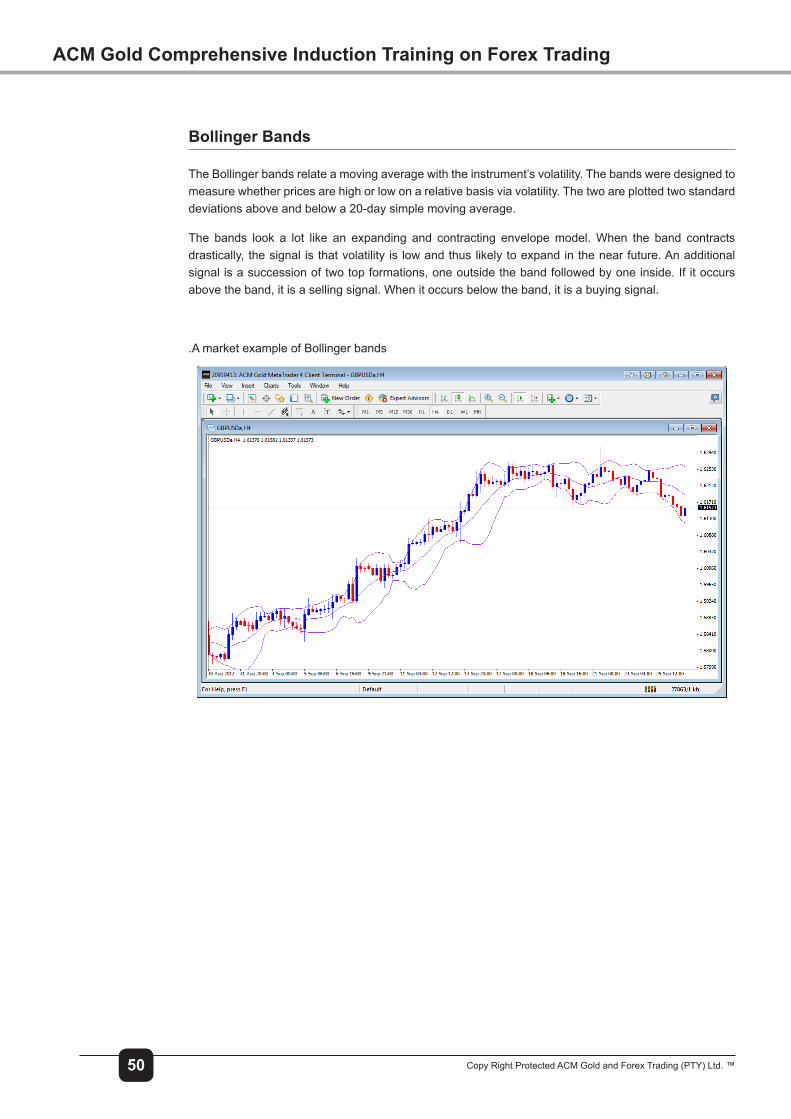
50 Copy Right Protected ACM Gold and Forex Trading (PTY) Ltd. ™
ACM Gold Comprehensive Induction Training on Forex Trading
Bollinger Bands
The Bollinger bands relate a moving average with the instrument’s volatility. The bands were designed to measure whether prices are high or low on a relative basis via volatility. The two are plotted two standard deviations above and below a 20-day simple moving average.
The bands look a lot like an expanding and contracting envelope model. When the band contracts drastically, the signal is that volatility is low and thus likely to expand in the near future. An additional signal is a succession of two top formations, one outside the band followed by one inside. If it occurs above the band, it is a selling signal. When it occurs below the band, it is a buying signal.
.A market example of Bollinger bands
51ACM Gold - Comprehensive Induction Training Manual - October 2012 v1
CHAPTER 5
Fundamental AnalysisTwo types of analysis are used for the market movements’ forecasting: fundamental, and technical (the chart study of past behavior of commodity prices). The fundamental one focuses on the theoretical models of exchange rate determination and on the major economic factors and their likelihood of affecting the foreign exchange rates.
5.1. Economic Fundamentals
Theories of Exchange Rate Determination
Fundamentalsmaybeclassified intoeconomic factors, financial factors, political factors, andcrises.Economic factors differ from the other three factors in terms of the certainty of their release. The dates and times of economic data release are known well in advance, at least among the industrialized nations.Belowaregivenbrieflyseveralknowntheoriesofexchangeratedetermination.
Purchasing Power Parity
Purchasing power parity states that the price of a good in one country should equal the price of the same good in another country, exchanged at the current rate—the law of one price. There are two versions of the purchasing power parity theory: the absolute version and the relative version. Under the absolute version, the exchange rate simply equals the ratio of the two countries’ general price levels, which is the weighted average of all goods produced in a country. However, this version works only if it is possible to compare the two countries, which produce or consume the same goods. Moreover, the absolute versionassumesthattransportationcostsandtradebarriersareinsignificant.Inreality,transportationcostsaresignificantanddissimilararoundtheworld.
Tradebarriersarestillaliveandwell,sometimesobviousandsometimeshidden,and they influencecosts and goods distribution.
Finally, this version disregards the importance of brand names. For example, cars are chosen not only based on the best price for the same type of car, but also on the basis of the name (“you are what you drive”).
The PPP Relative Version
Under the relative version, the percentage change in the exchange rate from a given base period must equal the difference between the percentage change in the domestic price level and the percentage changeintheforeignpricelevel.TherelativeversionofthePPPisalsonotfreeofproblems:itisdifficultorarbitrarytodefinethebaseperiod;traderestrictionsremainarealandthornyissue,justaswiththeabsolute version, different price index weighting and the inclusion of different products in the indexes makethecomparisondifficultandinthelongterm,countries’internalpriceratiosmaychange,causingthe exchange rate to move away from the relative PPP.
In conclusion, the spot exchange rate moves independently of relative domestic and foreign prices. In the

52 Copy Right Protected ACM Gold and Forex Trading (PTY) Ltd. ™
ACM Gold Comprehensive Induction Training on Forex Trading
shortrun,theexchangerateisinfluencedbyfinancialandnotbycommoditymarketconditions.
Theory of Elasticities
The theory of elasticities holds that the exchange rate is simply the price of foreign exchange that maintains the balance of payments in equilibrium. For instance, if the imports of country A are strong, then the trade balance is weak. Consequently, the exchange rate rises, leading to the growth of country A’s exports, and triggers in turn a rise in its domestic income, along with a decrease in its foreign income. Whereas a rise in the domestic income (in country A) will trigger an increase in the domestic consumption of both domestic and foreign goods and, therefore, more demand for foreign currencies, a decrease in the foreign income (in country B) will trigger a decrease in the domestic consumption of both country B’s domestic and foreign goods, and therefore, less demand for its own currency.
The elasticities approach is not problem-free because in the short term, the exchange rate is more inelastic than it is in the long-term and the additional exchange rate variables arise continuously, changing the rules of the game.
Modern Monetary Theories on Short-Term Exchange Rate Volatility
The modern monetary theories on short-term exchange rate volatility take into consideration the short-term capital markets’ roll and the long-term impact of the commodity markets on foreign exchange. These theories hold that the divergence between the exchange rate and the purchasing power parities dueto thesupplyanddemandforfinancialassets andtheinternationalcapability.
One of the modern monetary theories states that exchange rate volatility is triggered by a one-time domestic money supply increase, because this is assumed to raise expectations of higher future monetary growth.
The purchasing power parity theory is extended to include the capital markets. If, in both countries whose currencies are exchanged, the demand for money is determined by the level of domestic income and domestic interest rates, then a higher-income increases demand for transaction’s balances while a higher interest rate increases the opportunity cost of holding money, reducing the demand for money.
Under a second approach, the exchange rate adjusts instantaneously to maintain continuous interest rate parity, but only in the long run to maintain PPP.
Volatilityoccursbecause thecommoditymarketsadjustmoreslowly than thefinancialmarkets.Thisversion is known as the dynamic monetary approach.
The Portfolio-Balance Approach
Theportfolio-balanceapproachholds that currencydemand is triggeredby thedemand for financialassets, rather than the demand for the currency per se.
Synthesis of Traditional and Modern Monetary Views
In order to better suit the previous theories to the realities of the market, some of the more stringent conditions were adjusted into a synthesis of the traditional and modern monetary theories.
Ashort-termcapitaloutflowinducedbyamonetaryshockcreatesapaymentsimbalancethatrequires

53ACM Gold - Comprehensive Induction Training Manual - October 2012 v1
an exchange rate change to maintain balance of payments equilibrium. Speculative forces, commodity market’s disturbances, and the existence of short-term capital mobility trigger the exchange rate volatility. The degree of change in the exchange rate is a function of consumers’ elasticity of demand.
Becausethefinancialmarketsadjustfasterthanthecommodity’smarkets,theexchangeratetendstobe affected in the short term by capital market changes, and in the long term, by commodity’s changes.
5.2. Economic Indicators
Economic indicators occur in a steady stream, at certain times, and a little more often than changes in interest rates, governments, or natural activity such as earthquakes etc. Economic data is generally (except of the Gross Domestic Product and the Employment Cost Index, which are released quarterly) released on a monthly basis.
Alleconomic indicatorsare released inpairs.Thefirstnumber reflects the latestperiod.Thesecondnumberistherevisedfigureforthemonthpriortothelatestperiod.Forinstance,inJuly,economicdatais released for the month of June, the latest period. In addition, the release includes the revision of the sameeconomicindicatorfigureforthemonthofMay.Thereasonfortherevisionisthatthedepartmentin charge of the economic statistics compilation is in a better position to gather more information in a month’stime.Thisfeatureisimportantfortraders.Ifthefigureforaneconomicindicatorisbetterthanexpected by 0.4 percent for the past month, but the previous month’s number is revised lower by 0.4 percent,thentradersarelikelytoignoretheoverallreleaseofthatspecificeconomicdata.
Economic indicators are released at different times. In the United States, economic data is generally releasedat8:30and10amET. It is important toremember that themostsignificantdatafor foreignexchange is released at 8:30 am ET. In order to allow time for last-minute adjustments, the United States currency futures markets open at 8:20 am ET.
Information on upcoming economic indicators is published in all leading newspapers, such as the Wall Street Journal, the Financial Times, and the New York Times; and business magazines, such as Business Week. More often than not, traders use the monitor sources—Bridge Information Systems, Reuters, or Bloomberg—to gather information both from news publications and from the sources’ own up-to-date information.
The Gross National Product (GNP)
The Gross National Product measures the economic performance of the whole economy.
This indicator consists, at macro scale, of the sum of consumption spending, investment spending, government spending, and net trade. The Gross national product refers to the sum of all goods and services produced by United States residents, either in the United States or abroad.
The Gross Domestic Product (GDP)
The Gross Domestic Product (GDP) refers to the sum of all goods and services produced in the United States, either by domestic or foreign companies. The differences between the two are nominal in thecaseoftheeconomyoftheUnitedStates.GDPfiguresaremorepopularoutsidetheUnitedStates.In order to make it easier to compare the performances of different economies, the United States also releasesGDPfigures.

54 Copy Right Protected ACM Gold and Forex Trading (PTY) Ltd. ™
ACM Gold Comprehensive Induction Training on Forex Trading
Consumption Spending
Consumption is made possible by personal income and discretionary income. The decision by consumers tospendortosaveispsychologicalinnature.Consumerconfidenceisalsomeasuredasanimportantindicator of the propensity of consumers who have discretionary income to switch from saving to buying.
Investment Spending
Investment—orgrossprivatedomesticspending-consistsoffixedinvestmentandinventories.
Government Spending
Governmentspendingisveryinfluentialintermsofbothsheersizeanditsimpactonothereconomicindicators, due to special expenditures. For instance, United States military expenditures had a significantroleintotalU.S.employmentuntil1990.Thedefensecutsthatoccurredatthetimeincreasedunemploymentfiguresintheshortrun.
Net Trade
Net trade is another major component of the GNP. Worldwide internationalization and the economic and political developments since 1980 have had a sharp impact on the United States’ ability to compete overseas.
TheU.S.tradedeficitofthepastdecadeshassloweddowntheoverallGNP.GNPcanbeapproachedintwoways:flowofproductandflowofcost.
Industrial Production
Industrial production consists of the total output of a nation’s plants, utilities, and mines. From a fundamentalpointofview,itisanimportanteconomicindicatorthatreflectsthestrengthoftheeconomy,andbyextrapolation,thestrengthofaspecificcurrency.Therefore,foreignexchangetradersusethiseconomic indicator as a potential trading signal.
Capacity Utilization
Capacity utilization consists of total industrial output divided by total production capability. The term refers to the maximum level of output a plant can generate under normal business conditions. In general, capacity utilization is not a major economic indicator for the foreign exchange market.
However, there are instances when its economic implications are useful for fundamental analysis. A “normal”figureforasteadyeconomyis81.5percent.Ifthefigurereads85percentormore,thedatasuggests that the industrial production is overheating, that the economy is close to full capacity. High capacityutilizationratesprecedeinflation,andexpectationintheforeignexchangemarket isthatthecentralbankwillraiseinterestratesinordertoavoidorfightinflation.
55ACM Gold - Comprehensive Induction Training Manual - October 2012 v1
Factory Orders
Factory orders refer to the total of durable and nondurable goods orders. Nondurable goods consists of food, clothing, light industrial products, and products designed for the maintenance of durable goods. Durablegoodsordersarediscussedseparately.Thefactoryordersindicatorhaslimitedsignificanceforforeign exchange traders.
Durable Goods Orders
Durable goods orders consist of products with a life span of more than three years. Examples of durable goods are autos, appliances, furniture, jewelry, and toys. They are divided into four major categories: primary metals, machinery, electrical machinery, and transportation.
In order to eliminate the volatility pertinent to large military orders, the indicator includes a breakdown of the orders between defense and non- defense.
This data is fairly important to foreign exchange markets because it gives a good indication of consumer confidence.Becausedurablegoodscostmorethannondurables,ahighnumberinthisindicatorshowsconsumers’propensitytospend.Therefore,agoodfigureisgenerallybullishforthedomesticcurrency.
Business Inventories
Business inventories consist of items produced and held for future sale. The compilation of this information isfacileandholdslittlesurpriseforthemarket.Moreover,financialmanagementandcomputerizationhelp control business inventories in unprecedented ways. Therefore, the importance of this indicator for foreign exchange traders is limited.
Construction Indicators
Constructionindicatorsconstitutesignificanteconomicindicatorsthatareincludedinthecalculationofthe GDP of the United States. Moreover, housing has traditionally been the engine that pulled the U.S. economyoutofrecessionsafterWorldWarII.Theseindicatorsareclassifiedintothreemajorcategories:
1. Housing starts and permits;
2. New and existing one-family home sales and
3. Construction spending.
Private housing is monitored closely at all the major stages.
Privatehousingisclassifiedbasedonthenumberofunits(one,two,three,four,five,ormore);region(Northeast, West, Midwest, and South); and inside or outside metropolitan statistical areas.

56 Copy Right Protected ACM Gold and Forex Trading (PTY) Ltd. ™
ACM Gold Comprehensive Induction Training on Forex Trading
Diagram of construction of private housing
Construction indicators are cyclical and very sensitive to the level of interest rates (and consequently, mortgage rates) and the level of disposable income. Low interest rates alone may not be able to generate a high demand for housing, though. As the situation in the early 1990s demonstrated, despite historically low mortgage rates in the United States, housing increased only marginally, as a result of the lack of job security in a weak economy.
Housingstartsbetweenoneandahalfandtwomillionunitsreflectastrongeconomy,whereasafigureof approximately one million units suggests that the economy is in recession.
Inflation Indicators
Therateofinflationisthewidespreadriseinprices.Therefore,gauginginflationisavitalmacroeconomictask.Traderswatchthedevelopmentofinflationclosely,becausethemethodofchoiceforfightinginflationis raising the interest rates, and higher interest rates tend to support the local currency. Moreover, the inflationrateisusedto‘deflate’nominalinterestratesandtheGNPorGDPtotheirrealvaluesinorderto achieve a more accurate measure of the data.
The values of the real interest rates or real GNP and GDP are of the utmost importance to the money managers and traders of international financial instruments, allowing them to accurately compareopportunities worldwide.
Tomeasureinflation,tradersusefollowingeconomictools:
● Producer Price Index (PPI);
● Consumer Price Index (CPI);
● GNPDeflator;
● GDPDeflator;
● Employment Cost Index (ECI);
● Commodity Research Bureau’s Index (CRB Index);
● Journal of Commerce Industrial Price Index (JoC).
Thefirst fourarestrictlyeconomic indicators; theyare releasedatspecific intervals.Thecommodity

57ACM Gold - Comprehensive Induction Training Manual - October 2012 v1
indexesprovideinformationoninflationquicklyandcontinuously.
Othereconomicdatathatmeasureinflationareunemployment,consumerprices,andcapacityutilization.
Producer Price Index (PPI)
Producer price index is compiled from most sectors of the economy, such as manufacturing, mining, and agriculture. The sample used to calculate the index contains about 3400 commodities. The weights used for the calculation of the index for some of the most important groups are: food – 24 percent; fuel - 7 percent; autos - 7 percent; and clothing - 6 percent. Unlike the CPI, the PPI does not include imported goods, services, or taxes.
Consumer Price Index (CPI)
Consumerpriceindexreflectstheaveragechangeinretailpricesforafixedmarketbasketofgoodsandservices. The CPI data is compiled from a sample of prices for food, shelter, clothing, fuel, transportation, and medical services that people purchase on a daily basis. The weights attached for the calculation of the index to the most important groups are: housing – 38 percent; food - 19 percent; fuel - 8 percent; and autos - 7 percent.
Thetwoindexes,PPIandCPI,areinstrumentalinhelpingtrader’smeasureinflationaryactivity;althoughtheFederalReservetakesthepositionthattheindexesoverstatethestrengthofinflation.
Gross National Product Implicit Deflator
Grossnationalproduct implicitdeflator is calculatedbydividing thecurrentdollarGNPfigureby theconstantdollarGNPfigure.
Gross Domestic Product Implicit
Grossdomesticproduct implicitdeflator iscalculatedbydividingthecurrentdollarGDPfigurebytheconstantdollarGDPfigure.
BoththeGNPandGDPimplicitdeflatorsarereleasedquarterly,alongwiththerespectiveGNPandGDPfigures.Theimplicitdeflatorsaregenerallyregardedasthemostsignificantmeasureofinflation.
Commodity Research Bureau’s Futures Index (CRB index)
TheCommodityResearchBureau’sFuturesIndexmakeswatchingfor inflationary trendseasier.TheCRB Index consists of the equally weighted futures prices of 21 commodities. The components of the CRB Index are:
● precious metals: gold, silver, platinum;
● industrials: crude oil, heating oil, unleaded gas, lumber, copper, and cotton;
58 Copy Right Protected ACM Gold and Forex Trading (PTY) Ltd. ™
ACM Gold Comprehensive Induction Training on Forex Trading
● grains: corn, wheat, soybeans, soy meal, soy oil;
● livestock and meat: cattle, hogs, and pork bellies;
● imports: coffee, cocoa, sugar;
● Miscellaneous: orange juice.
ThepreponderanceoffoodcommoditiesmakestheCRBIndexlessreliableintermsofgeneralinflation.Nevertheless, the index is a popular tool that has proven quite reliable since the late 1980s.
The “Journal of commerce” Industrial Price Index (JoC)
The “Journal of commerce” industrial price index consists of the prices of 18 industrial materials and supplies processed in the initial stages of manufacturing, building, and energy production. It is more sensitivethanother indexes,as itwasdesignedtosignalchanges in inflationprior totheotherpriceindexes.
Merchandise Trade Balance
It is one of the most important economic indicators. Its value may trigger long-lasting changes in monetary and foreign policies. The trade balance consists of the net difference between the exports and imports of a certain economy. The data includes six categories:
1. Food;
2. Raw materials and industrial supplies;
3. Consumer goods;
4. Autos;
5. Capital goods;
6. Other merchandise.
Employment Indicators
Theemploymentrateisaneconomicindicatorwithsignificanceinmultipleareas.Therateofemployment,naturally, measures the soundness of an economy. The unemployment rate is a lagging economic indicator. It is an important feature to remember, especially in times of economic recession. Whereas people focus on the health and recovery of the job sector, employment is the last economic indicator to rebound.
When economic contraction causes jobs to be cut, it takes time to generate psychological confidenceineconomicrecoveryatthemanageriallevelbeforenewpositionsareadded.Atindividuallevels, the improvement of the job outlook may be clouded when new positions are added in small companiesandthusnotfullyreflectedinthedata.Theemploymentreportsaresignificanttothefinancialmarkets in general and to foreign exchange, in particular. In foreign exchange, the data is truly affective in periods of economic transition — recovery and contraction. The reason for the indicators’ importance in extreme economic situations lies in the picture they paint of the health of the economy andinthedegreeofmaturityofabusinesscycle.Adecreasingunemploymentfiguresignalsamaturingcycle, whereas the opposite is true for an increasing unemployment indicator.

59ACM Gold - Comprehensive Induction Training Manual - October 2012 v1
Employment Cost Index (ECI)
Employmentcostindexmeasureswagesandinflationandprovidesthemostcomprehensiveanalysisofworker compensation, includingwages, salaries,and fringebenefits.TheECI isoneof theFed’sfavourite quarterly economic statistics.
Consumer Spending Indicators
Retailsale isasignificantconsumerspending indicator for foreignexchangetraders,as itshowsthestrengthofconsumerdemandaswellastheconsumerconfidencecomponentinthecalculationofothereconomic indicators, such as GNP and GDP.
Generally, themostcommonlyusedemploymentfigure isnot themonthlyunemploymentrate,whichisreleasedasapercentage,butthenonfarmpayrollrate.Theratefigureiscalculatedastheratioofthe difference between the total labour force and the employed labour force, divided by the total labour force. The data is more complex, though, and it generates more information. In foreign exchange, the standard indicators monitored by traders are the unemployment rate, manufacturing payrolls, nonfarm payrolls,averageearnings,andaverageworkweek.Generally,themostsignificantemploymentdataaremanufacturing and nonfarm payrolls, followed by the unemployment rate.
Auto Sales
Despite the importance of the auto industry in terms of production and sales, the level of auto sales is not an economic indicator widely followed by foreign exchange traders. The American automakers experienced a long, steady market share loss, only to start rebounding in the early 1990s. However, car manufacturing has become increasingly internationalized, with American cars being assembled outside the United States and Japanese and German cars assembled within the United States. Because of their confusingnature,autosalesfigurescannoteasilybeusedinforeignexchangeanalysis.
60 Copy Right Protected ACM Gold and Forex Trading (PTY) Ltd. ™
ACM Gold Comprehensive Induction Training on Forex Trading
Leading Indicators
The leading indicators consist of the following economic indicators:
● Average workweek of production workers in manufacturing;
● Average weekly claims for state unemployment;
● Newordersforconsumergoodsandmaterials(adjustedforinflation);
● Vendor performance (companies receiving slower deliveries from suppliers);
● Contractsandordersforplantandequipment(adjustedforinflation);
● New building permits issued;
● Changeinmanufacturers’unfilledorders,durablegoods;
● Change in sensitive material’s prices.
Personal Income
Thisistheincomereceivedbyindividuals,non-profitinstitutions,andprivatetrustfunds.Componentsof this indicator include wages and salaries, rental income, dividends, interest earnings, and transfer payments (social security, state unemployment insurance, and veterans’ benefits). The wages andsalariesreflecttheunderlyingeconomicconditions.
This indicator is vital for the sales sector. Without an adequate personal income and a propensity to purchase, consumer purchases of durable and nondurable goods are limited.
FortheForextraders,personalincomeisnotsignificant.
5.3. Financial and Socio-political Factors
The Role of Financial Factors
Financialfactorsarevitaltofundamentalanalysis.Changesinagovernment’smonetaryorfiscalpoliciesare bound to generate changes in the economy, and thesewill be reflected in the exchange rates.Financial factors should be triggered only by economic factors. When governments focus on different aspectsoftheeconomyorhaveadditionalinternationalresponsibilities,financialfactorsmayhavepriorityover economic factors. This was painfully true in the case of the European Monetary System in the early1990s.Therealitiesofthemarketplacerevealedtheunderlyingartificialityofthisapproach.Usingthe interest rates independently from the real economic environment translated into a very expensive strategy.
Becauseforeignexchange,bydefinition,consistsofsimultaneoustransactionsintwocurrencies,thenit follows that the market must focus on two respective interest rates as well. This is the interest rate differential, a basic factor in the markets. Traders react when the interest rate differential changes, not simply when the interest rates themselves change. For example, if all the G-5 countries decided to simultaneously lower their interest rates by 0.5 percent, the move would be neutral for foreign exchange, because the interest rate differentials would also be neutral.
Of course, most of the time the discount rates are cut unilaterally, a move that generates changes in

61ACM Gold - Comprehensive Induction Training Manual - October 2012 v1
both the interest differential and the exchange rate. Traders approach the interest rates like any other factor, trading on expectations and facts. For example, if rumour says that a discount rate will be cut, the respective currency will be sold before the fact. Once the cut occurs, it is quite possible that the currency will be bought back, or the other way around. An unexpected change in interest rates is likely to trigger a sharp currency move. “Buy on the rumour, sell on the fact...”
Other factors affecting the trading decision are the time lag between the rumour and the fact, the reasons behind the interest rate change, and the perceived importance of the change. The market generally prices in a discount rate change that was delayed. Since it is a fait accompli, it is neutral to the market. If the discount rate was changed for political rather than economic reasons, what is a common practice in the European Monetary System, the markets are likely to go against the central banks, sticking to the real fundamentals rather than the political ones. This happened in both September 1992 and the summer of 1993, when the European central banks lost unprecedented amounts of money trying to prop up their currencies,despitehavinghighinterestrates.Themarketperceivedthoseinterestratesasartificiallyhigh and, therefore, aggressively sold the respective currencies. Finally, traders deal on the perceived importance of a change in the interest rate differential.
Political events and Crises
Political events generally take place over a period of time, but political crises strike suddenly. They are almostalways,bydefinition,unexpected.Currencytradershaveaknackforrespondingtocrises.Speedisessential;shootingfromthehipistheonlyfightingoption.Thetraders’reflexestakeover.Withoutfastaction, traders can be left out in the cold. There is no time for analysis, and only a split second, at best, to act. As volume drops dramatically, trading is hindered by a crisis. Prices dry out quickly, and sometimes the spreads between bid and offer jump from 5 pips to 100 pips. Getting back to the market isdifficult.
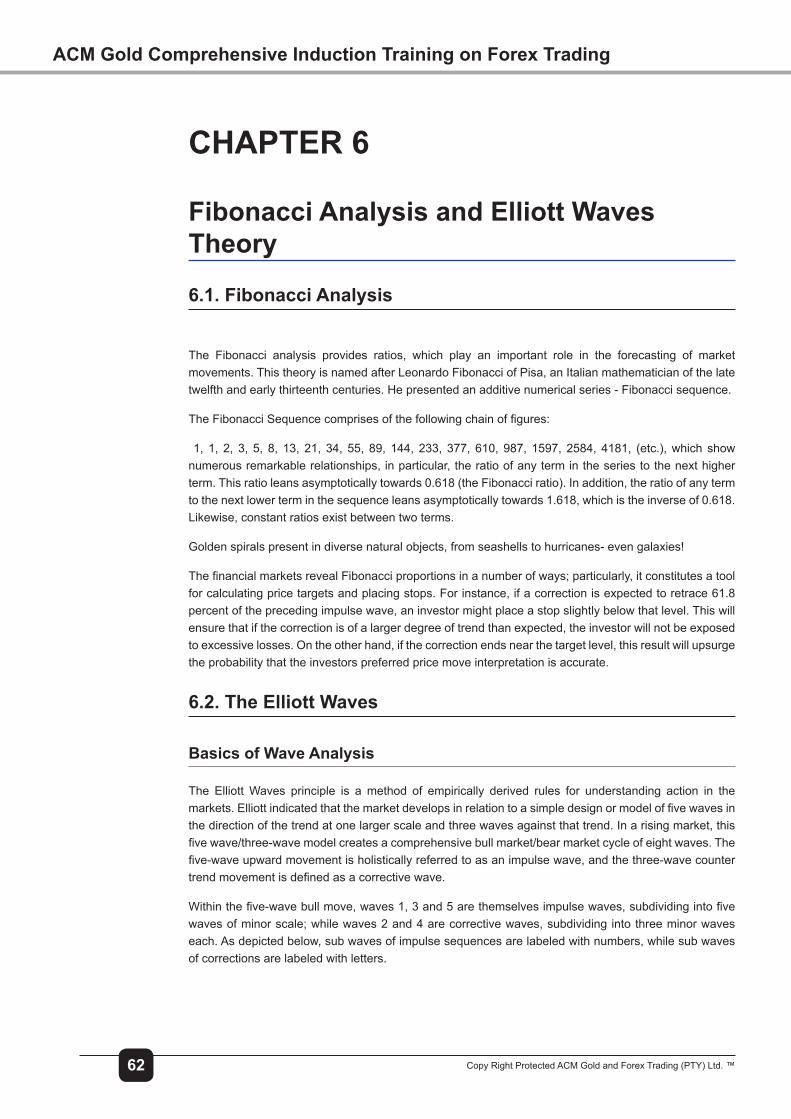
62 Copy Right Protected ACM Gold and Forex Trading (PTY) Ltd. ™
ACM Gold Comprehensive Induction Training on Forex Trading
CHAPTER 6
Fibonacci Analysis and Elliott Waves Theory
6.1. Fibonacci Analysis
The Fibonacci analysis provides ratios, which play an important role in the forecasting of market movements. This theory is named after Leonardo Fibonacci of Pisa, an Italian mathematician of the late twelfth and early thirteenth centuries. He presented an additive numerical series - Fibonacci sequence.
TheFibonacciSequencecomprisesofthefollowingchainoffigures:
1, 1, 2, 3, 5, 8, 13, 21, 34, 55, 89, 144, 233, 377, 610, 987, 1597, 2584, 4181, (etc.), which show numerous remarkable relationships, in particular, the ratio of any term in the series to the next higher term. This ratio leans asymptotically towards 0.618 (the Fibonacci ratio). In addition, the ratio of any term to the next lower term in the sequence leans asymptotically towards 1.618, which is the inverse of 0.618. Likewise, constant ratios exist between two terms.
Golden spirals present in diverse natural objects, from seashells to hurricanes- even galaxies!
ThefinancialmarketsrevealFibonacciproportionsinanumberofways;particularly,itconstitutesatoolfor calculating price targets and placing stops. For instance, if a correction is expected to retrace 61.8 percent of the preceding impulse wave, an investor might place a stop slightly below that level. This will ensure that if the correction is of a larger degree of trend than expected, the investor will not be exposed to excessive losses. On the other hand, if the correction ends near the target level, this result will upsurge the probability that the investors preferred price move interpretation is accurate.
6.2. The Elliott Waves
Basics of Wave Analysis
The Elliott Waves principle is a method of empirically derived rules for understanding action in the markets.Elliottindicatedthatthemarketdevelopsinrelationtoasimpledesignormodeloffivewavesinthe direction of the trend at one larger scale and three waves against that trend. In a rising market, this fivewave/three-wavemodelcreatesacomprehensivebullmarket/bearmarketcycleofeightwaves.Thefive-waveupwardmovementisholisticallyreferredtoasanimpulsewave,andthethree-wavecountertrendmovementisdefinedasacorrectivewave.
Withinthefive-wavebullmove,waves1,3and5arethemselvesimpulsewaves,subdividingintofivewaves of minor scale; while waves 2 and 4 are corrective waves, subdividing into three minor waves each. As depicted below, sub waves of impulse sequences are labeled with numbers, while sub waves of corrections are labeled with letters.
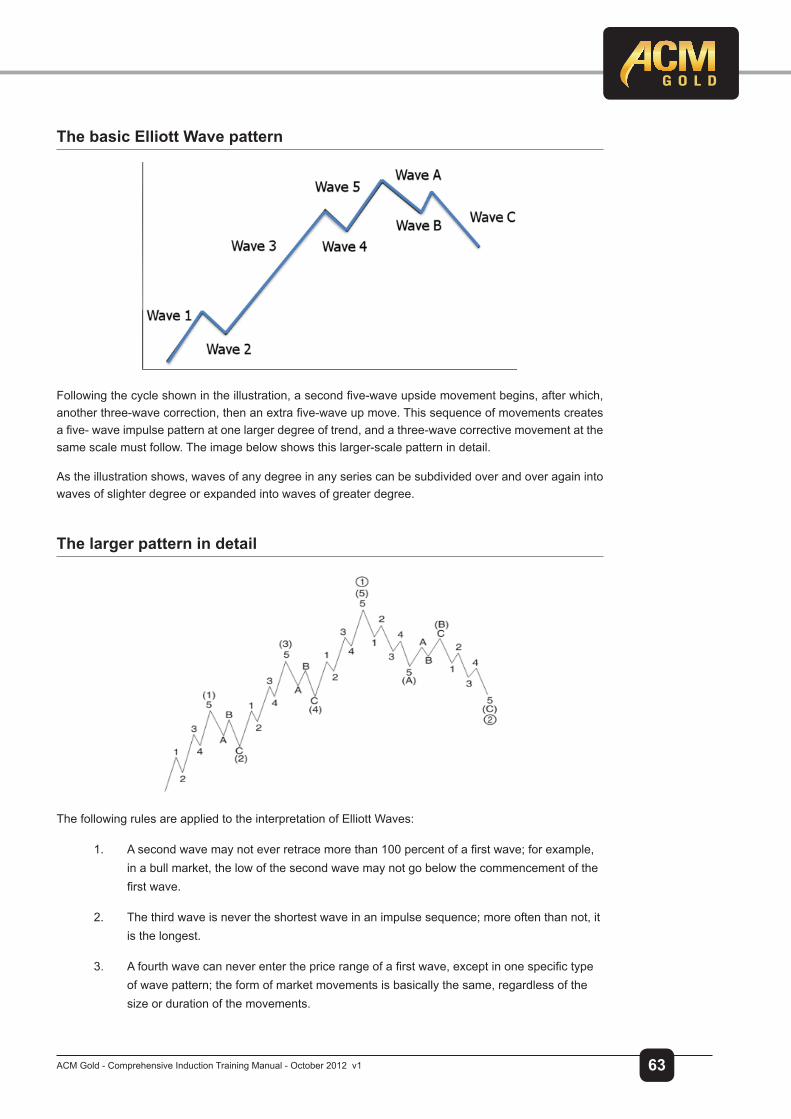
63ACM Gold - Comprehensive Induction Training Manual - October 2012 v1
The basic Elliott Wave pattern
Followingthecycleshownintheillustration,asecondfive-waveupsidemovementbegins,afterwhich,anotherthree-wavecorrection,thenanextrafive-waveupmove.Thissequenceofmovementscreatesafive-waveimpulsepatternatonelargerdegreeoftrend,andathree-wavecorrectivemovementatthesame scale must follow. The image below shows this larger-scale pattern in detail.
As the illustration shows, waves of any degree in any series can be subdivided over and over again into waves of slighter degree or expanded into waves of greater degree.
The larger pattern in detail
The following rules are applied to the interpretation of Elliott Waves:
1. Asecondwavemaynoteverretracemorethan100percentofafirstwave;forexample,in a bull market, the low of the second wave may not go below the commencement of the firstwave.
2. The third wave is never the shortest wave in an impulse sequence; more often than not, it is the longest.
3. Afourthwavecanneverenterthepricerangeofafirstwave,exceptinonespecifictypeof wave pattern; the form of market movements is basically the same, regardless of the size or duration of the movements.

64 Copy Right Protected ACM Gold and Forex Trading (PTY) Ltd. ™
ACM Gold Comprehensive Induction Training on Forex Trading
Moreover, smaller-scale movements link up to create larger-scale movements possessing the same basic form. On the other hand, large-scale movements consist of smaller-scale subdivisions with which theyshareageometricresemblance.Becausethesemovementslinkupingrowthsoffivewavesandthree waves, they produce sequences of numbers that the analyst can use (along with the rules of wave formation) to help recognize the present state of pattern development.
A complete market cycle
Wave extensions

65ACM Gold - Comprehensive Induction Training Manual - October 2012 v1
Wave extensions
Extensions can provide a useful guide to the lengths of future waves. Most impulse sequences contain extensionsinonlyoneoftheirthreeimpulsivesubwaves.Thus,ifthefirstandthirdwavesareofaboutthesameenormity,thefifthwavewillmostlikelybeextended,particularlyifvolumeduringthefifthwave is greater than during the third.
The Diagonal Triangles
There are some recognizable designs from the Technical Analysis theory, specifically two types oftriangles, which should be noticed in the frame of Elliott’s wave consideration.
Thediagonaltriangletype1occursonlyinfifthwavesandinСwaves,anditsignalsthatthepriormovehas, in accordance to Elliott, “gone too far, too fast.” All of the patterns’ sub-waves, including waves 1, 3, and 5, consist of three-wave movements, and their fourth waves often enter the price range of their firstwaves,asshowninthenexttwoimages.Arisingdiagonaltriangletype1isbearish,becauseitisgenerally followed by a sharp drop, at least to the level where the formation began. In contrast, a falling diagonal type 1 is bullish, because an upward thrust typically follows.
A bullish patter
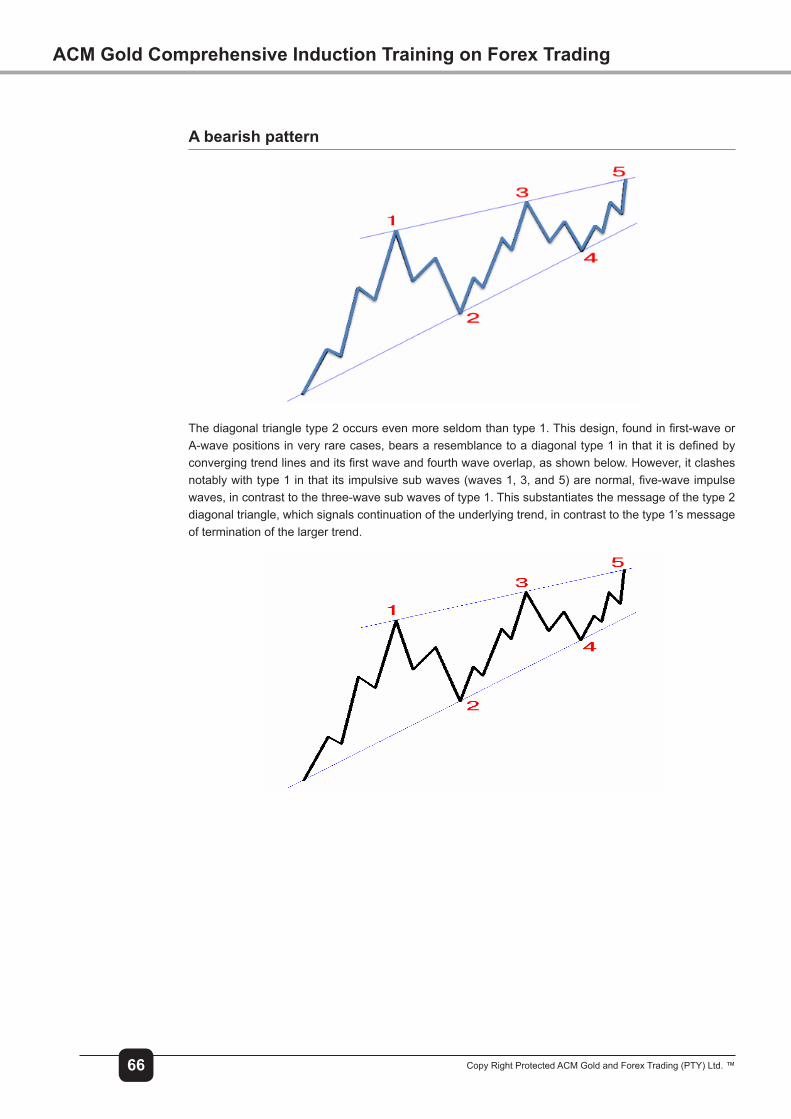
66 Copy Right Protected ACM Gold and Forex Trading (PTY) Ltd. ™
ACM Gold Comprehensive Induction Training on Forex Trading
A bearish pattern
Thediagonaltriangletype2occursevenmoreseldomthantype1.Thisdesign,foundinfirst-waveorA-wavepositionsinveryrarecases,bearsaresemblancetoadiagonaltype1inthatitisdefinedbyconvergingtrendlinesanditsfirstwaveandfourthwaveoverlap,asshownbelow.However,itclashesnotablywithtype1inthatitsimpulsivesubwaves(waves1,3,and5)arenormal,five-waveimpulsewaves, in contrast to the three-wave sub waves of type 1. This substantiates the message of the type 2 diagonal triangle, which signals continuation of the underlying trend, in contrast to the type 1’s message of termination of the larger trend.
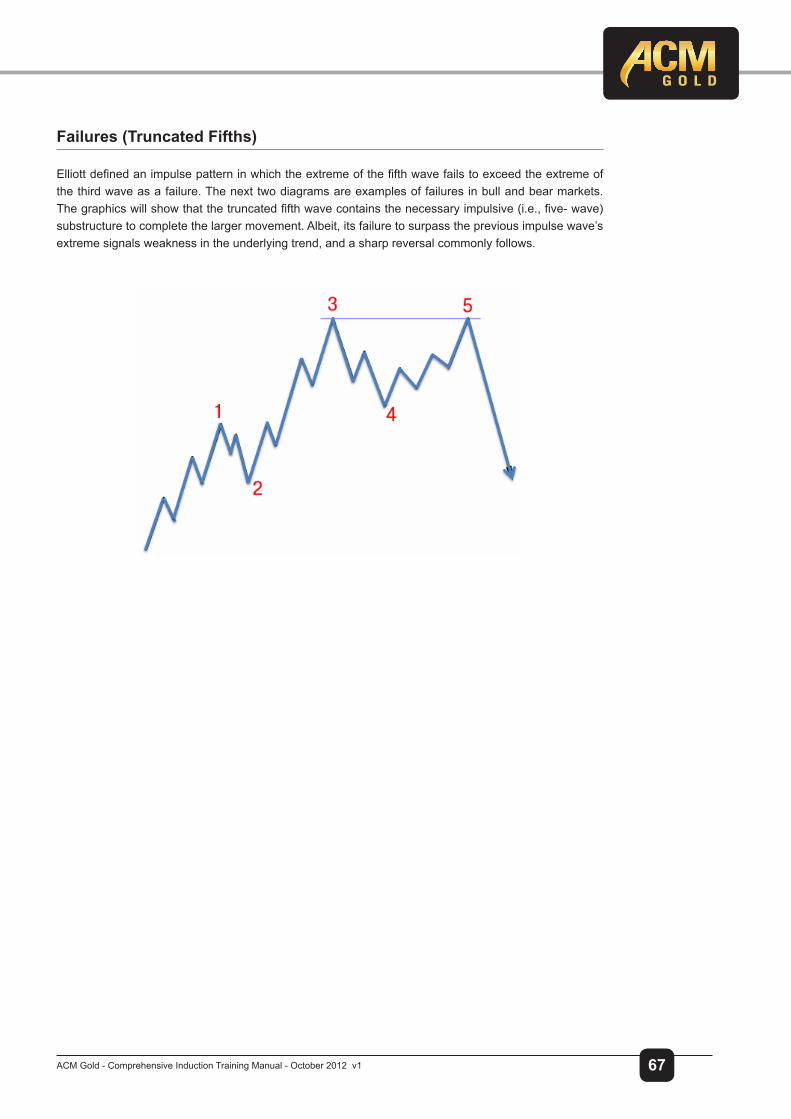
67ACM Gold - Comprehensive Induction Training Manual - October 2012 v1
Failures (Truncated Fifths)
Elliottdefinedanimpulsepatterninwhichtheextremeofthefifthwavefailstoexceedtheextremeofthe third wave as a failure. The next two diagrams are examples of failures in bull and bear markets. Thegraphicswillshowthatthetruncatedfifthwavecontainsthenecessaryimpulsive(i.e.,five-wave)substructure to complete the larger movement. Albeit, its failure to surpass the previous impulse wave’s extreme signals weakness in the underlying trend, and a sharp reversal commonly follows.
68 Copy Right Protected ACM Gold and Forex Trading (PTY) Ltd. ™
ACM Gold Comprehensive Induction Training on Forex Trading
Chapter 7
Foreign Exchange RisksOn the foreign exchange market, one is made aware of the following kinds of risks:
● Exchange rate risk;
● Interest-rate risk;
● Credit risk;
● Country risk.
7.1. Exchange Rate RiskExchange rate risk is a result of the continuous swing in the global market supply and demand balance on an outstanding foreign exchange position. A position will be dependent on all the price changes as longasitisoutstanding.Tocutlossesshortandrideprofitablepositions,lossesshouldbekeptwithinmanageable limits; and the most popular steps are the position limit and the loss limit. The limits are a function of the policy of the banks along with the expertise of the traders and their specialized areas. The typology of daily limits is two-fold; there are daylight limits and overnight limits.
1. The daylight position limit determines the maximum amount of a certain currency which a traderisallowedtocartatanygiventimeduringtheday.Thelimitshouldreflectboththetrader’s level of trading dexterities and the summation at which a trader peaks.
2. The overnight position limit should be smaller than daylight limits and concerns any outstanding position kept overnight by traders. In reality, most foreign exchange traders do not hold overnight positions.
The loss limit is a measure to avoid unmaintainable losses accrued by traders; which is implemented by theseniorofficersinthedealingcenter.Thelosslimitsarechosenonadailyandmonthlybasisbyuppermanagement.
The position and loss limits can now be executed more conveniently with the assistance of high-tech electronic systems, which allow the treasurer and the chief trader to have unremitting, rapid, and wide-rangingaccesstocorrectfiguresforallthepositionsandtheprofitandloss.Thisinformationmayalsobe conveyed from all the branches abroad into the headquarters stations.
7.2. INTEREST-RATE RISKInterest-rate risk is essential to currency swaps, forward out rights, futures, and options. It makes reference totheprofitandlossproducedbyboththevacillationsintheforwardspreadsandbyforwardamountdisparities and maturity gaps among transactions in the foreign exchange book. An amount mismatch is the spot amount different from the forward amounts. For an active forward desk, the complete eradication of maturity gaps is practically unfeasible. However, this may not be a grave problem if the sums of money involved in these mismatches are small. Every day, traders balance the net payments and receipts for each currency through a special type of swap, that is called tomorrow/next or rollover.
To reduce interest-rate risk, management sets restrictions on the total size of mismatches. The policies vary among banks, but the popular approach is to separate the mismatches, based on their maturity

69ACM Gold - Comprehensive Induction Training Manual - October 2012 v1
dates, into up to six months and past six months. All the transactions are entered in electronic systems inordertocalculatethepositionsforallthedeliverydatesandtheprofitandloss.Unceasinganalysisofthe interest rate environment is necessary to forecast any changes that may impact on the outstanding gaps.
7.3. Credit RiskCredit risk is connected with the possibility that an outstanding currency position may not be repaid as agreed, due to a voluntary or involuntary action by a counter party. In these cases, trading occurs on regulated exchanges, where all trades are settled by the learing house. On such exchanges, traders of all sizes can deal without any credit concern.
The following forms of credit risk are known:
1. Replacementriskwhichoccurswhencounterpartiesofthefailedbankfindtheirbooksunbalanced to the extent of their exposure to the insolvent party. To rebalance their books, these banks enter new transactions.
2. Settlement risk which occurs because of different time zones on different continents. Such a way, currencies may be credited at different times during the day. Australian and NewZealanddollarsarecreditedfirst,thenJapaneseyen,followedbytheEuropeancurrencies and ending with the U.S. dollar. Therefore, payment may be made to a party that will declare insolvency (or be declared insolvent) immediately after, but prior to executing its own payments.
The credit risk for instruments traded off regulated exchanges is to be minimized through the customers’ creditworthiness. Commercial and investment banks, trading companies, and banks’ customers must have credit lines with each other to be able to trade. Even after the credit lines are extended, the counter parties’ financial soundness should be continuouslymonitored.Alongwith themarket value of theircurrency portfolios, end users, in assessing the credit risk, must consider also the potential portfolio’s exposure. The latter may be determined through probability analysis over the time to maturity of the outstanding position. For the same purposes netting is used. Netting is a process that enables institutions to settle only their net positions with one another not trade by trade but at the end of the day, in a single transaction.Ifsignsofpaymentdifficultyofabankareshown,agroupoflargebanksmayprovideshort-term backing from a common reserve pool.
7.4. Country RiskThe failure to receive an expected payment due to government interference results in the bankruptcy of an individual bank or institution, a situation described under credit risk. Country risk refers to the government’s interference in the foreign exchange markets and falls under the joint responsibility of the treasurer and the credit department. Outside the major economies, controls on foreign exchange activities are still present and actively implemented.
In the case of traders, it is imperative to know or be able to foresee any constricting changes concerning the freeflowofcurrencies.Ifthisispossible,thoughtradingintheaffectedcurrencywilldryupconsiderably,it is still a manageable situation.

70 Copy Right Protected ACM Gold and Forex Trading (PTY) Ltd. ™
ACM Gold Comprehensive Induction Training on Forex Trading
Notes

71ACM Gold - Comprehensive Induction Training Manual - October 2012 v1

T +27 (11) 784 0603 N 086 11 TRADE (87233) F +27 (11) 784 2516 E [email protected] W www.acmgold.com
L Physical Address 12th Floor, Sandton City Office Tower Sandton Gauteng South Africa
P Postal Address PO Box 123456 Sandton Gauteng South Africa
ACM Gold and Forex Trading (Pty) Ltd is an authorised FSP -26164 Reg. No. 123456789