Embed Size (px)
Citation preview
C O M P R E H E N S I V E H O U S I N G M A R K E T A N A L Y S I S
As of April 1, 2012U.S. Department of Housing and Urban Development Office of Policy Development and Research
Salinas, California
San Benito
Santa Clara
Monterey
Merced
Fresno
StanislausAlameda
Madera
San Mateo
San Luis Obispo
Santa Cruz
Pacific Ocean
Housing Market Area
Market DetailsEconomic Conditions ............... 2
Population and Households ..... 5
Housing Market Trends ............ 6
Data Profile ............................... 9
Summary
The Salinas Housing Market Area (HMA), which consists of Monterey County, is located on the central coast of California, approximately 120 miles south of San Francisco. The HMA is home to the Defense Language Institute Foreign Language Center (DLIFLC) and Naval Postgraduate School (NPS), which have a combined annual eco- nomic impact of more than $140 mil- lion, according to the Department of Defense.
Economy Economic conditions in the Salinas HMA have been weak since 2008 but are beginning to improve. During the 12 months ending March 2012, nonfarm payrolls increased by 800 jobs, or 0.7 percent, to 122,500 jobs, compared with a gain of 430 jobs, or 0.4 percent, during the previous 12 months. The economy in the HMA is primarily based on the government, lei-sure and hospitality, and trade sectors. Agriculture also plays a significant role in the local economy. During the next 3 years, nonfarm payrolls are expected to increase by an average of 860 jobs, or 0.7 percent, annually.
Sales MarketThe sales housing market in the HMA is soft, with an estimated vacancy rate of 2.0 percent, down from the 2.5- percent rate in April 2010. Demand is estimated for 1,450 new homes during the forecast period; the 90 homes un-der construction will meet a portion of that demand (Table 1). In addition, an estimated 8,025 other vacant units are
in the HMA, a portion of which may re-enter the market and satisfy some of the demand.
Rental MarketRental housing market conditions are currently balanced, with an overall rental vacancy rate estimated at 4.5 percent, down from the 4.9-percent rate in April 2010. During the forecast period, demand is estimated for 2,225 new rental units (Table 1). The 70 rental units currently under construc-tion will satisfy some of the forecast rental demand.
Notes: Total demand represents estimated production necessary to achieve a balanced market at the end of the forecast period. Units under construction as of April 1, 2012. A portion of the estimated 8,025 other vacant units in the HMA will likely satisfy some of the forecast demand.
Source: Estimates by analyst
Salinas HMA
SalesUnits
RentalUnits
Total Demand 1,450 2,225
Under Construction 90 70
Table 1. Housing Demand in the Salinas HMA, 3-Year Forecast, April 1, 2012 to April 1, 2015
Sa
lin
as,
CA
• C
OM
PR
EH
EN
SIV
E H
OU
SIN
G M
AR
KE
T A
NA
LYS
IS
2Economic Conditions
Economic conditions in the HMA have remained weak
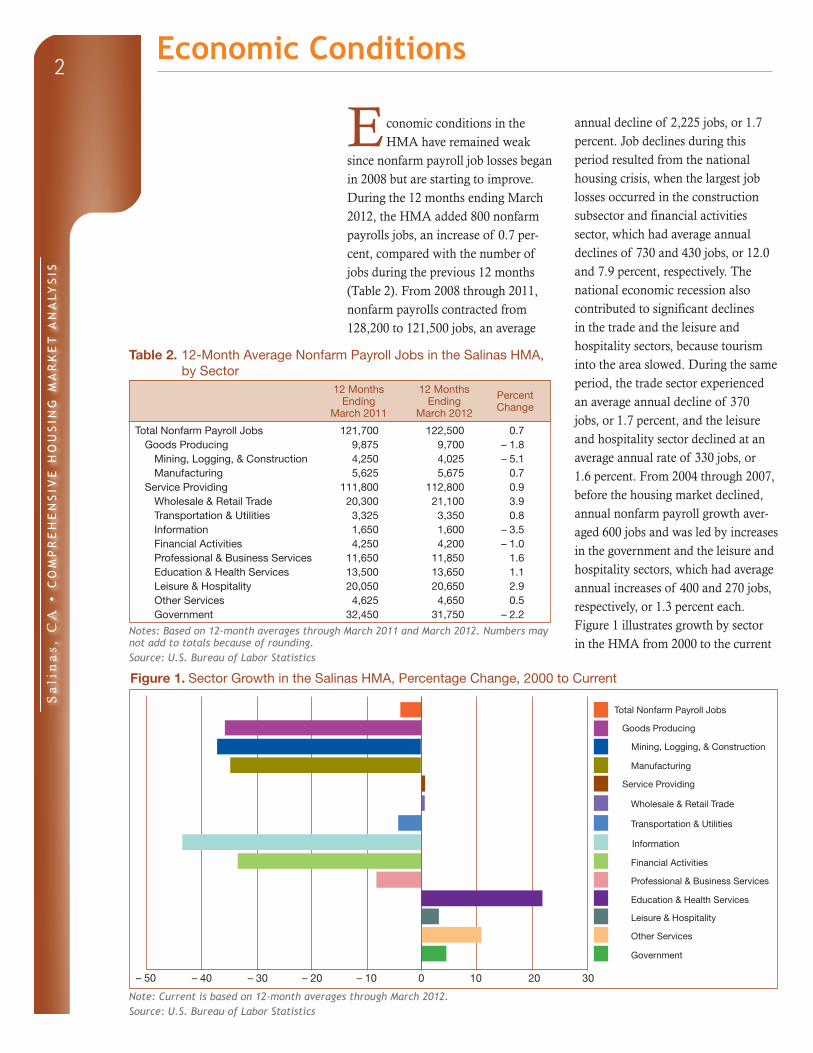
since nonfarm payroll job losses began in 2008 but are starting to improve. During the 12 months ending March 2012, the HMA added 800 nonfarm payrolls jobs, an increase of 0.7 per- cent, compared with the number of jobs during the previous 12 months (Table 2). From 2008 through 2011, nonfarm payrolls contracted from 128,200 to 121,500 jobs, an average
annual decline of 2,225 jobs, or 1.7 percent. Job declines during this period resulted from the national housing crisis, when the largest job losses occurred in the construction subsector and financial activities sector, which had average annual declines of 730 and 430 jobs, or 12.0 and 7.9 percent, respectively. The national economic recession also contributed to significant declines in the trade and the leisure and hospitality sectors, because tourism into the area slowed. During the same period, the trade sector experienced an average annual decline of 370 jobs, or 1.7 percent, and the leisure and hospitality sector declined at an average annual rate of 330 jobs, or 1.6 percent. From 2004 through 2007, before the housing market declined, annual nonfarm payroll growth aver-aged 600 jobs and was led by increases in the government and the leisure and hospitality sectors, which had average annual increases of 400 and 270 jobs, respectively, or 1.3 percent each. Figure 1 illustrates growth by sector in the HMA from 2000 to the current
Notes: Based on 12-month averages through March 2011 and March 2012. Numbers may not add to totals because of rounding.Source: U.S. Bureau of Labor Statistics
Table 2. 12-Month Average Nonfarm Payroll Jobs in the Salinas HMA, by Sector
12 MonthsEnding
March 2011
12 MonthsEnding
March 2012
Percent Change
Total Nonfarm Payroll Jobs 121,700 122,500 0.7Goods Producing 9,875 9,700 – 1.8
Mining, Logging, & Construction 4,250 4,025 – 5.1Manufacturing 5,625 5,675 0.7
Service Providing 111,800 112,800 0.9Wholesale & Retail Trade 20,300 21,100 3.9Transportation & Utilities 3,325 3,350 0.8Information 1,650 1,600 – 3.5Financial Activities 4,250 4,200 – 1.0Professional & Business Services 11,650 11,850 1.6Education & Health Services 13,500 13,650 1.1Leisure & Hospitality 20,050 20,650 2.9Other Services 4,625 4,650 0.5Government 32,450 31,750 – 2.2
Figure 1. Sector Growth in the Salinas HMA, Percentage Change, 2000 to Current
Note: Current is based on 12-month averages through March 2012.Source: U.S. Bureau of Labor Statistics
Total Nonfarm Payroll Jobs
Goods Producing
Mining, Logging, & Construction
Manufacturing
Service Providing
Information
Financial Activities
Professional & Business Services
Education & Health Services
Government
Other Services
Leisure & Hospitality
Transportation & Utilities
Wholesale & Retail Trade
0 10 20 30– 10– 20– 30– 50 – 40
Sa
lin
as,
CA
• C
OM
PR
EH
EN
SIV
E H
OU
SIN
G M
AR
KE
T A
NA
LYS
IS
3Economic Conditions Continued
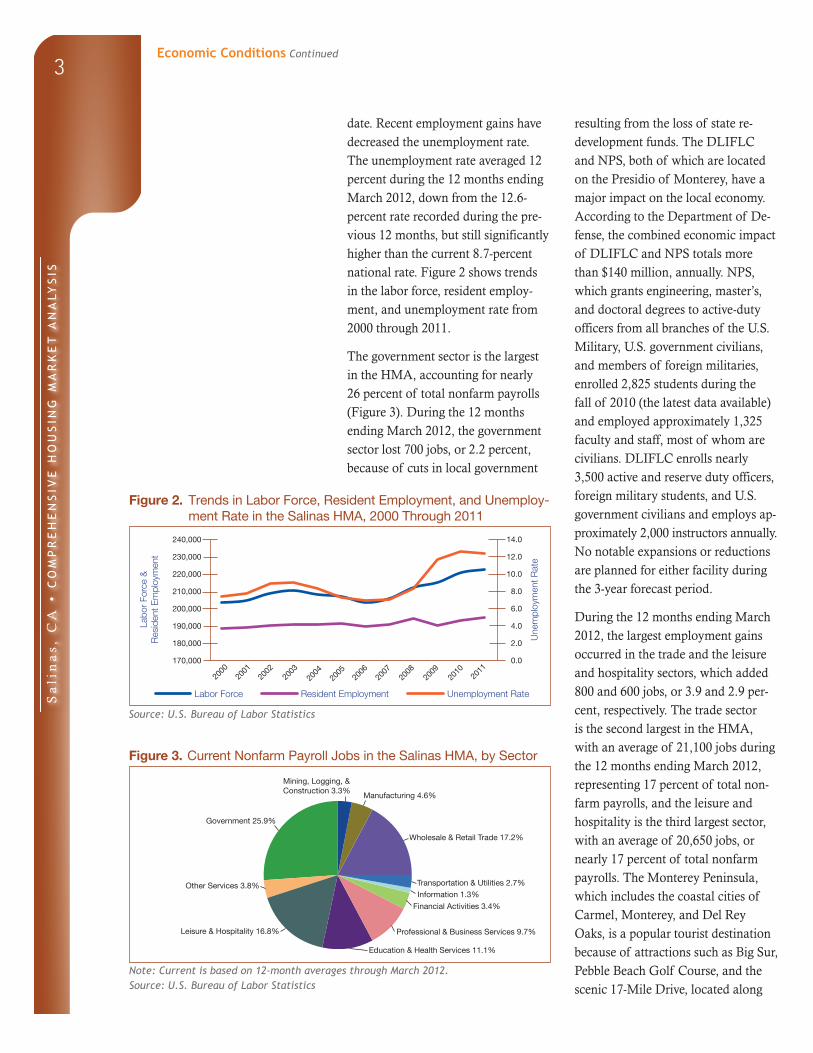
date. Recent employment gains have decreased the unemployment rate. The unemployment rate averaged 12 percent during the 12 months ending March 2012, down from the 12.6- percent rate recorded during the pre-vious 12 months, but still significantly higher than the current 8.7-percent national rate. Figure 2 shows trends in the labor force, resident employ-ment, and unemployment rate from 2000 through 2011.
The government sector is the largest in the HMA, accounting for nearly 26 percent of total nonfarm payrolls (Figure 3). During the 12 months ending March 2012, the government sector lost 700 jobs, or 2.2 percent, because of cuts in local government
resulting from the loss of state re- development funds. The DLIFLC and NPS, both of which are located on the Presidio of Monterey, have a major impact on the local economy. According to the Department of De-fense, the combined economic impact of DLIFLC and NPS totals more than $140 million, annually. NPS, which grants engineering, master’s, and doctoral degrees to active-duty officers from all branches of the U.S. Military, U.S. government civilians, and members of foreign militaries, enrolled 2,825 students during the fall of 2010 (the latest data available) and employed approximately 1,325 faculty and staff, most of whom are civilians. DLIFLC enrolls nearly 3,500 active and reserve duty officers, foreign military students, and U.S. government civilians and employs ap - proximately 2,000 instructors annually. No notable expansions or reductions are planned for either facility during the 3-year forecast period.
During the 12 months ending March 2012, the largest employment gains occurred in the trade and the leisure and hospitality sectors, which added 800 and 600 jobs, or 3.9 and 2.9 per- cent, respectively. The trade sector is the second largest in the HMA, with an average of 21,100 jobs during the 12 months ending March 2012, representing 17 percent of total non- farm payrolls, and the leisure and hospitality is the third largest sector, with an average of 20,650 jobs, or nearly 17 percent of total nonfarm payrolls. The Monterey Peninsula, which includes the coastal cities of Carmel, Monterey, and Del Rey Oaks, is a popular tourist destination because of attractions such as Big Sur, Pebble Beach Golf Course, and the scenic 17-Mile Drive, located along
Figure 3. Current Nonfarm Payroll Jobs in the Salinas HMA, by Sector
Note: Current is based on 12-month averages through March 2012.Source: U.S. Bureau of Labor Statistics
Government 25.9%
Leisure & Hospitality 16.8%
Other Services 3.8%
Education & Health Services 11.1%
Professional & Business Services 9.7%
Transportation & Utilities 2.7%
Wholesale & Retail Trade 17.2%
Manufacturing 4.6%
Mining, Logging, & Construction 3.3%
Information 1.3%
Financial Activities 3.4%
Source: U.S. Bureau of Labor Statistics
Figure 2. Trends in Labor Force, Resident Employment, and Unemploy-ment Rate in the Salinas HMA, 2000 Through 2011
Labo
r Fo
rce
&
Res
iden
t Em
ploy
men
t
Une
mpl
oym
ent R
ate
240,000
230,000
220,000
210,000
200,000
190,000
180,000
170,000
2000
2002
2004
Labor Force Resident Employment Unemployment Rate
14.0
12.0
10.0
8.0
6.0
4.0
2.0
0.0
2006
2001
2003
2005
2007
2009
2010
2008
2011
Sa
lin
as,
CA
• C
OM
PR
EH
EN
SIV
E H
OU
SIN
G M
AR
KE
T A
NA
LYS
IS
4Economic Conditions Continued
the Pacific coastline and Del Monte Forest. According to the California Travel and Tourism Commission, the economic impact of direct travel spending in the HMA during 2010 (the latest data available) totaled $2.02 billion, an increase of $26 million, or 1.3 percent, compared with travel spending in 2009.
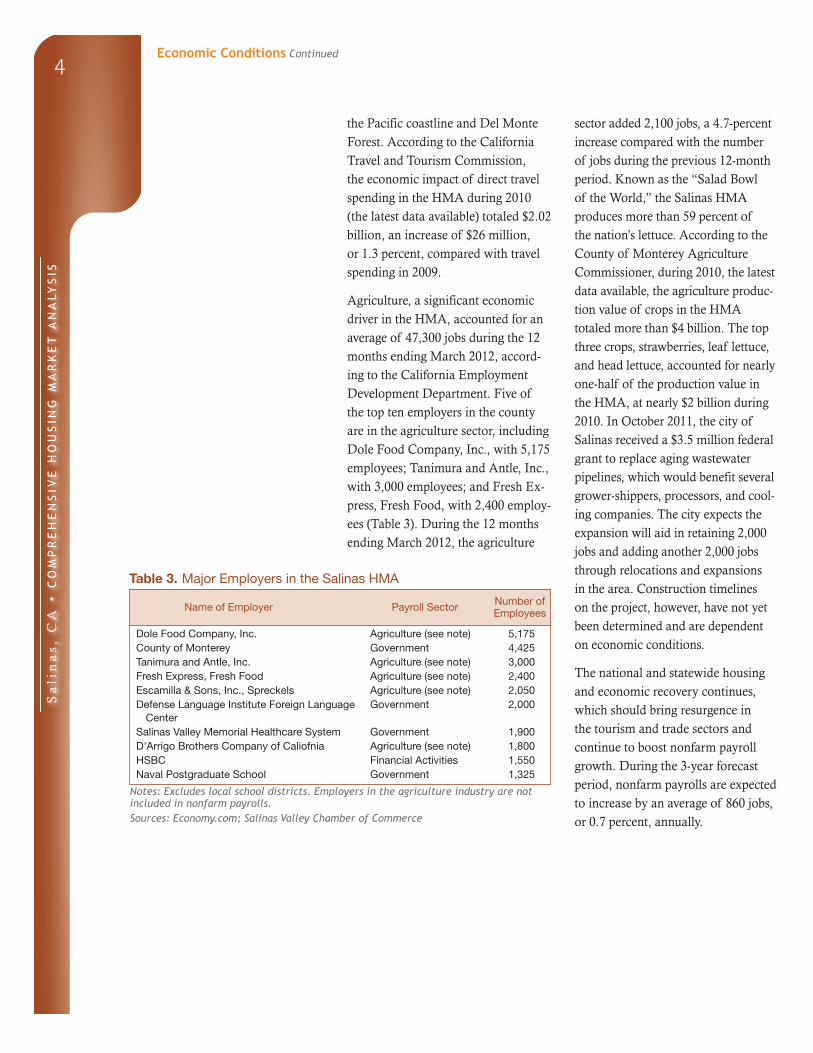
Agriculture, a significant economic driver in the HMA, accounted for an average of 47,300 jobs during the 12 months ending March 2012, accord-ing to the California Employment Development Department. Five of the top ten employers in the county are in the agriculture sector, including Dole Food Company, Inc., with 5,175 employees; Tanimura and Antle, Inc., with 3,000 employees; and Fresh Ex-press, Fresh Food, with 2,400 employ-ees (Table 3). During the 12 months ending March 2012, the agriculture
sector added 2,100 jobs, a 4.7-percent increase compared with the number of jobs during the previous 12-month period. Known as the “Salad Bowl of the World,” the Salinas HMA produces more than 59 percent of the nation’s lettuce. According to the County of Monterey Agriculture Commissioner, during 2010, the latest data available, the agriculture produc-tion value of crops in the HMA totaled more than $4 billion. The top three crops, strawberries, leaf lettuce, and head lettuce, accounted for nearly one-half of the production value in the HMA, at nearly $2 billion during 2010. In October 2011, the city of Salinas received a $3.5 million federal grant to replace aging wastewater pipelines, which would benefit several grower-shippers, processors, and cool-ing companies. The city expects the expansion will aid in retaining 2,000 jobs and adding another 2,000 jobs through relocations and expansions in the area. Construction timelines on the project, however, have not yet been determined and are dependent on economic conditions.
The national and statewide housing and economic recovery continues, which should bring resurgence in the tourism and trade sectors and continue to boost nonfarm payroll growth. During the 3-year forecast period, nonfarm payrolls are expected to increase by an average of 860 jobs, or 0.7 percent, annually.
Table 3. Major Employers in the Salinas HMA
Name of Employer Payroll Sector Number of Employees
Dole Food Company, Inc. Agriculture (see note) 5,175County of Monterey Government 4,425Tanimura and Antle, Inc. Agriculture (see note) 3,000Fresh Express, Fresh Food Agriculture (see note) 2,400Escamilla & Sons, Inc., Spreckels Agriculture (see note) 2,050Defense Language Institute Foreign Language
CenterGovernment 2,000
Salinas Valley Memorial Healthcare System Government 1,900D'Arrigo Brothers Company of Caliofnia Agriculture (see note) 1,800HSBC Financial Activities 1,550Naval Postgraduate School Government 1,325
Notes: Excludes local school districts. Employers in the agriculture industry are not included in nonfarm payrolls.Sources: Economy.com; Salinas Valley Chamber of Commerce
Sa
lin
as,
CA
• C
OM
PR
EH
EN
SIV
E H
OU
SIN
G M
AR
KE
T A
NA
LYS
IS
5
Population Households
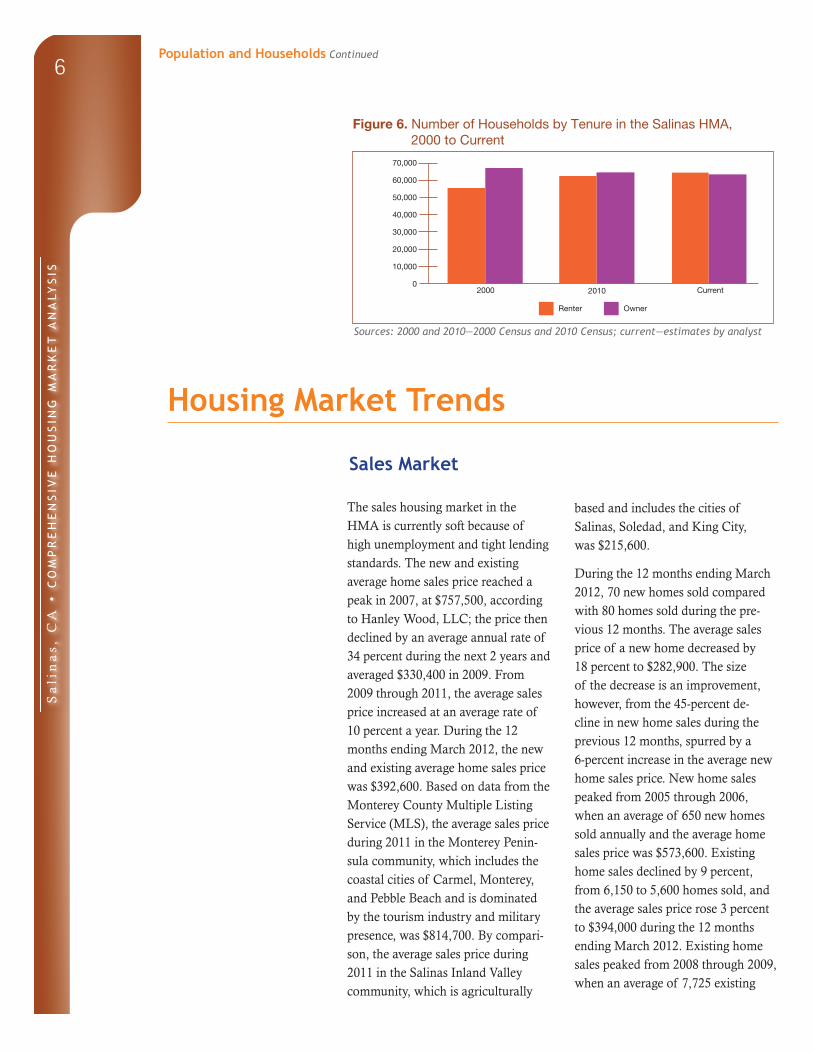
Sources: 2000 and 2010—2000 Census and 2010 Census; current and forecast—estimates by analyst
Figure 5. Population and Household Growth in the Salinas HMA, 2000 to Forecast
4,000
3,000
2,000
1,000
02000 to 2010 2010 to Current Current to ForecastA
vera
ge A
nnua
l Cha
nge
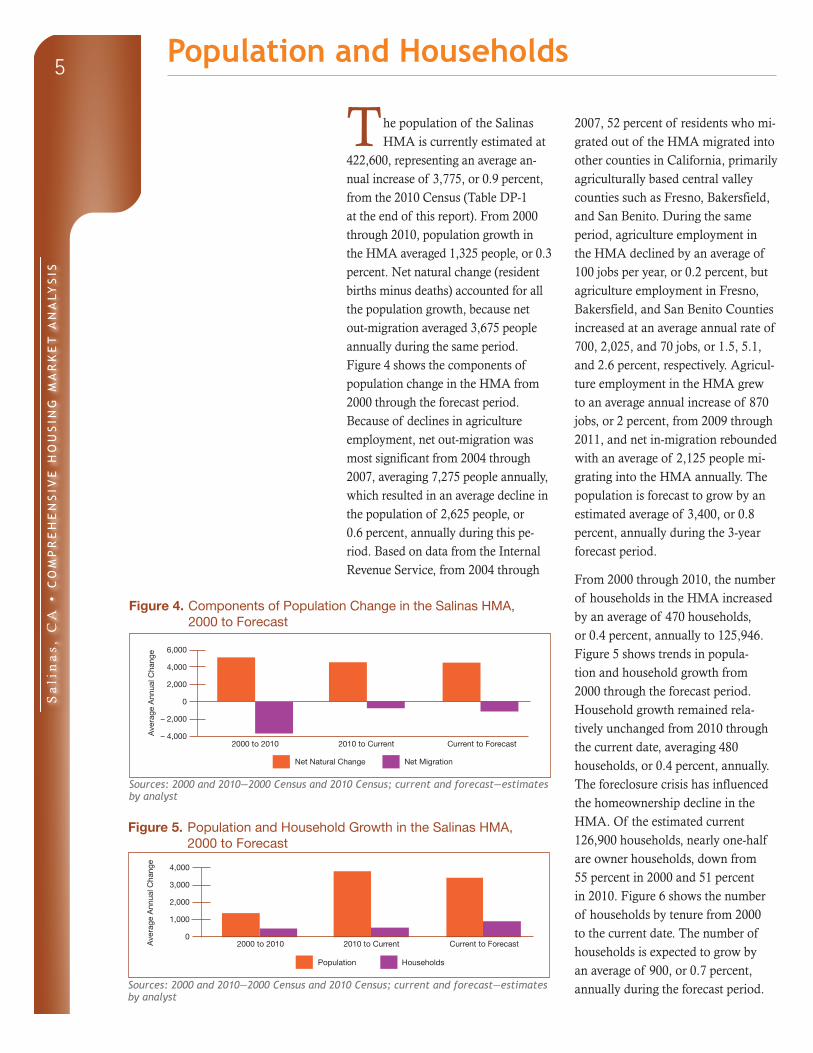
Figure 4. Components of Population Change in the Salinas HMA, 2000 to Forecast
Sources: 2000 and 2010—2000 Census and 2010 Census; current and forecast—estimates by analyst
Net Natural Change Net Migration
2000 to 2010 2010 to Current Current to Forecast
Ave
rage
Ann
ual C
hang
e 6,000
4,000
2,000
0
– 2,000
– 4,000
Population and Households
The population of the Salinas HMA is currently estimated at
422,600, representing an average an - nual increase of 3,775, or 0.9 percent, from the 2010 Census (Table DP-1 at the end of this report). From 2000 through 2010, population growth in the HMA averaged 1,325 people, or 0.3 percent. Net natural change (resident births minus deaths) accounted for all the population growth, because net out-migration averaged 3,675 people annually during the same period. Figure 4 shows the components of population change in the HMA from 2000 through the forecast period. Because of declines in agriculture employment, net out-migration was most significant from 2004 through 2007, averaging 7,275 people annually, which resulted in an average decline in the population of 2,625 people, or 0.6 percent, annually during this pe-riod. Based on data from the Internal Revenue Service, from 2004 through
2007, 52 percent of residents who mi-grated out of the HMA migrated into other counties in California, primarily agriculturally based central valley counties such as Fresno, Bakersfield, and San Benito. During the same period, agriculture employment in the HMA declined by an average of 100 jobs per year, or 0.2 percent, but agriculture employment in Fresno, Bakersfield, and San Benito Counties increased at an average annual rate of 700, 2,025, and 70 jobs, or 1.5, 5.1, and 2.6 percent, respectively. Agricul-ture employment in the HMA grew to an average annual increase of 870 jobs, or 2 percent, from 2009 through 2011, and net in-migration rebounded with an average of 2,125 people mi- grating into the HMA annually. The population is forecast to grow by an estimated average of 3,400, or 0.8 percent, annually during the 3-year forecast period.
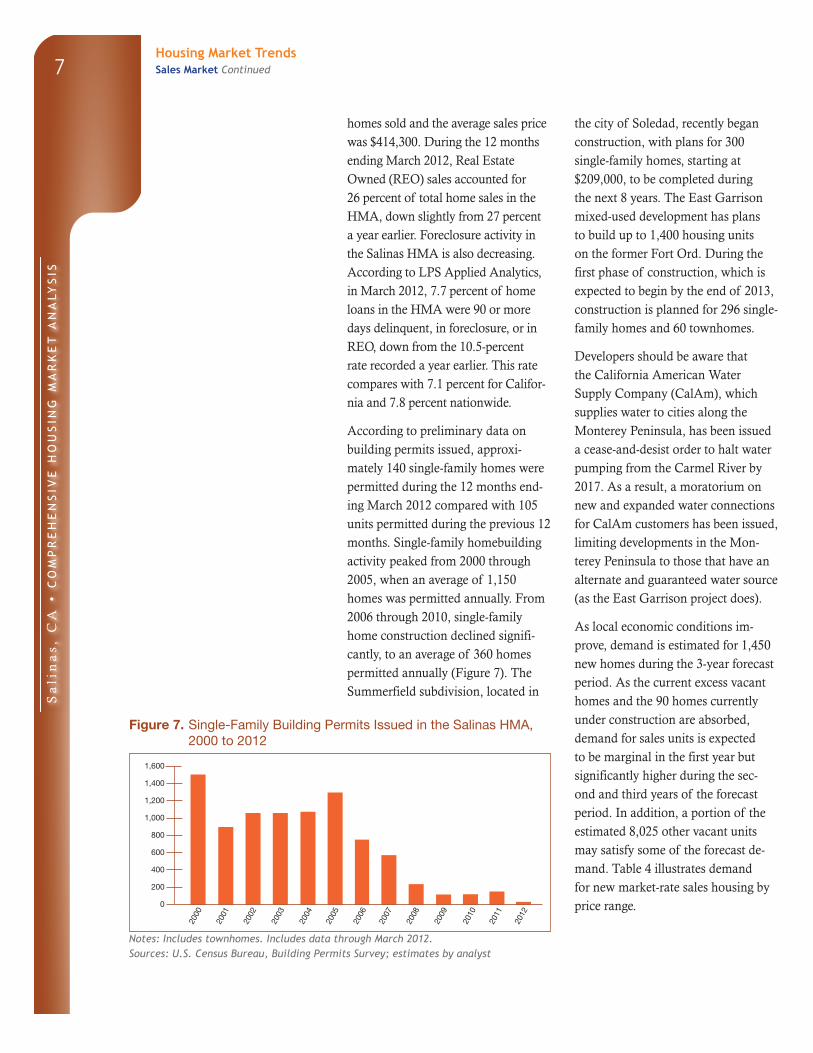
From 2000 through 2010, the number of households in the HMA increased by an average of 470 households, or 0.4 percent, annually to 125,946. Figure 5 shows trends in popula-tion and household growth from 2000 through the forecast period. Household growth remained rela-tively unchanged from 2010 through the current date, averaging 480 households, or 0.4 percent, annually. The foreclosure crisis has influenced the homeownership decline in the HMA. Of the estimated current 126,900 households, nearly one-half are owner households, down from 55 percent in 2000 and 51 percent in 2010. Figure 6 shows the number of households by tenure from 2000 to the current date. The number of households is expected to grow by an average of 900, or 0.7 percent, annually during the forecast period.
Sa
lin
as,
CA
• C
OM
PR
EH
EN
SIV
E H
OU
SIN
G M
AR
KE
T A
NA
LYS
IS
6
The sales housing market in the HMA is currently soft because of high unemployment and tight lending standards. The new and existing average home sales price reached a peak in 2007, at $757,500, according to Hanley Wood, LLC; the price then declined by an average annual rate of 34 percent during the next 2 years and averaged $330,400 in 2009. From 2009 through 2011, the average sales price increased at an average rate of 10 percent a year. During the 12 months ending March 2012, the new and existing average home sales price was $392,600. Based on data from the Monterey County Multiple Listing Service (MLS), the average sales price during 2011 in the Monterey Penin-sula community, which includes the coastal cities of Carmel, Monterey, and Pebble Beach and is dominated by the tourism industry and military presence, was $814,700. By compari-son, the average sales price during 2011 in the Salinas Inland Valley community, which is agriculturally
based and includes the cities of Salinas, Soledad, and King City, was $215,600.
During the 12 months ending March 2012, 70 new homes sold compared with 80 homes sold during the pre- vious 12 months. The average sales price of a new home decreased by 18 percent to $282,900. The size of the decrease is an improvement, however, from the 45-percent de-cline in new home sales during the previous 12 months, spurred by a 6-percent increase in the average new home sales price. New home sales peaked from 2005 through 2006, when an average of 650 new homes sold annually and the average home sales price was $573,600. Existing home sales declined by 9 percent, from 6,150 to 5,600 homes sold, and the average sales price rose 3 percent to $394,000 during the 12 months ending March 2012. Existing home sales peaked from 2008 through 2009, when an average of 7,725 existing
Housing Market Trends
Sales Market
2000 2010 Current
Renter Owner
Figure 6. Number of Households by Tenure in the Salinas HMA, 2000 to Current
Sources: 2000 and 2010—2000 Census and 2010 Census; current—estimates by analyst
70,000
60,000
50,000
40,000
30,000
20,000
10,000
0
Population and Households Continued
Sa
lin
as,
CA
• C
OM
PR
EH
EN
SIV
E H
OU
SIN
G M
AR
KE
T A
NA
LYS
IS
7
homes sold and the average sales price was $414,300. During the 12 months ending March 2012, Real Estate Owned (REO) sales accounted for 26 percent of total home sales in the HMA, down slightly from 27 percent a year earlier. Foreclosure activity in the Salinas HMA is also decreasing. According to LPS Applied Analytics, in March 2012, 7.7 percent of home loans in the HMA were 90 or more days delinquent, in foreclosure, or in REO, down from the 10.5-percent rate recorded a year earlier. This rate compares with 7.1 percent for Califor-nia and 7.8 percent nationwide.
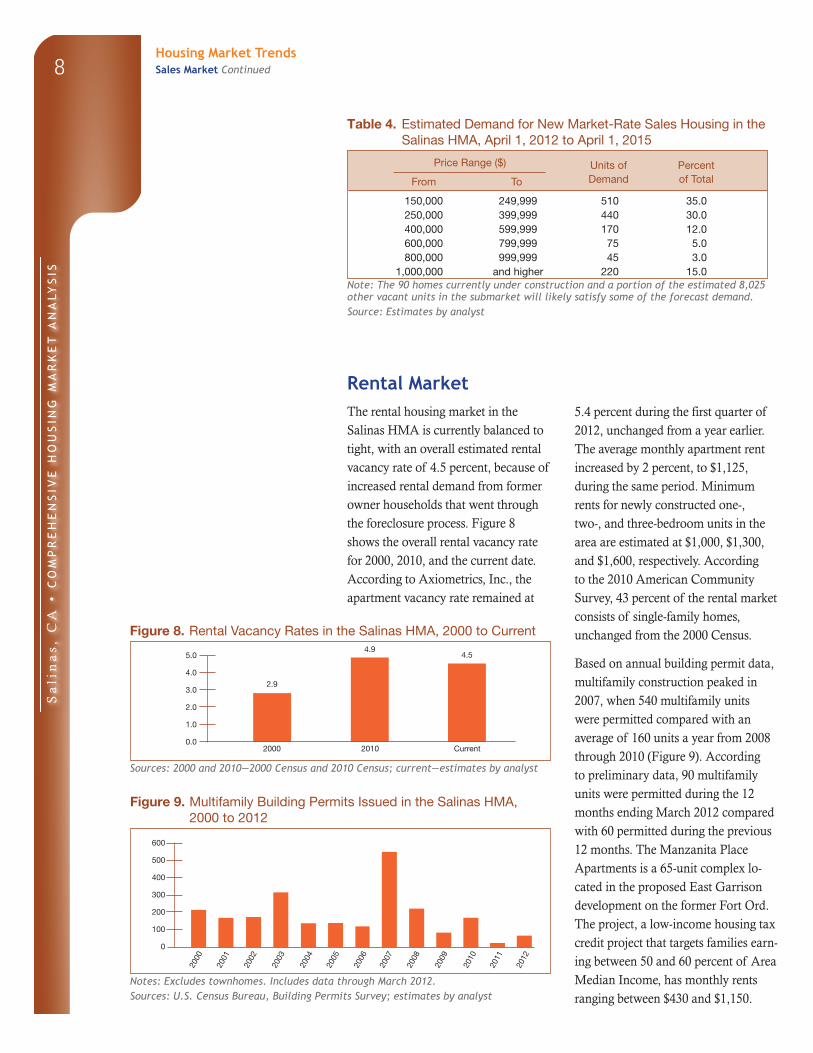
According to preliminary data on building permits issued, approxi-mately 140 single-family homes were permitted during the 12 months end-ing March 2012 compared with 105 units permitted during the previous 12 months. Single-family homebuilding activity peaked from 2000 through 2005, when an average of 1,150 homes was permitted annually. From 2006 through 2010, single-family home construction declined signifi-cantly, to an average of 360 homes permitted annually (Figure 7). The Summerfield subdivision, located in
the city of Soledad, recently began construction, with plans for 300 single-family homes, starting at $209,000, to be completed during the next 8 years. The East Garrison mixed-used development has plans to build up to 1,400 housing units on the former Fort Ord. During the first phase of construction, which is expected to begin by the end of 2013, construction is planned for 296 single-family homes and 60 townhomes.
Developers should be aware that the California American Water Supply Company (CalAm), which supplies water to cities along the Monterey Peninsula, has been issued a cease-and-desist order to halt water pumping from the Carmel River by 2017. As a result, a moratorium on new and expanded water connections for CalAm customers has been issued, limiting developments in the Mon-terey Peninsula to those that have an alternate and guaranteed water source (as the East Garrison project does).
As local economic conditions im- prove, demand is estimated for 1,450 new homes during the 3-year forecast period. As the current excess vacant homes and the 90 homes currently under construction are absorbed, demand for sales units is expected to be marginal in the first year but significantly higher during the sec- ond and third years of the forecast period. In addition, a portion of the estimated 8,025 other vacant units may satisfy some of the forecast de- mand. Table 4 illustrates demand for new market-rate sales housing by price range.
Housing Market TrendsSales Market Continued
2000
2001
2002
2003
2004
2005
2006
Figure 7. Single-Family Building Permits Issued in the Salinas HMA, 2000 to 2012
Notes: Includes townhomes. Includes data through March 2012.Sources: U.S. Census Bureau, Building Permits Survey; estimates by analyst
1,600
1,400
1,200
1,000
800
600
400
200
0
2008
2009
2010
2011
2012
2007
Sa
lin
as,
CA
• C
OM
PR
EH
EN
SIV
E H
OU
SIN
G M
AR
KE
T A
NA
LYS
IS
8
Price Range ($) Units of Percent
From To Demand of Total
150,000 249,999 510 35.0250,000 399,999 440 30.0400,000 599,999 170 12.0600,000 799,999 75 5.0800,000 999,999 45 3.0
1,000,000 and higher 220 15.0Note: The 90 homes currently under construction and a portion of the estimated 8,025 other vacant units in the submarket will likely satisfy some of the forecast demand.Source: Estimates by analyst
Table 4. Estimated Demand for New Market-Rate Sales Housing in the Salinas HMA, April 1, 2012 to April 1, 2015
Rental Market5.4 percent during the first quarter of 2012, unchanged from a year earlier. The average monthly apartment rent increased by 2 percent, to $1,125, during the same period. Minimum rents for newly constructed one-, two-, and three-bedroom units in the area are estimated at $1,000, $1,300, and $1,600, respectively. According to the 2010 American Community Survey, 43 percent of the rental market consists of single-family homes, unchanged from the 2000 Census.
Based on annual building permit data, multifamily construction peaked in 2007, when 540 multifamily units were permitted compared with an average of 160 units a year from 2008 through 2010 (Figure 9). According to preliminary data, 90 multifamily units were permitted during the 12 months ending March 2012 compared with 60 permitted during the previous 12 months. The Manzanita Place Apartments is a 65-unit complex lo- cated in the proposed East Garrison development on the former Fort Ord. The project, a low-income housing tax credit project that targets families earn-ing between 50 and 60 percent of Area Median Income, has monthly rents ranging between $430 and $1,150.
The rental housing market in the Salinas HMA is currently balanced to tight, with an overall estimated rental vacancy rate of 4.5 percent, because of increased rental demand from former owner households that went through the foreclosure process. Figure 8 shows the overall rental vacancy rate for 2000, 2010, and the current date. According to Axiometrics, Inc., the apartment vacancy rate remained at
Housing Market TrendsSales Market Continued
Sources: 2000 and 2010—2000 Census and 2010 Census; current—estimates by analyst
2000 Current2010
2.9
4.54.9
5.0
4.0
3.0
2.0
1.0
0.0
Figure 8. Rental Vacancy Rates in the Salinas HMA, 2000 to Current
2000
2001
2002
2003
2004
2005
2006
Figure 9. Multifamily Building Permits Issued in the Salinas HMA, 2000 to 2012
Notes: Excludes townhomes. Includes data through March 2012.Sources: U.S. Census Bureau, Building Permits Survey; estimates by analyst
600
500
400
300
200
100
0
2008
2009
2010
2011
2012
2007
Sa
lin
as,
CA
• C
OM
PR
EH
EN
SIV
E H
OU
SIN
G M
AR
KE
T A
NA
LYS
IS
9Housing Market TrendsRental Market Continued
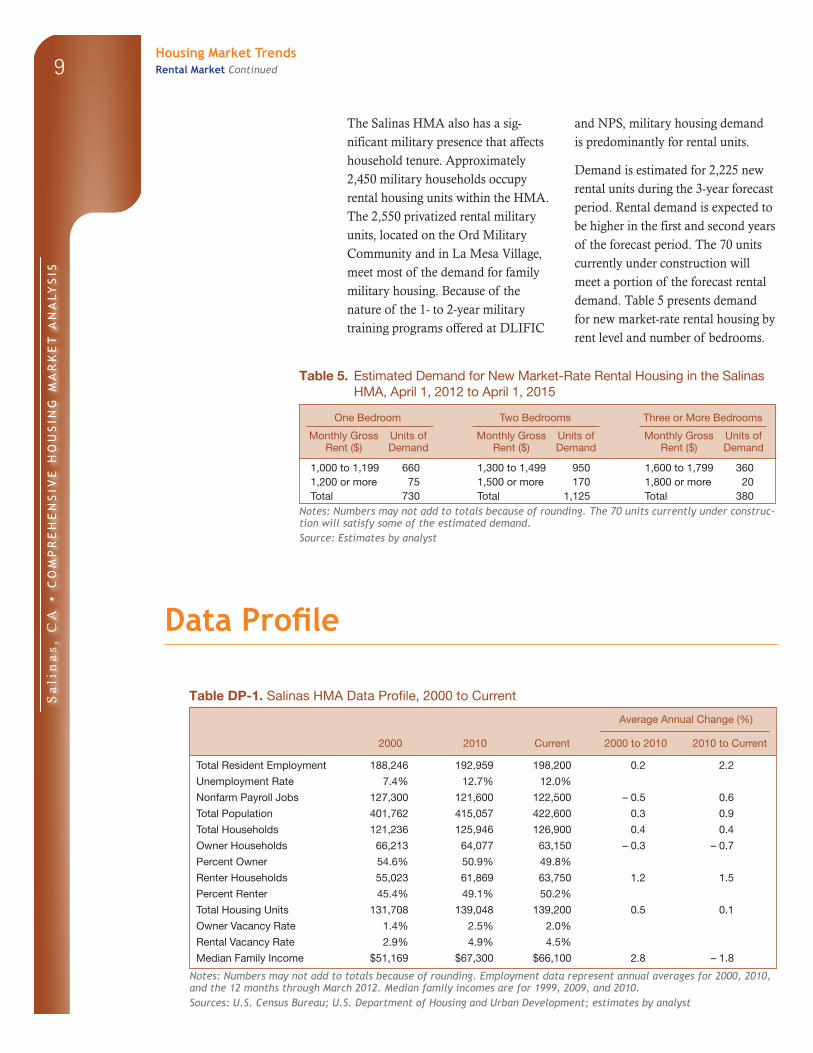
The Salinas HMA also has a sig-nificant military presence that affects household tenure. Approximately 2,450 military households occupy rental housing units within the HMA. The 2,550 privatized rental military units, located on the Ord Military Community and in La Mesa Village, meet most of the demand for family military housing. Because of the nature of the 1- to 2-year military training programs offered at DLIFIC
and NPS, military housing demand is predominantly for rental units.
Demand is estimated for 2,225 new rental units during the 3-year forecast period. Rental demand is expected to be higher in the first and second years of the forecast period. The 70 units currently under construction will meet a portion of the forecast rental demand. Table 5 presents demand for new market-rate rental housing by rent level and number of bedrooms.
Notes: Numbers may not add to totals because of rounding. The 70 units currently under construc-tion will satisfy some of the estimated demand.Source: Estimates by analyst
One Bedroom Two Bedrooms Three or More Bedrooms
Monthly GrossRent ($)
Units of Demand
Monthly Gross Rent ($)
Units of Demand
Monthly Gross Rent ($)
Units of Demand
Table 5. Estimated Demand for New Market-Rate Rental Housing in the Salinas HMA, April 1, 2012 to April 1, 2015
1,000 to 1,199 660 1,300 to 1,499 950 1,600 to 1,799 3601,200 or more 75 1,500 or more 170 1,800 or more 20Total 730 Total 1,125 Total 380
Notes: Numbers may not add to totals because of rounding. Employment data represent annual averages for 2000, 2010, and the 12 months through March 2012. Median family incomes are for 1999, 2009, and 2010. Sources: U.S. Census Bureau; U.S. Department of Housing and Urban Development; estimates by analyst
Table DP-1. Salinas HMA Data Profile, 2000 to Current
Average Annual Change (%)
2000 2010 Current 2000 to 2010 2010 to Current
Total Resident Employment 188,246 192,959 198,200 0.2 2.2
Unemployment Rate 7.4% 12.7% 12.0%
Nonfarm Payroll Jobs 127,300 121,600 122,500 – 0.5 0.6
Total Population 401,762 415,057 422,600 0.3 0.9
Total Households 121,236 125,946 126,900 0.4 0.4
Owner Households 66,213 64,077 63,150 – 0.3 – 0.7
Percent Owner 54.6% 50.9% 49.8%
Renter Households 55,023 61,869 63,750 1.2 1.5
Percent Renter 45.4% 49.1% 50.2%
Total Housing Units 131,708 139,048 139,200 0.5 0.1
Owner Vacancy Rate 1.4% 2.5% 2.0%
Rental Vacancy Rate 2.9% 4.9% 4.5%
Median Family Income $51,169 $67,300 $66,100 2.8 – 1.8
Data Profile
Sa
lin
as,
CA
• C
OM
PR
EH
EN
SIV
E H
OU
SIN
G M
AR
KE
T A
NA
LYS
IS
10
Data Definitions and Sources
2000: 4/1/2000—U.S. Decennial Census
2010: 4/1/2010—U.S. Decennial Census
Current date: 4/1/2012—Analyst’s estimates
Forecast period: 4/1/2012–4/1/2015—Analyst’s
estimates
Demand: The demand estimates in the analysis
are not a forecast of building activity. They are
the estimates of the total housing production
needed to achieve a balanced market at the end
of the 3-year forecast period given conditions on
the as-of date of the analysis, growth, losses, and
excess vacancies. The estimates do not account
for units currently under construction or units in
the development pipeline.
Other Vacant Units: In the U.S. Department of
Housing and Urban Development’s (HUD’s)
analysis, other vacant units include all vacant
units that are not available for sale or for rent.
The term therefore includes units rented or sold
but not occupied; held for seasonal, recreational,
or occasional use; used by migrant workers; and
the category specified as “other” vacant by the
Census Bureau.
Building Permits: Building permits do not neces-
sarily reflect all residential building activity that
occurs in an HMA. Some units are constructed
or created without a building permit or are issued
a different type of building permit. For example,
some units classified as commercial structures
are not reflected in the residential building per-
mits. As a result, the analyst, through diligent
fieldwork, makes an estimate of this additional
construction activity. Some of these estimates are
included in the discussions of single-family and
multifamily building permits.
For additional data pertaining to the housing
market for this HMA, go to www.huduser.org/
publications/pdf/CMARtables_SalinasCA_
12.pdf.
Contact Information
Elaine Ng, Economist
San Francisco HUD Regional Office
415–489–6777
This analysis has been prepared for the assistance and
guidance of HUD in its operations. The factual informa-
tion, findings, and conclusions may also be useful to
builders, mortgagees, and others concerned with local
housing market conditions and trends. The analysis
does not purport to make determinations regarding
the acceptability of any mortgage insurance proposals
that may be under consideration by the Department.
The factual framework for this analysis follows
the guidelines and methods developed by HUD’s
Economic and Market Analysis Division. The an-
alysis and findings are as thorough and current as
possible based on information available on the as-of
date from local and national sources. As such, find-
ings or conclusions may be modified by subsequent
developments. HUD expresses its appreciation to
those industry sources and state and local govern-
ment officials who provided data and information
on local economic and housing market conditions.
For additional reports on other market areas, please go to www.huduser.org/publications/econdev/mkt_analysis.html.