Embed Size (px)
Citation preview

Comprehensive Assessment of Soil HealthThe Cornell Framework
B.N. Moebius-Clune, D.J. Moebius-Clune, B.K. Gugino, O.J. Idowu, R.R. Schindelbeck, A.J. Ristow, H.M. van Es, J.E. Thies, H.A. Shayler, M.B. McBride, K.S.M. Kurtz, D.W. Wolfe, and G.S. Abawi
Third Edition
ii Comprehensive Assessment of Soil Health - The Cornell Framework
School of Integrative Plant Science
(SIPS)
Soil and Crop Sciences Section232 Emerson Hall
Ithaca, New York 14853 http://www.scs.cals.cornell.edu
2016 by Cornell University All rights reserved. Revised June, 2017.
It is the policy of Cornell University actively to support equality of educational and employment opportunities. No person shall be denied employment on the basis of any legally prohibited discrimination involving, but not limited to, such factors as race, color, creed, religion, national or ethic origin, sex, sexual orientation, age, or handicap. The University is committed to the maintenance of affirmative-action programs that will assure the continuation of such equality of opportunity.
ISBN 0-967-6507-6-3
How to Order a Copy
Hardcopy (for purchase): Contact:
Aaron Ristow Extension Associate Soil and Crop Sciences Section 1001 Bradfield Hall, Ithaca, NY 14853 USA Phone: 607.745.7165 Email: [email protected]
Electronic copy (download): PDF file(s) are available to download at bit.ly/SoilHealthTrainingManual
Cover photo: Troy Bishopp
Book design and layout: Bianca Moebius-Clune and Aaron Ristow
Unless otherwise noted, the photos were taken by authors, soil health team members and collaborators.

Comprehensive Assessment of Soil Health - The Cornell Framework iii
Funding for the preparation of this manual was provided by: Cornell University, Cornell Cooperative Extension, USDA-NRCS, NY Department of Agriculture and Markets, Northern New York Agricultural Development Program, USDA Northeast Region SARE, NY Farm Viability Institute, New Hampshire Charitable Foundation, NH Department of Agriculture, Food, and Markets.
Funding
Soil and Crop Sciences Section Comprehensive Assessment of Soil Health - soilhealth.cals.cornell.edu 1
Comprehensive Assessment of Soil Health
Cornell UniversityCollege of Agriculture and Life Sciences
What is Soil Health?Soil health is defined as the continued capacity of the soil to function as a vital living ecosystem that sustains plants, ani-mals and humans (NRCS, 2012). Characteristics of a healthy soil include good soil tilth, sufficient rooting depth, good water storage and drainage, rich and diverse soil life, stored carbon and an adequate supply of nutrients. Climate change, particularly the impacts of CO2 and N2O, can be mitigated through improved soil health management while at the same time building soil resilience. The health of a soil can change over time as a result of use and management, therefore it is crucial to measure soil improvement when implementing new or modifying current management practices.
The Cornell Soil Health Management Framework
Each grower is generally faced with a unique production en-vironment and set of management options to address soil health constraints. A more comprehensive understanding of a farm’s limitations and opportunities, and soil health status can better guide producers’ soil management decisions.
The Cornell approach aims to alleviate field-specific con-straints, identified through standard measurements, and then maintain and monitor over time for improved soil health sta-tus. To that end, we created a framework for developing Soil Health Management Plans for a farm operation.
The framework includes:• Six general steps for the planning and implementation
process (below).
• A Comprehensive Assessment of Soil Health report that explicitly provides interpretation, prioritization, and man-agement suggestions (see back).
• Resource concerns identified through soil health assess-ment are linked to each indicator showing constrained soil functioning for which new management practices may be applied.
• A pilot management plan template that includes purpose, site information, assessment results and interpretation, and planned practices via a multi-year management calendar.
Soil Health Management Planning Process1. Determine farm background and management history
2. Set goals and sample for soil health
3. For each management unit: identify and explain constraints, prioritize management
4. Identify feasible management options
5. Create short and long term Soil Health Management Plans
6. Implement, monitor and adapt
The Comprehensive Assessment of Soil Health is an integral part of the Cornell Soil Health Management Planning and Implementation framework.
Producers will align their needs and abilities to allow for the development of management solutions with guidance from the CASH report.

iv Comprehensive Assessment of Soil Health - The Cornell Framework
AcknowledgementsThis is the 3rd edition of the manual previously titled “Cornell Soil Health Assessment Training Manual”.
The 3rd Edition Publication Team· Bianca N. Moebius-Clune, formerly Soil and Crop Sciences, Cornell University, Ithaca NY; now Soil Health Division, USDA Natural Resources Conservation Service
· Daniel J. Moebius-Clune, formerly Soil and Crop Sciences, Cornell University, Ithaca, NY
· Robert R. Schindelbeck, Soil and Crop Sciences, Cornell University, Ithaca, NY
· Kirsten S.M. Kurtz, Soil and Crop Sciences, Cornell University, Ithaca, NY
· Harold M. van Es, Soil and Crop Sciences, Cornell University, Ithaca, NY
· Aaron J. Ristow, Soil and Crop Sciences, Cornell University, Ithaca, NY
ThanksWe would like to thank the Cornell Soil Health Team members and collaborators, including growers, extension educators, faculty, staff, non-profit, and governmental organizations, for their many contributions to the research and outreach activities conducted over the years since 2003. Their contributions provided the foundation on which this manual is based.
We acknowledge the contributions of Aubrey Fine for her work on the 2016 national scoring function updates and the preliminary development of regional scoring functions for physical and biological indicators.
We would like to thank Gordon Holloway for his significant input on book design and layout.
Many thanks to Kirsten Kurtz and Jenn Thomas-Murphy for designing the Comprehensive Assessment of Soil Health logo and other valuable contributions to this manual.
We would like to especially acknowledge the significant contributions ofCarol MacNeil, Cornell Cooperative Extension (CCE); Mike Rutzke, Cornell Nutrient Analysis Laboratory; Dorn Cox, Greenstart, NH; and Brandon Smith, NH NRCS
Past contributorsJohn Ludwig, Research Assistant; Kate Duhamel, Research Assistant; Molly Shaw, CCE; Ted Blomgren, Formerly of CCE; Dale Moyer, Formerly of CCE;
Excerpts from Building Soils for Better Crops, 3rd Edition, by Madgdoff and van Es were adapted throughout the manual.
For additional information related to this project and the revision history for this manual please visit the Cornell Soil Health Team’s website at: http://soilhealth.cals.cornell.edu
Correct citationMoebius-Clune, B.N., D.J. Moebius-Clune, B.K. Gugino, O.J. Idowu, R.R. Schindelbeck,A.J. Ristow, H.M. van Es, J.E. Thies, H.A. Shayler, M.B. McBride, K.S.M Kurtz, D.W. Wolfe, and G.S. Abawi, 2016. Comprehensive Assessment of Soil Health – The Cornell Framework, Edition 3.2, Cornell University, Geneva, NY.

Comprehensive Assessment of Soil Health - The Cornell Framework v
TM
Comprehensive Assessment of Soil Health
Training Manual
Edition 3.2, 2017

vi Comprehensive Assessment of Soil Health - The Cornell Framework

Comprehensive Assessment of Soil Health - The Cornell Framework vii
Table of ContentsAcknowledgements ................................................. iv
Introduction .............................................................viii
Part I Soil Health Concepts .......................1What is soil? ...............................................................2
Life in the soil ............................................................5
What is Soil Health? .............................................. 12
Characteristics of a healthy soil .............................13
Common soil constraints ........................................15
Part II Soil Health Assessment ............... 19In-field soil health assessment ............................. 20
Development of Cornell ’s Comprehensive Assessment of Soil Health .................................... 22
Assessment of Soil Health overview .................. 25
Soil sampling protocol .......................................... 27
Materials needed for one sample...........................27
Field sampling design.................................................27
Steps for soil sampling..............................................28
Soil sample storage requirements..........................29
Soil sample packaging and shipping........................29
Submission form example........................................30
Regulated soils............................................................31
Soil Health scoring functions.................................32
Regional updates........................................................32
Cumulative normal distribution.............................33
CASH summary report page example..................35
Scoring types...............................................................36
Soil Health Indicator Protocols and Scoring...... 37 Soil Texture ...............................................................37
Available Water Capacity .......................................39
Surface and Subsurface Hardness ..........................41
Wet Aggregate Stability ..........................................44
Organic Matter .........................................................47
Soil Protein Index ......................................................49
Soil Respiration .........................................................51
Active Carbon ...........................................................53
Standard Nutrient Analysis ....................................55
Soil Health Indicator Protocols and Scoring cont.
Add-on Test: Potentially Mineralizable N............59
Add-on Test: Root Health Bio-assay.....................61
Add-on Test: Heavy Metal Contamination..........64
Add-on Test: Salinity.................................................69
Soil Health Assessment Report .......................... 72
Six parts of the CASH summary report ...........73
Using the Assessment of Soil Health info............74
Using the Assessment of Soil Health in Soil Health Management Planning..........................75
Part III Soil Health Management ............ 79Soil Health Management Planning Framework..80 Six Steps of the Soil Health Management Planning Process.........................................................82
Soil Health Management Options and Opportunities ................................................... 87
The Soil Health Management Toolbox ............. 87
General management considerations ................. 88Tillage considerations ..............................................88
Crop rotation considerations ..............................90
Cover cropping considerations .............................92
Organic amendment considerations ....................96
Considerations for adapting to and mitigating climate change ...........................................................98
Part IV Additional Resources................103Selected Book and Journal Resources .............104
Selected Web Resources ....................................107
Appendix A. Sample 2017 StandardPackage Comprehensive Assessmentof Soil Health Report .............................. 110
Appendix B. Soil Health ManagementPlanning Process Worksheet ................ 121

viii Comprehensive Assessment of Soil Health - The Cornell Framework
Introduction
Soil health, or the capacity of the soil to function, is critical to human survival. Soil health constraints beyond nutrient limitations and excesses currently limit agroecosystem productivity and sustain-ability, resilience to drought and extreme rainfall, and progress in soil and water conservation. With mounting pressure to produce food, feed, fiber, and even fuel for an increasing population, soil health is gaining national and international attention. Research on both assessment and management of soil health, as well as farmers’ innovations in soil health management approaches have matured over the decades. Multiple regional, national, and global efforts are now leveraging that work to reach new stakeholder audiences, so that soil health management is expanding into mainstream agriculture. Public recognition of the critical importance of maintaining and rebuilding healthy soils for long term sustainable agricul-tural production is growing. But while much progress has been made, there is much more to be done.
The more comprehensive assessment of soil health described in this manual is available to the public on a fee-for-service basis, and provides field-specific information on constraints in biological and physical processes, in addition to standard soil nutrient analysis (soilhealth.cals.cornell.edu/). In essence, the assessment expands on a well understood approach that has been foundational to high agricultural pro-ductivity. Just as standard soil testing has informed nutrient management based on identified deficiencies and excesses since the 1900s, the assessment developed here, similarly, identifies constraints to biological and
physical soil functioning. This information then guides land managers in making targeted management decisions to plan and implement systems of soil health management practices to alleviate identified constraints and maintain healthier soils. The current (2017) version of the assessment and its interpretive scoring was developed for the Northeastern United States. However, the concepts, framework and indicators for soil health

Comprehensive Assessment of Soil Health - The Cornell Framework ix
assessment and management planning described here can be expanded and adapted for national and global applications. The most relevant components of the framework are 1) measurement of indicators that represent critical soil processes, 2) scoring of measured values that allows for interpretation, and 3) linkage of identified constraints with management practices. The main benefit of this approach is that the identification of physical biological and chemical constraints prompts farmers to seek improved and more sustainable soil and crop management practices. We hope that this framework will evolve and be used widely to measure and monitor soil health status. It is expected that a more comprehensive understanding of soil health status can lead to better, regenerative, and sustainable management of soils through holistic, adaptive, and data-driven approaches.

x Comprehensive Assessment of Soil Health - The Cornell Framework
This manual is laid out in four parts:
I. Soil Health Concepts (1–18)
II. Soil Health Assessment (19–78)
III. Soil Health Management (79–102)
IV. Additional Resources (103–108)
The purpose of this manual is to:
• Provide an overview of soil health concepts.
• Provide an overview of Cornell University laboratory methods used to assess the health status of soil, the report generated from this more comprehensive assessment of soil health, and its interpretation.
• Present a framework for soil health management planning and imple-mentation based on information gained from soil health assessment that can be adapted for use in other land management systems, soils, and climates.
• Provide a brief overview of in-field qualitative soil health assessment.
• Provide a how-to guide for proper soil health sampling.
• Describe soil constraints and soil health issues common to soils in the Northeast region, especially in vegetable and field crop production systems.
• Identify management strategies for improving soil health based on measured constraints.
• Provide guidelines for standardized and quantitative laboratory-based soil health assessment.
• Provide links to additional soil health assessment and management resources.

Comprehensive Assessment of Soil Health - The Cornell Framework 1
Soil Health Concepts - Part I
Part ISoil Health Concepts

2 Comprehensive Assessment of Soil Health - The Cornell Framework
Part I - Soil Health Concepts
What is soil?Representative and State Soils in the Northeast: Soil types across the nation and the world are varied. They form with the diverse influences of local climate, organisms, topography, bedrock or underlying sediment type (parent material), and the effects of time. Areas of similar soils are grouped and labeled as a soil series. The series name is usually derived from a town or landmark in the area where the soil was first recognized. Soil series are not bound by political boundaries, therefore a given soil series does not necessarily occur within the confines of only one state. The soil map delineating the soil series informs the land manager of the soil’s inherent quality, that cannot be changed through soil management.
According to the Natural Resources Conservation Service (NRCS), a state soil represents a soil series that has special significance to a particular state. Each state has selected a state soil (Figure 1.01). Of those, 20 have been legislatively established as “Official State Soils” and share the same level of distinction as official state flowers and birds.
Soil is at the foundation of everything that we and the other life on earth need to live, including food, fiber, habitat, shelter, recreational space, clean air and water, and more. But first, what is it?
Honeoye (NY) Tunbridge (VT)
Marlow (NH) Chesuncook (ME)
Hazleton (PA) Paxton (MA)
Downer (NJ) Windsor (CT) Narragansett (RI)
FIGURE 1.01 Information and soil profile images of the Northeast. Source: USDA-NRCS.

Comprehensive Assessment of Soil Health - The Cornell Framework 3
Soil Health Concepts - Part I
Soil is a dynamic interface between the lithosphere (rock), atmosphere (air), hydrosphere (water), and biosphere (living things). It is the zone in which rocks and organisms, and the air and water that move in and through and around them, interact. Soil is not just the physical parts that make it up, but also the active interactions between its various physical, biological, and chemical parts. A soil’s characteristics determine how that soil functions as a foundation of the ecosystem it is part of, whether natural or managed by humans. When we discuss soil health, we are primarily concerned with the interactive processes involved with this functioning and how human management influences these processes.
Physically, soil is made up of a mixture of materials, including various solids, air, and water in varying proportions (Figure 1.02). The solid components of soil include mineral and organic fractions (both living and non-living). This composition of soil strongly influences how it functions.
Mineral Solids: The large majority of the solids (in most soils) are the mineral parts, consisting of stone fragments, sand, silt, and clay. These particles are defined by their sizes, although they differ in the way they influence soil functioning beyond simply their size-related effects (Figure 1.03). The relative proportions of sand, silt and clay determine a soils texture and textural class (Figure 1.04, following page).
Texture is one of the fundamental char-acteristics important for quantifying how a soil is functioning. For example, the amount and type of clay, in particular, can greatly influence the ability of soils to hold and exchange nutrients, and to store organic matter. Clays have a lot of surface area because they are very small, layered, platy particles. The surfaces of most clays are negatively charged, so that positively charged nutrient ions can electrostatically ‘stick’ to them. This ability of soil particles to hold onto positively charged nutrient ions and exchange them with the soil water, or soil solution, is referred to as the soil’s cation exchange capacity (CEC), and the surfaces to which the ions can ‘stick’ are the exchange complex.
FIGURE 1.02 Distribution of solids and pores in soil. Solids are minerals, organic matter and living organisms, or biota. Pores are filled with water, air, and biota.
FIGURE 1.03. Relative size of soil particles.

4 Comprehensive Assessment of Soil Health - The Cornell Framework
Part I - Soil Health Concepts
Organic Matter: Soil organic matter (SOM or OM) is largely made up of carbon, and is any material that originated from living organisms. OM is of profound importance for soil function. It contributes to the soil’s ability to hold onto nutrient ions, similarly to clay, but for an even greater range of ionic nutrients. It can also contain nutrients in its molecular structure. As soil biota (living things – see the following page on Life in the Soil) decompose the OM, nutrients can be released and become available to plants. Some of the very small particles of well decomposed organic materials become bound to fine soil mineral particles and can become protected from further biological activity inside very small soil aggregates. There it will remain more stable as part of the soil’s structure. This process is known as carbon sequestra-tion, an important process for mitigating climate change (also see page 98). Stabilized soil organic matter contributes to soil function in numerous ways, including those related to soil structure such as its capacity to store water and thus provide drought resilience.
Pores: The spaces between the solid soil particles, as mentioned previously, are called pores. These are filled with air, water, and biota. Water and air are essential for all life in the soil. Water is the medium that facilitates nutrient transport through the soil and enables plant nutrient uptake. It also allows microbes such as nematodes and bacteria to move through the soil. Air is constantly moving into and out of the soil, providing oxygen required for cell functioning in aerobic organisms including plant roots and most of the biota discussed in the following pages.
The balance of air and water depends on weather conditions, and also on the size of the pores. Pore sizes are determined in part by the sizes of the particles between
which the spaces are formed: for example, clay soils tend to have smaller pores than sandy soils. But just as important as the sizes of the primary particles in this influence, is the aggregation, or ‘clustering’ of these particles into soil crumbs or aggregates, bound together by particle surface chemistry, fungal hyphae, and microbial and plant exudates (see Life in the Soil).
Just as the primary particles are of multiple sizes, soil aggregates can be of varying size, with larger aggregates made up in turn of smaller aggregates. This is referred to as soil structure, or popularly as ‘tilth’. A healthy, well aggregated soil has a range of sizes of both stable crumbs and pores (Figure 1.05).
Pore sizes and their continuity determine how water moves in soil. For example, after a soil becomes wet, gravity will drain larger pores more readily than smaller ones. Due to the same forces responsible for capillary action, smaller pores will store a fraction of the water that infiltrates into the soil. Plants can access water from all but the smallest pores, which hold water too tightly to release it to plants. Thus, a well-structured soil with a range of pore sizes allows plant roots and soil dwelling organisms to have access to a good balance of air from the larger pores that drain readily through gravity, and water from the smaller pores that store water.
FIGURE 1.04. The soil textural triangle. For example, a soil with a texture of 70% silt, 20% sand, and 10% clay can be classified as a silt loam, one of the textural classes. Adapted from USDA-NRCS

Comprehensive Assessment of Soil Health - The Cornell Framework 5
Soil Health Concepts - Part I
Life in the soilThe soil is teeming with life. Some soil scientists say that there are likely more species of organisms in a shovel full of garden soil than exist above ground in the entire Amazon rain forest (NRCS). There are many groups of soil-dwelling organisms, which range in size from those that are easy to see, such as earthworms and arthropods, to those that are microscopic, such as bacteria. Understanding these organisms and their needs, and how they influence soil functioning, can help us improve soil health. The initial source of food that drives the soil food web is organic material (e.g. leaves, roots, sticky substances called ‘exudates’, Figure 1.06). Just like us, biota need energy. Plants gather this energy from the sun as they fix CO2 from the atmosphere into sugars via photosynthesis. Most other organisms need to consume energy rich materials that are directly or indirectly sourced from plants. Without plentiful plant-derived organic inputs, the soil food web cannot thrive. In essence, managers of healthy soils need to feed, and provide good habitat for, their “livestock” living underground.
FIGURE 1.05. A healthy soil is well aggregated with a range of pore sizes. Source: Building Soils for Better Crops
FIGURE 1.06. The soil food web. Relationship between the soil food web, plants, organic matter and animals. Adapted from USDA- NRCS

6 Comprehensive Assessment of Soil Health - The Cornell Framework
Part I - Soil Health Concepts
If we ‘follow’ a piece of plant residue into the soil, it will help organize a brief survey of some important soil biota. Picture a leaf falling to the soil surface... earthworms and arthropods are some of first organisms likely to interact with the leaf (Figure 1.07 and 1.08).
Earthworms physically drag organic material into the soil from the surface, exposing it to the activity of other soil biota. There are a number of different types of soil dwelling earthworms (or annelids, that differ from roundworms or nematodes, and will be discussed shortly). While many of these would be considered invasive exotic species in forested systems, their presence and activity are generally considered quite welcome and a sign of a healthy system in agricultural soils. Earthworms burrow through the soil, consuming the solids (including both mineral and organic matter). They digest some of the nutritious material and ‘egest’ the remainder as ‘casts’. These worm castings are coated with microbial cultures from the worm’s gut, which can contribute to both building stable aggregates and suppressing plant disease, depending on the type of worm. They help break down organic matter, mix materials in the soil profile, alleviate compaction, and develop soil pores. Earthworms support the microbial community, and in addition are often considered to be themselves good indicators of the health status of the soil, as they tend to be both easily visible and sensitive to management. Their numbers decline when conditions and management negatively impact a variety of soil processes.
FIGURE 1.07. Various Arthropods feed on decaying OM and break larger pieces down into smaller ones: A) Sowbug, B) 200 species of mites, C & G) springtail, D)
Oribatid turtle-mite, E) Predatory Pergamasus mite, F) Pseudoscorpion. Photos credit: Soil and Water Conservation Society
Earthworms aerate soil and provide other benefits as they burrow.
A
B
C
D
E
F
G

Comprehensive Assessment of Soil Health - The Cornell Framework 7
Soil Health Concepts - Part I
Arthropods, including spiders, mites, and other insects, also interact early with organic matter added to a system. These animals are small from our perspective but immense compared with many of the other soil biota. Among their more important activities with regard to soil functioning, they break larger organic matter pieces down into smaller pieces (shredding), expose the organic matter to microbial cultures (inoculation), and mix the soil materials (bioturbation).
Bacteria and Fungi: Some of the organic material we are following into the soil is directly digested by the annelids and arthropods, although material inoculated with bacteria and fungi is ultimately broken down by them more thoroughly. This is due to both bacteria and fungi producing digestive enzymes that they release into their surroundings. They then absorb the breakdown products and release nutrient ions for plant uptake in the process. This activity is important for carbon and nutrient cycling, and of course for residue management as well. It would be quite incon-venient for management if plant residues and roots continued to accumulate in the soil environment.
Protozoa: As the bacterial colonies grow on and around the degrading organic matter, larger mobile organisms such as ciliates, flagellates, and amoebae (which, informally, may be collectively referred to as protozoans) may consume them. These organisms are single-celled, yet larger than the bacterial cells, and generally live and move about in the thin films of water that can be found on the surfaces of most of the soil solids. These protozoans may also consume algal cells and cyanobacterial cells that grow in habitats with access to sunlight, where they get their energy through photosynthesis, as plants do.
Enzymatic breakdown of cellulose
Cellulose is the main component of plant cell walls, and therefore a large bulk of plant material. It is a large, or high molecular weight compound that has to be broken apart by the enzymes that microbes release, before the smaller breakdown products can be taken up and used as an energy source. Bacteria and fungi produce different and complementary kinds of cellulose degrading enzymes. As the cellulose in the cell wall materials is broken down, other compounds become more exposed and therefore available for uptake by the microbial community. Smaller compounds like amino acids or sugars, or salts can then be taken up directly. Larger compounds, such as proteins, need further breakdown first. Some of these enzymes in fact are the very same enzymes that are being explored for use in cellulosic ethanol production, where cellulose from biomass crops is broken down by enzymes into sugars. Sugars are then fermented by bacterial culture to produce alcohol, which we can use as a liquid fuel.
FIGURE 1.08. Arbuscular mycorrhizal fungi, growing out of carrot roots (top), and showing network of hyphae and spores (bottom).

8 Comprehensive Assessment of Soil Health - The Cornell Framework
Part I - Soil Health Concepts
diversity as an index to represent soil biological and functional diversity, and therefore soil health.
Nutrient Benefits from Decomposition: As organisms feed on organic matter, or on each other, they respire or ‘burn off ’ much of the carbon present in the food (this respiration is represen-tative of general biological activity, and is measured as a soil health indicator). As they do so, they accumulate a small portion of the total carbon, as well as nitrogen and
BUILDING SOILS FOR BETTER CROPS: SUSTAINABLE SOIL MANAGEMENT
20
apply excessive rates of nitrogen fertilizers or manures—in addition to the economic costs and the pollution of ground and surface waters—the possible formation of nitrous oxide should make you cautious.
The Water CycleOrganic matter plays an important part in the local, regional, and global water cycles due to its role in promoting water infiltration into soils and storage within the soil. The water cycle is also referred to as the hydrologic cycle. Water evaporates from the soil surface and from living plant leaves as well as from the ocean
and lakes. Water then returns to the earth, usually far from where it evaporated, as rain and snow. Soils high in organic matter, with excellent tilth, enhance the rapid infiltration of rainwater into the soil. This water may be available for plants to use or it may percolate deep into the subsoil and help to recharge the groundwater sup-ply. Since groundwater is commonly used as a drinking water source for homes and for irrigation, recharging groundwater is important. When the soil’s organic mat-ter level is depleted, it is less able to accept water, and high levels of runoff and erosion result. This means less water for plants and decreased groundwater recharge.
CHAPTER 2 ORGANIC MATTER: WHAT IT IS AND WHY IT’S SO IMPORTANT
crop harvest
crop and animal residues
nitrogen in soil
organic matter
ammoniumNH
4+
leaching togroundwater
nitrateNO
3–
erosion
NH4+ + OH– NH
3+ H
2O
immobilization
legumes
free-livingbacteria
nitrogenfixation
NH4++ NO
3–
nitrogen gas (N2)
(78% of atmosphere)
volatilization
plant uptake
denitrification
NO3– N
2 + N
2O
atmospheric fixationor
fertilizer production
mineralization
Figure 2.9. The role of organic matter in the nitrogen cycle.
Nematodes: Larger, yet still microscopic, multicellular animals called nematodes (or roundworms, Figure 1.09) similarly live and move about in the water films, and may consume the bacteria, fungi, and protozoa. There are numerous groups of nematodes, including those that feed on bacteria, fungi, or even other nematodes. Some parasitic nematodes feed on plants or animals – including several agricultural pest. There have been reports of nematodes which contribute to suppression of plant disease by consuming plant pathogens. Some researchers have characterized nematode
FIGURE 1.10. Nitrogen cycle demonstrating nutrient benefits from decomposition.
FIGURE 1.09. Nematode.
Comprehensive Assessment of Soil Health - The Cornell Framework 9
Soil Health Concepts - Part I
other nutrients, in their biomass. Nutrients stored in soil biota are not immediately available to plants (they are ‘immobilized’), but also are protected from environmental loss (such as nitrogen leaching or volatilization), because they are in solid form or within living cells.
An organism’s need for carbon as energy source and for nitrogen or other nutrients usually differs in magnitude and in proportion from what it consumes. To consume enough carbon, biota often consume more nitrogen than necessary, so that they excrete excess N. This is part of the important process called mineraliza-tion. In mineralization, nitrogen that has been bound to carbon in relatively large molecules (‘organic nitrogen’) is released in ‘mineral’ form as smaller, more soluble, nitrogen containing ions such as ammonium (NH4
+) or nitrate (NO3+). These can
then be taken up by plants. Mineralization is thus a process of great importance in nutrient cycling and availability (Figure 1.10, previous page). The opposite effect, immobilization, may occur as well, when the materials that the soil biota consume contain a very high ratio of carbon to nitrogen. For example, when decomposing plant materials such as straw or wood, bacteria and fungi may take up free nitrogen from their surroundings and make it less available, as little is available to them from the same material that is their carbon-rich energy source.
Much of current fertility management for agriculture relies on supplying nutrients in soluble forms as amendments. However, in some agricultural management systems, an increased emphasis is placed on maintaining soil organic matter, soil microbial diversity and activity. In these systems, as in natural or less managed systems, a significant fraction of plants’ nutrient needs can be stored in and supplied from organic materials.
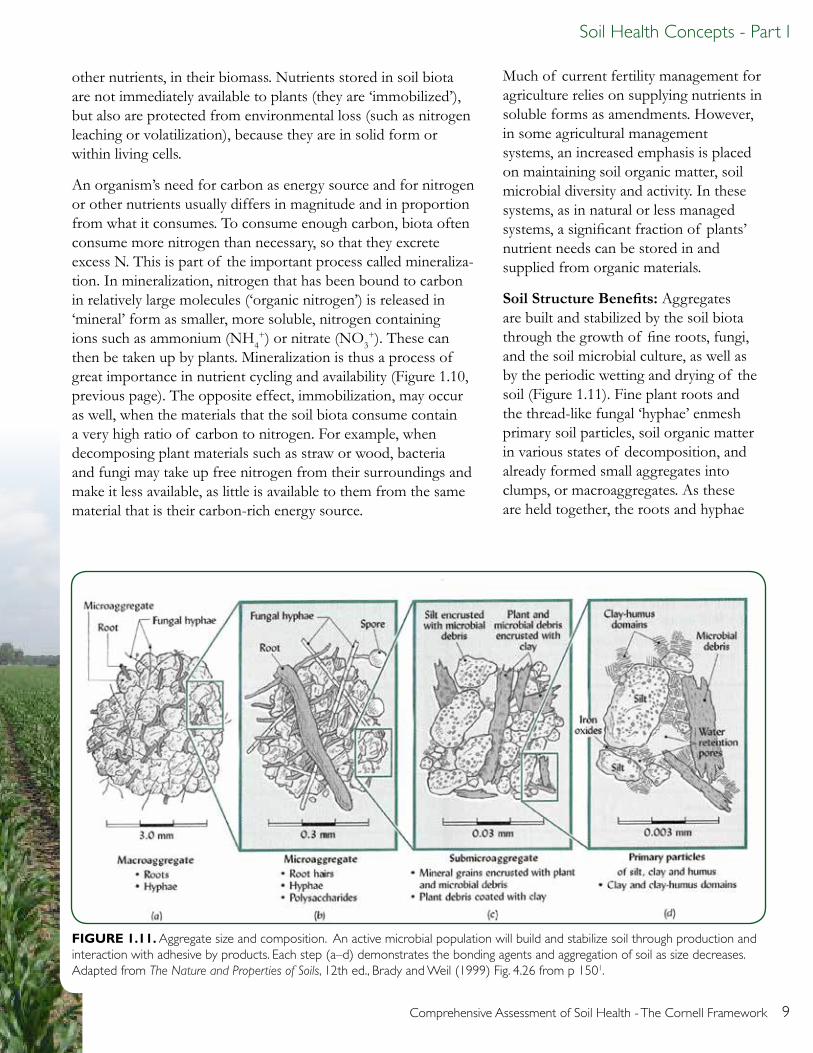
Soil Structure Benefits: Aggregates are built and stabilized by the soil biota through the growth of fine roots, fungi, and the soil microbial culture, as well as by the periodic wetting and drying of the soil (Figure 1.11). Fine plant roots and the thread-like fungal ‘hyphae’ enmesh primary soil particles, soil organic matter in various states of decomposition, and already formed small aggregates into clumps, or macroaggregates. As these are held together, the roots and hyphae
FIGURE 1.11. Aggregate size and composition. An active microbial population will build and stabilize soil through production and interaction with adhesive by products. Each step (a–d) demonstrates the bonding agents and aggregation of soil as size decreases. Adapted from The Nature and Properties of Soils, 12th ed., Brady and Weil (1999) Fig. 4.26 from p 1501.

10 Comprehensive Assessment of Soil Health - The Cornell Framework
Part I - Soil Health Concepts
N fixing bacteria: Gaseous nitrogen (N2) is a major component of atmospheric air, but plants cannot use it directly. The nodule-inducing nitrogen fixing bacteria (Rhizobium, Bradyrhizobium, and Sinorhizobium, among others) interact with legumes, such as beans, peas, soybeans, clover and vetch. The legume roots develop nodules, which house the bacterial colonies inside (Figure 1.12). Plant tissues provide sugars to the bacteria, while the bacteria convert atmospheric nitrogen into ammonia (NH3), in a process called nitrogen fixation. Ammonia is quickly converted to ammonium (NH4
+) in solution and incorporated by the plant into amino acids and other nitrogenous molecules. Sometimes more nitrogen is ‘fixed’ than is required by the plant,
release exudates that can bind the parts of the aggregates together, and also serve as food for other organisms such as bacteria, colonial unicellular yeasts, and protozoa. Microaggregates form within the macro-aggregates as soil microbes release sticky compounds that further bind soil particles together, and form gels that hold water and slowly release it as the soil dries. At the finest scales, microbial cells and debris stick to fine clay particles, and chemical bonds may form between organic matter and mineral particles as they are held close together to make very small micro-aggregates. For the biota to effectively carry out these processes, it is important for soil disturbance (such as tillage) to be minimized, and of course for there to be a carbon supply for the biota, as well as both air and water availability.
Stable soil aggregates are important for maintaining good (crumbly) soil structure or ‘tilth’, enabling adequate air exchange and water infiltration, storage, and drainage. Stable soil aggregation minimizes erosion and flooding. These processes are also critical in sequestering, or stabilizing carbon, in the form of well-decomposed organic materials protected within small pores, and tightly bound to soil mineral particles.
Symbiotic Organisms: The organisms discussed so far are free-living in the soil, and decompose and consume plant materials, exudates or secretions that plants release. Two other key groups of soil organisms are not directly involved in decomposition, but are important in soil functioning. These are important symbiotic bacteria and fungi that associate with plant roots. They include nodule-inducing nitrogen fixing bacteria (rhizobia) and mycorrhizal fungi and they live in close association with plant roots, and interact with living plants in a mutually supportive manner.
Soil Microbes Drive Many Soil Processes:
· Decompose organic matter (plant residues)
· Sequester carbon
· Recycle, store (immobilize), and release (mineralize) nutrients for sustained availability to plants
· Increase access to nutrients
· Fix nitrogen
· Stabilize and maintain soil structure
· Biologically suppress plant pests
· Parasitize and damage plants (see “Nematodes” on page 8)
· Promote plant growth
· Detoxify pollutants and clean water
FIGURE 1.12 Nodules on pea roots.

Comprehensive Assessment of Soil Health - The Cornell Framework 11
Soil Health Concepts - Part I
and so excess is released into the surrounding soil. The fixed nitrogen can also become available for other plants in the system as parts of the legume die and decompose, either through root turnover, or as residues or whole plant biomass is incorporated by biota or human management. Some free-living (not plant associated) and associative (close to roots but not in nodules) nitrogen fixation is known to occur in both natural and managed systems. However, it is the nodule-associated nitrogen fixation that is managed intentionally by inoculating the host plants (legumes) with the appropriate rhizobia, and by maintaining a legume phase in rotations and cover cropping.
Mycorrhizal fungi: Most plant roots associate with symbiotic fungi (Figure 1.13). One major group of these are called arbuscular mycorrhizal fungi. Together with plants, these fungi form joint structures called mycorrhizae (from the Greek words for fungus and root). The plant host provides sugars to the fungus, used for growth and metabolism, in exchange for nutrients. Outside of the root, the fungus grows extensively through the soil, and can reach more spaces and absorb more nutrients (especially phosphorus, which is poorly soluble) than the plant roots alone could. In addition to providing a nutrient benefit to the plant host, these fungi contribute to both plant and soil health in multiple ways. They can help the plant resist disease, and tolerate drought and saline (salty) conditions. The arbuscular mycorrhizal fungi also contribute substantially to the accumu-lation of soil organic matter and to the formation and stabilization of soil aggregates.
Soil organisms are critical to numerous biological, physical, and chemical soil processes. They interact with the plants we generally manage in agricultural systems, and with the physical soil environment that these plants grow in. They are essential parts of the functioning healthy ecosystems that soils supports, and are key contributors to the health of the soil itself.
FIGURE 1.13. Mycorrhizal fungi’s close association with plant roots form symbiotic relationships.

12 Comprehensive Assessment of Soil Health - The Cornell Framework
Part I - Soil Health Concepts
What is soil health?
The terms ‘soil health’ and ‘soil quality’ are becoming increasingly familiar worldwide. A modern consensus definition of soil health is “the continued capacity of the soil to function as a vital living ecosystem that sustains plants, animals and humans” (Natural Resources Conservation Service – USDA-NRCS, 20122; Soil Renaissance, 2014). Doran and Parkin3, in 1994, defined soil quality as “the capacity of a soil to function, within ecosystem and land use boundaries, to sustain productiv-ity, maintain environmental quality, and promote plant and animal health.”
In general, soil health and soil quality are considered synonymous and can be used interchangeably, with one key distinction conceptualized by scientists and practi-tioners over the last decades: soil quality includes both inherent and dynamic quality. Inherent soil quality refers to the aspects of soil quality relating to a soil’s natural composition and properties (soil type, as delineated by the NRCS Soil Survey) influenced by the natural long-term factors and processes of soil formation. These generally cannot be influenced by human management. Dynamic soil quality, which is equivalent to soil health, refers to soil properties that change as a result of soil use and management over the human time scale. (See example, Figure 1.14, on the following page).
Soil health invokes the idea that soil is an ecosystem full of life that needs to be carefully managed to regain and maintain our soil’s ability to function optimally. The term ‘soil health’ has been generally preferred by farmers, while scientists have generally preferred ‘soil quality’.
Important soil functions related to crop production and environ-mental quality include:
· Retaining and cycling nutrients and supporting plant growth
· Sequestering carbon
· Allow infiltration, and facilitate storage and filtration of water
· Suppressing pests, diseases, and weeds
· Detoxifying harmful chemicals
· Supporting the production of food, feed, fiber and fuel
When the soil is not functioning to its full capacity, sustainable productivity, environmental quality, and net farmer profits are jeopardized over the long term. Impaired function may result from constraints to specific and interacting soil processes (see pages 15-17). Below are some examples of the economic benefits of maintaining and improving soil health:
· Better plant growth, quality, and yield
· Reduced risk of yield loss during periods of environmental stress (e.g., heavy rain, drought, pest or disease outbreak)
· Better field access during wet periods
· Reduced fuel costs by requiring less tillage
· Reduced input costs by decreasing losses, and improving use efficiency of fertilizer, pesticide, herbicide, and irrigation applications
Healthy soil ecosystem, with organisms living within and above the soil surface. Illustration credit: Carlyn Iverson and USDA-SARE.

Comprehensive Assessment of Soil Health - The Cornell Framework 13
Soil Health Concepts - Part I
Characteristics of a healthy soil
Good soil tilthSoil tilth refers to the overall physical character of the soil in the context of its suitability for crop production. Soil with good tilth is crumbly, well structured, dark with organic matter, and has no large and hard clods (Figure 1.15).
Sufficient depthSufficient depth refers to the extent of the soil profile through which roots are able to grow to find water and nutrients. A soil with a shallow depth as a result of a compaction layer or past erosion is more susceptible to damage in extreme weather fluctuations, thus predisposing the crop to flooding, pathogen, or drought stress.
Good water storage and good drainage
During a heavy rain, a healthy soil will take in and store more water in medium and small pores, but will also drain water more rapidly from large pores. Thus, a healthy soil will retain more water for plant uptake during dry times, but will also allow air to rapidly move back in after rainfall, so that organisms can continue to thrive.
Sufficient supply, but not excess of nutrients
An adequate and accessible supply of nutrients is necessary for optimal plant growth and for maintaining balanced cycling of nutrients within the system. An excess of nutrients can lead to leaching and potential ground water pollution, high nutrient runoff and greenhouse gas losses, as well as toxicity to plants and microbial communities.
FIGURE 1.14. Dynamic soil quality- Beneficial vs. unfavorable management. Both photos are inherently the same Buxton silt loam.
Left - Management for improved soil health: tillage radish growing in long-term pasture/hay with occasional annual crops;
Right- Intensive management leading to soil degradation: long-term annual tillage and vegetable production without cover crops or other organic inputs.
Due to management differences, soil health has diverged significantly.
Crop residue retention improves soil aggregation, infiltration, and nutrient cycling in addition to increasing available water capacity, soil biota diversity and activity, and carbon sequestration. Photo credit: Edwin Remsburg and USDA-SARE.

14 Comprehensive Assessment of Soil Health - The Cornell Framework
Part I - Soil Health Concepts
Small population of plant pathogens and insect pests
In agricultural production systems, plant pathogens and pests can cause diseases and damage to the crop. In a healthy soil, the population of these organisms is low or is less active. This could result from direct competition from other soil organisms for nutrients or habitat, hyperparasitism, etc. In addition, healthy plants are better able to defend themselves against a variety of pests (somewhat analogous to the human immune system).
Large population of beneficial organisms
Soil organisms are important to the functioning of the soil. They help with cycling nutrients, decomposing organic matter, maintaining soil structure, bio-logically suppressing plant pests, etc. A healthy soil will have a large and diverse population of beneficial organisms to carry out these functions and thus help maintain a healthy soil status.
FIGURE 1.15. The effect of organic matter (OM) on the same soil type managed using conventional plow tillage (left) or zone tillage for 10 years (right). Soil with good tilth is crumbly, well structured, dark with OM and has no large and hard clods.
Low weed pressure
Weed pressure is a major constraint in crop production. Weeds compete with crops for water and nutrients that are essential for plant growth. Weeds can block sunlight, interfere with stand establishment and harvest and cultivation operations, and harbor disease causing pathogens and pests.
Free of chemicals and toxinsthat may harm the cropHealthy soils are either devoid of excess amounts of harmful chemicals and toxins, or can detoxify or bind such chemicals. These processes make these harmful compounds unavailable for plant uptake, due to the soil’s richness in stable organic matter and diverse microbial communities.
Resistant to degradationA healthy, well aggregated soil full of a diverse community of living organisms is more resistant to adverse events including erosion by wind and rain, excess rainfall, extreme drought, vehicle compaction, disease outbreak, and other potentially degrading influences.
Resilience when unfavorable conditions occurA healthy soil will rebound more quickly after a negative event, such as harvesting under wet soil conditions, or if land constraints restrict or modify planned rotations.
Characteristics of a healthy soil (continued)

Comprehensive Assessment of Soil Health - The Cornell Framework 15
Soil Health Concepts - Part I
Soil CompactionCompaction can occur at the surface and subsurface soil profile. Be sure that a soil is ready for equipment prior to tilling.
Contributing factors· Traffic or tillage when soil is wet (‘plastic’)
· Heavy equipment and loads
· Uncontrolled traffic patterns
Can result in· Reduced root growth in surface and subsurface soils
· Limited water infiltration, resulting in runoff, erosion, ponding and poor aeration
· Drought sensitivity due to reduced water storage and reduced rooting
· Reduced nutrient access due to poor root growth and restricted water flow
· Increased pathogen pressure due to poor drainage and to plant stress
· Increased cost of tillage and lower yields
Common soil constraintsIt is important to recognize soil constraints that limit crop productivity, farm sustainability, and environmental quality. In this way management practices can be adjusted to alleviate these problems. Below is a listing of soil constraints commonly observed in the Northeast region of the U.S., along with some contributing factors and resulting soil conditions.
Tillage when the soil is too wet (plastic) resulting in clodding and compaction.
Ruts resulting from late fall harvest when soils are wet.
Surface crusting in mid-spring.
Poor AggregationPoorly aggregated soils are more susceptible to erosion and runoff which increases risk of lost productivity. Aggregates are formed whenever mineral and organic particles clump together.
Contributing factors· Intensive tillage
· Limited use of soil building crops and soil cover
· Low active rooting density
· Limited duration of root presence during the year
· Limited organic additions
· Low biological activity to stabilize aggregates
Can result in· Crusting and cracking
· Poor seedling emergence and stand establishment
· Poor water infiltration and storage
· Increased occurrence of erosion and runoff
· Reduced root growth
· Less active microbial communities
· Reduced aeration
· Reduced drought resistance due to decreased water intake during rainfall events

16 Comprehensive Assessment of Soil Health - The Cornell Framework
Part I - Soil Health Concepts
High Pathogen PressureRoot pathogenesis negatively impacts plant growth and root effectiveness as well as minimizes contributions from microbiota in proper functioning of important soil processes.
Contributing factors
· Poorly planned crop rotations and low rotational diversity
· Ineffective residue management
· Poor sanitary practices (equipment, tools, vehicles not cleaned between operations)
· Low microbial diversity, resulting in reduced suppressiveness
· Poor physical soil functioning, particularly waterlogging, or other plant stress inducing conditions
Can result in · Damaged and diseased roots · Uneven and poor growth · Reduced yields, crop quality, and profits
Weed PressureWhen plants are unhealthy and “weak” they are less able to compete against weeds for water and nutrients and defendthemselves against pests.
Contributing factors· Poor crop rotations and omission of cover crops
· Resistance to herbicides
· Poor weed management and timing of management practices
Can result in· Poor stand establishment and crop growth
· Poor crop quality and reduced yield
Weedy beet field.
Symptoms of root rot diseases on pea roots.
Application of liquid manure to increase water and nutrient retention.
· Increased disease and pest damage
· Interference with cultural practices and harvest
· Increased cost of weed control
Low Water and Nutrient RetentionLower organic matter in soils indicates poor structure and lower water holding capacity. Therefore nutrient mobility and plant growth will be limited.
Contributing factors· Low organic matter and resulting poor structure, water
holding capacity, and exchange capacity
· Poor retention and biological recycling of nutrients in biomass and soil organic matter
· Excessive tillage
· Insufficient use of soil building crops
Can result in· Ground and surface water pollution
· Reduced microbial community
· Nutrient deficiencies and poor plant growth
· Drought stress

Comprehensive Assessment of Soil Health - The Cornell Framework 17
Soil Health Concepts - Part I
Salinity and SodicitySoils become saline when the concentration of soluble salts in the soil profile becomes excessive. Sodic soils are those with excessive sodium ion concentrations, relative to magnesium and calcium, measured by the sodium adsorption ratio. Salinity and sodicity are quite different from each other. These conditions may occur together or separately.
Contributing factors· Frequently found in semi-arid and arid climates, especially
under irrigated systems
· Common in the Northeast only in high tunnels and greenhouses, which could be considered to be artificial “irrigated deserts”
Can result in· Loss of crop yield and quality
· Loss of aggregation and thus infiltration and drainage functions if sodicity is the problem
Saline/sodic soil.
Growth inhibition in soil contaminated with copper and zinc.
Heavy Metal Contamination4
Contamination from past human activities, such as high traffic, commercial activity, spills, or pesticide application, can negatively impact soil and plant health.
Contributing factors· Common in urban areas and other sites with past use of
contaminant sources such as lead paint, fertilizers, pesticides (e.g., lead arsenate use on orchard land)
· Past activities such as high traffic, industrial or commercial activity, treated lumber, petroleum spills, automobile or machine repair, junk vehicles, furniture refinishing, fires, landfills, or garbage dumps
· Naturally occurring high heavy metal concentrations are generally rare in the Northeast
Can result in· Higher risks of human exposure when children or adults
swallow or breathe in soil particles or eat food raised in or on contaminated soil
· Inhibition of soil biological activity
· Plant toxicity, and reduced yield and/or crop quality

18 Comprehensive Assessment of Soil Health - The Cornell Framework
Part I - Soil Health Concepts
Cited References1 Brady, N.C., and R.R. Weil. 1999. The Nature and Properties of Soil. 12th ed. Upper Saddle River, New Jersey:
Prentice Hall. Print.
2 Natrual Resources Conservation Services: Soil Health. 2012. Retrieved June 23, 2016 from http://www.nrcs.usda.gov/wps/portal/nrcs/main/soils/health/.The Soil Renaissance accepted this definition in 2014
3 Doran, J.W., and T.B. Parkin. 1994. Defining and assessing soil quality. p. 3-21. In: J.W. Doran et al., (ed.) Defining Soil Quality for a Sustainable Environment. SSSA Spec. Publ. No. 35, Soil Sci. Soc. Am., Inc. and Am. Soc. Agron., Inc., Madison, WI.
4 Content adapted from resources developed by the Cornell Waste Management Institute. Soil Quality and Testing and the Healthy Soils, Healthy Communities Project. 2007. (http://cwmi.css.cornell.edu/soilquality.htm and http://cwmi.css.cornell.edu/healthysoils.htm.

Comprehensive Assessment of Soil Health - The Cornell Framework 19
Soil Health Assessment - Part II
Part IISoil Health Assessment

20 Comprehensive Assessment of Soil Health - The Cornell Framework
Part II - Soil Health Assessment
In-field soil health assessmentQualitative, on-farm, in-field assessment of soil health does not need to involve special analyses, only the informed observation and interpretation of soil characteristics. This is usually done by visual assessment, but the smell and feel of soil may also be involved. Field test kits for measuring several indicators are also available (e.g. NRCS soil quality test kit). While this approach is more subjective and therefore can reflect user bias, the results can be very informative in making management decisions when detailed guidelines and training have been provided. Guided, in-field assessment can also be particularly effective to increase awareness and understanding of how important it is to maintain healthy soils, and the importance of key soil processes. Some specific soil indicators, such as compaction measured using a penetrometer in the root zone, are always measured better directly in the field than in a laboratory.
Developing and using in-field assessments:· Participatory processes in developing qualitative soil health
monitoring procedures locally have had significant educational value and opened up communication among farmers and between farmers and other agriculture professionals.
· A number of score cards and kits for measuring soil health in the field have been developed (Figure 2.01, following page). These have used more than 30 physical indicators and more than 10 biological, chemical, and crop observation based indicators of soil health. In this approach, soil physical characteristics might be scored for soil ‘feel’, crusting, water infiltration, retention or drainage, and compaction. Soil biological properties might include soil smell (low score for sour, putrid or chemical odors vs. high score for ‘earthy,’ sweet, fresh aroma), soil color and mottling (which reflects balance of aerobic vs. anaerobic bacterial activity, among other things), and earthworm or overall biological activity by in-field respiration measures. Crop indicators of soil functioning such as root proliferation and health, signs of compaction (such as thick angular roots), legume nodulation, and signs of residue decomposition can also provide useful information.
· The rating scales used in soil health score cards vary from just a few categories (“poor, fair, or good”) to scales of 1 to 10. The descrip-tions that define categories or rating scales are best based on local terminology and preferences. High quality photographs are an excellent way to train users and achieve somewhat standardized scoring (Figure 2.02.).
Crusting at the soil surface.
A subsoil plow pan restricts root growth and decreases resilience during extreme weather.
Points to remember:
· Training should include information on sampling, standardized verbal descrip-tions and, if possible, photos that facilitate uniform scoring and keep users on track. Sufficient information regarding interpreta-tion of results is essential
· To the extent possible, comparisons of measurements should be made between samples taken at a similar time of year in relation to field operations, and at a similar soil moisture content and soil temperature

Comprehensive Assessment of Soil Health - The Cornell Framework 21
Soil Health Assessment - Part II
BUILDING SOILS FOR BETTER CROPS: SUSTAINABLE SOIL MANAGEMENT
52
extremes, and its behavior is typical of that exhibited by a well-aggregated loam soil (figures 5.4c, 5.5). Such a soil has a sufficient amount of large pore spaces between the aggregates to provide adequate drainage and aera-tion during wet periods, but also has enough small pores and water-holding capacity to provide water to plants and soil organisms between rainfall or irrigation events. Besides retaining and releasing water at near optimum quantities, such soils also allow for good water infiltra-tion, thereby increasing plant water availability and reducing runoff and erosion. This ideal soil condition is therefore characterized by crumb-like aggregates, which are common in good topsoil.
AVAILABLE WATER AND ROOTINGThere is an additional dimension to plant-available water capacity of soils: The water in the soil may be available, but roots also need to be able to access it, along with the nutrients contained in the water. Consider the soil from the compacted surface horizon in figure 5.6 (left), which was penetrated only by a single corn root with few fine lateral rootlets. The soil volume held sufficient water, which was in principle available to the corn plant, but the roots were unable to penetrate most of the hard soil. The corn plant, therefore, could
not obtain the moisture it needed. The corn roots on the right (figure 5.6) were able to fully explore the soil volume with many roots, fine laterals, and root hairs, allowing for better water and nutrient uptake.
Similarly, the depth of rooting can be limited by compaction. Figure 5.7 shows, on the right, corn roots from moldboard-plowed soil with a severe plow pan. The roots could not penetrate into the subsoil and were therefore limited to water and nutrients in the plow layer. The corn on the left was grown in soil that had been subsoiled, and the roots were able to reach about twice the depth. Subsoiling opened up more soil for
CHAPTER 5 SOIL PARTICLES, WATER, AND AIR
Figure 5.6. Left: Corn root in a compacted soil cannot access water and nutrients from most of the soil volume. Right: Dense rooting allows for full exploration of soil water and nutrients.
Figure 5.7. Corn roots on the right were limited to the plow layer due to a severe compaction pan. Roots on the left penetrated into deeper soil following subsoiling and could access more water and nutrients.
FIGURE 2.02. While the corn root in a compacted soil (left) cannot access water and nutrients from most of the soil volume, dense rooting (right) allows for full access. High quality photographs like these are an excellent way to train users and achieve standardized scoring. Source: Building Soils for Better Crops
FIGURE 2.01. Example score card from the Maryland Soil Quality Assessment Book (1997) published by the Natural Resource Conservation Service (available online as a pdf file at bit.ly/NRCSSoilHealthCard).
Date
Acres
Type Quantity Price
Field Notes/Inputs Farm I.D.
Field I.D.
Crop
Inputs
Fertilizer
Lime
Manure
CoverCrops
Pesticides
Other
Equipment
Used
Problems, Comments, Weather Conditions
Yields
Amount
Units
Moisture
Price
Assessment Sheet
Medium Good Soil Quality Poor
Date__________________ Crop______________
Farm/Field ID _________________________
7 8 91 2 3 4 5 6INDICATORS
Earthworms
Organic Matter Color
Organic Matter Roots/Residue
SubsurfaceCompaction
Tilth/Friability Mellowness
Erosion
Capacity Water Holding
infiltrationDrainage
Crop Condition
pH
Nutrient Holding Capacity
Other (write in)
Other (write in)

22 Comprehensive Assessment of Soil Health - The Cornell Framework
Part II - Soil Health Assessment
Development of Cornell ’s Comprehensive Assessment of Soil HealthSoil health is a concept that deals with the integration and optimization of the chemical, physical, and biological processes of soil that are important for sustained productivity and environmental quality (Figure 2.03). Over the years the concepts and understanding of the importance of the soils’ chemical and even physical properties have been well accepted in the agricultural community as a whole. However, it has not been until more recently that the importance of understanding and managing the soil’s biological properties has moved beyond a few leading innovative producers and scientists, to become a focus in broader circles. Scientific research and a larger group of producers are now making significant progress on assessing and managing soil biological functioning in diverse agricultural production systems.
While soil nutrient (chemical) testing has long been available to farmers, physical and especially biological testing had largely remained only in research labs until the first version of the Cornell Assessment of Soil Health was made publicly available in 2006. As the stakeholder community converges on standards for more comprehensive assessment of soil health, and national awareness is bringing about wide adoption, we hope that public and private labs integrate more comprehensive soil health testing, and management suggestions, into their offerings. This can lead to a future where soil testing will involve a more compre-hensive testing of soil health for the average land manager.
FIGURE 2.03. The concept of soil health deals with integrating the physical, biological and chemical components of the soil. Adapted from the Rodale Institute.

Comprehensive Assessment of Soil Health - The Cornell Framework 23
Soil Health Assessment - Part II
Our approachThe Cornell Soil Health Team has been working to address soil degradation issues that have resulted in reduced soil health, lower crop productivity and farm profitability. Among the causes of soil degradation are soil compaction, surface crusting, low organic matter, increased pressure and damage from diseases, weeds, insects and other pests, as well as lower abundance, activity, and diversity of beneficial organisms. To address these issues, a group of interested growers, extension educators, researchers and private consultants and funders established a Program Work Team with support from Cornell Cooperative Extension in the early 2000’s. One of the major accomplishments was the development of an initial cost-effective protocol for assessing the health status of soils in New York and the Northeast region.
TABLE 2.01. Potential indicators that were initially evaluated for use in the soil health assessment protocol.
Physical
Texture
Bulk density
Macro-porosity
Meso-porosity
Micro-porosity
Available water capacity
Residual porosity
Penetration resistance at 10 kPa
Saturated hydraulic conductivity
Dry aggregate size (<0.25 mm)
Dry aggregate size (0.25 - 2 mm)
Dry aggregate size (2 - 8 mm)
Wet aggregate stability (0.25 - 2 mm)
Wet aggregate stability (2 - 8 mm)
Surface hardness with penetrometer
Subsurface hardness with penetrometer
Field infiltrability
Biological
Root pathogen pressure assessment
Beneficial nematode population
Parasitic nematode population
Potentially mineralizable nitrogen
Cellulose decomposition rate
Particulate organic matter
Active carbon
Weed seed bank
Microbial respiration rate
Soil proteins
Organic matter content
Chemical
Phosphorus
Nitrate nitrogen
Potassium
pH
Magnesium
Calcium
Iron
Aluminum
Manganese
Zinc
Copper
Exchangeable acidity
Salinity
Sodicity
Heavy metals
The protocol has been revised over the years, and is the outcome of a process where many potential indicators were evaluated for their use in standard-ized, rapid, quantitative assessment of soil health based on relevance to key soil processes, response to management, complexity of measurement, and cost (Table 2.01). An electronic copy of the current Standard Operating Procedures is available at bit.ly/SoilHealthSOPs.
In order to evaluate the many indicators for soil health assessment, soil samples were collected from replicated research trials, grower demonstration trials and from fields of interested growers from across New York State (Figure 2.04, following page) and later Pennsylvania, Vermont, Maryland, New Hampshire, and other parts of the Northeast. The replicated research sites represent different vegetable and field crop production systems being managed using different practices in various combinations.

24 Comprehensive Assessment of Soil Health - The Cornell Framework
Part II - Soil Health Assessment
Legend:Replicated research site
Grower demonstration site
Additional grower site 2005
Additional grower site 2006
Regional sub-team
FIGURE 2.04. The soil health research, demonstra-tion and field sampling sites that were sampled for the initial development of the soil health assessment protocol. A broader data set from the Northeast was used in later updates to the assessment.
FIGURE 2.05. The 14-acre long-term soil health research site at Gates Farm in Geneva, NY was established in 2003. The 72 plots represent three tillage systems, three cover crops and two rotation treatments replicated four times. One rotation (plots with green vegetation) emphasizes continuous high-value vegetable production and another rotation includes season long soil-building crops (plots with corn residue).
For example, the Gates Farm in Geneva, NY is a 14-acre research site that consists of a total of 72 plots which represent three tillage (no-till/ridge-till, strip-till, and conventional tillage), three cover crops (no cover, rye, and vetch), and two rotation treatments. One rotation emphasizes continuous high-value vegetable production, while the second rotation includes season long soil-building crops. The grower demonstration sites are side-by-side comparisons of different management practices such as the use of a winter rye cover crop versus no cover crop or using strip tillage versus conventional moldboard plowing prior to planting sweet corn (Figure 2.05). Numerous individual fields of interested growers were also initially sampled in cooperation with county educators in order to build a database on the health status of Northeast soils. The selection of the subset of indicators used in the soil assessment protocol is described further on pages 25-26.

Comprehensive Assessment of Soil Health - The Cornell Framework 25
Soil Health Assessment - Part II
Comprehensive Assessment of Soil Health OverviewThe Cornell Comprehensive Assessment of Soil Health (CASH) protocol emphasizes the integration of soil biological, physical, and chemical measurements. These measurements include soil texture (to help interpret other measured indicators), available water capacity, field pen-etrometer resistance, wet aggregate stability, organic matter content, soil proteins, respiration, active carbon, and macro- and micro-nutrient content assessment. Additional indicators are available as add-ons, including root pathogen pressure, salinity and sodicity, heavy metals, boron and potentially mineralizable nitrogen. These measurements were selected from 42 potential soil health indicators (page 23, Table 2.01) that were evaluated for:
· sensitivity to changes in soil management practices;
· ability to represent agronomically and environmentally important soil processes;
· consistency and reproducibility;
· ease and cost of sampling;
· cost of analysis;
· ease of interpretation for users.
The results of these measurements have been synthesized into a grower-friendly comprehensive soil health assessment report with indicator scores, constraint identification, and management suggestions. This report can initially be used by agricultural service providers, consultants and growers as a baseline assessment and guide to prioritiza-tion of management focus. Subsequent sampling and analysis of the same field can help determine the impact of implemented soil management practices on soil health. The report is explained in further detail on pages 72-76. Table 2.02 on the following page provides a brief description of each indicator. More detailed descriptions, as well as the basic methodology, how each indicator relates to the functioning of the soil, the interpretive scoring function used to assign a rating score, and comments on managing identified constraints can be found on pages 37–71.
This framework facilitates expansion with future indicators, especially biological assessments, as these become more cost effective and interpretable. It also allows for region-specific or crop-specific indicators or revised scoring approaches for individual indicators, as further implementa-tions of the framework are established.
See the Comprehensive Assessment of Soil health website for the most up-to-date package offerings and pricing: soilhealth.cals.cornell.edu.
Why assess soil health?· Increase awareness of soil health
· Understand constraints beyond nutrient deficiencies and excesses
· Target management practices to alleviate soil constraints
· Monitor soil improvement or degradation resulting from management practices
· Facilitate applied research – compare management practices to develop recommendations for farm and field specific soil health management planning
· Land valuation – facilitate the realization of equity embodied in healthier soils
· Enable assessment of farming system risk
Indicator Descriptions ..........................26
Soil Sampling Protocol ......................... 27Materials needed for sampling .................27
Sampling design ................................................27
Steps for soil sampling .................................28
Soil sample storage requirements: .....................................................29
Soil sample packaging and shipping requirements: ..................................29
Submission Form ................................... 30
Regulated Soils ........................................31
Scoring Functions .................................. 32
Scoring Types ..........................................36
Indicator Lab Protocols ........................37
Soil Health Assessment Report...........72

26 Comprehensive Assessment of Soil Health - The Cornell Framework
Part II - Soil Health Assessment
Available Water Capacity: reflects the quantity of water that a disturbed sample of soil can store for plant use. It is the difference between water stored at field capacity and at the wilting point, and is measured using pressure chambers.
Surface Hardness: is a measure of the maximum soil surface (0 to 6 inch depth) penetration resistance (psi), or compaction, determined using a field penetrometer.
Subsurface Hardness: is a measure of the maximum resistance (psi) encountered in the soil between 6 to 18 inch depths using a field penetrometer.
Aggregate Stability: is a measure of how well soil aggregates resist disintegration when hit by rain drops. It is measured using a standardized simulated rainfall event on a sieve containing soil aggregates between 0.25 and 2.0 mm. The fraction of soil that remains on the sieve determines the percent aggregate stability.
Organic Matter: is a measure of all carbonaceous material that is derived from living organisms. The percent OM is determined by the mass of oven dried soil lost on combustion in a 500◦C furnace.
Soil Protein: is a measure of the fraction of the soil organic matter which contains much of the organically bound N. Microbial activity can mineralize this N and make it available for plant uptake. This is measured by extraction with a citrate buffer under high temperature and pressure.
Soil Respiration: is a measure of the metabolic activity of the soil microbial community. It is measured by re-wetting air dried soil, and capturing and quantifying carbon dioxide (CO2) produced.
Active Carbon: is a measure of the small portion of the organic matter that can serve as an easily available food source for soil microbes, thus helping fuel and maintain a healthy soil food web. It is measured by quantifying potassium permanganate oxidation with a spectrophotometer.
Add-on Indicators:
Root Pathogen Pressure Rating: is a measure of the degree to which sensitive test-plant roots show symptoms of disease when grown in standardized conditions in assayed soil. Assessed by rating washed roots through visual inspection for disease symptoms.
Potentially Mineralizable Nitrogen: is a combined measure of soil biological activity and substrate available to mineralize nitrogen to make it available to the plant. It is measured as the change in mineralized plant-available nitrogen present after a seven day anaerobic incubation.
Soil Chemical Composition: a standard soil test analysis package measures levels of pH and plant nutrients. Measured levels are interpreted in this assessment’s framework of sufficiency and excess but no crop specific recommendations are provided.
Add-on Indicators:
Salinity and Sodicity: Salinity is a measure of the soluble salt concentration in soil, and is measured via electrical conductivity. Sodicity is a calculation of the sodium absorption ratio (SAR) and is measured using ICP spectrometry to determine Na+, Ca2+, Mg2+ concentrations and using an equation to calculate the absorption ratio.
Heavy Metals: is a measure of levels of metals of possible concern to human or plant health. They are measured by digesting the soil with concentrated acid at high temperature.
PHY
SIC
AL
BIO
LOG
ICA
LC
HEM
ICA
L
TABLE 2.02. Indicators of the Comprehensive Assessment of Soil Health and what they mean.

Comprehensive Assessment of Soil Health - The Cornell Framework 27
Soil Health Assessment - Part II
Materials list• 1 large bucket for each sample and one for supplies• 2 one-gallon freezer storage bag for each sample• Clipboard and Submission Form (bit.ly/CASHforms)• Permanent marker and/or pen• Straight shovel (sharpshooter or drain spade style)• Penetrometer (optional); Contact lab to borrow• Cooler for in-field sample storage and transfer• Ice pack(s) (optional); Only needed for hottest days
Field sampling design• ASK YOUR BEST QUESTION! Clearly define sampling goals and number of necessary samples.
• Define sampling goals; i.e. to assess the current status of a management unit, to identify and trouble-shoot constraints in a particular problem area, to compare between different areas on a farm, etc.
• Determine the number of samples to be taken. Decide whether one sample will adequately represent a management unit, or whether an area should be split to compare multiple units. Fields should be divided into sampling units with differences in soil type, management practices, crop growth, yield, etc.
A. Sampling for general purposes (1 sample)• Ideal for sampling uniform fields or areas where you want to assess general needs.• Baseline assessment before applying treatments.• Typical in-field soil sub-sample collection strategy.
Example A (Figure 2.07 A): In this instance, identify locations within the area you would like to test that are representative of the field or plot. Borders and irregular areas should be avoided, unless a sample is specifically being collected from those areas to identify constraints.
B. Sampling for troubleshooting
(2 or more separate samples)• Ideal for areas with uneven crop performance or
for comparing zones, ‘X’ vs. ‘Y’, for example.• Targeted soil sampling from representative
areas of each zone.Example B: In this instance, identify multiple locations within the two or more areas you would like to test. You don’t need to sample the entire field. With targeted sampling, focus on represen-tative areas that will answer a particular question. For example, how is the 2nd year of no-till in zone X affecting the soil health status compared to the long-term plow-till in zone Y?
Soil Sampling ProtocolPlease use our two-page field sheet or view the eight minute video available at bit.ly/SoilHealthSampling
Example A: General field sampling (1 sample)
FIGURE 2.07 A and B. Examples of different sampling goals and how they may affect sampling strategies.
Example B: Troubleshooting (2 or more samples)
FIGURE 2.06. Materials needed to collect at least one soil health sample.
B
A
zone X
zone Y

28 Comprehensive Assessment of Soil Health - The Cornell Framework
Part II - Soil Health Assessment
Soil sampling considerationsSoil Health sampling guidelines are similar to those of the standard nutrient analysis. Soil samples can be taken at any time of the year. It is best, however, to establish a regular sampling date, around the same month, to minimize seasonal variation in your results and records. At each of the 5-10 identified sampling stops, collect two soil sub-samples at least 15 feet apart (see field diagrams, previous page). Samples should be taken when soils are at field capacity, before field operations, at a minimum 6” depth. Avoid irregular areas unless a sample is
Steps for taking a soil sample at each locationA. Remove surface debris (Figure 2.08 A).B. Use a drain spade to dig a small hole about 8’’ deep. From the side of the hole take a vertical, rectangular slice of soil 6” deep and about 2” thick.C1 Remove any extra soil to ensure that the sample is the same width at the top and bottom of the slice.
You want a rectangular, 6” deep x 2” thick slice of soil, the width of the spade. It is important to collect the same amount of soil through the 6” sample profile so that it is not biased with more soil from the surface compared to the subsurface.
C2 Place into clean pail.D. Optional - At each of the 10 sub-sample locations, collect soil hardness information with a penetrometer.
Record maximum hardness (in psi) from the 0-6” and at the 6-18” depth ranges on the Submission Form.E. Repeat steps A – D to collect the remainder of the sub-samples. Mix thoroughly and transfer 3-6 cups of
soil into a clearly labeled one-gallon re-closable freezer bag. The amount of soil required depends on the analysis package selected. See Table 2.03 on the following page for a brief description of each package.
specifically being collected from a problem area to identify constraints.
Following these considerations facilitates proper mixing of sub-samples, prevents soils from smearing during sampling and transport, and ensures appropriate interpretation of field penetration resistance measurements.
NOTE: We do not recommend using a standard soil probe as more cores will need to be collected than a spade to obtain the necessary amount of soil for analysis, and more physical smearing will result, impairing physical indicator measurements.
FIGURE 2.08 A - E. The steps of taking a soil health sample. The microorganisms in the soil are sensitive to heat. Keep samples out of direct sunlight and keep as cool as possible during sampling and storage. Store samples in a refrigerator or cold room after returning from the field and ship to Cornell as soon as possible.
A B CI
C2 D
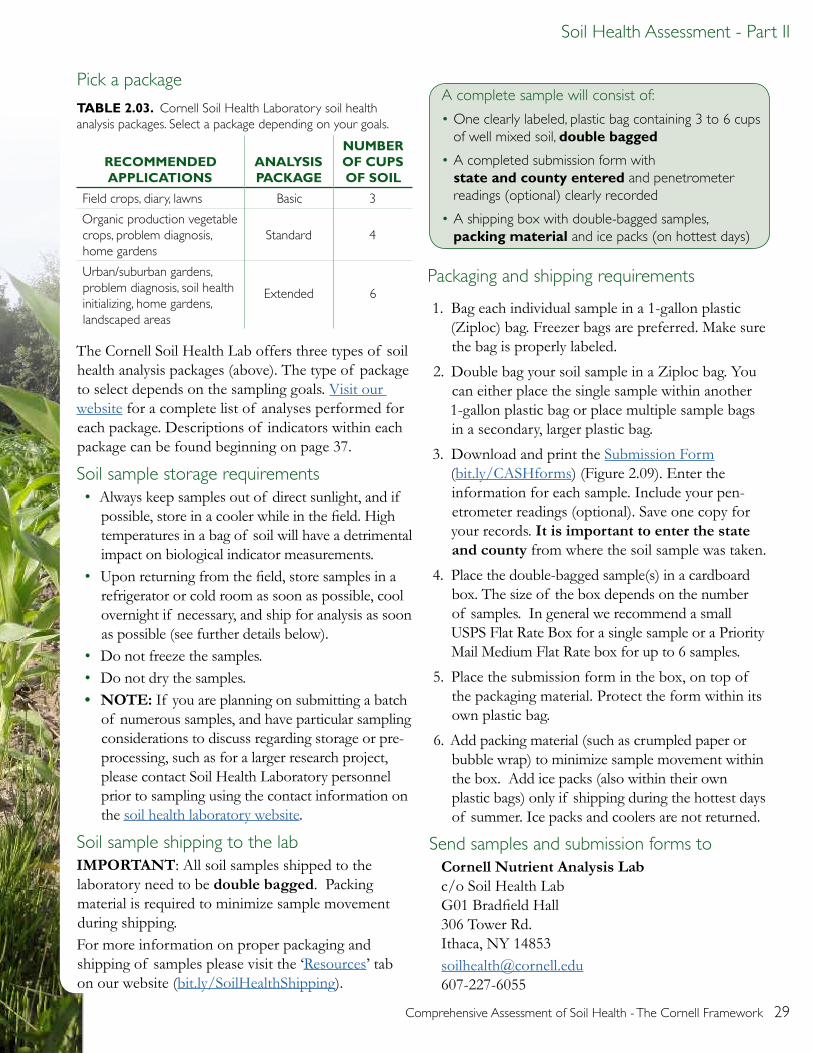
Comprehensive Assessment of Soil Health - The Cornell Framework 29
Soil Health Assessment - Part II
Pick a package
RECOMMENDED APPLICATIONS
ANALYSIS PACKAGE
NUMBER OF CUPS OF SOIL
Field crops, diary, lawns Basic 3
Organic production vegetable crops, problem diagnosis, home gardens
Standard 4
Urban/suburban gardens, problem diagnosis, soil health initializing, home gardens, landscaped areas
Extended 6
The Cornell Soil Health Lab offers three types of soil health analysis packages (above). The type of package to select depends on the sampling goals. Visit our website for a complete list of analyses performed for each package. Descriptions of indicators within each package can be found beginning on page 37.
Soil sample storage requirements• Always keep samples out of direct sunlight, and if
possible, store in a cooler while in the field. High temperatures in a bag of soil will have a detrimental impact on biological indicator measurements.
• Upon returning from the field, store samples in a refrigerator or cold room as soon as possible, cool overnight if necessary, and ship for analysis as soon as possible (see further details below).
• Do not freeze the samples.• Do not dry the samples.• NOTE: If you are planning on submitting a batch
of numerous samples, and have particular sampling considerations to discuss regarding storage or pre-processing, such as for a larger research project, please contact Soil Health Laboratory personnel prior to sampling using the contact information on the soil health laboratory website.
Soil sample shipping to the labIMPORTANT: All soil samples shipped to the laboratory need to be double bagged. Packing material is required to minimize sample movement during shipping.For more information on proper packaging and shipping of samples please visit the ‘Resources’ tab on our website (bit.ly/SoilHealthShipping).
Send samples and submission forms toCornell Nutrient Analysis Labc/o Soil Health LabG01 Bradfield Hall306 Tower Rd.Ithaca, NY [email protected] 607-227-6055
Packaging and shipping requirements
1. Bag each individual sample in a 1-gallon plastic (Ziploc) bag. Freezer bags are preferred. Make sure the bag is properly labeled.
2. Double bag your soil sample in a Ziploc bag. You can either place the single sample within another 1-gallon plastic bag or place multiple sample bags in a secondary, larger plastic bag.
3. Download and print the Submission Form(bit.ly/CASHforms) (Figure 2.09). Enter the information for each sample. Include your pen-etrometer readings (optional). Save one copy for your records. It is important to enter the state and county from where the soil sample was taken.
4. Place the double-bagged sample(s) in a cardboard box. The size of the box depends on the number of samples. In general we recommend a small USPS Flat Rate Box for a single sample or a Priority Mail Medium Flat Rate box for up to 6 samples.
5. Place the submission form in the box, on top of the packaging material. Protect the form within its own plastic bag.
6. Add packing material (such as crumpled paper or bubble wrap) to minimize sample movement within the box. Add ice packs (also within their own plastic bags) only if shipping during the hottest days of summer. Ice packs and coolers are not returned.
A complete sample will consist of:
• One clearly labeled, plastic bag containing 3 to 6 cups of well mixed soil, double bagged
• A completed submission form with state and county entered and penetrometer
readings (optional) clearly recorded
• A shipping box with double-bagged samples, packing material and ice packs (on hottest days)
TABLE 2.03. Cornell Soil Health Laboratory soil health analysis packages. Select a package depending on your goals.

30 Comprehensive Assessment of Soil Health - The Cornell Framework
Part II - Soil Health Assessment
page 2
Sample #
1
2
3
4
5
6
7
8
9
10
location 8 0-6" 6-18"
location 1 0-6" 6-18"
location 2 0-6" 6-18"
location 3 0-6" 6-18"
location 4 0-6" 6-18"
location 5 0-6" 6-18"
location 6 0-6" 6-18"
location 7 0-6" 6-18"
Soil penetrometer data- record the highest number encountered in the 0-6" and the 6-18" depth for each subsample location
BASIC Soil Health Analysis Package $60/sample (sample size 3 cups)Recommended applications: field crops, dairy, lawns > Soil pH, Organic Matter, Modified Morgan Extractable P, K, micronutrients > Wet Aggregate Stability > Soil Respiration > Surface , sub-surface Hardness interpretation (optional- you provide the penetrometer readings)
STANDARD Soil Health Analysis Package $110/sample (sample size 4 cups)Recommended applications: organic production, veg crops, problem diagnosis, home gardens > Soil pH, Organic Matter, Modified Morgan Extractable P, K, micronutrients > Soil Texture > Active Carbon> Wet Aggregate Stability > Soil Respiration > Available Water Capacity > Soil Protein > Surface and sub-surface Hardness (optional- you provide the penetrometer readings)
EXTENDED Soil Health Analysis Package $170/sample (sample size 6 cups)Recommended applications: urban/ suburban gardens, problem diagnosis, soil health initializing, home gardens, landscaped areas, corner lots, brownfields> Includes the STANDARD Soil Health Analysis Package PLUS> Add-on Soluble Salts> Add-on Heavy Metal Screening> Add-on Bean Root Bioassay
Useful Add-on Tests for the BASIC and STANDARD Package
Soluble Salts $8/sampleRecommended applications: high tunnels, lawns and urban areas, heavily composted areas, home gardens, landscaped areas
Heavy Metal Screening $30/sampleRecommended applications: urban areas, home gardens, playgrounds, brownfields
Bean Root Bioassay $20/sampleRecommended applications: home gardens, vegetables, problem areas
Hot Water-soluble Boron $15/sampleRecommended applications: small fruits, vegetables, home gardens
All of the soil analyses found in the Packages or
the Add-ons listed above are available
from the Cornell Nutrient Analysis Lab.
Use the Submission form S at this link:
http://cnal.cals.cornell.edu/forms/pdfs/CNAL_
Form_S.pdf
15
2017 Cornell Assessment of Soil Health Submission Form - PRINTABLE spreadsheet page 1
State (sample origin)
County (sample origin)
Out- side U.S.?
Ag Service Provider Name
REQUIRED REQUIRED
1
2
3
4
5
6
7
8
9
10
TESTING PACKAGE
Basic, Standard or Extended
(see page 2)
check enclosed
ADDITIONAL TESTING? Choose: Soluble Salts,
Heavy Metal Screening, Root Bioassay,
Water-soluble Boron
DATE SAMPLED (mm/dd/y
y)
Grower Mailing Address
Ag Service Provider Email Address
Ag Service Provider
Phone Number
SOIL NAME (IF KNOWN)
Tillage Type 2017
1 = notill 2 = 1-7" 3 = 7-9" 4 = > 9"
CROP INFORMATION* *Find the Crop Codes at
http://bit.ly/2fjULu1 2015 2016 2017
GPS COORDINATES for Field or Sample
*Online help at http://itouchmap.com/
latlong.html
Who is paying for the samples?
(Name or Email) Grower NameGrower Email
Address
SAMPLE NUMBER
FIELD I.D. OR SAMPLE NAME
(WRITTEN ON SAMPLE BAG)
IMPORTANT Information regarding shipping soils: Your soil samples may be from a county within the U.S. which has
restrictions on soil movement. Some areas are PROHIBITED meaning you cannot bag, box or ship from these areas.
Visit bit.ly/SoilHealthProhibitedCounties for a list of currentPROHIBITED COUNTIES.
NOTE: We require state and county of origin be included on this form.
All samples must be double bagged and secured in the shipping box.
Mail Samples To:Cornell Soil Health Lab
G01 Bradfield Hall306 Tower Rd
Ithaca, NY 14853Email:
1. Double bag each sample2. Enter your information into this form, prefably
electronically. IMPORTANT - complete all fields where possible. Print two copies.
3. Save one copy of the form for your records4. Place second copy into a plastic bag for protection
and put it into the box with your samples5. Send Excel file of this form via email6. We will contact you within 3 weeks with amount
due for analysis. Allow 4-6 weeks for results.Video for how to package and ship samples: bit.ly/SoilHealthSampling
For Lab Use Only
1
7
2
10 11
3 4 4 4 5 5 51
6 8 9 12 13 14
FIGURE 2.09 Sample submission form. Go to bit.ly/CASHforms to download form.

Comprehensive Assessment of Soil Health - The Cornell Framework 31
Soil Health Assessment - Part II
FIGURE 2.10. Regulated soils map. Blue = no regulated areas; Purple = regulated areas in a few counties within the state; Yellow = regulated areas in a large portion of counties within a state; Red = regulations in areas comprising the entire state.Source: diymaps.net
Regulated soils
Soil can contain numerous animal and plant pests, noxious weed seeds, or other materials that have the potential of propagating a harmful organism to the next stage in their life cycle or transmitting diseases. These pests are potentially detrimental to the health and value of agriculture, landscaped areas and natural resources. They include bacteria, plant viruses, fungi, nematodes, and life stages of destructive mollusks, acari, and insects.
Guidance exists from the USDA Animal and Plant Health Inspection Service (APHIS) Plant Protection and Quarantine (PPQ) program, in cooperation with state departments of agriculture and other government agencies, to respond to existing and new plant pests to eradicate, suppress, or contain them. These efforts may be an emergency or longer term domestic programs that target a specific regulated pest. To learn more about current APHIS restricted areas, visit aphis.usda.gov.
In response to the APHIS PPQ program, the Cornell Soil Health Laboratory has categorized three areas of regulated soils - Prohibited, Regulated and Quarantined – to provide special handling of the samples once they reach the lab. All samples, regardless of the category or whether or not they are regulated, need to be double bagged prior to packaging and shipping. Place crumpled paper or bubble wrap in the shipping box to minimize sample damage. Figure 2.10 provides general guidance of areas that are likely regulated, prohibited, or may have no restrictions at all.
For more details, including updated regulated areas and downloadable step-by-step instructions on proper packaging and shipping protocols, please visit the ‘Resources’ tab on our website.
Prohibited Soils: There are certain counties in the United States where soil should neither be packaged nor shipped. Soil received from these counties will be temporarily stored as quarantined samples and destroyed without processing. For a complete list of prohibited counties please visit the ‘Resources’ tab on the soil health website.
Regulated Soils: We can accept soils from most regulated areas throughout the U.S. As with all samples, please be sure to double bag and use packing material to minimize sample damage during shipping. Special lab procedures are required for regulated soils. Please visit the ‘Resources’ tab on our website for more information or visit aphis.usda.gov for a complete, active list of federally regulated soils for the county where your sample is taken.
Quarantined Soils: Quarantined soils are from any area outside the contiguous U.S. Special shipping and lab procedures are required for quarantined soils. You must contact the Cornell Soil Health Lab prior to shipping quarantined soils: [email protected]. Quarantined samples are subject to an additional surcharge.
If you have any question or concerns about packaging and shipping regulated soils, please contact your local lab. The Cornell Soil Health Lab can be reached at [email protected].
Red imported fire ant (Solenopsis invicta). Source: Pest and Diseases Image Library, Bugwood.org

32 Comprehensive Assessment of Soil Health - The Cornell Framework
Part II - Soil Health Assessment
Scoring FunctionsBackgroundThe Cornell Comprehensive Assessment of Soil Health (CASH) scoring functions for each indicator were originally developed to interpret our soil health measurements by adapting work of Andrews et al. (2004)1. In the context of our soil health assessment, the scoring functions convert a value for a specific indicator to an interpretive rating via a curve that assigns scores between 0 and 100 to the measured values. Most physical and biological indicators are given higher scores for higher measured values, while some are given higher scores for lower measured values (i.e., surface and subsurface hardness, root health rating). Chemical indicators are assigned high scores for measured values that fall within the optimum range for most soils. Outside this range, scores decrease with increasing difference between measured and optimal values.
Since scoring functions for some indicators depend strongly upon soil textural class, several indicators require separate scoring functions for coarse, medium, and fine textured soils. These were developed based on the observed distribution of measured values for the indicators in regional soils of similar texture.
Scoring curves for each indicator have been determined by estimating the cumulative normal distribution function using the mean and standard deviations of samples in the Cornell Soil Health Lab (CSHL) database. Originally, scoring curves were established from data collected across the Northeastern United States. In the years since, the CSHL database has expanded to include a much greater number and spatially diverse set of samples representing over 60% of the U.S. and several countries throughout the world.
During 2014 and 2015 the first round of revisions to the scoring functions occurred using the higher relative sample size. Accompanying these changes was replacing the Potentially Mineralizable Nitrogen (PMN) test with both the Soil Respiration and the Autoclaved Citrate Extractable (ACE) Protein Assay as Biological Indicators.
Regional updates2
In 2016, several significant adjustments were made and incorporated into assessment reports. New in 2016 is the preliminary development of regional scoring functions for Physical and Biological Indicators. The CSHL has sufficient sample sizes to investigate NRCS-defined Major Land Resource Areas (MLRA) Regions L, M, N, R and S, which include the Northeast and significant portions of the Midwest and Southeast United States (USDA and NRCS, 2006)3 (Figure 2.11).
Our investigation found evidence of significant differences in the mean indicator values between these five regions for all indicators except Surface and Subsurface Hardness and Soil Respiration. In an effort to increase the scope of our database to soils outside the Northeast, the updated scoring functions (all indicators and textural classes) were calculated as the overall mean of the mean and standard deviation of each MLRA Region. This approach accounts for:1) regional differences in mean indicator values, and2) unequal sample sizes between regions.
FIGURE 2.11. USDA-NRCS Major Land Resource Area (MLRA) Regions L, M, N, R and S of the Midwest and Eastern United States. Modified from USDA-NRCS

Comprehensive Assessment of Soil Health - The Cornell Framework 33
Soil Health Assessment - Part II
For illustration on how scoring curves are developed, the histogram in Figure 2.12 above shows the observed distribution of measured values of active carbon (Active C) for medium textured soils in the CSHL calibration set. The height of the bars depict the frequency of measured values that fall within each range (bin) along the horizontal (X) axis. In this case, all medium texture Active C values were separated into bins in increments of 100 covering the entire range of concentration values (0-100, 100-200, …, 1200-1300). For instance, approximately 24% of the soil samples in this set had measured Active C con-centrations falling between 500 and 600 parts per million (ppm). The normal distribution, or bell curve, superimposed over the bars was calculated using the mean (531 ppm) and standard deviation (182 ppm) of all medium textured soils.
Cumulative Normal DistributionWe used the mean and standard deviation of our data set to calculate the cumulative normal distribu-tion (CND). The CND function is essentially the scoring function, as it provides the score on a scale ranging from 0-100. Figure 2.13 includes the CND function for Active C (ppm) plotted on the horizontal axis and score on the vertical axis. For example, a medium textured soil with measured Active C of 600 ppm would be given a score of 60, as indicated
FIGURE 2.12. Example of the distribution of active carbon indicator data in medium textured soils used to determine the scoring curve.
by the red lines drawn on the figure. In practical terms, this means that 60% of medium textured soil samples in the CSHL calibration set had Active C values lower than or equal to that of the sample being scored. NOTE: A score of 50% is associated with an Active C value of 531 ppm, the mean of the normal distribution.
This approach can be adapted to regions with different soils and climate as scoring functions should be adjusted to fit different conditions for more appropriate interpretation. For example, this framework was applied to a region in Western Kenya (Moebius-Clune et al., 2011)4. In addition, future work to score measured values based on specific land management practices or outcomes such as yield, crop quality, risk, and environmental considerations (as available for standard nutrient testing) is needed.
Cumulative Normal Distribution functions for all indicators along with coarse, medium, and fine textured soils were calculated using the same approach as for active carbon.
As part of the CASH Report Summary (Figure 2.14, page 35), indicator scores are assigned a color rating. The assessment traditionally used a three color system (red, yellow, green for low (0-30), medium (30-70), and high (70-100), respectively).
FIGURE 2.13. Cumulative normal distribution for scoring active carbon in silt soils. In this example, 60% of medium textured soil samples in the calibration set had Active C contents lower than or equal to the sample being scored.

34 Comprehensive Assessment of Soil Health - The Cornell Framework
Part II - Soil Health Assessment
In 2016, the report began using a five-color system - red, orange, yellow, light green, and dark green for very low, low, medium, high, and very high, respectively. See the following page for an example summary report.
We used the following values to set thresholds for rating soil health indicators:
i. Scores between 0 and 20 are considered very low (red)
ii. Scores between 20 and 40 are considered low (orange)
iii. Scores between 40 and 60 are considered medium (yellow)
iv. Scores between 60 and 80 are considered high (light green)
v. Scores between 80 and 100 are considered very high (dark green).
The lower the score, the greater the constraint in the proper functioning of processes as represented by the indicator. Land management decisions should therefore place priority on correcting this condition (see Part III of this manual). Low and medium scores do not necessarily represent a major constraint to proper soil functions, but suggest places for improvement in management planning. High or Very High scores suggest that the soil processes represented by these indicators are likely functioning well. As such, management goals should aim to maintain such conditions. A more detailed description of the summary report is provided beginning on page 72.
After all indicators are scored and colored appropriately, a soil health overall quality score is computed as the unweighted average of all individual indicator scores. The overall rating of the soil sample follows the logic of the individual indicator scores (see above). This score may be useful in some cases for making relative comparisons, but it is generally advised that greater attention be paid to the scores of individual indicators and the identification of constraints to proper functioning of important soil processes.
The Cornell Assessment of Soil Health identifies biological and physical soil constraints in addition to conventional soil testing. From left to right: wet aggregate stability, root pathogen pressure and soil protein tests in the lab.

Comprehensive Assessment of Soil Health - The Cornell Framework 35
Soil Health Assessment - Part II
Comprehensive Assessment of Soil HealthFrom the Cornell Soil Health Laboratory, Department of Soil and Crop Sciences, School ofIntegrative Plant Science, Cornell University, Ithaca, NY 14853. http://soilhealth.cals.cornell.edu
Grower:Bob Schindelbeck306 Tower Rd.Ithaca, NY 14853
Agricultural Service Provider:Mr. Bob [email protected]
Sample ID: LL8
Field ID: Caldwell Field- intensivemanagement
Date Sampled: 03/11/2015
Given Soil Type: Collamer silt loam
Crops Grown: WHT/WHT/WHT
Tillage: 7-9 inches
Measured Soil Textural Class: silt loamSand: 2% - Silt: 83% - Clay: 15%
Group Indicator Value Rating Constraints
physical Available Water Capacity 0.14 37
physical Surface Hardness 260 12 Rooting, Water Transmission
physical Subsurface Hardness 340 35
physical Aggregate Stability 15.7 19 Aeration, Infiltration, Rooting, Crusting,Sealing, Erosion, Runoff
biological Organic Matter 2.5 28
biological ACE Soil Protein Index 5.1 25
biological Soil Respiration 0.5 40
biological Active Carbon 288 12 Energy Source for Soil Biota
chemical Soil pH 6.5 100
chemical Extractable Phosphorus 20.0 100
chemical Extractable Potassium 150.6 100
chemical Minor ElementsMg: 131.0 / Fe: 1.2 / Mn: 12.9 / Zn: 0.3
100
Overall Quality Score: 51 / MediumFIGURE 2.14. Example summary report page for a conventional small grain operation. The report is described further on page 72, and a full report including interpretive text is included in Appendix A. Because producers generally manage soil nutrient levels and pH carefully, using standard soil testing, chemical soil health is often found to be in the optimal range (100 rating and dark green in example above). Constraints are more frequently found in physical and biological health, because these aspects of soil health have not previously been tested and explicitly managed (< 20 rating and in red in example above). Orange and yellow-colored ratings should be monitored but are not necessarily a priority for management at this time.

36 Comprehensive Assessment of Soil Health - The Cornell Framework
Part II - Soil Health Assessment
A. More is better graph
B. Less is better graph
C. Optimum graph
FIGURE 2.15 A-C. Three general scoring curve types, depending on the indicator that is evaluated.
Scoring TypesThree general types of scoring are used, whether the curve shape is normal, linear, or otherwise. These are described below:
A. More is Better :In this situation, the higher the measured value of the indicator, the higher the score until a maximum score of 100 is attained (Figure 2.15 A). Values exceeding this maximum are assigned a score of 100. Indicators falling in this class include Aggregate Stability, Available Water Capacity, Organic Matter Content, ACE Protein, Soil Respiration, Active Carbon, and Potentially Min-eralizable Nitrogen. Scoring functions for these indicators are calculated as
Score = 100*CND.
As for Chemical Indicators, potassium content is scored as ‘more is better’ as well, dependent on established outcome-based thresholds. Micronutri-ents Magnesium and Zinc are associated with risk of deficiency, so higher values are assigned better scores.
B. Less is Better :For a few indicators, lower measured values are associated with better soil functioning (Figure 2.15 B). This is the case for Surface and Subsurface Hardness and the Root Health Bioassay Rating. Scoring functions for these indicators are calculated as
Score = 100*(1 - CND).
Manganese and Iron are scored as ‘less is better’ because these micronutrients are associated with a risk of toxicity from excess levels.
C. Optimum Curve:Extractable Phosphorous and pH are both scored using an optimum curve (Figure 2.15 C). In this case, the scoring curve rises with increasing measured value until the lower end of the optimum range is reached. Within the optimum range, scores are always 100. Values exceeding the optimum range follow a scoring curve with a negative slope which decreases with further increases in measured value.

Comprehensive Assessment of Soil Health - The Cornell Framework 37
Soil Health Assessment - Part II
Soil TextureSoil texture refers to a mixture of variously sized mineral particles, the relative amounts of which determine a soil’s texture. The textural class is defined by the relative amounts of sand (0.05 to 2 mm particle size), silt (0.002 to 0.05 mm), and clay (less than 0.002 mm), as seen in the textural triangle (following page). Particles that are larger than 2 mm are called coarse fragments (pebbles, cobbles, stones, and boulders), and are not considered in the textural class, although they may help define a soil type. Organic matter is also not considered in the determination of soil texture, although it is very important for soil functioning, as we will further discuss (page 47). A soil’s textural class—such as a clay, clay loam, loam, sandy loam, or sand—is perhaps its most fundamental inherent characteristic. It affects many of the important physical, biological, and chemical processes in a soil, but is not easily altered by management, and changes little over time. Thus, while texture is not a soil health indicator per se, it informs the interpretation of most soil health indicators.
Basic protocol (adapted from Kettler et al.)6
· Air dry a portion of the soil sample and sieve past 2mm.
· Approximately 14g (+/- 0.1g) of sieved soil is added to a 50ml centrifuge tube containing 42ml of a dispersant solution (3% sodium hexametaphosphate, a detergent).
· Shake vigorously on reciprocating shaker for 2 hours to fully disperse soil into suspension.
· Wash entire contents of centrifuge tube onto a sieve assembly (Figure 2.16 A). Sieve assembly consists of 0.053mm sieve on top of a plastic funnel above a 1L beaker. Rinse all material through the sieve. Sand captured on top of the sieve is washed into a tared metal can and set aside (B).
· Silt and clay particles collected in the 1L beaker are re-suspended by stirring and allowed to settle for 2 hours (C). The clay in suspension is then carefully decanted. The settled silt is washed into a second tared can. Both tared cans (one containing the sand fraction and the other the silt fraction) are dried at 105O C to constant weight before recording dry weight.
· Calculate percent sand, silt clay from: Sand (%) = dry wt sand (g)/dry wt (g)
soil added to centrifuge tube. Silt (%) = dry wt silt (g)/dry wt (g)
soil added to centrifuge tube. Clay (%) = 100% - Sand (%) - Silt (%).
FIGURE 2.16 Steps to determining soil textural class in the lab.
Soil Health Indicator Laboratory Protocols and Scoring FunctionsSoil Health indicators were selected for the assessment using criteria discussed on page 23, such as their sensitivity to management, changes in measurement consistency and reproducibility, ease and cost of sampling and cost of analysis. The following pages provide a detailed description of each indicator, how it is measured, how it relates to soil functioning and the interpretive scoring function used to assign a rating score.
An electronic copy of the Standard Operating Procedures (2016)5 for the suite of physical and biological analyses offered from the Cornell Soil Health Lab (CSHL) is available under the ‘Resources’ tab on our website.
A
B
C

38 Comprehensive Assessment of Soil Health - The Cornell Framework
Part II - Soil Health Assessment
How soil texture relates to soil functionTexture affects many important soil processes due to the total amount of pore space and how varied pore space is within aggregates. Soils with higher clay contents generally have higher ability to retain nutrients (more cation exchange capacity, or CEC, discussed previously) and can accumulate, or sequester, more organic matter.
The size distribution of the particles strongly influences the size of the pore spaces between the particles, the formation and stabilization of soil aggregates, and the spaces between these aggregates. Aggregates and inter- aggregate spaces are as important as the sizes of the particles themselves, because the relative quantities of variously sized pores—large, medium, small, and very small—govern the important processes of water and air movement. These in turn affect processes like water infiltration, permeability, water storage, aeration, nutrient leaching, and denitrification.
In addition, soil organisms and plant roots live and function in pore spaces. When the soil loses porosity (generally due to management), roots cannot grow as well, and many organisms have more difficulty surviving. Most pores in a clay are small (generally less than 0.002 mm), whereas most pores in a sand are large (but generally still smaller than 2 mm).
On the one extreme of the texture and aggregation spectrum, we see that beach sands have large particles (in relative terms) and very poor aggregation due to a lack of organic matter or clay to help bind the sand grains. A good loam or clay soil, on the other hand, has smaller particles, but they tend to be aggregated into crumbs that have larger pores between them and small pores within. Although soil texture doesn’t generally change over time, the total amount of pore space and the relative amount of variously sized pores are strongly affected by management practices.
Using texture in developing scoring functionsSoil texture contributes to inherent soil quality, the characteristics of the soil that result from soil forming processes. It is virtually unchangeable through soil management for a particular soil and is therefore not scored as part of a soil health assessment. Information on soil texture, however, is very valuable by itself for planning management practices. Moreover, soil textural information is used to score most of the other soil health indicators, because interpretations are best made in light of interactions with soil texture. For example, given the same management, coarse textured soils like loamy sands generally have lower organic matter levels than fine-textured clay loams, because they lack the ability to stabilize organic matter through organo-mineral bonds.
Measured organic matter contents, along with other indicators, are scored relative to an appropriate distri-bution for soils of a particular textural grouping, to account for this type of difference. In the soil health assessment scoring process, we distinguish between coarse-textured (sand, loamy sand, sandy loam), medium-textured (loam, silt loam, silt, sandy clay loam) and fine-textured (clay loam, silty clay loam, sandy clay, silty clay, and clay) soils (below).
CSHL Soil Texture Standard Operating Procedures (CSH 02) can be found under the ‘Resources’ tab on our website.
Textural triangle used in determining soil texture. Soils with different properties of sand, silt and clay are assigned different classes. Adapted from: USDA-NRCS

Comprehensive Assessment of Soil Health - The Cornell Framework 39
Soil Health Assessment - Part II
Available Water CapacityAvailable Water Capacity is an indicator of the range of plant available water the soil can store. In the field, a soil is at the upper end of soil wetness when water that it can’t hold against gravity has drained - this is called field capacity. The lower end of the range is called the permanent wilting point, when only water unavailable to plants, also called hygroscopic water, is left. The water stored in the soil against gravity is plant available until it decreases to the permanent wilting point. Available Water Capacity is determined from measuring water content at field capacity and permanent wilting point in the lab, and calculating the difference.
Basic protocol (adapted from Reynolds et al.)7
· Soil is placed on two ceramic plates with known porosity, and wetted to saturation (Figure 2.17 A).
· The ceramic plates are inserted into two high pressure chambers to extract the water to field capacity (10 kPa), and to the permanent wilting point (1500 kPa) (B).
· After the sample equilibrates at the target pressure, the sample is weighed (C), then oven-dried at 105◦ C to a constant weight, and then weighed again.
· The soil water content at each pressure is calculated, and the available water capacity can then be calculated as the soil water loss between the 10 and 1500 kPa pressures.
How AWC relates to soil functionWater is stored in medium and small sized soil pores and in organic matter. Available Water Capacity is an indicator relating the laboratory measured weight of soil to water storage capacity in the field, and therefore how crops may fare in extremely dry conditions. Soils with lower storage capacity have greater risk of drought stress.
Sandy soils, which tend to store less organic matter and have larger pores, tend to lose more water to gravity than clayey and loamy soils (Figure 2.18). Therefore a common constraint of sandy (coarse textured) soils is their lower ability to store water for crops between rains, which is especially a concern during droughty periods, and in areas where irrigation is costly or not available.
In heavier (fine textured) soils, the available water capacity is generally less constraining, because clays naturally have high water retention ability. Instead, they are typically more limited in their ability to supply air to plant roots during wet periods, and to allow for enough infiltration to store water if rains comes less frequently but more intensively.
Note that total crop water availability is also dependent on rooting depth, which is considered in separate soil health indicators - surface and subsurface hardness (page 41).
A guide to demonstrating how soil structure can impact water storage is available at bit.ly/SHSpongeDemo and under the ‘resources’ tab of our website.
FIGURE 2.18. Water storage for two soil textural groups. The blue shaded area represents water that is available for plant use.
A B
C
Drainage water
Stored water (available)
Hygroscopic water
(unavailable)
Saturation Field Capacity
Drainage
Permanent Wilting Point
waterStored water (available)
Hygroscopic water
(unavailable)
Saturation Field Capacity
Permanent Wilting Point
Clay Soil
Sandy Soil
Soil Drying
FIGURE 2.17 A-C (A) Ceramic plates with soil are (B) inserted into high pressure chambers. (C) Equilibrated samples at target pressure Samples are weighed and then oven dried to a constant weight.

40 Comprehensive Assessment of Soil Health - The Cornell Framework
Part II - Soil Health Assessment
Managing constraints and maintaining optimal available water capacity
FIGURE 2.19. Available Water Capacity (AWC) scoring functions and upper value limits for Coarse (C), Medium (M) and Fine (F) textural classes. Mean and standard deviation (in parenthesis) for each class are provided. In this case more is better. Higher AWC scores indicate a greater capacity of the soil to store plant available water.
CSHL Available Water Capacity Standard Operating Procedures (CSH 05) can be found under the ‘Resources’ tab on our website.
A roller crimper can be used to supply large additions of organic materials. Photo credit: Edwin Remsburg and USDA-SARE.
Available water capacity can be improved in the short term by large additions of stable organic materials, such as composts, or possibly biochar, that themselves can store larger amounts of water. Mulches may be used to prevent limited water from evaporating.
In the long term, building organic matter and aggregation will build porosity for storing water. This can be accom-plished by reducing tillage, long-term cover cropping, mulching, rotating annual crops with diverse perennials, and generally keeping actively growing roots in the system to build and maintain soil pores (see Part III).
In coarse textured soils, building higher water storage is more challenging than in finer textured soils that inherently store more water. Therefore, managing for relatively high water storage capacity, and also for decreased evaporation through surface cover, is particularly important in coarse textured soils. While the inherent textural effect cannot be influenced by management, choosing management options can be, in part, based on an understanding of inherent soil characteristics.
Scoring functionThe graph below depicts Available Water Capacity scoring functions and upper value limits for coarse, medium, and fine textured soils (Figure 2.19). Scoring functions were combined for medium and fine classes because no effects due to texture were observed in the data set.
The red, orange, yellow, light green and dark green shading reflects the color coding used for the ratings on the soil health report summary page (see page 73).

Comprehensive Assessment of Soil Health - The Cornell Framework 41
Soil Health Assessment - Part II
FIGURE 2.21 A and B. Soil compaction graphs for (A) a field in intensive vegetable production and (B) a conventionally plow-tilled field and zone-till field with deep ripping on the same farm in the spring of 2005 (Courtesy of C.R. MacNeil).
0
100
200
300
400
500
600
0 2 4 6 8 10 12 14 16 18
Depth (inches)
Poun
ds p
er s
quar
e in
ch (p
si)
0
50
100
150
200
250
300
350
400
450
0 2 4 6 8 10 12 14 16 18
Depth (inches)
Zone tillageConventional tillage
Poun
ds p
er s
quar
e in
ch (p
si)
Poun
ds p
er s
quar
e in
ch (p
si) Zone tillage
Conventional tillage
Root growth is reduced above 300 psi
• Apply slow even pressure so penetrometer advances into the soil at a rate of 4 seconds per 6 inches or less. Record the highest pressure reading measured for each of the two depths in the sample intake form. If you detect a hard layer, make sure to note its depth – this is important information for management decisions.
• Field profiles of penetration resistance can be created by recording the measured psi every inch through the soil profile and then plotting them on a chart (Figures 2.21 A and B). These charts can be used to identify various layers of compaction, if present. For the soil health test, however, we only target two depths.
Surface and Subsurface HardnessSurface and subsurface hardness are indicators of the soil compaction status, measured as field penetration resistance in pounds per square inch (psi). It is measured in the field using a penetrometer or soil compaction tester pushed through the soil profile at two depth increments (surface 0 – 6”, and subsurface 6 – 18”). Measurements should be taken when the soil is friable (or near field capacity), since moisture content influences the measurement. The reading in psi can be converted to kilogram-force per square centimeter (kgf/cm2). For a detailed guide on how to take penetrometer mea-surements please visit bit.ly/SHPenetrometer.
Basic protocol (adapted from Duiker)8
• Surface and subsurface hardness are measured using a penetrometer, an instrument that measures the soil’s resistance to penetration. It consists of a cone-tip, a metal shaft, and a pressure gauge that measures resistance in psi (Figure 2.20 A).
• Most penetrometers come with two different sized tips which correspond to two different gauge scales. The outer and inner scales correspond to the larger ¾ inch and the smaller ½ inch diameter tips, respec-tively (Figure 2.20 B). For most instances, the ½” tip should be used. The ¾” tip is for very soft soil. Be sure to use the scale appropriate for the tip size.
• The level of soil moisture can greatly affect the ease with which the probe penetrates the soil, and therefore the measured values. It is recommended that penetration readings be taken when the soil is at field capacity (2-3 days after free drainage). If the soil conditions are not ideal, it is important to note conditions at the time so that proper interpretation of the reading can be made.
FIGURE 2.20 A and B. Measuring surface and subsurface hardness with a penetrometer.
A
B
A B

42 Comprehensive Assessment of Soil Health - The Cornell Framework
Part II - Soil Health Assessment
How soil hardness relates to soil functionField penetration resistance is an indicator of the soil compaction status. Compaction occurs when large pores are packed closer together through tillage or traffic with heavy equipment, particularly on wet soils. Large pores are necessary for water and air movement and to allow roots and organisms to explore the soil (Figure 2.22). When surface soils are compacted, runoff, erosion, slow infil tration, and poor water storage result.
Subsurface hardness prevents deep rooting and causes poor drainage and poor deep water storage (Figure 2.23). After heavy rain events, water can build up over a hard pan, causing poor aeration both at depth and at the surface, as well as ponding, poor infiltration, runoff and erosion. Impaired water movement and storage create greater risk during heavy rainfall events, as well as greater risk of drought stress between rainfall events.
Most crop roots cannot easily penetrate soil with pene trometer readings above about 300 psi. Similarly, growth of mycorrhizal fungal hyphae and mobility of other beneficial soil organisms may be severely restricted by excessively hard soil. Since plant roots must be actively growing and exploring the root zone to access water and nutrients, crop quality and yield decline with compaction. Low growth increases weed pressure, and stressful conditions make crops more susceptible to pathogen pressure.
Managing and preventing surface and subsurface hardness constraints Compaction in surface and subsurface soil occurs very rapidly when the soil is worked or trafficked while it is too wet, and compaction can be transferred deep into the soil even from surface pressure.
Compaction can be prevented by avoiding soil disturbance, especially when the soil is wet. Maintaining aggregation is particularly critical for preventing surface compaction (pages 15,46. Compaction can be alleviated by targeted management (Part III).
FIGURE 2.22. (Left) Surface compaction prevents root from accessing water and nutrients. (Right) Dense rooting allows for full soil exploration. Source: Building Soils for Better Crops, 3rd Edition
BUILDING SOILS FOR BETTER CROPS: SUSTAINABLE SOIL MANAGEMENT
65
aeration (figure 6.12). This range, referred to by scien-tists as the least-limiting water range, is bounded on two sides—when the soil is too wet and when it’s too dry.
The optimum water range in a well-structured soil has its field capacity on the wet end, as water above that moisture content is quickly drained out by gravity. On the dry end is the wilting point—beyond which the soil holds water too tightly to be used by plants. However, the soil water range for best growth in a compacted soil is much narrower. Even after a severely compacted soil drains to field capacity, it is still too wet because it lacks large pores and is poorly aerated. Good aera-tion requires at least 20% of the pore space (about 10% of the volume of the whole soil) to be air filled. On the dry end, plant growth in a compacted soil is commonly limited by soil hardness rather than by lack of available water. Plants in compacted soils therefore experience more stress during both wet and dry periods than plants in soils with good tilth. The effects of compaction on crop yields usually depend on the length and severity of excessive wet or dry periods and when those periods occur relative to critical times for plant growth.
CHEMICAL CONTAMINATION OF SOILSoils can be contaminated with chemicals—either natu-rally or by human activity—to such an extent that crops are adversely affected. In this section we’ll start with a discussion of problems of saline and sodic (alkaline) soils, normally found in arid and semiarid regions. Then we’ll discuss other types of chemical contamination.
Sodic and Saline SoilsSpecial soil problems are found in arid and semiarid regions, including soils that are high in salts, called saline soils, and those that have excessive sodium (Na+), called sodic soils. Sometimes these go together and the result is a saline-sodic soil. Saline soils usually have good soil tilth, but plants can’t get the water they need because the high salt levels in the soil inhibit water uptake. Sodic soils tend to have very poor physical struc-ture because the high sodium levels cause clays to dis-perse, leading aggregates to break apart. As aggregates break down, these soils become difficult to work with and very inhospitable for plants because of compaction and greatly reduced aeration.
CHAPTER 6 SOIL DEGRADATION: EROSION, COMPACTION, AND CONTAMINATION
Figure 6.11. Compacted soils harden more quickly upon drying than well-aggregated soils.
Figure 6.12. The optimum water range for crop growth for two different soils.
soil water content
well-aggregated soil
compacted soil
300-psi critical level
soil hardness
saturatedvery dry
compacted soil
poor aeration
poor aeration
well-structured soil
droughtstress
root resistance
optimumwater range
field capacity
optimumwater range
soil water content
FIGURE 2.23. Compacted soils have greater root resistance, poorer water storage capacity and decreased infiltration compared to well-structured soils. Source: Building Soils for Better Crops, 3rd edition.
BUILDING SOILS FOR BETTER CROPS: SUSTAINABLE SOIL MANAGEMENT
52
extremes, and its behavior is typical of that exhibited by a well-aggregated loam soil (figures 5.4c, 5.5). Such a soil has a sufficient amount of large pore spaces between the aggregates to provide adequate drainage and aera-tion during wet periods, but also has enough small pores and water-holding capacity to provide water to plants and soil organisms between rainfall or irrigation events. Besides retaining and releasing water at near optimum quantities, such soils also allow for good water infiltra-tion, thereby increasing plant water availability and reducing runoff and erosion. This ideal soil condition is therefore characterized by crumb-like aggregates, which are common in good topsoil.
AVAILABLE WATER AND ROOTINGThere is an additional dimension to plant-available water capacity of soils: The water in the soil may be available, but roots also need to be able to access it, along with the nutrients contained in the water. Consider the soil from the compacted surface horizon in figure 5.6 (left), which was penetrated only by a single corn root with few fine lateral rootlets. The soil volume held sufficient water, which was in principle available to the corn plant, but the roots were unable to penetrate most of the hard soil. The corn plant, therefore, could
not obtain the moisture it needed. The corn roots on the right (figure 5.6) were able to fully explore the soil volume with many roots, fine laterals, and root hairs, allowing for better water and nutrient uptake.
Similarly, the depth of rooting can be limited by compaction. Figure 5.7 shows, on the right, corn roots from moldboard-plowed soil with a severe plow pan. The roots could not penetrate into the subsoil and were therefore limited to water and nutrients in the plow layer. The corn on the left was grown in soil that had been subsoiled, and the roots were able to reach about twice the depth. Subsoiling opened up more soil for
CHAPTER 5 SOIL PARTICLES, WATER, AND AIR
Figure 5.6. Left: Corn root in a compacted soil cannot access water and nutrients from most of the soil volume. Right: Dense rooting allows for full exploration of soil water and nutrients.
Figure 5.7. Corn roots on the right were limited to the plow layer due to a severe compaction pan. Roots on the left penetrated into deeper soil following subsoiling and could access more water and nutrients.

Comprehensive Assessment of Soil Health - The Cornell Framework 43
Soil Health Assessment - Part II
Surface compaction can be alleviated by targeted mechanical surface loosening of the soil, followed by fresh organic matter additions and vigorously rooting cover/rotation crops to strengthen and rebuild aggregates (pages 88-97). Subsoil compaction can be addressed by deep tillage or by deep rooting crops. In the long term, reduced, well-timed tillage and controlled traffic with minimized loads, soil cover, rotations, and active rooting will maintain non-compacted soils.
FIGURE 2.24 A and B. Surface and subsurface scoring functions and upper value limits for Coarse (C), Medium (M) and Fine (F) textural classes. Mean and standard deviation (in parenthesis) is provided. In this instance less is better. Lower scores indicate a better soil compaction status.
A
B
Wheel traffic compaction from wet soil conditions.Scoring functionThe graphs below depict Surface and Subsurface Resistance scoring functions and upper value limits for coarse, medium, and fine textured soils (Figure 2.24). Scoring functions were combined for all classes because no effects due to texture were observed in the data set.
The red, orange, yellow, light green and dark green shading reflects the color coding used for the ratings on the soil health report summary page (see page 73).
Penn State Extension Soil Penetrometer Standard Operating Procedures and a video demonstrating how to take penetrometer readings in the field can be found on our website and at bit.ly/SoilHealthSampling.

44 Comprehensive Assessment of Soil Health - The Cornell Framework
Part II - Soil Health Assessment
Wet Aggregate StabilityWet Aggregate Stability is a measure of the extent to which soil aggregates resist falling apart when wetted and hit by rain drops. It is measured using a Cornell Rainfall Simulator that steadily rains on a sieve containing a known weight of soil aggregates sized between 0.25 mm and 2 mm. The unstable aggregates slake (fall apart) and pass through the sieve. The fraction of soil that remains on the sieve is used to calculate the percent aggregate stability (Figure 2.25 A-C). For details on the Rainfall Simulator visit soilhealth.cals.cornell.edu.
Basic protocol (adapted from Moebius et al.)9
· Soil is air-dried and placed on stacked sieves of 2.0 mm, 0.25 mm and a catch pan. The dried soil is shaken for 15 seconds on a Tyler Coarse Sieve Shaker to separate out aggregates of 0.25 - 2.0 mm size for analysis.
· A single layer of aggregates from 0.25 - 2.0 mm in size (about 30g) is spread on a 0.25 mm sieve (200 mm diameter) (A).
· Sieves are placed at a distance of 500 mm (20 inches) below a rainfall simulator, which delivers individual drops of 4.0 mm diameter (B).
· The test is run for 5 minutes and delivers 12.5 mm of water (approximately 0.5 inches) as drops to each sieve. See soils starting to wet in (C). A total of 0.74 J of energy thus impact each sieve over this 5 minute rainfall period. Since 0.164 mJ of energy is delivered for each 4.0 mm diameter drop, it can be calculated that 15 drops per second impact each sieve. This is equivalent to a heavy thunderstorm.
· The slaked soil material that falls through during the simulated rainfall event, and any stones remaining on the sieve are collected, dried and weighed, and the fraction of stable soil aggregates (WSA) is calculated using the following equation:
WSA = Wstable / Wtotal,
where
Wstable = Wtotal - (Wslaked +Wstones)
where
W = weight (g) of stable soil aggregates (stable), total aggregates tested (total), aggregates slaked out of sieve (slaked), and stones retained in sieve after test (stones).
Corrections are made for stones. FIGURE 2.25 A-C. Aggregate Stability test. A rain simulator is used for 5 minutes on a sieve containing soil aggregates.
A
B
C

Comprehensive Assessment of Soil Health - The Cornell Framework 45
Soil Health Assessment - Part II
How aggregate stability relates to soil functionWet Aggregate Stability tests the soil’s physical ability to hold together and sustain its aggregation, or structure, during conditions with the most impact: a heavy rain storm or other rapid wetting event, such as irrigation, after surface drying weather. This is a good indicator of both physical and biological health (Part I, page 9).
Soils with low aggregate stability tend to form surface crusts and compacted surface soils, which can reduce air exchange and seed germination, increase plant stress and susceptibility to pathogen attack, and reduce water infiltration and thus storage of water received as rainfall. This leads to runoff, erosion and flooding risk downstream during heavy rainfall, and higher risk of drought stress later (above). Poor soil aggregation also makes the soil more difficult to manage, as it reduces its ability to drain excess water, so that it takes longer before field operations are possible after rain events.
In heavy (fine textured) soils, enhanced friability and crumbliness from good aggregation makes the soil less dense, so that it is lighter, and is easier to work with less fuel. A well aggregated clay soil allows for excess water to drain through the cracks and fissures between crumbs, while storing water for plant use within the stable aggregates. Good aggregation is critical for resilience to extreme weather (Figure 2.26).
FIGURE 2.26. Pictures of different soil aggregate test results: A Lima silt loam soil from a long-term tillage experiment. (Left) Moldboard plow treatment with 34% water stable aggregates. (Right) Zone-till management with 56% water stable aggregates (0.25 mm sieve).
Poor soil aggregation tends to form surface crusts and compacted surface soil. This can reduce water infiltration and storage and lead to excessive runoff and erosion. Source: indianapublicmedia.org

46 Comprehensive Assessment of Soil Health - The Cornell Framework
Part II - Soil Health Assessment
Managing constraints and maintaining optimal aggregate stabilityStable aggregates are built by biological activity, as aggregates are largely “stuck” together by fungal hyphae, microbial colonies, and plant and microbial exudates. This means plentiful fresh and diverse organic materials (such as green manures, cover crops with vigorous fine roots, animal manures, and mulches) are needed to sustain soil biota, so that they can stabilize soil aggregates.
Repeated tillage breaks down stable soil aggregates, especially when organic additions are too low. Such soils can be so degraded that they become ‘addicted to tillage’, where crop establishment then requires a soil loosening operation. A successful transition to reduced tillage usually requires focused tillage for crop establishment, and significant organic additions or rotation with a perennial forage or cover crop, to build the soil for minimized disturbance.
Reduced tillage, soil cover, and diverse species and rotations with active living roots will maintain stable aggregates in the long term (see Part III).
Scoring functionThe graph below depicts Wet Aggregate Stability scoring functions and upper value limits for coarse, medium, and fine textured soils (Figure 2.27).
The red, orange, yellow, light green and dark green shading reflects the color coding used for the ratings on the soil health report summary page (see page 73).
CSHL Wet Aggregate Stability Standard Operating Procedures (CSH 03) can be found under the ‘Resources’ tab on our website.
FIGURE 2.27. Wet Aggregate Stability scoring functions and upper value limits for Coarse (C), Medium (M) and Fine (F) textural classes. Mean and standard deviation (in parenthesis) for each class are provided. In this case more is better. Higher scores indicate a greater ability of the soil aggregates to resist falling apart when exposed to rainfall.

Comprehensive Assessment of Soil Health - The Cornell Framework 47
Soil Health Assessment - Part II
Organic MatterTotal soil organic matter (OM) consists of both living and dead material, including well decomposed, more stabilized materials. OM analysis is a measure of carbon-containing material that is, or is derived from, living organisms, including plants and other soil dwelling organisms. Organic matter content is often provided by soil analysis laboratories along with major and minor nutrient contents, using a variety of methods.
Basic protocol (adapted from Broadbent)10
In our analysis, the percent organic matter is determined by loss on ignition, based on the change in mass after a soil is exposed to high temperature (500 °C or 932°F) in a furnace. At these temperatures, carbonaceous materials are burned off (oxidized to CO2), while other materials remain. Specifically -
· A sample is dried at 105°C to remove all water.
· The sample is weighed (Figure 2.28).
· The sample is then ashed (for weight loss on ignition) for two hours at 500°C, and the percent of mass lost is calculated after weighing again.
· The % loss on ignition (LOI) is converted to % organic matter (OM) using the following equation:
% OM = (% LOI * 0.7) - 0.23
How organic matter relates to soil functionSoil organic matter is where soil carbon is stored, and is directly derived from biomass of microbial communities in the soil (bacterial, fungal, and protozoan), as well as from plant roots and detritus, and biomass-containing amendments like manure, green manures, mulches, composts, and crop residues (Figure 2.29).
As discussed earlier, OM in its various forms greatly impacts the physical, biological and chemical properties of the soil. OM acts as a long-term carbon sink, and as a slow-release pool for nutrients. It contributes to ion exchange capacity (nutrient storage), nutrient cycling, soil aggregation, and water holding capacity, and it provides nutrients and energy to the plant and soil microbial communities (Figure 2.30, following page).
Soils that are continually managed for high organic matter tend to require lower farm inputs, and be more resilient to drought and extreme rainfall. It has been argued that organic matter management is soil health management.
FIGURE 2.29. Corn residue on the soil surface is a source of organic matter. Source: USDA-NRCS
FIGURE 2.28. Soil mass is determined prior to being exposed to high temperature. Soil is weighed after being ashed to calculate the percentage of mass lost.

48 Comprehensive Assessment of Soil Health - The Cornell Framework
Part II - Soil Health Assessment
Managing constraints and maintaining optimal organic matter contentIntensive tillage and lack of carbon inputs decrease organic matter content and overall soil health with time. Likewise, increasing organic matter in the soil takes dedication, patience and time to rebuild.
It is unlikely that a single incorpora-tion of a green manure will noticeably increase the percent organic matter. Rather, adding more stable organic matter such as compost, or possibly biochar, can improve water infiltration and retention in the short term. Retention and accumulation of OM in the long term is improved by reducing tillage intensity and frequency (as much as is feasible within the constraints of the production system), and repeated use of diverse organic matter additions from various sources (amendments, residues, and the active growth of crops, forages, or cover crops, particularly their roots) which all stimulate both microbial community growth and the stabilization (sequestration) of carbon in aggregates. The appropriate selection of organic matter input will depend on the management goal(s) and other microbial activity and food source related constraints identified. Additional information on organic matter amendments and other resources can be found in Part III, page 96.
Scoring functionThe graph below depicts Organic Matter scoring functions and upper value limits for coarse, medium, and fine textured soils (Figure 2.31).
The red, orange, yellow, light green and dark green shading reflects the color coding used for the ratings on the soil health report summary page (see page 73).
FIGURE 2.30. Adding organic matter results in a cascade of changes within the soil. Source: Building Soils for Better Crops, 2nd Edition
FIGURE 2.31. Soil Organic Matter (OM) scoring functions and upper value limits for Coarse (C), Medium (M) and Fine (F) textural classes. Mean and standard deviation (in parenthesis) for each class are provided. In this case more is better. Soils with higher OM scores generally require lower inputs of nutrients and are more resilient to drought and extreme rainfall.
CSHL Organic Matter Standard Operating Procedures can be found under the ‘Resources’ tab on our website.

Comprehensive Assessment of Soil Health - The Cornell Framework 49
Soil Health Assessment - Part II
A B
C
E
Soil Protein IndexThe Autoclaved Citrate Extractable (ACE) Protein Index is an indicator of the amount of protein-like substances that are present in the soil organic matter. ACE represents the large pool of organically bound nitrogen (N) in the soil organic matter, which microbial activity can mineralize, and make available for plant uptake. Protein content is well associated with overall soil health status because of its indication of biological and chemical soil health, in particular, the quality of the soil organic matter (SOM).
Basic protocol (adapted from Wright et al.)11
· Proteins are extracted from sieved, well-mixed, air-dried soil, using a protocol modified from Wright and Upadhyaya (1996) and Clune (2008).
· 3.00 g of soil are weighed into a pressure- and heat- stable glass screw-top tube, with 24.00 ml of sodium citrate buffer (20 mM, pH 7.0), and the mixture is shaken to disperse aggregates and mix well (5 min at 180 rpm) (Figure 2.32 A).
· The tubes are autoclaved for 30 min (121° C, 15 psi) and then cooled (B).
· 2 ml of the slurry is withdrawn to a smaller micro-centrifuge tube (top of C), and centrifuged at 10,000 x gravity to remove soil particles.
· A small subsample of this clarified extract is used in a standard colorimetric protein quantification assay (BCA; demonstrated in tubes at bottom of C), to determine total protein content of the extract.
· The Cornell Soil Health Lab uses the Thermo Pierce BCA protein assay, miniaturized for use in 96-well microplates, incubated at 60° C for uniform response to different protein types (D), and read for color development in a BioTek spectrophoto-metric plate reader (E).
· Extractable protein content of the soil is calculated by multiplying the protein concentration of the extract by the volume of extractant used, and dividing by number of grams of soil used.
How soil protein relates to soil functionPlant residues are ultimately the source of much of the SOM. Microbial biomass builds up as plant residues and other organic matter amendments decompose in the soil. Residues are made up of several types of compounds that are largely similar in composition (Figure 2.33, following page). Of these compounds, protein contains the largest fraction of N.
Protein content, as organically bound N, influences the ability of the soil to store N, and make it available by mineralization during the growing season. Soil protein content has also been associated with soil aggregation and thus water storage and movement.
FIGURE 2.32 A-E. Lab procedure for the Autoclaved Citrate Extractable (ACE) Protein Index.
D

50 Comprehensive Assessment of Soil Health - The Cornell Framework
Part II - Soil Health Assessment
Managing constraints and maintaining optimal soil protein content
To store and maintain N in the soil organic matter, we need to accumulate compounds that are relatively stable, rich in N (low C:N ratio), microbially degradable, and potentially abundant in amendments, crops, cover crops, or residues (Part III). For example, add biomass such as manure, fresh green biomass, and high-N well finished compost, and growing biomass in place by maintaining the presence of living, actively growing roots and soil microbes. Protein content tends to decrease with increasing soil disturbance such as tillage.
Building and maintaining healthy, biologically active
FIGURE 2.33. Types of compounds in plant residues. Protein are found in high abundance and contain the largest fraction of N. Modified from Brady and Weil (2002)
soil with large reserves of decomposting plant tissue in organic form is a good approach to provide a crop with its N needs over time as opposed to applying soluble forms of N that plants may not use immediately and be lost through runoff, leaching or denitrification.
Scoring Function The graph below depicts ACE Soil Protein Index scoring functions and upper value limits for coarse, medium, and fine textured soils (Figure 2.34). It is important to note that extremely high N mineralization could increase losses of N to the environment and thus harm air and water quality.
The red, orange, yellow, light green and dark green shading reflects the color coding used for the ratings on the soil health report summary page (see page 73).
FIGURE 2.34. ACE Soil Protein Index scoring functions and upper value limits for Coarse (C), Medium (M) and Fine (F) textural classes. Mean and standard deviation (in parenthesis) for each class are provided. In this case more is better. Higher protein index scores indicate a larger pool of organically-bound N in the soil.
CSHL ACE Soil Protein Index Standard Operating Procedures (CSH 07) can be found under the ‘Resources’ tab on our website.

Comprehensive Assessment of Soil Health - The Cornell Framework 51
Soil Health Assessment - Part II
Soil RespirationRespiration is a measure of the metabolic activity of the soil microbial community. It is measured by capturing and quantifying carbon dioxide (CO2) released from a re-wetted sample of air dried soil held in an airtight jar for 4 days. Greater CO2 release is indicative of a larger, more active soil microbial community.
A
B
C
Basic Protocol (adapted from Zibilske)12
· 20.00 g of air-dried, sieved soil are weighed into an aluminum weighing boat, which is pre-perforated with 9 pin-holes through the bottom.
· The weighing boat with soil is placed on top of two staggered filter papers in the bottom of a standard 1 pint wide-mouth mason jar (Figure 2.35 A).
· A trap assembly (a 10 ml glass beaker secured to a plastic tripod ‘pizza stool’) is placed in the jar, and the beaker filled with an alkaline CO2 - trapping solution (9 ml of 0.5 M KOH) (B).
· 7 ml of distilled, deionized water is pipetted into the jar onto the side, so that the water runs down and is wicked up into the soil through the filter paper.
· The jar is sealed tightly and incubated undisturbed for 4 days.
· Trap electrical conductivity declines linearly with increasing CO2 absorption, as OH- concentration in the trap declines and CO3
2- concentration in the trap increases.
· After incubation, the jar is opened and the conductivity of the trap solution is measured (C).
· CO2 respired is calculated by comparison with the conductivities of the original trap solution, and a solution representing the trap if saturated with CO2 (0.25 M K2CO3).
FIGURE 2.35 A-C. Soil Respiration is measured by capturing and quantifying CO2 released from samples.

52 Comprehensive Assessment of Soil Health - The Cornell Framework
Part II - Soil Health Assessment
How soil respiration relates to soil functionRespiration is a direct biological activity measurement, integrating abundance and activity of microbial life. Thus it is an indicator of the biological status of the soil community, which can give insight into the ability of the soil’s microbial community to accept and use residues or amendments, to mineralize and make nutrients available from them to plants and other organisms, to store nutrients and buffer their avail-ability over time, and to develop good soil structure, among other important functions (Part I, page 5).
Soil biological activity influences key physical, biological, and chemical soil processes, and is also influenced by constraints in physical and chemical soil functioning (right).
Several individual enzyme and process activity assays are possible, as is quantification of microbial biomass size. However, measuring respiration by trapping evolved CO2 gives a rapid, low cost, integrative measure of general microbial activity level.
Managing constraints and maintaining optimal soil biological activityThe soil’s biological activity is improved by keeping the soil covered with plants or residues throughout the season, adding fresh, microbially degradable amendments, growing biomass in place by maintaining living roots for as much of the year as possible, increasing diversity of species in the system through rotations, interseeding, or intercropping, and by reducing the use of biocides such as pesticides, fungicides, and herbicides (see Part III). Beneficial soil biological activity tends to decrease with increasing soil disturbance such as tillage, heavy traffic, and compaction, as well as with extremes in low or high pH, or contamination by heavy metals or salts.
Scoring functionThe graph below depicts Soil Respiration scoring functions and upper value limits for coarse, medium, and fine textured soils (Figure 2.36). Scoring functions were combined for all classes because no effects due to texture were observed in the data set.
The red, orange, yellow, light green and dark green shading reflects the color coding used for the ratings on the soil health report summary page (see page 73).
FIGURE 2.36. Soil Respiration scoring functions and upper value limits for Coarse (C), Medium (M) and Fine (F) textural classes. Mean and standard deviation (in parenthesis) is provided. In this case more is better. Higher respiration scores indicate the presence of a larger, more active soil community.
A larger, more active microbial community will maximize soil functioning such as making nutrients readily available for plants.
CSHL Soil Respiration Standard Operating Procedures (CSH 06) can be found under the ‘Resources’ tab on our website.

Comprehensive Assessment of Soil Health - The Cornell Framework 53
Soil Health Assessment - Part II
Active CarbonActive carbon is an indicator of the small portion of soil organic matter that can serve as a readily available food and energy source for the soil microbial community, thus helping to maintain a healthy soil food web.
Basic Protocol (adapted from Weil et al)13
To begin the process of measuring active carbon, soil is mixed with a potassium permanganate solution, which starts off deep purple in color. The permanganate oxidizes the active carbon and loses some of its color. The more active carbon found in the soil, the more the purple color declines. This color change is measured with a spectro-photometer or colorimeter. Specifically -
· Soil is air dried and sieved to 2 mm.
· A 2.5 g sample of air-dried soil is placed in a 50 ml centrifuge tube filled with 20 ml of a 0.02 M potassium permanganate (KMnO4) solution, which is deep purple in color (Figure 2.37 A).
· The soil and KMnO4 are shaken for exactly 2 minutes to oxidize the active carbon in the sample. The purple color becomes lighter as a result of this oxidation reaction.
· The sample tube is then allowed to settle for 8 minutes, pipetted into another tube, and diluted with distilled water.
· Absorbance is measured at 550 nm (B).
· The absorbance of a standard dilution series of the KMnO4 is also measured to create a calibration curve for interpreting the sample absorbance data.
· A simple formula is used to convert sample absorbance value to active C in units of mg carbon per kg of soil.
How active carbon relates to soil function Active carbon is highly correlated with and similar to particulate organic matter (POM), which is determined with a more complex and labor-intensive wet-sieving and/or chemical extraction procedure.
Due to its role in providing available food and energy sources for the soil microbial community, active carbon is positively correlated with percent organic matter, aggregate stability, and with measures of biological activity (such as respiration) and microbial biomass.
Research has shown that active carbon is a good “leading indicator” of soil health response to changes in crop and soil management, usually responding to management much sooner (often years sooner) than total organic matter percent. This is likely because when a large population of soil microbes is fed plentifully over an extended period of time, well decomposed organic matter builds up. Thus, monitoring the changes in active carbon can be particu-larly useful to farmers who are changing practices with the goal of building up soil organic matter.
FIGURE 2.37 A and B. (A) Extracts before and after dilution. The samples on the left are after they have been weighed, shaken, and settled. The samples on the right show the dilution as they are prepared for (B) samples are measured for absorbance at 550 nm.
A B

54 Comprehensive Assessment of Soil Health - The Cornell Framework
Part II - Soil Health Assessment
Managing constraints and maintaining optimal soil biological activity
Reducing tillage and increasing organic matter additions from various sources (right) will increase active carbon, and will feed, expand, and balance the microbial community, thus increasing total organic matter over the long term. Various sources include amendments, residues, and active and diverse forage, crop, or cover crop growth, with living roots providing labile carbon to soil microbes for as much of the year as possible (see Part III).
Scoring function
The graph below depicts active carbon scoring functions and upper value limits for coarse, medium, and fine textured soils (Figure 2.38).
The red, orange, yellow, light green and dark green shading reflects the color coding used for the ratings on the soil health report summary page (see page 73).
FIGURE 2.38. Active carbon scoring functions and upper value limits for Coarse (C), Medium (M) and Fine (F) textural classes. Mean and standard deviation (in parenthesis) for each class are provided. In this case more is better. Higher active carbon scores indicate a trend toward more organic matter building up in the soil through biological activity.
CSHL Active Carbon Standard Operating Procedures (CSH 04) can be found under the ‘Resources’ tab on our website.
Reducing tillage (top) and using cover crops (bottom) with living roots provide the residues and labile carbon necessary to increase soil OM and promote soil microbial diversity and activity. Photo credit: Jeff Vanuga, USDA-NRCS (top); Dorn Cox, Greenstart (bottom).

Comprehensive Assessment of Soil Health - The Cornell Framework 55
Soil Health Assessment - Part II
Standard Nutrient AnalysisThe Comprehensive Assessment of Soil Health measures pH and extracts plant macro- and micro-nutrients to estimate plant nutrient availability using a traditional soil fertility analysis package for the Northeast. Measured levels are interpreted in our framework for sufficiency and excess but are not crop specific. The measured values for pH, extractable phosphorus and potassium are scored and integrated into the CASH Report (see page 58). Selected secondary nutrients and micronutri-ent (magnesium, iron, manganese and zinc) analyses are combined into one rating for the report.
Basic protocolsPlant Available Nutrients:
Extractable Phosphorus
Extractable Potassium
Magnesium
Iron
Manganese
Zinc
pH:
Analysis Method:
Nutrients are extracted from soil by shaking with Modified Morgan’s solution, an ammonium acetate plus acetic acid solution buffered at pH 4.8. After shaking, the extraction slurry is filtered through a paper filter, and the filtrate is analyzed on an inductively coupled plasma emission spec-trometer (ICP, Spectro Arcos) for the elements Al, As, B, Ba, Be, Ca, Cd, Co, Cu, Fe, Li, Mg, Na, P, Pb, S, Se, Sr, Ti, V, Zn and Cl. As part of the soil health assessment, P, K, Mg, Fe, Mn, and Zn are scored and included in the report.
The pH of a suspension of two parts water to one part soil is determined by pH electrode probe, using a Lignin pH robot.
Extractable Phosphorus is a measure of phosphorus (P) availability to a crop. P is an essential plant macronutrient, as it plays a role in photosynthesis, respiration, energy storage and transfer, cell division, cell enlargement, and several other process in plants. Its availability varies with soil pH and mineral composition (Figure 2.39, following page). Low P values indicate poor P availability to plants. Excessively high P values indicate a risk of adverse environmental impact. P can be considered a contaminant and runoff of P into fresh surface water will cause damage through eutrophication, for this reason over application is strongly discouraged, especially close to surface water, on slopes, and on large scales.
Extractable Potassium is a measure of potassium (K) availability to the crop. K is an essential plant macronutrient that plays a role in photosynthesis, respiration, energy storage and transfer, regulation of water uptake and loss, protein synthesis, activation of growth related enzymes, and other processes. Plants with higher potassium tend to be more tolerant of frost and cold. Thus, good potassium levels may help with season extension. While soil pH only marginally affects K availability, K is easily leached from sandy soils and is only weakly held by increased OM, so that applications of the amount removed by the specific crop being grown are generally necessary in such soils.

56 Comprehensive Assessment of Soil Health - The Cornell Framework
Part II - Soil Health Assessment
FIGURE 2.39. Relationship between soil pH and plant nutrient availability in soil solution. Modified from Brady and Weil (1999)
Minor Elements, also called secondary nutrients (calcium, magnesium and sulfur) and micronutrients (iron, manganese, zinc, copper, boron, molybdenum, etc.) are essential plant nutrients taken up by plants in smaller quantities than the macronutrients N, P, and K. If minor elements are deficient, decreased yield and crop quality may result. Toxicities can also occur when concentrations are too high. The CSHL’s minor elements rating indicates whether four measured nutrients (magnesium, iron, manganese, and zinc) are deficient or excessive (Table 2.03, page 58). Micronutrient availability is strongly influenced by pH and OM. Low pH increases the availability of most micronutrients, whereas high pH increases the availability of others (see Figure 2.39). High OM and microbial activity tend to increase micronutrient availability. Note that CASH does not measure all important micronutrients, however a complete micronutrient analysis is available if this information is needed (cnal.cals.cornell.edu).
Soil pH is a measure of how acidic the soil is, which controls how available nutrients are to crops. Optimum pH is around 6.2-6.8 for most crops (exceptions include potatoes and blueberries, which grow best in more acidic soil). If pH is too high, nutrients such as phosphorus, iron, manganese, copper and boron become unavailable to the crop. If pH is too low, calcium, magnesium, phosphorus, potassium and molybdenum become unavailable (Figure 2.39). Lack of nutrient availability will limit crop yields and quality. Aluminum toxicity can also be a concern in low pH soils, which can severely decrease root growth and yield, and in some cases lead to accumulation of aluminum and other metals in crop tissue. In general, as soil organic matter (SOM) increases, crops can tolerate lower soil pH. Soil pH also influences the ability of certain pathogens to thrive, and of beneficial organisms to effectively colonize roots.
How nutrient analysis results relate to soil function
Nutrient availability is critical to crop production. Of the eighteen elements needed by plants, only three— nitrogen (N), phosphorus (P), and potassium (K)—are commonly deficient in soils. Deficiencies of micro-nutrients such as magnesium (Mg), sulfur (S), boron (B), manganese (Mn) and zinc (Zn) can occur, but it is unusual. Crops do not grow properly if nutrients are not present at the right time of the season in sufficient quantities and in balance with one another. When plants don’t grow well they are more susceptible to disease, loss of yield, and poor crop quality which leads to reduced economic returns.
Excessive nutrient application may also create problems that lead to poor plant growth or to environmental degradation. These concerns have resulted in more emphasis on better management of N and P as their excessive use contributes to surface and groundwater degradation and to greenhouse gas emissions.
Managing nutrients on the farm is critical to general plant health and pest management. If a soil has good tilth, drainage and supply of organic matter, limited subsurface compaction and adequate water, plants should be healthy and have expansive root systems. This enables plants to efficiently take up nutrients and water from the soil and to use those nutrients to produce higher yields.
Conventional soil nutrient analyses are based solely on chemical extraction and are used to recommend the type and quantity of nutrients to add through amendments, as well as whether pH needs to be adjusted for improved nutrient availability from the soil. This approach has been used to guide farmers since the middle of the last century. Until very recently, the influence of physical and biological processes on plant nutrient availability have not been taken into account.

Comprehensive Assessment of Soil Health - The Cornell Framework 57
Soil Health Assessment - Part II
Managing constraints and maintaining optimal nutrient availability
The best single overall strategy for nutrient management is to build organic matter (OM) in a soil to optimize the cascading positive effects on a range of physical, biological and chemical properties. Specific examples of management that promote nutrient availability (solubility) includes maintaining optimal pH (Figure 2.39) through lime or wood ash applications, and adding organic material to help immobilize (make less soluble) aluminum and heavy metals. Cover crops, such as buckwheat, which is good at mining otherwise unavailable P, can be used to make P more available. Another option is to grow plants which can associate with mycorrhizal fungi to facilitate increased P availability as well as other nutrients and water. In general, improved understanding of the suite of limiting soil fertility and crop productivity factors is important to realize appropriate soil and nutrient management decisions.
Management of fertilizers and liming amendments has been well researched and communicated worldwide and therefore many resources are available on this topic. We briefly summarize some important concepts related to soil health below.
Nutrient balances
Once adequate nutrient levels are present in the soil, nutrients still have to be imported to a farm and added to the soil. The amounts added must be adequate to replace nutrients that leave the farm through products that are harvested and sold, or that leave through environmental losses, or else these nutrients are essentially mined by plant uptake until they become deficient. As previously stated, maintaining optimal pH through lime or wood ash applications, and adding organic matter, will help immobilize aluminum and heavy metals, and contribute to maintaining proper nutrient availability.
Biological and physical influences on nutrient availability
Nitrogen is the only nutrient that can be biologically “produced” on farm. Legumes and their symbiotically associated rhizobia can fix unavailable, but plentiful N2 from the air, transforming it to plant available forms. Nitrogen is also the most dynamic of the nutrients – which is to say its availability in soil changes rapidly as it is influenced by weather, physical soil condition, microbial activity, and the availability of organic materials. Its dynamic nature is why N is neither extracted nor assessed in CASH. Although in-season soil N testing is available (cnal.cals.cornell.edu), employing models that account for the impact of weather on fertilizer needs (adapt-n.com), along with soil testing, is likely the future of nitrogen management.
Other nutrients can only come from soil minerals, organic matter, and external sources of fertility, although biota can help in making these more available to plants. Availability of nutrients present in the root zone is very much influenced by soil microbes and plant roots. For example, some cover crops, such as buckwheat, are good at mining otherwise unavailable P so that it becomes more available to the following crop. When plants associate with mycorrhizal fungi, these can help make P (and other nutrients and water) more available to the crop. The influence of biological and physical processes is generally not taken into account by standard extractants such as the one used in the CASH analysis. There is active research ongoing to adjust fertility rec-ommendations, using additional physical and biological information, such as indicators of microbial species presence and activity.
Cover crops planted between rows of corn.

58 Comprehensive Assessment of Soil Health - The Cornell Framework
Part II - Soil Health Assessment
Scoring functionsScoring function graphs are shown below for pH, extractable phosphorus (P) and potassium (K) on coarse, medium, and fine textured soils (Figure 2.40 A-C). Scoring functions were combined for all textural classes because no effects due to texture were observed. For pH, a score of 100 is assigned for values between 6.4-7.3 and 5.3-6.3 for normal and acidic crops, respectively. Concentration values for P between 3.5-21.5 ppm and ≥ 74.5 ppm for K are given a maximum score of 100. Scores are not crop specific.The red, orange, yellow, light green and dark green shading in the figures below reflect the color coding used for the CASH summary report.
TABLE 2.03 A-B. The optimal value ranges (ppm) for micronu-trients for all soil textural classes. Individual micronutrient subscores can be either 0 (sub-optimal) or 100 (optimal), based on the values. The overall micronutrient score is determined using the mean of the four subscores.
FIGURE 2.40 A-C. Scoring function graphs for pH (A), extractable phosphorus (B) and extractable potassium (C) for Coarse (C), Medium (M) and Fine (F) textural classes.
A
B
C
The micronutrient rating in the CASH Summary Report is reported as one score from determining the mean of the four subscores for Mg, Fe, Mn and Zn. To begin (Table 2.03 A), each individual micronutrient value (ppm) is assigned a subscore of either ‘0’ (sub-optimal) or ‘100’ (optimal), independent of texture. Next (Table 2.03 B), if the mean of all four micronutrient subscores are adequate, the subscore is 100 which also equates to an overall micronutrient score of 100 (excellent), and is color coded dark green in the report. However, if one micronutrient value is deficient or excessive, the mean of all four micronutrient subscores is 75 which equates to an overall micronutrient score of 56 (moderate), and is yellow in the report. If a combination of two, three, or four micronutrients values are deficient or excessive, the mean subscore is 50, 25 or 0, respectively, and equates to an overall micronutrient score of 11, 4 or 0 (poor), color coded red in the report.
A
B

Comprehensive Assessment of Soil Health - The Cornell Framework 59
Soil Health Assessment - Part II
Add-on Test: Potentially Mineralizable Nitrogen
Potentially Mineralizable Nitrogen (PMN) is an indicator of the capacity of the soil microbial community to convert (mineralize) nitrogen tied up in complex organic residues into the plant available form of ammonium.
This indicator has been replaced with the soil protein and respiration measurements in the CASH package, as those two separately indicate the activity of the microbial community in aerobic conditions and the availability of N containing organic residues. However, PMN is still available as an add-on test (page 60).
Basic protocol (adapted from Drinkwater et al.)14
Soil samples are anaerobically incubated for 7 days, and the amount of ammonium produced in that period is measured as an indicator of nitrogen miner-alization. Specifically -
· As soon as possible after sampling, the fresh soil sample (stored at 40°F) is sieved.
· Two 8g soil samples are placed into 50 ml centrifuge tubes.
· 40 ml of 2.0 M potassium chloride (KCl) solution is added to one of the tubes, which is shaken on a mechanical shaker for 1 hour, and filtered
· 20 ml of the filtrate is collected from this tube and analyzed for ammonium concentration, as a measure of pre-incubation ammonium.
· 10 ml of distilled water is added to the second tube, which is hand shaken, capped with a nitrogen gas (N2) atmosphere, and incubated for 7 days at 30°C (86°F).
· After the 7 day anaerobic incubation, 30 ml of 2.67 M KCl is added to the second tube (creating a 2.0 M solution). The tube is shaken, filtered, and the filtrate is collected and analyzed for ammonium concentration (Figure 2.41).
· The difference between the pre-incubation and post-incubation measurements is used as an indicator of N mineralization.
How PMN relates to soil function Nitrogen is the most limiting nutrient for plant growth and yield in most agricultural situations (Figure 2.42, following page). Almost all of the nitrogen stored in crop residues, soil organic matter, manures and composts is in the form of complex organic molecules (e.g., proteins) that are not available to plants (i.e., cannot be taken up by plant roots). We rely on several microbial species to convert this organic nitrogen into the ammonium and nitrate forms that plant roots can utilize (Part I, Figure 1.10). The PMN test provides us with one indication of the capacity of the soil biota to recycle organic nitrogen that is present into plant available forms.
Managing constraints and maintaining optimal nitrogen mineralizationBuilding and maintaining healthy, biologically active soil with large reserves of decomposting plant tissue in organic form is a good approach to provide a crop with its N needs over time. In contrast, plants may not immediately use soluble forms of applied N and it may be lost to the environment. Soils with high levels of nitrogen-rich organic matter tend to have the highest populations of microbes involved in nitrogen mineralization and the highest PMN rates. Organic forms of N reserves are built over years and should be maintained to the extent possible.
FIGURE 2.41. Potentially Mineralizable Nitrogen (PMN) processed in the lab. The difference between pre-incubation and post-incubation ammonium measurements is used as an indicator of N mineralization.

60 Comprehensive Assessment of Soil Health - The Cornell Framework
Part II - Soil Health Assessment
FIGURE 2.42. Nitrogen is the most limiting nutrient in crop production. The two rows of sweet corn on the left are severely nitrogen deficient.
Accumulation and retention of N in organic matter as well as stimulation of a soil’s biological activity is improved by keeping the soil covered with plants or residues throughout the season, increasing diversity of species in the system through rotations, interseeding, or intercropping, adding fresh, microbially degradable amendments, growing biomass in place by maintaining living roots for as much of the year as possible and by reducing the use of biocides such as pesticides, fungicides, and herbicides (Part III)
Beneficial soil biological activity tends to decrease with increased soil disturbance such as tillage, heavy traffic, and compaction, as well as with extremes in low or high pH, or contamination by heavy metals or salts.
Scoring functionResults of the Potentially Mineralizable Nitrogen analysis are provided in a table sent as a separate file outside of the CASH report. However, measured values are scored using the scoring function in Figure 2.43 below. Scoring functions were combined for all textural classes because no effects due to texture were observed in the data set.
The red, orange, yellow, light green and dark green shading reflects the color coding used for scoring PMN results (see page 73). It should be noted that while none of the scoring functions currently are calibrated to decline with very high nitrogen mineralization potential, extremely high N mineralization could increase losses of N to the environment through runoff, leaching and denitrification and thus impact water and air quality.
FIGURE 2.43. Potentially Mineralizable Nitrogen (PMN) scoring functions and upper limits for Coarse (C), Medium (M) and Fine (F) textural classes. Mean and standard deviation (in parenthesis) is provided. In this case higher scores indicate potentially higher levels of N rich organic matter, indicating higher levels of microbial population involved in N mineralization.
Add-on testsThe suite of soil analyses in the Cornell Assessment of Soil Health packages are all available as individual tests. Certain analysis, such as Potentially Mineralizable Nitrogen, are not part of the Basic or Standard packages but are available as add-ons or as individual tests. A complete list of the packages we offer in addition to the add-on tests is available on our website at bit.ly/CSHLPackages.
CSHL Potentially Mineralizable Nitrogen Standard Operating Procedures (CSH 08) can be found under the ‘Resources’ tab on our website.

Comprehensive Assessment of Soil Health - The Cornell Framework 61
Soil Health Assessment - Part IIAdd-on Test: Root Health Bio-assayThe Root Health Bio-assay test is a measure of the degree to which sensitive test-plant roots show symptoms of disease when grown for a set time in controlled conditions. It is assessed by visual inspection after roots are washed, for root size, color, texture and the presence or absence of damage potentially from root pathogens. Pathogen pressure is given a rating from 2 to 9, with higher numbers indicating greater pathogen-induced damage.
Commonly found soil pathogens include the fungi Fusarium, Rhizoctonia, and Thielaviopsis, and the oomycete Pythium. High pathogen pressure identified by the assay indicates that disease-causing organisms are present, and that other members of the microbial community are not successfully suppressing them. Lower pressure indicates either that few pathogens are present, or that the rest of the microbial community is able to prevent them from success-fully colonizing the roots.
Basic protocol (adapted from Abawi et al.)15
· Approximately 200 ml of fresh soil is placed in each of 4 cone-tubes which have cotton balls placed in the bottom to prevent soil loss through the drainage holes (Figure 2.44 A).
· Each tube is planted with one green bean seed. Com-mercially available, treated seeds are used to more closely represent on-farm conditions (B).
· The hilum (curved) side of the seed is placed flat, hori-zontally, to encourage successful seed germination and emergence (straight vertical shoots).
· The plants are maintained in a greenhouse under supple-mental light and watered regularly for 4 weeks (C).
· The plants are removed from their containers and the roots washed and rated as described in the examples shown to the right.
Rating system
2 = White and coarse textured hypocotyl and roots; healthy (Figure 2.45 A);
4 = Light discoloration, with lesions covering up to a maximum of 10% of hypocotyl and root tissues (B);
6 = Moderate damage, with lesions covering approximately 25% of hypocotyl and root tissue, with tissues remaining firm (C);
7 to 9 = Advanced damage and decay, with 50 to 75% (or more for higher ratings) of hypocotyl and roots showing lesions and severe symptoms of pathogen damage (D).FIGURE 2.44 A-C. Root Pathogen Pressure test in the
greenhouse using green bean seed.
A
B
C
A B
C D
FIGURE 2.45 A-D. Root Health Bio-assay rating system.

62 Comprehensive Assessment of Soil Health - The Cornell Framework
Part II - Soil Health Assessment
While one-size-fits-all pathogen pressure assays for lab testing of soils are difficult to devise, several relevant options for certain crops and pathogens are available. For vegetable production systems, a soil bio-assay with beans was shown to be highly effective in assessing root pathogen pressure as a component of overall soil health. Beans are susceptible to the major pathogens that impact vegetable, legume, and forage crops grown in the Northeast region, which makes them suitable as an indicator plant. The selection of other indicator plants might be needed for the proper assessment of root pathogen pressure of soils in different production systems.
Managing constraints and maintaininglow pathogen pressureTo manage root pathogen pressure constraints in the field, make sure to evaluate rotations and cover crops for their ability to suppress pathogens, and especially avoid consecutively planting hosts of the same pathogen. Some cover crops (e.g. sorghum-sudangrass, mustards) can be used to effectively biofumigate against certain pests and pathogens. Plants differ in their efficacy as hosts for various pests. Some produce compounds that inhibit or suppress pathogens, or may stimulate microbial communities that are antagonistic or parasitic to crop pathogens.
Organic matter inputs from rotational and cover crops, green manures, and composts have a major impact (both positive, and negative if poorly chosen) on populations of soilborne microbial pathogens, plant parasitic nematodes, and other pests. Plant residues remaining from previous crops that have been diseased can harbor pathogens and serve as a source of inoculum in following seasons, allowing disease to spread. This makes rotation all the more important. It is also important to alleviate physical and chemical plant stressors that make crops more susceptible to pathogen attack, such as poor drainage, high compaction, poor irrigation practices, or nutrient deficiencies (see Part III).
How root health bio-assay relatesto soil functionPathogen pressure refers to the degree to which plants encounter potentially growth-limiting attack by disease causing organisms. This is a function of:
• the presence of pathogens
• the compatibility between pathogens and the plants that are growing
• environmental conditions including which other microbial communities are present at the time, weather, and soil physical and chemical character-istics, particularly those that can stress plants or make them more susceptible to pathogen attack, such as poor drainage, high compaction, or nutrient deficiencies (Figure 2.46).
Healthy roots are essential for vigorous plant growth and high yield as a large root mass can efficiently obtain nutrients and water from soil. Root pathogene-sis negatively impacts plant growth and root effective-ness, as well as limiting interaction with beneficial root associated microbiota (Part I, page 16).
Host
Pathogen Environment
FIGURE 2.46. Disease Triangle, illustrating the interaction between susceptible host, compatible pathogen, and conducive environmental conditions necessary for the development of plant disease. For example: strawberry plants in the presence of the strawberry pathogen Botrytis cineria, in wet environmental conditions, will likely become infected with Botrytis grey mold.

Comprehensive Assessment of Soil Health - The Cornell Framework 63
Soil Health Assessment - Part II
Add-on testsThe suite of soil analyses in the Cornell Assessment of Soil Health packages are all available as individual tests. Certain analysis, such as the Root Health Bio-assay, are not part of the Basic or Standard packages but are available as add-ons or as individual tests. A complete list of the packages we offer in addition to the add-on tests is available on our website at bit.ly/CSHLPackages.
NOTE: Due to APHIS regulations we cannot perform the bio-assay on soils from specific areas of the country. Please visit bit.ly/CASHRegulatedCounties for a complete list of states and counties that fall into this category.
CSHL Root Health Bioassay Rating Standard Operating Procedures (CSH 09) can be found under the ‘Resources’ tab on our website.
Soil health management keys to preventing pathogen pressure: - keep note of seed, seedling, and mature plant
health and disease throughout growing season
- improve sanitation of tools and equipment
- carefully manage diseased plant residues
- rotate with non-compatible or resistant crops and cover crops
- limit environmental conditions that are conducive to disease spread
- foster beneficial and disease suppressive microbial communities
FIGURE 2.47. The Root Health Bioassay Rating scoring function and upper limits for Coarse (C), Medium (M) and Fine (F) textural classes. Mean and standard deviation (in parenthesis) is provided. In this case, a lower score is better and indicates there is little pathogen pressure in the field.
Scoring functionThe graph below depicts the Root Health Bio-assay rating scoring function and upper value limits for coarse, medium, and fine textured soils (Figure 2.47). Scoring functions were combined for all textural classes because no effects due to texture were observed in the data set.
The red, orange, yellow, light green and dark green shading reflects the color coding used for the ratings on the soil health report summary page (see page 73).

64 Comprehensive Assessment of Soil Health - The Cornell Framework
Part II - Soil Health Assessment
Add-on Test: Heavy Metal Contamination16
Heavy metal testing (also sometimes called total elemental analysis) is available for situations where contamination is suspected, or as a precaution by identifying whether contamination from past human activities (such as high traffic, industrial or commercial activity, spills, or pesticide application) is affecting the site. Heavy metals such as arsenic, barium, cadmium, chromium, copper, lead, nickel, zinc are measured.
It is important to understand that levels of metals can vary greatly across a site, and sometimes at a very small scale, so additional samples may be needed.
More information is available from the Cornell Waste Management Institute’s “Guide to Soil Testing and Interpreting Results” (available at cwmi.css. cornell.edu/guidetosoil.pdf).
Basic protocol (Total Soil Digestion)
· A dried soil sample is digested in concentrated acid at high temperature.
· Particulates in the digestate are removed by filtration, centrifugation, or by allowing the sample to settle.
· The sample is analyzed by inductively coupled plasma (ICP) or flame atomic absorption (AA) instruments (below).
Method details differ among different labs: Different acids, temperatures, and heating mechanisms are used, and improvements to methods are still being made. Nitric acid, perchloric acid, or a combination of the two are common acids. Heating methods include microwave digestion, hot plate digestion, and automated instruments. Depending on the method, additional acid or other reagents may be added. The Cornell Nutrient Analysis Laboratory generally follows their own procedures. In some cases they follow EPA protocols. Detailed information is available at cnal.cals.cornell.edu.
In some situations less expensive screening tests (e.g., for lead) may be appropriate. Some laboratories (including the Cornell Nutrient Analysis Laboratory) offer total elemental analysis with lead screening.
Screening procedures may involve methods similar to the previously described protocol, or may use technology such as x-ray fluorescence instruments.
For current and complete Standard Operating Procedures, please contact the Cornell Nutrient Analysis Lab (cnal.cals.cornell.edu). The following information about interpreting results generally applies to both screening tests and total elemental analysis.
How Heavy Metals relate to soil functionSoil characteristics can affect the transport and fate of heavy metals, and whether they can be readily taken up by plants or animals. Most heavy metals (e.g., barium, chromium[+3], copper, lead) are adsorbed strongly to clays and organic matter, which limits the potential for plants to take these up when soil pH is not in the acid range (Figure 2.39, page 56). A few - notably cadmium, nickel and zinc - may remain soluble enough at near-neutral pH to be excessively taken up by plants from contaminated soils. For most heavy metals, uptake (via plant roots) into food crops may be higher if soil is acidic (pH < 5-6), high in salts, or low in organic matter (Figure 2.48, following page). Arsenic adsorbs poorly on organic matter, but well on clays and iron oxides, and is more available to plants in non-acid (pH > 6) than acid soils.
Additionally, heavy metals (e.g., copper, nickel, zinc) at elevated concentrations in soil may suppress natural microbial processes. For example, soil copper at high levels inhibits organic matter decomposition (Figure 2.49, following page).
2 Soil and Crop Sciences Section Comprehensive Assessment of Soil Health - soilhealth.cals.cornell.edu
For more information contact:
Cornell UniversitySoil Health Laboratorybit.ly/SoilHealthContacts
Harold van Es
Robert Schindelbeck
Aaron Ristow, Kirsten Kurtz
M. McBride, H. Shayler and the
Cornell Waste Management Institute
March 2017
AcknowledgementThanks to the NE Sustainable Agriculture Research & Education Program, New York Farm Viability Institute, USDA-NRCS and Cornell Cooperative Extension for funding and support of the Cornell Soil Health program.
This fact sheet represents the best professional judgment of the authors and does not necessarily reflect the views of the funders or reviewers.
Add-on Test: Heavy Metal ContaminationAdd-on testsThe suite of soil analyses in the Cornell Assessment of Soil Health packages are all available as individual tests. Certain analyses, such as Heavy Metal Contamination, are not part of the Basic or Standard packages but are available as add-ons or as individual tests. A complete list of the packages we offer in addition to the add-on tests is available on our website at bit.ly/CSHLPackages.
Basic protocol• A dried soil sample is digested in concentrated acid at
high temperature.• Particulates in the digestate are removed by filtration,
centrifugation, or by allowing the sample to settle.• The sample is analyzed by an inductively coupled
plasma (ICP) instrument that identifies and quantifies individual elements accurately and precisely (Fig. 2).
Interpreting heavy metals resultsLaboratories report concentrations of measured elements in mg/kg or ppm. Results can inform decisions about how to manage a site, farm, or garden, and other activities to promote healthy soils, high quality crops, and efforts to protect human health by reducing exposure to contaminants. Yet, under-standing heavy metal results is not always an easy task. There is no single standard for acceptable concentrations in the soils of farms, gardens, or residential yards. Some guidance can be found by comparing soil test results to soil background levels or state guidance values, where these are available. Guidance values are given outside of the CASH report. This guidance was developed by the NYSDEC and the NYS DOH for environmental remediation programs (Table 1).
MetalLevel in soil (parts per million [ppm])
Guidance Value Protective of Public Health
NYS Rural Background
Level
NYC Urban Background Level
Arsenic 16 < 0.2 - 12 4.1 - 26
Barium 350 4 - 170 46 - 200
Cadmium 2.5 < 0.05 - 2.4 0.27 - 1.0
Chromium 36 1 - 20 15 - 53
Copper*** 270 2 - 32 23 - 110
Lead 400 3 - 72 48 - 690
Mercury 0.81 0.01 – 0.20 0.14 – 1.9
Nickel*** 140 0 - 25 10 - 43
Zinc*** 2200 10 - 140 64 - 380
* See NYSDEC 2006, NYSDEC and NYSDOH 2005, Retec Group, Inc. 2007
** http://cwmi.css.cornell.edu/Metals_Urban_Garden_Soils.pdf
*** Can be toxic to plants below health-based guidance values
TABLE 1. Guidance values and background levels of metals commonly found in garden soils*. See Healthy Soils, Healthy Communities resource Metals in Urban Garden Soils** for more information.
Although the values were developed by New York State, they can be used elsewhere as a guide when considering human health and the environment. The guidance values for residential scenarios are typically the most appropriate reference point for farmers, gardeners, homeowners, and others.
It is not uncommon to find heavy metals in soil at levels near or above guidance values. Health risks associated with metals in soils at levels slightly or moderately above guidance values cannot be ruled out, but are likely to be low. High levels of exposure can be associated with health effects, and the higher the levels are, the greater the risks.
Regarding plant health, some heavy metals (such as Zn) can be toxic to plants (phytotoxic) at levels below human health-based guidance values. In contrast, some heavy metals (e.g. Cd or Pb) do not adversely affect the health of the plant at levels that would be a concern for human health.
For a more comprehensive overview of soil health concepts including a guide on conducting in-field qualitative and quantitative soil health assessments, please download the Cornell Soil Health Manual at bit.ly/SoilHealthTrainingManual.
FIGURE 2. (Left) Heavy metal samples are analyzed by an inductively coupled plasma (ICP) instrument. (Right) Every element has a unique spectrum that can be identified and quantified.
Barium
r
Strontium
Yttrium
Barium
Cupper
Sodium
ICP-OES Spectral Display
Barium
Yttrium
Copper
Sodium
Strontium
(Left) Heavy metal samples are analyzed by an inductively coupled plasma (ICP) instrument. (Right) Every element has a unique spectrum that can be identified and quantified.

Comprehensive Assessment of Soil Health - The Cornell Framework 65
Soil Health Assessment - Part II
Interpreting heavy metals results17
Laboratories report the concentrations of measured elements in mg/kg or ppm, which are equivalent. Results can inform decisions about how to manage a site, farm, or garden, and other activities, to promote healthy soils, high quality crops, and efforts to protect human health by reducing exposure to contaminants. Yet, understanding heavy metals results is not always an easy task. There is no single standard for acceptable concentrations in the soils of farms, gardens, or residential yards. Some guidance can be found by comparing soil test results to soil background levels or state guidance values, where these are available.
Guidance values are given outside of the CASH report. Our guidance was developed by the New York State (NYS) Department of Environmental Conservation (DEC) and the NYS Department of Health (DOH) for environmental remediation programs (NYSDEC SCOs, 2006, Table 2.04).
Although these values are developed by the NYSDEC and the NYSDOH for state environmental remediation programs, they can be used elsewhere as a guide when considering human health and the environment. The guidance values for residential scenarios are typically the most appropriate reference point for farmers, gardeners, homeowners, and others.
It is not uncommon to find heavy metals in soil at levels near or above guidance values. Health risks associated with metals in soils at levels slightly or moderately above guidance values cannot be ruled out, but are likely to be low. High levels of exposure can be associated with health effects, and the higher the levels are, the greater the risks.
Regarding plant health, some heavy metals (such as Zn) can be toxic to plants (phytotoxic) at levels below human health-based guidance values (Harrison et al. 1999)18. For example, copper can cause toxicity and stunted growth in some crops at concentrations above 75-100 ppm in soil. This is more likely to be a concern if pH is low. Nickel can cause toxicity and stunted growth in some crops at concentrations above 40-60 ppm (Figure 2.50). Zinc levels above 150 ppm may cause toxicity and stunted growth in some crops. However, at near-neutral pH (6.5 - 7.5), zinc is insoluble enough that toxicity to plants would require zinc levels above 200 ppm.
In contrast, some heavy metals (e.g. Cd or Pb) do not adversely affect the health of the plant at levels that would be a concern for humans. Keep in mind the type of crops being consumed also have varying levels of contaminants, depending on what part of the plant is being consumed (Table 2.05, page 67).
FIGURE 2.48. Lead uptake by vegetables is greater in low pH soil, and differs by crop type. Source: Healthy Soils, Healthy Communities Project
FIGURE 2.49. Simple colorimetric test for microbial inhibition in copper (Cu)-contaminated soils after 3 weeks of incubation. Indigo carmine was used as redox indicator to measure O2 consumption (indicating healthy microbial activity) in Arkport soils spiked with CuSO4 10 years earlier. Source: M. McBride

66 Comprehensive Assessment of Soil Health - The Cornell Framework
Part II - Soil Health Assessment
Managing heavy metals in soil19
When developing a site management plan for a con-taminated site, it is important to balance the many known benefits of farming, gardening, outdoor recreation, and consuming fresh fruits and vegetables with possible risks from exposure to soil contaminants.
Soil amendments are an important technique for mitigating heavy metals in soils. For example, organic matter (composts, peat) forms strong complexes with heavy metals such as lead and cadmium, and limits availability to plant roots. Lime additions raise soil pH, reducing solubility and plant availability of most metals. Phosphate has been shown to reduce lead solubility under some circumstances, though it is generally not effective or practical for non-acid soils where lead solubility is already low.
MetalLevel in soil (parts per million [ppm])
Guidance Value Protective of Public Health
NYS Rural Background Level
NYC Urban Background Level
Arsenic 16 < 0.2 - 12 4.1 - 26
Barium 350 4 - 170 46 - 200
Cadmium 2.5 < 0.05 - 2.4 0.27 - 1.0
Chromium 36 1 - 20 15 - 53
Copper** 270 2 - 32 23 - 110
Lead 400 3 - 72 48 - 690
Mercury 0.81 0.01 – 0.20 0.14 – 1.9
Nickel** 140 0 - 25 10 - 43
Zinc** 2200 10 - 140 64 - 380
* See NYSDEC 2006, NYSDEC and NYSDOH 2005, Retec Group, Inc. 2007
** Can be toxic to plants below health-based guidance values
TABLE 2.04. Guidance values and background levels of metals commonly found in garden soils*. See Healthy Soils, Healthy Communities resource Metals in Urban Garden Soils for more information.
FIGURE 2.50. Increasing levels of nickel (Ni) contamination impede plant growth. Source: M. McBride

Comprehensive Assessment of Soil Health - The Cornell Framework 67
Soil Health Assessment - Part II
Crop Type Considerations
RootMore likely to have higher levels of contaminants because edible portion grows directly in soil
Leafy Greens and Herbs
More likely to have higher levels of contaminants because of dust/soil splash
FruitPlant barriers help prevent contamination; surface contamination can be washed off of most fruits more easily
TABLE 2.05. Crop type and contaminant considerations for managing heavy metals in soils.
Managing heavy metals in soil continued
Using plants to remove heavy metals from soil (a type of phytoremediation) is generally not effective for reducing metals levels in farm or garden soils. Many metals are not readily taken up into plant tissue when soil pH is near neutral (6.5 – 7.5). For those metals that are more easily taken up by plants (such as cadmium, copper, nickel, and zinc), the plants that take them up most readily are also relatively small in stature and slow growing, and they will take many years to “clean up” soils with metal levels even moderately above guidance values. Also, unlike some other contaminants, metals are chemical elements and therefore are not broken down into less toxic compounds by phytoremediation. Metals that are removed from the soil are relocated into the roots or other parts of the plants, which means the plants must be disposed of properly, and not eaten or composted.
Add-on testsThe suite of soil analyses in the Cornell Assessment of Soil Health packages are all available as individual tests.
Certain analysis, such as Heavy Metal Contamination, are not part of the Basic or Standard packages but are available as add-ons or as individual tests.
A complete list of the packages we offer in addition to the add-on tests is available on our website at bit.ly/CSHLPackages.
Photo: Sandor Weisz via Flickr (CC BY-NC)

68 Comprehensive Assessment of Soil Health - The Cornell Framework
Part II - Soil Health Assessment
Washing garden-grown vegetables. Gardening in a raised bed with clean soil and landscape fabric barrier.
Amending soil with compost.
FIGURE 2.51 A-C. Strategies to help reduce risk of heavy metal contamination in urban soils.
A
B C
Additional risk-minimizing strategies· If needed, add clean soil or organic matter;
adjust soil pH; promote good drainage (Figure 2.51 A).
· Wash hands / wear gloves when working with soil.
· Keep soil from coming indoors on shoes, pets, or clothing.
· Keep an eye on children.
· Avoid or contain contaminated areas: use raised beds where appropriate for growing edible crops (B); mulch, plant ground cover, or otherwise cover areas of bare soil to reduce dust.
· Wash produce well to remove soil particles from plant surfaces, and peel root crops (C).
· If contamination is a concern, consider planting food crops that are least likely to have contaminants on or in them (like fruits) or grow ornamental plants.
· Avoid or limit activities that can increase soil contamination, such as the use of certain fertilizers and treated wood.

Comprehensive Assessment of Soil Health - The Cornell Framework 69
Soil Health Assessment - Part II
FIGURE 2.52. Electrical conductivity (EC) meter used to measure salinity.
Soils become saline when the concentration of soluble salts (mostly made up of compounds of Mg+2, Ca+2, Na+, K+, Cl-, SO4
-2, HCO3- and CO3
-2) in the soil profile becomes excessive. Salinity can be measured by electrical conductivity, and this is offered as the ‘soluble salts add-on’ with a Cornell Soil Health Assessment. Sodic soils are those with excessive sodium ion concentra-tions, relative to magnesium and calcium, measured by the sodium adsorption ratio (SAR). These conditions may occur together or separately.
The SAR is not currently available from the CSHL. Although salinity and sodicity are often mistaken as the same thing, they are in fact quite different from each other. We include the comparison between salinity and sodicity here for clarification.
Basic protocol (adapted from Rhoades)20
Electrical Conductivity (EC) - to measure salinity
Soluble salts are extracted from the soil with water, in a 1:1 soil:water suspension by volume, and the electrical conductivity of the supernatant is determined as follows:
- 20ml of distilled deionized water are added to 20 ml of dried ground soil and stirred;
- Suspension is settled for one hour;
- Electrical conductivity of the supernatant is measured with a calibrated conductivity meter (Figure 2.52).
Add-on Test: Salinity
Saline soil effects on plants: - Drought stress symptoms
- Wilting
- Stunted growth
- Necrosis (death of cells or tissues) of leaf tips
- Toxicities from build-up of certain elements
- Certain plants are more tolerant to salt
Sodic soil effects: - Sodium disperses soil particles
- Soil particles do not aggregate
- Clay particles fill in soil pore spaces
- Limited or no water and air movement
- Difficult to impossible for plant growth in sodic soils
How salinity and sodicity relate to soil functionProblems with salts (salinity) and sodium (sodicity) may occur naturally, but are especially prevalent under irrigated agriculture in semi-arid and arid areas, where water from rainfall would not otherwise be adequate for crop production. This situation is prevalent in western regions of the United States. It is also prevalent in high tunnels and greenhouses used for season extension in the Northeast – these are effectively irrigated deserts when they are covered year-round. Localized saline-sodic soils may also occur in coastal regions when soils are affected by sea water, or in urban areas in cold climates where salt de-icing materials are used. Salinity and Sodicity have severe impact on growing crops through very different mechanisms.

70 Comprehensive Assessment of Soil Health - The Cornell Framework
Part II - Soil Health Assessment
How salinity and sodicity relate to soil function continued
High salinity decreases the osmotic potential of the soil water relative to plant water. This means that the crops must exert more energy to get water from a saline soil, which holds the water more tightly. Therefore soils with high salinity could have sufficient water but growing crops will lack access to it and may wilt and die (Figure 2.53 A and B). In addition, high concentrations of some elements that make up the salts in the soil such as sodium and chloride can become toxic for some plants, affecting their metabolism and consequently reducing their growth.
High sodium concentrations break down soil structure, as sodium replaces calcium and magnesium on mineral surfaces. This prevents fine particles from sticking to each other, so that aggregates are dispersed into single grains. A sodium-affected soil becomes crusted and severely compacted, so that water cannot properly infiltrate or drain, and water storage is diminished as well (C) (page 45). This has a major impact on soil physical functioning, so that crops will not be able to grow properly. Sodic soils also have high pH, negatively affecting the availability of certain nutrients like phosphorus.
Managing salinity and sodicity concerns
Salinity and sodicity problems have multiple causes and may be difficult to address. In general, salts can be leached out of the soil with the application of excess water through natural rainfall or irrigation. But this is often problematic in regions where shallow groundwater is a primary source of the salts, which in turn is often the results of excessive irrigation. Such areas may therefore require installation of subsurface drainage to remove the excess groundwater before salts can be leached.
Sodicity is often addressed through the application of gypsum, where calcium substitutes for the sodium on the soil exchange complex, thereby improving soil aggregation and reducing pH. It is then important to leach the sodium out of the surface soil to prevent the reoccurrence of sodicity.
Cotton grown in saline-sodic soil (Turkey).
Crusting in a saline-sodic urban soil.
FIGURE 2.53 A-C. Management challenges in saline and sodic soils.
Salt affected corn.Photo credit: University of Delaware
A
B
C

Comprehensive Assessment of Soil Health - The Cornell Framework 71
Soil Health Assessment - Part II
TABLE 2.06A. Interpretation of 1:1 soluble salts test (Dahnke and Whitney, 198821).
Add-on tests
The suite of soil analyses in the Cornell Assessment of Soil Health packages are all available as individual tests. Certain analysis, such as testing for salinity, are not part of the Basic or Standard packages but are available as add-ons or as individual tests. A complete list of the packages we offer in addition to the add-on tests is available on our website atbit.ly/CSHLPackages.
Interpretation
Tables 2.06 A (below) and B (right) show threshold criteria for interpreting salinity measured by the 1:1 volumetric extraction of soluble salts (A). These thresholds are general interpretations that are not crop specific (B). The effect of soil salinity is often judged by the extent to which crops respond to different levels of salinity. Some crops are very sensitive while some others are more tolerant. Vegetables sensitive to salinity include radish, celery, and green beans, while those with high salt tolerance include kale, asparagus and spinach. Crop response is also influenced by texture.
TABLE 2.06B. General threshold criteria defined to classify a soil as saline, sodic, or saline-sodic. It is important to note that the pH of the soil is also important in defining these conditions.
ECe = Electrical Conductivity of a saturated soil extract pH = Acidity or alkalinity of the solution
Wind erosion from a saline area. Photo: USDA NRCS South Dakota via Flickr

72 Comprehensive Assessment of Soil Health - The Cornell Framework
Part II - Soil Health Assessment
Soil Health Assessment Report The raw data from the individual indicators and background information about sample location and management history from the sample submission form (page 30) are synthesized in an auto-generated and grower-friendly report (Appendix A). The soil health assessment report presents measured values, interpretive ratings, and constraints identified by soil health indicators in a summary page, followed by a short narrative description of each indicator’s importance and status, and selection tables with suggestions for targeted management.
The soil health assessment report summary is laid out in a visually enhanced format to present information to growers and agricultural service providers (Figure 2.54, following page). The sections of the summary page include:
1) Background information: includes the farm and agricultural service provider’s name and contact information, provided sample name or field identification, sample lab ID, date of sampling, current and prior crop and tillage, provided soil type and both provided and measured soil texture information.
2) Measured indicators: provides a list of physical, biological, and chemical indicators that were measured for soil health assessment. Note that values measured for add-on indicators are provided separately.
3) Indicator values: presents the values of the indicators that were measured in the laboratory or field, in the units of measure as provided in the indicator descriptions that follow the report’s cover page (see Appendix A for a complete sample report).
4) Ratings: interprets that measured value using the provided texture-adjusted scoring functions (pages 32-35) on a scale of 0 to 100, where higher scores are better. Ratings are color coded. Those in red (20 or less) are particularly important to take note of as they may indicate a constraint to proper soil functioning. Any in orange and yellow (between 20
and 60), particularly those that are close to a rating of 20, are also important in addressing current or potentially developing soil health problems. Green and dark-green (60 or higher) indicates high scores, which suggest optimal or near optimal functioning.
5) Constraints: If the rating of a particular indicator is poor (red color code), associated soil health constraints will be highlighted in this section. This is useful for identifying priorities for targeting management efforts. Suggested management practices to address the identified constraints can be found in Part III of this manual, and are briefly summarized in tabular form at the end of the assessment report.
6) Overall quality score: computed by averaging the individual indicator ratings to provide an indication of the soil’s overall health status. However, it is of greater importance to identify which particular soil processes are constrained in functioning or suboptimal, so that these issues can be addressed through appropriate management. Therefore the ratings for each indicator are more important information. The overall quality score is further rated as follows: less than 40 is regarded as very low to low, 40-60 is medium, 60-80 is high and 80 to 100 is regarded as very high. The highest possible quality score is 100 and the lowest possible is 0, thus it is a relative overall soil health status indicator.
Poor aggregation can result in poor water infiltration and storage.

Comprehensive Assessment of Soil Health - The Cornell Framework 73
Soil Health Assessment - Part II
Comprehensive Assessment of Soil HealthFrom the Cornell Soil Health Laboratory, Department of Soil and Crop Sciences, School ofIntegrative Plant Science, Cornell University, Ithaca, NY 14853. http://soilhealth.cals.cornell.edu
Grower:Bob Schindelbeck306 Tower Rd.Ithaca, NY 14853
Agricultural Service Provider:Mr. Bob [email protected]
Sample ID: LL8
Field ID: Caldwell Field- intensivemanagement
Date Sampled: 03/11/2015
Given Soil Type: Collamer silt loam
Crops Grown: WHT/WHT/WHT
Tillage: 7-9 inches
Measured Soil Textural Class: silt loamSand: 2% - Silt: 83% - Clay: 15%
Group Indicator Value Rating Constraints
physical Available Water Capacity 0.14 37
physical Surface Hardness 260 12 Rooting, Water Transmission
physical Subsurface Hardness 340 35
physical Aggregate Stability 15.7 19 Aeration, Infiltration, Rooting, Crusting,Sealing, Erosion, Runoff
biological Organic Matter 2.5 28
biological ACE Soil Protein Index 5.1 25
biological Soil Respiration 0.5 40
biological Active Carbon 288 12 Energy Source for Soil Biota
chemical Soil pH 6.5 100
chemical Extractable Phosphorus 20.0 100
chemical Extractable Potassium 150.6 100
chemical Minor ElementsMg: 131.0 / Fe: 1.2 / Mn: 12.9 / Zn: 0.3
100
Overall Quality Score: 51 / MediumFIGURE 2.54. Sample Soil Health Assessment Report with (1) Background info, (2) Measured indicator, (3) Indicator value, (4) Rating, (5) Constraints, and (6) Overall quality score.
1
2 3 4 5
6

74 Comprehensive Assessment of Soil Health - The Cornell Framework
Part II - Soil Health Assessment
Using the Assessment of Soil Health InformationThe Cornell Assessment of Soil Health focuses on identifying priorities and opportunities for improved soil management. The color coded results and constraints listed on the summary page (page 73) help the user get an overview of the field's soil health status.
Identified constraints in soil process functioning are highlighted in red, and the associated soil processes represented by these constrained indicators are listed. While the overall soil quality score is provided at the bottom of the report summary page to integrate the suite of indicators, it is important to note that the most important information is which indicators are suboptimal, because it is this information that informs management decisions. As an entry point in our understanding of soil health, any measured soil constraint can be taken as a management target.
The soil health report is part of an overall Soil Health Management Planning Process and can be used to:
• Understand soil processes and past management impacts
• Identify constraints, assess soil health status
• Select and implement management strategies that address needs and are feasible for the operation
• Monitor change
• Measure progress and adjust management
It is important to recognize that the information presented in the report is not intended as a measure of a grower’s management skills, but as a tool to understand soil processes and past management impacts to inform management decisions towards addressing specific soil constraints that have not been previously measured as part of standard soil testing.
When multiple constraints are considered together, management strategies can be developed that select particular practices to address needs that are feasible for the operation and can restore functionality to the soil. These strategies become part of the Soil Health Management Plan discussed in Part III.
Spade and buckets used to collect soil health samples.
Soil Health Assessment Information: - Part of an overall planning process
- Contains grower-friendly report
- Presents measured values, interpretive ratings
- Identifies priorities and opportunities
- Suggests management options
- Monitors change
- Measures progress

Comprehensive Assessment of Soil Health - The Cornell Framework 75
Soil Health Assessment - Part II
Using Soil Health Assessments in
Soil Health Management Planning
Considerations in interpreting soil health assessmentsFirst some general guidance to consider when embarking on evaluating the information gained from soil health assessments, and using it to decide on management solutions:
The report is a management guide, not a pre-scription: Nutrient management has largely been prescription-based (for example, a soil test report is returned with a recommendations to ‘add 80 pounds of potassium per acre to increase plant available potassium’). The soil health report shows the aspects of the soil needing attention in order to alleviate constraints and thus enhance productivity, resilience, and sustainability. However, there is not a single and specific prescribed treatment for a given identified constraint, because options for addressing soil health constraints are more complex and varied (and also still less well understood) than options for alleviating nutrient deficiencies. Rather multiple diverse management options are provided for any given constraint, to guide the producer in under-standing the types of practices that would alleviate the constraint identified. The choice and details of management efforts to be used in overcoming identified soil health constraints are dependent on various factors related to the operation, as will be discussed in the Soil Health Management Planning Process section in Part III.
Different management approaches can be used to mitigate the same problem: A number of different management practices that achieve similar outcomes can be used to address a constraint, as shown in the management suggestions tables provided as part of the soil health assessment report (see Part III). For example, growers seeking to increase aggregate stability in their fields need to find ways to protect and build soil aggregates through improving biological activity that accomplishes this, as discussed previously (page 46). They might approach this by using manure, growing shallow, dense-rooted cover crops, mulching, reducing tillage, or a combination of these methods, depending on their operational opportunities and challenges.
Management practices can affect multiple indicators: A single management practice can affect multiple indicators and the functioning of soil processes associated with them. For example, adding manure to the soil will improve soil aggregation, increase organic matter, increase active carbon and soil protein contents, increase microbial activity, and improve soil nutrient status. The magnitude of such synergistic effects are dependent on the specific management practices, soil types, and management history.
Certain indicators are related, but over-interpre-tation of these relationships may be misleading: While several soil health indicators used in this assessment provide information about interrelated processes, the degree of interrelationship varies with soil type and previous management history. For example, a general relationship exists between total soil organic matter and active carbon contents. However, active carbon is an indicator of actively decomposing organic fractions that are readily available to the soil microbial community. A soil may be high in stabilized soil organic matter from past high carbon inputs and microbial activity, but it may be lacking the fresh decomposable component currently, and thus may show relatively low active carbon content. An example of such a situation is provided in the case study titled “Implementation of a Soil Health Management Plan Resolves Pond Eutrophication at Tuckaway Farm, NH” available online at blogs.cornell.edu/whatscroppingup

76 Comprehensive Assessment of Soil Health - The Cornell Framework
Part II - Soil Health Assessment
Growing Aroostook cereal rye cover crop. Photo credit: Troy Bishopp
Direct comparison of two fields that have been managed differently may lead to confounded interpretations: Comparing two soil health assessment reports of fields with different management practices, histories, and soil types should be done with care. The absence of baseline data and similar inherent soil types for such comparisons makes it difficult to conclude on beneficial effects of a management practice. However, if a field was managed the same way and then divided up into comparable sections with different management practices (preferably replicated), a soil health assessment can be used to compare management alternatives.
Soil health changes slowly over time: Soil health problems have generally developed as a result of long-term management choices, so it can be expected that a “heavy footprint” on soil health parameters cannot be instantaneously alleviated as is the case for most nutrient deficiency problems. Generally, management practices to address soil health constraints take variable amounts of time for desired effects to be observed and measured.
Some changes in the indicators can be seen in the short term, while others may take a much longer period to be realized. For example, fertilizer application for nutrient deficiencies, and even targeted deep sub-soiling to alleviate a subsoil plow pan, or surface disturbance to alleviate compacted surface soils, may produce immediate effects within a season. But with conversion to no-tillage it may take 3-5 years before beneficial changes in soil health and productivity become noticeable. The speed of change also depends on climate and soil type. For example in very cold or very warm climates, measurable changes may take longer. Some producers are experiencing more rapid changes when they strategically combine multiple locally-adapted practices into soil health management systems, such as combining reduced tillage with cover cropping, grazing of those covers, and improved rotations.
The Comprehensive Assessment of Soil Health Report fits into the Soil Health Management and Planning Framework to be discussed in further detail in Part III.
REMEMBER -
SOIL HEALTH
MANAGEMENT
PLANNING
AND
IMPLEMENTATION
IS A
LONG-TERM INVESTMENT!

Comprehensive Assessment of Soil Health - The Cornell Framework 77
Soil Health Assessment - Part II
Cited References
1 Andrews, S.S., D.L. Karlen, and C.A. Cambardella. 2004. The soil management assessment framework: A quantitative soil quality evaluation method. Soil Science of America Journal 68: 1945-1962 .
2 Fine, A.K., H.M. van Es, R.R. Schindelbeck. 2017. Statitstics, Scoring Functions and Regional Analysis of a Comprehensive Soil Health Database. Soil Science Society of America Journal. Accepted.
3 United States Department of Agriculture and Natural Resources Conservation Service. 2006. Land Resource Regions and Major Land Resource Areas of the United States, the Caribbean, and the Pacific Basin. USDA Handbook 296.
4 Moebius-Clune, B. N., H.M. van Es, O.J. Idowu, R.R. Schindelbeck, J.M. Kimetu, S. Ngoze, J. Lehmann, and J.M. Kinyangi. 2011. Long-term Soil Quality Degradation along a Cultivation Chronosequence in Western Kenya. Agriculture Ecosystems and Environment, 141, 86-99.
5 Schindelbeck, R.R., B.N. Moebius-Clune, D.J. Moebius-Clune, K.S. Kurtz and H.M. van Es. 2016. Cornell University Comprehensive Assessment of Soil Health Laboratory Standard Operating Procedures (available at: bit.ly/SoilHealthSOPs).
6 Kettler , T. A., J. W. Doran, and T. L. Gilbert. 2001. Simplified method for soil particle-size determination to accompany soil-quality analyses. Soil Science Society of America Journal 65:849–852.
7 Reynolds, W. D., G.C. Topp. 2008. Soil water desorption and imbibition: tension and pressure techniques. Soil sampling and methods of analysis. 2nd ed. CRC Press, Boca Raton, FL, 981-997.
8 Duiker, S.W. 2002. Diagnosing Soil Compaction Using a Penetrometer (Soil Compaction Tester). [Agronomy Facts 63]. Retrieved from extension.psu.edu/plants/crops/soil-management/soil-compaction/diagnosing-soil-compaction-using-a-penetrometer
9 B.N. Moebius, H.M. van Es, R.R. Schindelbeck, O.J. Idowu, J.E. Thies, D.J. Clune. 2007. Evaluation of Laboratory-Measured Soil Physical Properties as Indicators of Soil Quality. Soil Science Vol. 172, No. 11, pp. 895-910.
10 Broadbent, F.E. 1965. Organic Matter, Methods of Soil Analysis. Part 1, Physical and Mineralogical Methods. American Society of Agronomy Monograph No. 9. pp. 1397- 1400.

78 Comprehensive Assessment of Soil Health - The Cornell Framework
Part II - Soil Health Assessment
Cited References
11 Wright S.F., A. Upadhyaya. 1996. Extraction of an abundant and unusual protein from soil and comparison with hyphal protein of arbuscular mycorrhizal fungi. Soil Science 161: 575-586.
12 Zibilske L. 1994. Carbon mineralization. Methods of Soil Analysis: Part 2—Microbiological and Biochemical Properties. Soil Science Society of America, Madison, WI, pp. 835-863.
13 Weil, R., K.R. Islam, M.A. Stine, J.B. Gruver, S.E. Samson-Liebig. 2003. Estimating active carbon for soil quality assessment: A simple method for laboratory and field use. Amer. J. Alternative Agric. 18(1):3-17.
14 Drinkwater, L., C.A. Cambardella, J.D. Reeder, C.W. Rice. 1996. Potentially Mineralizable Nitrogen as an Indicator of Biologically Active Soil Nitrogen. Methods for Assessing Soil Quality, 217-229. SSSA. Madison, WI.
15 Abawi, G.S., J.W. Ludwig, C.H. Petzoldt. 2004. Assessing root health by a soil bioassay with beans as an indicator of soil health. Phytopathology 94:(Suppl.):S1
16 Content adapted from resources developed by the Cornell Waste Management Institute (cwmi.css.cornell.edu/soilquality.htm) and the Healthy Soils, Healthy Communities Project (cwmi.css.cornell.edu/healthysoils.htm).
17 Content adapted from Healthy Soils, Healthy Communities Project resource: “Metals in Urban Garden Soils” (available at cwmi.css.cornell.edu/Metals_Urban_Garden_Soils.pdf).
18 Harrison, E.Z., M.B. McBride, D.R. Bouldin. 1999. Land application of sewage sludges: An appraisal of the US regulations. International Journal of Environment and Pollution 11 (1): 1–36.
19 Content adapted from Healthy Soils, Healthy Communities Project resources: “Metals in Urban Garden Soils” (available at cwmi.css.cornell.edu/Metals_Urban_Garden_Soils.pdf) and “What Gardeners Can Do: 10 Best Practices for Healthy Gardening” (available at cwmi.css.cornell.edu/WhatGardenersCanDoEnglish.pdf).
20 Rhoads, J.D. 1982. Soluble Salts, Methods of Soil Analysis, Part 2, Chemical and Micro-biological Properties. Amerrican Society of Agronomy Monograph No. 9, 2nd ed.
21 Dahnke, W. C., D. A. Whitney. 1988. Measurement of soil salinity. Recommended chemical soil test procedures for the North Central Region, North Dakota Agric. Exp. Stn. Bull: 32-34.

Comprehensive Assessment of Soil Health - The Cornell Framework 79
Soil Health Management - Part III
Part IIISoil Health Management

80 Comprehensive Assessment of Soil Health - The Cornell Framework
Part III - Soil Health Management
The Soil Health Management Planning FrameworkCornell’s Comprehensive Assessment of Soil Health (C.A.S.H.) makes it possible to identify biological and physical constraints in addition to those identified by standard nutrient testing. Soil health constraints beyond nutrient deficiencies and excesses limit agroecosystem sustainability, resilience to drought and extreme rainfall, as well as progress in soil and water conservation.
Each grower is generally faced with a unique situation in the choice of management options to address soil health constraints and each system affords its own set of opportunities or limitations to soil management. A more comprehensive under-standing of soil health status can better guide farmers’ soil management decisions. However, until recently, there has not been a formalized decision making process for implementing a soil health management system.
Our approach aims to alleviate field-specific constraints, identified through standard mea-surements, and then maintain and monitor the measurement unit for improved soil health status. To that end, we created a framework for developing Soil Health Management Plans (SHMP) for a farm operation (Figure 3.01).
FIGURE 3.01. The Comprehensive Assessment of Soil Health, used to determine soil health status, is an integral part of the Cornell Soil Health Management Planning and Implementation Framework.
Each grower is faced with unique situations and management options to address each soil health constraint. Growers, usually in conjunction with an Ag Service Provider, will align their needs and abilities to allow for the development of management solutions.
The framework includes:
• Six general steps for the planning and implemen-tation process (Table 3.01, pages 82-86).
• A Comprehensive Assessment of Soil Health report format that more explicitly provides initial interpretation, prioritization, and management suggestions, from which a SHMP can then be developed (page 75 and Appendix A).
• Resource concerns identified through soil health assessment are detailed in a listing specific to each indicator showing constrained soil functioning for which relevant NRCS cost-shared practices may be applied (pages 84-85).
• A pilot SHMP template for such plans that includes purpose, site information, assessment results and interpretation, and planned practices via a multi-year management calendar outlining a specific plan for each field (page 86 and Appendix B).

Comprehensive Assessment of Soil Health - The Cornell Framework 81
Soil Health Management - Part III
The soil health assessment, described in Part II, is an integral part of the Cornell Soil Health Management Planning and Implementation Framework that enables farmers, usually with assistance from Agricultural Service Providers, to develop a more direct interpretation of the assessment to guide farm-specific planning and implementation decisions for soil health management systems (Figure 3.02). The process is designed to alleviate field-specific constraints identified through the soil health assessment, and then maintain improved soil health.
The remainder of this section will focus on describing the framework for management planning and implementation, based on information gained from assessments of soil health. A discussion will follow with a summary of the general considerations for management options and opportunities.
A detailed case study1 demonstrating the Soil Health Management Planning Process is available at the Cornell Soil and Crop Sciences website: scs.cals.cornell.edu
FIGURE 3.02. The soil health report, which identifies constraints and guides prioritization, is just one step in the soil health management planning process.
TABLE 3.01. The six steps of the Soil Health Management Planning Process.
SOIL HEALTH MANAGEMENT PLANNING PROCESS
1. Determine farm background and management historyCompile background info: history by management unit, farm operation type, equipment, access to resources, situational opportunities or limitations.
2. Set goals and sample for soil healthDetermine goals and decide on the number and distribution of soil health samples, according to operation’s background and objectives (pages 27 and 82).
3. For each management unit: identify and explain constraints, prioritizeThe Soil Health Assessment Report identifies constraints and guides prioritization. Explain results based on background where feasible, and adjust priorities.
4. Identify feasible management optionsIdentify which of the suggestions from Step 3 may be feasible for the operation. For guidance, use the management suggestions table available as part of the Soil Health Assessment Report, or online with NRCS practice linkages (see page 84).
5. Create short and long term Soil Health Management PlanIntegrate agronomic science of Steps 3 and 4 with grower realities and goals of Steps 1 and 2 to create a specific short-term schedule of management practices for each management unit and an overall long-term strategy (Appendix B).
6. Implement, monitor, and adaptImplement and document management practices. Monitor progress, repeat testing, and evaluate outcomes. Adapt the plan based on experience and data over time. Remember that soil health changes slowly.

82 Comprehensive Assessment of Soil Health - The Cornell Framework
Part III - Soil Health Management
Six Steps of the Soil Health Management Planning Process
1. Farm Background and Management History
Each farm is unique as is each management unit within a farm. In this first step the grower and the Ag Service Provider work together to compile background information. It is critical to first understand the operation’s land base, soil types, cropping system, current and past soil management, and the producer’s inclinations. Opportu-nities (such as neighbor’s ability to provide manure, easy access to rental equipment, or a son or daughter coming back to the operation with new skills) and limitations (such as having very tight economic margins, having no resources for or access to new equipment, having highly erodible soils, or having a short growing season) need to be identified to guide the planning process.
2. Set Goals and Sample for Soil Health
Setting goals facilitates deciding how and where to sample. Typically, soil health sampling falls into one of two categories – sampling for general purposes or for troubleshooting. General field sampling is ideal for establishing a baseline before applying treatments or for areas where you want to assess general needs. Once baseline conditions of the farm are understood, the information can be used to further define problems and opportunities. Troubleshooting samples are more targeted and are ideal for comparing areas with uneven crop performance or different field management units (Area ‘A’ versus ‘B’). With targeted sampling you are trying to answer a particular question.
Once the purpose for soil health sampling has been decided, sampling can begin. It is important to collect as much information as possible at this stage to inform the creation of a plan that will fit both the needs of the landowner and the available resources. See page Part II, page 27 for more detail.
Step 1. Farm Background and Management History
- Farm is far from dairies so lacks access to manure
- Northern climate with short growing season
- Soil ‘addicted to tillage’ from decades of use of the moldboard plow, disking and harrowing before annual corn grain
- Access to diverse inventory of equipment
- Grower is very open-minded and willing to try ‘anything’
Step 2. Goals and Sampling
- Determine what is causing crop growth issues, especially in extremely wet years in a particular field
- Use field diagrams to document rep-resentative areas where data on soil performance would provide information useful to troubleshoot growth issues
- Record purposes for sampling each zone
The Cornell Soil Health Management Planning Process involves six steps which are described with a brief conceptual example for a corn grain operation here. A worksheet to guide this process is also included at the end of the manual in Appendix B.

Comprehensive Assessment of Soil Health - The Cornell Framework 83
Soil Health Management - Part III
Comprehensive Assessment of Soil HealthFrom the Cornell Soil Health Laboratory, Department of Soil and Crop Sciences, School ofIntegrative Plant Science, Cornell University, Ithaca, NY 14853. http://soilhealth.cals.cornell.edu
Grower:Kirsten Kurtz306 Tower Rd.Ithaca, NY 14853
Agricultural Service Provider:Mr. Bob [email protected]
Sample ID: LL88
Field ID: Moldboard field
Date Sampled: 05/01/2015
Coordinates: Latitude: 42.447900000000Longitude: 76.475700000000
Measured Soil Textural Class: silt loamSand: 37% - Silt: 53% - Clay: 10%
Group Indicator Value Rating Constraints
physical Available Water Capacity 0.15 43
physical Surface Hardness 103 76
physical Subsurface Hardness 290 53
physical Aggregate Stability 14.8 18 Aeration, Infiltration, Rooting, Crusting,Sealing, Erosion, Runoff
biological Organic Matter 2.9 45
biological ACE Soil Protein Index 3.5 18 Organic Matter Quality, Organic N Storage, NMineralization
biological Soil Respiration 0.4 24
biological Active Carbon 430 35
chemical Soil pH 6.9 100
chemical Extractable Phosphorus 4.5 100
chemical Extractable Potassium 67.8 93
chemical Minor ElementsMg: 419.0 / Fe: 1.1 / Mn: 12.9 / Zn: 1.9
100
Overall Quality Score: 59 / Medium
Very Low Aggregate Stability (poor soil structure) (High priority)
Very Low ACE Soil Protein Index (High priority)
Low Respiration (Consider improving)
Low Active Carbon (Consider improving)
3. Constraints Identified, Explained and Prioritized
The Comprehensive Assessment of Soil Health Report, as described in detail in Part II, measures indicators of agronomically and environmentally important soil processes and then applies scoring functions to interpret mea-sured results in the context of soil conditions and management options (Figure 3.03). The soil health assessment report’s color coded results help the user get an overview glance of the field’s soil health status. The main benefit of this approach is that the identification of physical, biological and chemical constraints prompts farmers to seek improved – more sustainable - soil and crop management practices. The process links specific constraints in functioning of important soil processes (highlighted in red when the score is below 20), to management solutions through a farmer-centered decision process. Identified constraints should be given the highest priority in target-ing management decisions. It is also encouraged to consider improving management for soil processes associated with indicators rated to be functioning sub-optimally (shown in orange), particularly when the score is close to 20. Indicators rated with high scores (light and dark green) should be maintained. Remember, the field’s manage-ment history can often provide insights that help explain the field’s current soil health condition. Step 3 is critical to creating workable management plans. Land managers can monitor changes over time through further assess-ment, and adapt management plans to achieve chosen goals.
FIGURE 3.03. Example report of measured indicator ratings that identify soil health constraints. For a full sized report see page 73 and Appendix A.
Step 3. Constraints Identified, Explained and Prioritized
- Continuous tillage, corn monoculture, and lack of diverse organic inputs have degraded the biological functioning of this soil
- Identified constraints suggest that priority should be given to improving biological functioning, while maintaining and improving physical functioning is also desired

84 Comprehensive Assessment of Soil Health - The Cornell Framework
Part III - Soil Health Management
Management Suggestions for Physical and Biological Constraints
Constraint Short Term Management Suggestions Long Term ManagementSuggestions
Available Water CapacityLow
• Add stable organic materials, mulch• Add compost or biochar• Incorporate high biomass cover crop
• Reduce tillage• Rotate with sod crops• Incorporate high biomass cover crop
Surface Hardness High • Perform some mechanical soil loosening(strip till, aerators, broadfork, spader)• Use shallow-rooted cover crops• Use a living mulch or interseed cover crop
• Shallow-rooted cover/rotation crops• Avoid traffic on wet soils, monitor• Avoid excessive traffic/tillage/loads• Use controlled traffic patterns/lanes
Subsurface HardnessHigh
• Use targeted deep tillage (subsoiler,yeomans plow, chisel plow, spader.)• Plant deep rooted cover crops/radish
• Avoid plows/disks that create pans• Avoid heavy loads• Reduce traffic when subsoil is wet
Aggregate StabilityLow
• Incorporate fresh organic materials• Use shallow-rooted cover/rotation crops• Add manure, green manure, mulch
• Reduce tillage• Use a surface mulch• Rotate with sod crops and mycorrhizalhosts
Organic Matter Low • Add stable organic materials, mulch• Add compost and biochar• Incorporate high biomass cover crop
• Reduce tillage/mechanical cultivation• Rotate with sod crop• Incorporate high biomass cover crop
ACE Soil Protein IndexLow
• Add N-rich organic matter (low C:N sourcelike manure, high N well-finished compost)• Incorporate young, green, cover cropbiomass• Plant legumes and grass-legume mixtures• Inoculate legume seed with Rhizobia &check for nodulation
• Reduce tillage• Rotate with forage legume sod crop• Cover crop and add fresh manure• Keep pH at 6.2-6.5 (helps N fixation)• Monitor C:N ratio of inputs
Soil Respiration Low • Maintain plant cover throughout season• Add fresh organic materials• Add manure, green manure• Consider reducing biocide usage
• Reduce tillage/mechanical cultivation• Increase rotational diversity• Maintain plant cover throughoutseason• Cover crop with symbiotic host plants
Active Carbon Low • Add fresh organic materials• Use shallow-rooted cover/rotation crops• Add manure, green manure, mulch
• Reduce tillage/mechanical cultivation• Rotate with sod crop• Cover crop whenever possible
TABLE 3.02. Example of management suggestions for Physical and Biological constraints from Figure 3.03 (page 83). Constrained and suboptimal indicators are flagged in red and orange in the report management table.Black text indicates no high-priority constraint.
4. Identify Feasible Management Options
Table 3.02, below, and 3.03 on the following page are examples of information included in the soil health assessment report that show recommended management approaches targeted at addressing specific measured soil constraints for both the short- and long-term. Combining these with growers’ needs and abili-ties will allow for an active evaluation scenario and the develop-ment of management solutions. In addition, ‘success stories’ of specific management practices that effectively address targeted soil constraints can enhance the knowledge base of soil man-agement consequences. There are no specific ‘prescriptions’ for what management regimen should be pursued to address the highlighted soil health constraints, yet we can recommend a number of effective practices to consider when addressing spe-cific constraints. The Soil Health Management Toolbox (page 87) lists the main categories of action for soil management.
Step 4. Identifying Feasible Management Options
- Growing fresh and readily available organic material. Manure is not available to be added, but would have otherwise been an appropriate option
- Reduce tillage intensity
- Rotate with different short season crop to allow for cover cropping
- Identify window for shallow-rooted cover crop mix that includes a legume

Comprehensive Assessment of Soil Health - The Cornell Framework 85
Soil Health Management - Part III
Management Suggestions for Chemical Constraints
Constraint Short Term Management Suggestions Long Term Management Suggestions
Soil pH Low • Add lime or wood ash per soil testrecommendations• Add calcium sulfate (gypsum) in additionto lime if aluminum is high• Use less ammonium or urea
• Test soil annually & add "maintenance"lime per soil test recommendations to keeppH in range• Raise organic matter to improve bufferingcapacity
Soil pH High • Stop adding lime or wood ash• Add elemental sulfur per soil testrecommendations
• Test soil annually• Use higher % ammonium or urea
ExtractablePhosphorus Low
• Add P amendments per soil testrecommendations• Use cover crops to recycle fixed P• Adjust pH to 6.2-6.5 to free up fixed P
• Promote mycorrhizal populations• Maintain a pH of 6.2-6.5• Use cover crops to recycle fixed P
ExtractablePhosphorus High
• Stop adding manure and compost• Choose low or no-P fertilizer blend• Apply only 20 lbs/ac starter P if needed• Apply P at or below crop removal rates
• Use cover crops that accumulate P andexport to low P fields or offsite• Consider low P rations for livestock• Consider phytase for non-ruminants
ExtractablePotassium Low
• Add wood ash, fertilizer, manure, orcompost per soil test recommendations• Use cover crops to recycle K• Choose a high K fertilizer blend
• Use cover crops to recycle K• Add "maintenance" K per soilrecommendations each year to keep Kconsistently available
Minor Elements Low • Add chelated micros per soil testrecommendations• Use cover crops to recycle micronutrients• Do not exceed pH 6.5 for most crops
• Promote mycorrhizal populations• Improve organic matter• Decrease soil P (binds micros)
Minor Elements High • Raise pH to 6.2-6.5 (for all high microsexcept Molybdenum)• Do not use fertilizers with micronutrients
• Maintain a pH of 6.2-6.5• Monitor irrigation/improve drainage• Improve soil calcium levels
School of Integrative Plant Science, Soil and Crop Sciences Section, G01 Bradfield Hall, 306 TowerRoad, Cornell University, Ithaca, NY 14853, email: [email protected]
College of Agriculture and Life Sciences, Cornell University
Developed in partnership with Cornell Soil Health, Farmier, and GreenStart. Hosted by Farmier
TABLE 3.03. Example of management suggestions for Chemical constraints from Figure 3.03 (page 83). Constrained and suboptimal indicators, if any, would be flagged in red and orange in the report management table. Black text throughout this example indicates that there are no high-priority constraints for Chemical indicators.
5. Create Short and Long Term Soil Health Management Plans
This step develops the detailed plan that a producer can follow. The plan must address prioritized constraints in a way that is feasible economically and logistically for the producer. Man-agement approaches taken from the soil health management toolbox (page 87) can be used singularly or in combination as the same constraint might be overcome through a variety of management approaches. A specific short-term schedule of management activities is developed for each field or manage-ment unit, and an overall long-term strategy and direction is defined. Alternatives for weather contingencies may be listed as well. The options that a grower chooses may depend on farm-specific conditions such as soil type, cropping, equipment, labor availability, etc. It is important to align the agronomic science of Steps 3 and 4 with the grower realities and goals of Steps 1 and 2 to create a specific schedule of management practices for each management unit and an overall long-term strategy in this step. Table 3.04 on the following page provides a template for the Soil Health Management Planning process.
Step 5. Create a Plan
Short Term:
- Spring: drill barley, timothy and clover mix (adds fresh, diverse, non-corn derived organic materials and active roots earlier in season than corn)
- Summer: harvest barley (produces income)
- Summer and fall: mow timothy-clover mix as green manure (adds further and protein-rich organic material)
Long Term:
- Winter: learn about strip tillage and prepare to transition soil to reduced tillage system with improved rotation

86 Comprehensive Assessment of Soil Health - The Cornell Framework
Part III - Soil Health Management
6. Implement, Monitor and Adapt
This step is continuous and feeds back into the plan-ning process over time. In this step the grower is im-plementing the plan from Step 5, documenting actions, successes and failures of management practices, and monitoring progress in problems that were initially identified. This process is critical for continued learning and improved success. The soil health assessment can be used over time to monitor change, measure progress and evaluate outcomes. The soil health management plan becomes a living document that is adapted based on experience and outcomes over time. It is impor-tant to remember that soil health has usually degraded over many years or decades, and so building it back up should be expected to take quite some time. Continue to adjust management for continuous improvement.
Step 6. Implement, Monitor, Adapt
- This farmer may find, for example, that the timothy and clover mix is ready to mow earlier or later than initially planned, or may decide that it is worth leaving the mix growing in that field for an additional season for hay, if a nearby market develops
TABLE 3.04. Soil Health Management Planning Process Worksheet. A full version is available in Appendix B.
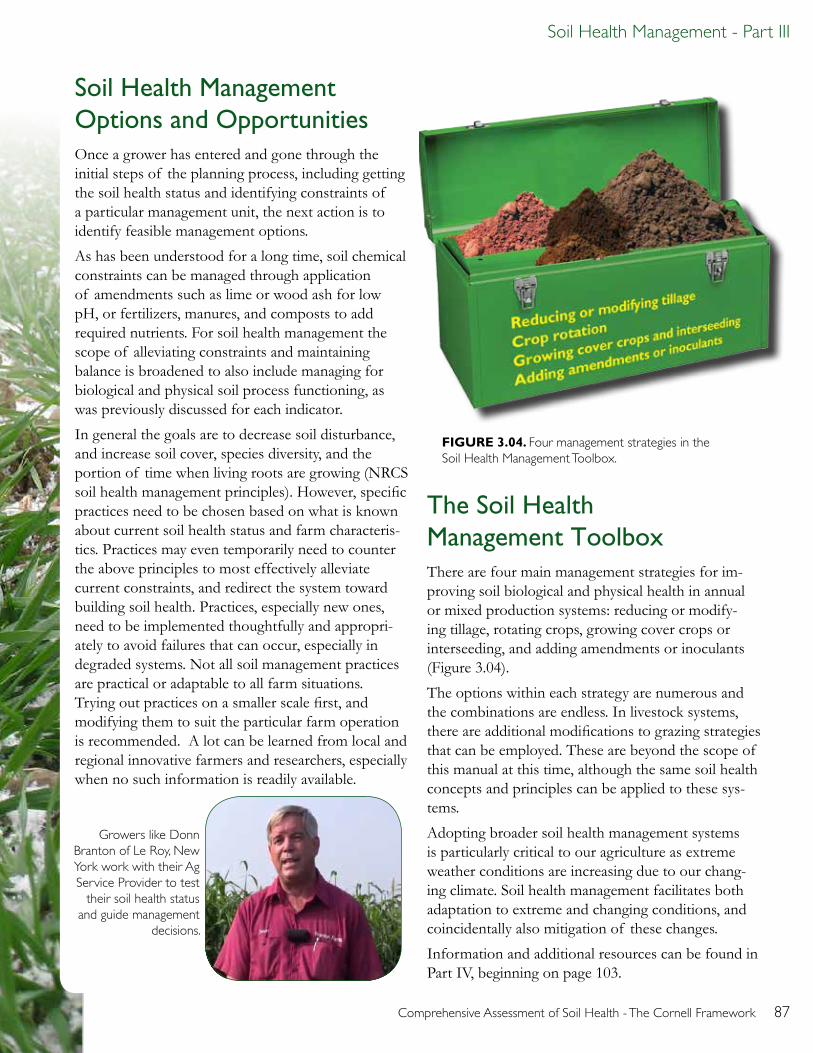
Comprehensive Assessment of Soil Health - The Cornell Framework 87
Soil Health Management - Part III
Soil Health Management Options and OpportunitiesOnce a grower has entered and gone through the initial steps of the planning process, including getting the soil health status and identifying constraints of a particular management unit, the next action is to identify feasible management options.
As has been understood for a long time, soil chemical constraints can be managed through application of amendments such as lime or wood ash for low pH, or fertilizers, manures, and composts to add required nutrients. For soil health management the scope of alleviating constraints and maintaining balance is broadened to also include managing for biological and physical soil process functioning, as was previously discussed for each indicator.
In general the goals are to decrease soil disturbance, and increase soil cover, species diversity, and the portion of time when living roots are growing (NRCS soil health management principles). However, specific practices need to be chosen based on what is known about current soil health status and farm characteris-tics. Practices may even temporarily need to counter the above principles to most effectively alleviate current constraints, and redirect the system toward building soil health. Practices, especially new ones, need to be implemented thoughtfully and appropri-ately to avoid failures that can occur, especially in degraded systems. Not all soil management practices are practical or adaptable to all farm situations. Trying out practices on a smaller scale first, and modifying them to suit the particular farm operation is recommended. A lot can be learned from local and regional innovative farmers and researchers, especially when no such information is readily available.
The Soil Health Management Toolbox There are four main management strategies for im-proving soil biological and physical health in annual or mixed production systems: reducing or modify-ing tillage, rotating crops, growing cover crops or interseeding, and adding amendments or inoculants (Figure 3.04).
The options within each strategy are numerous and the combinations are endless. In livestock systems, there are additional modifications to grazing strategies that can be employed. These are beyond the scope of this manual at this time, although the same soil health concepts and principles can be applied to these sys-tems.
Adopting broader soil health management systems is particularly critical to our agriculture as extreme weather conditions are increasing due to our chang-ing climate. Soil health management facilitates both adaptation to extreme and changing conditions, and coincidentally also mitigation of these changes.
Information and additional resources can be found in Part IV, beginning on page 103.
FIGURE 3.04. Four management strategies in the Soil Health Management Toolbox.
Growers like Donn Branton of Le Roy, New York work with their Ag Service Provider to test
their soil health status and guide management
decisions.

88 Comprehensive Assessment of Soil Health - The Cornell Framework
Part III - Soil Health Management
Tillage ConsiderationsAs new technologies have been developed, the reliance on full width tillage to kill weeds, incorporate crop debris and amendments, and prepare seedbeds has been diminished. At the same time, we now have a better under-standing of how critical decreasing soil disturbance is for diverse and active biological activity that is critical for well-functioning, healthy soil. Extensive tillage temporarily stimulates certain species making up the microbial community to ‘burn off ’, or decompose, organic matter quickly. This reduces soil aggregation, resulting in crusting and soil compaction, in addition to decreased beneficial microbial activity. It is now well understood that reducing tillage intensity, and mechanical soil disturbance in general, can improve soil health and, over time, maintain or even increase yields, while reducing production costs due to saved labor, equipment wear, and fuel.
· No Tillage: A no-till planter or transplanter does minimal soil disturbance to plant the crop (Figure 3.05 A). This is true, “single-pass” planting.
· Ridge Tillage: Crops are planted into minimally disturbed ridges that generally remain in the same place. Only surface soils are disturbed when ridges are rebuilt annually around the planted crop.
· Strip Tillage: A shank set just below the depth of the compacted layer (if present, B) rips a compacted layer while a series of coulters forms a narrow, shallow ridge in preparation for planting (C). Plants are later sown into tilled strips with a pass of the planter.
· Zone Tillage: Similar to strip tillage, but without the rip shank, which is not necessary when you lack subsoil compaction. Instead of preparing the entire field as a seedbed, only a narrow band is loosened by zone and strip tillage, enabling crop or cover crop residue to remain on the soil surface as a mulch. In single pass planting, the strips are simul-taneously prepared and the seeds are sown.
(A) No-till planted sweet corn into a killed sweet clover fall cover crop. (B) Two-row strip tillage unit with an opening coulter, followed by a vertical shank, two closing coulters to form a small ridge then a rolling basket to prepare the ridge for planting.
· Permanent drive rows: Drive rows are particularly possible with new GPS enabled technologies and often better facilitates reduced tillage systems.
· Roller crimpers, rotovators: These are being developed to be set to disturb only the surface inch of the soil, and other minimal disturbance methods for managing spring cover crops.
· Cover crop interseeders and no-till drills: These may be used to avoid additional tillage passes for establishing cover crops.
· Frost Tillage: Frost Tillage can be a means of alleviating soil compaction or injecting manure in the winter. It is done when the soil is frozen between 1 and 3 inches deep. Such conditions generally only occur on a few days per winter, depending on location and year in the Northeast (D).
B C D
(C) Strip tillage with a vertical shank followed by two wavy coulters. (D) Soil following frost tillage. The large clods will mellow and break down as a result of subsequent freeze-thaw action.
General Management Considerations from the Toolbox
FIGURE 3.05 A-D. Examples of different reduced tillage systems.
A
There are many different strategies for reducing tillage intensity

Comprehensive Assessment of Soil Health - The Cornell Framework 89
Soil Health Management - Part III
Frost Tillage (continued): The soil below the frost layer is non-plastic or dry, ideal conditions for tillage without compaction. Frost-tilled soil leaves a rough surface, but subsequent freeze-thaw action loosens the soil and allows the clods to fall apart in the spring, so that it is ready for an early spring crop.
Details about benefits and disadvantages of different strategies can be found in Building Soils for Better Crops and other resources. A summary table is below (Table 3.05).
Reduced tillage can be used for all crops, or it can be part of a rotation, modified based on the cropping sequence. Different tillage practices can be rotated depending on crop and soil management goals and concerns.
For some crops such as potato, more intensive tillage and soil disturbance is generally used to establish and harvest the crop, although some growers even plant potatoes using zone tillage. The subsequent sweet corn (or other) crop(s) may be more easily strip- or no-tilled into a killed winter cover crop.
The type and timing of tillage are site-specific and dependent on the cropping system and equipment avail-ability. Reducing both tillage frequency and intensity will reduce the loss of organic matter and lead to improved soil aggregation and microbial activity. This will result in soils that are less susceptible to compaction and other soil health problems, and more resilient to extreme weather.
Tillage System Benefits Limitations
Full-Field Tillage
Moldboard plow Easy incorporation of fertilizers and amendments.
Buries surface weed seeds and also diseased debris/pathogen surviving structures.
Dries soil out fast.
Temporarily reduces compaction.
Leaves soil bare. Surface crusting, lack of infiltration and water storage, and accelerated erosion is common.
Destroys natural aggregation and enhances organic matter loss.
High energy requirements.
Causes plow pans.
Chisel Plow Same as above, but with more surface residues.
Same as above, but less aggressive destruction of soil structure, less erosion, less crusting, no plow pans, and less energy use.
Disc harrow Same as above. Same as above, but additional development of disk pans.
Restricted Tillage
No-till Little soil disturbance and low organic matter losses.
Few trips over field.
Low energy use.
Most surface residue cover and erosion protection.
Harder to incorporate fertilizers and amendments, but new injection equipment is being developed.
Wet soils slow to dry and warm up in spring.
More challenging to alleviate compaction without tillage options.
Higher disease and weed pressure if not combined with appropriate rotation and cover cropping.
Zone-till/ Strip-till Same as above. Same as above, but fewer problems with compaction and cold spring soils.
Ridge-till Easy incorporation of fertilizer and amendments.
Some weed control as ridges are built.
Zone on ridge dries and warms more quickly for better germination.
Hard to use together with sod-type or narrow crop rotation.
Equipment needs to be adjusted to travel without disturbing ridges.
TABLE 3.05. Tillage System Benefits and Limitations. Modified from: Building Soils for Better Crops, 3rd Edition

90 Comprehensive Assessment of Soil Health - The Cornell Framework
Part III - Soil Health Management
Crop Rotation ConsiderationsInitially, crop rotation was practiced as a way to avoid depleting the soil of various nutrients and to manage pathogens and pests. Today, crop rotation is also an important component of soil health management in many agricultural production systems. Crop rotations can be as simple as rotating between two crops and planting sequences in alternate years or they can be more complex and involve numerous crops over several years or even at the same time for improved soil health. Proper crop rotations generally increase species diversity, and reduce insect pressure, disease-causing pathogens, and weed pressure by breaking life cycles through removal of a suitable host or habitat. Additionally, crop rotation can improve nutrient management and improve soil resiliency (to drought, extreme rainfall and disease) especially after root crops such a carrot or potato that usually involve intensive tillage. Generally yield increases when crops in different families are grown in rotation versus in monoculture (referred to as the “rotation effect”).
One basic rule of crop rotation is that a crop should not follow itself. Continuous mono-cropping generally results in the build-up of disease causing pathogens, nematodes, insects and weeds that can lead to yield reductions and the need for increased inputs such as herbicides, insecticides and other pesticides. A cropping sequence for soil health management should include the use of cover crops and/or season-long soil building crops. Rotating with a diversity of root structures and make-ups, from taproots to fibrous rooted crops from a variety of plant families, will also improve the soil’s physical, chemical and biological health and functioning. Note that successful crop rotation sequences are farm specific and depend on unique combinations of location and climatic factors, as well as economic and resource limitations.
The following page contains a list of general principles for crop rotation.
Wheat is a good rotation crop in an intensive vegetable production rotation especially if Northern root-knot
nematode is a problem. All grain crops are non-hosts for Meloidogyne hapla.

Comprehensive Assessment of Soil Health - The Cornell Framework 91
Soil Health Management - Part III
General Principles for Crop Rotation
• Grow the same annual crop for only one year, if possible, to decrease the likelihood of insects, diseases, and nematodes becoming a problem.
• Don’t follow one crop with another closely related species, since insect, disease, and nematode problems are frequently shared by members of closely related crops.
• Use crop sequences that promote healthier crops. Some crops seem to do well following a particular crop (for example, cabbage family crops following onions, or potatoes following corn). Other crop sequences may have adverse effects, as when potatoes have more scab following peas or oats.
• Follow a legume forage crop, such as clover or alfalfa, with a high nitrogen-demanding crop, such as corn, to take advantage of the nitrogen supply. Grow less nitrogen-demanding crops, such as oats, barley, or wheat, in the second or third year after a legume sod.
• Use crop sequences that aid in controlling weeds. Small grains compete strongly against weeds and may inhibit germination of weed seeds, row crops permit mid-season cultivation, and sod crops that are mowed regularly or are intensively grazed help control annual weeds.
• Use longer periods of perennial crops, such as forages, on sloping land, highly erodible soils, or soils where intensive tillage is required to establish annual crops. Using sound conservation practices, such as no-till planting, extensive cover cropping, or strip-cropping (a practice that combines the benefits of rotations and erosion control), may lessen the need to grow perennials.
• Grow a deep-rooted crop or cover crop, such as alfalfa, safflower, sunflower, sorghum sudan grass, or radish, as part of the rotation. These crops scavenge the subsoil for nutrients and water. Channels left from decayed roots can promote water infiltration and access to subsoil water and nutrients by following crops.
• Grow some crops that will leave a significant amount of residue, like sorghum or corn harvested for grain, to help maintain organic matter levels.
• When growing a wide mix of crops - as is done on many direct marketing vegetable farms - try grouping crop mixes into blocks according to plant family, timing of crops (all early season crops together, for example), type of crop (root vs. fruit vs. leaf), or crops with similar cultural practices (irrigated, using plastic mulch) to facilitate integrating cover crops.
• The SARE publication Crop Rotations on Organic Farms has more information that is useful for conventional as well as organic systems.
Modified from: Building Soils for Better Crops, 3rd Edition

92 Comprehensive Assessment of Soil Health - The Cornell Framework
Part III - Soil Health Management
Cover Cropping ConsiderationsCover crops are usually grown for less than one year. They provide a canopy, organic matter inputs, increased species diversity, and living root activity for soil protection and improvement between the production of main cash crops. They can also be interseeded between some main crops. They can be grown as monocultures, or as mixes of two or many more species. When specifically used for improved soil fertility (often by incorporating), cover crops are also referred to as green manures. However it should be noted that often the greatest benefits are derived from cover crops that are terminated in place as this prevents damaging soil disturbance, and allows roots to decompose in the field and create continuous pores. Roots are also generally more effective at contributing to soil organic matter than above ground biomass.
Cover crops with shallow fibrous root systems, such as many grasses, build soil aggregation and alleviate compaction in the surface layer. Cover crops with deep tap roots can help break-up compacted layers, bring up nutrients from the subsoil to make them available for the following crop, and provide access to the subsoil for the following crop via root channels left behind. Cover crops can thus recycle nutrients that would otherwise be lost through leaching during off-season periods. Leguminous cover crops can also fix atmospheric nitrogen that then becomes available to the following crop. Other benefits from cover crops include protection of the soil from water and
When selecting cover crops it is important to consider :· What are your goals for using the cover
crop(s)? Which constraints are you addressing, or which aspects of soil health are you aiming to maintain?
· Where can cover crops fit into the rotation? Summer, winter, season-long, interseeded?
· When and how should the cover crop be killed or incorporated? Winter-kill vs. chemical applications vs. rolled or chopped?
· What cover crops are suitable for the climate?
· What cover crops fit with the current production practices including any equipment constraints?
· What is the susceptibility or host status of the cover crop to major pathogen(s) of concern on your operation?
Winter wheat after unseasonable rainfall.
wind erosion, improved soil aggregation and water storage, suppressing soil-borne pathogens, supporting beneficial microbial activity, increasing active and total organic matter, and sequestering carbon.
Dead cover crop material left on the soil surface can become an effective mulch that reduces evaporation of soil moisture, increases infiltration of rainfall, minimizes temperature extremes, increases soil organic matter, and aids in the control of annual weeds. Leguminous cover crops suitable for the Northeastern US include various clovers, hairy vetch, field peas, alfalfa, and soybean, while popular non-leguminous cover crops include rye, oats, wheat, oilseed radish, sorghum Sudan grass, and buckwheat. Additional resources for cover crop species that can be used for building soil health are included in Part IV of this manual.
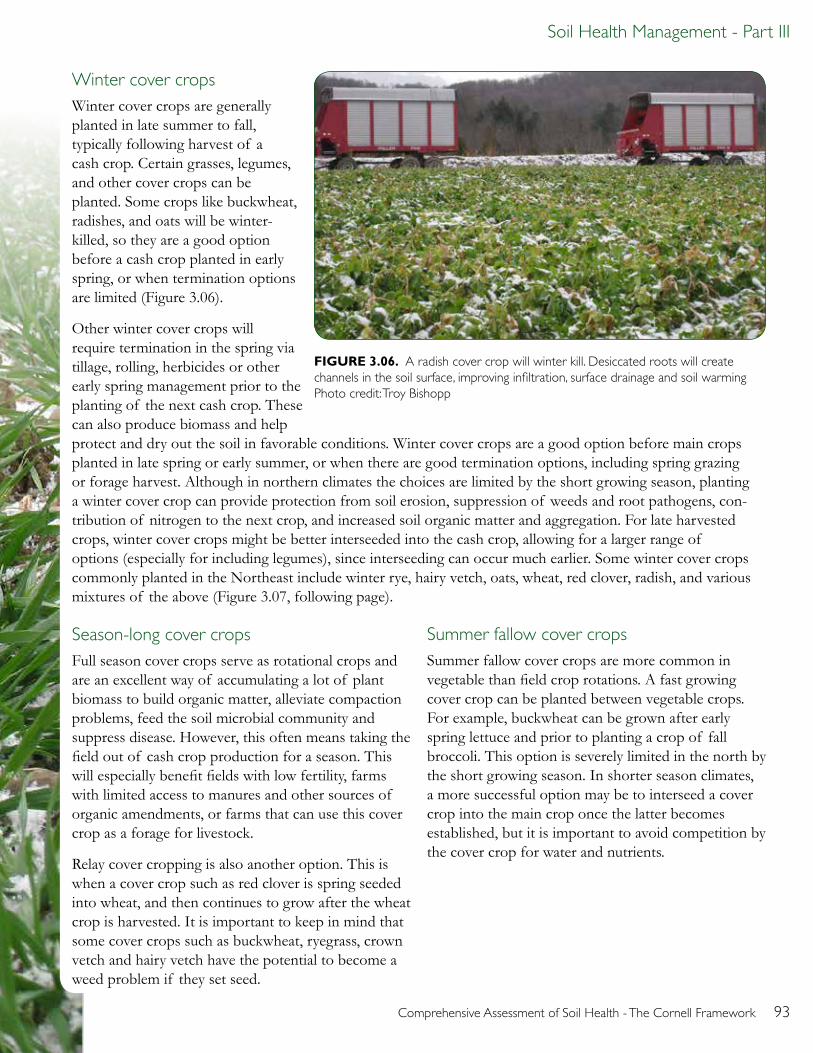
Comprehensive Assessment of Soil Health - The Cornell Framework 93
Soil Health Management - Part III
Winter cover cropsWinter cover crops are generally planted in late summer to fall, typically following harvest of a cash crop. Certain grasses, legumes, and other cover crops can be planted. Some crops like buckwheat, radishes, and oats will be winter-killed, so they are a good option before a cash crop planted in early spring, or when termination options are limited (Figure 3.06).
Other winter cover crops will require termination in the spring via tillage, rolling, herbicides or other early spring management prior to the planting of the next cash crop. These can also produce biomass and help protect and dry out the soil in favorable conditions. Winter cover crops are a good option before main crops planted in late spring or early summer, or when there are good termination options, including spring grazing or forage harvest. Although in northern climates the choices are limited by the short growing season, planting a winter cover crop can provide protection from soil erosion, suppression of weeds and root pathogens, con-tribution of nitrogen to the next crop, and increased soil organic matter and aggregation. For late harvested crops, winter cover crops might be better interseeded into the cash crop, allowing for a larger range of options (especially for including legumes), since interseeding can occur much earlier. Some winter cover crops commonly planted in the Northeast include winter rye, hairy vetch, oats, wheat, red clover, radish, and various mixtures of the above (Figure 3.07, following page).
Summer fallow cover cropsSummer fallow cover crops are more common in vegetable than field crop rotations. A fast growing cover crop can be planted between vegetable crops. For example, buckwheat can be grown after early spring lettuce and prior to planting a crop of fall broccoli. This option is severely limited in the north by the short growing season. In shorter season climates, a more successful option may be to interseed a cover crop into the main crop once the latter becomes established, but it is important to avoid competition by the cover crop for water and nutrients.
FIGURE 3.06. A radish cover crop will winter kill. Desiccated roots will create channels in the soil surface, improving infiltration, surface drainage and soil warming Photo credit: Troy Bishopp
Season-long cover cropsFull season cover crops serve as rotational crops and are an excellent way of accumulating a lot of plant biomass to build organic matter, alleviate compaction problems, feed the soil microbial community and suppress disease. However, this often means taking the field out of cash crop production for a season. This will especially benefit fields with low fertility, farms with limited access to manures and other sources of organic amendments, or farms that can use this cover crop as a forage for livestock.
Relay cover cropping is also another option. This is when a cover crop such as red clover is spring seeded into wheat, and then continues to grow after the wheat crop is harvested. It is important to keep in mind that some cover crops such as buckwheat, ryegrass, crown vetch and hairy vetch have the potential to become a weed problem if they set seed.

94 Comprehensive Assessment of Soil Health - The Cornell Framework
Part III - Soil Health Management
FIGURE 3.07. Mix of winter rye, wheat, barley, and hairy vetch. Cover crop mixes are an excellent way of accumulating plant biomass to build organic matter, alleviate compaction problems, feed soil microbes and suppress disease. Photo credit: Dorn Cox
Cover crop mixesCover crop mixes are getting increasing attention these days, as it is being recognized that greater plant diversity also increases microbial community diversity and functioning. Grass and legume combinations have long been used (as for example oat-pea mix in the fall, or rye-vetch mix over winter), but “cover crop cocktails” that often include eight or more species of various grasses and legumes are being increasingly evaluated by farmers and researchers alike. There are several reasons for this approach:
1) Different cover crops provide different benefits, so mixes can be chosen to improve a larger number of soil functions. For example a legume (for nitrogen contributions), a shallow rooted grass (for improved aggregation and to alleviate surface hardness), and a deep rooted crop such as radish (to alleviate subsoil compaction) can be combined to achieve all of these benefits.
2) Depending on weather factors, some species may do better in a given year than others. Seeding a mix of many species ensures that at least some of these species can take advantage of the prevailing weather conditions.
3) Because different species have different root architectures and growth habits, various niches can be occupied, so that often more biomass is produced by a mix of species than by a single species.
The SARE publications Managing Cover Crops Profitably and Building Soils for Better Crops have additional, useful information (see Part IV).

Comprehensive Assessment of Soil Health - The Cornell Framework 95
Soil Health Management - Part III
Four common cover crops in the Northeast:
Winter rye (Secale cereale) is very winter hardy and can be seeded late into the fall after late harvest crops (Figure 3.08 A). It can serve as a nutrient catch crop, reduce erosion, increase organic matter, suppress weeds, reduce soil-borne pathogen populations. It can be sown with legumes if desired, but it has also been found to somewhat inhibit the growth of certain crops following it. Rye will grow aggressively in spring and sometimes may need to be quickly killed before it matures to reduce potential weed problems, deplete soil moisture and immobilize nitrogen. Rye can be incorporated as a green manure, mowed, rolled, or killed with an herbicide in reduced tillage systems, preferably several weeks prior to planting the main crop. Some farmers have had great success no-till planting soybeans into rolled rye (page 100).
Oat (Avena sativa) is not winter hardy in the Northeast. However in early spring the killed oat biomass can serve as mulch for weed suppression (B). It can be mixed with a legume and also be used to prevent erosion, scavenge excess nutrients, add biomass, and act as a nurse crop. A nurse crop is an annual crop used to assist in the establishment of a perennial crop.
Sudan grass and sorghum sudan grass hybrids (Sorghum bicolor x S. bicolor var. sudanese) are fast growing during warm weather, although they are not winter hardy in the Northeast (C). However, in early spring the killed biomass can serve as mulch for weed suppression. It can be used as a soil builder, subsoil loosener and weed suppressor when sown at high rates. When used for their biofumigant properties, incorporating young tissue (1 to 3 months old) when the soil is warm (microbially active) is recommended, especially for control of plant-parasitic nematodes. To promote increased root growth, it should be mowed or grazed multiple times during the growing season.
Hairy vetch (Vicia villosa) is an excellent spring biomass producer and leguminous nitrogen contributor therefore making it good for weed suppression and as a nitrogen source (D). It improves topsoil tilth by reducing surface crusting, ponding, runoff, and erosion. In the Northeast, it needs to be planted by late summer for good establishment and overwintering.
Winter rye (Secale cereale)
Sudangrass and sorghum-sudan-grass hybrids (Sorghum bicolor x S. bicolor var. sudanese)
Hairy vetch (Vicia villosa)
FIGURE 3.08 A-D. Common
cover crops in the Northeast.
A
B
C
D
Oat (Avena sativa)

96 Comprehensive Assessment of Soil Health - The Cornell Framework
Part III - Soil Health Management
Organic Amendment ConsiderationsOrganic matter is critical for maintaining balanced soil biological communities, as these are largely responsible for maintaining soil structure, increasing water infiltra-tion and building the soil’s ability to store and release water and nutrients for crop use. Organic matter can be maintained better by reducing tillage and other soil disturbances, and increased by improving rotations and growing cover crops as previously discussed. Organic materials can also be added by amending the soil with composts, animal manures, and crop or cover crop residues imported to the field from elsewhere. The addition of organic amendments is particularly important in vegetable production where minimal crop residue is returned to the soil, more intensive tillage is generally used, and land is more often a limiting factor making the use of cover crops more challenging. Various organic amendments can affect soil physical, chemical and biological properties quite differently, so decisions should be based on identified constraints and soil health management goals. Organic amendments derived from organic wastes should not only be tested for nutrients, but also for contaminants such as heavy metals.
Animal manureApplying manure can have many soil and crop health benefits, such as increased nutrient levels (nitrogen, phosphorus, and potassium in particular, but also micro-nutrients) as well as easily available carbon that will benefit the soil microbial community (Figure 3.09). Not all manures are equal however. Manure nutrient and carbon contents vary depending on the animal, feed, bedding, and manure-storage practices. Manure containing a lot of bedding is typically applied as a solid, while manure with minimal bedding is applied as a liquid. Manure solids and liquids may be separated, and solids can also be composted prior to application to help stabilize nutrients, especially nitrogen. Due to the variability in nutrient content, manure analysis is beneficial and takes the guesswork out of estimating manure nutrient content and characteristics.
Manuring soil can increase total soil organic matter, cation exchange capacity and water holding capacity over time, and fresh uncomposted manure, especially when solid, is very effective at increasing soil aggregation. Careful attention should be paid to the timing and method of application to meet the needs of the crop or cropping sequence. Excessive or untimely application can cause plant or soil damage, food pathogen concerns, or degraded water resources.
CompostUnlike manure, compost is very stable and generally not a readily available source of nitrogen, but it is important to recognize that phosphorus remains highly available. The composting process uses heat and microbial activity to quickly decompose simple compounds like sugars and proteins, leaving behind more stable complex compounds such as lignin and humic materials. The stable products of composting are an important source of organic matter (Figure 3.10). The addition of compost increases available water holding capacity by improving organic matter content and pore space that holds water. It also improves cation and anion exchange capacities, and thus the ability for nutrients to be stored and released for plant use. Compost is less effective at building soil aggregation than fresh manure, because the readily-degradable organic compounds have already been decomposed, and it is the microbial process of decomposition that helps build aggregates. Composts differ in their efficiency to suppress various crop pests, although they can sometimes be quite effective. Compost should not be used alone to meet crop nitrogen demand, as this will result in over-application of phosphorus, and thus can increase environmental risk. Properly produced composts are safe to use on human food crops with respect to pathogens.
FIGURE 3.09. Applying
manure can have many soil and
crop benefits.
FIGURE 3.10. The stable
products of composting are an
important source of OM.

Comprehensive Assessment of Soil Health - The Cornell Framework 97
Soil Health Management - Part III
Crop and cover crop residuesCrop or cover crop residue (whether grown in place or imported from a different field) is usually referred to as “green manure” and is another important source of organic matter (Figure 3.11). Green manure cover crops can be grown specifically to improve soil fertility, organic matter content, and microbial diversity and activity. Crop residues and green manures can either be incorporated or left on the surface to protect the soil against erosion and disturbance, and to improve surface aggregation (Figure 3.12). This results in reducing crusting and surface compaction. A soil with better aggregation (aggregate stability) is more resilient in heavy rain storms and is capable of greater water infiltration and storage. However, diseased crop debris can harbor inoculum that can become a problem during the next season if a susceptible crop is planted. Crop rotation with non-host crops belonging to different plant families, and/or the appropriate use of cover crops will reduce pathogen inoculum. Removal and composting of diseased crop debris may be an option in some situations. Incorporation or plowing down of crop debris to encourage the decomposition process may be an option depending on the tillage system and crop rotation sequence.
Other Sources of Organic Amendments· Municipal wastes (yard debris, biosolids,
municipal composts)
· Organic wastes from food processing industries
· Organic wastes from paper mills, timber industry and brewing facilities
· Post-consumer food wastes (home, restaurant, and institutional)
FIGURE 3.11. Crop residues (green manure) can improve soil fertility, OM content, and microbial diversity and activity.
Photo credit: Jeff Vanuga, USDA-NRCS
FIGURE 3.12. Residue mulch on surface. Crop residues can
either be incorporated or left on the surface to protect the
soil against erosion and disturbance. Source: USDA-NRCS

98 Comprehensive Assessment of Soil Health - The Cornell Framework
Part III - Soil Health Management
Considerations for adapting to and mitigating climate changeSoil health management provides an opportunity to increase profits and decrease risks through adaptations to a changing climate, and to contribute to solving this critical environmental issue.
Throughout the long history of life on Earth, soil organisms, plants, and other living things have played a major role in the cycling of three important greenhouse gases: carbon dioxide (CO2), nitrous oxide (N2O), and methane (CH4). In our atmosphere, these gases trap heat that otherwise would escape. For many millions of years the concentrations of these gases were relatively constant and created a planet with a comfortable average temperature of about 590 F, which has promoted the abundant life we are familiar with. Since the Industrial Revolution, however, all three of these gases have been steadily on the rise, leading to a rapid pace of climate change that is affecting natural ecosystems and agriculture worldwide (Figure 3.13).
Soil organisms, plants, and animals are important as both sources (producers) and sinks (absorbers)
of greenhouse gases. How we manage our soils, crops, and livestock will thus play a major role in determining the future pace of climate change, with implications for farming and food security. We can mitigate (decrease the magnitude of) these impacts – particularly the impacts of CO2 and N2O – through better soil health management, and at the same time build resistance and resilience, so that our systems are better adapted to these changes.
FIGURE 3.13. Greenhouse gas concentrations have been rising significantly since the Industrial Revolution.Source: IPCC Fourth Assessment Report (2007)
Soil health management for carbon sequestration: capturing and storing carbon in soilsMany of the practices emphasized in this manual for increasing soil organic matter and improving soil health also increase soil carbon (since organic matter is mostly carbon). This carbon stored (“sequestered”) in soil is carbon that otherwise would be in the air as the greenhouse gas, carbon dioxide (CO2).
· Winter cover cropping and growing perennial forages or other vegetation increases the annual carbon capture from the atmosphere (via photo-synthesis), and some of this carbon remains in the soil as organic matter.
· Including nitrogen-fixing legumes as winter cover crops or rotation crops adds benefit by reducing the need for synthetic nitrogen fertilizers, which are energy-intensive to manufacture and transport. This further reduces CO2 emissions associated with farming (and saves money on nitrogen fertilizer).
· Reducing tillage slows decomposition of soil organic matter and release of CO2 into the atmosphere. Also, fewer tillage operations reduces the CO2 emissions from tractor driving (and saves on labor and fuel costs for the farmer).
· Using manure, composts, and other organic amendments directly adds carbon-rich organic matter to the soil, and also can reduce the need for synthetic nitrogen fertilizers and associated CO2 emissions.

Comprehensive Assessment of Soil Health - The Cornell Framework 99
Soil Health Management - Part III
Rebuilding soil organic matter thus plays a role in climate change mitigation (reducing the “carbon footprint” of agriculture). At the same time, it increases adaptation to these changes by building resilience to extreme weather. Improved infiltration and drainage minimize crop stress, valuable top soil loss, and flooding during extreme rainfall events. Increased water holding capacity, in combination with better infiltration, allows for more water storage to buffer against short term drought.
Soil health management to prevent nitrous oxide emissionsNitrous oxide (N2O) is about 300 times more potent in its global warming potential than CO2 on a molecule-to-molecule basis. Over 70% of total U.S. N2O emissions come from agriculture, largely from excessive and poorly timed use of nitrogen fertilizers. While small amounts of this come from soil microbial nitrogen mineralization processes that cycle nitrogen from organic nitrogen to ammonium and nitrate, most comes from “denitrification” in water logged (low oxygen, anaerobic) soils that convert most of the nitrate (NO3
-)to the inert form of nitrogen gas (N2), while releasing significant amounts of N2O (Part I, Figure 1.10).
· Improved soil drainage will reduce denitrifica-tion and nitrogen losses (as well as CH4 losses) from water-logged soils, and greater water storage will reduce risk of applied nitrogen to be lost to the environment after a crop lost to drought. This also cuts costs for the farmer!
· Optimizing timing and amount applied, and splitting fertilizer applications can significantly reduce emissions and improve profit margins. Timing and amount should be based on crop demand, soil health measures, and new web-based decision tools and apps that take into account real-time weather effects (e.g., soil temperature, moisture, rainfall) on available nitrogen.
· Organic sources of nitrogen, such as legume rotation crops, manures, and composts will release nitrogen more slowly and ‘spoon feed’ the crop.
U.S. Agriculture’s Greenhouse Gas EmissionsWhile nationally and globally, CO2 emissions (mostly fossil fuels like coal, oil, and gas) are the biggest contributor to climate change, N2O and CH4 are of bigger concern for agriculture. They are such potent greenhouse gases that on a “CO2
- equivalent” basis their emissions from the U.S. agriculture sector contribute more to global warming than CO2 emissions from tractor driving or other fossil fuel energy use on the farm.
Greenhouse gas emissions from U.S. Agriculture (CO2 equivalent basis, 2007, USEPA).
These sources have the added benefit of allowing you to reduce the fossil fuel emissions associated with manufacturing and transporting synthetic fertilizers.
· Perennial plants and winter cover crops such as winter rye “scavenge” excess nitrogen from the soil and help store this in plant tissue over the winter and spring when it could otherwise be lost due to wet conditions. Decomposition then releases nitrogen to the subsequent cash crop.
CO220%
CH4
36%
N2O44%

100 Comprehensive Assessment of Soil Health - The Cornell Framework
Part III - Soil Health Management
In summary, healthy soils store more carbon and require fewer inputs. Thus, they have reduced carbon emissions associated with manufacture, transport, and application of inputs. They are also better able to prevent saturation and soil loss, and store water from large rainfall events to carry a crop through a short-term drought. Healthy soils therefore minimize greenhouse gas emissions, plant stress, and risk to the farmer of challenging weather events. Sustaining healthy productive soils also reduces the need for land clearing, deforestation, and related CO2 emissions internationally.
Cover crop being planted without tillage on previously manured field. Photo credit: Troy Bishopp
The larger picture above shows a rolled rye crop with emerging soybeans planted two weeks previous on 30 inch centers. The inset photo shows the roller/crimper on the front of the tractor with the soybean planter on the back. This method has found success in organic systems where the rye controls weeds by mulching the soil below the beans.

Comprehensive Assessment of Soil Health - The Cornell Framework 101
Soil Health Management - Part III
Cited References1 Adapted from work presented in: Moebius-Clune, Bianca, Dorn Cox, Brandon Smith, Dan Moebius-Clune,
Robert Schindelbeck, and Harold van Es. 2014. Implementation of a Soil Health Management Plan Resolves Pond Eutrophication at Tuckaway Farm, NH. What’s Cropping Up? Vol. 24, No.5, Sep – Oct, a newsletter for NY field crops and soils, Soil and Crop Science Section, Cornell University, Ithaca, NY.

102 Comprehensive Assessment of Soil Health - The Cornell Framework
Part IV - Additional Resources

Comprehensive Assessment of Soil Health - The Cornell Framework 103
Additional Resources - Part IV
Part IVAdditional Resources

104 Comprehensive Assessment of Soil Health - The Cornell Framework
Part IV - Additional ResourcesPart IV - Additional Resources
Additional Resources
Selected Book and Journal Resources:Andrews, S.S., D.L. Karlen, C.A. Cambardella. 2004. The soil management assessment
framework: A quantitative soil quality evaluation method. Soil Science of America Journal 68: 1945-1962.
Brady, N.C., and R.R. Weil. 1999. The Nature and Properties of Soil. 12th ed. Upper Saddle River, New Jersey: Prentice Hall. Print.
Clark, A. (ed.). 2007. Managing Cover Crops Profitably. 3rd Edition. Sustainable Agriculture Network, Handbook Series #9, Beltsville, MD. (order from: www.sare.org).
Clune, D.J. 2007. Glomalin: its relationship with aggregate stability, response to soil management, source and quantification. Cornell University, Ithaca, NY.
Cornell University Comprehensive Assessment of Soil Health Laboratory Soil Health Manual Series. January 2017. Schindelbeck, R.R., A.J. Ristow, K.S. Kurtz, L.F. Fennell, H.M. van Es.
Dahnke, W. C., D. A. Whitney. 1988. Measurement of soil salinity. Recommended chemical soil test procedures for the North Central Region, North Dakota Agric. Exp. Stn. Bull: 32-34.
Doran, J.W., D.C. Coleman, D.F. Bezdicek, B.A. Stewart. 1994. Defining Soil Quality for a Sustainable Environment. SSSA Special Publication No. 35. Soil Science Society of America, Madison, WI.
Doran, J.W., A.J. Jones. 1996. Methods for Assessing Soil Quality. SSSA Special Publication No. 49. Soil Science Society of America, Madison, WI. (order from: www.soils.org).
Fine, A.K., H.M. van Es, R.R. Schindelbeck. 2017. Statitstics, Scoring Functions and Regional Analysis of a Comprehensive Soil Health Database. Soil Science Society of America Journal. Accepted.
Franzluebbers, A., R. Haney, F. Hons, D. Zuberer. 1996. Determination of microbial biomass and nitrogen mineralization following rewetting of dried soil. Soil Science Society of America Journal 60: 1133-1139.
Grubinger, V. Farmers and Innovative Cover Cropping Techniques. A 70-minute educational video featuring 10 farms from 5 northeastern states (PA, NH, NY, MA, NJ). University of Vermont Extension in conjunction with NE-SARE (ordering information available at: http://www.uvm.edu/vtvegandberry/Videos/covercropvideo.html)
Grubinger, V. Vegetable Farmers and their Sustainable Tillage Practices. A 45-minute educational video featuring 9 farms from 4 northeastern states (PA, NH, NY, NJ). University of Vermont Extension in conjunction with NE-SARE. (ordering information available at: http://www.uvm.edu/vtvegandberry/Videos/covercropvideo.html)
Harrison, E.Z., M.B. McBride, D.R. Bouldin. 1999. Land application of sewage sludges: An appraisal of the US regulations. International Journal of Environment and Pollution 11 (1): 1–36.

Comprehensive Assessment of Soil Health - The Cornell Framework 105
Additional Resources - Part IVAdditional Resources - Part IV
Magdoff, F., R.R. Weil (eds.). 2004. Soil Organic Matter in Sustainable Agriculture. CRC Press, Taylor and Francis Group, Boca Raton, FL.
Magdoff, F.R., H.M. van Es. 2009. Building Soils for Better Crops: Sustainable Soil Management. Handbook Series Book 10. Sustainable Agric. Research and Education, Waldorf, MD. (Order or download from: www.sare.org).
Moebius-Clune, B. N., H.M. van Es, O.J. Idowu, R.R. Schindelbeck, J.M. Kimetu, S. Ngoze, J. Lehmann, J.M. Kinyangi. 2010. Development and evaluation of scoring functions for integrative soil quality assessment and monitoring in western Kenya. In Applications of Integrative Soil Quality Assessment in Research, Extension, and Education. Ph.D. Dissertation, Cornell University, Ithaca NY.
Moebius-Clune, B. N., H.M. van Es, O.J. Idowu, R.R. Schindelbeck, J.M. Kimetu, S. Ngoze, J. Lehmann, J.M. Kinyangi. 2011. Long-term Soil Quality Degradation along a Cultivation Chronosequence in Western Kenya. Agriculture Ecosystems and Environment, 141, 86-99.
Moebius-Clune, B.N., D. Cox, S. Brandon, D. Moebius-Clune, R. Schindelbeck, H. van Es. 2014. Implementation of a Soil Health Management Plan Resolves Pond Eutrophication at Tuckaway Farm, NH. What’s Cropping Up? Vol. 24, No.5, Sep – Oct, A newsletter for NY field crops and soils, Department of Crop and Soil Science, Cornell University, Ithaca, NY.
New York State Department of Environmental Conservation. 2006. Brownfield and Superfund Regulation, 6 NYCRR Part 375 - Environmental Remediation Programs. Division of Environmental Remediation, Albany, NY. Available at http://www.dec.ny.gov/chemical/34189.html
New York State Department of Environmental Conservation and New York State Department of Health. 2005. Concentrations of Selected Analytes in Rural New York State Surface Soils: A Summary Report on the Statewide Rural Surface Soil Survey. Albany, NY. Available at http://www.dec.ny.gov/docs/remediation_hudson_pdf/appendixde.pdf
Retec Group, Inc. 2007. Characterization of Soil Background PAH and Metal Con-centrations in Manhattan, New York. Consolidated Edison, New York, NY.
Rhoades, J.D. 1996. Salinity: Electrical conductivity and total dissolved solids. In Methods of Soil Analysis. Part 3-Chemical Methods. SSSA, Inc. ASA, Inc. Madison, WI. P. 417-435.
Sarrantonio, M. 1994. Northeast Cover Crop Handbook. Soil Health Series, Rodale Institute, Kutztown, PA. (order from: http://www.johnnyseeds.com/p-7976-northeast-cover-crop-hand-
book.aspx#)
Soil and Water Conservation Society (SWCS). 2000. Soil Biology Primer. Rev. ed. Ankeny, IA: Soil and Water Conservation Society.

106 Comprehensive Assessment of Soil Health - The Cornell Framework
Part IV - Additional ResourcesPart IV - Additional Resources
Selected Book and Journal Resources: Continued
Uphoff, N. et al. (eds.). 2006. Biological Approaches to Sustainable Soil Systems. CRC Press, Taylor and Francis Group, Boca Raton, FL.
Walker, J.M. 2002. The bicinchonic acid (BCA) assay for protein quantitation. In: J. M. Walker, editor The Protein Protocols Handbook. Humana Press, Totowa, NJ.
Wolfe, D.W. 2001. Tales From the Underground: A Natural History of Subterranean Life. Perseus Publishing Group. Cambridge, MA.
Wolf, J.M., A.H. Brown, D.R. Goddard. 1952. An improved electrical conductivity method for accurately following changes in the respiratory quotient of a single biological sample. Plant Physiology 27: 70-80.
Wollum, A., J. Gomez. 1970. A conductivity method for measuring microbially evolved carbon dioxide. Ecology 51: 155-156.
Wright, S.F., A. Upadhyaya. 1996. Extraction of an abundant and unusual protein from soil and comparison with hyphal protein of arbuscular mycorrhizal fungi. Soil Science 161: 575-586.
Zibilske, L. 1994. Carbon mineralization. Methods of Soil Analysis: Part 2—Micro-biological and Biochemical Properties. p. 835-863.
Good pasture management leads to good soil health.

Comprehensive Assessment of Soil Health - The Cornell Framework 107
Additional Resources - Part IVAdditional Resources - Part IV
Selected Web Resources:
Cornell Comprehensive Assessment of Soil Health (CASH) (http://soilhealth.cals.cornell.edu): The Cornell CASH website provides resources on many aspects of soil health management. For example, there is information regarding the Cornell Soil Health Test in addition to links to important resources such as how to take, package and ship a soil health sample, a downloadable version of this manual, demonstration tools, and a detailed description of the Soil Health Management Planning Process.
National Sustainable Agriculture Information Service (http://attra.ncat.org/): contains information pertaining to sustainable agriculture and organic farming including in-depth publications on production practices, alternative crop and livestock enterprises, innovative marketing, organic certification, and highlights of local, regional, USDA and other federal sustainable ag activities.
Northeast Sustainable Agriculture Research and Education (http://www.nesare.org): search the project report database for the latest in sustainable research and education projects that are ongoing in the northeast including information on soil management.
Soil Science Society of America (http://www.soils.org): is the website for the soil science professionals.
USDA-Natural Resources Conservation Service (NRCS) Soil Survey and Soil Health Information
(http://soils.usda.gov) (http://www.nrcs.usda.gov/wps/portal/nrcs/main/national/soils/health/): Helping People Help the Land. Websites provide a wealth of information of soil taxonomy, soil survey maps, soil biology, soil function, soil health educational materials, etc. for educators, researchers and land managers.
Agency for Toxic Substances and Disease Registry ToxFAQsTM (http://www.atsdr.cdc.gov/toxfaqs/index.asp): contains information about contami-nants found at hazardous waste sites.
Cornell Waste Management Institute (http://cwmi.css.cornell.edu/soilquality.htm): fact sheets and other resources provide a variety of information related to soil contaminants, soil testing, and best practices, including “Sources and Impacts of Contaminants in Soils”, “Guide to Soil Testing and Interpreting Results”, and “Soil Contaminants and Best Practices for Healthy Gardens.”

108 Comprehensive Assessment of Soil Health - The Cornell Framework
Part IV - Additional ResourcesPart IV - Additional Resources
Selected Web Resources: Continued
Healthy Soils, Healthy Communities Project (http://cwmi.css.cornell.edu/healthysoils.htm): a community-research-Extension partnership led by Cornell University, the New York State Department of Health, and NYC Parks GreenThumb, funded by National Institute of Health and National Institute of Environmental Health Sciences. Research and Extension activities address contamina-tion in urban gardens and provide resources for gardeners and others, including: “What Gardeners Can Do: 10 Best Practices for Healthy Gardening” (http://cwmi.css.cornell.edu/WhatGardenersCanDoEnglish.pdf) and “Metals in Urban Garden Soils”
(http://cwmi.css.cornell.edu/Metals_Urban_Garden_Soils.pdf)
New York State Department of Health, “Healthy Gardening: Tips for New andExperienced Gardeners”
(http://www.health.ny.gov/publications/1301/index.htm): provides information to help gardeners learn more about where to plant, how to prepare new gardens, and how to grow and harvest healthier fruits and vegetables.
New York State Department of Health, Lead Poisoning Prevention (http://www.health.ny.gov/environmental/lead): provides information to help people prevent lead poisoning.
US Environmental Protection Agency, Urban Agriculture and Improving Local,Sustainable Food Systems
(http://www.epa.gov/brownfields/urbanag/): resources from the Office of Brownfields and Land Revitalization provide information intended for people working on agriculture projects as a part of brownfield redevelopment and reuse. The website includes educational resources, success stories, FAQs, and more.
Soil Health Institute (http://soilhealthinstitute.org/): a multi-organizational effort lead by Farm Foundation, NFP and the Samuel Roberts Noble Foundation to advance soil health and make soil health the cornerstone of land use management decisions by bringing together relevant stakeholders around critical needs.
USDA Agricultural Research Service Northern Great Plains Research Laboratory Cover Crop Chart (http://www.ars.usda.gov/Main/docs.htm?docid=20323): designed to assist producers with decisions on the use of cover crops in crop and forage production systems.

Comprehensive Assessment of Soil Health - The Cornell Framework 109
Additional Resources - Part IVAdditional Resources - Part IV
TM

110 Comprehensive Assessment of Soil Health - The Cornell Framework
Appendix A. Sample 2017 Standard Package Cornell Soil Health Assessment Report
Appendix A
Sample 2017 Standard Package
Cornell Soil Health Assessment Report

Comprehensive Assessment of Soil Health - The Cornell Framework 111
Appendix A. Sample 2017 Standard Package Cornell Soil Health Assessment Report
Comprehensive Assessment of Soil Health - The Cornell Framework Manual 111
Appendix A. Sample 2016 Standard Package Cornell Soil Health Assessment Report
Comprehensive Assessment of Soil HealthFrom the Cornell Soil Health Laboratory, Department of Soil and Crop Sciences, School of Integrative Plant Science, Cornell University, Ithaca, NY 14853. http://soilhealth.cals.cornell.edu
Grower:Mr. T Organic Grains 556 Loamy Haven Hardwork, PA 12435
Agricultural Service Provider: Mr. Bob Consulting
Sample ID: LL6
Field ID: Deep six
Date Sampled: 10/16/2015
Crops Grown: COG/COG/COG
Tillage: more than 9 inches
Test ReportMeasured Soil Textural Class: sandy loam
Sand: 59% - Silt: 36% - Clay: 5%
Group Indicator Value Rating Constraints
0.09 28
255 14 Rooting, Water Transmission
physical Available Water Capacity
physical Surface Hardness
physical Subsurface Hardness 400 18 Subsurface Pan/Deep Compaction, DeepRooting, Water and Nutrient Access
56.4 76
2.1 54
6.9 44
0.6 55
359 32
5.9 54
2.3 66
175.3 100
physical Aggregate Stability
biological Organic Matter
biological ACE Soil Protein Index
biological Soil Respiration
biological Active Carbon
chemical Soil pH
chemical Extractable Phosphorus
chemical Extractable Potassium
chemical Minor ElementsMg: 134.0 / Fe: 3.4 / Mn: 2.7 / Zn: 1.3
100
Overall Quality Score: 53 / Medium

112 Comprehensive Assessment of Soil Health - The Cornell Framework
Appendix A. Sample 2017 Standard Package Cornell Soil Health Assessment Report
112 Comprehensive Assessment of Soil Health - The Cornell Framework Manual
Appendix A. Sample 2016 Standard Package Cornell Soil Health Assessment Report
Measured Soil Health IndicatorsThe Cornell Soil Health Test measures several indicators of soil physical, biological and chemical health. These are listed on the left side of the report summary, on the first page. The "value" column shows each result as a value, measured in the laboratory or in the field, in units of measure as described in the indicator summaries below. The "rating" column interprets that measured value on a scale of 0 to 100, where higher scores are better. Ratings in red are particularly important to take note of, but any in yellow, particularly those that are close to a rating of 30 are also important in addressing soil health problems.
A rating below 20 indicates a Constraint and is color‐coded red. This indicates a problem that is likely limiting yields, crop quality, and long‐term sustainability of the agroecosystem. In several cases this indicates risks of environmental loss as well. The "constraint" column provides a short list of soil processes that are not functioning optimally when an indicator rating is red. It is particularly important to take advantage of any opportunities to improve management that will address these constraints.
A rating between 20 and 40 indicates Low-level functioning and is color‐coded orange. This indicates that a soil process is functioning somewhat poorly and addressing this should be considered in the field management plan. The Management Suggestions Table at the end of the Soil Health Assessment Report provides linkages to field management practices that are useful in addressing each soil indicator process.A rating between 40 and 60 indicates Suboptimal functioning and is color‐coded yellow. This indicates that soil health could be better; and yield and sustainability could decrease over time if this is not addressed. This is especially so if the condition is being caused, or not being alleviated, by current management. Pay attention particularly to those indicators rated in yellow and close to 40.A rating between 60 and 80 indicates Excellent functioning and is color‐coded light green. This indicates that this soil process is functioning at a non-limiting level. Field soil management approaches should be maintained at the current intensity or improved.A rating of 80 or greater indicates Optimal or near‐optimal functioning and is color‐ coded dark green. Past management has been effective at maintaining soil health. It can be useful to note which particular aspects of management have likely maintained soil health, so that such management can be continued. Note that soil health is often high, when first converting from a permanentsod or forest. In these situations, intensive management quickly damages soil health when it includes intensive tillage, low organic matter inputs, bare soils for significant parts of the year, or excessive traffic, especially during wet times.The Overall Quality Score at the bottom of the report is an average of all ratings, and provides an indication of the soil’s overall health status. However, the important part is to know which particular soil processes are constrained or suboptimal so that these issues can be addressed through appropriate management. Therefore the ratings for each indicator are more important information.
The Indicators measured in the Cornell Soil Health Assessment are important soil properties and characteristics in themselves, but also are representative of key soil processes, necessary for the proper functioning of the soil. The following is a summary of the indicators measured, what each of these indicates about your soil’s health status, and what may influence the relevant properties and processes described.
A Management Suggestions Table follows, at the end of the report, with short and long termsuggestions for addressing constraints or maintaining a well‐functioning system. This table will indicate constraints identified in this assessment for your soil sample by the same yellow and red color coding described above. Please also find further useful information by following the links to relevant publications and web resources that follow this section.

Comprehensive Assessment of Soil Health - The Cornell Framework 113
Appendix A. Sample 2017 Standard Package Cornell Soil Health Assessment Report
Comprehensive Assessment of Soil Health - The Cornell Framework Manual 113
Appendix A. Sample 2016 Standard Package Cornell Soil Health Assessment Report
Texture is an inherent property of soil, meaning that it is rarely changed by management. It is thus not a soil health indicator per se, but is helpful both in interpreting the measured values of indicators (see the Cornell Soil Health Assessment Training Manual), and for deciding on appropriate management strategies that will work for that soil.
Your soil’s measured textural class and composition: Sandy Loam
Sand: 59% Silt: 36% Clay: 5%
Available Water Capacity is a measure of the porosity of the soil, within a pore size rangeimportant for water retention. Measured by the amount of water held by the soil sample between field capacity and wilting point by applying different levels of air pressure, the value is presented in grams of water per gram of soil. This value is scored against an observed distribution in regional soils with similar texture. A physical soil characteristic, AWC is an indicator of the amount of plant‐available water the soil can store, and therefore how crops will fare in droughty conditions. Soils with lower storage capacity will cause greater risk of drought stress. AWC is generally lower when total organic matter and/or aggregation is low. It can be improved by reducing tillage, long‐term cover cropping, and adding large amounts of well‐decomposed organic matter such as compost.
Coarse textured (sandy) soils inherently store less water than finer textured soils, so that managing
for relatively high water storage capacity is particularly important in coarse textured soils. While the textural effect cannot be influenced by management, management decisions can be in part based on an understanding of inherent soil characteristics.
Your measured Available Water Capacity value is 0.09 g/g, corresponding with a score of28. This score is in the Low range, relative to regional soils with similar texture. This suggeststhat, while Available Water Capacity does not currently register as a strong constraint,management practices should be geared toward improving this condition, as it currentlyindicates suboptimal functioning. Please refer to the management suggestions table at theend of this document.
Surface Hardness is a measure of compaction that develops when large pores are lost in the surface soil (0‐6 inches). Compaction is measured in the field using a penetrometer, and the resultant value is expressed in pounds per square inch (p.s.i.), representing the localized pressure necessary to break through the soil. It is scored by comparison with a distribution observed in regional soils, with lower hardness values rating higher scores. A strongly physical characteristic of soils, surface hardness is an indicator of both physical and biological health of the soil, as growing roots and fungal hyphae must be able to grow through soil, and may be severely restricted by excessively hard soil. Compaction also influences water movement through soil. When surface soils are compacted, runoff, erosion, and slow infiltration can result. Soil compaction is influenced by management, particularly in timing and degree of traffic and plowing disturbance, being worst when the soil is worked wet.
Your measured Surface Hardness value is 255 p.s.i., corresponding with a score of 14.Thisscoreisinthe VeryLow(constraining) range, relative to regional soils with similar texture. Surface Hardness level should be given a high priority in management decisions based on this assessment, as it is likely to be an important constraint to proper soil functioning and sustainability of management at this time. Please refer to the management suggestions table at the end of this document.

114 Comprehensive Assessment of Soil Health - The Cornell Framework
Appendix A. Sample 2017 Standard Package Cornell Soil Health Assessment Report
114 Comprehensive Assessment of Soil Health - The Cornell Framework Manual
Appendix A. Sample 2016 Standard Package Cornell Soil Health Assessment Report
Subsurface Hardness is a measure of compaction that develops when large pores are lost in the subsurface soil (6‐18 inches). Subsurface hardness is measured and scored similarly to surface hardness, but deeper in the profile, and scored against an observed distribution in regional soils with similar texture. Large pores are necessary for water and air movement and to allow roots to explore the soil. Subsurface hardness prevents deep rooting and thus deep water and nutrient uptake by plants, and can increase disease pressure by stressing plants. It also causes poor drainage and poor deep water storage. After heavy rain events, water can build up over a hard pan causing poor aeration both at depth and at the surface, as well as ponding, poor infiltration, runoff and erosion. Impaired water movement and storage create greater risk during heavy rainfall events, as well as greater risk of drought stress. Compaction occurs very rapidly when the soil is worked or trafficked while it is too wet, and compaction can be transferred deep into the soil even from surface pressure. Subsoil compaction in the form of a plow pan is usually found beneath the plow layer, and is caused by smearing and pressure exerted on the undisturbed soil just beneath the deepest tillage operation, especially when wet.
Your measured Subsurface Hardness value is 400 p.s.i., corresponding with a score of 18.This score is in the Very Low (constraining) range, relative to regional soils with similar texture. Subsurface Hardness level should be given a high priority in management decisions based on this assessment, as it is likely to be an important constraint to proper soil functioning and sustainability of management at this time. Please refer to the managementsuggestions table at the end of this document.
Aggregate Stability is a measure of how well soil aggregates or crumbs hold together under rainfall. Measured by the fraction of dried aggregates that disintegrate under a controlled, simulated rainfall event similar in energy delivery to a hard spring rain, the value is presented as a percent, and scored against a distribution observed in regional soils with similar textural characteristics. A physical characteristic of soil, Aggregate Stability is a good indicator of soil biological and physical health. Good aggregate stability helps prevent crusting, runoff, and erosion, and facilitates aeration, infiltration, and water storage, along with improving seed germination and root and microbial health. Aggregate stability is influenced by microbial activity, as aggregates are largely held together by microbial colonies and exudates, and is impacted by management practices, particularly tillage, cover cropping, and fresh organic matter additions.
Your measured Aggregate Stability value is 56.4 %, corresponding with a score of 76. This score is in the Excellent range, relative to regional soils with similar texture. This suggests that this soil process is enhancing overall soil resilience. Soil management should aim at maintaining this functionality while addressing any other measured soil constraints as identified in the Soil Health Assessment Report. Please refer to the management suggestions table at the end of this document.

Comprehensive Assessment of Soil Health - The Cornell Framework 115
Appendix A. Sample 2017 Standard Package Cornell Soil Health Assessment Report
Comprehensive Assessment of Soil Health - The Cornell Framework Manual 115
Appendix A. Sample 2016 Standard Package Cornell Soil Health Assessment Report
Organic Matter (OM) is a measure of the carbonaceous material in the soil that is biomass or biomass‐derived. Measured by the mass lost on combustion of oven‐dried soil, the value is presented as a percent of the total soil mass. This is scored against an observed distribution of OM in regional soils with similar texture. A soil characteristic that measures a physical substance of biological origin, OM is a key or central indicator of the physical, biological, and chemical health of the soil. OM content is an important influence on soil aggregate stabilization, water retention, nutrient cycling, and ion exchange capacity. OM acts as a long‐term slow‐release pool for nutrients. Soils with low organic matter tend to require higher inputs, and be less resilient to drought and extreme rainfall. OM is directly derived from biomass of microbial communities in the soil (bacterial, fungal, and protozoan), as well as from plant roots and detritus, and biomass‐containing amendments like manure, green manures, mulches, composts, and crop residues. The retention and accumulation of OM is influenced by management practices such as tillage and cover cropping, as well as by microbial community growth. Intensive tillage and lack of organic matter additions from various sources (amendments, residues, active crop or cover crop growth) will decrease organic matter content and overall soil health with time.
Your measured Organic Matter value is 2.1 %, corresponding with a score of 54. This score is in the Medium range, relative to regional soils with similar texture. This suggests that, while Organic Matter is functioning at an average level, management practices should be geared toward improving this condition, as it currently indicates suboptimal functioning. Soil management should aim at improving this functionality while addressing any other measured soil constraints as identified in the Soil Health Assessment Report. Please refer to the management suggestions table at the end of this document.
Soil Proteins are the fraction of the soil organic matter that are present as proteins or protein‐like substances. This represents the large pool of organically bound N in the SOM, which microbial activity can mineralize, and make available for plant uptake. Measured by extraction with a citrate buffer under high temperature and pressure (hence Autoclave Citrate Extractable, or ACE proteins), the value given is expressed in mg extracted per gram of soil. As the method used extracts only a readily extractable fraction of the total amount of soil proteins in the SOM, we present this value as an index rather than as an absolute quantity. A measure of a physical substance, protein content is an indicator of the biological and chemical health of the soil, and is very well associated with overall soil health status. Protein content, as organically bound N, influences the ability of the soil to make N available by mineralization, and has been associated with soil aggregation and water movement. Protein content can be influenced by biomass additions, the presence of roots and soil microbes, and tends to decrease with increasing soil disturbance such as tillage.
Your measured ACE Soil Protein Index value is 6.9 , corresponding with a score of 44. This score is in the Medium range, relative to regional soils with similar texture. This suggests that, while ACE Soil Protein Index is functioning at an average level, management practices should be geared toward improving this condition, as it currently indicates suboptimal functioning. Soil management should aim at improving this functionality while addressing any other measured soil constraints as identified in the Soil Health Assessment Report. Please refer to the management suggestions table at the end of this document.
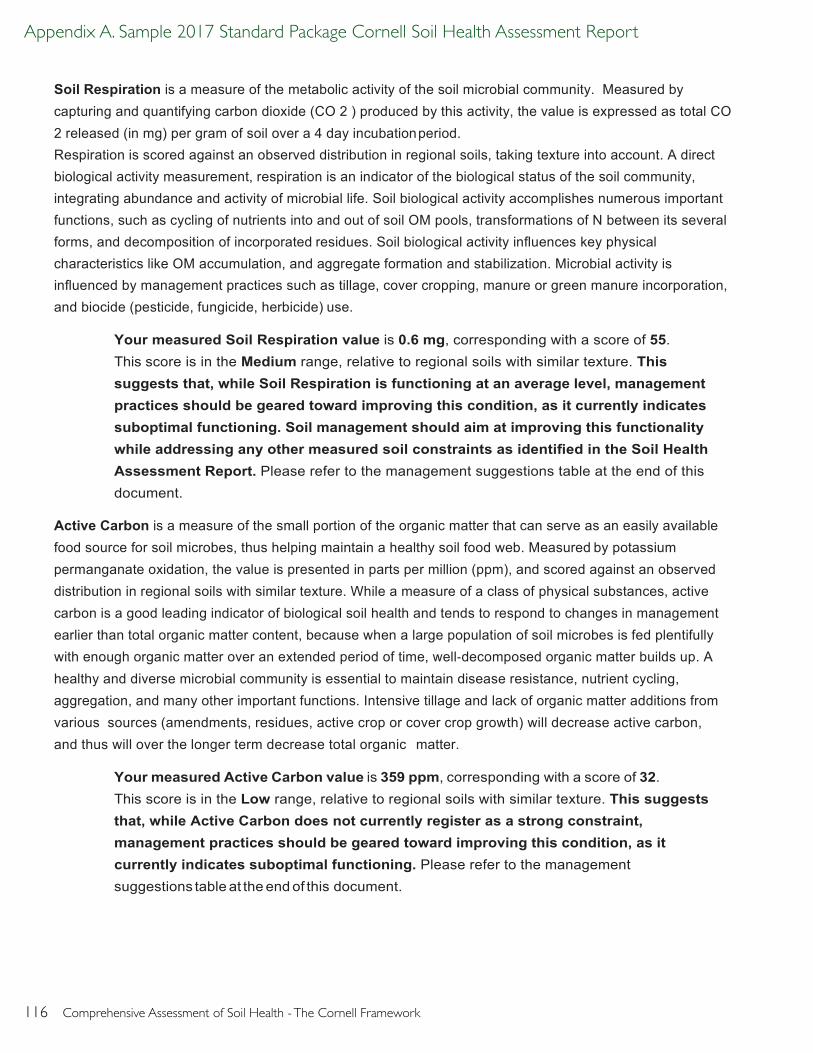
116 Comprehensive Assessment of Soil Health - The Cornell Framework
Appendix A. Sample 2017 Standard Package Cornell Soil Health Assessment Report
116 Comprehensive Assessment of Soil Health - The Cornell Framework Manual
Appendix A. Sample 2016 Standard Package Cornell Soil Health Assessment Report
Soil Respiration is a measure of the metabolic activity of the soil microbial community. Measured by capturing and quantifying carbon dioxide (CO 2 ) produced by this activity, the value is expressed as total CO 2 released (in mg) per gram of soil over a 4 day incubationperiod.Respiration is scored against an observed distribution in regional soils, taking texture into account. A direct biological activity measurement, respiration is an indicator of the biological status of the soil community, integrating abundance and activity of microbial life. Soil biological activity accomplishes numerous important functions, such as cycling of nutrients into and out of soil OM pools, transformations of N between its several forms, and decomposition of incorporated residues. Soil biological activity influences key physical characteristics like OM accumulation, and aggregate formation and stabilization. Microbial activity is influenced by management practices such as tillage, cover cropping, manure or green manure incorporation, and biocide (pesticide, fungicide, herbicide) use.
Your measured Soil Respiration value is 0.6 mg, corresponding with a score of 55. This score is in the Medium range, relative to regional soils with similar texture. This suggests that, while Soil Respiration is functioning at an average level, management practices should be geared toward improving this condition, as it currently indicates suboptimal functioning. Soil management should aim at improving this functionality while addressing any other measured soil constraints as identified in the Soil Health Assessment Report. Please refer to the management suggestions table at the end of this document.
Active Carbon is a measure of the small portion of the organic matter that can serve as an easily available food source for soil microbes, thus helping maintain a healthy soil food web. Measured by potassium permanganate oxidation, the value is presented in parts per million (ppm), and scored against an observed distribution in regional soils with similar texture. While a measure of a class of physical substances, active carbon is a good leading indicator of biological soil health and tends to respond to changes in management earlier than total organic matter content, because when a large population of soil microbes is fed plentifully with enough organic matter over an extended period of time, well‐decomposed organic matter builds up. A healthy and diverse microbial community is essential to maintain disease resistance, nutrient cycling, aggregation, and many other important functions. Intensive tillage and lack of organic matter additions from various sources (amendments, residues, active crop or cover crop growth) will decrease active carbon, and thus will over the longer term decrease total organic matter.
Your measured Active Carbon value is 359 ppm, corresponding with a score of 32. This score is in the Low range, relative to regional soils with similar texture. This suggests that, while Active Carbon does not currently register as a strong constraint, management practices should be geared toward improving this condition, as it currently indicates suboptimal functioning. Please refer to the management suggestions table at the end of this document.

Comprehensive Assessment of Soil Health - The Cornell Framework 117
Appendix A. Sample 2017 Standard Package Cornell Soil Health Assessment Report
Comprehensive Assessment of Soil Health - The Cornell Framework Manual 117
Appendix A. Sample 2016 Standard Package Cornell Soil Health Assessment Report
Soil pH is a measure of how acidic the soil is, which controls how available nutrients are to crops. A physico‐chemical characteristic of soils, pH is an indicator of the chemical or nutrient status of the soil. Measured with an electrode in a 1:1 soil:water suspension, the value is presented in standard pH units, and scored using an optimality curve. Optimum pH is around 6.2‐6.8 for most crops (exceptions include potatoes and blueberries, which grow best in more acidic soil – this is not accounted for in the report interpretation). If pH is too high, nutrients such as phosphorus, iron, manganese, copper and boron become unavailable to the crop. If pH is too low, calcium, magnesium, phosphorus, potassium and molybdenum become unavailable. Lack of nutrient availability will limit crop yields and quality. Aluminum toxicity can also be a concern in low pH soils, which can severely decrease root growth and yield, and in some cases lead to accumulation of aluminum and other metals in crop tissue. In general, as soil OM increases, crops can tolerate lower soil pH. Soil pH also influences the ability of certain pathogens to thrive, and of beneficial organisms to effectively colonize roots. Raising the pH through lime or wood ash applications, and organic matter additions, will help immobilize aluminum and heavy metals, and maintain proper nutrient availability.
Your measured Soil pH value is 5.9 , corresponding with a score of 54. This score is in the Medium range, relative to regional soils with similar texture. This suggests that, while Soil pH is functioning at an average level, management practices should be geared toward improving this condition, as it currently indicates suboptimal functioning. Soil management should aim at improving this functionality while addressing any other measured soil constraints as identified in the Soil Health Assessment Report. Please refer to the management suggestions table at the end of this document.
Extractable Phosphorus is a measure of phosphorus (P) availability to a crop. Measured on a modified Morgan’s extractant, using a rapid‐flow analyzer, the value is presented in parts per million (ppm), and scored against an optimality curve for sufficiency or excess. P is an essential plant macronutrient, and its availability varies with soil pH and mineral composition. Low P values indicate poor P availability to plants, and excessively high P values indicates a risk of adverse environmental impact through runoff and contamination of surface waters. Most soils in the Northeast store unavailable P from the soil’s mineral make up or from previously applied fertilizer or manure. This becomes more available to plants as soils warm up. Therefore, incorporating or banding 10‐25 lbs/acre of soluble ‘starter’ P fertilizer at planting can be useful even when soil levels are optimum. Some cover crops, such as buckwheat, are good at mining otherwiseunavailable P so that it becomes more available to the following crop. When plants associate with mycorrhizal fungi, these can also help make P (and other nutrients and water) more available to the crop. P is an environmental contaminant and runoff of P into fresh surface water will cause damage through eutrophication, so over‐application is strongly discouraged, especially close to surface water, on slopes, andon large scales.
Your measured Extractable Phosphorus value is 2.3 ppm, corresponding with a score of 66. This score is in the Excellent range, relative to regional soils with similar texture. This suggests that this soil process is enhancing overall soil resilience. Soil management should aim at maintaining this functionality while addressing any other measured soil constraints as identified in the Soil Health Assessment Report. Please refer to the management suggestions table at the end of this document.

118 Comprehensive Assessment of Soil Health - The Cornell Framework
Appendix A. Sample 2017 Standard Package Cornell Soil Health Assessment Report
118 Comprehensive Assessment of Soil Health - The Cornell Framework Manual
Appendix A. Sample 2016 Standard Package Cornell Soil Health Assessment Report
Extractable Potassium is a measure of potassium (K) availability to the crop. Measured using modified Morgan’s extract and an ICP Spectrometer, the value is presented in parts per million (ppm), and scored against an optimality curve for sufficiency. K is an indicator of soil nutrient status, as it is an essential plant macronutrient. Plants with higher potassium tend to be more tolerant of frost and cold. Thus good potassium levels may help with season extension. While soil pH only marginally affects K availability, K is easily leached from sandy soils and is only weakly held by increased organic matter, so that applications of the amount removed by the specific crop being grown are generally necessary in such soils.
Your measured Extractable Potassium value is 175.3 ppm, corresponding with a score of 100. This score is in the Optimal range, relative to regional soils with similar texture. This suggests that management practices should be geared toward maintaining this condition, as it currently indicates ideal soil functioning. Please refer to the management suggestions table at the end of this document.
Minor Elements, also called secondary (calcium, magnesium and sulfur) and micro (iron, manganese, zinc, copper, boron, molybdenum, etc.) nutrients are essential plant nutrients taken up by plants in smaller quantities than the macro nutrients N, P and K. If any minor elements are deficient, this will decrease yield and crop quality, but toxicities can also occur when concentrations are too high. This assessment’s minor elements rating indicates whether four measured micronutrients (magnesium, iron, manganese, and zinc) are deficient or excessive.
Micronutrient availability is strongly influenced by pH and organic matter. Low pH increases the availability of most micronutrients, whereas high pH increases the availability of molybdenum, magnesium and calcium. High OM and microbial activity tend to increase micronutrient availability. Note that this test does not measure all important micronutrients. Consider submitting a sample for a complete micronutrient analysis to find out the levels of the other micronutrients.
Your measured Minor Elements Rating is 100. This score is in the Optimal range. Magnesium(134.0ppm) issufficient, Iron (3.4ppm) issufficient,Manganese(2.7ppm) is sufficient, Zinc (1.3 ppm) is sufficient. This suggests that management practices should be geared toward maintaining this condition, as it currently indicates ideal soil functioning. Please refer to the management suggestions table at the end of this document.
Overall Quality Score: an overall quality score is computed from the individual indicator scores. This score is further rated as follows: less than 40% is regarded as very low, 40‐55% is low, 55‐70% is medium, 70‐85% is high and greater than 85% is regarded as very high. The highest possible quality score is 100 and the least score is 0, thus it is a relative overall soil health status indicator. However, of greater importance than a single overall metric is identification of constrained or suboptimally functioning soil processes, so that these issues can be addressed through appropriate management. The overall soil quality score should be taken as a general summary rather than the main focus.
Your Overall Quality Score is 53, which is in the Medium range.
Management Suggestions for Physical and Biological Constraints
Constraint Short Term Management Suggestions Long Term ManagementSuggestions
Available Water CapacityLow
• Add stable organic materials, mulch• Add compost or biochar• Incorporate high biomass cover crop
• Reduce tillage• Rotate with sod crops• Incorporate high biomass cover crop
Surface Hardness High • Perform some mechanical soil loosening(strip till, aerators, broadfork, spader)• Use shallow-rooted cover crops• Use a living mulch or interseed cover crop
• Shallow-rooted cover/rotation crops• Avoid traffic on wet soils, monitor• Avoid excessive traffic/tillage/loads• Use controlled traffic patterns/lanes
Subsurface HardnessHigh
• Use targeted deep tillage (subsoiler,yeomans plow, chisel plow, spader.)• Plant deep rooted cover crops/radish
• Avoid plows/disks that create pans• Avoid heavy loads• Reduce traffic when subsoil is wet
Aggregate Stability Low • Incorporate fresh organic materials• Use shallow-rooted cover/rotation crops• Add manure, green manure, mulch
• Reduce tillage• Use a surface mulch• Rotate with sod crops and mycorrhizalhosts
Organic Matter Low • Add stable organic materials, mulch• Add compost and biochar• Incorporate high biomass cover crop
• Reduce tillage/mechanical cultivation• Rotate with sod crop• Incorporate high biomass cover crop
ACE Soil Protein IndexLow
• Add N-rich organic matter (low C:N sourcelike manure, high N well-finished compost)• Incorporate young, green, cover cropbiomass• Plant legumes and grass-legume mixtures• Inoculate legume seed with Rhizobia &check for nodulation
• Reduce tillage• Rotate with forage legume sod crop• Cover crop and add fresh manure• Keep pH at 6.2-6.5 (helps N fixation)• Monitor C:N ratio of inputs
Soil Respiration Low • Maintain plant cover throughout season• Add fresh organic materials• Add manure, green manure• Consider reducing biocide usage
• Reduce tillage/mechanical cultivation• Increase rotational diversity• Maintain plant cover throughoutseason• Cover crop with symbiotic host plants
Active Carbon Low • Add fresh organic materials• Use shallow-rooted cover/rotation crops• Add manure, green manure, mulch
• Reduce tillage/mechanical cultivation• Rotate with sod crop• Cover crop whenever possible

Comprehensive Assessment of Soil Health - The Cornell Framework 119
Appendix A. Sample 2017 Standard Package Cornell Soil Health Assessment Report
Comprehensive Assessment of Soil Health - The Cornell Framework Manual 119
Appendix A. Sample 2016 Standard Package Cornell Soil Health Assessment Report
Management Suggestions for Physical and Biological Constraints
Constraint Short Term Management Suggestions Long Term ManagementSuggestions
Available Water CapacityLow
• Add stable organic materials, mulch• Add compost or biochar• Incorporate high biomass cover crop
• Reduce tillage• Rotate with sod crops• Incorporate high biomass cover crop
Surface Hardness High • Perform some mechanical soil loosening(strip till, aerators, broadfork, spader)• Use shallow-rooted cover crops• Use a living mulch or interseed cover crop
• Shallow-rooted cover/rotation crops• Avoid traffic on wet soils, monitor• Avoid excessive traffic/tillage/loads• Use controlled traffic patterns/lanes
Subsurface HardnessHigh
• Use targeted deep tillage (subsoiler, yeomans plow, chisel plow, spader.)• Plant deep rooted cover crops/radish
• Avoid plows/disks that create pans• Avoid heavy loads• Reduce traffic when subsoil is wet
Aggregate Stability Low • Incorporate fresh organic materials• Use shallow-rooted cover/rotation crops• Add manure, green manure, mulch
• Reduce tillage• Use a surface mulch• Rotate with sod crops and mycorrhizalhosts
Organic Matter Low • Add stable organic materials, mulch• Add compost and biochar• Incorporate high biomass cover crop
• Reduce tillage/mechanical cultivation• Rotate with sod crop• Incorporate high biomass cover crop
ACE Soil Protein IndexLow
• Add N-rich organic matter (low C:N sourcelike manure, high N well-finished compost)• Incorporate young, green, cover cropbiomass• Plant legumes and grass-legume mixtures• Inoculate legume seed with Rhizobia &check for nodulation
• Reduce tillage• Rotate with forage legume sod crop• Cover crop and add fresh manure• Keep pH at 6.2-6.5 (helps N fixation)• Monitor C:N ratio of inputs
Soil Respiration Low • Maintain plant cover throughout season• Add fresh organic materials• Add manure, green manure• Consider reducing biocide usage
• Reduce tillage/mechanical cultivation• Increase rotational diversity• Maintain plant cover throughoutseason• Cover crop with symbiotic host plants
Active Carbon Low • Add fresh organic materials• Use shallow-rooted cover/rotation crops• Add manure, green manure, mulch
• Reduce tillage/mechanical cultivation• Rotate with sod crop• Cover crop whenever possible
ABOVE. Management suggestions table for physical and biological constraints. Constrained indicators are flagged in red in the report management table. Black text indicates no high-priority constraint.

120 Comprehensive Assessment of Soil Health - The Cornell Framework
Appendix A. Sample 2017 Standard Package Cornell Soil Health Assessment Report
120 Comprehensive Assessment of Soil Health - The Cornell Framework Manual
Appendix A. Sample 2016 Standard Package Cornell Soil Health Assessment Report
Management Suggestions for Chemical Constraints
Constraint Short Term Management Suggestions Long Term Management Suggestions
Soil pH Low • Add lime or wood ash per soil testrecommendations• Add calcium sulfate (gypsum) in additionto lime if aluminum is high• Use less ammonium or urea
• Test soil annually & add "maintenance"lime per soil test recommendations to keeppH in range• Raise organic matter to improve bufferingcapacity
Soil pH High • Stop adding lime or wood ash• Add elemental sulfur per soil testrecommendations
• Test soil annually• Use higher % ammonium or urea
ExtractablePhosphorus Low
• Add P amendments per soil testrecommendations• Use cover crops to recycle fixed P• Adjust pH to 6.2-6.5 to free up fixed P
• Promote mycorrhizal populations• Maintain a pH of 6.2-6.5• Use cover crops to recycle fixed P
ExtractablePhosphorus High
• Stop adding manure and compost• Choose low or no-P fertilizer blend• Apply only 20 lbs/ac starter P if needed• Apply P at or below crop removal rates
• Use cover crops that accumulate P andexport to low P fields or offsite• Consider low P rations for livestock• Consider phytase for non-ruminants
ExtractablePotassium Low
• Add wood ash, fertilizer, manure, orcompost per soil test recommendations• Use cover crops to recycle K• Choose a high K fertilizer blend
• Use cover crops to recycle K• Add "maintenance" K per soilrecommendations each year to keep Kconsistently available
Minor Elements Low • Add chelated micros per soil testrecommendations• Use cover crops to recycle micronutrients• Do not exceed pH 6.5 for most crops
• Promote mycorrhizal populations• Improve organic matter• Decrease soil P (binds micros)
Minor Elements High • Raise pH to 6.2-6.5 (for all high microsexcept Molybdenum)• Do not use fertilizers with micronutrients
• Maintain a pH of 6.2-6.5• Monitor irrigation/improve drainage• Improve soil calcium levels
School of Integrative Plant Science, Soil and Crop Sciences Section, G01 Bradfield Hall, 306 Tower Road, Cornell University, Ithaca, NY 14853, email: [email protected]
College of Agriculture and Life Sciences, Cornell University
Developed in partnership with Cornell Soil Health, Farmier, and GreenStart. Hosted by Farmier
ABOVE. Example of management suggestions for Chemical constraints. Constrained and suboptimal indicators, if any, would be flagged in red and orange in the report management table. Black text throughout this example indicates that there are no high-priority constraints for Chemical indicators.

Comprehensive Assessment of Soil Health - The Cornell Framework 121
Appendix B. Soil Health Management Planning Process Worksheet
Appendix B
Soil Health Management Process Worksheet

122 Comprehensive Assessment of Soil Health - The Cornell Framework
Appendix B. Soil Health Management Planning Process Worksheet
Soil Health Management Planning Process Worksheet
1. Determine farm background and management history Compile background info: history by management unit, farm operation type, equipment, access to resources, situational opportunities or limitations.
2. Set goals and sample for soil health Determine goals and number and distribution of soil health samples needed, according to operation’s background and goals.
3. For each management unit: identify and explain constraints, prioritizeSoil Health Assessment Report identifies constraints and guides prioritization. Explain results based on background where feasible, and adjust priorities.
4. Identify feasible management optionsUsing the management suggestions table available as part of Soil Health Report, or online with NRCS practice linkages, identify which of these suggestions may be feasible for the operation.
5. Create short and long term Soil Health Management PlanIntegrate agronomic science of Steps 2. – 4. above with grower realities of Step 1. to create a specific short-term schedule of management practices for each management unit and an overall long-term strategy (see worksheet next page)
6. Implement, monitor, and adapt Implement and document management practices. Monitor progress, repeat testing, and evaluate outcomes. Adapt plan based on experience and data over time. Remember that soil health changes slowly over time.

Comprehensive Assessment of Soil Health - The Cornell Framework 123
Appendix B. Soil Health Management Planning Process Worksheet
Step 5. Create short and long term Soil Health Management PlanDate Operation implemented Constraint addressed Notes
EXAMPLE: April 2016
Subsoil with yeoman’s plow
Subsoil compaction Choose appropriate soil moisture conditions
Long Term Directions to Pursue: