Embed Size (px)
Citation preview
For the Fiscal Year Ended June 30, 2014
4 Vaoeo’tt, Toecca
Comprehensive Annual
Financial Report
I• •
2”

CITY OF DAVENPORT, IOWA
COMPREHENSIVE ANNUAL FINANCIAL
REPORT
FOR THE FISCAL YEAR ENDED JUNE 30, 2014
Prepared by:
Finance Department
Accounting Division
Front Cover: Designed by Helen Boyd, Engineering Division

INTRODUCTORY SECTION

iiiiviiiixx
1 3
14 16
18
21
22
25 26
29
30
33 34 38 39
66 68 69
72
74 78
80 82 88
89
Combining Statement of Revenue, Expenses and Changes in
Combining Statement of Cash Flows - Non-Major Enterprise Funds Combining Statement of Net Position - Internal Service Funds Combining Statement of Revenue, Expenses, and Changes in Fund Net Position - Internal Service Funds
Schedule of Revenues, Expenditures, and Changes in Fund Balances- Budget and Actual - Governmental and Proprietary Funds Notes to Required Supplementary Information - Budgetary Reporting
Combining Statement of Revenue, Expenditures, and Changes in Fund Balances - Non-Major Governmental Funds Combining Statement of Net Position - Non-Major Enterprise Funds
Fund Net Position - Non-Major Enterprise Funds
Statement of Cash Flows - Proprietary Funds
Statement of Net Position - Proprietary Funds Reconciliation of Enterprise Funds Net Position to the Statement of Net Position Statement of Revenue, Expenses, and Changes in Fund Net Position -
Statement of Fiduciary Net Position-Fiduciary Funds Notes to the Financial Statements
Combining and Individual Fund Statements and Schedules
Required Supplementary Information
Balance Sheet - Governmental Funds Reconciliation of the Governmental Funds Balance Sheet to the
Combining Balance Sheet - Non-Major Governmental Funds
Fund Balances-Governmental Funds Reconciliation of the Statement of Revenue, Expenditures and Change in Fund Balances of Governmental Funds to the Statement of Activities
Proprietary Funds Reconciliation of the Change in Net Position of Enterprise Funds to the Statement of Net Activities
Other Postemployment Benefit Plan
Statement of Net Position Statement of Revenues, Expenditures, and Changes in
Independent Auditor's ReportManagement's Discussion and Analysis
Basic Financial Statements
Government-wide Financial Statements Statement of Net Position Statement of Activities Fund Financial Statements
TABLE OF CONTENTS
INTRODUCTORY SECTION
Letter of TransmittalGFOA Certificate of Achievement
Table of Contents
Organizational ChartList of Elected and Appointed Officials
FINANCIAL SECTION
i

90 93 94
98 100 102 104 106 108 110 111 112 113 114 116 118 119 120 122 124 Capital Asset Statistics by Function
Demographic and Economic Statistics Principal Employers Full-time and Part-time Employees by Function Operating Indicators by Function
Ratios of General Bonded Debt Outstanding Direct and Overlapping Governmental Activities Debt Legal Debt Margin Information
Property Tax Levies and Collections
Combining Statement of Changes in Assets and Liabilities - All Agency Funds
Ratios of Outstanding Debt by Type
Changes in Fund Balances, Governmental Funds Assessed and Taxable Value of Taxable Property Direct and Overlapping Property Tax Rates
Net Position by Component Changes in Net Position Fund Balances, Governmental Funds
Principal Property Taxpayers
Schedule of Expenditures of Federal Awards
STATISTICAL SECTION
Combining Statement of Cash Flows -Internal Service Funds
FINANCIAL SECTION (continued)
ii

City of Davenport
226 West Fourth Street • Davenport, Iowa 52801Telephone: 563-326-7711 TDD: 563-326-6145
www.cityofdavenportiowc.com
December 12, 2014
Honorable Mayor and Members of the City Council and the citizens of Davenport, Iowa
State law requires that cities publish a complete set of financial statements presented in conformity withaccounting principles generally accepted in the United States of America (GAAP) and that their financial conditionand their transactions be examined annually by the Auditor of State or by a certified public accountant. Pursuant tothat requirement, we hereby issue the Comprehensive Annual Financial Report of the City of Davenport for thefiscal year ended June 30, 2014.
This report consists of management’s representations concerning the finances of the City. Consequently,management assumes full responsibility for the completeness and reliability of all of the information presented inthis report. To provide a reasonable basis for making these representations, management of the City has establisheda comprehensive internal control framework that is designed both to protect the government’s assets from loss, theft,or misuse and to compile sufficient reliable information for the preparation of the City’s financial statements inconformity with GAAP. Because the cost of inlernal controls should not outweigh their benefits, the City’scomprehensive framework of internal controls has been designed to provide reasonable rather than absoluteassurance that the financial statements will be free from material misstatement. As management, we assert that, tothe best of our knowledge and belief, this financial report is complete and reliable in all material respects.
The City’s financial statements have been audited by McGladrey LLP, a lirm of licensed certified publicaccountants. The goal of the independent audit was to provide reasonable assurance that the financial statements ofthe City for the fiscal year ended June 30. 2014 are free of material misstatement. The independent audit involvedexaniining, on a test basis, evidence supporting the amounts and disclosures in the financial statements; assessingthe accounting principles used and significant estimates made by management; and evaluating the overall financialstatement presentation. The independent auditor concluded, based upon the audit, that there was a reasonable basisfor rendering an unmodified opinion that the City’s financial statements for the fiscal year ended June 30, 2014 arefairly presented in conformity with GAAP. The independent auditor’s report is presented as the first component ofthe financial section of this report.
The independent audit of the financial statements of the City was part of a broader, federally mandated“Single Audit” designed to meet the special needs of federal grantor agencies. The standards governing Single Auditengagements require the independent auditor to report not only on the fair presentation of the financial statements,but also on the audited government’s internal controls and compliance with legal requirements, with specialemphasis on internal controls and legal requirements involving the administration of federal awards. The results ofthe City’s Single Audit for the fiscal year ended June 30. 2014 provided no instances of material weaknesses in theinternal control over compliance or significant violations of applicable laws, regulations, contracts and grants. Thesereports are available in the City’s separately issued Single Audit Report.
Generally accepted accounting principles require that management provide a narrative introduction,overview, and analysis to accompany the basic financial statements in the form of a Management’s Discussion andAnalysis (MD&A). This letter of transmittal is designed to complement MD&A and should be read in conjunctionwith it. The City’s MD&A can be found immediately following the report of the independent auditors.
Working Together To Serve You
iii

Profile of the City
The City of Davenport, the principal city of eastern Iowa and the county seat of Scott County, is located onthe Iowa bank of the Mississippi River approximately midway between the cities of Des Moines and Chicago. TheCity is the third largest city in Iowa. Davenport, named after Colonel George Davenport, was originally settled in1808, making it one of the oldest cities in the upper Midwest. Incorporated in 1836, Davenport continues as one ofthe four remaining special charter cities in Iowa. Davenport is the major city of the Quad-City Metropolitan Area,which includes three counties located in two states. The area includes Scott County, Iowa and Rock Island andHenry Counties in Illinois. The major communities, apart from Davenport, include the cities of Betiendorf, Iowa andRock Island, Moline and East Moline in Illinois. The Davenport-Rock Island-Moline Metropolitan Statistical Area(MSA) had an official 2010 population of 379,690. Davenport had an official 2010 population of 99,685.
The City operates under the Mayor-Council form of government. The mayor and ten council members areelected on a non-partisan basis every two years. Eight council members are elected by ward. The mayor and tworemaining council members are elected at-large. A professional cily administrator is appointed by the City Council.
The City provides a full range of services including police and fire protection; solid waste collection;construction and maintenance of streets, sewers and bridges; sewage collection and treatment; culture andrecreation; mass transporlation; planning and zoning; and general administrative services.
For financial reporting purposes, all funds, agencies, hoards, commissions, trusts, and authorities involvedin the provision of these services are included if the City is financially accountable. The GASB has set forth criteriato be considered in determining financial accountability. The City of Davenport does not include any componentunits within its reporting entity. See Note IA in the notes to the financial statemenLs for more specific informationon reporting entity.
The City maintains budgetary controls to ensure compliance with legal provisions embodied in the annualappropriated budget approved by the City Council in March each year for the fiscal year beginning the followingJuly I. The State of Iowa requires the passage of an annual budget of total City operating expenditures by majorprogram categories after public hearing. Activities of the General, Special Revenue, Debt Service, Capital Projects,Enterprise and Internal Service Funds are included in the annual appropriated budget. Project-length financial plansare also adopted for the Capital Projects Fund. The level of budgetary control (that is, the level at whichexpenditures cannot legally exceed the appropriated amount) is at the total program level. As a result of this programstructure used for the legally-adopted budget, legal compliance (total budget-to-actual appropriations) isdemonstrated in one schedule which combines all funds and is in the required supplementary information section ofthis report (GASB Statement 41). The City also maintains an encumbrance accounting system as one technique ofaccomplishing budgetary control. Encumbered amounts lapse at year end. However, encumbrances generally arereappropriated as part of the following year’s budget.
Factors Aftectinn Financial Condition
The information presented in the financial statements may be better understood when it is considered fromthe broader perspective of the specific environment within which the City operates.
Local Economy. Historically, the economic strength of the Quad-Cities has been dependent upon the manufacturingof farm and construction equipment. During the early 1980s, with multiple plant closings and layoffs,unemployment reached a high in Davenport of 12 percent. After reaching this peak in 1963, unemployment rateshave declined. This reduction in unemployment is attributed, in part, to the growth in the area of professional andnonprofessional services. The Davenport-Rock Island-Moline MSA 2014 unemployment rate (through nine months)was 64%b. The total number of jobs in the MSA has grown the past two years, and of the 199,500 persons in thelabor force in 2014, 186,732 were employed, which is indicative of the economic diversification that has occurred.Major employment in the area includes the health care, retail, meat packing and food processing, aluminum, andindustrial and agricultural equipment sectors in addition to government, education, and utilities. Employment levelsat the City’s largest employers remained remarkably stable during the economic downturn nationally following 9/Il
iv
and several are implementing plans to add jobs and make capital investment, including Deere & Company,KrafUOscar Mayer, Sears Manufacturing, and M. A. Ford Manufacturing.
Tax base composition is diverse, consisting of 55% residential, 39% commercial, 2% utility and 4%industrial properties. The tax base is not concentrated; the largest taxpayer accounts for 7.2% of total value and theremaining nine leading taxpayers account for just 5.4% of taxable value. More detailed information on permits andprincipal taxpayers can be found in the statistical section of this reporL
The River Renaissance on the Mississippi project was kicked off in August 2001, when the State of Iowaapproved a $20 million grant to the City as part of the $113 million. Completed in October 2008, River Renaissanceis a collection of major improvements and renovations downtown and on the riverfront, including: the Figge ArtMuseum, the New Ventures Center, the River Music Experience, the River Music Skybridge, the Adler TheatreStage Expansion and Downtown Parking. Scott County, Iowa assisted with a $5 million grant subsequent to aspecial referendum at which 73 percent of voters favored the bond issue. This has spurred additional investments toDowntown Davenport including One Renaissance Plaza, a $14 million, 90,000-square-foot, Class A office facility inthe downtown and approximately 250 loft apartments constructed in the old warehouse district. The $40 millionrenovation of the Hotel Blackhawk is complete and re-opened in December 2010. This facility is attached to theCity’s RiverCenter Conventinn Hall and provides 130 new hotel rooms and 30 luxury market-rate apartments andadded 130 jobs in downtown Davenport The same company, Restoration St. Louis, also restored the Forrest Blockbuilding, an 1885 Italianate style building, with 22 market-rate luxury apartments. The company recently completedrenovations to the historic Renwick building and developed 18 luxury apartments and 12,000 feet of street levelretail. In addition, two major corporations, AT&T (previously Cingular) and eServ, a Perot Systems Company havenew facilities in Davenport. AT&T is now occupying a 75,000 square foot facility, bringing 510 jobs with a tolalpayroll of $11 million. eServe has completed constructing a new building valued at $5.95 million providing 60 newpositions for a total of 235 jobs. Approximately 55 engineering jobs have been created with an average annual wageof $61 ,0(X) per year.
Budeet Challenees. Recent years’ budget processes have faced the many challenges presented by thecurrent local, state and national economies, including: state-shared revenue reductions; loss of investment incomedue to lower returns in the current markets; state-mandated increases in public safety pension costs; increasing costsof health care; and increasing costs of liability and property insurance.
The General Fund includes most of the City’s services including police, fire, parks and recreation, library,community and economic development, civil rights, administration and finance.
The City’s General Fund receives approximately 75% of its reventie from property taxes. The State ofIowa allows a maximum levy rate of $8.10 per thousand dollars of assessed value and $0.27 in an emergency levy.The City has been at the maximum levy rates since 1984 and 1986, respectively. Growth limitations are imposed onthe City’s property tax base by the state, including the residential property rollback, Despite other revenuechallenges imposed by the State, including the 1995 phase out of machinery and equipment property taxes and theexemption of gas and electric utilities, the City’s taxable property tax base has grown moderately, an average of16% annually over the last ten fiscal years. For the upcoming FY 2015. total assessed value increased by 1.3%,while taxable values decreased 1 .6% due to state legislation, described below.
In 2013, the Iowa Legislature passed Senate File 295, which included a number of components that will continue tochallenge the ability of Iowa municipalities to present balanced budgets. The largest components include a 10%rollback for all commercial properties and the creation of a new multi-residential property class with a rollback thatwill be equivalent to the residential rollback. The impact of SF 295 to the City of Davenport is estimated at $40niiilion through FY 2024.
Personnel costs represent one of the single largest categories of costs for the City. Employee benefits includefunding for health claims, which have increased an average of 5.58% over the last ten years. State-mandatedcontributions to the statewide fire and police pension system have continued to rise sharply through FY 2015. Thecontribution rate increased from 17% in FY 201010 19.9% in FY 2011 ($800,000 in added costs) to 24.76% in El’2012 ($1 million in added costs) to 26.12% inflt 2013 ($400,000 in added costs) to 30.l2% in El’ 2014 ($400,000
v

in added costs). In order to fully fund projected increases in the state-mandated MFPRSI system, the City Councilapproved a $0.96 increase in the trust & agency property tax levy in FY 2013. The levy increase also funds increasesin the City’s self-funded health insurance costs.
Future budgets will challenge the City to continue current services within the current revenue andexpenditure structure. It is important to note that the Stale does provide unlimited property tax levies for employeebenefits (trust and agency levy), debt service (debt service levy), and insurance/claims (tort liability levy), whereasthe general and emergency levies are limited as discussed above. The City also has the ability to collect a utilityfranchise fee on natural gas and has been successful in signing agreements to move the City’s gaming operation ontoland These non-property-tax revenues are two options that could help diversify revenues.
Lone-Term Financial Plannine. Maintenance and expansion of the City’s infrastructure (such as streets,curbs, sidewalks, sewers, bridges, and traffic signals) remain a major priority of the City. The City annually adopts asix-year Capital Improvement Program that provides a framework for the development and maintenance ofinfrastructure to meet current and future needs.
The major source of funds for the program is general obligation bonds, which are primarily financed froman unlimited debt service property tax levy and local sales tax receipts. The City attempts to leverage its programcommitment with available grants from the federal and state governments and private sector partnerships. Debtservice payments have been made with a combination of property taxes received from the debt service levy, localoption sales tax revenue, and enterprise fund fees dedicated to this purpose. The City Council increased the debtservice property tax levy to $2.05 in FY 2013, an increase from $1 .76/S I ,000 which had been the rate since 2007.
Highlights of the Capital Improvement Program which is scheduled to begin in fiscal year 2015 include:
• Sanitary sewer lining construction and repair $9.6 million• Forest Grove Paving $2 million• Street resurfacing, full depth patching and reconstruction $3.6 million• Veteran’s Memorial Parkway 174 to Utica Ridge $6.8 million (project total $17 million)• Fire truck $1.1 million• Police department classroont/audiiorium $0.Smillion
Awards and Acknowledgements
The Government Finance Officers Association of the United States and Canada (GFOA) awarded aCertificate of Achievement for Excellence in Financial Reporting to the City of Davenport, Iowa for itsComprehensive Annual Financial Report for the fiscal year ended June 30, 2013. This was the 3 l consecutive yearthat the City has received this prestigious award. In order to be awarded a Certificate of Achievement, agovernmental unit must publish an easily readable and efficiently organized Comprehensive Annual FinancialReport, whose contents conform to program standards. Such reports must satisfy both accounting principlesgenerally accepted in the United States of America and applicable legal requirements.
A Certificate of Achievement is valid for a period of one year only. We believe our current report continuesto conform to Certificate of Achievement Program requirements, and we are submitting it to GFOA to determine itseligibility for another certificate.
In addition, the City received the GFOA’s Distinguished Budget Presentation Award for the FY 2015budget document. This is the 20th consecutive year that the City has received this award. In order to qualify for theDistinguished Budget Presentation Award, the City’s budget document was judged to be proficient in severalcategories, including as a policy document, a financial plan, an operations guide, and a communication device.
The preparation of this report on a timely basis could not have been accomplished without the services ofthe entire staff of the Finance Department and the auditors. We would like to express our appreciation to all thosewho assisted and contributed to its preparation accordingly. We especially wish to thank Assistant Finance Director
vi

Linda Folland and the Accounting Division staff for all of their extra time and effort in the preparation of this report.We would also like to thank the Mayor and members of the Finance Committee and City Council for their directionand support in planning and overseeing the financial operations of the City.
Respectfully submitted,
inCity Administrator
Brandon WrightFinance Director
vii

Government Finance Officers Association
Certificate ofAchievementfor Excellence
in FinancialReporting
Presented to
City of Davenport
Iowa
For its Comprehensive AnnualFinancial Report
for the Fiscal Year Ended
June 30, 2013
Executive Director/CEO
viii

Davenport Residents
Mayor
Civil Rights
City Council
Boards and
Commisions
Davenport Public Library
Affirmative Action
City Clerk
Community Planning & Economic
Development
Fire Police Legal
Parks and Recreation
Finance Public Works
City Administration
CITY OF DAVENPORT
ORGANIZATIONAL CHARTJUNE 30, 2014
ix

TERMEXPIRATION
DATE OF ELECTED
OFFICIAL TITLE OFFICIAL OFFICIALS
Elected Officials
Mayor William E. Gluba 1/16Alderman at Large Gene Meeker 1/16Alderman at Large Jason Gordon 1/16Alderman First Ward Richard L. Dunn 1/16Alderman Second Ward Bill Edmond 1/16Alderman Third Ward William J. Boom 1/16Alderman Fourth Ward Raymond A. Ambrose 1/16Alderman Fifth Ward Morris D. Barnhill 1/16Alderman Sixth Ward Jeffrey W. Justin 1/16Alderman Seventh Ward Mike Matson 1/16Alderman Eighth Ward Kerri K. Tompkins 1/16
Administration
City Administrator Craig Malin
Departments
Civil Rights Judith MorrellCommunity Planning and Economic Development Bruce E. BergerFinance Brandon E. WrightFire Lynn Washburn-LivingstonHuman Resources Dawn M. ShermanInformation Technology Rob HenryLegal Thomas D. WarnerParks and Recreation Scott M. HockLibrary KennethWayne ThompsonPolice Francis R. DonchezPublic Works Michael F. Clarke
CITY OF DAVENPORT
CITY OFFICIALSJune 30, 2014
x

FINANCIAL SECTION

1
Independent Auditor's Report
To the Honorable Mayor and City Council City of Davenport, Iowa Davenport, Iowa Report on the Financial Statements
We have audited the accompanying financial statements of the governmental activities, the business-type activities, each major fund, and the aggregate remaining fund information of the City of Davenport, Iowa (the City), as of and for the year ended June 30, 2014, and the related notes to the financial statements, which collectively comprise the City’s basic financial statements as listed in the table of contents. Management’s Responsibility for the Financial Statements
Management is responsible for the preparation and fair presentation of these financial statements in accordance with accounting principles generally accepted in the United States of America; this includes the design, implementation, and maintenance of internal control relevant to the preparation and fair presentation of financial statements that are free from material misstatement, whether due to fraud or error. Auditor’s Responsibility
Our responsibility is to express opinions on these financial statements based on our audit. We conducted our audit in accordance with auditing standards generally accepted in the United States of America and the standards applicable to financial audits contained in Government Auditing Standards, issued by the Comptroller General of the United States. Those standards require that we plan and perform the audit to obtain reasonable assurance about whether the financial statements are free from material misstatement. An audit involves performing procedures to obtain audit evidence about the amounts and disclosures in the financial statements. The procedures selected depend on the auditor’s judgment, including the
assessment of the risks of material misstatement of the financial statements, whether due to fraud or error. In making those risk assessments, the auditor considers internal control relevant to the entity’s
preparation and fair presentation of the financial statements in order to design audit procedures that are appropriate in the circumstances, but not for the purpose of expressing an opinion on the effectiveness of the entity’s internal control. Accordingly, we express no such opinion. An audit also includes evaluating the appropriateness of accounting policies used and the reasonableness of significant accounting estimates made by management, as well as evaluating the overall presentation of the financial statements. We believe that the audit evidence we have obtained is sufficient and appropriate to provide a basis for our audit opinions. Opinions
In our opinion, the financial statements referred to above present fairly, in all material respects, the respective financial position of the governmental activities, the business-type activities, each major fund, and the aggregate remaining fund information of the City, as of June 30, 2014, and the respective changes in financial position and, where applicable, cash flows thereof for the year then ended in accordance with accounting principles generally accepted in the United States of America.

2
Other Matters
Required Supplementary Information
Accounting principles generally accepted in the United States of America require that the Management’s
Discussion and Analysis on pages 3 through 13, Schedule of Revenues, Expenditures and Changes in Fund Balances – Budget to Actual – Government and Proprietary Funds, and Other Postemployment Benefit Plan – on pages 66 through 69 be presented to supplement the basic financial statements. Such information, although not a part of the basic financial statements, is required by the Governmental Accounting Standards Board who considers it to be an essential part of financial reporting for placing the basic financial statements in an appropriate operational, economic or historical context. We have applied certain limited procedures to the required supplementary information in accordance with auditing standards generally accepted in the United States of America, which consisted of inquiries of management about the methods of preparing the information and comparing the information for consistency with management’s responses to our inquiries, the basic financial statements, and other
knowledge we obtained during our audit of the basic financial statements. We do not express an opinion or provide any assurance on the information because the limited procedures do not provide us with sufficient evidence to express an opinion or provide any assurance. Other Information
Our audit was conducted for the purpose of forming opinions on the financial statements that collectively comprise the City’s basic financial statements. The combining and individual nonmajor fund financial statements and other schedules, listed in the table of contents as supplementary information are presented for purposes of additional analysis and are not a required part of the basic financial statements. Such information is the responsibility of management and was derived from and relates directly to the underlying accounting and other records used to prepare the basic financial statements. Such information has been subjected to the auditing procedures applied in the audit of the basic financial statements and certain additional procedures, including comparing and reconciling such information directly to the underlying accounting and other records used to prepare the basic financial statements or to the basic financial statements themselves, and other additional procedures in accordance with auditing standards generally accepted in the United States of America. In our opinion, the information is fairly stated, in all material respects, in relation to the basic financial statements as a whole. The accompanying introductory and statistical sections, as listed in the table of contents, are presented for purposes of additional analysis and are not a required part of the basic financial statements. Such information has not been subjected to the auditing procedures applied in the audit of the basic financial statements, and accordingly, we do not express an opinion or provide any assurance on them. Other Reporting Required by Government Auditing Standards
In accordance with Government Auditing Standards, we have also issued our report dated December 11, 2014 on our consideration of the City's internal control over financial reporting and on our tests of its compliance with certain provisions of laws, regulations, contracts, and grant agreements and other matters. The purpose of that report is to describe the scope of our testing of internal control over financial reporting and compliance and the results of that testing, and not to provide an opinion on internal control over financial reporting or on compliance. That report is an integral part of an audit performed in accordance with Government Auditing Standards in considering City’s internal control over financial
reporting and compliance.
Davenport, Iowa December 11, 2014

Management’s Discussion and Analysis
As management of the City of Davenport, we offer readers of the City’s financial statements this narrative overview
and analysis of the financial activities of the City for the fiscal year ended June 30, 2014. We encourage readers to
consider the information presented here in conjunction with additional information that we have furnished in our
letter of transmittal, which can be found on pages iii through vii of this report. All amounts, unless otherwise
indicated, are expressed in thousands of dollars.
Financial Highlights
Overall, the City continues to maintain a strong financial position, in spite of economic pressures and State of Iowa
mandates and cutbacks in shared revenues.
The assets of the City of Davenport exceeded its liabilities at June 30, 2014 by $302,034 (net position).
Current assets exceeded current liabilities by $70,127.
The government’s total net position increased by $15,696 during fiscal year (FY) 2014.
At June 30, 2014, unassigned fund balance for the General Fund was $8,537, or 12.8 percent of total
General Fund expenditures, while total fund balance represents 23.0 percent of total expenditures.
The above financial highlights are explained in more detail in the Government-wide Financial Analysis and
Financial Analysis of the City’s Funds sections of this document.
Overview of the Financial Statements
This discussion and analysis is intended to serve as an introduction to the City of Davenport’s basic financial
statements. The City of Davenport’s basic financial statements comprise three components: 1) government-wide
financial statements, 2) fund financial statements, and 3) notes to the financial statements. This report also contains
other supplementary information in addition to the basic financial statements themselves.
Government-wide financial statements. The two government-wide financial statements are designed to provide
readers with a broad overview of the City of Davenport’s finances, in a manner similar to a private-sector business.
The statement of net position presents information on all of the City of Davenport’s assets, deferred outflows of
resources, liabilities and deferred inflows of resources, with the difference between them reported as net position.
Over time, increases or decreases in net position may serve as a useful indicator of whether the financial position of
the City of Davenport is improving or deteriorating.
The statement of activities presents information showing how the government’s net position changed during FY
2014. All changes in net position are reported as soon as the underlying event giving rise to the change occurs,
regardless of the timing of related cash flows. Thus, revenues and expenses are reported in this statement for some
items that will only result in cash flows in future fiscal periods (e.g., uncollected taxes and earned but unused
vacation leave).
Both of the government-wide financial statements distinguish functions of the City of Davenport that are principally
supported by property taxes, other local taxes and state and federal grants (governmental activities) from other
functions that are intended to recover all or a significant portion of their costs through user fees and charges
(business-type activities). The governmental activities of the City of Davenport include public safety, public works,
culture and recreation, community and economic development, and general government. The business-type
activities of the City of Davenport include parking, sewer operations, RiverCenter (convention center), public
transit, public housing, golf courses, airport, solid waste collection, clean water utility, and River’s Edge (indoor
recreational facility).
The government-wide financial statements include only the City of Davenport itself (known as the primary
government).
The government-wide financial statements can be found on pages 14 through 17 of this report.
3

Fund financial statements. A fund is a grouping of related accounts that is used to maintain control over resources
that have been segregated for specific activities or objectives. The City of Davenport, like other state and local
governments, uses fund accounting to ensure and demonstrate compliance with finance-related legal requirements,
including restrictions on the use of certain monies. All of the funds of the City of Davenport can be divided into
three categories: governmental funds, proprietary funds, and fiduciary funds.
Governmental funds. Governmental funds are used to account for essentially the same functions reported as
governmental activities in the government-wide financial statements. However, unlike the government-wide
financial statements, governmental fund financial statements focus on near-term inflows and outflows of spendable
resources, as well as on balances of spendable resources available at the end of the year. Such information may be
useful in evaluating a government’s near-term financial requirements.
Because the focus of governmental funds is narrower than that of the government-wide financial statements, it is
useful to compare the information presented for governmental funds with similar information presented for
governmental activities in the government-wide financial statements. By doing so, readers may better understand
the long-term impact of the City’s near-term financing decisions. Both the governmental fund balance sheet and the
governmental fund statement of revenues, expenditures, and changes in fund balances provide a reconciliation to
facilitate this comparison between governmental funds and governmental activities.
The City of Davenport maintains 15 individual governmental funds. In the basic financial statements, information is
presented separately in the governmental fund balance sheet and in the governmental fund statement of revenues,
expenditures, and changes in fund balances(deficits) for the General Fund, General Debt Service Fund, Local Option
Sales Tax Fund, and Capital Projects Fund, all of which are considered to be major funds. Data from the other
eleven governmental funds are combined into a single, aggregated presentation. Individual fund data for each of
these nonmajor governmental funds is provided in the form of combining statements elsewhere in this report
(supplemental information).
The City of Davenport adopts an annual appropriated budget, prepared on a modified accrual basis. A budgetary
comparison statement has been provided to demonstrate legal compliance in the required supplementary information
section.
The basic governmental fund financial statements can be found on pages 18 through 25 of this report.
Proprietary funds. The City of Davenport maintains two different types of proprietary funds. Enterprise funds are
used to report the same functions presented as business-type activities in the government-wide financial statements.
Internal service funds are an accounting device used to accumulate and allocate costs internally among the City of
Davenport’s various functions. The City of Davenport uses internal service funds to account for employee health
insurance, risk management, and information management services. Because these services predominantly benefit
governmental rather than business-type functions, they have been included within governmental activities in the
government-wide financial statements.
The City of Davenport maintains ten enterprise funds. Proprietary funds provide the same type of information as the
government-wide financial statements, only in more detail. In the basic financial statements, the proprietary fund
financial statements provide separate information for the parking system, sewer operations, RiverCenter, and clean
water as these are considered to be major funds of the City of Davenport. Data from the other six enterprise funds
are combined into a single, aggregated presentation. Individual fund data for each of these nonmajor enterprise
funds is provided in the form of combining statements elsewhere in this report (supplemental information). The
three internal service funds are combined into a single, aggregated presentation in the proprietary fund financial
statements. Individual fund data for the internal service funds is provided in the form of combining statements
elsewhere in this report (supplemental information).
The basic proprietary fund financial statements can be found on pages 26 through 37 of this report.
Fiduciary funds. Fiduciary funds are used to account for resources held for the benefit of parties outside the City.
Fiduciary funds are not reflected in the government-wide financial statement because the resources of those funds
are not available to support the City of Davenport’s own programs. The accounting used for fiduciary funds is much
like that used for proprietary funds. The City has three agency funds. The basic agency fund financial statements
can be found on page 38 of this report.
4

Notes to the financial statements. The notes provide additional information that is essential to a full understanding
of the data provided in the government-wide and fund financial statements. The notes to the financial statements
can be found on pages 39 through 65 of this report.
Supplementary information. The combining statements referred to earlier in connection with nonmajor
governmental funds, nonmajor enterprise funds, internal services funds, and agency funds are presented immediately
following the notes to the financial statements. Combining and individual fund statements and schedules can be
found on pages 71 through 93 of this report.
Government-wide Financial Analysis
As noted earlier, net position may serve over time as a useful indicator of a government’s financial position.
Comparative data from fiscal year 2013 and 2014 are presented below. In Davenport, assets exceeded liabilities and
deferred inflows of resources by $302,034, an increase of 5.5%, at the close of the fiscal year ended June 30, 2014.
City of Davenport’s Net Position
Governmental
Activities
Business-type
activities Total
2014 2013 2014 2013 2014 2013
Current and other
assets $ 162,309 $ 151,366 $ 31,882 $ 25,844 $ 194,191 $ 177,210
Capital assets 269,943 274,522 175,902 169,322 445,845 443,844
Total assets 432,252 425,888 207,784 195,166 640,036 621,054
Noncurrent
liabilities
outstanding 150,420 157,274 61,384 52,320 211,804 209,594
Other liabilities 45,354 45,294 7,827 6,785 53,181 52,079
Total liabilities 195,774 202,568 69,211 59,105 264,985 261,673
Deferred inflows of
resources 69,303 69,279 3,713 3,765 73,016 73,044
Net position:
Net investment in
capital assets 145,746 140,160 124,953 124,902 270,699 265,062
Restricted 29,555 32,607 4,610 4,904 34,165 37,511
Unrestricted(deficit) (8,126) (18,726) 5,296 2,491 (2,830) (16,235)
Total net position $ 167,175 $ 154,041 $ 134,859 $ 132,297 $ 302,034 $ 286,338
By far the largest portion of the City of Davenport’s net position (90 percent) reflects its investment in capital assets
(e.g., land, buildings, infrastructure, machinery, and equipment), less any related debt used to acquire those assets
that is still outstanding. The City of Davenport uses these capital assets to provide services to citizens;
consequently, these assets are not available for future spending. Although the City of Davenport’s investment in its
capital assets is reported net of related debt, it should be noted that the resources needed to repay this debt must be
provided from other sources, since the capital assets themselves cannot be used to liquidate these liabilities.
An additional portion of the City of Davenport’s net position (11 percent) represents resources that are subject to
external restrictions on how they may be used. Current assets exceed current liabilities in all three categories, both
for the City as a whole, as well as for its separate governmental and business-type activities, in the amounts of
$70,127, $66,987 and $3,140, respectively.
In the governmental activities, the $4,579 decrease in capital assets is due to results of a capital asset inventory
performed on a rotating schedule and expensing items previously in construction in progress that we thought would
be capitalized.
5

City of Davenport’s Changes in Net Position
Governmental
Activities
Business-type
Activities Total
2014 2013 2014 2013 2014 2013
Revenues:
Program revenues:
Charges for services $ 12,467 $ 13,116 $ 31,475 $ 30,060 $ 43,942 $ 43,176
Operating grants and
contributions 19,667 16,301 3,378 1,726 23,045 18,027
Capital grants and
contributions 8,410 5,828 3,038 311 11,448 6,139
General revenues:
Property taxes 69,609 68,023 3,647 3,580 73,256 71,603
Other taxes 21,057 20,459 - - 21,057 20,459
Other 1,246 2,706 1,225 2,735 2,471 5,441
Total revenues 132,456 126,433 42,763 38,412 175,219 164,845
Expenses:
Public safety 42,650 40,632 - - 42,650 40,632
Public works 26,440 25,909 - - 26,440 25,909
Culture and recreation 13,286 11,671 - - 13,286 11,671
Community and economic
development 18,877 13,491 - - 18,877 13,491
General government 10,261 10,870 - - 10,261 10,870
Interest on long-term debt 6,101 6,866 - - 6,101 6,866
Parking system - - 1,936 1,947 1,936 1,947
Sewer operations - - 17,700 17,751 17,700 17,751
RiverCenter - - 3,032 2,684 3,032 2,684
Public transit - - 6,509 6,223 6,509 6,223
Public housing - - 1,315 1,202 1,315 1,202
Golf courses - - 1,792 1,844 1,792 1,844
Airport - - 612 785 612 785
Curbside recycling - - 5,389 5,187 5,389 5,187
Clean water - - 2,817 2,807 2,817 2,807
Rivers Edge - - 806 747 806 747
Total expenses 117,615 109,439 41,908 41,177 159,523 150,616
Increase/(decrease) in net
position before transfers 14,841 16,994 855 (2,765) 15,696 14,229
Transfers (1,707) (502) 1,707 502 - -
Increase/(decrease) in net position 13,134 16,492 2,562 (2,263) 15,696 14,229
Net position-beginning,as restated 154,041 137,549 132,297 134,560 286,338 272,109
Net position-ending $ 167,175 $ 154,041 $ 134,859 $ 132,297 $ 302,034 $ 286,338
Governmental activities. Governmental activities increased the City’s net position by $14,841, before transfers.
This is an increase of $2,153 from 2013, due in part to the grant related activity described below.
Certain revenues are generated that are specific to governmental program activities. These totaled $40,544. The
graph below shows a comparison between the expenditures by governmental activity type and the revenues
generated that are specific to those activities. There was an increase in both operating grants and contributions and
capital grants and contributions. The operating grant revenue increased in the HUD Section 8 fund by $275. The
city received $2,359 of a supplemental Community Development Block Grant passed thru the State of Iowa to
rehabilitate a building that was previously home to a tire company and has been renovated into 37 units of mixed
6

income rental housing. Capital grants and contributions increased $2,040 due to the progress of the Transload
Facility project that is partially funded by the U.S. Department of Commerce and the Iowa Department of
Transportaiton.
The graph below shows the percentage of the total governmental revenues allocated by each revenue type.
Total governmental activities’ revenues for FY 2014 were $132,456, an increase of $6,023 from FY 2013. This is
primarily due to the increase in operating and capital grants in FY 2014 as described above. The largest single
revenue source was property taxes of $69,609, which increased by $1,586 (2.3 percent) during FY 2014. This
increase resulted from an increase in the tax base of 1.7 percent.
7

Business-type activities. Business-type activities increased City of Davenport’s net position by $855. This is
primarily due to the increased Transit Grants received as a result of carry over Federal Transit amounts that were
due to expire of $761.
Total business-type activities revenue for the fiscal year was $42,763.
The graph below shows a comparison between the business-type activity expenditures and program revenues.
The graph below shows the breakdown of revenues by source for the business-type activities
8
Financial Analysis of the City’s Funds
As noted earlier, the City of Davenport uses fund accounting to ensure and demonstrate compliance with finance-
related legal requirements.
Governmental funds. The focus of the City of Davenport’s governmental funds is to provide information on near-
term inflow, outflows, and balances of spendable resources. Such information is useful in assessing the City of
Davenport’s financing requirements. In particular, unassigned fund balance may serve as a useful measure of a
government’s net resources available for spending at the end of the fiscal year.
As of the end of the current fiscal year 2014, the City of Davenport’s governmental funds reported combined ending
fund balances of $53,697, an increase of $6,891 in comparison with the prior year. The increase is attributable to an
increase in the Capital Project Fund and the Local Option Sales Tax Fund of $8,506 and $2,142, respectively, due to
the timing of progress on projects. There was a $6,312 decrease in the General Debt Service Fund, due to the timing
of a crossover refunding. Without the crossover refunding, the General Debt Service fund balance would have
increased $2,088. There was an increase of $1,703 in the general fund due to planned fund balance growth.
Approximately 16.0 percent of this total amount, $8,193, constitutes unassigned fund balance, which is available for
spending at the City’s discretion. The remainder of fund balance is nonspendable (represents prepaid amounts) $11;
restricted by grantors and other legal restrictions $43,530; committed by the City Council for revolving loans and
the levee improvement commission $1,184; and assigned by the Finance Director for future projects $779.
The General Fund is the chief operating fund of the City of Davenport. The General Fund includes many of the
City’s services including police, fire, parks and recreation, library, community and economic development, civil
rights, administration, and finance. The General Fund group as reported combines a number of individual funds
each with a specific purpose. These include the General Fund, the City’s primary operating fund; the Trust and
Agency Fund, which accounts for employee benefits; Hotel/Motel Tax Fund; the Library Special Levy Fund, used to
enhance library services; Parks Special Needs Funds, and the Flood Fund. At the end of the current fiscal year 2014,
unassigned fund balance of the General Fund was $8,537, while total fund balance was $15,321. As a measure of
the General Fund’s liquidity, it may be useful to compare both unassigned fund balance and total fund balance to
total fund expenditures. Unassigned fund balance represents 12.8 percent of total General Fund expenditures, 19.2
percent General Fund expenditures excluding the specific purpose funds, while total fund balance represents 23.0
percent of the total expenditures.
The total fund balance of the City of Davenport’s General Fund increased by $1,703 during the current fiscal year
and the unassigned fund balance increased by $953. The State of Iowa allows a maximum property tax levy rate of
$8.10 per thousand dollars of assessed value and $0.27 in an emergency levy for general activities. The City has
been at the maximum levy rates since 1984 and 1986, respectively. In addition to these two levies, the State allows
unlimited levies for employee benefits (trust and agency levy) and insurance/claims (tort liability levy), which are
also accounted for in the City’s General Fund. Property tax balances from these two levies are reserved at the end of
each year because their use is restricted.
The General Fund balances discussed above are considered adequate by management. The City’s policy on fund
balance of the General Fund, excluding the other specific-use funds, was recently revised to have unassigned fund
balance maintained at 15 to 20 percent of operating requirements. The current fund balance is within policy
guidelines. Fund balances at June 30 cover the City’s cash flow needs prior to the collection of property taxes (in
September and March each year) so that cash flow borrowings are unnecessary. Fund balances also provide
flexibility (for example, should revenue projections fall short) and can be used in cases of emergency (for example,
flooding or storm clean-up).
The General Debt Service Fund has a total fund balance of $13,385, all of which is reserved for the retirement of
debt. The State of Iowa allows an unlimited property tax levy for debt service. The net decrease in fund balance
during the current year in the General Debt Service Fund was $6,312 as explained above. The city prepares a rolling
six-year capital improvement program. This will allow for a stable levy over the six years of the current program.
The Local Option Sales Tax Fund accounts for the proceeds of a local option sales tax and has a fund balance of
$4,466. The State of Iowa provides for a one-cent local option sales tax. Davenport voters approved the tax in 1988
and the referendum directs its usage to 60 percent for property tax relief (debt service levy) and 40 percent for
capital improvements. A transfer of 60 percent of tax proceeds is made to the General Debt Service Fund and the
9
remainder is transferred to the Capital Projects Fund as expenditures occur. The net increase in fund balance during
the current year was $2,142, due to the completion of capital projects.
The Capital Projects Fund has a fund balance of $15,164, due to unspent bond proceeds. The net increase in fund
balance during the current year in the Capital Projects Fund was $8,506.
Proprietary funds. The City of Davenport proprietary funds provide the same type of information found in the
government-wide financial statements, but in more detail.
Legal Compliance Budgetary Highlights
As explained in the Letter of Transmittal, budgetary legal compliance is demonstrated in one schedule summarizing
all funds in the Required Supplementary Information section of this report on pages 68 and 69.
Differences between the original budget and the final amended budget can be summarized as follows:
The total original revenue budget of $250,435 was increased to $318,835, an increase of $68,400. In the
intergovernmental category, federal, state and local grants were carried forward in the budget amendment
to reflect on-going construction in progress of capital projects in the amount of $37,837. There were
special revenue grant rollovers and new grants amounting to $7,603 and $18,560 budgeted for a bond
refunding.
The total original expenditure budget of $207,179 was increased to $286,248, an increase of $79,069. In
the community and economic development category, $7,603 was carried forward for on-going grants and
budgeted for new grants. In the capital outlay category, $49,240 was carried forward in the budget
amendment to reflect on-going construction in progress of capital projects. In the debt service category an
additional $18,560 was budgeted to reflect three refunding issues.
Differences between the final amended budget and actual results of operations can be summarized as follows:
In the intergovernmental revenue category, federal, state, and local grants in the amount of $38,373 were
not accrued or received due to construction projects not completed and special revenue grants not yet spent.
In the other revenue category, there was $6,957 of transfers not made, due to the not completed status of
some capital projects.
In the community and economic development expenditure category, $5,795 was not spent in special
revenue funds and will be carried forward. In the capital outlay category, $69,954 of expenditures were
budgeted and not spent, due to construction projects not completed. In the business type category, $4,285
of the difference is due to bond principal payments being budgeted as an expense, but reported as
adjustments to the liability.
General Fund Budgetary Highlights
As discussed above and in the Letter of Transmittal, the General Fund budget and actual revenues, expenditures and
changes in fund balance have been incorporated into the statement of all funds on pages 66 and 67 of this report.
Highlights for the General Fund follow.
Differences between the original budget and the final amended budget for the General Fund can be summarized as
follows:
The total original revenue budget of $67,483 was increased to $68,656, an increase of $1,173. In the
intergovernmental revenue category, federal grants in the amount of $244, and state grants in the amount of
$76, subsequent to original budget adoption are included as both revenues and expenditures.
The total original expenditure budget of $67,762 was increased to $69,236, an increase of $1,474. Police
forfeiture and seizure monies of $686 held as reserved General Fund balance at June 30, 2013 were
included in amendments in order to authorize the expenditure during FY 2014. Public works expenditures
were increased in amendments by $95 as a result of the carry forward of the monies collected from
developers and reserved for reforestation. Public works budget also increased for flood related expenses by
$49. Culture and recreation expenditures were amended to include grants carried forward of $356 and new
grants received as noted under the revenue discussion.
10

Differences between the final amended budget and actual results of operations of the General Fund can be
summarized as follows:
The net change in the General Fund balance in FY 2014 was $1,703, a positive variance from the budgeted
change ($952) of $751.
Revenue items that came in under budget included gaming taxes from the casino and the cable television
franchise tax.
All expenditure categories came in under budget.
A special library property tax levy ($.27/$1,000 assessed value) was approved by voters to support
operations of two new branch libraries. Unexpended taxes of $873 were a part of the favorable variance
and a reservation of General Fund balance at June 30, 2014.
Capital Asset and Debt Administration
Capital assets. The City of Davenport’s investment in capital assets for its governmental and business-type
activities as of June 30, 2014, amounts to $445,845 (net of accumulated depreciation). This investment in capital
assets includes land, buildings, improvements, equipment and vehicles, sanitary sewers, bridges, traffic signals,
storm sewers, and streets and roads. The City of Davenport’s investment in capital assets almost stayed identical to
last year. Business type activities accounted for the entire net increase. At June 30, 2014, and June 30, 2013 the
depreciable capital assets of the City were 43% and 44%. This indicates that the City is replacing its assets as they
are depreciating.
Major capital asset activities during fiscal year 2014 include the following:
Governmental activities
Street and road work completed by the City of $10,220 including $1,041 of full-depth patching, $4,181 of
Veteran’s Memorial Parkway extension, $3,230 East River Drive resurfacing, and $1,038 Tremont Avenue
extension.
Ferris Wheel at Modern Woodmen Stadium $1,708
Business-type activities
Sanitary sewers built by City of Davenport $2,395
Storm sewers built by City of Davenport $220
Littig Area Detention Basin $877
Digital Radio System $704
Sewer TV Van $508
Additional information on the City of Davenport’s capital assets can be found in Note 6 in the notes to the financial
statements.
11

City of Davenport’s Capital Assets
Governmental activities Business-type activities Total
2014 2013 2014 2013 2014 2013
Land $ 20,003 $ 20,003 $ 11,250 $ 11,250 $ 31,253 $ 31,253
Buildings 105,711 106,172 97,334 96,925 203,045 203,097
Improvements
other than
buildings 28,255 28,145 13,788 13,788 42,043 41,933
Sanitary sewers - - 117,543 69,306 117,543 69,306
Equipment and
vehicles 41,403 38,749 34,030 34,161 75,433 72,910
Bridges 9,461 9,515 - - 9,461 9,515
Traffic signals 8,503 8,503 - - 8,503 8,503
Storm sewers - - 23,766 22,670 23,766 22,670
Paving 205,407 194,722 1,374 1,374 206,781 196,096
Seawalls 2,685 2,685 - - 2,685 2,685
Tunnels 54 54 - - 54 54
Construction in
progress 11,617 15,529 11,513 46,393 23,130 61,922
Accumulated
depreciation (163,155) (149,554) (134,697) (126,545) (297,852) (276,099)
Total $ 269,944 $ 274,523 $ 175,901 $ 169,322 $ 445,845 $ 443,845
Long-term debt. At the end of the current fiscal year, the City of Davenport had total bonded debt outstanding of
$200,100. Of this amount, $135,701 comprises debt being serviced from the general debt service fund from
property taxes and 60 percent of the local option sales tax proceeds. The remainder of the City of Davenport’s debt
represents bonds serviced by specified revenue sources, including the tax increment financing districts debt service
fund, the municipal improvement districts fund, the sewer operations enterprise fund, the public housing enterprise
fund, solid waste enterprise, clean water enterprise the parking system enterprise fund, and the airport enterprise
fund. The City has issued general obligation bonds backed by its full faith and credit, including the unlimited debt
service property tax levy, which are planned to be retired from the above revenue sources rather than revenue bonds
because legal debt capacity exists (see below) and the resulting lower interest costs benefit its citizens and service
users. Detailed information on bonded debt abatement by fund is contained in a summary on page 58 of this report.
City of Davenport's Outstanding Debt
General Obligation Bonds
Governmental activities Business-type activities Total
General obligation 2014 2013 2014 2013 2014 2013
Bonds $151,885 $161,460 $48,215 $43,605 $200,100 $205,065
The City of Davenport’s total debt decreased by $4,965 during the current fiscal year. New debt issuance of
$34,075 during the year was less than the debt retired of $39,040. There was a crossover refunding issues in FY
2014 and the City has investments in escrow accounts that will retire $11,785 of debt when it is callable in FY 2015.
The issuance was to finance the City’s capital improvement program including streets, buildings, and sanitary
sewers (abated by user fees), and tax increment financing projects (abated by tax increment financing revenue).
The City’s scheduled debt repayment is rapid, with 85 percent of outstanding bonded debt scheduled for repayment
in 10 years and 98 percent in 15 years. State Statutes limit the amount of general obligation debt a governmental
entity may issue to five percent of its total assessed valuation. The current debt limitation for the City of Davenport
is $307,269, which is significantly in excess of the City of Davenport’s outstanding general obligation debt,
$200,100, and other debt subject to the debt limitation of $5,487.
12

The City of Davenport maintains an AA- rating from Standard & Poor’s, and an Aa3 rating from Moody’s Investors
Service for general obligation debt. This reflects an upgrade by Standard & Poor’s from A. The upgrade by
Standard & Poor’s reflects an improvement of the city’s liquidity position and the removal of potential enterprise
risk in FY 2013. The downgrade by Moody’s reflects the limited reserves and liquidity across all city funds, as well
as their new local government obligation methodology.
Additional information on the City of Davenport’s long-term debt can be found in Note 9 in the notes to the
financial statements.
Economic Factors and Current and Future Budgets
The City’s General Fund receives approximately 75% of its revenue from property taxes. The State of Iowa allows
a maximum levy rate of $8.10 per thousand dollars of assessed value and $0.27 in an emergency levy. The City has
been at the maximum levy rates since 1984 and 1986, respectively. Growth limitations are imposed on the City’s
property tax base by the state, including the residential property rollback. Despite other revenue challenges imposed
by the State, including the 1995 phase out of machinery and equipment property taxes and the exemption of gas and
electric utilities, the City’s taxable property tax base has grown moderately, an average of 3.6% annually over the
last ten fiscal years. For FY 2014, taxable assessed valuations increased 1.7%. This was due to the addition of $112
million in residential property values and a decrease of $28 million in commercial and industrial values. This is
exclusive of changes in utility values. The residential rollback increased from 50.7518% to 52.8166%.
In 2013, the Iowa Legislature passed Senate File 295, which included a number of components that will continue to
challenge the ability of Iowa municipalities to present balanced budgets. The largest components include a 10%
rollback for all commercial properties and the creation of a new multi-residential property class with a rollback that
will be equivalent to the residential rollback. The impact of SF 295 to the City of Davenport is estimated at $40
million through FY 2024.
Personnel costs represent one of the single largest categories of costs for the City. Employee benefits include
funding for health claims, which have increased an average of 5.58% over the last ten years. State-mandated
contributions to the statewide fire and police pension system continue to rise sharply. The contribution rate increased
from 17% in FY 2010 to 19.9% in FY 2011 ($800,000 in added costs) to 24.76% in FY 2012 ($1 million in added
costs) to 26.12% in FY 2013 ($400,000 in added costs) to 30.12% in FY 2014 ($400,000 in added costs) to 30.41%
in FY 2015. In order to fully fund projected increases in the state-mandated MFPRSI system, the City Council
approved a $0.96 increase in the trust & agency property tax levy in FY 2013. The levy increase also funds increases
in the City’s self-funded health insurance costs, which on average increase 5% each year.
The City’s six bargaining groups and non-bargaining employees all went without a general wage increase in FY
2013 in order to reduce costs. General wage increases were 1% in FY 2014 and will be an effectual increase of
2.25% in FY 2015. To better manage costs, investments in labor-saving technology continue to be supported,
methods to reduce health care claims are ongoing, and intergovernmental partnerships are pursued where
practicable. Revenue sources continue to be diversified (resulting in the reallocation of personnel costs to other
funds) with incremental increases in the sewer fee, clean water fee, solid waste fee, and building permit fees to
provide for the services related to each of these functions.
For the future, plans to enable the City to continue to adopt balanced budgets include: continued evaluation of the
unlimited levies for employee benefits (Trust and Agency) and property and liability insurance and claims (Tort);
consideration of a natural gas franchise utility fee to further diversify revenue; and moving the city’s gaming
operation onto land. The City has a strong record of implementing expenditure reductions and introducing
efficiencies in order to balance General Fund budgets.
Requests for Information
This financial report is designed to provide a general overview of the City of Davenport’s finances for all those with
an interest in the City’s finances. Questions concerning any of the information provided in this report or requests for
additional financial information should be addressed to: Brandon Wright, Finance Director, City of Davenport, 226
West Fourth Street, Davenport, IA 52801.
13

GOVERNMENTAL
ACTIVITIES
BUSINESS-TYPE
ACTIVITIES TOTAL
ASSETS
Current assets:
Unrestricted current assets:
Cash and investments 20,157,197$ 1,412,718$ 21,569,915$
Delinquent property taxes receivable 1,180,373 63,204 1,243,577
Succeeding year property taxes receivable 68,937,239 3,605,618 72,542,857
Other taxes receivable 3,433,123 - 3,433,123
Special assessments 1,140,451 - 1,140,451
Accounts receivable 1,527,260 9,430,653 10,957,913
Accrued interest receivable 26,053 5,060 31,113
Internal balances 4,778,617 (4,778,617) -
Due from other governments 9,000,990 1,101,183 10,102,173
Inventory - 119,242 119,242
Prepaid items 331,560 7,693 339,253
Loans receivable - net 1,770,800 - 1,770,800
Total unrestricted current assets 112,283,663 10,966,754 123,250,417
Restricted current assets:
Cash and cash equivalents 58,827 - 58,827
Total current assets 112,342,490 10,966,754 123,309,244
Noncurrent assets:
Investment in joint venture - 434,151 434,151
Loans receivable - net 15,937,200 - 15,937,200
Restricted cash and cash equivalents 22,708,213 19,408,957 42,117,170
Restricted cash and investments - held in escrow 11,321,223 1,072,410 12,393,633
Capital assets:
Land 20,002,931 11,250,241 31,253,172
Buildings 105,710,810 97,333,863 203,044,673
Improvements other than buildings 28,254,710 13,788,021 42,042,731
Sanitary sewers - 117,542,619 117,542,619
Equipment and vehicles 41,403,457 34,029,798 75,433,255
Bridges 9,461,243 - 9,461,243
Traffic signals 8,502,673 - 8,502,673
Storm sewers - 23,766,442 23,766,442
Streets and roads 205,406,879 1,374,009 206,780,888
Seawalls 2,685,289 - 2,685,289
Tunnels 54,326 - 54,326
Construction in progress 11,616,606 11,513,039 23,129,645
Accumulated depreciation (163,155,630) (134,696,703) (297,852,333)
Total capital assets 269,943,294 175,901,329 445,844,623
Total noncurrent assets 319,909,930 196,816,847 516,726,777
Total assets 432,252,420$ 207,783,601$ 640,036,021$
CITY OF DAVENPORT
STATEMENT OF NET POSITION
June 30, 2014
14

GOVERNMENTAL
ACTIVITIES
BUSINESS-TYPE
ACTIVITIES TOTAL
LIABILITIES
Liabilities:
Current liabilities:
Accounts payable 7,741,822$ 798,047$ 8,539,869$
Contracts payable 848,839 - 848,839
Accrued wages payable 1,366,331 292,026 1,658,357
Accrued compensated absences 4,224,672 601,271 4,825,943
Claims and judgments 4,121,719 - 4,121,719
Due to other governments 529 - 529
Accrued interest payable 524,389 190,034 714,423
General obligation bonds payable 15,862,260 4,437,740 20,300,000
Unearned revenue - other 10,591,856 89,491 10,681,347
Capital Lease Payable - 91,025 91,025
Total 45,282,417 6,499,634 51,782,051
Current liabilities payable from restricted assets:
Accounts payable 58,827 - 58,827
Deposits payable - 813,669 813,669
Notes payable 13,440 514,000 527,440
Total current liabilities payable from restricted assets 72,267 1,327,669 1,399,936
Total current liabilities 45,354,684 7,827,303 53,181,987
Noncurrent liabilities:
Accrued compensated absences 553,288 78,746 632,034
Claims and judgments 3,195,783 - 3,195,783
Other postemployment benefits 4,628,642 1,023,559 5,652,201
Note payable 297,351 13,693,982 13,991,333
General obligation bonds payable 140,604,200 46,398,521 187,002,721
Special assessment with government commitment 1,140,451 - 1,140,451
Capital Lease Payable - 189,352 189,352
Total noncurrent liabilities 150,419,715 61,384,160 211,803,875
Total liabilities 195,774,399 69,211,463 264,985,862
DEFERRED INFLOWS OF RESOURCES
Succeeding year property tax 68,937,239 3,605,618 72,542,857
Deferred amount on refunding 328,875 107,108 435,983
Other deferred inflows of resources 36,998 - 36,998
Total deferred inflows of resources 69,303,112 3,712,726 73,015,838
NET POSITION
Net investment in capital assets 145,746,153 124,953,410 270,699,563
Restricted:
Employee benefits 2,719,630 - 2,719,630
Tort Liability 1,433,279 - 1,433,279
Local option sales tax 4,466,397 - 4,466,397
Library 873,040 - 873,040
Police seizure 973,492 - 973,492
Debt retirement 16,614,527 - 16,614,527
Road use tax 496,696 - 496,696
Community development act 146,664 - 146,664
Municipal improvement districts 478,048 - 478,048
Revolving loans 1,041,456 - 1,041,456
Section 8 169,222 - 169,222
Home investment partnership projects 5 - 5
Levee improvement commission projects 142,953 - 142,953
Equipment replacement - 4,610,003 4,610,003
Unrestricted (deficit) (8,126,653) 5,295,999 (2,830,654)
Total net position 167,174,909$ 134,859,412$ 302,034,321$
The notes to the financial statements are an integral part of this statement.
15

CHARGES FOR OPERATING CAPITAL
FUNCTIONS/PROGRAMS EXPENSES
SALES AND
SERVICES
GRANTS AND
CONTRIBUTIONS
GRANTS AND
CONTRIBUTIONS
Governmental activities:
Public safety 42,649,971$ 2,780,989$ 83,732$ 68,000$
Public works 26,439,948 4,089,579 10,612,749 8,332,393
Culture and recreation 13,285,572 593,369 603,762 9,567
Community and economic development 18,877,119 457,258 7,906,317 -
General government 10,261,218 4,546,069 459,838 -
Interest on long-term debt 6,101,313 - - -
Total governmental activities 117,615,141 12,467,264 19,666,398 8,409,960
Business-type activities:
Parking system 1,935,914 1,418,539 - (90,123)
Sewer operations 17,700,417 17,485,142 - 121,846
RiverCenter 3,031,575 1,823,924 - -
Public transit 6,508,558 533,804 2,758,015 859,106
Public housing 1,314,883 424,386 620,196 -
Golf courses 1,791,523 1,517,159 - -
Airport 611,884 187,444 - 1,895,900
Solid waste 5,388,789 5,349,669 - -
Clean water 2,817,230 2,497,339 - 251,204
River's Edge 806,140 237,388 - -
Total business-type activities 41,906,913 31,474,794 3,378,211 3,037,933
Total government 159,522,054$ 43,942,058$ 23,044,609$ 11,447,893$
General Revenues:
Taxes:
Gain on sale of capital assets
Miscellaneous
Net position, ending
The notes to the financial statements are an integral part of this statement.
Net position, beginning
Investment earnings
Local option sales tax
Transfers
Franchise taxes
Property taxes, levied for general purposes
Property taxes, levied for debt service
Property taxes, levied for public transit
Total general revenues and transfers
CITY OF DAVENPORT
STATEMENT OF ACTIVITIES
For the Fiscal Year Ended June 30, 2014
PROGRAM REVENUES
Change in net position
Hotel/motel tax
16

GOVERNMENTAL
ACTIVITIES
BUSINESS-TYPE
ACTIVITIES TOTAL
(39,717,250)$ -$ (39,717,250)$
(3,405,227) - (3,405,227)
(12,078,874) - (12,078,874)
(10,513,544) - (10,513,544)
(5,255,311) - (5,255,311)
(6,101,313) - (6,101,313)
(77,071,519) - (77,071,519)
- (607,498) (607,498)
- (93,429) (93,429)
- (1,207,651) (1,207,651)
- (2,357,633) (2,357,633)
- (270,301) (270,301)
- (274,364) (274,364)
- 1,471,460 1,471,460
- (39,120) (39,120)
- (68,687) (68,687)
- (568,752) (568,752)
- (4,015,975) (4,015,975)
(77,071,519) (4,015,975) (81,087,494)
61,120,041 - 61,120,041
8,489,044 - 8,489,044
- 3,646,576 3,646,576
15,840,748 - 15,840,748
2,277,032 - 2,277,032
2,938,969 - 2,938,969
1,176,460 618,220 1,794,680
17,355 61,731 79,086
52,581 545,287 597,868
(1,706,916) 1,706,916 -
90,205,314 6,578,730 96,784,044
13,133,795 2,562,755 15,696,550
154,041,114 132,296,657 286,337,771
167,174,909$ 134,859,412$ 302,034,321$
NET (EXPENSE) REVENUE AND CHANGES IN NET POSITION
17

CITY OF DAVENPORT
BALANCE SHEET
June 30, 2014
ASSETS
GENERAL
FUND
LOCAL
OPTION
SALES TAX
FUND
Cash and investments 10,516,041$ 1,680,011$
Receivables:
Property taxes:
Delinquent 960,927 -
Succeeding year 54,751,959 -
Other taxes 919,725 2,513,398
Accounts 666,939 21,267
Special assessments - 34,196
Loans - 2,417,847
Interest 4,158 -
Interfund receivable 4,886,446 -
Due from other governments 266,693 68,000
Prepaids 5,440 -
Restricted assets-cash and investments - -
Restricted investments - held in escrow - -
TOTAL ASSETS 72,978,328$ 6,734,719$
LIABILITIES
Wages payable 1,121,478$ 31,591$
Accounts payable 1,576,143 132,944
Contracts payable -
Payable from restricted assets - -
Interfund payable 4,969 2,070,551
Due to other governments - -
Unearned revenue - -
Note payable - -
Matured bonds payable - -
Matured interest payable - -
TOTAL LIABILITIES 2,702,590 2,235,086
DEFERRED INFLOWS OF RESOURCES
Unavailable revenue - succeeding year property tax 54,751,959 -
Unavailable revenue - intergovernmental and special assessments 203,264 33,236
TOTAL DEFERRED INFLOWS OF RESOURCES 54,955,223 33,236
FUND BALANCES
Nonspendable 5,440$ -$
Restricted 5,999,441 4,466,397
Committed - -
Assigned 778,856 -
Unassigned 8,536,778 -
TOTAL FUND BALANCES 15,320,515 4,466,397
TOTAL LIABILITIES, DEFERRED INFLOWS OF
RESOURCES AND FUND BALANCES 72,978,328$ 6,734,719$
The notes to the financial statements are an integral part of this statement.
GOVERNMENTAL FUNDS
18

GENERAL
DEBT SERVICE
FUND
CAPITAL
PROJECTS
FUND
TOTAL
NON-MAJOR
GOVERNMENTAL
FUNDS
TOTAL
GOVERNMENTAL
FUNDS
267,461$ 18,046,379$ 3,861,520$ 34,371,412$
146,095 - 73,351 1,180,373
8,418,523 - 5,766,757 68,937,239
- - - 3,433,123
152,995 646,662 20,562 1,508,425
1,106,255 - - 1,140,451
- - 15,290,153 17,708,000
13,461 - 3,351 20,970
1,508,038 1,395,506 - 7,789,990
- 6,946,623 1,719,674 9,000,990
- - 5,868 11,308
- - 58,827 58,827
11,321,223 - - 11,321,223
22,934,051$ 27,035,170$ 26,800,063$ 156,482,331$
-$ 5,066$ 170,868$ 1,329,003$
- 4,812,285 1,099,295 7,620,667
- 848,839 - 848,839
- - 58,827 58,827
- - 421,902 2,497,422
- - 529 529
- - 10,591,856 10,591,856
- 310,791 - 310,791
20,000 - - 20,000
3,381 - - 3,381
23,381 5,976,981 12,343,277 23,281,315
8,418,523 - 5,766,757 68,937,239
1,107,392 5,893,795 3,329,374 10,567,061
9,525,915 5,893,795 9,096,131 79,504,300
-$ -$ 5,868 11,308$
13,384,755 15,164,394 4,514,539 43,529,526
- - 1,184,409 1,184,409
- - - 778,856
- - (344,161) 8,192,617
13,384,755 15,164,394 5,360,655 53,696,716
22,934,051$ 27,035,170$ 26,800,063$ 156,482,331$
19

20

CITY OF DAVENPORT
RECONCILIATION OF THE GOVERNMENTAL FUNDS BALANCE SHEET
TO THE STATEMENT OF NET POSITION
JUNE 30, 2014
Total governmental fund balances 53,696,716$
Amounts reported for governmental activities in the statement ofnet position are different because:
Capital assets used in governmental activities are not financial resources and, 266,005,494 therefore, are not reported in the funds.
Assets are not available to pay for current-period expenditures are reported 10,530,063 as a deferred inflow of resources in governmental funds.
Internal service funds are used by management to charge the costs of certain servicesto individual funds. The assets and liabilities of the internal service funds are includedin governmental activities in the statement of net position. 5,039,006
Internal service funds activities allocated to business-type activities (513,951)
Long-term liabilities including bonds payable, are not due and payable in the current period and, therefore, are not reported in the funds.
Accrued employee benefits (4,644,153) Accrued interest payable (521,008) General Obligation bonds payable and special assessments (157,915,786) Other post employment benefits (4,501,472)
(167,582,419)
Net position of governmental activities 167,174,909$
The notes to the financial statements are an integral part of this statement.
21

GENERAL
FUND
LOCAL
OPTION
SALES TAX
FUND
GENERAL
DEBT
SERVICE
FUND
CAPITAL
PROJECTS
FUND
REVENUES:
Taxes 60,207,114$ 15,840,749$ 8,483,333$ -$
Special assessments - 7,473 40,580 48,192
Licenses and permits 1,679,731 - - -
Intergovernmental 1,159,513 68,000 - 6,093,323
Charges for services 3,951,785 99,834 - -
Use of monies and property 308,668 162,167 291,212 40,194
Fines and forfeits 1,931,967 - - -
Loan repayments - - - 86,240
Other 396,986 - 1,001,538 1,093,761
Total Revenues 69,635,764 16,178,223 9,816,663 7,361,710
EXPENDITURES:
Current:
Public safety 40,772,552 375,150 - -
Public works 4,758,575 1,538,462 - -
Culture and recreation 11,213,507 68,206 - -
Community and economic development 1,310,626 236,023 - -
General government 8,639,508 77,685 6,300 -
Capital outlay - - - 15,247,456
Debt service:
Principal retirement - - 32,885,160 -
Interest - - 5,374,352 -
Bond issuance costs - - 72,385 177,273
Total Expenditures 66,694,768 2,295,526 38,338,197 15,424,729
EXCESS (DEFICIENCY) OF REVENUES
OVER EXPENDITURES 2,940,996 13,882,697 (28,521,534) (8,063,019)
OTHER FINANCING SOURCES (USES):
Bond issuance - - - 14,850,000
Premium on debt issued - - 2,370,295 -
Sale of capital assets - 17,355 - -
Transfers in 341,650 - 9,504,449 1,819,063
Transfers out (1,579,236) (11,758,352) - (100,224)
Refunding bond issuance - - 10,335,000 -
Total Other Financing Sources (Uses) (1,237,586) (11,740,997) 22,209,744 16,568,839
NET CHANGE IN FUND BALANCES 1,703,410 2,141,700 (6,311,790) 8,505,820
FUND BALANCES -BEGINNING 13,617,105 2,324,697 19,696,545 6,658,574
FUND BALANCES - ENDING 15,320,515$ 4,466,397$ 13,384,755$ 15,164,394$
The notes to the financial statements are an integral part of this statement.
CITY OF DAVENPORT
GOVERNMENTAL FUNDS
For the Fiscal Year Ended June 30, 2014
STATEMENT OF REVENUES, EXPENDITURES, AND CHANGES IN FUND BALANCES
22

TOTAL
NON-MAJOR
GOVERNMENTAL
FUNDS
TOTAL
GOVERNMENTAL
FUNDS
5,890,751$ 90,421,947$
- 96,245
70,021 1,749,752
18,209,976 25,530,812
- 4,051,619
374,219 1,176,460
- 1,931,967
979,050 1,065,290
1,616,143 4,108,428
27,140,160 130,132,520
69,148 41,216,850
11,260,754 17,557,791
- 11,281,713
12,307,014 13,853,663
97,226 8,820,719
- 15,247,456
1,874,625 34,759,785
726,961 6,101,313
- 249,658
26,335,728 149,088,948
804,432 (18,956,428)
- 14,850,000
35,301 2,405,596
- 17,355
361,393 12,026,555
(349,602) (13,787,414)
- 10,335,000
47,092 25,847,092
851,524 6,890,664
4,509,131 46,806,052
5,360,655$ 53,696,716$
23

24
CITY OF DAVENPORT
RECONCILIATION OF THE STATEMENT OF REVENUE,
EXPENDITURES AND CHANGES IN FUND BALANCE OF
GOVERNMENTAL FUNDS TO THE STATEMENT OF ACTIVITIES
For the Fiscal Year Ended June 30, 2014
Amounts reported for governmental activities in the statement of activities aredifferent because:
Net change in fund balances: total governmental funds 6,890,664$
Governmental funds report capital outlays as expenditures. However, in the statement of activities the cost of those assets is allocated over their estimated useful lives and reported as depreciation expense. The following is the detail of the amount by which capital outlay exceeded depreciation in the current period.
Capital Expenditures 9,553,526 Depreciation (14,178,643)
(4,625,117)
The following is the detail of various miscellaneous transactions involving capital assets which effect the increase/decrease in assets in the current period.
Loss on disposal of capital assets (384,062) Proceeds from sale of capital assets (17,355)
(401,417)
Revenues in the statement of activities that do not provide current financial resources are not reported as revenues in the funds. 2,305,977
The issuance of long-term debt (bonds) provides current financial resources to governmental funds, while the repayment of the principal on long-term debt consumes the current financial resources of governmental funds. Neither transaction, however, has any effect on net position. Also, governmental funds report the effect of premiums, discounts, and similar items when debt is first issued, whereas these amounts are deferred and amortized in the statement of activities. In the statement of activities, interest is accrued on outstanding bonds, whereas in the governmental funds interest expenditures are reported when due. The following is the detail of the net effect of these differences in the treatment of long-term debt and related items.
General obligation bonds issued, premiums and other deferred costs on bonds (additions and amortization) (8,043,928) Repayment of bond principal 16,024,785 Interest (4,082)
7,976,775
Some expenses reported in the statement of activities do not require the use of current financial resources and, therefore, are not reported as expenditures in governmental funds. (921,766)
Internal services funds are used by management to charge the costs of various activities internally to individual funds. The net income of certain activities of internal service funds is reported with governmental activities. 1,908,679
Change in net position of governmental activities 13,133,795$
The notes to the financial statements are an integral part of this statement
25

CITY OF DAVENPORT
PROPRIETARY FUNDS
STATEMENT OF NET POSITION
June 30, 2014
BUSINESS-TYPE ACTIVITIES -
ASSETS
PARKING
SYSTEM
SEWER
OPERATIONS
Current assets:
Cash and cash equivalents -$ -$
Receivables:
Property taxes:
Delinquent - -
Succeeding year - -
Accounts 94,751 5,333,702
Interest - 4,472
Due from other governments - 248,336
Inventory -
Prepaids - 2,264
Total current assets 94,751 5,588,774
Noncurrent assets:
Investment in joint venture - -
Restricted cash and cash equivalents - 15,936,506
Restricted investments - held in escrow - 1,072,410
Capital assets:
Land 3,647,368 779,435
Buildings 26,238,949 35,458,767
Improvements other than buildings 189,547 141,111
Sanitary sewers - 117,542,619
Paving 1,140,885
Equipment and vehicles 707,848 19,386,509
Storm sewers - -
Less accumulated depreciation (10,404,587) (75,175,759)
Construction in progress 28,461 7,557,661
Total noncurrent assets 21,548,471 122,699,259
Total assets 21,643,222 128,288,033
LIABILITIES
LIABILITIES:
Current liabilities:
Wages payable 8,377 111,010
Accounts payable 40,212 181,973
Capital leases payable - 91,025
Accrued interest payable 16,713 158,349
Compensated absences 10,360 318,511
Claims and judgments - -
Interfund loans payable 347,398 2,200,129
Unearned revenue - -
Note payable - current - 514,000
General obligation bonds - current 636,850 3,177,450
Deposits payable - 778,953
Total current liabilities 1,059,910 7,531,400
Noncurrent liabilities:
Capital leases payable - 189,352
Compensated absences 1,357 41,714
Claims and judgments - -
Other postemployment benefits 31,467 435,723
Note payable - 13,693,982
General obligation bonds -long term 5,150,950 36,972,508
Total noncurrent liabilities 5,183,774 51,333,279
Total liabilities 6,243,684 58,864,679
DEFERRED INFLOWS OF RESOURCES
Succeeding year property tax - -
Deferred amount on refunding 69,991 34,525
Total deferred inflows of resources 69,991 34,525
NET POSITION
Net investment in capital assets 15,690,680 62,063,575
Restricted for equipment replacement - 4,610,003
Unrestricted (deficit) (361,133) 2,715,251
Total net position 15,329,547$ 69,388,829$
The notes to the financial statements are an integral part of this statement
ENTERPRISE FUNDS
26

RIVERCENTER
CLEAN
WATER
TOTAL
NON-MAJOR
ENTERPRISE
FUNDS
TOTAL
ENTERPRISE
FUNDS
GOVERNMENTAL
ACTIVITIES -
INTERNAL SERVICE
FUNDS
-$ 690,164$ 722,554$ 1,412,718$ 8,493,998$
- - 63,204 63,204 -
- - 3,605,618 3,605,618 -
810,970 816,531 2,374,699 9,430,653 18,835
- 245 343 5,060 5,083
- - - 248,336 -
22,239 - 97,003 119,242 -
2,633 2,796 852,847 860,540 320,252
835,842 1,509,736 7,716,268 15,745,371 8,838,168
- - 434,151 434,151 -
- 1,229,060 2,243,391 19,408,957 -
- - - 1,072,410 -
2,472,550 204,051 4,146,837 11,250,241 -
18,891,978 - 16,744,169 97,333,863 -
59,147 316,520 13,081,696 13,788,021 2,601,753
- 117,542,619 -
84,121 149,003 1,374,009
696,573 1,095,077 12,143,791 34,029,798 4,586,317
- 23,766,442 - 23,766,442 -
(10,999,901) (11,606,124) (26,510,332) (134,696,703) (3,299,760)
- 640,772 3,286,145 11,513,039 49,490
11,204,468 15,645,798 25,718,851 196,816,847 3,937,800
12,040,310 17,155,534 33,435,119 212,562,218 12,775,968
1,032 22,099 149,508 292,026 37,328
153,435 19,426 403,001 798,047 121,155
- - - 91,025 -
- 6,461 8,511 190,034 -
980 55,515 215,905 601,271 118,312
- - - - 4,121,719
166,542 4,555 2,573,944 5,292,568 -
73,720 - 15,771 89,491 -
- - - 514,000 -
- 153,000 470,440 4,437,740 -
- - 34,716 813,669 -
395,709 261,056 3,871,796 13,119,871 4,398,514
- - - 189,352 -
128 7,270 28,277 78,746 15,495
- - - - 3,195,783
3,721 71,773 480,875 1,023,559 127,170
- - - 13,693,982 -
- 2,212,947 2,062,116 46,398,521 -
3,849 2,291,990 2,571,268 61,384,160 3,338,448
399,558 2,553,046 6,443,064 74,504,031 7,736,962
- - 3,605,618 3,605,618 -
- - 2,592 107,108 -
- - 3,608,210 3,712,726 -
11,204,468 13,279,851 22,714,836 124,953,410 3,937,800
- - - 4,610,003 -
436,284 1,322,637 669,009 4,782,048 1,101,206
11,640,752$ 14,602,488$ 23,383,845$ 134,345,461$ 5,039,006$
ENTERPRISE FUNDS
27

28

CITY OF DAVENPORT
RECONCILIATION OF ENTERPRISE FUNDS NET POSITION
TO THE STATEMENT OF NET POSITION
JUNE 30, 2014
Total enterprise funds net position 134,345,461$
Amounts reported for enterprise activities in the statement ofnet position are different because:
Internal service funds are used by management to charge the costs of certain services to individual funds. Adjustments to reflect the consolidation of internal service fund activities related to enterprise funds. 536,061
Adjustments fo reflect the consolidation of prior years internal service fund activities related to enterprise funds. (22,110)
Net position of business-type activities 134,859,412$
The notes to the financial statements are an integral part of this statement.
29

STATEMENT OF REVENUES, EXPENSES, AND CHANGES IN NET POSITION
PARKING
SYSTEM
SEWER
OPERATIONS RIVERCENTER
OPERATING REVENUES:
Charges for services 1,342,889$ 17,485,142$ 1,823,924$
Fines and forfeits 75,650 - -
Other 826 333,515 72,694
Total Operating Revenues 1,419,365 17,818,657 1,896,618
OPERATING EXPENSES:
Employee expenses 376,312 6,155,493 52,799
Supplies and services 627,681 6,550,565 2,441,841
Depreciation 753,777 4,945,163 548,171
Total Operating Expenses 1,757,770 17,651,221 3,042,811
OPERATING INCOME (LOSS) (338,405) 167,436 (1,146,193)
NON-OPERATING REVENUES (EXPENSES):
Taxes - - -
Non-operating grants - - -
Use of monies and property 20,237 74,306 -
Interest expense (206,012) (264,129) -
Gain (loss) on disposition of capital assets - 14,778 -
Joint venture adjustment - - -
Total Non-operating Revenues (Expenses) (185,775) (175,045) -
INCOME (LOSS) BEFORE CONTRIBUTIONS AND
TRANSFERS (524,180) (7,609) (1,146,193)
Capital contributions - (90,123) 121,846
Transfers in 500,000 - 607,178
Transfers out - (220,524) -
Change in net position (24,180) (318,256) (417,169)
Total net postion - beginning 15,353,727 69,707,085 12,057,921
Total net position - ending 15,329,547$ 69,388,829$ 11,640,752$
The notes to the financial statements are an integral part of this statement.
CITY OF DAVENPORT
PROPRIETARY FUNDS
For the Fiscal Year Ended June 30, 2014
BUSINESS-TYPE ACTIVITIES -
30

ENTERPRISE FUNDS
CLEAN
WATER
TOTAL
NON-MAJOR
ENTERPRISE
FUNDS
TOTAL
ENTERPRISE
FUNDS
GOVERNMENTAL
ACTIVITIES-
INTERNAL
SERVICE FUNDS
2,497,339$ 8,249,850$ 31,399,144$ 19,917,238$
- - 75,650 -
32,631 105,621 545,287 1,405,207
2,529,970 8,355,471 32,020,081 21,322,445
1,212,596 6,724,541 14,521,741 1,892,829
645,726 7,891,661 18,157,474 17,451,042
931,623 2,007,163 9,185,897 451,206
2,789,945 16,623,365 41,865,112 19,795,077
(259,975) (8,267,894) (9,845,031) 1,527,368
- 3,646,576 3,646,576 -
- 3,378,211 3,378,211 -
7,294 516,383 618,220 16,645
(57,713) (40,958) (568,812) -
45,278 1,675 61,731 -
- (9,050) (9,050) -
(5,141) 7,492,837 7,126,876 16,645
(265,116) (775,057) (2,718,155) 1,544,013
251,204 2,755,006 3,037,933 846,784
- 820,262 1,927,440 220,524
- (220,524) (166,581)
(13,912) 2,800,211 2,026,694 2,444,740
14,616,400 20,583,634 132,318,767 2,594,266
14,602,488$ 23,383,845$ 134,345,461$ 5,039,006$
31

32
CITY OF DAVENPORT
RECONCILIATION OF THE CHANGE IN NET POSITION OF
ENTERPRISE FUNDS TO THE STATEMENT OF ACTIVITIES
For the Fiscal Year Ended June 30, 2014
Net change in net position in enterprise funds 2,026,694$
Amounts reported for proprietary activities in the statement of activities are different because:
Internal service funds are used by management to charge the costs of various activities internally to individual funds. Adjustment to reflect the consolidation of internal service fund activities related to enterprise funds. 536,061
Change in net position of business-type activities 2,562,755$
The notes to the financial statements are an integral part of this statement.
33

STATEMENT OF CASH FLOWS
PARKING
SYSTEM
SEWER
OPERATIONS
CASH FLOWS FROM OPERATING ACTIVITIES:
Cash received from users 1,389,627$ 17,210,978$
Cash paid to suppliers for goods and services (599,648) (6,240,650)
Cash paid to employees for services (371,626) (6,009,162)
Other operating revenue 826 333,515
Net Cash Provided by (Used for) Operating
Activities 419,179 5,294,681
CASH FLOWS FROM NON-CAPITAL
FINANCING ACTIVITIES:
Repayments to other funds (448,592) (1,537,580)
Advances from other funds 347,398 2,200,129
Grants - -
Property tax - -
Transfers in 500,000 -
Transfers out - (220,524)
Net Cash Provided by (Used for) Non-Capital
Financing Activities 398,806 442,025
CASH FLOWS FROM CAPITAL AND RELATED
FINANCING ACTIVITIES:
Proceeds from general obligation bonds - 6,830,000
Proceeds from loan - 4,624,820
Refunding discount/issue costs and premiums (8,882) (31,600)
Proceeds from the sale of capital assets - 28,900
Acquisition and construction of capital assets - (11,237,142)
Principal paid on long-term debt (622,025) (3,193,365)
Interest paid on long-term debt (207,315) (1,247,491)
Deposits-other municipalities - (91,179)
Refunding bond proceeds - 615,000
Net Cash Provided by (Used for) Capital and
Related Financing Activities (838,222) (3,702,057)
CASH FLOWS FROM INVESTING ACTIVITIES:
Sale of investments - (908,280)
Interest and other investment income 20,237 69,834
Net Cash provided by (used for) Investing
Activities 20,237 (838,446)
Net Increase (Decrease) in Cash and Cash
Equivalents - 1,196,203
CASH AND CASH EQUIVALENTS-BEGINNING - 14,740,303
CASH AND CASH EQUIVALENTS-ENDING -$ 15,936,506$
The notes to the financial statements are an integral part of this statement.
CITY OF DAVENPORT
For the Fiscal Year Ended June 30, 2014
PROPRIETARY FUNDS
BUSINESS-TYPE ACTIVITIES -
34

RIVERCENTER CLEANWATER
TOTAL
NON-MAJOR
ENTERPRISE
FUNDS
TOTAL ENTERPRISE
FUNDS
GOVERNMENTAL
ACTIVITIES-
INTERNAL
SERVICE FUNDS
1,767,790$ 2,425,592$ 7,457,967$ 30,251,954$ 20,515,248$
(2,357,515) (647,399) (7,873,204) (17,718,416) (17,582,036)
(52,362) (1,179,760) (6,576,388) (14,189,298) (1,857,578)
72,694 32,631 105,621 545,287 1,405,207
(569,393) 631,064 (6,886,004) (1,110,473) 2,480,841
(194,323) (113,671) (3,441,190) (5,735,356) (6,536)
166,543 4,555 2,573,943 5,292,568 -
- - 3,378,211 3,378,211 -
- - 3,646,576 3,646,576 -
607,178 - 820,262 1,927,440 220,524
- - - (220,524) (166,581)
579,398 (109,116) 6,977,802 8,288,915 47,407
- - 1,445,000 8,275,000 -
- - - 4,624,820 -
- (21,967) 103,058 40,609 -
- 50,600 1,675 81,175 -
(10,005) (283,553) (199,646) (11,730,346) (51,638)
- (155,000) (314,825) (4,285,215) -
- (63,407) (35,836) (1,554,049) -
- - - (91,179) -
- - - 615,000 -
(10,005) (473,327) 999,426 (4,024,185) (51,638)
- - - (908,280) -
- 7,049 516,040 613,160 11,562
- 7,049 516,040 (295,120) 11,562
- 55,670 1,607,264 2,859,137 2,488,172
- 1,863,554 1,358,681 17,962,538 6,005,826
-$ 1,919,224$ 2,965,945$ 20,821,675$ 8,493,998$
(continued)
ENTERPRISE FUNDS
35

STATEMENT OF CASH FLOWS (CONTINUED)
PARKING
SYSTEM
SEWER
OPERATIONS
RECONCILIATION OF OPERATING INCOME (LOSS) TO
NET CASH PROVIDED BY (USED FOR) OPERATING ACTIVITIES
Operating Income (Loss) (338,405)$ 167,436$
Adjustments to Reconcile Operating Income (Loss) to Net Cash
Provided by (Used for) Operating Activities:
Depreciation 753,777 4,945,163
Change in assets and liabilities:
Decrease (increase) in accounts receivable (28,912) (302,324)
Decrease in due from other governments - 28,160
Decrease (increase) in inventory and prepaids - (2,264)
Increase (decrease) in accounts payable 28,033 312,179
Increase in other accrued liabilities 4,686 146,331
Increase (decrease) in unearned revenue - -
Total Adjustments 757,584 5,127,245
NET CASH PROVIDED BY ( USED FOR) OPERATING
ACTIVITIES 419,179$ 5,294,681$
SCHEDULE OF NON-CASH INVESTING, CAPITAL AND
FINANCING ACTIVITIES
Acquisition of capital assets through capital contributions -$ (90,123)$
Contribution of capital assets by municipality - 549,706
Contribution of capital assets by state and federal governments - (459,583)
Capitalized interest - 1,011,127
CITY OF DAVENPORT
PROPRIETARY FUNDS
For the Fiscal Year Ended June 30, 2014
BUSINESS-TYPE ACTIVITIES -
36

RIVERCENTER CLEANWATER
TOTAL
NON-MAJOR
ENTERPRISE
FUNDS
TOTAL ENTERPRISE
FUNDS
GOVERNMENTAL
ACTIVITIES-
INTERNAL
SERVICE FUNDS
(1,146,193)$ (259,975)$ (8,267,894)$ (9,845,031)$ 1,527,368$
548,171 931,623 2,007,163 9,185,897 451,206
(46,711) (71,747) (130,096) (579,790) 598,010
- - (663,801) (635,641) -
11,047 (2,796) (97,003) (91,016) (23,184)
73,279 1,123 115,460 530,074 (107,810)
437 32,836 148,153 332,443 35,251
(9,423) - 2,014 (7,409) -
576,800 891,039 1,381,890 8,734,558 953,473
(569,393)$ 631,064$ (6,886,004)$ (1,110,473)$ 2,480,841$
121,846$ 251,204$ 2,755,006$ 3,037,933$ 846,784$
(121,846) (221,204) (633,833) (427,177) (846,784)
- (30,000) (2,121,173) (2,610,756) -
- 4,783 - 1,015,910 -
ENTERPRISE FUNDS
37
AGENCY
FUNDS
ASSETS
Cash and investments 431,329$
Interest receivable 267
Total assets 431,596$
LIABILITIES
Accounts payable 10,343$
Due to other governments 421,253
Total liabilities 431,596$
The notes to the financial statements are an integral part of this statement.
CITY OF DAVENPORT
FIDUCIARY FUNDS
STATEMENT OF FIDUCIARY NET POSITION
June 30, 2014
38

CITY OF DAVENPORT NOTES TO FINANCIAL STATEMENTS JUNE 30, 2014______________________________________________________________________________________ 1. SUMMARY OF SIGNIFICANT ACCOUNTING POLICIES A. Reporting Entity The City of Davenport, Iowa, was incorporated in 1836 and is one of the few remaining special charter cities in
Iowa. The General Assembly of Iowa in 1851 adopted a special charter of the City and with subsequent amendments adopted by the General Assembly in 1853, 1855 and 1857, the charter has remained unchanged to this date. Subsequent changes to the laws of the State of Iowa affecting cities under special charter have been made from time to time and are now codified in Chapter 420, Code of Iowa. The form of City government is Mayor-Council, utilizing a professional City Administrator. The City of Davenport provides a wide variety of public services through eleven professionally staffed departments and the office of the City Administrator, including public safety (police and fire), streets, sewers and bridges, garbage and refuse collection, sewage treatment, culture-recreation, mass transportation, public improvements, planning and zoning, and general administrative services.
These financial statements have been prepared in conformity with the accounting principles generally accepted in
the United States of America (U.S. GAAP) that apply to governmental units. The Governmental Accounting Standards Board (GASB) is the accepted standard – setting body for establishing governmental accounting and financial reporting principles. All funds created under the authority of the State Code of Iowa, the operations of which are under the control of the City’s governing body required by financial reporting standards for governmental units, are included herewith.
The City of Davenport has also considered all potential component units for which it is financially accountable,
and other organizations for which the nature and significance of their relationship with the City are such that exclusion would cause the City’s financial statements to be misleading or incomplete. The Governmental Accounting Standards Board has set forth criteria to be considered in determining financial accountability. These criteria include appointing a voting majority of an organization’s governing body, and (1) the ability of the City to impose its will on that organization or (2) the potential for the organization to provide specific benefits to, or impose specific financial burdens on, the City.
The City of Davenport does not have any component units required to be reported within the City’s reporting
entity. Joint Venture – the City is a participant in a joint venture agreement (Quad-City Garage Policy Group) with
Metrolink for the operation of a garage and maintenance facility used by the transit programs of each entity. The City maintains a 12% interest in the venture with Metrolink maintaining the remaining 88%. Funding of the maintenance operation is achieved through allocation of expenditures between the City and Metrolink based upon usage.
Operations are reimbursed on a break-even basis, the City providing approximately 25% and Metrolink providing
75% for the year. The City paid $1,374,453 in maintenance fees during the fiscal year ended June 30, 2014. The City’s interest in the joint venture is accounted for under the equity method in the Transit enterprise fund (Note 8). Financial statements of the Quad-City Garage Policy Group may be obtained from the entity’s administrative office at 2929 5th Avenue, Rock Island, IL 61201.
B. Government-wide and Fund Financial Statements The government-wide financial statements (i.e., the statement of net position and the statement of activities)
report information on all of the non-fiduciary activities of the City. For the most part, the effect of inter-fund activity has been removed from these statements, other than interfund services provided and used. Any direct expenses have not been eliminated and interfund services provided and used are shown as program revenue (for example, charges for services in the sewer fund by all other funds). Governmental activities, which normally are supported by taxes and intergovernmental revenues, are reported separately from business-type activities, which rely to a significant extent on fees and charges for services.
The statement of net position presents the City’s non-fiduciary assets, deferred outflows of resources, liabilities
and deferred inflows of resources, with the difference reported as net position.
39

CITY OF DAVENPORT NOTES TO FINANCIAL STATEMENTS JUNE 30, 2014 (CONTINUED)________________________________________________________________________
The statement of activities demonstrates the degree to which the direct expenses of a given function are offset by program revenues. Direct expenses are those that are clearly identifiable with a specific function. Program revenues include (1) charges to customers or applicants who purchase, use or directly benefit from goods, services, or privileges provided by a given function and (2) grants and contributions that are restricted to meeting the operational or capital requirements of a particular function. Taxes and other items not properly included among program revenues are reported instead as general revenues.
Separate financial statements are provided for governmental funds, propriety funds, and fiduciary funds, even though the latter are excluded from the government-wide financial statements.
C. Fund Accounting
The accounts of the City are organized on the basis of funds each of which is considered to be a separate accounting entity. The operations of each fund are accounted for by providing a separate set of self-balancing accounts which comprise its assets, deferred outflows of resources, liabilities, deferred inflows of resources, fund balances/net position, revenues and expenditures or expenses, as appropriate. Major individual governmental and proprietary funds are reported as separate columns in the fund financial statements. All remaining governmental and proprietary funds are aggregated and reported as non-major governmental and proprietary funds. The City has the following funds:
(1) Governmental Fund Types
Governmental fund types are those funds through which most governmental functions of the city are
financed. The acquisition, use and balances of the City’s expendable financial resources and the related liabilities (except those accounted for in Proprietary Funds) are accounted for through Governmental funds. The measurement focus is upon determination of changes in financial position, rather than upon net income determination. The following comprise the City’s major governmental funds:
(a) General Fund
The General Fund is the general operating fund of the City. It is used to account for all financial resources except those required legally or by sound financial management to be accounted for in another fund. (b) Local Option Sales Tax Fund The Local Option Sales Tax Fund is a special revenue fund, which accounts for revenue received from a 1% sales tax, to be used for property tax relief and public improvements. (c) General Debt Service Fund The General Debt Service Fund is a debt service fund which accounts for the accumulation of resources for and the payment of principal and interest on general obligation long-term debt from governmental resources and principal and interest on special assessment debt with governmental commitment from special assessment levies. The City levies an annual property tax, which is unlimited by law, to finance the debt service requirements not abated by special assessments.
(d) Capital Projects Fund The Capital Projects Fund is used to account for the resources used for the acquisition and construction of major capital facilities, except those financed by Proprietary Funds.
40

CITY OF DAVENPORT NOTES TO FINANCIAL STATEMENTS JUNE 30, 2014 (CONTINUED)________________________________________________________________________
(2) Proprietary Fund Types Proprietary fund types are used to account for the City’s ongoing organizations and activities, which are
similar to those often found in the private sector. The measurement focus is upon determination of net income.
Enterprise funds are used to finance and account for the acquisition, operation, and maintenance of the City’s facilities and services, which are supported primarily by user charges. The following comprise the City’s major enterprise funds: (a) Parking System Fund – Accounts for revenue and expenses associated with the City’s parking system, which provides both on-street and off-street parking. (b) Sewer Operations Fund – Accounts for revenue and expenses of the system responsible for collecting and
treating the wastewater of the Cities of Davenport, Bettendorf, Riverdale, and Panorama Park. Davenport accumulates the costs of operations, construction, and equipment replacement, and bills the other cities monthly for their portion of such costs based on an actual usage percentage calculated annually.
(c) RiverCenter Fund – Accounts for rental income and expenses associated with the operation of a 57,000
square foot conference, convention and trade show facility. This fund is a nonmajor fund but the City has elected to report it as a major fund for public interest purposes.
(d) Clean Water Fund – Accounts for revenue and expenses related to the operation and maintenance of the
storm water collection system including inspections, mapping, drainage maintenance, street sweeping and other activities related to clean water activities. This fund is a nonmajor fund but the City has elected to report it as a major fund for public interest purposes.
Internal service funds are used to finance and account for, employee insurance, risk management, and information management services provided to other departments or agencies of the City, or to other governments, on a cost reimbursement basis. (3) Fiduciary Fund Types
Fiduciary fund types are used to account for assets held by the City in a trustee capacity under a formal trust agreement or as an agent for individuals, private organizations, other governmental units and/or other funds. The following is the City’s fiduciary fund type:
(a) Agency Funds
Agency funds are custodial in nature (assets equal liabilities), and do not involve the measurement of results of operations. The agency funds function primarily as a clearing mechanism for cash resources, which are collected, held as such for brief period, and then disbursed to authorized recipients. The City has 3 agency funds: Riverfront Task Force that accounts for donations toward the formulation of a plan for riverfront development; Library Gift that accounts for donations to the Davenport Public Library and disbursements as authorized by the Library Board of Trustees and M.D. Petersen Memorial that accounts for annual contributions from the Petersen estate and disbursements designated by the Davenport Levee Improvement Commission.
41

CITY OF DAVENPORT NOTES TO FINANCIAL STATEMENTS JUNE 30, 2014 (CONTINUED)________________________________________________________________________ D. Measurement Focus and Basis of Accounting
The government-wide financial statements are reported using the economic resources measurement focus and the accrual basis of accounting, as are the proprietary fund financial statements. The agency funds do not have a measurement focus, as they record only assets and liabilities. Revenues are recorded when earned and expenses are recorded when a liability is incurred, regardless of the timing of related cash flows. Property taxes are recognized as revenues in the year for which they are levied and budgeted for. Grants and similar items are recognized as revenue as soon as all eligibility requirements imposed by the provider have been met. Governmental fund financial statements are reported using the current financial resources measurement focus and the modified accrual basis of accounting. Revenues are recognized as soon as they are both measurable and available. Revenues are considered to be available when they are collectible within the current period or soon enough thereafter to pay liabilities of the current period. For this purpose, the City considers revenues to be available if they are collected within 60 days of the end of the current fiscal period. Expenditures generally are recorded when a liability is incurred, as under accrual accounting. However, debt service expenditures, as well as expenditures related to compensated absences, other post employment benefits and claims and judgments, are recorded only when payment is due. Property tax when levied, local option sales tax, intergovernmental revenues and interest are considered to be susceptible to accrual. All other revenue items are considered to be measurable and available only when cash is received by the City.
Licenses and permits, fines and forfeits, charges for services, and miscellaneous revenues are generally recorded
as revenue when received in cash, because they are generally not measurable until actually received. In the category of use of monies and property, property rentals are recorded as revenue when received in cash, but investment earnings are recorded as earned, since they are measurable and available.
Amounts reported as program revenues include (1) charges to customers or applicants for goods, services, or
privileges provided, (2) operating grants and contributions, and (3) capital grants and contributions, including special assessments. Internally dedicated resources are reported as general revenues rather than as program revenues. Likewise, general revenues include all taxes.
Operating revenues and expenses generally result from providing services and delivering goods in connection
with a proprietary fund’s principal ongoing operations. The principal operating revenues are charges for services. The principal operating expenses include the cost of sales and services, administrative expenses and depreciation on capital assets. All revenues and expenses not meeting this definition are reported as non-operating revenues and expenses and include interest earnings and interest payments
When both restricted and unrestricted resources are available for use, it is the government’s policy to use restricted resources first, then unrestricted resources as they are needed.
E. Cash and Pooled Cash Investments Except where otherwise required, the City maintains all deposits in a bank account in the name of the City. Cash
resources have been pooled in order to maximize investment opportunities. Income from investments purchased with pooled cash is allocated to individual funds based on the fund's average cash balance and legal requirements. Fund cash deficits, which represent current loans between funds, have been reported as interfund loans receivable/payable.
F. Investments Investments in government agency securities are stated at fair value based on quoted market prices. Investments
in the Iowa Public Agency Investment Trust are stated at amortized cost.
42

CITY OF DAVENPORT NOTES TO FINANCIAL STATEMENTS JUNE 30, 2014 (CONTINUED)________________________________________________________________________ G. Statement of Cash Flows For the purpose of the statement of cash flows, the City considers all liquid investments (including restricted
assets) with original maturities of three months or less when purchased to be cash equivalents. H. Property Tax Receivable Property taxes, including tax increment financing, in governmental funds are accounted for using the modified
accrual basis of accounting. Property tax receivable is recognized in these funds on the levy or lien date, which is the date the tax asking is
certified by the City to the County Board of Supervisors. Current year property tax receivable represent taxes collected by the County but not remitted to the City at June 30, 2014 and unpaid taxes. The succeeding year property tax receivable represent taxes certified by the City to be collected in the next fiscal year for the purposes set out in the budget for the next fiscal year. By statute, the City is required to certify its budget to the County Auditor by March 15 of each year for the subsequent fiscal year. However, by statute, the tax asking and budget certification for the following fiscal year becomes effective on the first day of that year. Although the succeeding year property tax receivable have been recorded, the related revenue is treated as a deferred inflow in both the government-wide and fund financial statements and will not be recognized as revenue until the year for which it is levied and budgeted for.
Property tax revenues recognized in these funds become due and collectible in September and March of the
current fiscal year with a 1½% per month penalty for delinquent payments; is based on January 1, 2012 assessed property valuations; is for the tax accrual period July 1, 2013 through June 30, 2014 and reflects tax asking contained in the budget certified to the County Board of Supervisors in March 2013.
The City is permitted by the Code of Iowa to levy taxes up to $8.10 per $1,000 of assessed valuation for General
Fund purposes, $.27 per $1,000 of assessed valuation for an Emergency Fund to assist in the funding of General Fund activities, $.95 per $1,000 of assessed valuation for a mass transportation program and unlimited amounts for the payment of principal and interest on general obligation bonds, judgments awarded against the City, trust and agency accounts for pension and related employee benefits funds, and to pay the premium costs on tort liability insurance. The combined tax rate for the collection year ended June 30, 2014 was $16.78 per $1,000 of assessed valuation.
I. Loans Receivable
Loans receivable consist of $4,237,973 of financing provided to companies that are beginning operations. The remaining $13,470,027 of loans receivable are low- and no-interest loans. The City receives federal funds from the U.S. Department of Housing and Urban Development as part of the Community Development Block Grant, which allows the City to provide loans at below-market-rates to eligible corporations and individuals to finance urban and community development. Loans are carried at the amount of unpaid principal. Management records allowances for estimated uncollectible amounts of $3,641,196 based on historic information and review of outstanding amounts.
J. Special Assessments Receivable Special assessments are levied against certain property owners benefited by various street projects. Special
assessments receivable consists of assessments due over the next ten years in relation to these projects. K. Restricted Assets If the use of monies received is limited by City ordinance and/or contract provisions, they are reported as
restricted assets. Also, liabilities which are payable from restricted assets are reported as such. The following assets are reported as restricted at June 30, 2014: unexpended general obligation bond proceeds and other funds
43

CITY OF DAVENPORT NOTES TO FINANCIAL STATEMENTS JUNE 30, 2014 (CONTINUED)________________________________________________________________________
restricted to capital outlay of $9,699,287, deposits and equipment replacements of $6,237,219 in the Sewer Enterprise Fund, $1,229,060 of unexpended bond proceeds in the Clean Water Enterprise Fund; $1,958,675 of unexpended bond proceeds in the Solid Waste Enterprise Fund; $250,000 of unexpended bond proceeds in the Public Housing Fund, security deposits of $34,716 in the Public Housing Fund, and loan escrow payments of $58,827 in the Community Development Act Special Revenue Fund. In governmental activities, there is also $22,708,213 of unexpended general obligation proceeds restricted to capital outlay. In addition, $11,321,223 is held in escrow related to the crossover refunding of bonds.
L. Capital Assets Capital assets, including land, buildings, improvements, infrastructure, and equipment, are reported in the
applicable governmental or business-type activities columns in the government-wide financial statement and proprietary fund financial statements. In the governmental funds capital assets (capital outlay) is reported as expenditures and no depreciation is recognized. Generally, capital assets purchased in excess of $5,000 are capitalized if they have an expected useful life of one year or greater. Assets are recorded at historical cost if purchased or constructed. Donated capital assets are recorded at estimated fair value on the date donated.
Major outlays for capital assets and improvements are capitalized as projects are constructed. Interest incurred
during the construction phase of capital assets of business-type activities is included as part of the capitalized value of the assets constructed. Capitalized interest was $1,011,127 in the Sewer Operations Fund and $4,783 in the Clean Water Fund.
Capital assets are depreciated using the straight-line method of depreciation over the following estimated useful
lives: Buildings 40-50 years Improvements 10-20 years Equipment and vehicles 3-15 years Sanitary sewers 40 years Streets and roads 10-30 years Storm sewers 30 years Traffic signals 20-40 years Bridges 25-50 years Seawalls 30-50 years Tunnels 20-40 years The City's collection of works of art, library books and other similar assets are not capitalized. These collections
are unencumbered, held for public exhibition and education, protected, cared for and preserved and subject to a City policy that requires proceeds from sale of these items to be used to acquire other collection items.
M. Unearned Revenues Unearned revenues represent grants and similar items received, but for which the City has not met all eligibility
requirements imposed by the provider. N. Deferred Inflows of Resources
In addition to liabilities, the statement of net position will sometimes report a separate section for deferred inflows of resources. This separate financial statement element, deferred inflows of resources, represents an acquisition of net position that applies to a future period(s) and so will not be recognized as an inflow of resources (revenue) until that time. The governmental activities and enterprise funds report deferred inflows from several sources: property taxes and deferred amount on refunding. The governmental funds also include unavailable revenues from special assessments and intergovernmental revenue. These amounts are deferred and recognized as an inflow of resources in the period that the amounts become available. In the City’s government-wide statements, only the property tax revenues remain under the modified accrual basis of accounting. The property tax revenues will become a revenue in the year they are levied and budgeted for.
44

CITY OF DAVENPORT NOTES TO FINANCIAL STATEMENTS JUNE 30, 2014 (CONTINUED)________________________________________________________________________
O. Interfund Transactions Interfund transactions that would be treated as revenue and expenditures or expenses if they involved
organizations external to the City are similarly treated when involving other funds of the City. Major transactions that fall into this category include payments to the Sewer Fund for fees and payments to the Internal Service Funds for costs of the City's insurance programs and data processing system.
Transfers from funds receiving revenue to funds through which the resources are to be expended and operating
loss subsidies are classified as transfers. Major transactions that fall into this category include transfers from the Local Option Sales Tax Fund to the General Debt Service Fund and the Capital Projects Fund and a transfer from the General Fund to subsidize the operating loss of the RiverCenter Enterprise Fund.
Activity between funds that are representative of lending/borrowing arrangements at the end of the fiscal year are
referred to as "interfund payables/receivables." Any residual balances outstanding between the governmental activities and business-type activities are reported in the government-wide financial statements as "internal balances."
P. Compensated Absences City employees earn vacation and sick leave based upon union contracts or City policy on an annual basis and are
credited with vacation and sick leave hours each payroll period. Vacation leave is fully vested when earned. In general, except for Police and Fire personnel, 75% of accumulated sick leave in excess of 720 hours earned prior to July 1, 1987 is vested using the employees' hourly rate at July 1, 1987. For Police and Fire personnel hired before July 1, 1988, 75% of accumulated sick leave earned in excess of 720 hours is vested using the employees' hourly rate at the time of termination. Employees are offered the option of accumulating overtime hours to be taken as compensatory time off rather than being paid for them on a current basis; any amounts unused at time of termination are also paid.
For government-wide financial statements and proprietary fund types, these accumulations are recorded as
expenses and liabilities in the fiscal year earned. For governmental fund types, a liability for these amounts is reported in governmental funds only if they have matured, for example, as a result of employee resignations and retirements.
Q. Net Position
Net position represent the difference between assets, deferred outflows of resources, liabilities and deferred inflows of resources. Net investment in capital assets, consists of capital assets, net of accumulated depreciation, reduced by the outstanding balances of any borrowings used for the acquisition, construction or improvement of those assets. Net investment in capital assets excludes unspent debt proceeds. Unspent debt proceeds for the Sewer Operations, Clean Water, Solid Waste and Public Housing Funds were $9,699,287, $1,958,675, $1,229,060 and $250,000 respectively. Unspent debt proceeds for the Capital Projects Fund were $22,708,213. Net position is reported as restricted when there are limitations imposed on their use either through the enabling legislation adopted by the City or through external restrictions imposed by creditors, grantors or laws or regulations of other governments. Net position restricted through enabling legislation consists of $2,719,630 for employee benefits; $1,433,279 for tort liability; $4,466,397 for local option sales tax; $873,040 for library; $16,614,527 for debt service; $496,696 for road use tax and $478,048 for municipal improvement districts. Net position is reported as unrestricted when it does not meet the definition of the two preceding categories. Deficits will require future funding. Unrestricted net position often has constraints on resources imposed by management which can be removed or modified. The City first applies restricted resources when an expense is incurred for purposes for which both restricted and unrestricted net position is available.
45
CITY OF DAVENPORT NOTES TO FINANCIAL STATEMENTS JUNE 30, 2014 (CONTINUED)________________________________________________________________________
R. Long-term Obligations
In the government-wide financial statements, and proprietary fund types in the fund financial statements, long-term debt and other long-term obligations are reported as liabilities in the applicable governmental activities, business-type activities, or proprietary fund type statement of net position. Bond premiums and discounts are deferred and amortized over the life of the bonds using the effective interest method. Bonds payable are reported net of the applicable bond premium or discount. Bond issuance costs are reported as expenses. In the fund financial statements, governmental fund types recognize bond premiums and discounts, as well as bond issuance costs, during the current period. The face amount of debt issued is reported as other financing sources. Premiums received on debt issuances are reported as other financing sources while discounts on debt issuances are reported as other financing uses. Issuance costs, whether or not withheld from the actual debt proceeds received, and principal payments are reported as debt service expenditures.
S. Prepaids Certain payments to vendors reflect costs applicable to future accounting periods and are recorded as prepaid items in both government-wide and fund financial statements. The prepaid items reflect the consumption method.
T. Estimates The preparation of financial statements in conformity with accounting principles generally accepted in the United States of America require management to make estimates and assumptions that affect the reported amounts of assets and liabilities and disclosure of contingent assets and liabilities at the date of the financial statements and the reported amounts of revenues, expenses and other changes in net position during the reporting period. Actual results could differ from those estimates.
2. CONTINGENCIES
A. Litigation
The City records liabilities resulting from claims and legal actions only when they become probable and estimatable. There are several lawsuits pending against the City for various reasons. Liability insurance covers many of the lawsuits for personal injury, property damage and civil rights violations pending against the City. Although the outcome of these lawsuits is not presently determinable, it is the opinion of management and counsel that the likelihood is remote that any such claims or proceedings will have a material adverse effect on the City’s financial position.
B. Grants Amounts received or receivable from grantor agencies are subject to audit and adjustment by grantor agencies, principally the federal government. Any disallowed claims, including amounts already collected, may constitute a liability of the applicable funds. The amount, if any, of expenditures which may be disallowed by the grantor cannot be determined at this time although City management and counsel expect such amounts, if any, to be immaterial.
3. DEPOSITS AND INVESTMENTS
A. Deposits
Chapter 12C of the Code of Iowa requires that all City funds be deposited into an approved depository and either insured or collateralized. At year-end, the carrying amount of the City’s deposits was $63,863,005 and the bank balances were $65,047,388. As of June 30, 2014, the City’s deposits with financial institutions were entirely
46

CITY OF DAVENPORT NOTES TO FINANCIAL STATEMENTS JUNE 30, 2014 (CONTINUED)________________________________________________________________________
covered by federal depository insurance or insured by the state through pooled collateral, state sinking funds and by the state’s ability to assess for lost funds.
B. Investments The City is authorized by statute to invest public funds in obligations of the United States government, its agencies and instrumentalities, certificates of deposit or other evidences of deposit at federally insured Iowa institutions approved by the City Council; prime eligible bankers acceptances, certain high rated commercial paper; perfected repurchase agreements; certain registered open-end management investment companies; and state and local securities. Interest rate risk – the City’s investment policy limits the investment of operating funds in instruments that mature within 397 days. Funds not identified as operating funds may be invested in investments with maturities longer than 397 days but the maturities shall be consistent with the needs and use of the City. The City’s investments in State and Local Government Securities exceed the 397 day investment period, but the maturities match the crossover refundings.
Credit risk – Generally, credit risk is the risk that an issuer of an investment will not fulfill its obligation to the holder of the investment. This is measured by the assignment of a rating by a nationally recognized statistical rating organization. The City’s investment in the Iowa Public Agency Investment Trust is unrated. Concentration of credit risk – The City’s investment policy is to diversify its investment portfolio to eliminate the risk of loss resulting from over concentration of assets in a specific maturity, a specific issuer or a specific class of securities. However, the City’s policy limits them from investing in prime bankers’ acceptances, commercial paper, other short-term corporate debt, open-end management investment company or Iowa Public Agency Investment Trust of more than 10 percent of the investment portfolio or perfected repurchase agreements of more than 25 percent of the investment portfolio and more than 5 percent of the investment portfolio with a single issuer. In addition, no more than 5 percent of all amounts invested in commercial paper and other short-term corporate debt shall be invested in paper and debt rated in the second highest classification. More than 5 percent of the City’s investments are in SLGS. The majority of these securities represent the crossover refunding proceeds. Custodial credit risk – for an investment, this is the risk that, in the event of the failure of the counterparty, the government will not be able to recover the value of its investments of collateral securities that are in the possession of an outside party. The City’s investments were not insured but were held by a custodian in the name of the City. The City does not have a formal deposit policy for custodial credit risk. At June 30, 2014, the interest rate risk and credit risk of the City’s investments are as follows: Type Fair Value Maturities Credit Ratings State and Local Government Securities (SLGS) $ 128,084 November 30, 2014 AA+ State and Local Government Securities (SLGS) $ 12,132,037 May 31, 2015 AA+ The City had investments in the Iowa Public Agency Investment Trust (IPAIT) with maturity of 1 day, which are valued at an amortized cost of $414,301 pursuant to Rule 2a-7 under the Investment Company Act of 1940.
47

CITY OF DAVENPORT NOTES TO FINANCIAL STATEMENTS JUNE 30, 2014 (CONTINUED)________________________________________________________________________ 4. FUND TRANSFER RECONCILIATION
The following is a schedule of transfers in and out as included in the financial statements of the City. Transfer in:
General Fund
General Debt
Service Fund
Capital Projects
Fund
Non-major
governmental Funds
Parking Fund
RiverCenter Fund
Non-major proprietary
Funds
Risk Internal Service Fund
Total transfer
Transfer out: General Fund
$ -
$ -
$ 36,627
$ 215,169
$ -
$ 607,178
$ 720,262
$ -
$ 1,579,236
Local Option Sales Tax Fund
-
9,504,449
1,607,903
46,000
500,000
-
100,000
-
11,758,352
Capital Project Fund
-
-
-
100,224
-
-
-
-
100,224
Sewer Fund - - - - - - - 220,524 220,524
Risk Internal Service Fund
14,150
-
152,431
-
-
-
-
-
166,581
Other non-major governmental funds
327,500
-
22,102
-
-
-
-
-
349,602
Total Transfer $341,650 $9,504,449 $1,819,063 $ 361,393 $500,000 $ 607,178 $ 820,262 $220,524 $14,174,519
Transfers are used to (1) move revenues from the fund that statute or budget requires collecting them to the fund that statute or budget requires to expend them or (2) use unrestricted revenues collected in the General Fund to finance various programs accounted for in other governmental and proprietary funds in accordance with budgetary authorizations. The governmental activities also contributed capital to the Parking System Fund, Sewer Operations Fund, RiverCenter Fund, Clean Water Fund, Public Housing Fund, Golf Courses Fund, Airport Fund, Public Transit Fund, Solid Waste Fund and River’s Edge Fund.
5. INTERFUND RECEIVABLES AND PAYABLES At June 30, 2014, interfund receivables and payables are summarized as follows:
Receivable Fund Payable Fund Amount
General Non-major Governmental Funds $ 421,902
Sewer Fund 1,376,660
RiverCenter Fund 166,542
Parking Fund 347,398
Non-major Proprietary Funds 2,573,944General Debt Service Local Option Sales Tax Fund 1,508,038
Capital Projects Clean Water Fund 4,555
Sewer Fund 823,469
General Fund 4,969
Local Option Sales Tax Fund 562,513
$ 7,789,990Interfund balances resulted from the time lag between the dates that interfund goods and services are provided or reimbursable expenditures occur, transactions are recorded in the accounting system, and payments between funds are made.
48

CITY OF DAVENPORT
6. Changes in Capital Assets
BEGINNING
BALANCE
06/30/13 ADDITIONS DELETIONS
ENDING
BALANCE
06/30/14
GOVERNMENTAL ACTIVITIES
Capital assets, not being depreciated:
Land 20,002,931$ -$ -$ 20,002,931$
Construction in progress 15,529,290 8,048,422 (11,961,106) 11,616,606
Total capital assets, not being depreciated 35,532,221 8,048,422 (11,961,106) 31,619,537
Capital assets being depreciated
Buildings 106,171,714 322,685 (783,589) 105,710,810
Improvements other than buildings 28,144,924 109,786 - 28,254,710
Equipment and vehicles 38,748,879 3,300,929 (646,351) 41,403,457
Bridges 9,515,356 240,520 (294,633) 9,461,243
Traffic Signals 8,502,673 - - 8,502,673
Streets and roads 194,721,534 10,390,712 294,633 205,406,879
Seawalls 2,685,289 - - 2,685,289
Tunnels 54,326 - - 54,326
Total capital assets being depreciated 388,544,695 14,364,632 (1,429,940) 401,479,387
Less accumulated depreciation for:
Buildings 32,783,291 2,707,934 (571,767) 34,919,458
Improvements other than buildings 10,508,197 1,487,825 11,351 12,007,373
Equipment and vehicles 26,546,381 2,734,360 (468,107) 28,812,634
Bridges 2,564,522 257,454 (12,432) 2,809,544
Traffic signals 5,682,214 247,755 - 5,929,969
Streets and roads 71,250,964 7,107,483 12,432 78,370,879
Seawalls 200,402 84,322 - 284,724
Tunnels 18,333 2,716 - 21,049
Total accumulated depreciation 149,554,304 14,629,849 (1,028,523) 163,155,630
Total capital assets being depreciated, net 238,990,391 (265,217) (401,417) 238,323,757
Governmental activities capital assets, net 274,522,612$ 7,783,205$ (12,362,523)$ 269,943,294$
BUSINESS-TYPE ACTIVITIES
Capital assets, not being depreciated:
Land 11,250,241$ -$ -$ 11,250,241$
Construction in progress 46,392,719 12,346,649 (47,226,329) 11,513,039
Total capital assets not being depreciated 57,642,960 12,346,649 (47,226,329) 22,763,280
Capital assets, being depreciated:
Buildings 96,925,051 408,812 - 97,333,863
Improvements other than buildings 13,788,021 - - 13,788,021
Equipment and vehicles 34,161,392 922,104 (1,053,698) 34,029,798
Sanitary sewer 69,306,285 48,236,334 - 117,542,619
Storm Sewer 22,669,823 1,096,619 - 23,766,442
Streets and roads 1,374,009 - - 1,374,009
Total capital assets being depreciated 238,224,581 50,663,869 (1,053,698) 287,834,752
Less accumulated depreciation for:
Buildings 48,569,870 2,784,569 - 51,354,439
Improvements other than buildings 7,753,334 526,032 - 8,279,366
Equipment and vehicles 23,884,727 2,089,275 (1,034,255) 24,939,747
Sanitary sewer 36,246,337 2,978,261 - 39,224,598
Storm sewer 9,971,645 760,277 - 10,731,922
Streets and roads 119,148 47,483 - 166,631
Total accumulated depreciation 126,545,061 9,185,897 (1,034,255) 134,696,703
Total capital assets,being depreciated, net 111,679,520 41,477,972 (19,443) 153,138,049
Business-type activities capital assets, net 169,322,480$ 53,824,621$ (47,245,772)$ 175,901,329$
The following is a summary of changes in capital assets for the year ended June 30,2014:
NOTES TO FINANCIAL STATEMENTS
JUNE 30, 2014 (CONTINUED)
49

CITY OF DAVENPORT NOTES TO FINANCIAL STATEMENTS JUNE 30, 2014 (CONTINUED)________________________________________________________________________
Depreciation expense was charged to the functions of the primary government as follows: Governmental activities: General government $ 647,989 Community & economic development 25,980 Public works 8,817,034 Public safety 1,797,232 Culture & recreation 2,890,408 Internal service assets are charged to the various functions based on their usage of the assets 451,206 Total depreciation expense-governmental activities $14,629,849
Business-type activities: Parking systems $ 753,777 Sewer operations 4,945,163 RiverCenter 548,171 Public transit 567,449 Public housing 316,697 Golf courses 194,378 Airport 359,767 Solid Waste 461,379 Clean Water Utility 931,623 Rivers Edge 107,493 Total depreciation expense-business-type activities $ 9,185,897
The City has active construction projects as of June 30, 2014. The projects include street construction and improvements, sanitary sewer and water pollution control plant improvements, parks, city wide beautification, and public buildings. At the year end the City’s commitments with contractors are as follows:
Remaining Projects Spent-to-Date Commitment
Streets/Improvements $ 12,608,919 $ $ 5,784,923 Sanitary Sewer/WPCP 12,018,416 2,986,470 Parks 596,301 265,267 Public Buildings 2,329,607 7,608,401 Total $ 27,553,243
$ 16,645,061
The streets and improvements are being financed with state and federal grants along with general obligation bonds, local option sales tax, and road use tax. The sanitary sewers and water pollution control plant improvements are being funded by general obligation bonds being serviced by the Sewer Operations Fund. The City had no significant encumbrances as of June 30, 2014.
50

CITY OF DAVENPORT NOTES TO FINANCIAL STATEMENTS JUNE 30, 2014 (CONTINUED)________________________________________________________________________ 7. EMPLOYEE RETIREMENT SYSTEMS
The City participates in two statewide retirement plans. The Iowa Public Employees Retirement System (IPERS) covers all employees (excluding firefighters and sworn police officers) earning in excess of $300 per quarter. The Municipal Fire and Police Retirement System of Iowa covers firefighters and sworn police officers. The City also makes contributions to specific employee groups’ Section 457 deferred compensation plans as described in Section C following.
A. Iowa Public Employees Retirement System The City of Davenport contributes to IPERS which is a cost-sharing multiple-employer defined benefit pension plan administered by the State of Iowa. IPERS provides retirement and death benefits, which are established by State statute to plan members and beneficiaries. IPERS issues a publicly available financial report that includes financial statements and required supplementary information. The report may be obtained by writing to IPERS, P.O. Box 9117, Des Moines, Iowa 50306-9117. Plan members are required to contribute 5.95% of their annual covered salary and the City is required to contribute 8.93% of annual covered payroll. Contribution requirements are established by State statute. The City’s contributions to IPERS for the years ended June 30, 2014, 2013 and 2012 were $2,667,158, $2,567,903, and $2,514,056 respectively, equal to the required contributions for each year.
B. Municipal Fire and Police Retirement System of Iowa The City of Davenport contributes to MFPRSI which is a cost-sharing multiple-employer defined benefit pension plan administered by a Board of Trustees of the MFPRSI. The plan provides retirement, disability and death benefits, which are established by State statute to plan members and beneficiaries. MFPRSI issues a publicly available financial report that includes financial statements and required supplementary information. The report may be obtained by writing to MFPRSI, 2836 104th Street, Urbandale, Iowa 50322.
MFPRSI Plan members are required to contribute 9.40% of earnable compensation and the City’s contribution rates for the years ended June 30, 2014, 2013 and 2012 were 30.12%, 26.12%, and 24.76%. Contribution requirements are established by State statute. The City’s contributions to the plan for the years ended June 30, 2014, 2013 and 2012 were $6,291,856, $5,329,969, and $5,320,594, respectively, which met the required contributions for each year.
C. 457 Deferred Compensation Contributions The City of Davenport contributes 1% to 8% matches to Police and Fire, Teamsters, Non-bargaining Management and department directors’ 457 deferred compensation plans. The City’s contributions for the years ended June 30, 2014, 2013 and 2012 were $1,912,655, $1,901,498, and $1,811,869 respectively.
51

CITY OF DAVENPORT NOTES TO FINANCIAL STATEMENTS JUNE 30, 2014 (CONTINUED)________________________________________________________________________
8. JOINT VENTURE
The City of Davenport, Iowa and the Board of Trustees of the Rock Island County Metropolitan Mass Transit District (MetroLink), Illinois entered into an agreement in July 1979, which was amended in June 1982, which designates the Quad-City Garage Policy Group (QCGPG) to oversee and operate a joint maintenance and storage facility for transit vehicles and related equipment owned and/or operated by the two parties. Davenport’s authority to enter into this agreement arises from powers granted by Chapter 28E of the Code of Iowa. The City of Davenport and MetroLink have jointly constructed a maintenance facility. The City contributed $542,196 and the MetroLink contributed $362,523. The remainder of the funding was provided by grants from the Federal Transit Administration and the State of Illinois in the amount of $5,495,205. The maintenance facility is recorded as an asset of MetroLink, and not by the QCGPG. The City’s share of the facility is $248,629 as of June 30, 2014. The QCGPG consists of six (6) members, three (3) each representing the City of Davenport and MetroLink. Two members and an alternate are appointed by the Mayor of Davenport, subject to the approval of the Davenport City Council. Two members and an alternate are appointed by the Chairman of the MetroLink Board of Trustees, subject to the approval of the Board of Trustees of the MetroLink. Officers are chosen from the above six (6) members, and there are two voting members each representing the City of Davenport and MetroLink. The facility supervisor, appointed by the parties, prepares an annual budget, which is presented to the parties, or to the QCGPG for their approval. Expenses incurred by the QCGPG are allocated either (a) on the basis of ownership of the facility, or (b) on the basis of the number of buses that the respective parties have in service. The City’s investment as of June 30, 2014 was $185,522. A summary of the latest available financial information for the QCGPG as of June 30, 2014, and for the year then ended is as follows:
Total assets $920,273
Total liabilities $479,142
Total equity $441,131
Total revenue $5,320,962 Total expenses $5,321,112 Net change in fund equity $(150)
The City uses the equity method of accounting for these investments. At June 30, 2014, this amounted to $434,151 which includes the City’s share of both the maintenance facility and the fund equity of the QCGPG. Additional information concerning the QCGPG is available in its separately issued annual report, which may be obtained from the entity’s administrative office 2929 5th Avenue, Rock Island, IL 61201.
52

CITY OF DAVENPORT NOTES TO FINANCIAL STATEMENTS JUNE 30, 2014 (CONTINUED)________________________________________________________________________
9. LONG-TERM DEBT
The following is a summary of changes in long-term debt, including premiums, for the year ended June 30, 2014 (numbers shown in thousands):
Balance Balance Due Within Governmental Activities: June 30,2013 Additions Retirements June 30,2014 One Year Bonds Payable: General Obligation Bonds $ 160,261 $ 25,185 $ (34,701) $ 150,745 $ 15,862 Special Assessment Debt 1,199 - (59) 1,140 - Premium on issuance 4,025 2,405 (709) 5,721 - Total Bonds Payable 165,485 27,590 (35,469) 157,606 15,862 Other post employment benefits payable 3,564 1,065 - 4,629 - Compensated Absences 4,894 4,831 (4,947) 4,778 4,225 Note Payable 311 - - 311 13
$ 174,254 $ 33,486 $ (40,416) $ 167,324 $ 20,100
Business-type Activities: Bonds Payable: General Obligation Bonds $ 43,605 $ 8,890 $ (4,280) $ 48,215 $ 4,438 Premium on issuance 2,329 641 (348) 2,622 - Total Bonds Payable 45,934 9,531 (4,628) 50,837 4,438 Compensated Absences 635 1,270 (1,225) 680 601 Other post employment benefits payable 790 233 - 1,023 - Capital lease - 508 (228) 280 91 Note Payable 9,798 4,625 (215) 14,208 514
$ 57,157 $ 16,167 $ (6,296) $ 67,028 $ 5,644
The City is obligated for the Special Assessment Debt with governmental commitment debt service payments.
Internal service funds predominantly serve governmental funds. Accordingly, long-term liabilities for these funds are included as part of the above totals for governmental activities. At year end $133,807 of internal service funds compensated absences and $127,170 of other post-employment benefits are included in the above amounts. The governmental activities, compensated absences and other post employment benefits are generally liquidated by the fund incurring the expense. The General Fund of the city includes a trust and agency fund that is used to levy taxes to pay for and liquidate benefit obligations.
53

CITY OF DAVENPORT NOTES TO FINANCIAL STATEMENTS JUNE 30, 2014 (CONTINUED)________________________________________________________________________
General obligation bonds payable at June 30, 2014, is comprised of the following individual issues:
Outstanding Balance June 30, 2014
(in thousands of dollars)
A. Matured bonds not presented for payment.
$ 20
B. $1,330,000 2006B Refunding of 1997 Economic Development serial bonds due in annual installments of $95,000 to $150,000 through June 1, 2017; interest at 5.0 percent ($60,000 in principal and interest thereon are being serviced by the Tax Increment Financing Districts Debt Service Fund).
425
C. $14,400,000 2007A Streets, Equipment and Parks serial bonds due in annual installments of $810,000 to $1,280,000 through June 1, 2021; interest at 4.0 to 4.125 percent ($460,000 in principal and interest thereon are being serviced by the Sewer Enterprise Fund).
6,860
D. $3,690,000 2008B Refunding of 2001 Taxable Economic Development, Sewers, Buildings, Equipment and Public Improvements serial bonds due in annual installments of $570,000 to $660,000 through June 1, 2015; interest at 3.0 to 3.5 percent ($890,000 and $60,000 in principal and interest thereon are being serviced by the Sewer Enterprise Fund and Tax Increment Financing Districts Debt Service Fund, respectively).
660
E. $11,230,000 2008C Streets, Sewer, Buildings, Equipment and Park serial bonds due in annual installments of $595,000 to $910,000 through June 1, 2023; interest at 4.0 to 4.5 percent $1,320,000 in principal and interest thereon is being serviced by the Sewer Enterprise Fund.
6,410
F. $3,530,000 2008 General Obligation Economic Development serial bonds due in annual installments of $205,000 to $400,000 through June 1, 2021; interest at 3.5 to 6.2 percent ($3,530,000 principal and interest thereon is being serviced by the TIF increment Financing District Debt Service Fund).
2,365
G. $16,530,000 2009 General Obligation Streets, Buildings, Sewer and Equipment serial bonds due in annual installments of $695,000 to $1,190,000 through June 1, 2024; interest at 3.0 to 4.0 percent ($275,000 principal and interest thereon is being serviced by the Sewer Enterprise Fund).
10,165
54

CITY OF DAVENPORT NOTES TO FINANCIAL STATEMENTS JUNE 30, 2014 (CONTINUED)________________________________________________________________________
H. $7,035,000 2009 General Obligation Economic Development Serial bonds due in
annual installments of $865,000 to $1,350,000 through June 1, 2028; interest at 4.0 to 6.0 percent ($7,035,000 principal and interest thereon is being serviced by the TIF Increment Financing District Debt Service Fund).
5,730
I. $10,125,000 2009C General Obligation Communication Building serial bonds, (Build America Bonds) due in annual installments of $350,000 to $795,000 through June 1, 2029; interest at 2.0 to 5.8 percent.
8,645
J. $20,650,000 2010A General Obligation Streets, Sewer, Equipment and Economic Development serial bonds (Build American Bonds) due in annual installments of $1,110,000 to $1,865,000 through June 1, 2024; interest at .50 to 5.0 percent ($2,099,000 and $1,012,000 principal and interest thereon is being serviced by the Sewer Enterprise Fund and Tax Increment Financing District Debt Service Fund, respectively).
12,860
K. $10,845,000 2010B Refunding of 2001 Streets, Signals, Parks, Equipment, Golf and Parking serial bonds due in annual installments of $645,000 to $1,155,000 through June 1, 2021; interest at 2.0 to 3.37 percent ($1,762,650, $4,298,600 and $666,600 principal and interest thereon is being serviced by the Tax Increment Financing District Debt Service Fund, Parking Enterprise Fund and Municipal Districts Special Revenue Fund, respectively).
5,980
L. $3,870,000 2010C Refunding of 2001 Taxable Parking serial bonds due in annual installments of $275,000 to $435,000 through June 1, 2021; interest at 2.0 to 4.3 percent ($3,870,000 principal and interest thereon is being serviced by the Parking Enterprise Fund).
2,660
M. $33,745,000 2010D General Obligation Streets, Sewer, Cleanwater, Airport, Equipment and Economic Development serial bonds due in annual installments of $1,815,000 to $3,350,000 through June 1, 2025; interest at 2.0 to 4.0 percent ($7,049,000, $692,000, $512,000 and $1,010,000 principal and interest thereon is being serviced by the Sewer Enterprise Fund, Cleanwater Enterprise Fund, Airport Enterprise Fund and Tax Increment Financing District Debt Service Fund, respectively).
22,875
N. $6,005,000 2011A Refunding of 2002 Streets, Buildings, Parks, Equipment and Sewer serial bonds due in annual installments of $875,000 to $1,100,000 through June 1, 2017; interest at 2.0 to 4.0 percent ($2,317,750 principal and interest thereon is being serviced by the Sewer Enterprise Fund).
3,175
O. $31,250,000 2012 General Obligation Streets, Sewers, Buildings, Solid Waste, Clean Water and Equipment serial bonds due in annual installments of $565,000 to $2,700,000 through June 1, 2031; interest at 2.0 to 4.0 percent ($2,034,000, $17,454,000, $406,000 and $1,473,000 in principal and interest thereon are being serviced by the Tax Increment Financing Districts Debt Service Fund, Sewer Enterprise Fund, Solid Waste Enterprise Fund and Clean Water Fund, respectively).
24,520
55
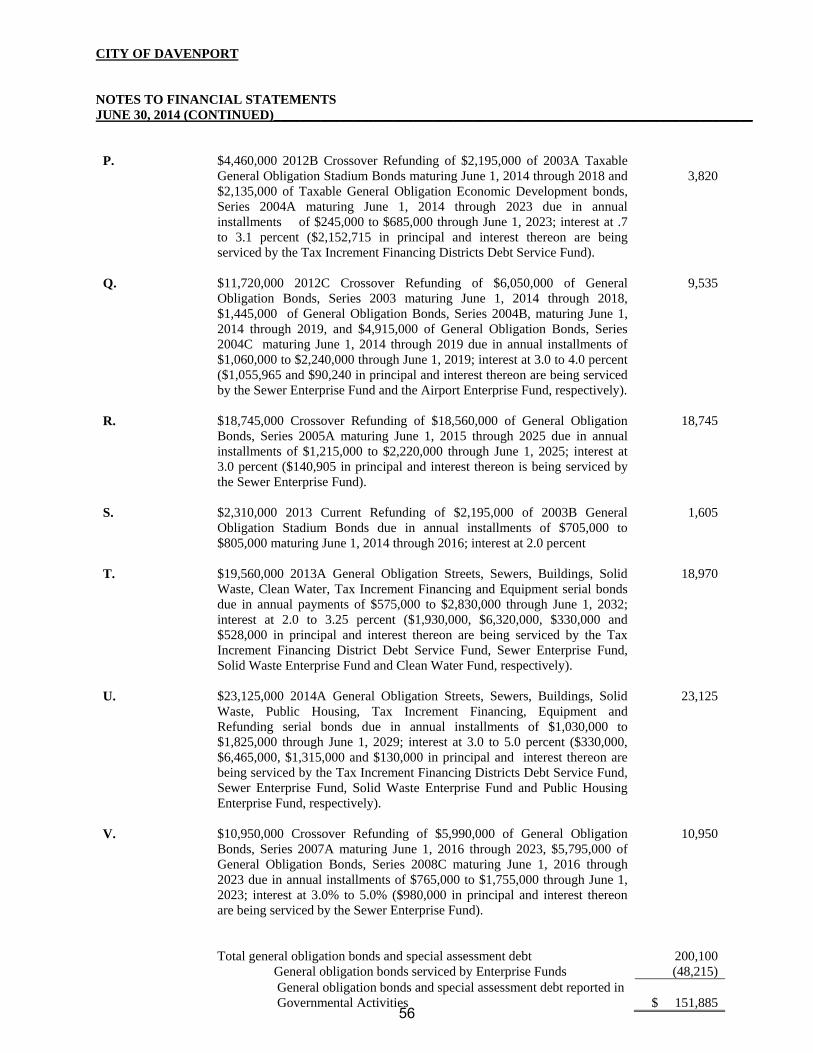
CITY OF DAVENPORT NOTES TO FINANCIAL STATEMENTS JUNE 30, 2014 (CONTINUED)________________________________________________________________________
P.
$4,460,000 2012B Crossover Refunding of $2,195,000 of 2003A Taxable General Obligation Stadium Bonds maturing June 1, 2014 through 2018 and $2,135,000 of Taxable General Obligation Economic Development bonds, Series 2004A maturing June 1, 2014 through 2023 due in annual installments of $245,000 to $685,000 through June 1, 2023; interest at .7 to 3.1 percent ($2,152,715 in principal and interest thereon are being serviced by the Tax Increment Financing Districts Debt Service Fund).
3,820
Q. $11,720,000 2012C Crossover Refunding of $6,050,000 of General Obligation Bonds, Series 2003 maturing June 1, 2014 through 2018, $1,445,000 of General Obligation Bonds, Series 2004B, maturing June 1, 2014 through 2019, and $4,915,000 of General Obligation Bonds, Series 2004C maturing June 1, 2014 through 2019 due in annual installments of $1,060,000 to $2,240,000 through June 1, 2019; interest at 3.0 to 4.0 percent ($1,055,965 and $90,240 in principal and interest thereon are being serviced by the Sewer Enterprise Fund and the Airport Enterprise Fund, respectively).
9,535
R. $18,745,000 Crossover Refunding of $18,560,000 of General Obligation Bonds, Series 2005A maturing June 1, 2015 through 2025 due in annual installments of $1,215,000 to $2,220,000 through June 1, 2025; interest at 3.0 percent ($140,905 in principal and interest thereon is being serviced by the Sewer Enterprise Fund).
18,745
S. $2,310,000 2013 Current Refunding of $2,195,000 of 2003B General Obligation Stadium Bonds due in annual installments of $705,000 to $805,000 maturing June 1, 2014 through 2016; interest at 2.0 percent
1,605
T. $19,560,000 2013A General Obligation Streets, Sewers, Buildings, Solid Waste, Clean Water, Tax Increment Financing and Equipment serial bonds due in annual payments of $575,000 to $2,830,000 through June 1, 2032; interest at 2.0 to 3.25 percent ($1,930,000, $6,320,000, $330,000 and $528,000 in principal and interest thereon are being serviced by the Tax Increment Financing District Debt Service Fund, Sewer Enterprise Fund, Solid Waste Enterprise Fund and Clean Water Fund, respectively).
18,970
U. $23,125,000 2014A General Obligation Streets, Sewers, Buildings, Solid Waste, Public Housing, Tax Increment Financing, Equipment and Refunding serial bonds due in annual installments of $1,030,000 to $1,825,000 through June 1, 2029; interest at 3.0 to 5.0 percent ($330,000, $6,465,000, $1,315,000 and $130,000 in principal and interest thereon are being serviced by the Tax Increment Financing Districts Debt Service Fund, Sewer Enterprise Fund, Solid Waste Enterprise Fund and Public Housing Enterprise Fund, respectively).
23,125
V. $10,950,000 Crossover Refunding of $5,990,000 of General Obligation Bonds, Series 2007A maturing June 1, 2016 through 2023, $5,795,000 of General Obligation Bonds, Series 2008C maturing June 1, 2016 through 2023 due in annual installments of $765,000 to $1,755,000 through June 1, 2023; interest at 3.0% to 5.0% ($980,000 in principal and interest thereon are being serviced by the Sewer Enterprise Fund).
10,950
Total general obligation bonds and special assessment debt General obligation bonds serviced by Enterprise Funds
200,100
(48,215) General obligation bonds and special assessment debt reported in
Governmental Activities
$ 151,885 56

CITY OF DAVENPORT NOTES TO FINANCIAL STATEMENTS JUNE 30, 2014 (CONTINUED)________________________________________________________________________
The City of Davenport’s Capital Improvement Program has been funded in part from general obligation bonds which are intended to be abated by user fees, special assessment collections, municipal improvement district taxes, and levee rents. The debt to be abated by user fees is accounted for in the Enterprise Funds in the amount of $48,214,720. Debt abated by special assessment collections is accounted for in the governmental activities as Special Assessment Debt with Governmental Commitment in the amount of $1,258,511. The debt to be abated by municipal improvement district taxes is accounted for in the governmental activities in the amount of $456,225. These abated bonds, including interest thereon, are included in the above schedule and represent a contingent liability against the City’s full faith and credit. The general credit of the City is obligated only to the extent that user fees, special assessment collections or liens foreclosed against properties involved in the special assessment projects, municipal improvement district taxes, and levee rents are insufficient to retire outstanding bonds. In order to limit the liability of taxpayers, the State Constitution of Iowa imposes a limit on the amount of debt local governments may incur. The City of Davenport’s debt limitation is five (5) percent of its gross assessed valuation. This limitation applies to general obligation indebtedness and Tax Increment Financing agreements entered in to rebate taxes paid over time. At June 30, 2014, the statutory limit for the City was $307,269,293 providing a debt margin of $101,681,943.
The City has entered into an agreement with the Iowa Finance Authority to borrow ten million dollars in the form of the proceeds of the Iowa Finance Authority Taxable Sewer Revenue Build America Bonds Series 2010. The City draws funds from the Iowa Finance Authority as needed for construction of the Westside Diversion Sewer Tunnel project. The note bears interest at 3% with interest payments payable semi annually commencing December 1, 2010. Principal repayment is annually each June 1 commencing June 1, 2012. As of June 30, 2014, the City has drawn all of the loan, except for the final $6,000 that is held until completion of the project. The note is payable solely from the net revenues of the sewer utility. Annual principal and interest payments on the note is expected to require less than 20% of net revenue of the Sewer Utility Fund. The note requires several covenants including maintaining net revenues of the sewer operating of at least 110% of the amount of principal and interest due in revenue bonds in the same year and the completion and issuance of the City’s annual audit within 180 days of year end. The note is expected to be paid as follows:
Year ended June 30 Principal Interest 2015 222,000 281,250 2016 229,000 274,590 2017 237,000 267,720 2018 244,000 260,610 2019 252,000 253,290 2020 – 2024 1,391,000 1,147,830 2025 – 2029 1,633,000 925,170 2030 – 2034 1,916,000 663,750 2035 – 2039 2,247,000 357,150 2040 – 2041 1,004,000 45,420 $ 9,375,000 $ 4,476,780
57

CITY OF DAVENPORT NOTES TO FINANCIAL STATEMENTS JUNE 30, 2014 (CONTINUED)________________________________________________________________________
The City has entered into a second agreement with the Iowa Finance Authority to borrow $7,085,000 in the form of the proceeds of the Iowa Finance Authority Taxable Sewer Revenue Bond Series 2013. The City draws funds from the Iowa Finance Authority as needed for construction of the Westside Diversion Sewer Tunnel project. The note bears interest at 1.75% with interest payments payable semiannually commencing December 1, 2013. Principal repayment is annually each June 1 commencing June 1, 2015. As of 6/30/14, the City had drawn $4,832,982. The note is payable solely from the net revenues of the sewer utility and has the same covenants as the other Iowa Finance Authority note. The note is expected to be paid as follows:
Year ended June 30 Principal Interest 2015 292,000 122,686 2016 297,000 118,877 2017 303,000 113,680 2018 309,000 108,377 2019 316,000 102,970 2020-2024 1,676,000 429,730 2025-2029 1,850,000 277,095 2030-2034 2,042,000 108,658 $ 7,085,000 $ 1,382,073
The City has entered into an agreement with the Iowa Department of Transportation to borrow $310,791 from the Railroad Revolving Loan Program. The City drew the funds from the Iowa Department of Transportation for construction of a new rail spur line to serve the Eastern Iowa Industrial Center. The loan bears interest at 3% with principal and interest payments payable semiannually originally commencing in June 2013. However, the loan agreement is being reworked due to a change in the completion date of the project. The City is not in default and below is an estimated revised debt schedule. The estimated payment schedule is:
Year ended June 30 Principal Interest 2015 $ 13,440 $ 4,662 2016 27,489 8,716 2017 28,320 7,885 2018 29,175 7,029 2019 30,057 6,147 2020-2023 182,310 16,815 $ 310,791 $ 51,254
On March 5, 2014 the City issued $10,950,000 of its General Obligation Refunding Bonds with an average coupon rate of 4.54% to crossover refund $5,990,000 of its General Obligation Bonds dated 2007 with an average coupon rate of 4% and $5,795,000 of its General Obligation Bonds dated 2008 with an average coupon rate of 4.20% . These proceeds are for the future debt service payments of the 2014B Bonds until the crossover date of June 1, 2015. The transactions, balances and liabilities of the escrow account are recorded by the City since the refunded debt Series 2007A and 2008C are not considered extinguished as of June 30, 2014. The City refunded these bonds to reduce its total debt service payments through 2023 by $823,519 and obtain a net economic gain (difference between the present values of the debt service payments on the old and new debt) of $752,378. Also on March 5, 2014, the city issued a current refunding of $365,000 with an average coupon rate of 3% to refund $385,000 of its General Obligation Bonds dated 12/28/2006 with an average coupon rate of 3.65%. The City refunded these bonds to reduce its total debt service payments over the next 3 years by $24,041 and obtain a net economic gain (difference between the present values of the debt service payments on the old and new) of $22,743.
58

CITY OF DAVENPORT NOTES TO FINANCIAL STATEMENTS JUNE 30, 2014 (CONTINUED)________________________________________________________________________
Since 1976, the City has authorized the issuance of $269,190,000 of industrial development revenue bonds under the provision of Chapter 419 of the Code of Iowa. There have not been any industrial development revenue bonds issued since 1993. The bonds and related interest are the sole responsibility of the issuers, and the bond principal and interest do not constitute liabilities of the City. The annual requirements including interest (in thousands of dollars), to service bonds payable are as follows:
Governmental Activities Year General Obligation Bonds Business-type Activities Ending and Special Assessments General Obligation Bonds
June 30 Principal Interest Principal Interest 2015 15,842 6,004 4,438 1,7982016 17,360 5,271 4,560 1,5902017 15,497 4,693 4,608 1,4492018 14,846 4,131 4,314 1,3022019 13,826 3,576 4,234 1,1592020-2024 52,399 10,316 17,746 3,4452025-2029 19,140 2,657 8,315 6382030-2032 2,955 187 - -Totals 151,865 36,835 48,215 11,381Matured 20 2 - -
$ 151,885 $ 36,837 $ 48,215 $ 11,381
10. RISK MANAGEMENT The City is self-insured for the following types of risk exposures: Health Benefits – The City has established an Employee Insurance Fund for insurance benefits provided to City employees and covered dependents, which is included in the Internal Service Fund type. Health benefits were self-insured up to a specific annual stop loss amount of $175,000 per member, and an aggregate annual stop loss amount of approximately $10,726,262 for 2014. Coverage from a private insurance company is maintained for losses in excess of the aggregate stop loss amount. All claims handling procedures are performed by an independent claims administrator. Incurred but not reported claims have been accrued as a liability based upon the claims lag report provided by the third party administrator. No settlements exceeded insurance coverage for the past three fiscal years. There were no significant reductions in insurance coverage during the past year. Based on experience, the claims payable balance of $1,171,766 as of June 30, 2014 is considered current and due within one year. General and Auto Liability, Property, and Workers’ Compensation – The City has established a Risk Management Fund for self-insurance related to general and automobile liability, property, and workers’ compensation claims which is included in the Internal Service Fund type. Self-insurance was in effect up to individual stop loss amounts per occurrence of $500,000 for general and auto liability, $100,000 for property and $2,000,000 for workers’ compensation for 2014. Coverage from private insurers is maintained for losses in excess of the individual stop loss amounts. All claims handling procedures are performed by the risk management division of the finance department. A private attorney specializing in workers’ compensation law is retained to defend workers’ compensation claims filed with the state Workers’ Compensation Commissioner by claimants. Incurred but not reported claims have been accrued as a liability based upon an independent actuarial study. No settlements exceeded insurance coverage for the past three fiscal years. There were no significant reductions in insurance coverage during the past year. Based on experience, $2,949,953 of the claims payable as of June 30, 2014 is considered current and due within one year.
59

CITY OF DAVENPORT NOTES TO FINANCIAL STATEMENTS JUNE 30, 2014 (CONTINUED)________________________________________________________________________
Changes in reported liabilities for the fiscal years ended June 30, 2013 and 2014 are summarized as follows:
Employee Risk Insurance Management Fund Fund Total Liabilities at June 30, 2012 $ 1,187,852 $ 6,024,139 $ 7,211,991 Claims and changes in estimates during fiscal year 2013 10,635,835 1,802,519 12,438,354 Claim payments (11,015,712) (1,535,163) (12,550,875)Liabilities at June 30, 2013 $ 807,975 $ 6,291,495 $ 7,099,470 Claims and changes in estimates during fiscal year 2014 10,799,635 2,559,413 13,359,048 Claim payments (10,435,844) (2,705,172) (13,141,016) Liabilities at June 30, 2014 1,171,766 $ 6,145,736 $ 7,317,502
11. INDIVIDUAL FUND DISCLOSURES The Risk Management internal service fund has a deficit unrestricted net position balance of $994,582 as of June 30, 2014. The Miscellaneous grant non-major governmental fund has a deficit balance of $344,161 as of June 30, 2014, due to deferred inflows of resources. Deficits in the internal service fund will be addressed through future premiums and charges for services. Deficits in the non-major governmental fund will be addressed through future grant revenue.
12. OTHER POST EMPLOYMENT BENEFITS (OPEB) Plan description: The City sponsors a single-employer health care plan that provides a continuation option to retirees to purchase health benefits under the City’s group health plan. The plan does not issue a stand alone financial report. Employees who have attained age 55 and have fifteen or more years of service with the City, or qualify for normal retirement as defined by IPERS, or qualify for normal retirement as defined by MFPRSI or are granted retiree status pursuant to a separation agreement with the City are eligible for retiree benefits. Eligible retirees and their dependents may purchase medical, prescription drug and dental insurance through the City’s self-insured plan. Retirees pay 100% of the group rate calculated on the expected costs based on the entire group of actives, COBRA participants, and retirees. Funding Policy: The current funding policy of the City is to pay health claims as they occur. This arrangement does not qualify as other post employment benefits (OPEB) plan assets under Governmental Accounting Standards Board (GASB) Statement No. 45 for current GASB reporting. The City establishes and amends contributions requirements annually. The required contribution is based on projected pay-as-you-go financing. The source of payment is the fund that pays the benefits for the current employees; either the General Fund or a proprietary fund. For fiscal year 2014, the City contributed $118,728. Retirees receiving benefits contributed $557,557 through their required contribution of $703.09 per month for single health coverage and $1,559.49 per month for family health coverage.
Annual OPEB Cost and Net OPEB obligation: The City’s annual OPEB cost (expense) is calculated based on the annual required contribution (ARC) of the employer, an amount actuarially determined in accordance with the parameters of the GASB Statement No. 45. The ARC represents a level of funding that, if paid on an ongoing basis, is projected to cover the normal cost each year and amortize any unfunded actuarial liabilities over a period
60
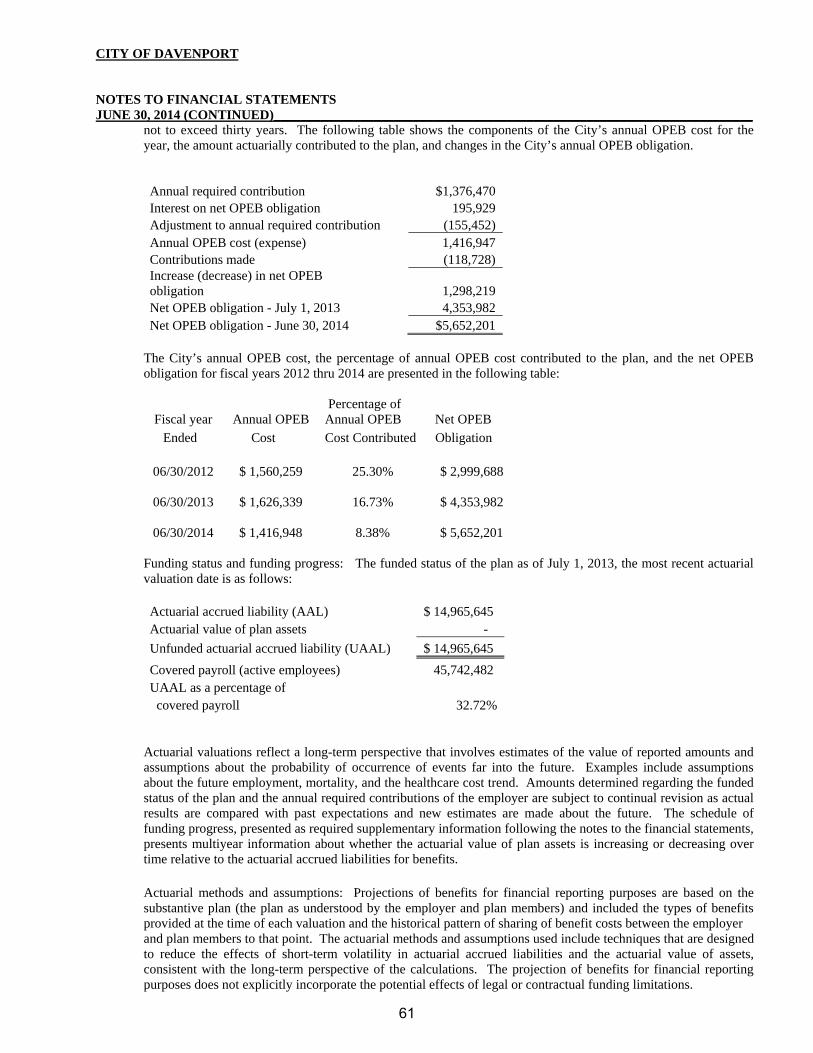
CITY OF DAVENPORT NOTES TO FINANCIAL STATEMENTS JUNE 30, 2014 (CONTINUED)________________________________________________________________________
not to exceed thirty years. The following table shows the components of the City’s annual OPEB cost for the year, the amount actuarially contributed to the plan, and changes in the City’s annual OPEB obligation.
Annual required contribution
$1,376,470 Interest on net OPEB obligation 195,929 Adjustment to annual required contribution (155,452) Annual OPEB cost (expense) 1,416,947 Contributions made (118,728) Increase (decrease) in net OPEB obligation 1,298,219 Net OPEB obligation - July 1, 2013 4,353,982 Net OPEB obligation - June 30, 2014 $5,652,201
The City’s annual OPEB cost, the percentage of annual OPEB cost contributed to the plan, and the net OPEB obligation for fiscal years 2012 thru 2014 are presented in the following table:
Fiscal year Annual OPEB Percentage of Annual OPEB Net OPEB
Ended Cost Cost Contributed Obligation 06/30/2012 $ 1,560,259 25.30% $ 2,999,688
06/30/2013 $ 1,626,339 16.73% $ 4,353,982
06/30/2014 $ 1,416,948 8.38% $ 5,652,201
Funding status and funding progress: The funded status of the plan as of July 1, 2013, the most recent actuarial valuation date is as follows: Actuarial accrued liability (AAL) $ 14,965,645 Actuarial value of plan assets -
Unfunded actuarial accrued liability (UAAL) $ 14,965,645
Covered payroll (active employees) 45,742,482 UAAL as a percentage of covered payroll 32.72%
Actuarial valuations reflect a long-term perspective that involves estimates of the value of reported amounts and assumptions about the probability of occurrence of events far into the future. Examples include assumptions about the future employment, mortality, and the healthcare cost trend. Amounts determined regarding the funded status of the plan and the annual required contributions of the employer are subject to continual revision as actual results are compared with past expectations and new estimates are made about the future. The schedule of funding progress, presented as required supplementary information following the notes to the financial statements, presents multiyear information about whether the actuarial value of plan assets is increasing or decreasing over time relative to the actuarial accrued liabilities for benefits. Actuarial methods and assumptions: Projections of benefits for financial reporting purposes are based on the substantive plan (the plan as understood by the employer and plan members) and included the types of benefits provided at the time of each valuation and the historical pattern of sharing of benefit costs between the employer and plan members to that point. The actuarial methods and assumptions used include techniques that are designed to reduce the effects of short-term volatility in actuarial accrued liabilities and the actuarial value of assets, consistent with the long-term perspective of the calculations. The projection of benefits for financial reporting purposes does not explicitly incorporate the potential effects of legal or contractual funding limitations.
61

CITY OF DAVENPORT NOTES TO FINANCIAL STATEMENTS JUNE 30, 2014 (CONTINUED)________________________________________________________________________
The actuarial calculations were performed in accordance with the entry age normal cost method as of the July 1, 2013 valuation date. The actuarial assumptions included a 4.5 percent discount rate, a wage inflation component of 4.0%, an annual health care cost trend rate of 8.0 percent reduced by decrements of .50 percent annually to an ultimate rate of 4.5 percent. The UAAL is amortized over the maximum acceptable period of 30 years as a level percentage of projected payroll on an open basis.
13. FUND BALANCE
Fund balances, presented in the governmental fund financial statements, represent the difference between assets and liabilities reported in a governmental fund. GASB Statement No. 54, Fund Balance Reporting and Governmental Fund Type Definitions, establishes criteria for classifying fund balances into specifically defined classifications and clarifies definitions for governmental funds. The Statement requires that the fund balances be classified into categories based upon the type of constraints imposed on the use of funds. The City of Davenport evaluated each of its funds at June 30, 2014 and classified fund balances into the following five categories: Nonspendable – items that cannot be spent because they are not in spendable form, such as prepaid items. Restricted – items that are restricted by external parties such as creditors or imposed by grants, laws or enabling legislation. The city has legal restrictions on amounts collected by property tax levies, on forfeiture/seizure collections and on unspent bond proceeds. The City has restrictions by grantors for the balance of program income. Committed – items that have been committed by formal action by the entity’s “highest level of decision-making authority”, which are City Council resolutions. The commitment of fund balances took place on May 18, 2011. Those committed amounts cannot be used for any other purpose unless the City Council removes or changes the specified use by taking the same action it employed to commit those amounts. Assigned – items the Chief Financial Officer assigns as specific projects or purposes have been identified, as the City’s fund balance policy states. This power was granted by the City Council on May 18, 2011. Unassigned – any balances that have no restrictions on them. The General Fund is the only fund that would report a positive amount in unassigned fund balance. Residual deficit amounts of other governmental funds would also be reported as unassigned. The City of Davenport spends restricted fund balance first, followed by committed, assigned and unassigned fund balance. The City’s policy on fund balance of the general fund, excluding the other specific-use funds, is that the unassigned fund balance will be maintained at 10 to 15 percent of the operating requirements. The current fund balance is within policy guidelines.
62

CITY OF DAVENPORT NOTES TO FINANCIAL STATEMENTS JUNE 30, 2014 (CONTINUED)________________________________________________________________________
Fund Balances:
General Fund
Major Special Revenue Local Option Sales Tax Fund
Major Debt Service Fund
Major Capital Projects Fund
Non Major Special Revenue Funds
Non Major Debt Service Fund
Total
Nonspendable: Prepaids
$ 5,440
$ -
$ -
$ -
$ 5,868 $ -
$ 11,308
Restricted for: Tort 1,433,279 - - - - - 1,433,279 Debt Service - - 13,384,755 - - 3,229,772 16,614,527 Capital Projects - - - 15,164,394 - - 15,164,394 Police Non-recurring
973,492
-
-
-
- -
973,492
Library 873,040 - - - - - 873,040 Employee Benefits
2,719,630
-
-
-
- -
2,719,630
Community Development Block Grant Projects
-
-
-
-
146,664 -
146,664 HUD Section 8 Rents
-
-
-
-
169,222 -
169,222
Municipal Improvement Projects
-
-
-
-
478,048
-
478,048 Home Investment Partnership Projects
-
-
-
-
5 -
5 Road Use Tax project
-
-
-
-
490,828 -
490,828
Local Option Sales Tax
-
4,466,397
-
-
- -
4,466,397
Committed for: Levee Improvement Commission Projects
-
-
-
-
142,953 -
142,953 Revolving Loans - - - - 1,041,456 - 1,041,456 Assigned for: Library projects 176,323 - - - - - 176,323 Police projects 18,738 - - - - - 18,738 Parks projects 4,313 - - - - - 4,313 Reforestation 80,622 - - - - - 80,622 RiverCenter projects
218,104
-
-
-
- -
218,104
Flood Project 246,660 - - - - - 246,660 Parks Special Needs Program
34,096
-
-
-
- -
34,096
Unassigned: 8,536,778 - - - (344,161) - 8,192,617 Total Fund Balances:
$15,320,515
$ 4,466,397
$13,384,755
$15,164,394
$ 2,130,883 $ 3,229,772
$ 53,696,716
63

CITY OF DAVENPORT NOTES TO FINANCIAL STATEMENTS JUNE 30, 2014 (CONTINUED)________________________________________________________________________ 14. RECENTLY ISSUED PRONOUNCEMENTS
The Governmental Accounting Standard Board (GASB) has issued three statements not yet implemented by the City of Davenport. The City has not yet determined the impact of the statements not yet implemented. The statements, which may impact the City of Davenport, are as follows:
GASB Statement No. 68, Accounting and Financial Reporting for Pensions, issued June 2012, will be effective for the City beginning with its year ending June 30, 2015. This Statement replaces the requirements of GASB Statement No. 27, Accounting for Pensions by State and Local Governmental Employers, and GASB Statement No. 50, Pension Disclosures, as they relate to governments that provide pensions through pension plans administered as trusts or similar arrangements that meet certain criteria. This Statement requires governments providing defined benefit pensions to recognize their long-term obligation for pension benefits as a liability for the first time, and to more comprehensively and comparably measure the annual costs of pension benefits. This Statement also enhances accountability and transparency through revised and new note disclosures and required supplementary information.
GASB Statement No. 69, Government Combinations and Disposals of Government Operations, issued January 2013, will be effective for the City beginning with its year ending June 30, 2015. This Statement establishes accounting and financial reporting standards related to government combinations and disposals of government operations. This Statement provides guidance for: determining whether a specific government combination is a government merger, a government acquisition, or a transfer of operations; using carrying values (generally, the amounts recognized in the pre-combination financial statements of the combining governments or operations) to measure the assets, deferred outflows of resources, liabilities, and deferred inflows of resources combined in a government merger or transfer of operations; measuring acquired assets, deferred outflows of resources, liabilities, and deferred inflows of resources based upon their acquisition values in a government acquisition; and reporting the disposal of government operations that have been transferred or sold.
GASB Statement No. 71, Pension Transition for Contributions Made Subsequent to the Measurement Date—an amendment of GASB Statement No. 68, issued November 2013, will be effective for the City beginning with its year ending June 30, 2015. This Statement eliminates a potential source of understatement of restated beginning net position and expense in a government’s first year of implementing GASB Statement No. 68, Accounting and Financial Reporting for Pensions. To correct this potential understatement, Statement 71 requires a state or local government, when transitioning to the new pension standards, to recognize a beginning deferred outflow of resources for its pension contributions made during the time between the measurement date of the beginning net pension liability and the beginning of the initial fiscal year of implementation. This amount will be recognized regardless of whether it is practical to determine the beginning amounts of all other deferred outflows of resources and deferred inflows of resources related to pensions.
64

65

Required Supplementary Information
GOVERNMENTAL
FUNDS ACTUAL
PROPRIETARY
FUNDS
ACTUAL
TOTAL
ACTUAL
REVENUES:
Taxes 90,421,947$ 3,646,576$ 94,068,523$
Special assessments 96,245 - 96,245
Licenses and permits 1,749,752 - 1,749,752
Intergovernmental 25,530,812 3,378,211 28,909,023
Charges for services 4,051,619 51,316,382 55,368,001
Use of monies and property 1,176,460 634,865 1,811,325
Fines and forfeits 1,931,967 75,650 2,007,617
Loan repayments 1,065,290 - 1,065,290
Other 4,108,428 1,950,494 6,058,922
Total Revenues 130,132,520 61,002,178 191,134,698
EXPENDITURES:
Current:
Public safety 41,216,850 - 41,216,850
Public works 17,557,791 - 17,557,791
Culture and recreation 11,281,713 - 11,281,713
Community and economic development 13,853,663 - 13,853,663
General government 8,820,719 - 8,820,719
Capital outlay 15,247,456 - 15,247,456
Debt service:
Principal retirement 16,024,785 - 16,024,785
Interest 6,101,313 - 6,101,313
Bond issuance costs 249,658 - 249,658
Business type activities - 52,591,898 52,591,898
130,353,948 52,591,898 182,945,846
EXCESS (DEFICIENCY) OF REVENUES
OVER EXPENDITURES (221,428) 8,410,280 8,188,852
OTHER FINANCING SOURCES (USES), NET 7,112,092 1,760,859 8,872,951
EXCESS (DEFICIENCY) OF REVENUES
OVER EXPENDITURES AND OTHER
FINANCING USES 6,890,664 10,171,139 17,061,803
BALANCES BEGINNING OF YEAR, 46,806,052 19,490,592 66,296,644
BALANCES END OF YEAR 53,696,716$ 29,661,731$ 83,358,447$
See note to Required Supplementary Information
CITY OF DAVENPORT
GOVERNMENTAL AND PROPRIETARY FUNDS
SCHEDULE OF REVENUES, EXPENDITURES, AND CHANGES IN FUND BALANCES-
For the Fiscal Year Ended June 30, 2014
BUDGET AND ACTUAL (BUDGETARY BASIS)
66

ORIGINAL FINAL
FINAL TO
ACTUAL
VARIANCE
92,643,484$ 92,634,580$ 1,433,943$
53,500 53,500 42,745
1,395,200 1,395,200 354,552
21,785,536 67,281,832 (38,372,809)
56,606,192 56,895,192 (1,527,191)
1,247,040 1,294,190 517,135
1,655,000 1,655,000 352,617
1,157,275 1,157,275 (91,985)
73,891,364 96,468,110 (90,409,188)
250,434,591 318,834,879 (127,700,181)
42,215,051 42,957,558 1,740,708
18,934,442 19,286,207 1,728,416
11,336,272 11,871,322 589,609
12,045,835 19,648,964 5,795,301
9,268,307 9,435,289 614,570
31,960,770 81,201,019 65,953,563
21,549,669 34,374,785 18,350,000
688,131 6,101,312 (1)
- 249,658 -
59,180,590 61,121,407 8,529,509
207,179,067 286,247,521 103,301,675
43,255,524 32,587,358 (24,398,506)
(43,038,232) (48,710,374) 57,583,325
217,292 (16,123,016) 33,184,819
59,741,672 66,296,642 2
59,958,964$ 50,173,626$ 33,184,821$
BUDGETED AMOUNTS
67

CITY OF DAVENPORT
NOTES TO REQUIRED SUPPLEMENTARY INFORMATION-BUDGETARY REPORTING
JUNE 30, 2014
In accordance with the Code of Iowa, the City Council annually adopts a budget following required public
notice and hearing for all funds. The City’s governmental fund types are budgeted on a modified accrual basis
of accounting in conformance with the accounting principles generally accepted in the United States of America
(GAAP). Proprietary fund types are budgeted on full accrual basis, except bond proceeds, which are budgeted
on a modified accrual basis, and depreciation, incurred but not reported insurance claims, loss on disposal, joint
venture adjustment and capital contributions which are not budgeted. The annual budget may be amended
during the year utilizing similar statutorily prescribed procedures. Budget amendments are reflected in the final
budgeted amounts.
Formal and legal budgetary control is based upon 8 major classes of expenditures known as functions, not by
fund or fund type. These 8 functions are: public safety, public works, culture and recreation, community and
economic development, general government, debt service, capital projects, and business type activities.
Function expenditures required to be budgeted include expenditures for General Fund, Special Revenue Funds,
Debt Service Fund, Capital Projects Fund, Internal Service and Enterprise Funds. Although the budget
document presents function expenditures by fund, the legal level of control is at the aggregated function level,
not by fund. During the year a budget amendment increased budgeted expenditures by $79,068,454. The
budget amendment is reflected in the final budgeted amounts.
Budgetary Adjusted
Basis Adjustments Basis
Revenues $
191,134,698
-
$
191,134,698
Expenditures/expenses
182,945,846
9,637,103
192,582,949
Net
8,188,852
(9,637,103)
(1,448,251)
Other financing sources, net
8,872,951 3,937,398
12,810,349
Beginning fund balance/ net position
66,296,643
115,422,442
181,719,085
Ending fund balance/ net position $
83,358,446
$
109,722,737
$
193,081,183
68

Fiscal
Year
Ended
Actuarial
Valuation
Date
Actuarial
Value of
Assets (a)
Actuarial Accrued
Liability (b)
Unfunded
UAAL
(b-a)
Funded
Ratio
(a/b)
Covered Payroll
( c )
UAAL as a
Percentage of
Covered Payroll
((B-a)/c)
2011 7/1/2009 - 16,953,953 16,953,953 - 45,639,232 37.15%
2012 7/1/2011 - 13,492,482 13,492,482 - 47,559,240 28.37%
2013 7/1/2011 - 13,492,482 13,492,482 - 45,228,587 29.83%
2014 7/1/2013 - 14,965,645 14,965,645 - 45,742,482 32.72%
The information presented in the required supplementary schedule was determined as part of the actuarial
valuation as of July 1, 2013. Additional information follows:
a. The cost method used to determine the ARC is the entry age normal cost method.
b. There are no plan assets.
c. Economic assumptions are as follows: health care cost trend rates of 4.5-8.0 percent; discount rate 4.5 percent,
wage inflation component of 4.0%.
d. The amortization method is open basis as a level percentage of projected payroll.
For the Fiscal Year Ended June 30, 2014
Required Supplementary Information
CITY OF DAVENPORT
OTHER POSTEMPLOYMENT BENEFIT PLAN
SCHEDULE OF FUNDING PROGRESS
69

70
COMBINING STATEMENTS, AND SCHEDULES

Non - Major Governmental Funds Road Use Tax Fund – Accounts for the revenue received from the State of Iowa Road Use Tax Fund, which is collected from motor vehicle registration, fuel tax and use tax, and related expenditures, which must relate to the construction, maintenance and supervision of public streets. Community Development Act Fund – Accounts for expenditures relating to neighborhood improvements benefiting low and moderate income persons and economic development activities, which are reimbursed by the Federal Government under the Community Development Block Grant Program. HUD Section 8 Fund – Accounts for expenditures to landlords under a federally funded rent subsidy program. Levee Improvement Commission Fund – Accounts for the expenditure of rents received for the use of the Mississippi Riverfront property. Municipal Improvement Districts Fund – Accounts for revenue generated by Self-supported Municipal Improvement Districts. Revolving Loans Fund – Accounts for various Community and Economic Development revolving loans. Home Investment Partnership Fund – Accounts for expenditures related to the rehabilitation or new construction of rental units, and the rehabilitation of first time homebuyer owner/occupied residential units. Miscellaneous Grants – Accounts for the expenditures of U.S. Department of Housing and Urban Development cooperative agreement awarded for the purpose of educating and promoting fair housing practices, a Neighborhood Stabilization grant, lead based paint removal and education, a supplemental Community Development Block Grant from the Iowa Department of Economic Development and a Staffing for Adequate Fire and Emergency Response Grant. Tax Increment Financing (TIF) Districts Debt Service Fund – Accounts for the accumulation of resources for and the payment of principal and interest on general obligation debt representing the financing source for the City’s various tax increment financing districts. Property tax revenue generated on increased assessed valuation within the TIF Districts are the resources accounted for in this fund.
71
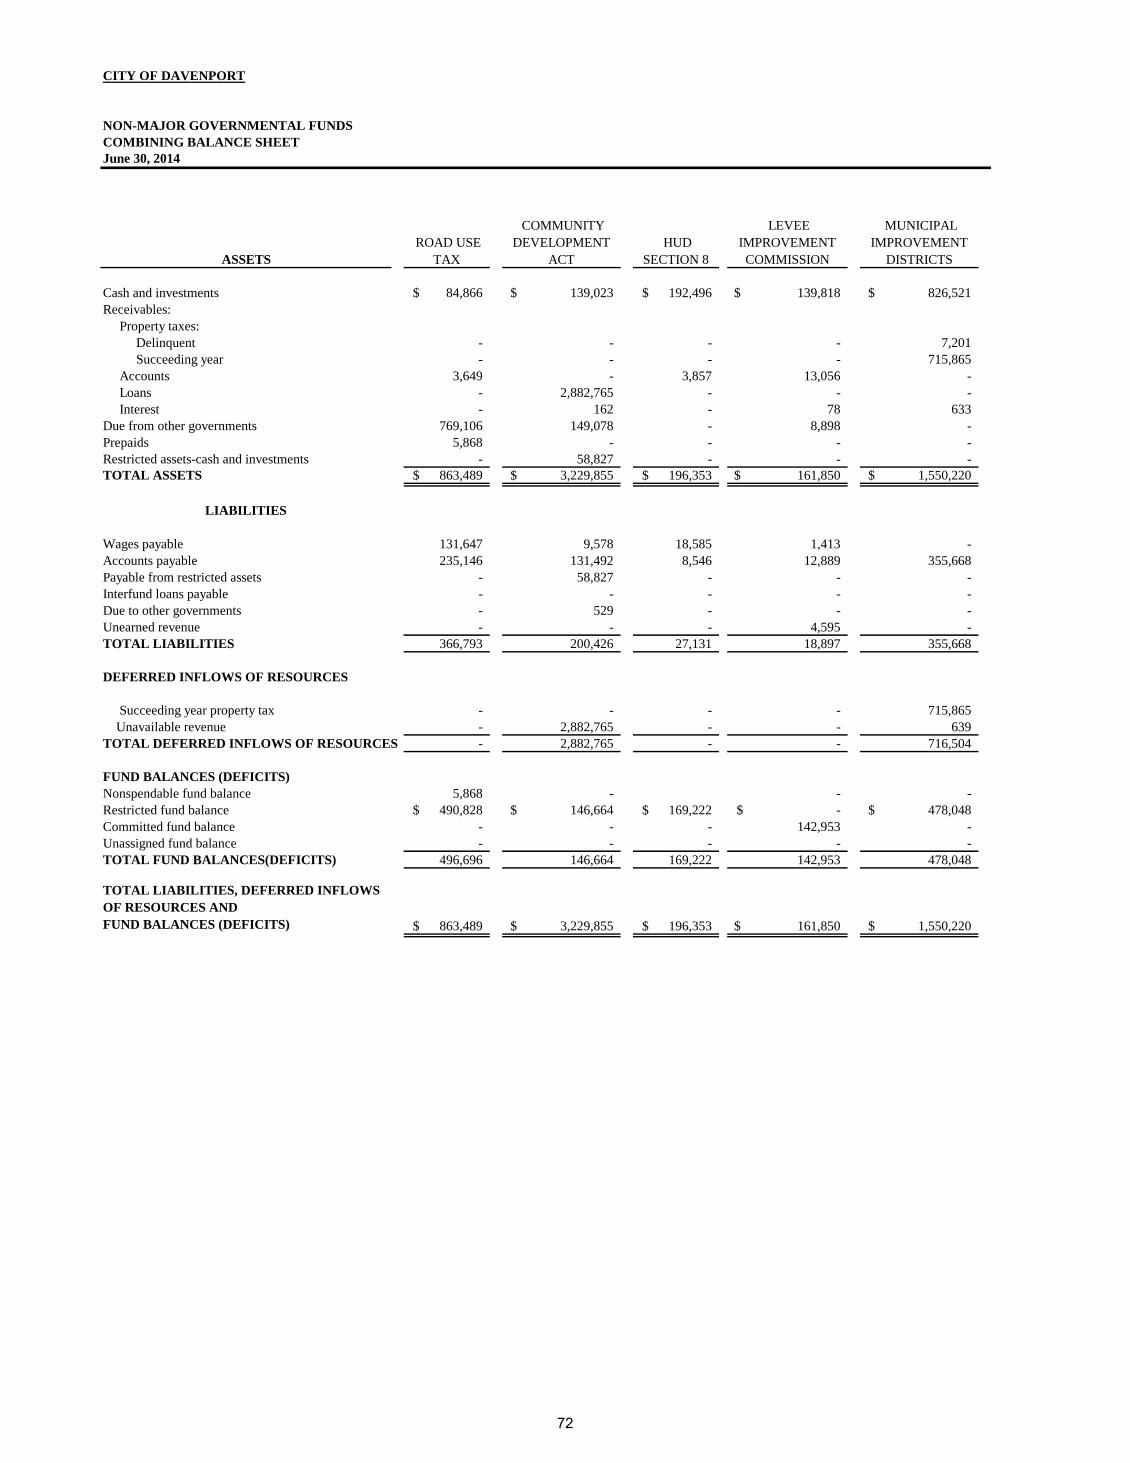
CITY OF DAVENPORT
COMBINING BALANCE SHEET
ASSETS
ROAD USE
TAX
COMMUNITY
DEVELOPMENT
ACT
HUD
SECTION 8
LEVEE
IMPROVEMENT
COMMISSION
MUNICIPAL
IMPROVEMENT
DISTRICTS
Cash and investments 84,866$ 139,023$ 192,496$ 139,818$ 826,521$
Receivables:
Property taxes:
Delinquent - - - - 7,201
Succeeding year - - - - 715,865
Accounts 3,649 - 3,857 13,056 -
Loans - 2,882,765 - - -
Interest - 162 - 78 633
Due from other governments 769,106 149,078 - 8,898 -
Prepaids 5,868 - - - -
Restricted assets-cash and investments - 58,827 - - -
TOTAL ASSETS 863,489$ 3,229,855$ 196,353$ 161,850$ 1,550,220$
LIABILITIES
Wages payable 131,647 9,578 18,585 1,413 -
Accounts payable 235,146 131,492 8,546 12,889 355,668
Payable from restricted assets - 58,827 - - -
Interfund loans payable - - - - -
Due to other governments - 529 - - -
Unearned revenue - - - 4,595 -
TOTAL LIABILITIES 366,793 200,426 27,131 18,897 355,668
DEFERRED INFLOWS OF RESOURCES
Succeeding year property tax - - - - 715,865
Unavailable revenue - 2,882,765 - - 639
TOTAL DEFERRED INFLOWS OF RESOURCES - 2,882,765 - - 716,504
FUND BALANCES (DEFICITS)
Nonspendable fund balance 5,868 - - -
Restricted fund balance 490,828$ 146,664$ 169,222$ -$ 478,048$
Committed fund balance - - - 142,953 -
Unassigned fund balance - - - - -
TOTAL FUND BALANCES(DEFICITS) 496,696 146,664 169,222 142,953 478,048
TOTAL LIABILITIES, DEFERRED INFLOWS
OF RESOURCES AND
FUND BALANCES (DEFICITS) 863,489$ 3,229,855$ 196,353$ 161,850$ 1,550,220$
NON-MAJOR GOVERNMENTAL FUNDS
June 30, 2014
72

REVOLVING
LOANS
HOME
INVESTMENT
PARTNERSHIP
MISCELLANEOUS
GRANTS
TAX
INCREMENT
FINANCING
DISTRICTS
DEBT SERVICE
TOTAL
NON-MAJOR
GOVERNMENTAL
FUNDS
1,106,274$ -$ 30,809$ 1,341,713$ 3,861,520$
- - - 66,150 73,351
- - - 5,050,892 5,766,757
- - - - 20,562
1,364,801 9,000,311 222,150 1,820,126 15,290,153
612 - - 1,866 3,351
- 47,353 745,239 - 1,719,674
- - - 5,868
- - - - 58,827
2,471,687$ 9,047,664$ 998,198$ 8,280,747$ 26,800,063$
- 484 9,161 - 170,868
65,430 810 289,314 - 1,099,295
- - - - 58,827
- 46,055 375,847 - 421,902
- - - - 529
1,364,801 9,000,310 222,150 - 10,591,856
1,430,231 9,047,659 896,472 - 12,343,277
- - - 5,050,892 5,766,757
- - 445,887 83 3,329,374
- - 445,887 5,050,975 9,096,131
- - - - 5,868
-$ 5$ - 3,229,772$ 4,514,539$
1,041,456 - - - 1,184,409
- - (344,161) - (344,161)
1,041,456 5 (344,161) 3,229,772 5,360,655
2,471,687$ 9,047,664$ 998,198$ 8,280,747$ 26,800,063$
73

CITY OF DAVENPORT
ROAD USE TAX
COMMUNITY
DEVELOPMENT
ACT HUD SECTION 8
LEVEE
IMPROVEMENT
COMMISSION
MUNICIPAL
IMPROVEMENT
DISTRICTS
REVENUES:
Taxes -$ -$ -$ -$ 1,347,801$
Licenses and permits 70,021 - - - -
Intergovernmental 9,906,674 1,049,367 3,492,502 44,555 -
Use of monies and property - 57,209 - 208,677 2,069
Loan repayments - 455,239 - - -
Other 1,293,441 - 10,568 144,976 -
Total Revenues 11,270,136 1,561,815 3,503,070 398,208 1,349,870
EXPENDITURES:
Current:
Public safety - - - - -
Public works 11,260,754 - - - -
Community and economic
development - 1,618,389 3,583,589 353,768 1,653,010
General government - - - - -
Debt service:
Principal retirement - - - - 54,275
Interest - - - - 14,277
Total Expenditures 11,260,754 1,618,389 3,583,589 353,768 1,721,562
EXCESS (DEFICIENCY) OF REVENUES
OVER EXPENDITURES 9,382 (56,574) (80,519) 44,440 (371,692)
OTHER FINANCING SOURCES
(USES):
Premium on debt issued - - - - -
Transfers in - - 215,169 46,000 -
Transfers out (22,102) - - (52,500) -
Total Other Financing
Sources (Uses) (22,102) - 215,169 (6,500) -
NET CHANGE IN FUND BALANCES (12,720) (56,574) 134,650 37,940 (371,692)
FUND BALANCES (DEFICITS) - BEGINNING 509,416 203,238 34,572 105,013 849,740
FUND BALANCES (DEFICITS) - ENDING 496,696$ 146,664$ 169,222$ 142,953$ 478,048$
NON-MAJOR GOVERNMENTAL FUNDS
COMBINING STATEMENT OF REVENUES, EXPENDITURES, AND CHANGES IN FUND BALANCES (DEFICITS)
For the Fiscal Year Ended June 30, 2014
74

REVOLVING
LOANS
HOME
INVESTMENT
PARTNERSHIP
MISCELLANEOUS
GRANTS
TAX
INCREMENT
FINANCING
DISTRICTS
DEBT
SERVICE
TOTAL
NON-MAJOR
GOVERNMENTAL
FUNDS
-$ -$ -$ 4,542,950$ 5,890,751$
- - - - 70,021
- 172,434 3,544,444 - 18,209,976
13,424 75,787 6,239 10,814 374,219
62,218 366,460 95,133 - 979,050
156,732 3,000 - 7,426 1,616,143
232,374 3,000 3,645,816 4,561,190 27,140,160
- - 69,148 - 69,148
- - - - 11,260,754
188,937 646,572 3,223,354 1,039,395 12,307,014
- - 97,226 - 97,226
- - - 1,820,350 1,874,625
- - - 712,684 726,961
188,937 646,572 3,389,728 3,572,429 26,335,728
43,437 (28,891) 256,088 988,761 804,432
- - - 35,301 35,301
- - - 100,224 361,393
- - - (275,000) (349,602)
- - - (139,475) 47,092
43,437 (28,891) 256,088 849,286 851,524
998,019 28,896 (600,249) 2,380,486 4,509,131
1,041,456$ 5$ (344,161)$ 3,229,772$ 5,360,655$
NON-MAJOR GOVERNMENTAL FUNDS
COMBINING STATEMENT OF REVENUES, EXPENDITURES, AND CHANGES IN FUND BALANCES (DEFICITS)
75

76

Non-Major Enterprise Funds Public Housing Fund – Accounts for revenue and expenses associated with the Heritage High-Rise housing facility for the elderly, handicapped and disabled and for the Public Housing units for the low-income families. A Federal Housing and Urban Development (HUD) subsidy provides support for the Heritage High-Rise. Golf Course Fund – Accounts for revenue and expenses associated with operation of the City’s three golf courses, Duck Creek, Emeis, and Red Hawk. Airport Fund – Accounts for revenue and expenses associated with operation of the Davenport Airport, a reliever airport for the Quad City Airport. Rental income is obtained from the leasing of surrounding farmland, as well as hangar spaces at the airport. Public Transit Fund – Accounts for revenue and expenses associated with the City’s fixed route transit system, demand response transit and the ground transportation terminal, known as the TransitCenter. Revenue is generated mainly from a transit property tax, federal and state operating and capital grants, user fees, and miscellaneous rentals at the TransitCenter. Solid Waste Fund – Accounts for revenue and expenses associated with the City’s collection of solid waste, bulky waste, yard waste and curbside recycling programs. River’s Edge Fund – Accounts for revenue and expenses associated with operating an indoor sports facility that offers both an indoor ice rink and soccer field.
77
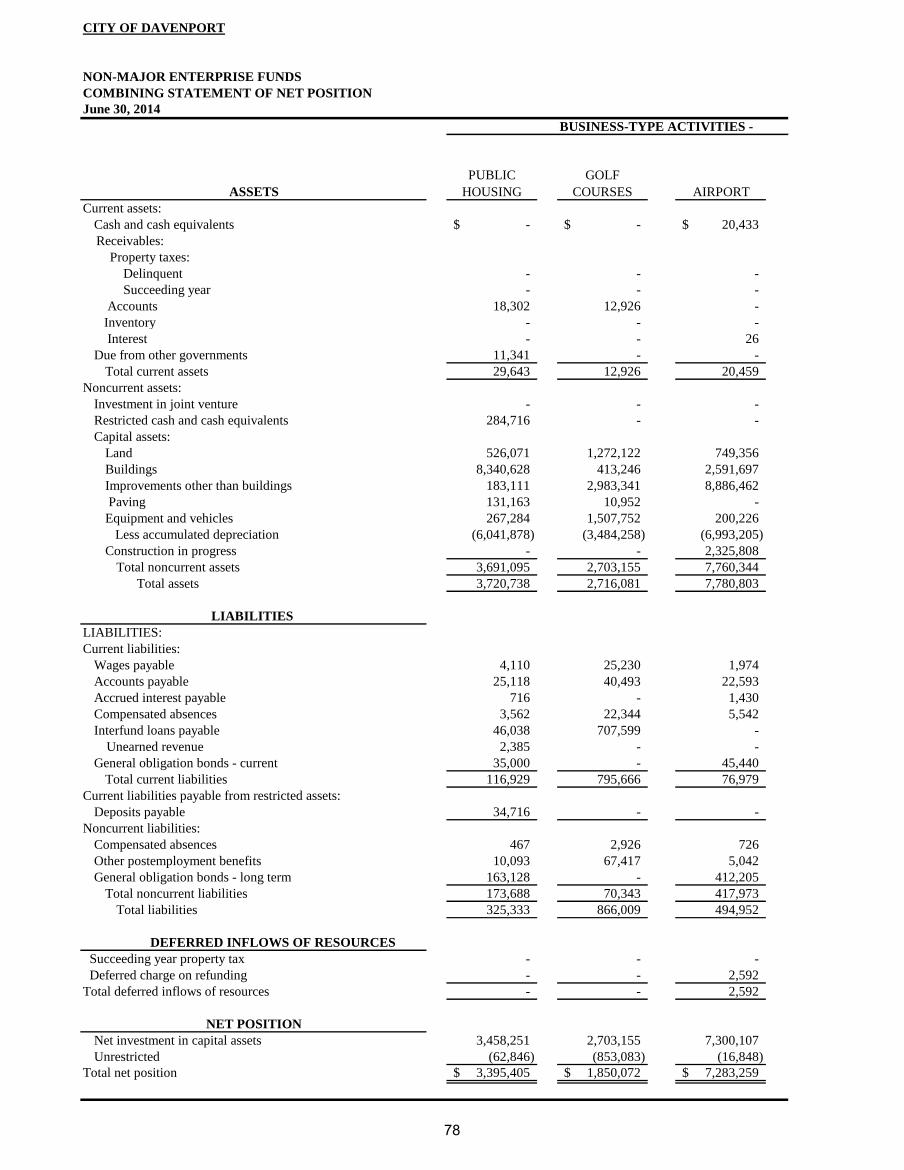
CITY OF DAVENPORT
NON-MAJOR ENTERPRISE FUNDS
COMBINING STATEMENT OF NET POSITION
June 30, 2014
BUSINESS-TYPE ACTIVITIES - ENTERPRISE FUNDS
ASSETS
PUBLIC
HOUSING
GOLF
COURSES AIRPORT
Current assets:
Cash and cash equivalents -$ -$ 20,433$
Receivables:
Property taxes:
Delinquent - - -
Succeeding year - - -
Accounts 18,302 12,926 -
Inventory - - -
Interest - - 26
Due from other governments 11,341 - -
Total current assets 29,643 12,926 20,459
Noncurrent assets:
Investment in joint venture - - -
Restricted cash and cash equivalents 284,716 - -
Capital assets:
Land 526,071 1,272,122 749,356
Buildings 8,340,628 413,246 2,591,697
Improvements other than buildings 183,111 2,983,341 8,886,462
Paving 131,163 10,952 -
Equipment and vehicles 267,284 1,507,752 200,226
Less accumulated depreciation (6,041,878) (3,484,258) (6,993,205)
Construction in progress - - 2,325,808
Total noncurrent assets 3,691,095 2,703,155 7,760,344
Total assets 3,720,738 2,716,081 7,780,803
LIABILITIES
LIABILITIES:
Current liabilities:
Wages payable 4,110 25,230 1,974
Accounts payable 25,118 40,493 22,593
Accrued interest payable 716 - 1,430
Compensated absences 3,562 22,344 5,542
Interfund loans payable 46,038 707,599 -
Unearned revenue 2,385 - -
General obligation bonds - current 35,000 - 45,440
Total current liabilities 116,929 795,666 76,979
Current liabilities payable from restricted assets:
Deposits payable 34,716 - -
Noncurrent liabilities:
Compensated absences 467 2,926 726
Other postemployment benefits 10,093 67,417 5,042
General obligation bonds - long term 163,128 - 412,205
Total noncurrent liabilities 173,688 70,343 417,973
Total liabilities 325,333 866,009 494,952
DEFERRED INFLOWS OF RESOURCES
Succeeding year property tax - - -
Deferred charge on refunding - - 2,592
Total deferred inflows of resources - - 2,592
NET POSITION
Net investment in capital assets 3,458,251 2,703,155 7,300,107
Unrestricted (62,846) (853,083) (16,848)
Total net position 3,395,405$ 1,850,072$ 7,283,259$
78

ENTERPRISE FUNDS
PUBLIC
TRANSIT
SOLID
WASTE
RIVER'S
EDGE
TOTAL
NON-MAJOR
ENTERPRISE
FUNDS
-$ 699,496$ 2,625$ 722,554$
63,204 - - 63,204
3,605,618 - - 3,605,618
20,505 2,322,966 - 2,374,699
97,003 - - 97,003
- 317 - 343
841,506 - - 852,847
4,627,836 3,022,779 2,625 7,716,268
434,151 - - 434,151
- 1,958,675 - 2,243,391
1,599,288 - - 4,146,837
4,120,577 24,888 1,253,133 16,744,169
179,929 - 848,853 13,081,696
6,888 - - 149,003
5,853,717 3,979,307 335,505 12,143,791
(6,559,965) (2,991,539) (439,487) (26,510,332)
960,337 - - 3,286,145
6,594,922 2,971,331 1,998,004 25,718,851
11,222,758 5,994,110 2,000,629 33,435,119
63,626 48,191 6,377 149,508
223,990 74,610 16,197 403,001
- 6,365 - 8,511
62,545 114,524 7,388 215,905
1,820,307 - - 2,573,944
13,386 - - 15,771
- 390,000 - 470,440
2,183,854 633,690 29,962 3,837,080
- - - 34,716
8,191 14,999 968 28,277
192,297 179,332 26,694 480,875
- 1,486,783 - 2,062,116
200,488 1,681,114 27,662 2,571,268
2,384,342 2,314,804 57,624 6,443,064
3,605,618 - - 3,605,618
- - - 2,592
3,605,618 - - 3,608,210
6,160,771 1,094,548 1,998,004 22,714,836
(927,973) 2,584,758 (54,999) 669,009
5,232,798$ 3,679,306$ 1,943,005$ 23,383,845$
79
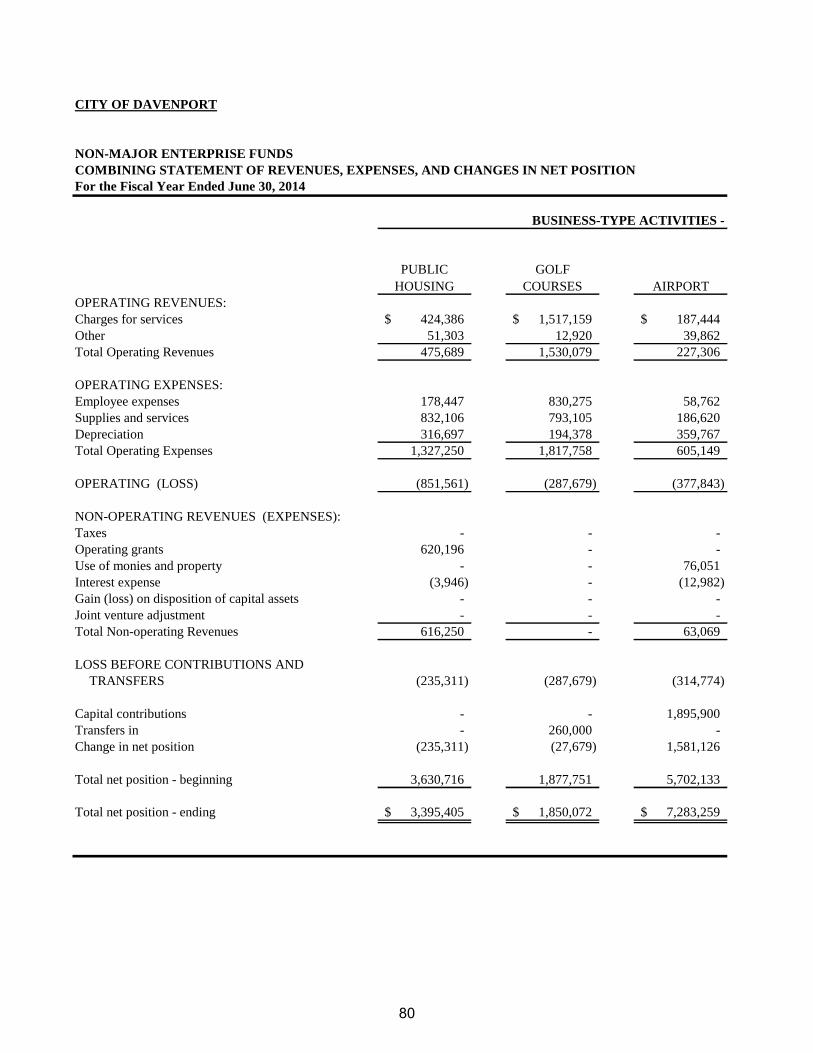
COMBINING STATEMENT OF REVENUES, EXPENSES, AND CHANGES IN NET POSITION
PUBLIC
HOUSING
GOLF
COURSES AIRPORT
OPERATING REVENUES:
Charges for services 424,386$ 1,517,159$ 187,444$
Other 51,303 12,920 39,862
Total Operating Revenues 475,689 1,530,079 227,306
OPERATING EXPENSES:
Employee expenses 178,447 830,275 58,762
Supplies and services 832,106 793,105 186,620
Depreciation 316,697 194,378 359,767
Total Operating Expenses 1,327,250 1,817,758 605,149
OPERATING (LOSS) (851,561) (287,679) (377,843)
NON-OPERATING REVENUES (EXPENSES):
Taxes - - -
Operating grants 620,196 - -
Use of monies and property - - 76,051
Interest expense (3,946) - (12,982)
Gain (loss) on disposition of capital assets - - -
Joint venture adjustment - - -
Total Non-operating Revenues 616,250 - 63,069
LOSS BEFORE CONTRIBUTIONS AND
TRANSFERS (235,311) (287,679) (314,774)
Capital contributions - - 1,895,900
Transfers in - 260,000 -
Change in net position (235,311) (27,679) 1,581,126
Total net position - beginning 3,630,716 1,877,751 5,702,133
Total net position - ending 3,395,405$ 1,850,072$ 7,283,259$
CITY OF DAVENPORT
NON-MAJOR ENTERPRISE FUNDS
For the Fiscal Year Ended June 30, 2014
BUSINESS-TYPE ACTIVITIES -
80
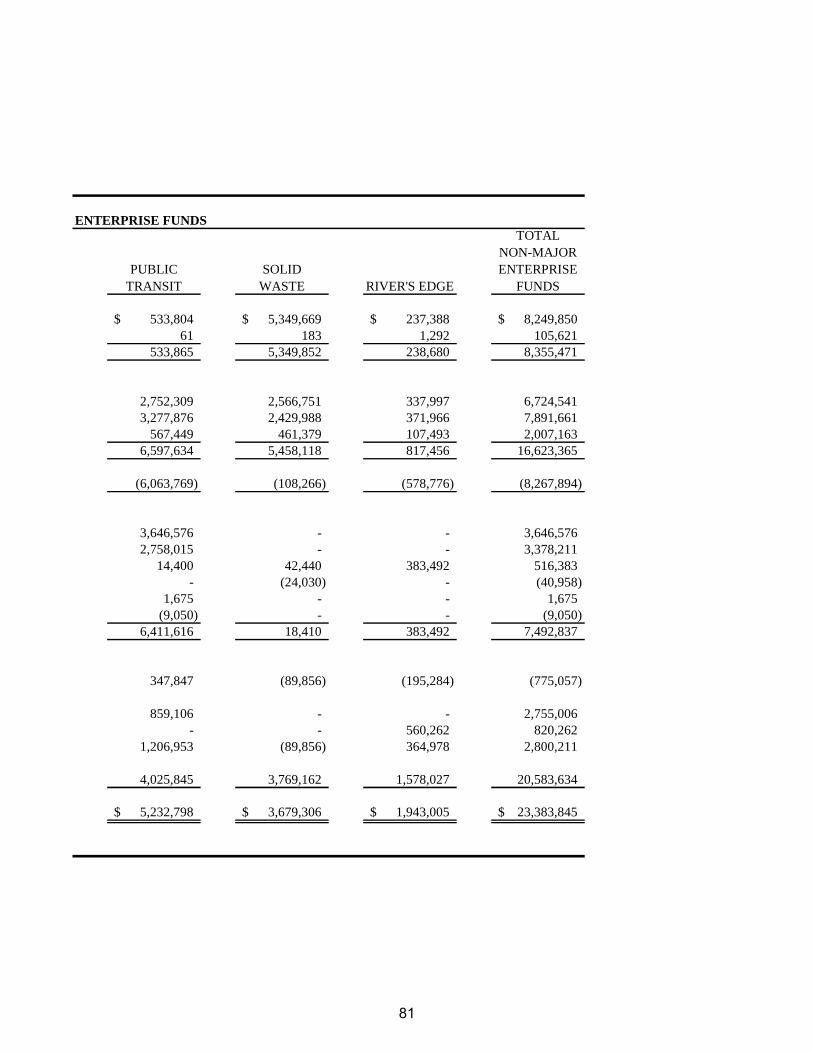
PUBLIC
TRANSIT
SOLID
WASTE RIVER'S EDGE
TOTAL
NON-MAJOR
ENTERPRISE
FUNDS
533,804$ 5,349,669$ 237,388$ 8,249,850$
61 183 1,292 105,621
533,865 5,349,852 238,680 8,355,471
2,752,309 2,566,751 337,997 6,724,541
3,277,876 2,429,988 371,966 7,891,661
567,449 461,379 107,493 2,007,163
6,597,634 5,458,118 817,456 16,623,365
(6,063,769) (108,266) (578,776) (8,267,894)
3,646,576 - - 3,646,576
2,758,015 - - 3,378,211
14,400 42,440 383,492 516,383
- (24,030) - (40,958)
1,675 - - 1,675
(9,050) - - (9,050)
6,411,616 18,410 383,492 7,492,837
347,847 (89,856) (195,284) (775,057)
859,106 - - 2,755,006
- - 560,262 820,262
1,206,953 (89,856) 364,978 2,800,211
4,025,845 3,769,162 1,578,027 20,583,634
5,232,798$ 3,679,306$ 1,943,005$ 23,383,845$
ENTERPRISE FUNDS
81

COMBINING STATEMENT OF CASH FLOWS
PUBLIC
HOUSING
GOLF
COURSES AIRPORT
CASH FLOWS FROM OPERATING ACTIVITIES:
Cash received from users 439,131$ 1,517,067$ 189,780$
Cash paid to suppliers for goods and services (826,593) (799,125) (166,338)
Cash paid to employees for services (177,118) (819,459) (57,705)
Other operating revenue 51,303 12,920 39,862
Net Cash Provided by (Used for) Operating
Activities (513,277) (88,597) 5,599
CASH FLOWS FROM NON-CAPITAL
FINANCING ACTIVITIES:
Repayments to other funds (35,155) (820,906) -
Advances from other funds 46,038 707,598 -
Grants 620,196 - -
Property tax - - -
Transfers in - 260,000 -
Net Cash Provided by Non-Capital
Financing Activities 631,079 146,692 -
CASH FLOWS FROM CAPITAL AND RELATED
FINANCING ACTIVITIES:
Proceeds from general obligation bonds 130,000 - -
Refunding discount/issue costs 5,367 - (5,464)
Proceeds from the sale of capital assets - - -
Acquisition and construction of capital assets - (58,095) (16,759)
Principal paid on long-term debt (123,000) - (46,825)
Interest paid on long-term debt (3,653) - (13,099)
Net Cash Provided by (Used for) Capital and
Related Financing Activities 8,714 (58,095) (82,147)
CASH FLOWS FROM INVESTING ACTIVITIES:
Interest and other investment income - - 76,025
Net Cash provided by (used for) Investing
Activities - - 76,025
Net increase (decrease) in Cash and Cash
Equivalents 126,516 - (523)
CASH AND CASH EQUIVALENTS-BEGINNING 158,200 - 20,956
CASH AND CASH EQUIVALENTS-ENDING 284,716$ -$ 20,433$
CITY OF DAVENPORT
NON-MAJOR ENTERPRISE FUNDS
For the Fiscal Year Ended June 30, 2014
BUSINESS-TYPE ACTIVITIES -
82

PUBLIC
TRANSIT
SOLID
WASTE
RIVER'S
EDGE
TOTAL
NON-MAJOR
ENTERPRISE
FUNDS
(142,864)$ 5,216,465$ 238,388$ 7,457,967$
(3,269,177) (2,440,277) (371,694) (7,873,204)
(2,687,385) (2,507,594) (327,127) (6,576,388)
61 183 1,292 105,621
(6,099,365) 268,777 (459,141) (6,886,004)
(2,132,608) - (452,521) (3,441,190)
1,820,307 - - 2,573,943
2,758,015 - - 3,378,211
3,646,576 - - 3,646,576
- - 560,262 820,262
6,092,290 - 107,741 6,977,802
- 1,315,000 - 1,445,000
- 103,155 - 103,058
1,675 - - 1,675
(9,000) (86,325) (29,467) (199,646)
- (145,000) - (314,825)
- (19,084) - (35,836)
(7,325) 1,167,746 (29,467) 999,426
14,400 42,123 383,492 516,040
14,400 42,123 383,492 516,040
- 1,478,646 2,625 1,607,264
- 1,179,525 - 1,358,681
-$ 2,658,171$ 2,625$ 2,965,945$
(continued)
ENTERPRISE FUNDS
83

COMBINING STATEMENT OF CASH FLOWS (Continued)
PUBLIC
HOUSING
GOLF
COURSES AIRPORT
Operating loss (851,561)$ (287,679)$ (377,843)$
Adjustments to Reconcile Operating loss to Net Cash
Provided by (Used for) Operating Activities:
Depreciation 316,697 194,378 359,767
Change in assets and liabilities:
Decrease (increase) in accounts receivable (6,170) (92) 2,336
Decrease (increase) in due from other governments 20,915 - -
Decrease (increase) in prepaids - - -
Increase (decrease) in accounts payable 5,513 (6,020) 20,282
Increase (decrease) in other accrued liabilities 1,329 10,816 1,057
Increase (decrease) in other deferred revenue - - -
Total Adjustments 338,284 199,082 383,442
NET CASH PROVIDED BY (USED FOR) OPERATING
ACTIVITIES (513,277)$ (88,597)$ 5,599$
SCHEDULE OF NON-CASH INVESTING, CAPITAL AND
FINANCING ACTIVITIES
Acquisition of capital assets through capital contributions -$ -$ 1,895,900$
Contribution of capital assets by municipality - - (249,831)
Contribution of capital assets by state and federal governments - - (1,646,069)
RECONCILIATION OF OPERATING INCOME (LOSS) TO NET
CASH PROVIDED BY (USED FOR) OPERATING ACTIVITIES
CITY OF DAVENPORT
NON-MAJOR ENTERPRISE FUNDS
For the Fiscal Year Ended June 30, 2014
BUSINESS-TYPE ACTIVITIES -
84
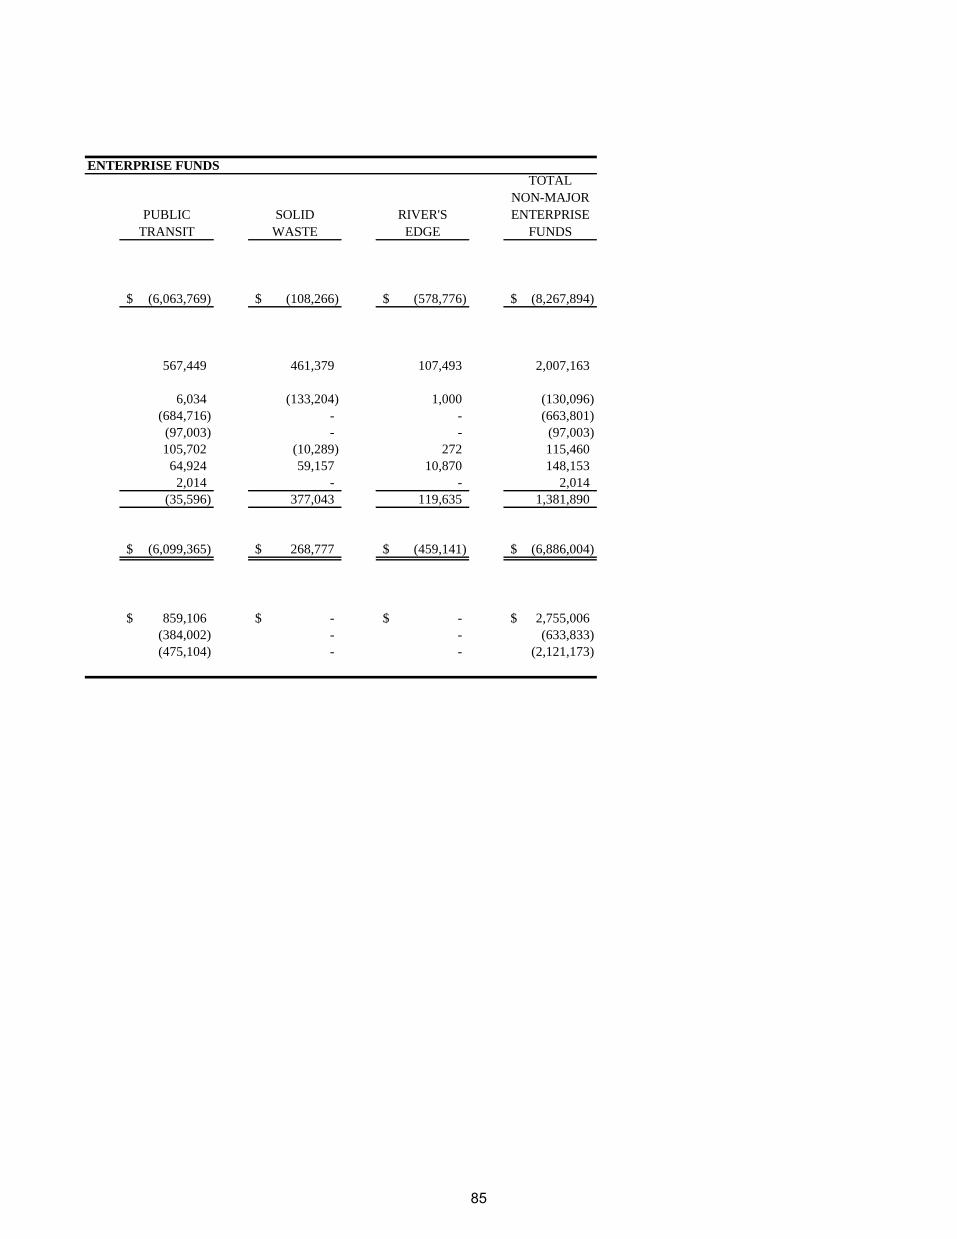
PUBLIC
TRANSIT
SOLID
WASTE
RIVER'S
EDGE
TOTAL
NON-MAJOR
ENTERPRISE
FUNDS
(6,063,769)$ (108,266)$ (578,776)$ (8,267,894)$
567,449 461,379 107,493 2,007,163
6,034 (133,204) 1,000 (130,096)
(684,716) - - (663,801)
(97,003) - - (97,003)
105,702 (10,289) 272 115,460
64,924 59,157 10,870 148,153
2,014 - - 2,014
(35,596) 377,043 119,635 1,381,890
(6,099,365)$ 268,777$ (459,141)$ (6,886,004)$
859,106$ -$ -$ 2,755,006$
(384,002) - - (633,833)
(475,104) - - (2,121,173)
ENTERPRISE FUNDS
85

86

Internal Service Funds
Employee Insurance Fund – Accounts for the revenue received from employee and employer contributions and expenses for insurance premiums, administrative fees, and health claims related to the City’s protected employee benefit program. Transfers from other City funds, determined on an actuarial basis, are accounted for as revenue in this fund. Risk Management Fund – Accounts for liability, property and worker’s compensation insurance premiums, claims and administrative fees of the City’s protected self-insurance program. Transfers from other City funds, determined on an actuarial basis, are accounted for as revenue in this fund. Information Management Services Fund – Accounts for the accumulation and allocation of costs associated with information technology.
87
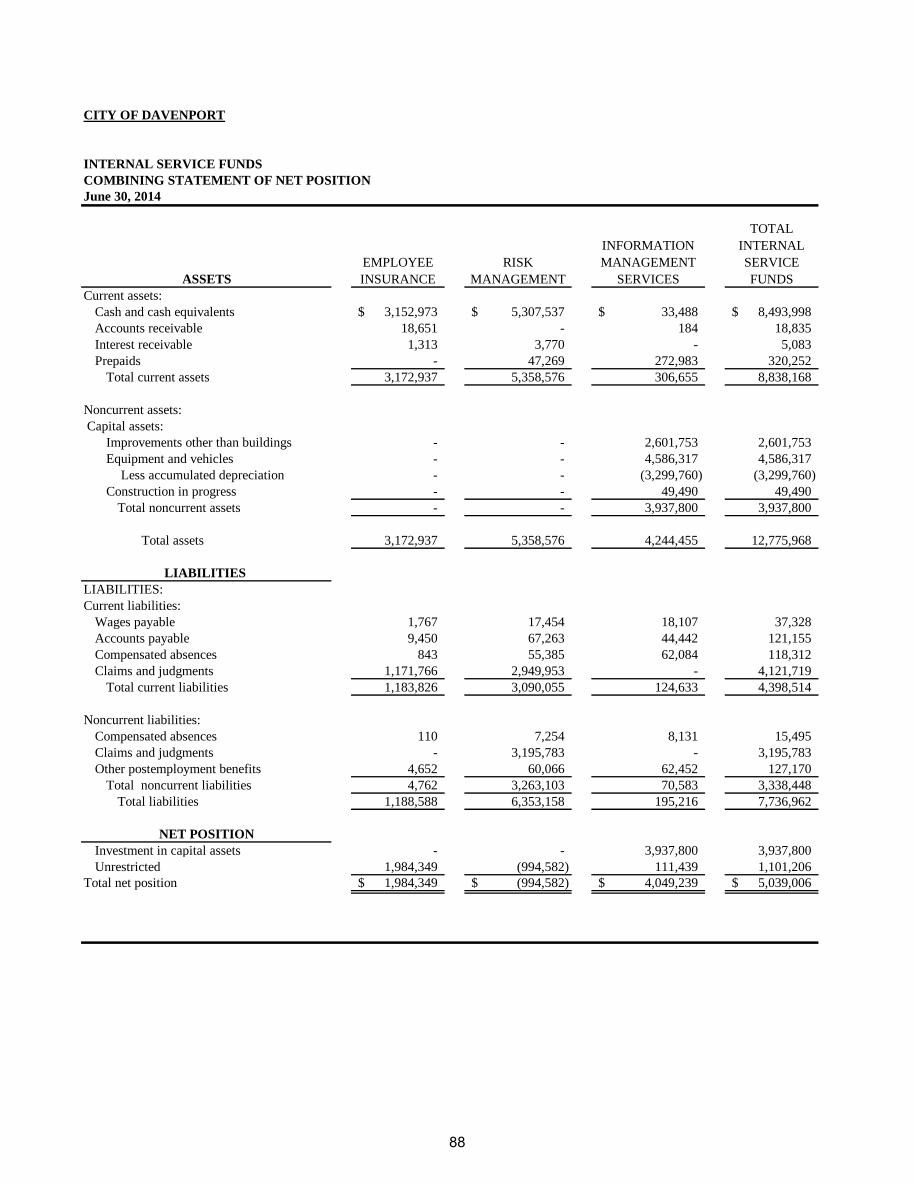
CITY OF DAVENPORT
COMBINING STATEMENT OF NET POSITION
June 30, 2014
ASSETS
EMPLOYEE
INSURANCE
RISK
MANAGEMENT
INFORMATION
MANAGEMENT
SERVICES
TOTAL
INTERNAL
SERVICE
FUNDS
Current assets:
Cash and cash equivalents 3,152,973$ 5,307,537$ 33,488$ 8,493,998$
Accounts receivable 18,651 - 184 18,835
Interest receivable 1,313 3,770 - 5,083
Prepaids - 47,269 272,983 320,252
Total current assets 3,172,937 5,358,576 306,655 8,838,168
Noncurrent assets:
Capital assets:
Improvements other than buildings - - 2,601,753 2,601,753
Equipment and vehicles - - 4,586,317 4,586,317
Less accumulated depreciation - - (3,299,760) (3,299,760)
Construction in progress - - 49,490 49,490
Total noncurrent assets - - 3,937,800 3,937,800
Total assets 3,172,937 5,358,576 4,244,455 12,775,968
LIABILITIES
LIABILITIES:
Current liabilities:
Wages payable 1,767 17,454 18,107 37,328
Accounts payable 9,450 67,263 44,442 121,155
Compensated absences 843 55,385 62,084 118,312
Claims and judgments 1,171,766 2,949,953 - 4,121,719
Total current liabilities 1,183,826 3,090,055 124,633 4,398,514
Noncurrent liabilities:
Compensated absences 110 7,254 8,131 15,495
Claims and judgments - 3,195,783 - 3,195,783
Other postemployment benefits 4,652 60,066 62,452 127,170
Total noncurrent liabilities 4,762 3,263,103 70,583 3,338,448
Total liabilities 1,188,588 6,353,158 195,216 7,736,962
NET POSITION
Investment in capital assets - - 3,937,800 3,937,800
Unrestricted 1,984,349 (994,582) 111,439 1,101,206
Total net position 1,984,349$ (994,582)$ 4,049,239$ 5,039,006$
INTERNAL SERVICE FUNDS
88

CITY OF DAVENPORT
INTERNAL SERVICE FUNDS
COMBINING STATEMENT OF REVENUES, EXPENSES, AND CHANGES IN NET POSITION
EMPLOYEE
INSURANCE
RISK
MANAGEMENT
INFORMATION
MANAGEMENT
SERVICES
TOTAL
INTERNAL
SERVICE
FUNDS
OPERATING REVENUES:
Charges for services 13,801,820$ 4,200,820$ 1,914,598$ 19,917,238$
Other 172,946 1,229,461 2,800 1,405,207
Total Operating Revenues 13,974,766 5,430,281 1,917,398 21,322,445
OPERATING EXPENSES:
Employee expenses 94,078 896,533 902,218 1,892,829
Supplies and services 12,407,667 4,057,436 985,939 17,451,042
Depreciation - - 451,206 451,206
Total Operating Expenses 12,501,745 4,953,969 2,339,363 19,795,077
OPERATING INCOME (LOSS) 1,473,021 476,312 (421,965) 1,527,368
NON-OPERATING REVENUES (EXPENSES):
Use of monies and property 4,301 12,344 - 16,645
Total Non-operating Revenues (Expenses) 4,301 12,344 - 16,645
INCOME (LOSS) BEFORE CONTRIBUTIONS 1,477,322 488,656 (421,965) 1,544,013
Capital contributions - - 846,784 846,784
Transfers in - 220,524 - 220,524
Transfers out - (166,581) - (166,581)
Change in net position 1,477,322 542,599 424,819 2,444,740
Total net position - beginning 507,027 (1,537,181) 3,624,420 2,594,266
Total net position - ending 1,984,349$ (994,582)$ 4,049,239$ 5,039,006$
For the Fiscal Year Ended June 30, 2014
89

EMPLOYEE
INSURANCE
RISK
MANAGEMENT
INFORMATION
MANAGEMENT
SERVICES
TOTAL
INTERNAL
SERVICE
FUNDS
CASH FLOWS FROM OPERATING
ACTIVITIES:
Cash received from users 13,793,726$ 4,806,924$ 1,914,598$ 20,515,248$
Cash paid to suppliers for goods and
services (12,364,410) (4,226,507) (991,119) (17,582,036)
Cash paid to employees for services (90,952) (889,166) (877,460) (1,857,578)
Other operating revenue 172,946 1,229,461 2,800 1,405,207
Net Cash provided by (used for)
Operating Activities 1,511,310 920,712 48,819 2,480,841
CASH FLOWS FROM NON-CAPITAL
FINANCING ACTIVITIES:
Repayments to other funds - (6,536) - (6,536)
Transfers in - 220,524 - 220,524
Transfers out - (166,581) - (166,581)
Net Cash used for Non-Capital
Financing Activities - 47,407 - 47,407
CASH FLOWS FROM CAPITAL AND RELATED
FINANCING ACTIVITIES:
Acquisition and construction of capital assets - - (51,638) (51,638)
Net Cash Provided by (Used for) Capital and Related
Financing Activities - - (51,638) (51,638)
CASH FLOWS FROM INVESTING
ACTIVITIES:
Interest and investment income 2,988 8,574 - 11,562
Net increase (decrease) in Cash and
Cash Equivalents 1,514,298 976,693 (2,819) 2,488,172
CASH AND CASH EQUIVALENTS-
BEGINNING 1,638,675 4,330,844 36,307 6,005,826
CASH AND CASH EQUIVALENTS-
ENDING 3,152,973$ 5,307,537$ 33,488$ 8,493,998$
CITY OF DAVENPORT
INTERNAL SERVICE FUNDS
For the Fiscal Year Ended June 30, 2014
COMBINING STATEMENT OF CASH FLOWS
90

EMPLOYEE
INSURANCE
RISK
MANAGEMENT
INFORMATION
MANAGEMENT
SERVICES
TOTAL
INTERNAL
SERVICE
FUNDSRECONCILIATION OF OPERATING
INCOME (LOSS) TO NET CASH
PROVIDED BY (USED FOR)
OPERATING ACTIVITIES
Operating Income (Loss) 1,473,021$ 476,312$ (421,965)$ 1,527,368$
Adjustments to Reconcile Operating Income (Loss)
to Net Cash Provided by (Used for) Operating Activities:
Depreciation - - 451,206 451,206
Change in assets and liabilities:
Decrease in accounts
receivable (8,094) 606,104 - 598,010
Decrease (increase) in prepaids - (6,070) (17,114) (23,184)
Increase in accounts
payable 43,257 (163,001) 11,934 (107,810)
Increase (decrease) in other accrued
liabilities 3,126 7,367 24,758 35,251
Total Adjustments 38,289 444,400 470,784 953,473
NET CASH PROVIDED BY (USED FOR)
OPERATING ACTIVITIES 1,511,310$ 920,712$ 48,819$ 2,480,841$
SCHEDULE OF NON-CASH INVESTING, CAPITAL AND
FINANCING ACTIVITIES
Acquisition of capital assets through capital contributions -$ -$ 846,784$ 846,784$
Contribution of capital assets by municipality - - (846,784) (846,784)
CITY OF DAVENPORT
INTERNAL SERVICE FUNDS
For the Fiscal Year Ended June 30, 2014
COMBINING STATEMENT OF CASH FLOWS (Continued)
91

Fiduciary Fund Types
Riverfront Task Force Fund – Accounts for receipts of donations to be used toward the formation of a plan for riverfront development. Library Gift Fund – Accounts for donations to the Davenport Library and disbursements, which include the purchase of books, periodicals and equipment as authorized by the Library Board of Directors. M.D. Petersen Memorial Fund – Accounts for an annual contribution from the Petersen estate and the disbursement for improvements designated by the Davenport Levee Improvement Commission.
92

RIVERFRONT TASK FORCE
BALANCE
JUNE 30, 2013 ADDITIONS DELETIONS
BALANCE
JUNE 30,2014
ASSETS:
Cash and investments 3,645$ 5$ -$ 3,650$
TOTAL ASSETS 3,645$ 5$ -$ 3,650$
LIABILITIES:
Due to other governments 3,645$ 5$ -$ 3,650$
LIBRARY GIFT
ASSETS:
Cash and investments 386,700$ 171,543$ 132,734$ 425,509$
Interest receivable - 267 - 267
TOTAL ASSETS 386,700$ 171,810$ 132,734$ 425,776$
LIABILITIES:
Accounts payable 11,164$ 95,108$ 95,929$ 10,343$
Due to other governments 375,536 39,897 - 415,433
TOTAL LIABILITIES 386,700$ 135,005$ 95,929$ 425,776$
M.D. PETERSEN MEMORIAL
ASSETS:
Cash and investments 2,167$ 3$ -$ 2,170$
TOTAL ASSETS 2,167$ 3$ -$ 2,170$
LIABILITIES:
Accounts payable -$ -$ -$ -$
Due to other governments 2,167 3 - 2,170
TOTAL LIABILITIES 2,167$ 3$ -$ 2,170$
TOTALS - ALL AGENCY FUNDS
ASSETS:
Cash and investments 392,512$ 171,551$ 132,734$ 431,329$
Interest receivable - 267 - 267
TOTAL ASSETS 392,512$ 171,818$ 132,734$ 431,596$
LIABILITIES:
Accounts payable 11,164$ 95,108$ 95,929$ 10,343$
Due to other governments 381,348 39,905 - 421,253
TOTAL LIABILITIES 392,512$ 135,013$ 95,929$ 431,596$
CITY OF DAVENPORT
ALL AGENCY FUNDS
COMBINING STATEMENT OF CHANGES IN ASSETS AND LIABILITIES
For the Fiscal Year Ended June 30, 2014
93

CFDA
NUMBER
GRANT
NUMBER
PROGRAM
EXPENDITURES
Direct:
Department of Housing and Urban Development (HUD)
N/C S/R Section 8 Programs 14.182 IA05 0002 0001 378,066
Community Development Block Grants/Entitlement Grants 14.218 B 12 MC 19 0002 1,594,386
HOME Investment Partnerships Program 14.239 M 12 MC 190200 646,572
Fair Housing Assistance Program 14.401 FF 207 K0 77015 66,446
Public and Indian Housing 14.850 IA 05 S04 5501 120,290
Section 8 Housing Choice Vouchers 14.871 KC 902 7V 3,349,712
Public Housing - Capital Fund Program 14.872 KC 914 8 121,839
Lead Based Paint Grant 14.900 IA LHB 0349 07 357,007
6,634,318
Equal Employment Opportunity Commission
Equal Employment Opportunity Commission 30.001 EE CCN 1001 14 27,000
Department of Transportation
Airport Rehabilitate Taxiway (T-Hanger Access) 20.205 319 00 24 15 105,207
Runway 3/21 Reconstruction 20.205 319 00 24 18 1,525,219
Recreational Trails 20.205 STPE 1827 (666) 8V 82 32,295
Credit Island Bridge 20.205 EDP 1827(002) 7Y 82 103,297
Jackson School Signal 20.205 SRTS 1827 (647) 8U 82 4,586
Division Street 20.205 STPU 1827 (648) 70 82 90,337
Forest Grove Avenue 20.205 STPU 1827 (665) 70 82 312,575
Kimberly and Forest Street 20.205 STPU 1827 9(79) 70 82 699,045
Pine Street Reconstruction 20.205 STPU 1827 (662) 70 82 340,600
Veteran's Memorial Parkway 20.205 STPU 1827 (633) 70 82 1,407,199
Kimberly and Division 20.205 STPU 1827 (667) 70 82 102,317
49th Street Paving 20.205 STPU 1827 (632) 70 83 4,000
Rail For Eastern Iowa 20.205 FE 06 (01) 49 82 131,404
Federal Transit - Formula Grants 20.507 IA 90 X 362 00 89,298
Federal Transit - Formula Grants 20.507 IA 90 X 399 00 1,292,167
Federal Transit - Formula Grants 20.507 IA 90 X 411 00 760,572
Federal Transit - Formula Grants 20.507 IA 90 X 372 00 236,437
7,236,555
Environmental Protection Agency
Clean Water State Revolving Funds 66.458 1,125,936
Economic Development Administration
Transload Facility 11.307 0679 5588 1,635,116
CITY OF DAVENPORT
SCHEDULE OF EXPENDITURES OF FEDERAL AWARDS
FOR THE YEAR ENDED JUNE 30, 2014
GRANTOR/PROGRAM
94

Department of Agriculture
Farmers Market Promotion Program 10.168 12-25-G-1559 44,555
Department of the Interior
American Battlefield Protection Program 15.928 GA-2255-12-005 11,406
Department of Homeland Security
Fire Safe House 97.044 EMW 2012 FP 00287 68,000
Staffing For Adequate Fire and Emergency Response 97.083 EMW 2013 FH 00603 69,148
137,148
Department of Justice
Bulletproof Vest Partnership Program 16.607 UG 06 2XG 12,604
National Recreation and Park Association
Parks Take Me Fishing 15.653 F 125 E 20 6,088
Arthritis 15.653 N/A 4,000
10,088
Total Direct 16,874,726
Indirect:
Department of Justice
ARRA Governor's Office of Drug Control Policy 16.730 10 JAG 43056 1,659
Iowa Department of Economic Development
HERA - Neighborhood Stabilization Program 14.228 276,911
Community Development Block Grant Housing Disaster Recovery 14.228 BGDRF 08-DRH-213 2,653,361
Community Development Block Grant Housing Disaster Recovery 14.228 BGDRF 08-DRH-213 24,000
2,954,272
Aquatic Education 15.605 N/A 1,640
National Highway Traffic Safety Administration
Governor's Traffic Safety Bureau:
State and Community Highway Safety 20.600 PAP 11-04 Task 10 22,118
Corporation For National And Community Service
Iowa Commission on Volunteer Service:
AmeriCorps 94.006 12 AF 02 82,151
AmeriCorps 94.006 13 AF 02 35,146
Interpreter 94.006 10 CDH IA 001 428
Volunteer Generation Fund Grant 94.021 11 VGF N4 14,114
131,839
Total Indirect 3,111,528
Total All Federal and Indirect 19,986,254
Iowa Department of Natural Resources
95

96

STATISTICAL SECTION
Statistical Section This part of the City of Davenport’s comprehensive annual financial report presents detailed information as a context for understanding what the information in the financial statements, note disclosures, and required supplementary information says about Davenport’s overall financial health.
Financial Trends – These schedules contain trend information to help the reader understand how Davenport’s financial performance and well-being have changed over time. Revenue Capacity – These schedules contain information to help the reader assess Davenport’s most significant local revenue source, the property tax. Debt Capacity – These schedules present information to help the reader assess the affordability of Davenport’s current levels of outstanding debt and our ability to issue additional debt in the future. Demographic and Economic Information – These schedules offer demographic and economic indicators to help the reader understand the environment within which Davenport’s financial activities take place. Operating Information – These schedules contain service and infrastructure data to help the reader understand how the information in Davenport’s financial report relates to the services we provide and the activities we perform. Sources: Unless otherwise noted, the information in these schedules is derived from the comprehensive annual financial reports for the relevant year.
97

CITY OF DAVENPORT
NET POSITION BY COMPONENT,LAST TEN FISCAL YEARS(accrual basis of accounting)
2014 2013 2012 2011
Governmental activities Net investment in capital assets 145,746,153$ 140,160,840$ 107,161,965$ 126,691,668$ Restricted 29,555,409 32,606,806 44,110,046 12,739,452 Unrestricted (8,126,653) (18,726,532) (12,343,725) (3,483,506) Total governmental activities net position 167,174,909$ 154,041,114$ 138,928,286$ 135,947,614$
Business-type activities Net investment in capital assets 124,953,410$ 124,901,380$ 136,518,021$ 123,757,219$ Restricted 4,610,003 4,904,259 4,049,687 3,849,157 Unrestricted 5,295,999 2,491,018 (5,484,405) (1,280,067) Total business-type activities net position 134,859,412$ 132,296,657$ 135,083,303$ 126,326,309$
Primary government Net investment in capital assets 270,699,563$ 265,062,220$ 243,679,986$ 250,448,887$ Restricted 34,165,412 37,511,065 48,159,733 16,588,609 Unrestricted (2,830,654) (16,235,514) (17,828,130) (4,763,573) Total primary government net position 302,034,321$ 286,337,771$ 274,011,589$ 262,273,923$
Fiscal Year
98

2010 2009 2008 2007 2006 2005
125,751,423$ 105,380,683$ 107,377,588$ 89,441,418$ 68,823,065$ 88,164,547$ 26,268,566 37,923,794 34,634,008 43,140,165 52,997,137 35,494,223
(22,165,731) 2,694,253 3,975,550 5,039,462 6,977,388 5,903,723 129,854,258$ 145,998,730$ 145,987,146$ 137,621,045$ 128,797,590$ 129,562,493$
113,558,845$ 106,460,687$ 109,164,803$ 109,968,802$ 114,960,736$ 100,497,072$ 4,414,849 - - - - - 4,336,900 13,226,200 12,464,481 12,747,591 14,110,629 13,644,118
122,310,594$ 119,686,887$ 121,629,284$ 122,716,393$ 129,071,365$ 114,141,190$
239,310,268$ 211,841,370$ 216,542,391$ 199,410,220$ 183,783,801$ 188,661,619$ 30,683,415 37,923,794 34,634,008 43,140,165 52,997,137 35,494,223
(17,828,831) 15,920,453 16,440,031 17,787,053 21,088,017 19,547,841 252,164,852$ 265,685,617$ 267,616,430$ 260,337,438$ 257,868,955$ 243,703,683$
Fiscal Year
99

CITY OF DAVENPORT
CHANGES IN NET POSITION, LAST TEN FISCAL YEARS(accrual basis of accounting)
2014 2013 2012 2011 2010 2009 2008 2007 2006 2005ExpensesGovernmental activities: General government 10,261,218$ 10,870,243$ 10,097,216$ 9,914,196$ 9,385,078$ 10,026,526$ 8,523,359$ 8,710,088$ 6,413,439$ 10,445,510$ Public safety 42,649,971 40,631,720 42,449,097 42,049,042 54,618,260 37,946,102 37,929,524 37,866,348 35,330,398 32,069,077 Public works 26,439,948 25,908,915 32,069,097 43,599,123 45,177,539 22,727,385 21,653,523 18,514,994 19,152,943 18,288,161 Culture and recreation 13,285,572 11,670,469 15,981,258 13,674,184 19,395,592 13,924,558 11,663,190 11,831,207 15,989,106 15,273,271 Community and economic development 18,877,119 13,491,393 20,382,079 14,880,835 24,923,932 17,884,887 10,083,864 10,485,046 10,892,810 12,540,036 Interest on long-term debt 6,101,313 6,865,979 5,598,997 6,489,039 6,232,307 5,159,660 5,352,084 5,437,269 4,977,495 4,697,555 Total governmental activities expenses 117,615,141 109,438,719 126,577,744 130,606,419 159,732,708 107,669,118 95,205,544 92,844,952 92,756,191 93,313,610
Business-type activities: Sewer operations 17,700,417 17,751,082 16,650,341 15,506,121 14,614,261 13,661,231 12,933,042 13,275,949 12,359,594 12,336,175 Parking system 1,935,914 1,947,343 2,046,877 2,080,257 2,293,309 2,130,548 2,214,256 2,297,589 2,223,058 1,987,325 Rivercenter 3,031,575 2,684,311 2,902,730 2,616,467 2,029,591 2,273,405 2,075,251 2,044,864 2,287,829 3,856,510 Public transit 6,508,558 6,222,902 6,324,871 5,866,989 5,555,580 5,243,812 5,108,767 5,200,408 4,781,823 4,464,738 Public housing 1,314,883 1,202,506 1,200,491 1,045,905 1,130,451 1,024,289 1,088,723 1,056,560 984,783 956,687 Golf courses 1,791,523 1,844,454 2,063,357 2,072,059 2,305,035 2,215,155 2,360,114 2,388,785 2,204,089 2,651,694 Airport 611,884 784,792 606,160 578,765 555,304 536,281 564,139 533,995 492,146 446,777 Solid waste 5,388,789 5,187,482 5,326,665 5,049,222 4,835,236 4,424,452 4,426,700 4,584,023 4,148,895 4,255,444 Clean water (1) 2,817,230 2,806,621 2,537,290 2,185,141 2,231,978 1,803,626 1,747,692 1,684,045 1,608,951 - Riversedge 806,140 746,906 960,907 1,087,614 166,168 Total business-type activities expenses 41,906,913 41,178,399 40,619,689 38,088,540 35,716,913 33,312,799 32,518,684 33,066,218 31,091,168 30,955,350
Total primary government expenses 159,522,054$ 150,617,118$ 167,197,433$ 168,694,959$ 195,449,621$ 140,981,917$ 127,724,228$ 125,911,170$ 123,847,359$ 124,268,960$
Program revenuesGovernmental activities: Charges for services: General government 4,546,069$ 3,595,092$ 3,331,628$ 3,401,763$ 3,802,966$ 1,906,531$ 2,492,146$ 2,185,830$ 1,807,942$ 1,677,053$ Public safety 2,780,989 2,821,608 2,991,978 4,272,343 2,433,034 1,991,648 1,769,379 1,772,612 2,175,988 1,577,554 Public works 4,089,579 4,382,205 4,486,531 2,938,022 6,200,604 1,891,001 2,212,146 1,486,492 1,941,969 1,753,160 Culture and recreation 593,369 850,025 772,321 1,698,503 1,420,156 1,255,539 1,110,907 1,774,460 3,820,105 499,872 Community and economic development 457,258 1,467,138 749,931 630,293 2,134,740 762,264 842,579 872,306 955,624 1,066,391 Operating grants and contributions 19,666,398 16,301,238 19,132,333 19,069,548 22,362,460 17,583,390 14,562,005 14,410,329 15,244,322 18,165,499 Capital grant and contributions 8,409,960 5,828,458 16,534,680 20,033,057 27,041,539 5,315,374 3,851,299 4,409,902 6,043,958 8,099,263 Total governmental activities program revenue 40,543,622 35,245,764 47,999,402 52,043,529 65,395,499 30,705,747 26,840,461 26,911,931 31,989,908 32,838,792
Business-type activities: Charges for services: Sewer operations 17,485,142 16,654,087 15,993,320 14,177,170 11,693,354 11,769,322 10,863,016 10,151,322 10,348,088 10,207,702 Parking system 1,418,539 1,463,314 1,351,539 1,399,623 1,454,569 1,675,828 1,699,437 1,765,985 1,657,506 1,630,981 Rivercenter 1,823,924 1,485,292 1,725,151 1,327,314 863,707 1,151,073 988,216 918,739 1,153,477 2,693,539 Public transit 533,804 515,210 516,315 506,706 479,090 479,056 451,139 455,216 453,792 593,905 Public housing 424,386 431,545 421,850 415,874 369,711 388,302 388,640 344,286 334,919 327,173 Golf courses 1,517,159 1,576,808 1,863,339 1,875,575 2,125,590 2,237,644 2,236,252 2,310,782 2,358,403 2,404,051 Airport 187,444 206,821 209,121 179,002 188,984 181,104 185,644 175,622 173,624 154,581 Solid waste (1) 5,349,669 5,227,041 5,023,908 4,592,794 4,494,879 4,481,816 4,577,669 4,451,864 3,777,700 3,729,191 Clean water (2) 2,497,339 2,315,651 2,075,947 1,788,322 1,730,883 1,740,483 1,765,014 1,718,423 1,609,020 - River's Edge (3) 237,388 184,325 247,685 255,061 36,618 Operating grants and contributions 3,378,211 1,725,748 1,828,869 1,654,119 1,752,126 1,557,994 1,792,100 1,463,558 1,669,214 1,363,461 Capital grant and contributions 3,037,933 310,850 12,704,352 10,663,923 8,979,787 1,603,113 2,169,889 4,192,000 7,466,146 4,340,112 Total business-type activities program revenues 37,890,938 32,096,692 43,961,396 38,835,483 34,169,298 27,265,735 27,117,016 27,947,797 31,001,889 27,444,696
Total primary government program revenues 78,434,560$ 67,342,456$ 91,960,798$ 90,879,012$ 99,564,797$ 57,971,482$ 53,957,477$ 54,859,728$ 62,991,797$ 60,283,488$
Fiscal Year
100

2014 2013 2012 2011 2010 2009 2008 2007 2006 2005Net (Expense)/RevenueGovernmental activities (77,071,519)$ (74,192,955)$ (78,578,342)$ (78,562,890)$ (94,337,209)$ (76,963,371)$ (68,365,083)$ (65,933,021)$ (60,766,283)$ (60,474,818)$ Business-type activities (4,015,975) (9,081,707) 3,341,707 746,943 (1,547,615) (6,047,064) (5,401,668) (5,118,421) (89,279) (3,510,654) Total primary government net expense (81,087,494)$ (83,274,662)$ (75,236,635)$ (77,815,947)$ (95,884,824)$ (83,010,435)$ (73,766,751)$ (71,051,442)$ (60,855,562)$ (63,985,472)$
General Revenues and Other Changes in Net PositionGovernmental activities: Taxes Property taxes 69,609,085$ 68,022,655$ 61,170,609$ 59,359,397$ 58,524,411$ 56,602,349$ 54,216,032$ 52,302,784$ 49,714,718$ 47,050,918$ Local option sales tax 15,840,749 15,210,804 15,062,987 14,934,103 14,061,501 14,268,556 14,925,248 14,408,214 13,071,274 12,556,556 Hotel/motel tax 2,277,031 2,170,593 2,055,052 1,834,327 1,636,626 1,745,523 1,687,454 1,586,261 1,611,777 1,395,028 Franchise tax 2,938,969 3,077,428 2,782,635 2,878,172 3,264,313 3,213,249 3,337,590 3,355,323 3,212,235 3,293,130 Investment earnings 1,176,460 1,036,972 1,218,684 1,014,156 1,035,244 1,390,993 2,953,986 3,839,767 3,010,775 1,943,966 Gain on sale of capital assets 17,355 1,634,804 108,867 728,558 65,547 4,905 51,385 78,176 367,546 - Miscellaneous 52,581 34,114 72,124 58,419 53,761 96,087 62,432 41,118 362,904 295,533 Transfers (1,706,916) (502,762) (911,944) 1,128,264 (448,666) (346,707) (501,515) (784,469) (11,349,849) (970,101) Total governmental activities 90,205,314 90,684,608 81,559,014 81,935,396 78,192,737 76,974,955 76,732,612 74,827,174 60,001,380 65,565,030
Business-type activities: Property taxes (public transit) 3,646,576 3,580,415 3,493,152 3,376,227 3,323,301 3,248,353 3,097,575 3,017,365 2,905,895 2,769,893 Investment earnings 618,220 660,890 700,403 658,157 259,257 400,305 649,905 790,290 698,124 462,890 Gain on sale of capital assets 61,731 25,446 - - - - - - - - Loss on donation of capital assets - - - - - - - (5,894,826) - - Miscellaneous 545,287 2,048,686 309,788 362,652 140,098 109,302 65,564 66,151 65,586 56,464 Transfers 1,706,916 502,762 911,944 (1,128,264) 448,666 346,707 501,515 784,469 11,349,849 970,101 Total business-type activities 6,578,730 6,818,199 5,415,287 3,268,772 4,171,322 4,104,667 4,314,559 (1,236,551) 15,019,454 4,259,348 Total primary government 96,784,044$ 97,502,807$ 86,974,301$ 85,204,168$ 82,364,059$ 81,079,622$ 81,047,171$ 73,590,623$ 75,020,834$ 69,824,378$
Change in Net PositionGovernmental activities 13,133,795$ 16,491,653$ 2,980,672$ 3,372,506$ (16,144,472)$ 11,584$ 8,367,529$ 8,894,153$ (764,903)$ 5,090,212$ Business-type activities 2,562,755 (2,263,508) 8,756,994 4,015,715 2,623,707 (1,942,397) (1,087,109) (6,354,972) 14,930,175 748,694 Total primary government 15,696,550$ 14,228,145$ 11,737,666$ 7,388,221$ (13,520,765)$ (1,930,813)$ 7,280,420$ 2,539,181$ 14,165,272$ 5,838,906$
(1) In fiscal year 2005, the city moved the solid waste division from governmental activities, public works to join the exisiting recycling division and made a combined solid waste business-type activity.
(2) In fiscal year 2006, the city split the clean water division from governmental activities, public works to a business-type activi
(3) Newly acquired facility in fiscal year 2010
Fiscal Year
101

CITY OF DAVENPORT
FUND BALANCES(DEFICITS), GOVERNMENTAL FUNDS,LAST TEN FISCAL YEARS(modified accrual basis of accounting)
2014 2013 2012 2011 2010General Fund Nonspendable 5,440$ 2,949$ 23,179$ 17,069$ -$ Restricted 5,999,441 5,476,184 3,717,150 3,883,934 - Committed - - - - - Assigned 778,856 555,034 545,488 551,836 - Unassigned 8,536,778 7,582,938 5,606,312 5,392,141 - Reserved - - - - 4,781,365 Unreserved - - - - 5,640,835 Total General Fund 15,320,515 13,617,105 9,892,129 9,844,980 10,422,200
All Other Governmental funds Nonspendable 5,868 - - - - Restricted 37,530,085 32,686,164 40,119,368 14,266,498 - Committed 1,184,409 1,103,032 844,461 1,058,755 - Assigned - - - - - Unassigned (344,161) (600,249) (906,693) (1,035,514) - Reserved - - - - 8,558,420 Unreserved, reported in special revenue funds - - - - (1,956,132) Capital project funds - - - - (503,939) Total All Other Governmental funds 38,376,201$ 33,188,947$ 40,057,136$ 14,289,739$ 6,098,349$
The City implemented GASB Statement No. 54, (Fund Balance Reporting and Governmental Fund Type Definitions), in fiscal year 2011.
Fiscal Year
102

2009 2008 2007 2006 2005
-$ -$ -$ -$ -$ - - - - - - - - - - - - - - - - - - - -
5,837,263 5,468,328 5,897,658 6,466,266 5,932,616 4,961,376 5,057,016 6,658,196 7,561,989 7,173,392
10,798,639 10,525,344 12,555,854 14,028,255 13,106,008
- - - - - - - - - - - - - - - - - - - - - - - - -
32,666,636 27,199,618 32,790,103 41,987,883 33,277,257
980,072 3,754,094 6,527,897 6,116,563 5,554,019 - - - (710,670) (7,430,722)
33,646,708$ 30,953,712$ 39,318,000$ 47,393,776$ 31,400,554$
Fiscal Year
103

CITY OF DAVENPORT
CHANGES IN FUND BALANCES, GOVERNMENTAL FUNDS,LAST TEN FISCAL YEARS(modified accrual basis of accounting)
Fiscal Year
2014 2013 2012 2011 2010
Revenues
Taxes 90,421,947$ 88,262,578$ 80,884,683$ 78,730,720$ 77,168,031$ Special assessments 96,245 93,757 58,964 157,683 37,717 Licenses and permits 1,749,752 1,619,350 1,317,804 1,238,659 1,275,935 Intergovernmental 25,530,812 22,837,172 35,240,010 31,332,008 29,024,273 Charges for services 4,051,619 4,210,684 4,479,467 4,146,542 3,926,869 Use of monies and property 1,176,460 1,036,972 1,218,685 1,014,156 1,035,244 Fines and forfeits 1,931,967 1,740,494 1,936,641 1,967,004 1,314,564 Loan repayments 1,065,290 860,284 723,850 839,699 648,896 Other 4,108,428 3,659,461 4,598,710 4,519,410 4,362,836
Total revenues 130,132,520 124,320,752 130,458,814 123,945,881 118,794,365
Expenditures
General government 8,820,719 8,601,095 8,992,941 8,178,030 8,370,902 Public safety 41,216,850 40,160,927 39,554,541 39,137,701 38,211,590 Public works 17,557,791 15,288,713 15,505,355 17,073,051 17,169,622 Culture and recreation 11,281,713 10,975,613 11,305,093 11,485,665 12,738,612 Community and economic development 13,853,663 10,629,873 15,234,614 13,823,997 20,305,456 Capital outlay 15,247,456 17,188,086 38,425,489 35,710,271 56,227,626 Debt service Principal 16,024,785 16,241,175 17,234,350 17,071,575 14,912,225 Interest 6,101,313 6,987,409 6,200,955 6,233,849 6,078,034 Bond issuance expense 249,658 216,403 125,781 150,055 153,704
Total expenditures 130,353,948 126,289,294 152,579,119 148,864,194 174,167,771
Excess of revenues over (under) expenditures (221,428) (1,968,542) (22,120,305) (24,918,313) (55,373,406)
Other Financing Sources (Uses)
Bond issuance 14,850,000 12,382,000 11,790,000 25,299,250 28,676,000 Discount on debt issued - - - - (66,902) Premium on debt issued 2,405,596 482,773 3,321,543 1,377,130 30,668 Refunding bonds issued 10,335,000 2,310,000 33,637,890 3,687,250 6,546,400 Payment to refunded bond escrow agent (18,735,000) (17,900,000) - (3,880,000) (6,555,500) Sale of capital assets 17,355 2,016,593 108,867 728,558 66,608 Transfers in 12,026,555 14,170,133 20,129,136 17,023,775 16,951,068 Transfers out (13,787,414) (14,636,170) (21,052,585) (15,224,330) (17,399,734)
Total other financing sources (uses) 7,112,092 (1,174,671) 47,934,851 29,011,633 28,248,608
Net change in fund balances 6,890,664$ (3,143,213)$ 25,814,546$ 4,093,320$ (27,124,798)$
Debt service as a percentage of noncapital expenditures 18.32% 20.55% 18.24% 17.28% 12.92%
104

2009 2008 2007 2006 2005
75,503,579$ 73,900,380$ 71,440,755$ 67,238,905$ 63,519,997$ 6,806 139,517 50,982 40,535 55,964
1,154,269 1,496,632 1,395,934 1,623,543 1,600,302 22,579,386 17,417,503 17,053,854 19,729,182 21,801,090
4,081,012 3,616,388 2,798,325 3,490,189 3,334,847 1,390,993 2,953,986 3,839,767 3,010,775 1,943,966
938,544 554,937 873,092 997,004 604,751 611,113 584,230 663,341 594,829 978,166
1,257,734 2,106,748 2,105,786 4,308,377 3,052,499
107,523,436 102,770,321 100,221,836 101,033,339 96,891,582
7,849,694 7,908,979 7,215,792 7,242,260 6,878,912 37,719,742 37,817,252 36,215,539 33,930,920 31,539,164 15,838,441 15,316,163 11,812,816 11,789,864 11,829,081 11,113,692 10,182,468 9,406,214 8,632,061 7,878,176 17,030,912 9,930,122 8,960,280 10,016,894 10,937,442 25,959,860 24,969,390 30,935,403 31,196,883 26,981,978
12,125,079 12,466,632 13,256,573 13,049,158 10,809,309 5,030,293 5,151,715 5,238,443 4,816,787 4,549,030
285,250 84,386 68,526 105,731 35,791
132,952,963 123,827,107 123,109,586 120,780,558 111,438,883
(25,429,527) (21,056,786) (22,887,750) (19,747,219) (14,547,301)
26,820,000 9,910,000 13,940,000 35,660,000 10,355,000 56,945 155,453 (51,222) (148,544) (18,161)
- 4,380,000 10,959,625 - - - (4,354,806) (11,005,000) - -
4,905 51,385 78,176 1,643,684 95,946 17,244,760 14,574,161 14,210,513 14,507,366 11,876,152
(15,730,792) (14,052,777) (14,721,821) (14,999,818) (12,249,737)
28,395,818 10,663,416 13,410,271 36,662,688 10,059,200
2,966,291$ (10,393,370)$ (9,477,479)$ 16,915,469$ (4,488,101)$
15.26% 17.72% 19.48% 19.94% 18.18%
Fiscal Year
105

CITY OF DAVENPORT
ASSESSED AND TAXABLE VALUE OF TAXABLE PROPERTYLAST TEN FISCAL YEARS IN THOUSANDS OF DOLLARS
ACTUAL VALUELevy FiscalYear Year Residential Commercial Industrial Agricultural Utilities Other
2003 2005 2,912,339 1,296,665 167,366 14,088 221,476 602 2004 2006 3,126,797 1,317,790 165,524 14,030 230,234 919 2005 2007 3,361,503 1,437,813 162,735 14,715 233,767 1,123 2006 2008 3,531,282 1,451,082 158,288 14,580 247,982 1,418 2007 2009 3,747,601 1,562,748 171,687 14,782 239,523 2,317 2008 2010 3,784,782 1,579,002 163,691 14,589 262,718 3,076 2009 2011 3,838,410 1,569,003 154,658 20,246 272,575 3,088 2010 2012 3,924,743 1,610,948 146,875 20,370 278,170 3,074 2011 2013 4,011,589 1,566,209 139,106 24,753 287,690 2,832 2012 2014 4,060,982 1,517,909 137,393 24,607 302,338 3,120
Levy Fiscal TAXABLE VALUEYear Year Residential Commercial Industrial Agricultural Utilities Other
2003 2005 1,410,066 1,286,675 167,366 14,088 225,060 598 2004 2006 1,498,414 1,317,790 165,524 14,030 215,864 919 2005 2007 1,545,096 1,425,136 162,735 14,715 206,783 1,113 2006 2008 1,607,643 1,451,082 158,288 14,580 203,541 1,418 2007 2009 1,650,821 1,558,379 171,687 13,319 208,017 2,311 2008 2010 1,721,872 1,579,002 163,691 13,693 209,530 3,077 2009 2011 1,797,306 1,569,003 154,658 13,417 205,383 3,088 2010 2012 1,902,023 1,610,948 146,875 14,058 213,792 3,074 2011 2013 2,033,254 1,566,209 139,106 14,243 216,271 2,832 2012 2014 2,141,742 1,517,909 137,393 14,747 222,312 3,120
Notes: By state law all property subject to taxation is valued every 2 years subject to an equalization action of the State Department of Revenue. The Assessor establishes actualvaluation (100%) as of January 1 in a calendar year for taxes payable in the succeedingfiscal year. The actual value of property is provided by the assessor to the County Auditorwho then determines the taxable value. The taxable value is computed by adjusting the actual value of various classes of property by percentages (roll back rates) determined by the StateDepartment of Revenue. The roll back rates are applied to classes of property on a state-widebasis so that the increase in actual valuations of property in the State will not exceed 4% annually. For property values as of January 1, 2005, the roll back rate was 45.996% forresidential property and .85% for commercial and other. For the remaining classes of property,the taxable value was equal to 100% of actual value.
Source: Levy rate sheet and valuation from Scott County.
106

Less Military Total directGross valuation exemption Net valuation tax rate
4,612,536 (11,066) 4,601,470 15.24%4,855,294 (10,756) 4,844,538 15.24%5,211,656 (10,733) 5,200,923 15.58%5,404,632 (10,496) 5,394,136 15.58%5,738,658 (10,515) 5,728,143 15.58%5,807,858 (10,350) 5,797,508 15.58%5,857,980 (10,216) 5,847,764 15.53%5,984,180 (9,957) 5,974,223 15.53%6,032,179 (9,707) 6,022,472 16.78%6,046,349 (9,483) 6,036,866 16.78%
Less MilitaryGross valuation exemption Net valuation
3,103,853 (11,066) 3,092,787 3,212,541 (10,756) 3,201,785 3,355,578 (10,735) 3,344,843 3,436,552 (10,496) 3,426,056 3,604,534 (10,515) 3,594,019 3,690,865 (10,350) 3,680,515 3,742,855 (10,216) 3,732,639 3,890,770 (9,956) 3,880,814 3,971,915 (9,705) 3,962,210 4,037,223 (9,483) 4,027,740
107

CITY OF DAVENPORT
DIRECT AND OVERLAPPING PROPERTY TAX RATESLAST TEN FISCAL YEARS (rate per $1,000 of assessed value)
City Direct Rates
Fiscal Tort Trust & Debt Year General Liability Agency Library (1) Transit Emergency Service Total
2005 8.10 0.34 4.36 0.27 0.91 0.27 0.99 15.24 2006 8.10 0.30 4.40 0.27 0.91 0.27 0.99 15.24 2007 8.10 0.30 3.97 0.27 0.91 0.27 1.76 15.58 2008 8.10 0.30 3.97 0.27 0.91 0.27 1.76 15.58 2009 8.10 0.30 3.97 0.27 0.91 0.27 1.76 15.58 2010 8.10 0.30 3.97 0.27 0.91 0.27 1.76 15.58 2011 8.10 0.25 3.97 0.27 0.91 0.27 1.76 15.53 2012 8.10 0.25 3.97 0.27 0.91 0.27 1.76 15.53 2013 8.10 0.25 4.93 0.27 0.91 0.27 2.05 16.78 2014 8.10 0.25 4.93 0.27 0.91 0.27 2.05 16.78
(1) First year for voter approved Library Levy was fiscal year 2005.
Source: City of Davenport Finance Department
108

Overlapping Rates
Scott Davenport Area IXCounty Schools College Other Total
4.76 17.10 0.59 0.34 38.03 5.57 17.10 0.59 0.33 38.83 5.51 17.11 0.61 0.36 39.17 5.54 17.11 0.61 0.37 39.21 5.34 17.08 0.61 0.35 38.96 5.47 17.09 0.88 0.33 39.35 6.38 17.11 0.92 0.31 40.25 6.38 17.05 1.02 0.32 40.30 6.30 17.05 0.92 0.38 41.43 6.24 16.66 0.92 0.44 41.04
109
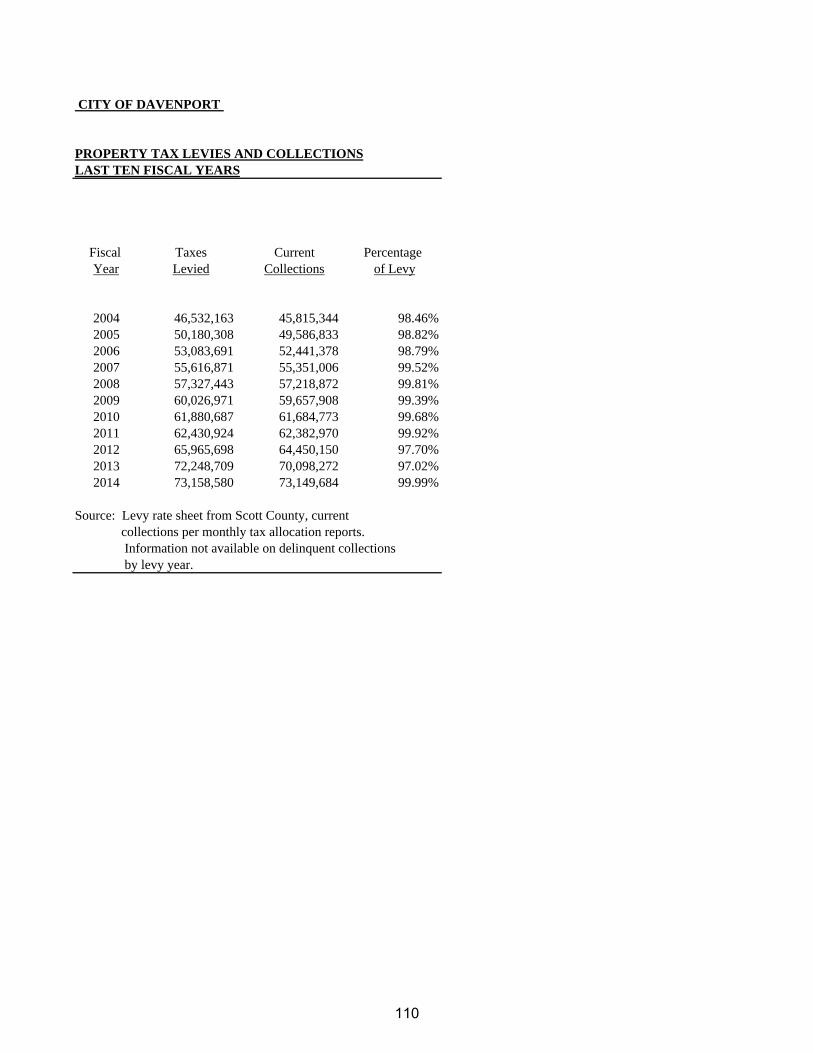
CITY OF DAVENPORT
PROPERTY TAX LEVIES AND COLLECTIONSLAST TEN FISCAL YEARS
Fiscal Taxes Current Percentage Year Levied Collections of Levy
2004 46,532,163 45,815,344 98.46%2005 50,180,308 49,586,833 98.82%2006 53,083,691 52,441,378 98.79%2007 55,616,871 55,351,006 99.52%2008 57,327,443 57,218,872 99.81%2009 60,026,971 59,657,908 99.39%2010 61,880,687 61,684,773 99.68%2011 62,430,924 62,382,970 99.92%2012 65,965,698 64,450,150 97.70%2013 72,248,709 70,098,272 97.02%2014 73,158,580 73,149,684 99.99%
Source: Levy rate sheet from Scott County, current collections per monthly tax allocation reports. Information not available on delinquent collections by levy year.
110

CITY OF DAVENPORT
PRINCIPAL PROPERTY TAX PAYERSCURRENT YEAR AND NINE YEARS AGO
2014 2005% of % of
Taxable taxable Taxable taxableName of Property Property type Valuation Rank value Valuation Rank value
Mid American Energy Utility 300,763,815$ 1 7.25% 156,830,731$ 1 5.07%Macerich North Park Mall LLC/SDG Macerich Properties Shopping Center 55,488,075 2 1.34% 72,986,200 2 2.36%Iowa-American Water Co. Utility 47,533,563 3 1.15% 46,683,123 3 1.51%Deere & Company Manufacturing 26,300,475 4 0.63% 22,036,631 4 0.71%QC Freight Service & John Deere Distribution Center Commercial 18,874,885 5 0.46%Hotel Blackhawk LLC Commercial 17,073,210 6 0.41% - THF Davenport North Development Realty 16,881,188 7 0.41% 18,277,607 7 0.59%Qwest Utility 13,881,476 8 0.33%Wal-Mart Commercial 13,581,485 9 0.33%Telecommunications 1031 Ventur Utility 13,358,900 10 0.32%Quanex Manufacturing - 20,862,200 5 0.67%Ryan Companies US Inc Logistics - 18,517,300 6 0.60%National Amusement Inc. Theatre Complexes - 18,254,200 8 0.59%US West Communications Utility - 15,451,415 9 0.50%Peterson Properties LC Industrial Center - 15,026,600 10 0.49% Total 523,737,072$ 12.63% 404,926,007$ 13.09%
Source: Scott County Auditor.
111

CITY OF DAVENPORT
RATIOS OF OUTSTANDING DEBT BY TYPELAST TEN FISCAL YEARS(dollars in thousands, except per capita)
GOVERNMENTAL BUSINESS-TYPEACTIVITIES ACTIVITIES
General Other General Other General Other Total PercentageFiscal Obligation Obligation Long-term Obligation Long-term Primary of Personal PerYear Bonds Debt Debt Bonds Debt Government Income (1) Capita (1)
2005 94,549 517 206 24,186 - 119,458 4.25% 1,226 2006 117,445 404 33 22,280 - 140,162 4.16% 1,439 2007 118,219 281 20 20,606 - 139,126 3.93% 1,424 2008 115,865 147 7 19,810 - 135,829 3.66% 1,372 2009 130,713 - - 18,392 - 149,105 3.88% 1,479 2010 144,488 - - 18,647 - 163,135 4.04% 1,610 2011 152,715 - - 24,384 - 177,099 unavailable 1,777 2012 180,909 - 311 41,206 9,798 232,224 unavailable 2,330 2013 165,485 - 311 45,934 9,798 221,528 unavailable 2,222 2014 157,606 - 311 50,837 14,208 222,962 unavailable 2,237
Note: Details regarding the city's outstanding debt can be found in the notes to the financial statements.
(1) See Demographic and economic statistics schedule for personal income and population data.
The personal income and population data is not yet available.
Source: City of Davenport Finance Department and U.S. Department of Commerce "Survey of Current Business: for Davenport, Rock Island, Moline SMSA.
112

CITY OF DAVENPORT
RATIOS OF GENERAL BONDED DEBT OUTSTANDINGLAST TEN FISCAL YEARS(dollars in thousands, except per capita)
General Percentage ofFiscal Obligation Taxable Value PerYear Debt of Property (1) Capita
2005 119,252 3.86% 1,224 2006 140,129 4.38% 1,439 2007 139,106 4.16% 1,424 2008 135,822 3.96% 1,372 2009 149,105 4.15% 1,479 2010 163,135 4.43% 1,610 2011 177,099 4.76% 1,777 2012 232,224 5.98% 2,330 2013 221,528 5.59% 2,222 2014 222,962 5.54% 2,237
Note: Details regarding the city's outstanding debt can be found in the notes to the financial statements.
(1) See Assessed and Taxable Value table for property value data.
Source: City of Davenport Finance Department and Scott County Auditor's Office.
113

CITY OF DAVENPORT
DIRECT AND OVERLAPPING GOVERNMENTAL ACTIVITIES DEBTAS OF JUNE 30, 2014(dollars in thousands)
Percentage Share ofGovernmental Unit Debt applicable Overlapping
Outstanding to City Debt
Davenport Community School District 9,535,000$ 88.04% 8,394,614$
Scott County 30,015,000 52.39% 15,724,859
Eastern Iowa Community College 58,615,000 31.00% 18,170,650 Subtotal, overlapping debt 42,290,123
City direct debt 155,877,270
Total direct and overlapping debt 198,167,393$
Sources: Debt outstanding data provided by each governmental unit. Percent applicableto city provided by Scott County. The City direct debt does not include business type activity debt.The percentage applicable to the City is based on shared tax base.
114

115

CITY OF DAVENPORT
LEGAL DEBT MARGIN INFORMATIONLAST TEN FISCAL YEARS
Fiscal year 2005 2006 2007 2008
Debt limit 232,991,693$ 246,426,202$ 263,977,950$ 274,332,381$
Total net debt applicable to limit 128,381,797 148,929,153 148,364,852 148,501,164
Legal debt margin 104,609,896$ 97,497,049$ 115,613,098$ 125,831,217$
Total net debt applicable to the limit as a percentage of debt limit 55.10% 60.44% 56.20% 54.13%
Note: Iowa State law limits local governments debt to 5% of its gross assessed valuation.
Source: City of Davenport Finance Department.
116

Legal debt margin calculation for Fiscal Year 2014Assessed valuation 6,145,385,857$ Debt limit (5% of assessed value) 307,269,293$ Debt applicable to limit: General Obligation Bonds 200,100,000 Tax Increment Financing Rebate Agreements subject to limit 5,487,350 Total G.O. Indebtedness 205,587,350 Legal debt margin 101,681,943$
2009 2010 2011 2012 2013 2014
290,703,247$ 295,219,101$ 297,663,843 303,752,150 306,921,649 307,269,293$
159,957,382 176,092,605 189,966,525$ 235,046,500 221,979,300 205,587,350
130,745,865$ 119,126,496$ 107,697,318$ 68,705,650$ 84,942,349$ 101,681,943$
55.02% 59.65% 63.82% 77.38% 72.32% 66.91%
117

CITY OF DAVENPORT
DEMOGRAPHIC AND ECONOMIC STATISTICSLAST TEN YEARS
Per CapitaPersonal Personal School Unemployment
Year Population (2) Income Income (3) Enrollment (4) Rate (5)
2004 97,700 2,773,116,800 28,384 16,077 4.5%2005 97,400 2,811,840,600 28,869 15,543 4.8%2006 97,400 3,366,046,600 34,559 15,674 4.3%2007 97,682 3,536,869,856 36,208 15,365 4.3%2008 98,975 3,715,026,625 37,535 15,967 4.3%2009 101,335 3,837,979,755 38,065 15,405 4.3%2010 99,685 4,041,341,135 39,881 15,407 7.2%2011 99,685 4,270,106,660 42,836 16,131 7.5%2012 99,685 4,370,888,195 43,847 15,940 6.8%2013 99,685 N/A (1) N/A (1) 15,990 6.5%
Sources:
(1) Information not available at time of printing
(2) Sales and Marketing Management, Survey of Buying Power, September issues.
(3) BEA website-AMSA04-Advance Metropolitan Statistical Area Income Summary for Davenport, Rock Island, Moline SMSA as of calendar year end.
(4) Davenport Community School District based on census at start of school year.
(5) Iowa Workforce Development, for Davenport as of calendar year end
118

CITY OF DAVENPORT
PRINCIPAL EMPLOYERSCURRENT YEAR AND NINE YEARS AGO
Employer Percentage of Percentage ofTotal City Total City
Employees Rank Employment Employees Rank Employment
Genesis Medical Centers 3,811 1 7.37% 4,900 1 7.84%Northpark Mall 3,000 2 5.80% - Davenport Community Schools 2,402 4 4.65% 2,500 2 4.00%ALCOA 2,513 3 4.86% 2,250 3 3.60%Kraft Foods/Oscar Mayer 1,629 5 3.15% 1,500 4 2.40%City of Davenport 963 7 1.86% 1,149 5 1.84%Rhythm City Casino/Isle Capri 554 13 1.07% 1,050 6 1.68%MidAmerican Energy Company - 0.00% 1,025 7 1.64%Eastern Iowa Community College 1,034 6 2.00% 1,016 8 1.63%John Deere Davenport Works 875 9 1.69% - APAC Teleservices 950 8 1.84% 900 9 1.44%Wells Fargo-Davenport Region - 0.00% 716 10 1.15%AT&T - 0.00% 610 11 0.98%Sears Manufacturing 600 10 1.16% 600 12 0.96%United Parcel Service 600 11 1.16% 590 13 0.94%Von Maur 569 12 1.10% 560 14 0.90%Scott County 425 15 0.82% 500 15 0.80%St. Ambrose University 550 14 1.06% 467 16 0.75%Nestle Purina 359 16 0.69% - Quad City Times/Lee Enterprises 350 17 0.68% -
21,184 40.97% 20,333 32.52%
Source: Quad City Development Group, Direct staff contact with Company (October 2004)Source: Iowa Quad Cities Chamber of Commerce (December 2013)
12/01/201310/01/2004
119
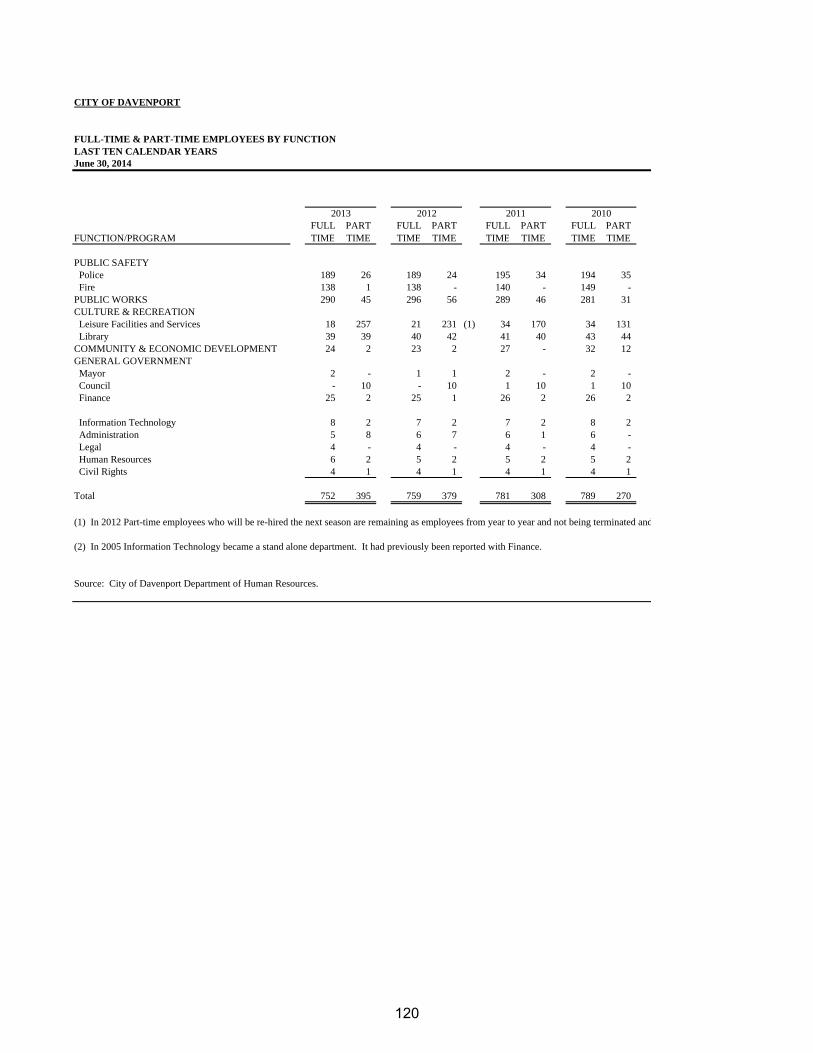
FUNCTION/PROGRAMFULLTIME
PARTTIME
FULLTIME
PARTTIME
FULLTIME
PARTTIME
FULLTIME
PARTTIME
PUBLIC SAFETY Police 189 26 189 24 195 34 194 35 Fire 138 1 138 - 140 - 149 - PUBLIC WORKS 290 45 296 56 289 46 281 31 CULTURE & RECREATION Leisure Facilities and Services 18 257 21 231 (1) 34 170 34 131 Library 39 39 40 42 41 40 43 44 COMMUNITY & ECONOMIC DEVELOPMENT 24 2 23 2 27 - 32 12 GENERAL GOVERNMENT Mayor 2 - 1 1 2 - 2 - Council - 10 - 10 1 10 1 10 Finance 25 2 25 1 26 2 26 2
Information Technology 8 2 7 2 7 2 8 2 Administration 5 8 6 7 6 1 6 - Legal 4 - 4 - 4 - 4 - Human Resources 6 2 5 2 5 2 5 2 Civil Rights 4 1 4 1 4 1 4 1
Total 752 395 759 379 781 308 789 270
(1) In 2012 Part-time employees who will be re-hired the next season are remaining as employees from year to year and not being terminated and
(2) In 2005 Information Technology became a stand alone department. It had previously been reported with Finance.
Source: City of Davenport Department of Human Resources.
2012 2010
FULL-TIME & PART-TIME EMPLOYEES BY FUNCTION
CITY OF DAVENPORT
LAST TEN CALENDAR YEARSJune 30, 2014
2013 2011
120
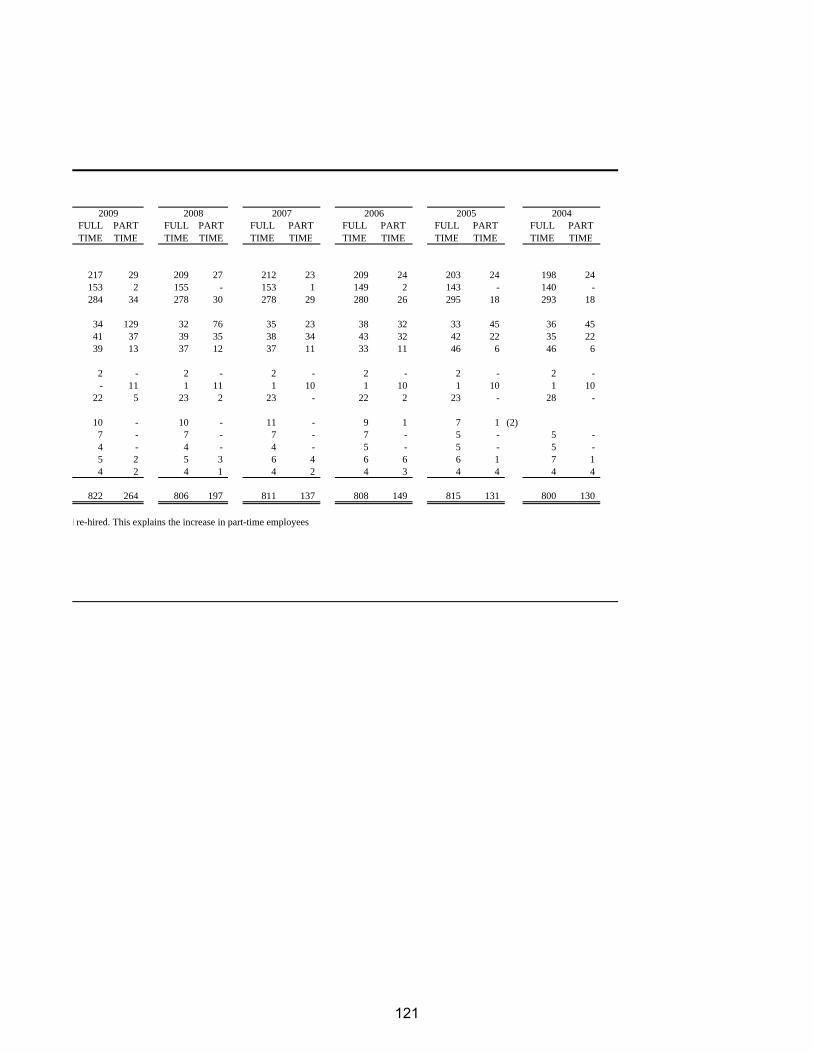
FULLTIME
PARTTIME
FULLTIME
PARTTIME
FULLTIME
PARTTIME
FULL TIME
PART TIME
FULL TIME
PART TIME
FULL TIME
PART TIME
217 29 209 27 212 23 209 24 203 24 198 24 153 2 155 - 153 1 149 2 143 - 140 - 284 34 278 30 278 29 280 26 295 18 293 18
34 129 32 76 35 23 38 32 33 45 36 45 41 37 39 35 38 34 43 32 42 22 35 22 39 13 37 12 37 11 33 11 46 6 46 6
2 - 2 - 2 - 2 - 2 - 2 - - 11 1 11 1 10 1 10 1 10 1 10
22 5 23 2 23 - 22 2 23 - 28 -
10 - 10 - 11 - 9 1 7 1 (2)7 - 7 - 7 - 7 - 5 - 5 - 4 - 4 - 4 - 5 - 5 - 5 - 5 2 5 3 6 4 6 6 6 1 7 1 4 2 4 1 4 2 4 3 4 4 4 4
822 264 806 197 811 137 808 149 815 131 800 130
d re-hired. This explains the increase in part-time employees.
200420052008 20072009 2006
121

FISCAL YEAR
FUNCTION/PROGRAM 2014 2013 2012 2011 2010
PUBLIC SAFETYFire calls answered 16,373 16,467 15,523 14,965 14,399 Police-arrests (1) 7,632 5,072 6,907 7,151 7,529 Construction permits issued 2,602 2,483 2,402 2,510 2,426
PUBLIC WORKSRefuse collected (tons) (2) 26,920 26,759 24,949 25,604 25,737 Gallons of wastewater processed (in millions) (1) 8,541 9,855 8,015 10,877 11,607 Yard waste composted (cu yds) 101,373 109,972 152,564 103,379 102,176 Citibus ridership 1,362,174 1,407,131 1,414,496 1,202,929 1,180,383 Utility service customers 39,500 39,000 38,000 40,000 40,000
CULTURE & RECREATIONRounds of golf played 64,063 64,029 77,519 71,243 80,113 Swimming pools attendance 28,191 28,170 32,590 40,874 30,830 Recreation programs available 984 845 1,272 910 549 Recreation program enrollment 5,733 6,342 6,235 57,600 42,500 Library - walk-in patrons served 481,592 463,971 503,778 578,957 511,259
COMMUNITY & ECONOMIC DEVELOPMENTPlanning & zoning-final development review 9 13 13 5 2 Households assisted with rental assistance 842 825 783 768 750
(1) Amounts for FY 08 and prior have been changed to fiscal year amounts from calendar year amounts
(2) Amounts for FY 08 and prior were measured in cubic yds
Source: Various City of Davenport departments.
CITY OF DAVENPORT
OPERATING INDICATORS BY FUNCTIONLAST TEN FISCAL YEARSJune 30, 2014
122
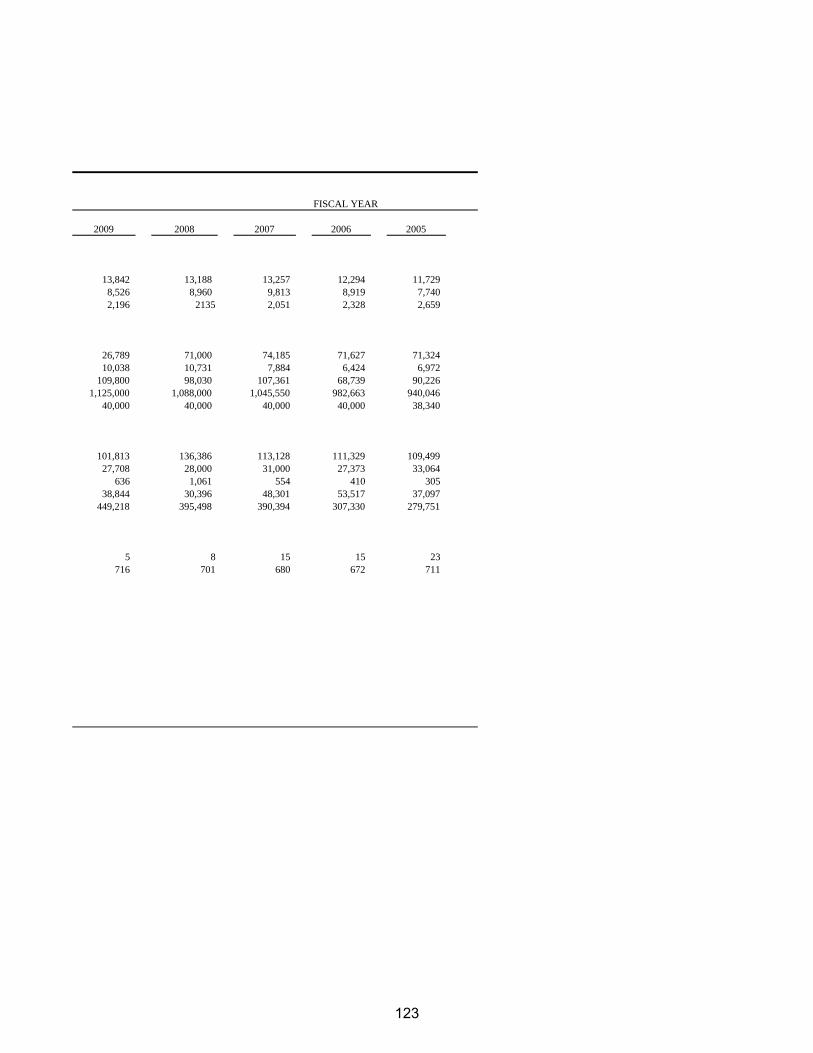
FISCAL YEAR
2009 2008 2007 2006 2005
13,842 13,188 13,257 12,294 11,729 8,526 8,960 9,813 8,919 7,740 2,196 2135 2,051 2,328 2,659
26,789 71,000 74,185 71,627 71,324 10,038 10,731 7,884 6,424 6,972
109,800 98,030 107,361 68,739 90,226 1,125,000 1,088,000 1,045,550 982,663 940,046
40,000 40,000 40,000 40,000 38,340
101,813 136,386 113,128 111,329 109,499 27,708 28,000 31,000 27,373 33,064
636 1,061 554 410 305 38,844 30,396 48,301 53,517 37,097
449,218 395,498 390,394 307,330 279,751
5 8 15 15 23 716 701 680 672 711
123

FISCAL YEAR
FUNCTION/PROGRAM 2014 2013 2012 2011 2010
PUBLIC SAFETYPolice cars 105 104 82 83 74 Fire stations 7 7 7 7 7 Fire trucks 16 16 16 16 16
PUBLIC WORKSStreets (miles) 695 695 695 695 695 Traffic signals 166 166 161 156 153 Street lights 9708 9,703 9,691 9,691 9,680 Refuse collection trucks 32 32 29 31 31 Buses 22 21 23 21 21
CULTURE & RECREATIONGolf courses 3 3 3 3 3 Acres of parks 1,981 1,913 1,913 1,700 1,700 Swimming pools 3 3 3 3 3 Libraries 3 3 3 3 3
Note: No capital asset indicators are available for General Government and Community & Economic Development functions.
Source: City of Davenport Summary of Fixed Assets Report.
CITY OF DAVENPORT
CAPITAL ASSET STATISTICS BY FUNCTIONLAST TEN FISCAL YEARSJune 30, 2014
124

FISCAL YEAR
2009 2008 2007 2006 2005
64 67 94 77 68 7 7 7 7 7
16 16 14 13 13
695 692 692 690 684 153 152 151 150 146
9,632 9,558 9,456 9,237 9,263 34 30 36 48 40 21 20 20 20 20
3 4 4 4 4 1,700 1,700 1,700 1,700 1,700
3 4 4 4 4 2 2 2 2 1
125


![Consolidated Financial Results for the Fiscal Year Ended ...Note: Comprehensive income Fiscal year ended March 31, 2019: ¥1,761 million [24.3%] Fiscal year ended March 31, 2018: ¥1,417](https://img.dokumen.tips/doc/110x75/5fe4d06806b4775830253106/consolidated-financial-results-for-the-fiscal-year-ended-note-comprehensive.jpg)