Embed Size (px)
Citation preview

CITY OF FULSHEAR, TEXAS
COMPREHENSIVE ANNUAL FINANCIAL REPORT
Year Ended September 30, 2018


CITY OF FULSHEAR, TEXAS
COMPREHENSIVE ANNUAL
FINANCIAL REPORT
FOR THE FISCAL YEAR ENDED
SEPTEMBER 30, 2018
Prepared by the Finance Department


CITY OF FULSHEAR, TEXAS COMPREHENSIVE ANNUAL FINANCIAL REPORT
TABLE OF CONTENTS
Page
Introduction Section
Letter of Transmittal i
Organization Chart v
Principal City Officials vi
Financial Section
Report of Independent Auditors 1
Management’s Discussion and Analysis 4
Basic Financial Statements
Government-Wide Financial Statements:
Statement of Net Position 14
Statement of Activities 16
Fund Financial Statements:
Governmental Funds:
Balance Sheet - Governmental Funds 18
Reconciliation of the Governmental Funds Balance Sheet to the
Governmental Activities Statement of Net Position
19
Statement of Revenues, Expenditures, and Changes in Fund Balances -
Governmental Funds
20
Reconciliation of the Statement of Revenues, Expenditures, and
Changes in Fund Balances of Governmental Funds to the
Governmental Activities Statement of Activities
21
Statement of Net Position – Proprietary Fund 22
Statement of Revenues, Expenses, and Changes in Fund Net Position –
Proprietary Fund
23
Statement of Cash Flows – Proprietary Fund 24
Notes to the Financial Statements 25

Page
Required Supplementary Information
General Fund - Schedule of Revenues, Expenditures, and Changes in Fund
Balance - Budget and Actual
46
Notes to Required Supplementary Information 47
Required Pension System Supplementary Information
Schedule of Changes in Net Pension Liability and Related Ratios 48
Combining and Individual Fund Statements and Schedules
Nonmajor Governmental Funds:
Combining Balance Sheet
54
Combining Statement of Revenues, Expenditures, and Changes in Fund
Balances
55
Discretely Presented Component Units:
Combining Balance Sheet
56
Combining Statement of Revenues, Expenditures, and Changes in Fund
Balances
58
Table Page
Statistical Section
Net Position by Component 1 62
Changes in Net Position 2 64
Fund Balances of Governmental Funds 3 68
Changes in Fund Balances of Governmental Funds 4 70
Assessed Value and Estimated Actual Value of Taxable Property 5 72
Property Tax Rates – Direct and Overlapping Governments 6 74
Principal Property Taxpayers 7 75
Property Tax Levies and Collections 8 76
Taxable Sales by Category 9 78
Direct and Overlapping Governmental Activities Debt 10 80
Demographic and Economic Statistics 11 81
Principal Employers 12 83
Full-time Equivalent City Government Employees by Function 13 84
Operating Indicators by Function 14 86
Capital Assets Statistics by Function 15 88

INTRODUCTORY SECTION

(This section intentionally left blank.)

i
CITY OF FULSHEAR
PO Box 279 /
Fulshear, Texas 77441
www.fulsheartexas.gov
To the Honorable Mayor, Members of the City Council, and Citizens of the City of Fulshear, Texas:
It is with great pleasure that we present to you a copy of the Comprehensive Annual Financial Report
(CAFR) of the City of Fulshear, Texas (the City) for the fiscal year ended September 30, 2018. The
responsibility for both the accuracy of the presented information and the completeness and fairness of the
presentation of the data, including all disclosures, rests with the City. To the best of our knowledge and
belief, the enclosed data is accurate in all material respects and is reported in a manner designed to present
fairly the results of operations of the various funds of the City, as well as the fund balances. All disclosures
necessary to enable the reader to gain an understanding of the City's financial activities have been included.
The CAFR is presented in three sections: Introductory, Financial, and Statistical. The Introductory Section
includes this transmittal letter, the City's organizational chart, and a list of principal officials, elected and
appointed. The Financial Section includes Management's Discussion and Analysis (MD&A), Basic
Financial Statements, Required Supplementary Information, Combining and Individual Fund Financial
Statements and Schedules, as well as the independent auditors' report. The Statistical Section includes
selected financial and demographic information generally presented on a multi-year basis.
MD&A immediately follows the independent auditors' report and provides a narrative introduction,
overview, and analysis of the basic financial statements. MD&A complements this letter and should be read
in conjunction with it.
Profile of the Government
The City, incorporated on November 7, 1977, is located in northern Fort Bend County west of Houston,
Texas, in a rapidly growing area of the County. The City currently occupies a land area of 12 square miles
and serves an estimated population of 13,498. The City of Fulshear is empowered to levy a property tax on
both real and personal properties located within its boundaries. It is also empowered by state statute to
extend its corporate limits by annexation, which occurs when deemed appropriate by the governing council.
The City has operated under the Council-manager form of government since December 2015. Policy-
making and legislative authority are vested in a governing council consisting of the Mayor and seven (7)
Council members, two (2) of which shall be elected at large by majority vote, and five (5) of which shall
be elected by majority vote of a single-member district in which they must reside. The governing council
is responsible for, among other things, passing ordinances, adopting the budget, appointing committees,
and hiring both the City Manager, City Attorney and Municipal Judge. The City Manager is responsible for
carrying out the policies and ordinances of the governing Council, for overseeing the day-to-day operations
of the government, and for appointing the heads of the various departments.
The City provides a full range of services, including police protection; public improvements, sanitation,
repair and maintenance of infrastructure, recreation and general administrative services. As an independent
political subdivision of the State of Texas governed by an elected Mayor and seven (7) Council members,
the City is considered a primary government. In accordance with standards established by the
Governmental Accounting Standards Board, the City reports all funds for which the City, as the primary
government, is accountable.

ii
The annual budget serves as the foundation for the City's financial planning and control. All departments
of the City are required to submit requests for appropriation to the Chief Financial Officer. These requests
serve as a starting point for developing a proposed budget. The Chief Financial Officer provides the
information to the City Manager who then presents this proposed budget to the Council for review. The
Council is required to hold public hearings on the proposed budget and to adopt a final budget no later than
September 30, the close of the City's fiscal year. The appropriated budget is prepared by fund and
department. Department heads may make requests to the City Manager for transfers of appropriations
within a department. Transfers of appropriations between departments, however, require the approval of
the City Council. Budget-to-actual comparisons are provided in this report for each individual governmental
fund for which an appropriated annual budget has been adopted. For the general fund, this comparison is
presented on Page 46 as part of required supplementary information.
Factors Affecting Financial Condition
The information presented in the financial statements is better understood when it is considered from the
broader perspective of the specific environment within which the City of Fulshear operates.
Local Economy
The first hill west of Houston is located in the heart of Fulshear, the fastest growing city in Texas according
to 2016 population estimates. Fulshear has a highly educated, affluent demographic, with nearly 64% of
the population holding a bachelor’s degree or higher and earning a median household income of $167,700.
Taxable values for Fiscal Year 2018 reflect an increase of 13.15 percent to $1.36 billion. This property
value increase is the result of continued development within the City including both residential and
commercial construction.
Sales tax revenues increased 61 percent during fiscal year 2018. The City had anticipated this revenue
source due to a Strategic Partnership Agreement being implemented when the budget was adopted. At this
writing, for fiscal year 2019, sales taxes are 43.40 percent higher than the first four months of fiscal year
2018. New residential and commercial development continues to increase through the City and the
surrounding area.
Economic Outlook
The largest revenue sources in the General Fund are property tax, sales tax and building fees. These are all
driven and sustained by continued growth of commercial and residential construction. The City has
experienced significant commercial and retail growth over the last several years and expects the growth to
continue based on preliminary development plans presented various developers.
In the first four months of fiscal year 2019 building permits, building inspections and plan reviews have
seen all an increase compared to the first four month of fiscal year 2018.
Within the next 12 months we will see considerable new residential activity in Polo Ranch, and other tracts
west of downtown Fulshear. In addition, new sections in Fulshear Run, Fulbrook on Fulshear Creek, Cross
Creek Ranch, Jordan Ranch and Tamarron will be coming online. Commercial construction activity
continues to pick-up with a new Popeye's, Valvoline, and Bancorp South Bank being completed in the near
future. Downtown Fulshear continues to draw varied interest in redevelopment opportunities, which will
likely grow with the recent publication of the Fulshear Liveable Centers Study. Two daycares’ have been
recently permitted for the Jordan Ranch and Cross Creek Ranch developments. Lastly, two large
commercial developments are under construction and will each house multiple businesses, the Shoppes at
Cross Creek Ranch and the Marcel Town Center. In the Multi-Family sector, the pace of growth continues

iii
to quicken as well with Parklane at Fulshear having new buildings being completed this spring, Tamarron
having a multi-family project soon to be approved, and an age-restricted apartment on the horizon for this
year as well.
Financial Information
The City's management team is responsible for establishing and maintaining internal controls designed to
ensure that the assets of the City are protected from loss, theft, or misuse and to ensure that adequate
accounting data is compiled to allow for the preparation of financial statements in conformity with generally
accepted accounting principles. Internal controls are designed to provide reasonable but not absolute
assurance that these objectives are met. The concept of reasonable assurance recognizes that (1) the cost of
the controls should not exceed the benefits likely to be derived and (2) the valuation of cost and benefits
requires estimates and judgments to be made by management.
Budgeting Controls
The City maintains budgetary controls to ensure compliance with legal provisions embodied in the annual
appropriated budget approved by the City Council. Activities of the General Fund, Special Revenue Funds,
Utility Fund, and Internal Service Funds are included in the annual operating budget. The City of Fulshear
Development Corporation and the Fulshear Development Corporation, component units of the City, are
budgeted separately but approved by the City Council as a component of the Annual Budget. A capital
improvement plan is approved each year by the City Council and funded through a separate capital projects
fund. The level of budgetary control (i.e., the level at which expenditures cannot legally exceed the
appropriated amount) is established at the Fund level. As demonstrated by the statements and schedules
included in the financial section of this report, the City continues to meet its responsibility for sound
financial management.
Debt Administration
Currently, the City has issued no General Obligation Bonds or Certificates of Obligation. The City may
issue General Obligation bonds that are approved by voters in a capital improvements plan.
Lapse of Appropriations
Every appropriation, except an appropriation for a capital expenditure, shall lapse at the close of the fiscal
year to the extent that it has not been expended or encumbered. An appropriation for a capital expenditure
shall continue in force until the purpose for which it was made has been accomplished or abandoned.
Awards
The City will be submitting this report to the Government Finance Officers' Association (GFOA) for the
Certificate of Achievement for Excellence in Financial Reporting to the City for its Comprehensive Annual
Financial Report for the fiscal year ended September 30, 2018. This will be the first year that the City has
submitted for this award. In order to be awarded the Certificate of Achievement, the City published an
easily readable and efficiently organized Comprehensive Annual Financial Report. This report satisfies
both generally accepted accounting principles and applicable legal requirements. The Certificate of
Achievement is held for a period of one year only.
The City also received the Distinguished Budget Presentation Award for the fiscal year beginning October
1, 2017. This was the City’s first submittal for this award and has submitted the annual budget for fiscal
year beginning October 1, 2018 to the GFOA for consideration of award for the second year. The award is
made to those cities whose budget presentations meet very stringent presentation guidelines. The budget

iv
document must be of the very highest quality that reflects both the guidelines established by the National
Advisory Council on State and Local Budgeting and the GFOA's recommended practices on budgeting.
Acknowledgements
The preparation of this report would not have been possible without the efficient and dedicated services of
the administrative staff of the City and the members of the Finance Department. We also would like to
express our appreciation to all members of the departments who assisted and contributed to the preparation
of this report. Credit must also be given to the Mayor and the City Council for their unfailing support for
maintaining the highest standards of professionalism in the management of the City of Fulshear's finances.
Respectfully submitted,
Wes Vela, CPA, CPM
Chief Financial Officer

v

CITY OF FULSHEAR, TEXAS PRINCIPAL OFFICIALS
September 30, 2018
vi
Governing Body
Aaron Groff Mayor
Kaye Kahlich Mayor Pro-Tem and Council
Member
Kent Pool Council Member
John Kelly Council Member
Dana Hollingsworth Council Member
Debra Cates Council Member
Lisa Kettler Martin Council Member
Joel M. Patterson Council Member
Other Principal Official
Jack Harper City Manager
Kim Kopecky City Secretary
Wes Vela Chief Financial Officer
J. Grady Randle City Attorney

FINANCIAL SECTION

(This page intentionally left blank.)

Houston Office 3737 Buffalo Speedway Suite 1600 Houston, Texas 77098 713.621.1515 Main whitleypenn.com
1
REPORT OF INDEPENDENT AUDITORS
To The Honorable Mayor and
City Council Members of the
City of Fulshear, Texas
Report on Financial Statements
We have audited the accompanying financial statements of the governmental activities, the business-type
activities, the aggregate discretely presented component units, each major fund, and the aggregate remaining
fund information of the City of Fulshear, Texas (the “City”) as of and for the year ended September 30, 2018,
and the related notes to the financial statements, which collectively comprise the City’s basic financial
statements as listed in the table of contents.
Management’s Responsibility for the Financial Statements
Management is responsible for the preparation and fair presentation of these financial statements in
accordance with accounting principles generally accepted in the United States of America; this includes the
design, implementation, and maintenance of internal control relevant to the preparation and fair presentation
of financial statements that are free from material misstatement, whether due to fraud or error.
Auditor’s Responsibility
Our responsibility is to express opinions on these financial statements based on our audit. We conducted our
audit in accordance with auditing standards generally accepted in the United States of America. Those
standards require that we plan and perform the audit to obtain reasonable assurance about whether the financial
statements are free of material misstatement.
An audit involves performing procedures to obtain audit evidence about the amounts and disclosures in the
financial statements. The procedures selected depend on the auditor’s judgment, including the assessment
of the risks of material misstatement of the financial statements, whether due to fraud or error. In making
those risk assessments, the auditor considers internal control relevant to the entity’s preparation and fair
presentation of the financial statements in order to design audit procedures that are appropriate the
circumstances, but not for the purpose of expressing an opinion on the effectiveness of the entity’s internal
control. Accordingly, we express no such opinion. An audit also includes evaluating the appropriateness of
accounting policies used and the reasonableness of significant accounting estimates made by management,
as well as evaluating the overall presentation of the financial statements.
We believe that the audit evidence we have obtained is sufficient and appropriate to provide a basis for our
audit opinions.
Opinions
In our opinion, the financial statements referred to above present fairly, in all material respects, the
respective financial position of the governmental activities, business-type activities, the aggregate
discretely presented component units, each major fund, and the aggregate remaining fund information of
the City as of September 30, 2018, and the respective changes in financial position and, where applicable,
cash flows thereof for the year then ended in accordance with accounting principles generally accepted in
the United States of America.

To The Honorable Mayor and
City Council Members of the
2
Other Matters
Required Supplementary Information
Accounting principles generally accepted in the United States of America require that the management’s
discussion and analysis on pages 3 through 11, budgetary comparison information on pages 46 and 47, and
pension system supplementary information on pages 48 and 49 be presented to supplement the basic
financial statements. Such information, although not a part of the basic financial statements, is required by
the Governmental Accounting Standards Board, who considers it to be an essential part of financial
reporting for placing the basic financial statements in an appropriate operational, economic, or historical
context. We have applied certain limited procedures to the required supplementary information in
accordance with auditing standards generally accepted in the United States of America, which consisted of
inquiries of management about the methods of preparing the information and comparing the information
for consistency with management’s responses to our inquiries, the basic financial statements, and other
knowledge we obtained during our audit of the basic financial statements. We do not express an opinion or
provide any assurance on the information because the limited procedures do not provide us with sufficient
evidence to express an opinion or provide any assurance.
Other Information
Our audit was conducted for the purpose of forming opinions on the financial statements that collectively
comprise the City’s basic financial statements. The combining nonmajor fund financial statements and the
discretely presented component unit fund financial statements are presented for purposes of additional
analysis and are not a required part of the basic financial statements.
The combining nonmajor fund financial statements and the discretely presented component unit fund
financial statements are the responsibility of management and were derived from and relate directly to the
underlying accounting and other records used to prepare the basic financial statements. Such information
has been subjected to the auditing procedures applied in the audit of the basic financial statements and
certain additional procedures, including comparing and reconciling such information directly to the
underlying accounting and other records used to prepare the basic financial statements or to the basic
financial statements themselves, and other additional procedures in accordance with auditing standards
generally accepted in the United States of America. In our opinion, the combining nonmajor fund financial
statements are fairly stated, in all material respects, in relation to the basic financial statements as a whole.
Houston, Texas
March 19, 2019
3
MANAGEMENT’S DISCUSSION AND ANALYSIS

CITY OF FULSHEAR, TEXAS MANAGEMENT’S DISCUSSION AND ANALYSIS
4
As management of the City of Fulshear (the “City”), we offer readers of the City’s financial statements this
narrative overview and analysis of the financial activities of the City for the fiscal year ended September
30, 2018.
Financial Highlights
The City’s assets and deferred outflows of resources exceeded its liabilities and deferred inflows
of resources at the close of the most recent fiscal year by $121.9 million (net position). Of this
amount, $12.2 million (unrestricted net position) may be used to meet the government's ongoing
obligations to citizens and creditors.
The government's total net position increased by $7.3 million.
As of the close of the current fiscal year, the City’s governmental funds reported combined ending
fund balances of $8.1 million, an increase of $2.8 million over the prior year mainly due to General
Fund as a result of increase in property tax, sales tax, licenses and permits, and charge for services.
Approximately 78% of this total amount, $6.3 million, is available for spending at the government's
discretion (unassigned fund balance).
At the end of the current fiscal year, unassigned fund balance for the general fund was 76% of total
general fund expenditures.
Overview of the Financial Statements
This discussion and analysis is intended to serve as an introduction to the City’s basic financial statements.
The City’s basic financial statements are comprised of three components: (1) government-wide financial
statements, (2) fund financial statements, and (3) notes to the financial statements. This report also contains
other supplementary information in addition to the basic financial statements themselves.
Government-wide Financial Statements
The government-wide financial statements are designed to provide readers with a broad overview of the
City’s finances, in a manner similar to a private-sector business.
The statement of net position presents information on all of the City’s assets, deferred outflows of resources,
liabilities and deferred inflows of resources, with the difference between the four reported as net position.
Over time, increases or decreases in net position may serve as a useful indicator of whether the financial
position of the City is improving or deteriorating.
The statement of activities presents information showing how the government’s net position changed during
the most recent fiscal year. All changes in net position are reported as soon as the underlying event to the
change occurs, regardless of timing of related cash flows. Thus, revenues and expenses are reported in this
statement for some items that will only result in cash flows in the future fiscal periods (e.g. municipal court
fines).
Both of the government-wide financial statements distinguish functions of the City that are principally
supported by taxes and intergovernmental revenues (governmental activities) from other functions that are
intended to recover all or a significant portion of their costs through user fees and charges (business-type
activities). The governmental activities of the City include general government, permits and inspections,
public safety, and public works. The business-type activities of the City include water distribution,
wastewater collection/treatment, and solid waste operating funds.

CITY OF FULSHEAR, TEXAS MANAGEMENT’S DISCUSSION AND ANALYSIS (continued)
5
Government-wide Financial Statements (continued)
The government-wide financial statements include not only the City itself (known as the primary
government), but also legally separate entities for which the City is financially accountable. Financial
information for these discretely presented component units is reported separately from the financial
information presented for the primary government itself. The City’s two discretely presented component
units consist of the following: Fulshear Development Corporation and The City of Fulshear Development
Corporation.
The government-wide financial statements can be found on pages 14 through 17 of this report.
Fund Financial Statements
A fund is a grouping of related accounts that is used to maintain control over resources that have been
segregated for specific activities or objectives. The City, like other state and local governments, uses fund
accounting to ensure and demonstrate compliance with finance-related legal requirements. All of the funds
of the City can be divided into two categories: governmental funds and proprietary funds.
Governmental Funds Governmental funds are used to account for essentially the same functions reported as governmental
activities in the government-wide financial statements. However, unlike the government-wide financial
statements, governmental fund financial statements focus on near-term inflows and outflows of spendable
resources, as well as on balances of spendable resources available at the end of the fiscal year. Such
information may be useful in evaluating a government’s near-term financing requirements. Because the focus of governmental funds is narrower than that of the government-wide financial statements,
it is useful to compare the information presented for governmental funds with similar information presented
for governmental activities in the government-wide financial statements. By doing so, readers may better
understand the long-term impact of the government’s near-term financing decisions. Both the
governmental funds balance sheet and the governmental funds statement of revenues, expenditures and
changes in fund balances provide a reconciliation to facilitate this comparison between governmental funds
and governmental activities. The City maintains six (6) individual governmental funds. Information is presented separately in the
governmental fund balance sheet and in the governmental fund statement of revenues, expenditures, and
changes in fund balances for the each of the six (6) funds with the General Fund considered to be the only
major fund. The governmental funds financial statements can be found on pages 18 through 21 of this report. Proprietary Funds The City maintains two types of proprietary funds: enterprise funds and internal service fund. Proprietary
funds are used to report the same functions presented as the business-type activities in the government-wide
financial statements. The City uses two enterprise funds to account for its water distribution, wastewater
collection/treatment, and solid waste operations.
The proprietary fund financial statements provide separate information for the Fulshear Facility Fund and
Cross Creek Ranch Facility Fund that are considered to be major funds of the City.
The internal service fund is an accounting device used to accumulate and allocate costs internally among
the City’s various functions. The City uses internal service fund to account for its fleet of vehicles and is

CITY OF FULSHEAR, TEXAS MANAGEMENT’S DISCUSSION AND ANALYSIS (continued)
6
included within governmental activities in the government-wide financial statements. The City utilizes
vehicle replacement fund which accounts for the pre-funding of vehicles for the City.
Proprietary fund financial statements provide the same type of information as the government-wide
financial statements, only in more detail.
The basic proprietary fund financial statements can be found on pages 22 through 24 of this report. Notes to the Basic Financial Statements The notes provide additional information that is essential to a full understanding of the data provided in the
government-wide and fund financial statements. The notes to the financial statements can be found on
pages 25 through 44 of this report.
Other Information In addition to the basic financial statements and accompanying notes, this report also presents required
supplementary information -- Schedules of Revenues, Expenditures, and Changes in Fund Balance - Budget
and Actual for the General Fund and information concerning the City’s progress in funding its obligation
to provide pension benefits to its employees. Required supplementary information can be found on pages
46 through 49 of this report.
Government-wide Financial Analysis
As noted earlier, net position may serve over time as a useful indicator of the City’s financial position. In
the case of the City of Fulshear, assets and deferred outflows exceeded liabilities and deferred inflows by
$121.9 million as of September 30, 2018.
By far the largest portion of the City’s net position, 89% reflects its net investment in capital assets (e.g.,
land, construction in progress, buildings, improvements other than buildings, machinery and equipment,
and infrastructure), less any debt used to acquire those assets that is still outstanding. The City uses capital
assets to provide services to citizens; consequently these assets are not available for future spending.
Although the City’s investment in its capital assets is reported net of related debt, it should be noted that
the resources needed to repay this debt must be provided from other sources, since the capital assets
themselves cannot be used to liquidate these liabilities.
CITY OF FULSHEAR, TEXAS MANAGEMENT’S DISCUSSION AND ANALYSIS (continued)
7
CONDENSED SCHEDULE OF NET POSITION
September 30, 2018 and 2017
Governmental Activities Business-Type Activities
2018 2017 2018 2017 2018 2017
Current and other assets 9,092,420$ 5,835,345$ 6,366,227$ 5,687,350$ 15,458,647$ 11,522,695$
Capital assets 47,690,398 44,707,835 61,057,346 60,024,809 108,747,744 104,732,644
Total Assets 56,782,818 50,543,180 67,423,573 65,712,159 124,206,391 116,255,339
Deferred Outflows of Resources
Pension related 258,431 179,788 258,431 179,788
Current and other liabilities 841,184 537,986 1,237,013 870,090 2,078,197 1,408,076
Long-term liabilities 136,927 138,046 136,927 138,046
Net pension liability 287,649 218,123 287,649 218,123
Total Liabilities 1,265,760 894,155 1,237,013 870,090 2,502,773 1,764,245
Deferred Inflows of Resources
Pension related 47,882 8,507 47,882 8,507
Net position:
Net investment in capital
assets 47,690,398 44,707,835 61,057,346 60,024,809 108,747,744 104,732,644
Restricted 927,779 539,487 927,779 539,487
Unrestricted 7,109,430 4,572,984 5,129,214 4,817,260 12,238,644 9,390,244
Total Net Position 55,727,607$ 49,820,306$ 66,186,560$ 64,842,069$ 121,914,167$ 114,662,375$
Total Primary Government
An additional 0.8% portion of the City’s net position represents resources that are subject to external
restrictions on how they may be used. The remaining balance of unrestricted net position of $12.2 million
may be used to meet the government’s ongoing obligations to citizens and creditors.

CITY OF FULSHEAR, TEXAS MANAGEMENT’S DISCUSSION AND ANALYSIS (continued)
8
As of September 30, 2018, the City is able to report positive balances in all three categories of net position.
The following table provides a summary of the City’s operations for the year ended September 30, 2018:
CONDENSED SCHEDULE OF CHANGES IN NET POSITION
September 30, 2018 and 2017
Governmental Activities Business-Type Activities
2018 2017 2018 2017 2018 2017
Revenues
Program revenue:
Charges for services 5,217,135$ 3,776,495$ 7,115,884$ 5,203,537$ 12,333,019$ 8,980,032$
Operating grants and
contributions 267,975 268,355 267,975 268,355
Capital grants and
contributions 4,469,274 4,791,180 1,481,332 18,860,007 5,950,606 23,651,187
General revenues:
Property taxes 2,155,867 1,834,115 2,155,867 1,834,115
Sales taxes 1,526,998 827,480 1,526,998 827,480
Franchise taxes 647,039 514,470 647,039 514,470
Investment earnings 107,636 46,505 77,531 33,319 185,167 79,824
Other revenues 532,474 244,036 138,496 670,970 244,036
Total Revenues 14,924,398 12,302,636 8,813,243 24,096,863 23,737,641 36,399,499
Expenses:
General government 2,605,264 2,381,636 2,605,264 2,381,636
Permits and inspections 957,063 814,579 957,063 814,579
Public safety 2,688,730 2,156,611 2,688,730 2,156,611
Public works 3,949,615 3,366,308 3,949,615 3,366,308
Water and sewer 6,285,177 4,189,671 6,285,177 4,189,671
Total Expenses 10,200,672 8,719,134 6,285,177 4,189,671 16,485,849 12,908,805
Increase in net position
before transfers 4,723,726 3,583,502 2,528,066 19,907,192 7,251,792 23,490,694
Transfers 1,183,575 (79,986) (1,183,575) 79,986
Change in net position 5,907,301 3,503,516 1,344,491 19,987,178 7,251,792 23,490,694
Net Position - beginning 49,820,306 46,316,790 64,842,069 44,854,891 114,662,375 91,171,681
Net Position - ending 55,727,607$ 49,820,306$ 66,186,560$ 64,842,069$ 121,914,167$ 114,662,375$
Total Primary Government
Governmental activities
For the year ended September 30, 2018, revenues from governmental activities totaled $14.9 million.
Overall, governmental revenues increased by 21% from the prior year due to charges for services, property
tax, and sales tax revenues. Charges for services, which are the City's largest revenue source, increased by
38% due to continued growth in residential and commercial building review and permit fees.
For the year ended September 30, 2018, expenses for governmental activities totaled $10.2 million, which
represents an increase of $1,481,538 from the previous year. Public works expenses increased the most
over the prior year by $583,307, primarily due to increases in contractual sanitation services, pavement
management program, and depreciation expenses resulting from large contributions of infrastructure from
developers. General government expenses increased by $223,628 primarily due to increase in professional
legal services and property tax rebate. Public safety increased by $532,119 due to increased salaries and
wages, hiring of new personnel, and funding of the vehicle and equipment replacement program. Permits
and inspection expenses increased by $142,484 as a result of increased consultant and engineering services.

CITY OF FULSHEAR, TEXAS MANAGEMENT’S DISCUSSION AND ANALYSIS (continued)
9
Business-type activities Charges for services for business-type activities increased by $1,912,347 or 37% from the previous year due to an increase in water and sewer taps and the activity due to new development. Water and sewer expenses increased by 50% or $2,095,506 due to increase in water pumpage and tapping fees, water system maintenance, and depreciation expense. Financial Analysis of the City’s Funds As noted earlier, fund accounting is used to demonstrate and ensure compliance with finance-related legal requirements. Governmental Funds - The focus of the City's governmental funds is to provide information on near-term inflows, outflows and balances of spendable resources. Such information is useful in assessing the City's financing requirements. In particular, unassigned fund balance may serve as a useful measure of the City's net resources available for spending at the end of the year. The City's governmental funds reflect a combined fund balance of $8.1 million. Of this amount, $0.55 million is restricted for the City’s regional park, $80,083 is restricted for municipal court, $99,562 is restricted for public safety, $196,651 is restricted for District #7, $833,515 million is committed to capital projects, and $6.3 million is unassigned. There was an increase in the combined fund balance of $2.8 million from the prior year. The general fund is the chief operating fund of the City. At the end of the current year, unassigned fund balance of the general fund was million. As a measure of the general fund's liquidity, it may be useful to compare unassigned fund balance to total fund expenditures. Unassigned fund balance represents 76% of total general fund expenditures. The general fund balance demonstrated an overall increase of $2.8 million primarily due to property taxes, sales tax, licenses and permits, and charges for services as a result of the continuous growth and development in the City. Proprietary Funds - The City's proprietary funds financial statements provide the same type of information found in the government-wide financial statements, but in more detail. General Fund Budgetary Highlights There had been a planned decrease in budgeted fund balance in the amount of $0.3 million in the general fund. However, actual fund balance increased by $2.7 million resulting in a positive variance of $3 million from budgeted as amended to actual. Actual General Fund revenues were above amended budgeted revenues by $2,094,195 for 2018. This net positive variance includes positive variances of $951,407 for licenses and permits, $504,946 for sales tax, and $504,181 for charges for services along with negative variances for property taxes and intergovernmental revenues. Actual expenditures were less than budgeted amounts by $831,275 for the fiscal year. The greatest positive variance was in general government.

CITY OF FULSHEAR, TEXAS MANAGEMENT’S DISCUSSION AND ANALYSIS (continued)
10
Capital Assets
The City’s investment in capital assets for its governmental and business-type activities as of September
30, 2018, amounted to $47.7 million and $61.1 million (net of accumulated depreciation), respectively.
This investment in capital assets includes land, buildings and improvements, machinery and equipment,
and infrastructure.
The following table shows the balances at September 30, 2018 and 2017:
2018 2017
Governmental Activities
Capital assets, not being depreciated:
Land 3,210,109$ 3,210,109$
Capital assets net of depreciation
Buildings and improvements 415,510 452,035
Machinery and equipment 498,107 390,283
Infrastructure 43,566,672 40,655,408
Total capital assets - net of depreciation 47,690,398$ 44,707,835$
Business-Type Activities
Capital assets, not being depreciated:
Land 526,082$ 526,082$
Construction in progress 761,661
Capital assets net of depreciation
Buildings and improvements 27,240 29,999
Machinery and equipment 175,577 22,531
Water and Sewer System 60,328,447 58,684,536
Total capital assets - net of depreciation 61,057,346$ 60,024,809$
Detailed information on capital assets is presented in Note 6 to the financial statements.
Long-term liabilities
The City’s long-term liabilities consist entirely of accrued compensated absences payable at year end. The
City has no outstanding debt instruments. Detailed information on compensated absences is presented in
Note 7 to the financial statements.

CITY OF FULSHEAR, TEXAS MANAGEMENT’S DISCUSSION AND ANALYSIS (continued)
11
Economic Factors and Next Year’s Budgets and Rates
The City Council has adopted the City's 2019 budget. The approval of the budget provides funding for the
City's operating and capital costs for the 2019 fiscal year. The City anticipates a fourteen percent (14%)
increase in expected total revenues and a fifteen percent (15%) percent increase in expected total
expenditures. The main contributor to the revenue increase is from ad valorem tax and sales tax generated
by increased property value through growth.
The increases in expenditures are generated from the addition of police personnel, development personnel,
building inspector, receptionist and capital projects funding.
The growth in residential and commercial building is expected to continue for the foreseeable future as the
City is experiencing phenomenal growth as part of the Houston region. Our population has grown from 916
in 2006 to around 13,500 through 2018. The FM 1463 corridor has exploded with new development
ranging from residential activity in Polo Ranch, and other tracts west of downtown Fulshear. In addition,
new sections in Fulshear Run, Fulbrook on Fulshear Creek, Cross Creek Ranch, Jordan Ranch and
Tamarron will be coming online. Commercial construction activity continues to pick-up with a new
Popeye's, Valvoline, and Bancorp South Bank being completed in the near future.
Cross Creek Ranch and Firethorne remain in the top 20 of the top selling developments in the nation. The
City is filled with beautiful developments on the ground and in the pipeline of development.
Request for Information
This financial report is designed to provide a general overview of the City's finances. Questions concerning
this report or requests for additional financial information should be directed to Wes Vela, City Financial
Officer, 30603 FM 1093, Fulshear, TX, 77441, telephone 281-346-1796, or for general City information,
visit the City's website at www.fulsheartexas.gov.

12
(This page intentionally left blank.)

13
BASIC FINANCIAL STATEMENTS

14
CITY OF FULSHEAR, TEXAS
STATEMENT OF NET POSITION
September 30, 2018
Governmental
Activities
Business-
Type
Activities Total
Assets
Current assets:
Cash and cash equivalents 5,475,573$ 5,651,404$ 11,126,977$
Investments 2,997,804 2,997,804
Receivables, net 619,043 714,823 1,333,866
Total Current assets 9,092,420 6,366,227 15,458,647
Capital assets:
Non-depreciable capital assets 3,210,109 526,082 3,736,191
Depreciable capital assets, net 44,480,289 60,531,264 105,011,553
Total Noncurrent assets 47,690,398 61,057,346 108,747,744
Total Assets 56,782,818 67,423,573 124,206,391
Deferred Outflows of Resources
Deferred outflows - pension related 258,431 258,431
Total Deferred Outflows of Resources 258,431 258,431
Liabilities
Current liabilities:
Accounts payable and accrued expenses 813,744 1,041,098 1,854,842
Customer deposits 27,440 195,915 223,355
Total current liabilities 841,184 1,237,013 2,078,197
Long-term liabilities:
Due within one year 13,693 13,693
Due in more than one year 123,234 123,234
Net pension liability 287,649 287,649
Total long-term liabilities 424,576 424,576
Total Liabilities 1,265,760 1,237,013 2,502,773
Deferred Inflows of Resources
Deferred inflow - pension items 47,882 47,882
Total Deferred Inflows of Resources 47,882 47,882
Net Position
Investment in capital assets 47,690,398 61,057,346 108,747,744
Restricted for:
Municipal court 80,083 80,083
Regional park 551,483 551,483
Public Safety 99,562 99,562
District #7 196,651 196,651
Economic Development
Unrestricted 7,109,430 5,129,214 12,238,644
Total Net Position 55,727,607$ 66,186,560$ 121,914,167$
See Notes To Basic Financial Statements.
Primary Government

15
Fulshear
Development
Corporation
City of
Fulshear
Development
Corporation
1,763,726$ 1,638,640$
164,986 162,713
1,928,712 1,801,353
1,928,712 1,801,353
1,614 1,837
1,614 1,837
1,614 1,837
1,927,098 1,799,516
1,927,098$ 1,799,516$
Component Units

16
CITY OF FULSHEAR, TEXAS
STATEMENT OF ACTIVITIES
For the Year Ended September 30, 2018
Functions/Programs Expenses
Charges for
Services
Operating
Grants and
Contributions
Capital
Grants and
Contributions
Primary government
Governmental Activities:
General government 2,605,264$ $ 236,838$ $
Permits and Inspections 957,063 3,985,701
Public safety 2,688,730 305,589 31,137
Public works 3,949,615 925,845 4,469,274
Total governmental activities 10,200,672 5,217,135 267,975 4,469,274
Business-Type Activities:
Water and Sewer Operations 6,285,177 7,115,884 1,481,332
Total Primary Government 16,485,849$ 12,333,019$ 267,975$ 5,950,606$
Component Units
City of Fulshear Development
Corporation 152,981$ $ $ $
Fulshear Development Corporation 136,055
Total component units 289,036$ $ $ $
General revenues:
Taxes:
Property taxes
Sales tax
Franchise taxes
Investment earnings
Other revenues
Transfers
Total general revenues and transfers
Change in net position
Net Position - beginning
Net Position - ending
See Notes to Basic Financial Statements.
Program Revenue

17
Net Revenue (Expense) and Changes in Net Position
Governmental
Activities
Business-
Type
Activities Total
Fulshear
Development
Corporation
City of
Fulshear
Development
Corporation
(2,368,426)$ $ (2,368,426)$
3,028,638 3,028,638
(2,352,004) (2,352,004)
1,445,504 1,445,504
(246,288) (246,288)
2,312,039 2,312,039
(246,288) 2,312,039 2,065,751
(152,981)$ $
(136,055)
(152,981) (136,055)
2,155,867 2,155,867
1,526,998 1,526,998 789,832 789,832
647,039 647,039
107,636 77,531 185,167 22,308 20,467
532,474 138,496 670,970
1,183,575 (1,183,575)
6,153,589 (967,548) 5,186,041 812,140 810,299
5,907,301 1,344,491 7,251,792 659,159 674,244
49,820,306 64,842,069 114,662,375 1,267,939 1,125,272
55,727,607$ 66,186,560$ 121,914,167$ 1,927,098$ 1,799,516$
Primary Government Component Units

18
CITY OF FULSHEAR, TEXAS
BALANCE SHEET
GOVERNMENTAL FUNDS
September 30, 2018
General Fund
Nonmajor
Governmental
Funds
Total
Governmental
Funds
Assets
Cash and cash equivalents 3,634,812$ 1,741,955$ 5,376,767$
Investments 2,997,804 2,997,804
Receivables, net 580,854 38,189 619,043
Total Assets 7,213,470$ 1,780,144$ 8,993,614$
Liabilities
Accounts payable 713,346$ 18,850$ 732,196$
Accrued expenditures 81,548 81,548
Customer deposits 27,440 27,440
Total Liabilities 822,334 18,850 841,184
Deferred Inflows of Resources
Unavailable taxes 69,870 69,870
Fund balances
Restricted for:
Regional Park 551,483 551,483
Municipal Court 80,083 80,083
Public Safety 99,562 99,562
District #7 196,651 196,651
Committed 833,515 833,515
Unassigned 6,321,266 6,321,266
Total Fund Balances 6,321,266 1,761,294 8,082,560
Total Liabilities, Deferred
Inflows, and Fund Balances 7,213,470$ 1,780,144$ 8,993,614$
See Notes to Basic Financial Statements.

19
CITY OF FULSHEAR, TEXAS
RECONCILIATION OF THE GOVERNMENTAL FUNDS BALANCE SHEET
TO THE GOVERNMENTAL ACTIVITIES STATEMENT OF NET POSITION
September 30, 2018
Total fund balance, governmental funds 8,082,560$
Amounts reported for governmental activities in the Statement of Net Position
are different because:
Capital assets used in governmental activities are not current financial
resources and therefore are not reported in this fund financial statement, but
are reported in the governmental activities of the Statement of Net Position. 47,593,536
Uncollected long-term receivables are not available to pay current period
expenditures and therefore are not reported in the fund financial statements,
but are reported in the governmental activities of the Statement of Net
Position. 69,870
Inflows and outflows of resources relating to pension plan activity are
recognized as expenditures in the governmental fund financial statements
when payments are made but are deferred in the governmental activities of
the statement of net position.
Deferred outflows- pensions 258,431
Deferred inflows- pensions (47,882)
Some liabilities are not due and payable in the current period and are not
included in the fund financial statement, but are included in the governmental
activities of the Statement of Net Position.
Accrued compensated absences (136,927)
Net pension liability (287,649)
The assets and liabilities of the internal service fund is not included in the
fund financial statement, but is included in the governmental activities of
the Statement of Net Position. 195,668
Net Position of Governmental Activities in the Statement of Net Position 55,727,607$
See Notes to Basic Financial Statements.

20
CITY OF FULSHEAR, TEXAS
STATEMENT OF REVENUES, EXPENDITURES AND
CHANGES IN FUND BALANCES
GOVERNMENTAL FUNDS
For the Year Ended September 30, 2018
General Fund
Nonmajor
Governmental
Funds
Total
Governmental
Funds
Revenues
Taxes:
Property 2,137,299$ $ 2,137,299$
Sales 1,331,346 195,652 1,526,998
Franchise taxes 647,039 647,039
Public improvement fees 353,186 353,186
Licenses and permits 2,759,307 2,759,307
Intergovernmental 236,838 236,838
Charges for services 1,800,981 1,800,981
Fines and forfeitures 263,893 41,696 305,589
Investment earnings 80,210 26,644 106,854
Other revenues 137,997 228,800 366,797
Total Revenues 9,748,096 492,792 10,240,888
Expenditures
Current:
General government 2,678,794 5,043 2,683,837
Permits and inspections 540,513 540,513
Public safety 2,361,214 6,599 2,367,813
Public works 2,218,008 2,218,008
Planning and development 401,682 401,682
Capital Outlay 89,437 286,670 376,107
Total Expenditures 8,289,648 298,312 8,587,960
Revenues over (under) expenditures 1,458,448 194,480 1,652,928
Other Financing Sources (Uses)
Transfers in 1,283,575 95,000 1,378,575
Transfers out (195,000) (195,000)
Total other financing sources (uses) 1,283,575 (100,000) 1,183,575
Net Changes in Fund Balances 2,742,023 94,480 2,836,503
Fund Balances - beginning of year 3,579,243 1,666,814 5,246,057
Fund Balances - end of year 6,321,266$ 1,761,294$ 8,082,560$
See Notes to Basic Financial Statements.

21
CITY OF FULSHEAR, TEXASRECONCILIATION OF THE STATEMENT OF REVENUES, EXPENDITURES AND
CHANGES IN FUND BALANCES OF GOVERNMENTAL FUNDS TO THE
STATEMENT OF ACTIVITIES
For the Year Ended September 30, 2018
Reference Columns
Net change in fund balances - total governmental funds: 2,836,503$
Amounts reported for Governmental Activities in the Statement of Activities are
different because:
Governmental funds report outlays for capital assets as expenditures because such
outlays use current financial resources. In contrast, the Statement of Activities
reports only a portion of the outlay as expense. The capital asset expenditures are
allocated over the assets' estimated useful lives as depreciation expense for the
period.
This is the amount by which capital outlay of $131,135 was exceeded by
depreciation of $1,710,698 in the current period. (1,579,563)
Governmental funds report the entire net sales price (proceeds) from sale of an
asset as revenue because it provides current financial resources. In contrast, the
Statement of Governmental activities reports only the gain or loss on the sale of the
assets. Thus, the change in net position differs from the change in fund balance by
the book value of the asset sold. (4,010)
Contributions of capital assets by developers are not reported in the governmental
fund financial statements as they do not represent a flow of current resources. 4,469,274
Governmental funds do not present revenues (property taxes and franchise fees
that are not available to pay current obligations. In contrast, such revenues are
reported in the Statement of Activities when earned. 18,568
Governmental funds report the payment of pension contributions as an expenditure.
In contrast, the statement of activities treats such payments as a reduction in net
pension liability. 212,079
Some expenses reported in the statement of activities do not require the use of
current financial resources and these are not reported as expenditures in
governmental funds:
Compensated absences 1,119
Pension expense (242,337)
Operations of Internal Service Funds not reported in Governmental Fund activities 195,668
Change in net position of governmental activities 5,907,301$
See Notes to Basic Financial Statements.
22
CITY OF FULSHEAR, TEXAS
STATEMENT OF NET POSITION
PROPRIETARY FUNDS
September 30, 2018
Governmental
Activities
Fulshear
Facility CCR Facility
Total
Enterprise
Funds
Vehicle
Replacement
Fund
Assets
Current assets:
Cash and cash equivalents 942,110$ 4,709,294$ 5,651,404$ 98,806$
Accounts receivable, net 287,323 427,500 714,823
Total current assets 1,229,433 5,136,794 6,366,227 98,806
Noncurrent assets:
Capital assets:
Land 60,292 465,790 526,082
Construction in progress
Infrastructure 9,666,586 38,791,258 48,457,844
Buildings 1,360,589 19,083,638 20,444,227
Equipment 237,617 25,276 262,893 96,862
Less accumulated depreciation (3,196,080) (5,437,620) (8,633,700)
Total noncurrent assets 8,129,004 52,928,342 61,057,346 96,862
Total Assets 9,358,437$ 58,065,136$ 67,423,573$ 195,668$
Liabilities
Accounts payable and accrued liabilities 354,726$ 686,372$ 1,041,098$ $
Customer deposits 25,173 170,742 195,915
Total Liabilities 379,899 857,114 1,237,013
Net Position
Investment in capital assets 8,129,004 52,928,342 61,057,346 96,862
Unrestricted 849,534 4,279,680 5,129,214 98,806
Total Net Position 8,978,538$ 57,208,022$ 66,186,560$ 195,668$
See Notes to Basic Financial Statements.
Enterprise Funds

23
CITY OF FULSHEAR, TEXAS
PROPRIETARY FUNDS
For the Year Ended September 30, 2018
Governmental
Activities
Fulshear
Facility CCR Facility
Total
Enterprise
Funds
Vehicle
Replacement
Fund
Operating Revenues
Charges for sales and services 1,617,361$ 5,498,523$ 7,115,884$ 167,968$
Operating Expenses
Supplies 3,058 3,058
Contractual services 157,454 81,323 238,777
Other operating 1,024,279 3,088,317 4,112,596
Utilities 89,057 251,277 340,334
Depreciation 193,212 1,397,200 1,590,412
Total Operating Expenses 1,467,060 4,818,117 6,285,177
Operating income (loss) 150,301 680,406 830,707 167,968
Non-Operating Revenues
Investment earnings 14,796 62,735 77,531 782
Miscellaneous Revenue 4,564 133,932 138,496 26,918
Total Non-Operating Revenues 19,360 196,667 216,027 27,700
Income (loss) before transfers and capital
contributions 169,661 877,073 1,046,734 195,668
Transfers in 295,000 295,000
Transfers out (347,254) (1,131,321) (1,478,575)
Capital contributions 348,797 1,132,535 1,481,332
Change in Net Position 466,204 878,287 1,344,491 195,668
Total Net Position - beginning of year 8,512,334 56,329,735 64,842,069
Total Net Position - end of year 8,978,538$ 57,208,022$ 66,186,560$ 195,668$
See Notes to Basic Financial Statements.
Enterprise Funds
STATEMENT OF REVENUES, EXPENSES AND CHANGES
IN FUND NET POSITION

24
CITY OF FULSHEAR, TEXAS
STATEMENT OF CASH FLOWS
PROPRIETARY FUNDS
For the Year Ended September 30, 2018
Governmental
Activities
Fulshear
Facility CCR Facility
Total
Enterprise
Funds
Vehicle
Replacement
Fund
Cash Flows From Operating Activities
Receipts from customers and users 1,651,376$ 5,510,830$ 7,162,206$ 167,968$
Payments to suppliers (1,261,927) (3,088,021) (4,349,948)
Net cash provided by operating activities 389,449 2,422,809 2,812,258 167,968
Cash Flows From Noncapital Financing Activities
Transfers from other funds 295,000 295,000
Transfers to other funds (347,254) (1,131,321) (1,478,575)
Net cash provided (used) by noncapital financing
activities (52,254) (1,131,321) (1,183,575)
Cash Flows from Capital and Related Financing
Activities
Capital grants 4,564 133,932 138,496
Insurance Proceeds 26,918
Acquisition of and construction of capital assets (1,141,617) (1,141,617) (96,862)
Net cash (used) by capital and related financing
activities (1,137,053) 133,932 (1,003,121) (69,944)
Cash Flows From Investing Activities
Investment earnings 14,796 62,735 77,531 782
Net cash flows from investing activities 14,796 62,735 77,531 782
Net increase (decrease) in cash and cash equivalents (785,062) 1,488,155 703,093 98,806
Cash and cash equivalents - beginning of year 1,727,172 3,221,139 4,948,311
Cash and cash equivalents - end of year 942,110$ 4,709,294$ 5,651,404$ 98,806$
Reconciliation of operating income to
net cash provided by operating activities
Operating Income 150,301$ 680,406$ 830,707$ 167,968$
Adjustments to reconcile operating income to
net cash provided by operating activities:
Depreciation 193,212 1,397,200 1,590,412
(Increase) decrease in accounts receivable 30,312 (6,096) 24,216
Increase (decrease) in accounts payable 11,921 332,896 344,817
Increase (decrease) in customer deposits 3,703 18,403 22,106
Net cash provided by operating activities 389,449$ 2,422,809$ 2,812,258$ 167,968$
Noncash investing, capital, and financing activities:
Contributions of capital assets 348,797$ 1,132,535$ 1,481,332$ $
See Notes to Basic Financial Statements.
Enterprise Funds

CITY OF FULSHEAR, TEXAS NOTES TO FINANCIAL STATEMENTS
25
Note 1 - Organization
The City of Fulshear, Texas (the “City”) was incorporated in 1977 and operated as a “Type A, General
Law” city until May 2016; wherein the voters elected to become a “Home-Rule” government. The City
operates under a Council-Manager form of government whereas the city council is the principal legislative
body of the City, composed of seven council members who serve two year terms. The Mayor presides at
the Council meetings. The City Manager is the chief executive officer of the City and is responsible to the
City Council for the management of all City affairs placed in the City Manager’s charge by or under the
charter.
The City provides the following services: public safety to include police services, municipal court, streets,
drainage, water and sewer services, solid waste collection and disposal, community development, and
general administration.
Note 2 - Summary of Significant Accounting Policies
The financial statements of the City have been prepared in conformity with generally accepted accounting
principles (GAAP) as applied to government units. The Governmental Accounting Standards Board
(GASB) is the accepted standard-setting body for establishing governmental accounting and financial
reporting principles. The more significant of the government’s accounting policies are described below.
A. Reporting Entity
The City is an independent political subdivision of the State of Texas governed by an elected council and a
mayor and is considered a primary government. As required by generally accepted accounting principles,
these basic financial statements have been prepared based on considerations regarding the potential for
inclusion of other entities, organizations, or functions as part of the City's financial reporting entity. The
City of Fulshear Development Corporation and the Fulshear Development Corporation, although legally
separate, are considered discretely presented component units and are part of the reporting entity. No other
entities have been included in the City's reporting entity. Additionally, as the City is considered a primary
government for financial reporting purposes, its activities are not considered a part of any other
governmental or other type of reporting entity.
Considerations regarding the potential for inclusion of other entities, organizations or functions in the City's
financial reporting entity are based on criteria prescribed by generally accepted accounting principles.
These same criteria are evaluated in considering whether the City is a part of any other governmental or
other type of reporting entity. The overriding elements associated with prescribed criteria considered in
determining that the City's financial reporting entity status is that of a primary government are that it has a
separately elected governing body, it is legally separate, and it is fiscally independent of other state and
local governments. Additionally, prescribed criteria under generally accepted accounting principles include
considerations pertaining to organizations for which the primary government is financially accountable and
considerations pertaining to organizations for which the nature and significance of their relationship with
the primary government are such that exclusion would cause the reporting entity's financial statements to
be misleading or incomplete.

CITY OF FULSHEAR, TEXAS NOTES TO FINANCIAL STATEMENTS (continued)
26
Note 2 - Summary of Significant Accounting Policies (continued)
Discretely Presented Component Units
City of Fulshear Development Corporation
After voter approval on August 29, 2007, the City formed the City of Fulshear Development Corporation
(CDC), a 4A development corporation. The Board of Directors is appointed by and serves at the discretion
of the City Council. City Council approval is required for budgets and bonded debt issuances. The CDC
was created to manage and supervise the programs and activities with revenues from their portion (one half
percent) of the sales tax increase of one percent, allowed by State of Texas law and approved by voters on
August 29, 2007. The revenues are limited to manufacturing and industrial development.
Fulshear Development Corporation
After voter approval on August 29, 2007, the City formed the Fulshear Development Corporation (FDC),
a 4B development corporation. The Board of Directors are appointed by and serve at the discretion of the
City Council. City Council approval is required for budgets and bonded debt issuances. The FDC was
created to manage and supervise the programs and activities with revenues from their portion (one half
percent) of the sales tax increase of one percent, allowed by State of Texas law and approved by voters on
August 29, 2007. The revenues are limited to quality of life improvements, including economic
development that will attract and retain primary employers.
The component units are reported in separate columns to emphasize that they are legally separate from the
City. In the event of dissolution, net position of the CDC and the FDC shall be conveyed back to the City.
The operations of these component units are presented as governmental fund types and cover the year ended
September 30, 2018.
B. Government-wide and Fund Financial Statements
The government-wide financial statements (i.e., the Statement of Net Position and the Statement of
Activities) report information on all of the nonfiduciary activities of the primary government. These
statements include all activities of the primary government and its component units. For the most part, the
effect of interfund activity has been removed from these statements. Governmental activities, which
normally are supported by taxes and intergovernmental revenues, are reported separately from business-
type activities, which rely to a significant extent on fees and charges for support.
The statement of activities demonstrates the degree to which the direct expenses of a given function or
segment are offset by program revenues. Direct expenses are those that are clearly identifiable with a
specific function or segment. Program revenues include (1) charges to customers or applicants who
purchase, use or directly benefit from goods, services, or privileges provided by a given function or segment
and (2) grants and contributions that are restricted to meeting operational or capital requirements of a
particular segment. Taxes and other items not properly included among program revenues are reported
instead as general revenues.
Separate financial statements are provided for governmental funds and proprietary funds. Major individual
governmental funds and the internal service fund are reported as separate columns in the fund financial
statements. In the fund financial statements, the accounts of the City are organized on the basis of funds,
each of which is considered a separate accounting entity. The operations of each fund are accounted for
with a separate set of self-balancing accounts that comprise its assets, liabilities, deferred inflows of
resources, fund equity, revenues, and expenditures or expenses, as appropriate.

CITY OF FULSHEAR, TEXAS NOTES TO FINANCIAL STATEMENTS (continued)
27
Note 2 - Summary of Significant Accounting Policies (continued)
B. Government-wide and Fund Financial Statements (continued)
The accounting and financial reporting treatment applied to a fund is determined by its measurement focus.
The government-wide financial statements are reported using the economic resources measurement focus, as
are the proprietary fund financial statements. The government-wide statements and proprietary fund
statements are reported using the accrual basis of accounting. Revenues are recognized when earned and
expenses are recorded when a liability is incurred, regardless of the timing of related cash flows. Sales taxes
and franchise fees are recognized as revenues in the year that gives rise to the transaction. Grants and similar
items are recognized as revenue as soon as all eligibility requirements imposed by the provider have been met.
Governmental fund financial statements are reported using the current financial resources measurement focus
and the modified accrual basis of accounting. Revenues are recognized as soon as they are both measurable
and available. Revenues are considered to be available if they are collectible within the current period or soon
enough thereafter to pay liabilities of the current period. For this purpose, the City considers revenues to be
available if they are collected within 60 days of the end of the current fiscal period. Expenditures generally
are recorded when a liability is incurred, as under accrual accounting. However, debt service expenditures,
as well as expenditures related to compensated absences and claims and judgments, are recorded only when
payment is due.
Sales taxes, franchise fees, licenses, municipal court revenues and interest associated with the current fiscal
period are all considered to be susceptible to accrual and so have been recognized as revenues of the current
fiscal period. All other revenue items are considered measurable and available only when cash is received by
the government.
The City reports the following major governmental funds: The General Fund is used to account for all financial transactions not properly includable in other funds.
The principal sources of revenues include local property taxes, sales and franchise taxes, licenses and
permits, fines and forfeitures, and charges for services. Expenditures include general government, public
safety and public works.
Proprietary Fund Types
Proprietary funds are used to account for activities that are similar to those often found in the private sector.
All assets, liabilities, equities, revenues, expenses, and transfers relating to the City's business activities are
accounted for through proprietary funds. The measurement focus is on determination of net income,
financial position, and cash flows. Proprietary funds distinguish operating revenues and expenses from non-
operating items. Operating revenues include charges for services. Operating expenses include costs of
materials, contracts, personnel, and depreciation. All revenues and expenses not meeting this definition are
reported as non-operating revenues and expenses. The City uses an internal service fund to account for the
financing of goods or services provided by one department or agency to other departments or agencies of a
government on a cost-reimbursement basis. The Vehicle Replacement Fund is the City’s internal service
fund. The purpose of this fund is to provide a separate accounting for the Vehicle & Equipment
Replacement Program, which charges appropriate user departments.

CITY OF FULSHEAR, TEXAS NOTES TO FINANCIAL STATEMENTS (continued)
28
Note 2 - Summary of Significant Accounting Policies (continued)
The City maintains one proprietary fund type, in the form of two enterprise funds. The enterprise funds are
used to account for the operations that provide water and wastewater collection, wastewater treatment
operations and solid waste collection and disposal. The services are financed and operated in a manner
similar to private business enterprises where the intent of the governing body is that the costs (expenses
including depreciation) of providing goods or services to the general public on a continuing basis will be
financed or recovered primarily through user charges. The Fulshear facility fund is utilized to supply the
City and surrounding developments with water, sewer, and sanitation services. The Cross Creek Ranch
facility fund is used to supply the Cross Creek Ranch development with water, sewer, and sanitation
services. The Fulshear facility and Cross Creek Ranch facility funds are considered major funds for
reporting purposes.
The government-wide Statements of Net Position and Statements of Activities and all proprietary funds are
accounted for on a flow of economic resources measurement focus and the accrual basis of accounting.
With this measurement focus, all assets and all liabilities associated with the operations of these activities
are included on the balance sheet. Government-wide and proprietary fund equity consists of net position.
Operating statements present increases (i.e., revenues) and decreases (i.e., expenses) in net total assets.
C. Measurement Focus, Basis of Accounting, and Financial Statement Presentation
The accounting and financial reporting treatment applied to a fund is determined by its measurement focus.
All governmental funds are accounted for using a current financial resources measurement focus and the
modified accrual basis of accounting. With this measurement focus, only current assets, current liabilities
and deferred inflows of resources are generally included on the balance sheet. Operating statements of these
funds present increases (i.e., revenues and other financing sources) and decreases (i.e., expenditures and
other financing uses) in net current assets.
Under the modified accrual basis of accounting, revenues are recognized in the accounting period when
they are susceptible to accrual (i.e., when they are measurable and available). "Measurable" means the
amount of the transaction can be determined and "available" means collectible within the current period or
soon enough thereafter to pay liabilities of the current period. For this purpose, the City considers revenues
available if they are collected within 60 days of the end of the current fiscal period. Revenues susceptible
to accrual include charges for services and interest on temporary investments.
Property taxes, sales taxes, franchise taxes, and interest associated with the current fiscal period are all
considered to be susceptible to accrual and so have been recognized as revenues of the current fiscal period.
Other receipts and other taxes become measurable and available when cash is received by the government
and are recognized as revenue at that time. Under modified accrual accounting, expenditures are recognized
in the accounting period in which the liability is incurred, if measurable, except for interest on general long-
term debt, which is recognized when due.
Under the accrual basis of accounting, revenues are recognized in the accounting period in which they are
earned and expenses are recognized in the accounting period in which they are incurred.
Proprietary funds distinguish operating revenues and expenses from non-operating items. Operating
revenues and expenses generally result from providing services and producing and delivering goods in
connection with a proprietary fund’s principal ongoing operations.

CITY OF FULSHEAR, TEXAS NOTES TO FINANCIAL STATEMENTS (continued)
29
Note 2 - Summary of Significant Accounting Policies (continued)
D. Cash and Cash Equivalents
The City's cash and cash equivalents are considered to be cash on hand, demand deposits and short term
investments with original maturities of three months or less from the date of acquisition. For the purpose
of the statement of cash flows, the proprietary fund types consider temporary investments with maturity of
three months or less when purchased to be cash equivalents.
The City’s local government investment pools are recorded at amortized costs as permitted by GASB
Statement No. 79, Certain Investment Pools and Pool Participants.
E. Investments
The City reports all investments at fair value based on quoted market prices at year-end date. The City
categorizes fair value measurements of its investments based on the hierarchy established by generally
accepted accounting principles. The fair value hierarchy, which has three levels, is based on the valuation
inputs used to measure an asset’s fair value: Level 1 inputs are quoted prices in active markets for identical
assets; Level 2 inputs are significant other observable inputs: Level 3 inputs are significant unobservable
inputs.
The City has adopted a written investment policy regarding the investment of its funds as defined in the
Public Funds Investment Act, Chapter 2256, Texas Government Code. In summary, the City is authorized
to invest in the following:
Direct obligations of the U.S. government
Direct obligations of the State of Texas
Collateralized certificates of deposit
Statewide investment pools
Repurchase agreements, reverse repurchase agreements, bankers' acceptances, and commercial paper
Related no-load money market mutual funds
F. General Property Taxes
Property taxes are levied by October 1 in conformity with Subtitle E, Texas Property Tax Code. Taxes
are due upon receipt and all taxes not paid prior to February 1 are deemed delinquent and are subject to
such penalty and interest set forth by the Property Tax Code. On January 1 of each year, a tax lien attaches
to property to secure the payment of all taxes, penalties and interest ultimately imposed. Appraised values
are established by the Fort Bend County Central Appraisal Districts (the “CAD”). Taxes are levied by the
City Commission based on the appraised values received from the CAD.
G. Due to and from Other Funds
Interfund receivables and payables arise from interfund transactions and are recorded by all funds affected
in the period in which transactions are executed. These receivables and payables are, for the most part,
eliminated from the Government-Wide Statement of Net Position and are recorded as “due from other
funds” or “due to other funds” in the fund financial statements.

CITY OF FULSHEAR, TEXAS NOTES TO FINANCIAL STATEMENTS (continued)
30
Note 2 - Summary of Significant Accounting Policies (continued)
H. Capital Assets
Capital assets, which include land, buildings and improvements, machinery and equipment, infrastructure,
and construction in progress, are reported in the applicable governmental type activities columns in the
government-wide financial statements. Capital assets are defined by the government as assets with an
initial, individual cost of more than $5,000 and an estimated useful life in excess of one year. All capital
assets are valued at historical cost or estimated historical cost if actual historical cost is not available.
Donated capital assets, donated works of art and similar items, and capital assets received in a service
concession arrangement are recorded at acquisition value. Repairs and maintenance are recorded as
expenses. Renewals and betterments are capitalized.
Major outlays for capital assets and improvements are capitalized as projects are constructed. Interest incurred
during the construction phase of capital assets of governmental-type activities is not included as part of the
capitalized value of the assets constructed.
Depreciation has been calculated on each class of depreciable property using the straight-line method.
Estimated useful lives are as follows:
Asset Description
Buildings 20 to 50 Years
Improvements other than buildings 5 to 50 Years
Machinery and equipment 5 to 10 Years
Water and sewer system 20 to 50 Years
Infrastructure 30 to 50 Years
I. Compensated Absences
It is the City's policy to permit employees to accumulate earned vacation, sick, and personal time. Vacation
earned can be accumulated up to 240 hours, sick leave can accrue up to 480 hours and personal time must
be taken within the fiscal year.
J. Use of Estimates
The preparation of financial statements, in conformity with generally accepted accounting principles, requires
management to make estimates and assumptions that affect the reported amounts of assets and liabilities and
disclosures of contingent assets and liabilities at the date of the financial statements and the reported amounts
of revenues and expenses during the reporting period. Actual amounts may differ from these estimates.
K. Long-Term Obligations
In the government-wide financial statements, long-term debt and other long-term obligations are reported
as liabilities in the applicable governmental activities Statement of Net Position.

CITY OF FULSHEAR, TEXAS NOTES TO FINANCIAL STATEMENTS (continued)
31
Note 2 - Summary of Significant Accounting Policies (continued)
L. Deferred Outflows/Inflows of Resources
In addition to assets, the statement of financial position will sometimes report a separate section for deferred
outflows of resources. This separate financial statement element, deferred outflows of resources, represents a
consumption of net position that applies to a future period(s) and so will not be recognized as an outflow of
resources (expense/expenditure) until then. The government has one item that qualifies for reporting in this
category:
Deferred outflows of resources for pension – Reported for the City in the government-wide financial
statement of net position. This deferred outflow results from pension plan contributions made after
the measurement date of the net pension liability, the results of differences between expected and
actual actuarial experiences and the differences between projected and actual earnings on pension
plan investments. The deferred outflows of resources related to pensions resulting from City
contributions subsequent to the measurement date will be recognized as a reduction of the net pension
liability in the next fiscal year. The other pension related deferred outflows will be amortized over
the expected remaining service lives of all employees (active and inactive employees) that are
provided with pensions through the pension plan which is currently 8.6198 years for the City plan.
Differences between projected and actual earnings on pension plan investments will be amortized
over a closed five year period.
In addition to liabilities, the governmental funds balance sheet will sometimes report a separate section for
deferred inflows of resources. This separate financial statement element, deferred inflows of resources,
represents an acquisition of net position or fund balance that applies to a future period(s) and so will not be
recognized as an inflow of resources (revenue) until that time. The city has two items that qualify for
reporting in this category:
Deferred inflows of resources for unavailable revenues - Reported only in the governmental funds
balance sheet, unavailable revenues from property taxes arise under the modified accrual basis of
accounting. These amounts are deferred and recognized as an inflow of resources in the period that
the amounts become available.
Deferred inflows of resources for pension activities - Reported in the government wide financial
statement of net position, these deferred inflows result primarily from differences between projected
and actual earnings on pension plan investments. These amounts will be amortized over a closed five
year period.
M. Pensions
For purposes of measuring the net pension liability, deferred outflows of resources and deferred inflows of
resources related to pensions, and pension expense, information about the Fiduciary Net Position of the
Texas Municipal Retirement System (TMRS) and additions to/deductions from TMRS’s Fiduciary Net
Position have been determined on the same basis as they are reported by TMRS. For this purpose, plan
contributions are recognized in the period that compensation is reported for the employee, which is when
contributions are legally due. Benefit payments and refunds are recognized when due and payable in
accordance with the benefit terms. Investments are reported at fair value.

CITY OF FULSHEAR, TEXAS NOTES TO FINANCIAL STATEMENTS (continued)
32
Note 2 - Summary of Significant Accounting Policies (continued)
N. Fund Equity
As of September 30, 2018, fund balances of the governmental funds are classified as follows:
Nonspendable - amounts that cannot be spent either because they are in nonspendable form or
because they are legally or contractually required to be maintained intact.
Restricted - amounts that can be spent only for specific purposes because of constitutional provisions
or enabling legislation or because of constraints that are externally imposed by creditors, grantors,
contributors, or the laws or regulations of other governments.
Committed – amounts constrained for specific purposes as determined by the City itself, using the
highest level of decision-making authority (i.e. City Council). To be reported as committed, amounts
cannot be used for any other purposes unless the City takes the same highest level of action to remove
or change the constraint. The City establishes (and modifies or rescinds) fund balance commitments
by passage of a resolution. City council will approve obligations of funds, such as multi-year
contracts, prior to the end of the fiscal year.
Unassigned - all other spendable amounts. When an expenditure is incurred for purposes for which both restricted and unrestricted fund balance is available, the City considers restricted funds to have been spent first.
O. Net Position
Net position represents the differences between assets, deferred outflows and liabilities. Net investment in
capital assets consists of capital assets, net of accumulated depreciation, reduced by the outstanding
balances of any borrowing used for the acquisition, construction or improvements of those assets, and
adding back unspent proceeds.
Net position is reported as restricted when there are limitations imposed on their use either through the
enabling legislations adopted by the City or through external restrictions imposed by creditors, grantors or
laws or regulations of other governments. When an expense is incurred for purposes for which both
restricted and unrestricted net position are available, the City’s policy is first to apply restricted net position.
P. Other Post-Employment Benefits
The City participates in a defined benefit group-term life insurance plan, both for current and retired
employees, administered by the Texas Municipal Retirement System (TMRS). The City reports the total
liability for this plan on the government-wide and proprietary fund financial statements. Information
regarding the City’s total OPEB liability is obtained from TMRS through a report prepared for the City by
TMRS’ consulting actuary, Gabriel Roeder Smith & Company, in compliance with GASB
Statement No. 75.

CITY OF FULSHEAR, TEXAS NOTES TO FINANCIAL STATEMENTS (continued)
33
Note 3 - Deposits and Investments
The City classifies deposits and investments for financial statement purposes as cash and cash equivalents,
current investments, and non-current investments based upon both liquidity (demand deposits) and maturity
date (deposits and investments) of the asset at the date of purchase. For this purpose an investment is
considered a cash equivalent if when purchased it has maturity of three months or less. Investments are
classified as either current investments or non-current investments. Current investments have maturity of
one year or less and non-current investments are those that have a maturity of one year or more.
At September 30, 2018, the City had the following investments:
Investment Type
Fair Value /
Amortized
Cost
Weighted
Average
Maturities
(Days)
Certificates of deposit 1,000,000$ 365
Municipal and State bonds 1,993,664 341
Texas CLASS public funds investment pool * 8,547,893 78
Total 11,541,557$ 148
* Credit rating of AAAm by Standard & Poors
Investments fair value measurement are as follows at September 30, 2018:
Investments Fair Value Level 1 Inputs Level 2 Inputs Level 3 Inputs
Certificates of Deposit 1,000,000$ 1,000,000$ $ $
Municipal and State bonds 1,993,664 1,993,664
Total 2,993,664$ 1,000,000$ 1,993,664$ $
Fair Value Measurements Using
Interest rate risk. In accordance with its investment policy, the City manages its exposure to declines in fair
values by structuring the investment portfolio so that securities mature to meet cash requirements for
ongoing operations and invest operating funds primarily in short-term securities.
Custodial credit risk - deposits. In the case of deposits, this is the risk that in the event of a bank failure, the
City's deposits may not be returned to it. The City's investment policy requires funds on deposit at the
depository bank to be collateralized by securities. At September 30, 2018, cash deposits and certificate of
deposit of the City, the City of Fulshear Development Corporation, and the Fulshear Development
Corporation were entirely covered by FDIC insurance and collateralizing securities.
Management does not expect any losses as a result of the under collateralization of deposits in the name of
the development corporations.
Custodial credit risk - investments. For an investment, this is the risk that, in the event of the failure of the
counterparty, the City will not be able to recover the value of its investments or collateral securities that are
in the possession of an outside party. The City's investment policy requires that it will seek to safekeeping
securities at financial institutions, avoiding physical possession. Further, all trades, where applicable, are
executed by delivery versus payment to ensure that securities are deposited in the City's safekeeping account
prior to the release of funds.

CITY OF FULSHEAR, TEXAS NOTES TO FINANCIAL STATEMENTS (continued)
34
Note 3 - Deposits and Investments (continued)
The Texas Cooperative Liquid Assets Securities System Trust - Texas (CLASS) is a public funds
investment pool under Section 2256.016 of the Public Funds Investment Act, Texas Government Code, as
amended (the "Act"). CLASS is created under an Amended and Restated Trust Agreement, dated as of
December 14, 2011 (the "Agreement"), among certain Texas governmental entities investing in the pool
(the "Participants"), Cutwater Investor Services Corporation as Program Administrator, and Wells Fargo
Bank Texas, NA as Custodian. CLASS is not SEC registered and is not subject to regulation by the State
of Texas. Under the Agreement, however, CLASS is administered and supervised by a seven-member board
of trustees (the "Board"), whose members are investment officers of the Participants, elected by the
Participants for overlapping two-year terms. In the Agreement and by resolution of the Board, CLASS has
contracted with Cutwater Investors Service Corporation to provide for the investment and management of
the public funds of CLASS. Separate financial statements for Texas CLASS may be obtained from CLASS'
website at www.texasclass.com.
In accordance with GASB Statement No. 79, Certain External Investment Pools and Pool Participants, the
Local Government Investment Pools do not have any limitations and restrictions on withdrawals such as
notice periods or maximum transaction amounts. These pools do not impose any liquidity fees or
redemption gates.
Note 4 - Receivables
Receivables are evaluated and an allowance for uncollectible accounts is set up when the collections are
doubtful. Receivables as of September 30, 2018, are as follows:
General
Fund
Regional Park
Fund
County
District #7
Fulshear
Facility
CCR
Facility Total
Property taxes 90,322$ $ $ $ 90,322$
Other taxes 410,282 37,053 447,335
Customer Accounts 290,600 706,889 997,489
Other 104,563 1,136 2,991 2,991 111,681
605,167 1,136 37,053 293,591 709,880 1,646,827
Less: allowance for uncollectibles (24,313) (6,268) (282,380) (312,961)
580,854$ 1,136$ 37,053$ 287,323$ 427,500$ 1,333,866$
Note 5 - Interfund Balances and Transfers
Transfers between the primary government funds during the year were as follows:
Transfer Out Transfer In Amounts
Capital Projects General 195,000$
Fulshear Facility Capital Projects 95,000
Fulshear Facility General 193,254
Cross Creek Facility General 895,321
1,378,575$
Transfers have been made to the capital projects fund for ongoing construction projects and to the general
fund to cover administrative functions.

CITY OF FULSHEAR, TEXAS NOTES TO FINANCIAL STATEMENTS (continued)
35
Note 6 - Capital Assets
Capital asset activity for the year ended September 30, 2018, was as follows:
Balance Balance
9/30/2017 Additions Deletions 9/30/2018
Governmental Activities
Capital assets, not being depreciated:
Land 3,210,109$ $ $ 3,210,109$
Total capital assets, not being depreciated 3,210,109 3,210,109
Other capital assets:
Buildings and improvements 998,232 998,232
Machinery and equipment 1,149,859 227,997 (102,567) 1,275,289
Infrastructure 46,884,637 4,469,274 51,353,911
Total other capital assets 49,032,728 4,697,271 (102,567) 53,627,432
Less accumulated depreciation for:
Buildings and improvements (546,197) (36,525) (582,722)
Machinery and equipment (759,576) (116,163) 98,557 (777,182)
Infrastructure (6,229,229) (1,558,010) (7,787,239)
Total accumulated depreciation (7,535,002) (1,710,698) 98,557 (9,147,143)
Total other capital assets , net 41,497,726 2,986,573 (4,010) 44,480,289
Governmental Activities
Capital Assets, Net 44,707,835$ 2,986,573$ (4,010)$ 47,690,398$
The total capital assets for internal service fund included in governmental activities was $96,862.
Depreciation expense was charged to functions/programs of the primary government as follows:
Governmental Activities
General government 76,497$
Public safety 53,807
Permits and inspections 22,384
Public works 1,558,010
Total depreciation expense -
governmental activities 1,710,698$
Additions to the governmental activities capital assets for fiscal year 2018 include approximately $4.7 million
of streets and other infrastructure relating to developer contributions. In addition, the City purchased
equipment and vehicles for $227,997.

CITY OF FULSHEAR, TEXAS NOTES TO FINANCIAL STATEMENTS (continued)
36
Note 6 - Capital Assets (continued)
A summary of changes in capital assets for business-type activities as of September 30, 2018, is as follows:
Balance Balance
9/30/2017 Additions Deletions 9/30/2018
Business-Type Activities
Capital assets, not being depreciated:
Land 526,082$ $ $ 526,082$
Construction in progress 761,661 (761,661)
Total capital assets, not being depreciated 1,287,743 (761,661) 526,082
Other capital assets:
Buildings 110,372 110,372
Machinery and equipment 106,893 156,000 262,893
Water and sewer system 65,563,089 1,718,638 1,509,972 68,791,699
Total other capital assets 65,780,354 1,718,638 1,665,972 69,164,964
Less accumulated depreciation for:
Buildings (80,373) (2,759) (83,132)
Machinery and equipment (84,362) (2,954) (87,316)
Water and sewer system (6,878,553) (1,584,699) (8,463,252)
Total accumulated depreciation (7,043,288) (1,590,412) (8,633,700)
Total other capital assets , net 58,737,066 128,226 1,665,972 60,531,264
Total business-type activities 60,024,809$ 128,226$ 904,311$ 61,057,346$
Depreciation was charged to business-type functions as follows:
Business-Type Activities
Fulshear facility fund 193,212$
Cross Creek Ranch facility fund 1,397,200
Total business-type activities
depreciation expense 1,590,412$

CITY OF FULSHEAR, TEXAS NOTES TO FINANCIAL STATEMENTS (continued)
37
Note 7 - Long-Term Liabilities
The following is a summary of changes in the City's total governmental long-term liabilities for the year
ended. The City uses the general fund to liquidate governmental long-term liabilities.
Beginning Ending Due Within
Balance Additions Reductions Balance One Year
Governmental Activities:
Compensated absences 138,046$ 78,692$ (79,811)$ 136,927$ 13,693$
Governmental Activities 138,046$ 78,692$ (79,811)$ 136,927$ 13,693$
Long-term liabilities applicable to the City's governmental activities are not due and payable in the current
period and, accordingly, are not reported as fund liabilities in the governmental funds. The governmental
activities compensated absences are liquidated by the general fund.
Note 8 - Employee Retirement System Texas Municipal Retirement System
Plan Description and Provisions
The City participates as one of 883 plans in the nontraditional, joint contributory, hybrid defined benefit
pension plan administered by the Texas Municipal Retirement System (TMRS). TMRS is an agency created
by the State of Texas and administered in accordance with the TMRS Act, Subtitle G, Title 8, Texas
Government Code (the "TMRS Act") as an agent multiple-employer retirement system for municipal
employees in the State of Texas. The TMRS Act places the general administration and management of
TMRS with a six-member Board of Trustees. Although the Governor, with the advice and consent of the
Senate, appoints the Board, TMRS is not fiscally dependent on the State of Texas. TMRS's defined benefit
pension plan is a tax-qualified plan under Section 401(a) of the Internal Revenue Code. TMRS issues a
publicly available comprehensive annual financial report (CAFR) that can be obtained at www.tmrs.com.
All eligible employees of the City are required to participate in TMRS.
Benefits Provided
TMRS provides retirement, disability, and death benefits. Benefit provisions are adopted by the governing
body of the City, within the options available in the state statutes governing TMRS.
At retirement, the benefit is calculated as if the sum of the employee's contributions, with interest, and the
City-financed monetary credits with interest were used to purchase an annuity. Members may choose to
receive their retirement benefit in one of seven payments options. Members may also choose to receive a
portion of their benefit as a partial lump sum distribution in an amount equal to 12, 24, or 36 monthly
payments, which cannot exceed 75% of the member's deposits and interest.
At the date the plan began, the City granted monetary credits for service rendered before the plan began of a
theoretical amount equal to two times what would have been contributed by the employee, with interest, prior
to establishment of the plan. Monetary credits for service since the plan began are 200% of the employee's
accumulated contributions.

CITY OF FULSHEAR, TEXAS NOTES TO FINANCIAL STATEMENTS (continued)
38
Note 8 - Employee Retirement System (continued)
Benefits Provided (continued)
The plan provisions are adopted by the governing body of the City, within the options available in the state
statutes governing TMRS. A summary of plan provisions for the City are as follows:
Employee deposit rate 7%
Matching ratio (City to employee) 2 to 1
Years required for vesting 5
Service retirement eligibility 20 years at any age, 5 years at age
60 and above
Updated Service Credit 100% Repeating Transfers
Annuity Increase to retirees
Supplemental death benefit – active
employees and retirees
70% of CPI Repeating
Yes
At the December 31, 2017 valuation and measurement date, the following employees were covered by the
benefit terms:
Retirees or beneficiaries currently receiving benefits 1
Inactive employees entitled to but not yet receiving benefits 17
Active employees 49
67
Contributions
The contribution rates for employees in TMRS are either 5%, 6%, or 7% of employee gross earnings, and the
city matching percentages are either 100%, 150%, or 200%, both as adopted by the governing body of the
city. Under the state law governing TMRS, the contribution rate for each city is determined annually by the
consulting actuary, using the Entry Age Normal (EAN) actuarial cost method. The actuarially determined
rate is the estimated amount necessary to finance the cost of benefits earned by employees during the year,
with an additional amount to finance any unfunded accrued liability.
Employees for the City were required to contribute 7% of their annual gross earnings during the fiscal year.
For fiscal year 2018, the City made contributions of 5.46% for the months in 2017 and 7.62% for the months
in 2018.
Net Pension Liability
The City’s Net Pension Liability (NPL) was measured as of December 31, 2017, and the Total Pension
Liability (TPL) used to calculate the Net Pension Liability was determined by an actuarial valuation as of that
date.

CITY OF FULSHEAR, TEXAS NOTES TO FINANCIAL STATEMENTS (continued)
39
Note 8 - Employee Retirement System (continued)
Actuarial Assumptions
The Total Pension Liability in the December 31, 2017 actuarial valuation was determined using the following
actuarial assumptions:
Inflation 2.5% per year
Salary Increases 3.5% to 10.5% including inflation per year
Investment Rate of Return 6.75%, net of pension plan investment expense, including inflation
Salary increases were based on a service-related table. Mortality rates for active members, retirees, and
beneficiaries were based on the gender-distinct RP2000 Combined Healthy Mortality Table, with male rates
multiplied by 109% and female rates multiplied by 103%. The rates are projected on a fully generational
basis by scale BB to account for future mortality improvements. For disabled annuitants, the gender-distinct
RP2000 Disabled Retiree Mortality Table is used, with slight adjustments.
These actuarial assumptions were developed primarily from the actuarial investigation of the experience of
TMRS over the four year period from December 31, 2010 to December 31, 2014. They were adopted in
2015 and first used in the December 31, 2015 actuarial valuation. The post-retirement mortality assumption
for healthy annuitants and Annuity Purchase Rate (APRs) are based on the Mortality Experience
Investigation Study covering 2009 through 2011 and dated December 31, 2013. In conjunction with these
changes first used in the December 31, 2013 valuation, the System adopted the Entry Age Normal actuarial
cost method and a one-time change to the amortization policy. Assumptions are reviewed annually. No
additional changes were made for the 2017 valuation.
The long-term expected rate of return on pension plan investments is 6.75%. The pension plan’s policy in
regard to the allocation of invested assets is established and may be amended by the TMRS Board of
Trustees. Plan assets are managed on a total return basis with an emphasis on both capital appreciation as
well as the production of income, in order to satisfy the short-term and long-term funding needs of TMRS.
The long-term expected rate of return on pension plan investments was determined using a building-block
method in which best estimate ranges of expected future real rates of return (expected returns, net of pension
plan investment expense and inflation) are developed for each major asset class. These ranges are combined
to produce the long-term expected rate of return by weighting the expected future real rates of return by the
target asset allocation percentage and by adding expected inflation. The target allocation for each major
asset class are summarized in the following table:
Asset Class
Target
Allocation
Long-Term Expected
Real Rate of Return
(Arithmetic)
U.S. Equities 17.5% 4.55%
International Equity 17.5% 6.35%
Core Fixed Income 10.0% 1.00%
Non-core fixed Income 20.0% 4.15%
Real Return 10.0% 4.15%
Real Estate 10.0% 4.75%
Absolute Return 10.0% 4.00%
Private Equity 5.0% 7.75%
100%

CITY OF FULSHEAR, TEXAS NOTES TO FINANCIAL STATEMENTS (continued)
40
Note 8 - Employee Retirement System (continued)
Discount Rate
The discount rate used to measure the Total Pension Liability was 6.75%. The projection of cash flows used
to determine the discount rate assumed that employee contributions will remain at the current 7% and
employer contributions will be made at the rates specified in statute. Based on that assumption, the pension
plan’s Fiduciary Net Position was projected to be available to make all projected future benefit payments of
current plan members. Therefore, the long-term expected rate of return on pension plan investments was
applied to all periods of projected benefit payments to determine the Total Pension Liability.
Sensitivity of the Net Pension Liability to Changes in the Discount Rate
The following presents the net pension liability of the City, calculated using the discount rate of 6.75%, as
well as what the City’s net pension liability would be if it were calculated using a discount rate that is 1-
percentage-point lower (5.75%) or 1-percentage-point higher (7.75%) than the current rate:
1% Decrease Current Single Rate 1% Increase
5.75% Assumption 6.75% 7.75%
Total Pension Liability 1,613,201$ 1,379,123$ 1,185,187$
Plan Fiduciary Net Position 1,091,475 1,091,475 1,091,475
Net Pension Liability 521,726$ 287,648$ 93,712$
Changes in the Net Pension Liability
Increase (Decrease)
Total Pension
Liability
Plan Fiduciary Net
Position
Net Pension
Liability
Beginning Balance, December 31, 2016 923,834$ 705,711$ 218,123$
Service Cost 294,849 294,849
Interest (on the Total Pension Liability) 75,604 75,604
Changes of benefit terms 60,200 60,200
Difference between expected and actual
experience 47,429 47,429
Changes of assumptions
Contributions – employer 162,285 (162,285)
Contributions – employee 148,613 (148,613)
Net investment income 98,192 (98,192)
Administrative Expense (507) 507
Other (26) 26
Benefit payments, including refunds of employee
contributions (22,793) (22,793)
Ending Balance, December 31, 2017 1,379,123$ 1,091,475$ 287,648$

CITY OF FULSHEAR, TEXAS NOTES TO FINANCIAL STATEMENTS (continued)
41
Note 8 - Employee Retirement System (continued)
Pension Plan Fiduciary Net Position
Detailed information about the pension plan’s Fiduciary Net Position is available in a separately-issued TMRS
financial report. That report may be obtained on the Internet at www.tmrs.com.
Pension Expense and Deferred Outflows of Resources and Deferred Inflows of Resources Related to
Pensions
For the fiscal year ended September 30, 2018, the City recognized pension expense of $242,337.
At September 30, 2018, the City reported deferred outflows and inflows of resources related to pensions from
the following sources:
Deferred Outflows
of Resources
Deferred Inflows
of Resources
Differences between expected and actual
experience 59,704$ $
Difference in assumption changes 17,503
Difference between projected and actual earnings 32,024
Pension contributions made after measurement date 165,366
242,573$ 32,024$
Deferred outflows of resources related to pensions resulting from contributions subsequent to the
measurement date of December 31, 2017 will be recognized as a reduction of the net pension liability for the
measurement year ending December 31, 2018 (i.e. recognized in the city’s financial statements September
30, 2019). Other amounts reported as deferred outflows and inflows of resources related to pensions will be
recognized in pension expense as follows:
Fiscal Year
Net Deferred
Outflows (Inflows)
of Resources
2019 7,398$
2020 6,971
2021 2,929
2022 2,958
2023 10,972
Thereafter 13,955
Total 45,183$
CITY OF FULSHEAR, TEXAS NOTES TO FINANCIAL STATEMENTS (continued)
42
Note 9 - Postemployment Benefits Other Than Pensions (OPEB)
TMRS Supplemental Death Benefits Fund
The City also participates in the cost sharing multiple-employer defined benefit group-term life insurance plan
operated by the Texas Municipal Retirement System (TMRS) known as the Supplemental Death Benefits
Fund (SDBF). The City elected, by ordinance, to provide group-term life insurance coverage to both current
and retired employees. The City may terminate coverage under and discontinue participation in the SDBF by
adopting an ordinance before November 1 of any year to be effective the following January 1.
The death benefit for active employees provides a lump-sum payment approximately equal to the employee’s
annual salary (calculated based on the employee’s actual earnings, for the 12-month period preceding the
month of death); retired employees are insured for $7,500; this coverage is an “other postemployment
benefit,” or OPEB.
The City contributes to the SDBF at a contractually required rate as determined by an annual actuarial
valuation. The rate is equal to the cost of providing one-year term life insurance. The funding policy for the
SDBF program is to assure that adequate resources are available to meet all death benefit payments for the
upcoming year; the intent is not to pre-fund retiree term life insurance during employees’ entire careers.
The City’s contributions to the TMRS SDBF for the fiscal year 2018 was $3,041 which equaled the required
contribution amount.
Based on the net position effect of approximately $32,000 and a trivial balance for disclosure of approximately
$40,000, management has determined the effects of GASB 75 are not material to the financial statements and
the amounts have not been recorded in the government-wide financial statements.
Note 10 - Risk Management
The City is exposed to various risks of loss related to torts; theft of, damage to and destruction of assets; errors
and omissions; and natural disasters for which the City participates along with 2,827 other entities in the Texas
Municipal League's Intergovernmental Risk Pools (the "Pool"). The Pool purchases commercial insurance at
group rates for participants in the Pool. The City has no additional risk or responsibility to the Pool, outside
of the payment of insurance premiums. The City has not significantly reduced insurance coverage or had
settlements which exceeded coverage amounts for the past three years.
Note 11 - Regional Park Fund
During 2004, the City entered into an agreement with Firethorne LTD, (the "Developer") whereby the
Developer would pay a regional park fee for every lot per plat the Developer finalized. The terms of the
agreement state that the regional park fees, plus interest earned, must be utilized in the development of a
regional park within five years from the date the fees are paid to the City.
Similar agreements were signed with TMI, Inc., Fulshear Land Investment Partners, LTD., and Tamarron,
L.P., excluding the five year utilization clause. During the year ended September 30, 2018, the City received
$228,800 in regional park fees. Since the inception of the agreements, the City has received $2,021,933.
During the year ended September 30, 2018, the City expended $77,799 of regional park contributions
received on park maintenance and beautification. As of September 30, 2018, the City has restricted net
position of $551,483 related to regional park fees.

CITY OF FULSHEAR, TEXAS NOTES TO FINANCIAL STATEMENTS (continued)
43
Note 12 - Developer Agreement
The City’s development agreements with two master planned communities state that the city rebate all but
$0.10 of the ad valorem tax rate without the clarification between maintenance and operation tax rate and
the interest and sinking tax rate. During the current fiscal year, the City’s rebate totaled $696,640.
Note 13 - Strategic Partnership Agreement
Effective June 21, 2016, the City and Waller County Road Improvement District No. 1 (the “District”)
entered into a Strategic Partnership Agreement (the “Agreement”) under which the City annexed a tract of
land within the boundaries of the District for the limited purposes of levying a sales and use tax on
commercial activities within such tract. The District continues to exercise all powers and functions of a
road improvement district as provided by law with respect to the tract. As consideration for the District
providing services as detailed in the Agreement, the City agreed to remit a portion of the sales and use tax
revenues generated within the boundaries of the tract. As consideration for the sales tax payments by the
City, the District agreed to continue to develop, own, and to operate a water, wastewater, and drainage
system within the District. The City agreed it will not annex the District for full purposes or commence any
action to annex the District during the term of the Agreement, which is through December 31, 2046. During
the current year, the City remitted $260,299 in sales tax revenues related to the Agreement.

44
(This page intentionally left blank.)

45
REQUIRED SUPPLEMENTARY INFORMATION

46
CITY OF FULSHEAR, TEXAS
GENERAL FUND
SCHEDULE OF REVENUES, EXPENDITURES AND CHANGES IN FUND BALANCE
BUDGET AND ACTUAL
For the Year Ended September 30, 2018
Original
Budget
Amounts
Final
Budget
Amounts
Actual
Amounts
Variance with
Final Budget
Revenues
Taxes:
Property 2,261,613$ 2,261,613$ 2,137,299$ (124,314)$
Sales 826,400 826,400 1,331,346 504,946
Franchise 516,000 516,000 647,039 131,039
Public improvement fees 220,000 220,000 353,186 133,186
Intergovernmental 534,486 534,486 236,838 (297,648)
Licenses and permits 1,807,900 1,807,900 2,759,307 951,407
Charges for services 1,296,800 1,296,800 1,800,981 504,181
Fines and forfeitures 150,700 150,700 263,893 113,193
Investment earnings 40,002 40,002 80,210 40,208
Other revenues 278,575 137,997 137,997
Total Revenues 7,932,476 7,653,901 9,748,096 2,094,195
Expenditures
Current:
General government 3,188,546 3,167,074 2,678,794 488,280
Permits and inspections 603,018 609,190 540,513 68,677
Public works 2,223,484 2,229,483 2,218,008 11,475
Public safety 2,411,705 2,421,006 2,361,214 59,792
Planning and development 536,670 536,670 401,682 134,988
Capital Outlay 157,500 157,500 89,437 68,063
Total Expenditures 9,120,923 9,120,923 8,289,648 831,275
Revenues over (under)
expenditures (1,188,447) (1,467,022) 1,458,448 2,925,470
Other Financing Sources (Uses)
Transfers in 1,283,575 1,283,575 1,283,575
Transfers out (95,000) (95,000) 95,000
Total other financing sources (uses) 1,188,575 1,188,575 1,283,575 95,000
Changes in fund balance 128 (278,447) 2,742,023 3,020,470
Fund Balance - Beginning of Year 3,579,243 3,579,243 3,579,243
Fund Balance - End of Year 3,579,371$ 3,300,796$ 6,321,266$ 3,020,470$

47
CITY OF FULSHEAR, TEXAS NOTES TO REQUIRED SUPPLEMENTARY INFORMATION
For the year ended September 30, 2018
Annual budgets are adopted on a modified accrual basis of accounting for all of the City’s funds. Annual
appropriations lapse at fiscal year-end.
The Finance department is responsible for producing, monitoring, and reporting the City’s annual operating
budget. The City of Fulshear operates a fiscal year beginning October 1 through September 30 annually.
Each spring, the staff begins the annual process to determine the needs of the city. The requests are based on
the programs and priorities that the city council has discussed or committed to in the past. A recommended
budget is formed based on the projected revenue and submitted to the citizens and the city council. After
input from the public and the staff the council has the opportunity to revise the budget to conform to its
objectives.
Public hearings regarding the budget and tax rate are held in August/September and are open to the
public. The city budget contains several different funds with the largest being the general fund which is used
for general government services that do not need to be accounted for separately. Examples of general
government services include public safety, street maintenance, and administrative activities.
Once adopted, the budget takes effect on the first of the fiscal year (October 1) and any major changes must
be approved by the city council.

48
CITY OF FULSHEAR, TEXAS REQUIRED PENSION SYSTEM SUPPLEMENTARY INFORMATION
September 30, 2018
TEXAS MUNICIPAL RETIREMENT SYSTEM (UNAUDITED)
Schedule of Changes in Net Pension Liability and Related Ratios
Last Four Measurement Years
Total pension liability: 2017 2016 2015 2014
Service Cost 294,849$ 231,217$ 156,945$ 93,711$ Interest (on the Total Pension Liability) 75,604 51,368 36,771 23,662
Changes of benefit terms 60,200
Difference between expected and
actual experience 47,429 (795) (9,944) 47,654
Changes of assumptions 25,851
Benefit payments, including refunds of
employee contributions (22,793) (6,702) (15,416) (3,334)
Net change in total pension liability 455,289 275,088 194,207 161,693
Total pension liability – beginning 923,834 648,746 454,539 292,846
Total pension liability – ending 1,379,123$ 923,834$ 648,746$ 454,539$
Plan fiduciary net position:
Contributions – employer 162,285$ 117,152$ 80,804$ 51,713$
Contributions – employee 148,613 118,817 85,950 68,767
Net investment income 98,192 30,293 436 9,644
Benefit payments, including refunds of
employee contributions (22,793) (6,702) (15,416) (3,334)
Administrative Expense (507) (341) (265) (101)
Other (26) (18) (13) (8)
Net change in plan fiduciary net
position 385,764 259,201 151,496 126,681
Plan fiduciary net position – beginning 705,711 446,510 295,014 168,333
Plan fiduciary net position – ending 1,091,475$ 705,711$ 446,510$ 295,014$
Net pension Liability 287,648$ 218,123$ 202,236$ 159,525$
Net plan fiduciary net position as a
percentage of total pension liability 79% 76% 69% 65%
Total covered payroll 2,972,266$ 2,376,331$ 1,718,999$ 1,375,366$
Net pension liability as a
percentage of total covered payroll 10% 9% 12% 12%
The amounts presented are for each measurement year, which end the preceding December 31 of the City's
fiscal year end. Net pension liability is calculated using a new methodology and will be presented
prospectively in accordance with GASB 68. Ten years of data should be presented in this schedule but data
was unavailable prior to 2014.

49
CITY OF FULSHEAR, TEXAS REQUIRED PENSION SYSTEM SUPPLEMENTARY INFORMATION
September 30, 2018
TEXAS MUNICIPAL RETIREMENT SYSTEM (UNAUDITED)
Schedule of Pension Contributions
Last Eight Fiscal Years
2018 2017 2016 2015 2014
Actuarial determined contribution 201,087$ 148,255$ 105,268$ 69,687$ 39,619$
Contribution in relation to the
actuarial determined contribution 201,087 148,255 105,268 69,687 39,619
Contribution deficiency (excess) $ $ $ $ $
Covered payroll (fiscal year) 3,025,711$ 2,779,644$ 2,155,862$ 1,568,017$ 870,232$
Contributions as a percentage of
covered payroll 6.65% 5.33% 4.88% 4.44% 4.55%
2013 2012 2011
Actuarial determined contribution 8,826$ 11,801$ 22,882$
Contribution in relation to the
actuarial determined contribution 8,826 11,801 22,882
Contribution deficiency (excess) $ $ $
Covered employee payroll (fiscal
year) 703,095$ 583,368$ 85,673$
Contributions as a percentage of
covered payroll 1.26% 2.02% 26.71%
The City began participating in TMRS in fiscal year 2011, therefore no information is available prior to that date.

50
(This page intentionally left blank.)

51
COMBINING AND INDIVIDUAL FUND
STATEMENTS AND SCHEDULES

52
(This page intentionally left blank.)

53
Non-Major Governmental Funds
Capital Projects Fund
The Capital Projects Fund provides a separate accounting for the Capital Improvement Program projects
that are detailed in the program and funded either by the issuing of debt or annual budget allocations.
Special Revenue Funds
Special Revenue Funds account for the proceeds and specific revenue sources that are legally restricted to
expenditures for specific purposes.
Regional Park Fund
This special revenue fund provides for the accounting of committed funds for park land and park
development.
Municipal Court Fund
This fund is made up of four special revenue funds those being:
Court Technology Fund provides for the accounting of fees collected by the Court in accordance
with state statute to purchase technology for the Court.
Court Building Security Fund provides for the accounting of fees collected by the Court in
accordance with state statute to purchase building security products and services for the Court.
Judicial Efficiency Fund provides for the accounting of fees collected by the court that are to be
used for the purpose of improving the efficiency of the administration of justice.
Child Safety Fund provides for the accounting of fees collected by the court that are to be used for
the purpose of providing child safety.
Police Donation and Federal Seizure Fund
This special revenue fund provides for the accounting of donations collected that are to be used for the
purpose of providing products and services for police operations.
This special fund also provides for the accounting of seizure funds collected that are to be used for the
purpose of providing products and services for police activities that do not supplant operating budgets.
County Assistance District #7 Fund
This special revenue fund provides additional sales tax revenues from unincorporated areas of the city’s
extraterritorial jurisdiction area (ETA). These funds are collected via the State Comptroller and distributed to
Fort Bend County and the County remits one-half of the remittance to the City on a quarterly basis. The funds
are required to be spent on projects in the area covered by the District #7 or projects that benefit the District
#7.

54
CITY OF FULSHEAR, TEXASCOMBINING BALANCE SHEET
NONMAJOR GOVERNMENTAL FUNDS
September 30, 2018
Capital Projects
Fund Regional
Park Municipal
Court
Police Donation and Seizure Fund
County Assistance District #7
Total Nonmajor
Governmental Funds
AssetsCash and cash equivalents 840,921$ 561,791$ 80,083$ 99,562$ 159,598$ 1,741,955$
Receivables, net 1,136 37,053 38,189 Total Assets 840,921$ 562,927$ 80,083$ 99,562$ 196,651$ 1,780,144$
LiabilitiesAccounts payable 7,406$ 11,444$ $ $ $ 18,850$
Total Liabilities 7,406 11,444 18,850
Fund balancesRestricted for:
Regional Park 551,483 551,483
Municipal Court 80,083 80,083 Public Safety 99,562 99,562
District #7 196,651 196,651
Committed 833,515 833,515
Total Fund Balances 833,515 551,483 80,083 99,562 196,651 1,761,294
Total Liabilities and Fund Balances 840,921$ 562,927$ 80,083$ 99,562$ 196,651$ 1,780,144$

55
CITY OF FULSHEAR, TEXAS
COMBINING STATEMENT OF REVENUES, EXPENDITURES AND
CHANGES IN FUND BALANCES
NONMAJOR GOVERNMENTAL FUNDS
For the Year Ended September 30, 2018
Capital
Projects
Fund
Regional
Park
Municipal
Court
Police
Donation
and Seizure
Fund
County
Assistance
District #7
Total
Nonmajor
Governmental
Funds
Revenues
Sales tax $ $ $ $ 195,652$ 195,652$
Fines and forfeitures 14,701 26,995 41,696
Investment earnings 15,059 8,348 1,058 1,180 999 26,644
Other revenues 228,800 228,800
Total Revenues 15,059 237,148 15,759 28,175 196,651 492,792
Expenditures
Current:
General administration 5,043 5,043
Public safety 1,599 5,000 6,599
Capital Outlay 208,871 77,799 286,670
Total Expenditures 208,871 77,799 1,599 10,043 298,312
Revenues over (under)
expenditures (193,812) 159,349 14,160 18,132 196,651 194,480
Other Financing Sources (Uses)
Transfers in 95,000 95,000
Transfers out (195,000) (195,000)
Total other financing
sources (uses) (100,000) (100,000)
Net Changes in Fund
Balances (293,812) 159,349 14,160 18,132 196,651 94,480
Fund Balances - beginning of
year 1,127,327 392,134 65,923 81,430 1,666,814
Fund Balances - end of year 833,515$ 551,483$ 80,083$ 99,562$ 196,651$ 1,761,294$

56
CITY OF FULSHEAR, TEXAS
COMBINING BALANCE SHEET AND STATEMENT OF NET POSITION
DISCRETELY PRESENTED COMPONENT UNITS
September 30, 2018
Fulshear Development Corporation City of Fulshear Development Corporation
General Fund
Capital
Projects Fund
Total
Governmental
Funds
Assets
Cash and cash equivalents 1,420,380$ 343,346$ 1,763,726$
Investments 2,273 2,273
Receivables, net 162,713 162,713
Total Assets 1,585,366$ 343,346$ 1,928,712$
Liabilities
Accounts payable 1,614$ $ 1,614$
Total Liabilities 1,614 1,614
Fund balances
Restricted for:
Economic Development 1,583,752 343,346 1,927,098
Total Fund Balances 1,583,752 343,346 1,927,098
Total Liabilities and Fund Balances 1,585,366$ 343,346$ 1,928,712$
Net position of component units 1,927,098$

57
City of Fulshear Development Corporation
General Fund
Capital
Projects Fund
Total
Governmental
Funds
1,249,633$ 389,007$ 1,638,640$
162,713 162,713
1,412,346$ 389,007$ 1,801,353$
1,837$ $ 1,837$
1,837 1,837
1,410,509 389,007 1,799,516
1,410,509 389,007 1,799,516
1,412,346$ 389,007$ 1,801,353$
1,799,516$

58
CITY OF FULSHEAR, TEXAS
COMBINING STATEMENT OF REVENUES, EXPENDITURES AND
CHANGES IN FUND BALANCES AND NET POSITION
DISCRETELY PRESENTED COMPONENT UNITS
For the Year Ended September 30, 2018
Fulshear Development Corporation City of Fulshear Development Corporation
General Fund
Capital Projects
Fund
Total
Governmental
Funds
Revenues
Taxes:
Sales 789,832$ $ 789,832$
Investment earnings 18,526 3,782 22,308
Total Revenues 808,358 3,782 812,140
Expenditures
Current:
General administration 125,078 27,903 152,981
Total Expenditures 125,078 27,903 152,981
Revenues over (under) expenditures 683,280 (24,121) 659,159
Other Financing Sources (Uses)
Transfers in 143,015 143,015
Transfers out (143,015) (143,015)
Total other financing sources (uses) (143,015) 143,015
Net Changes in Fund Balances 540,265 118,894 659,159
Fund Balances - beginning of year 1,043,487 224,452 1,267,939
Fund Balances - end of year 1,583,752$ 343,346$ 1,927,098$
Changes in Net Position of Component Units 659,159$

59
City of Fulshear Development Corporation
General Fund
Capital
Projects Fund
Total
Governmental
Funds
789,832$ $ 789,832$
16,083 4,384 20,467
805,915 4,384 810,299
125,015 11,040 136,055
125,015 11,040 136,055
680,900 (6,656) 674,244
143,015 143,015
(143,015) (143,015)
(143,015) 143,015
537,885 136,359 674,244
872,624 252,648 809,398
1,410,509$ 389,007$ 1,799,516$
674,244$

60
(This page intentionally left blank.)
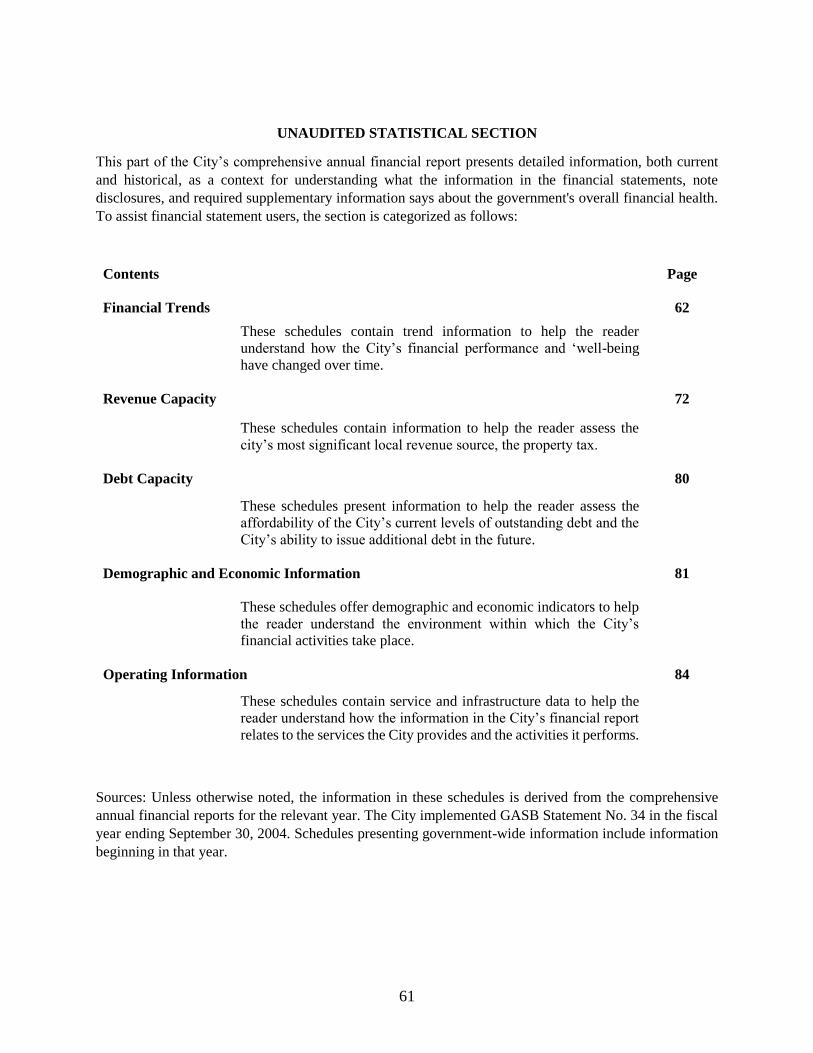
61
UNAUDITED STATISTICAL SECTION
This part of the City’s comprehensive annual financial report presents detailed information, both current
and historical, as a context for understanding what the information in the financial statements, note
disclosures, and required supplementary information says about the government's overall financial health.
To assist financial statement users, the section is categorized as follows:
Contents Page
Financial Trends 62
These schedules contain trend information to help the reader
understand how the City’s financial performance and ‘well-being
have changed over time.
Revenue Capacity 72
These schedules contain information to help the reader assess the
city’s most significant local revenue source, the property tax.
Debt Capacity 80
These schedules present information to help the reader assess the
affordability of the City’s current levels of outstanding debt and the
City’s ability to issue additional debt in the future.
Demographic and Economic Information
81
These schedules offer demographic and economic indicators to help
the reader understand the environment within which the City’s
financial activities take place.
Operating Information 84
These schedules contain service and infrastructure data to help the
reader understand how the information in the City’s financial report
relates to the services the City provides and the activities it performs.
Sources: Unless otherwise noted, the information in these schedules is derived from the comprehensive
annual financial reports for the relevant year. The City implemented GASB Statement No. 34 in the fiscal
year ending September 30, 2004. Schedules presenting government-wide information include information
beginning in that year.

62
CITY OF FULSHEAR, TEXAS
NET POSITION BY COMPONENT
Last Eight Fiscal Years
(Accrual Basis of Accounting)
2011 2012 2013 2014
Governmental Activities
Net investment in capital
assets 768,821$ 836,979$ 18,260,633$ 23,797,616$
Restricted 228,005 369,611 709,984 1,156,792
Unrestricted 2,230,981 2,451,299 3,179,338 4,560,523
Total Governmental
Activities Net Position 3,227,807$ 3,657,889$ 22,149,955$ 29,514,931$
Business-type Activities
Net investment in capital
assets 9,768,635$ 10,798,612$ 23,563,837$ 30,581,919$
Restricted 326,991 389,861 326,961 1,755,008
Unrestricted 170,624 363,227 1,076,677 2,692,052
Total Business-type
Activities Net Position 10,266,250$ 11,551,700$ 24,967,475$ 35,028,979$
Primary Government
Net investment in capital
assets 10,537,456$ 11,635,591$ 41,824,470$ 54,379,535$
Restricted 554,996 759,472 1,036,945 2,911,800
Unrestricted 2,401,605 2,814,526 4,256,015 7,252,575
Total Primary Government
Net Position 13,494,057$ 15,209,589$ 47,117,430$ 64,543,910$
Source: City's Annual Financial Report or Comprehensive Annual Financial Report
Note: Fiscal year 2018 is the first year for Comprehensive Annual Financial Report.
Fiscal years 2009 and 2010 financial data are not available.

63
Table 1
2015 2016 2017 2018
25,705,433$ 40,176,704$ 44,707,835$ 47,690,398$
1,515,599 1,564,928 539,487 927,779
5,475,094 4,575,158 4,572,984 7,109,430
32,696,126$ 46,316,790$ 49,820,306$ 55,727,607$
32,998,255$ 40,999,464$ 60,024,809$ 61,057,346$
1,223,225 727,922
3,908,853 3,127,505 4,817,260 5,129,214
38,130,333$ 44,854,891$ 64,842,069$ 66,186,560$
58,703,688$ 81,176,168$ 104,732,644$ 108,747,744$
2,738,824 2,292,850 539,487 927,779
9,383,947 7,702,663 9,390,244 12,238,644
70,826,459$ 91,171,681$ 114,662,375$ 121,914,167$

64
CITY OF FULSHEAR, TEXAS
CHANGES IN NET POSITION
Last Eight Fiscal Years
(Accrual Basis of Accounting)
2011 2012 2013 2014
Expenses
Governmental activities:
General government 775,237$ 791,786$ 550,662$ 1,256,952$
Permits and Inspections 187,965 376,897
Public safety 577,650 479,595 672,355 941,346
Public works 237,907 438,217 1,444,102 1,001,930
Interest on long-term debt 3,127 1,789 1,674 292
Total governmental activities
expenses 1,593,921 1,711,387 2,856,758 3,577,417
Business-type activities:
Water and sewer 1,165,997 1,493,238 2,254,075 2,573,262
Total Primary Government
Expenses 2,759,918$ 3,204,625$ 5,110,833$ 6,150,679$
Program Revenue
Governmental activities:
Charges for services:
Permits and Inspections $ $ 2,088,983$ 2,418,323$
Public safety 553,044 760,037 124,058 149,468
Public works 557,235 708,010 40,858 71,922
Operating grants and contributions:
General government 1,340
Public safety 5,000 28,919
Public works
Capital grants and contributions 21,711 51,514 1,745,415 6,595,732
Total governmental activities
program revenues 1,131,990 1,519,561 4,004,314 9,265,704
Business-type activities:
Charges for services:
Water and sewer 1,268,549 1,432,910 2,242,322 3,271,568
Capital grants and contributions 239,860 358,700 3,741,326 9,085,540
Total business-type activities
program revenues 1,508,409 1,791,610 5,983,648 12,357,108
Total Primary Government
Program Revenues 2,640,399$ 3,311,171$ 9,987,962$ 21,622,812$
Net (Expense)/Revenue
Governmental activities (461,931)$ (191,826)$ 1,147,556$ 5,688,287$
Business-type activities 342,412 298,372 3,729,573 9,783,846
Total Primary Government Net
Expense (119,519)$ 106,546$ 4,877,129$ 15,472,133$
Source: City's Annual Financial Report or Comprehensive Annual Financial Report
Note: Fiscal year 2018 is the first year for Comprehensive Annual Financial Report.
Fiscal years 2009 and 2010 financial data are not available.

65
Table 2
Page 1 of 2
2015 2016 2017 2018
2,039,436$ 2,579,727$ 2,381,636$ 2,605,264$
528,461 322,415 814,579 957,063
1,427,578 1,669,998 2,156,611 2,688,730
1,249,674 2,150,127 3,366,308 3,949,615
5,245,149 6,722,267 8,719,134 10,200,672
3,106,400 4,671,213 4,189,671 6,285,177
8,351,549$ 11,393,480$ 12,908,805$ 16,485,849$
2,570,046$ 2,396,980$ 2,811,853$ 3,985,701$
193,757 170,117 216,794 305,589
371,686 666,506 747,132 925,845
255,917 236,838
29,246 28,133 31,137
12,438
2,798,155 15,565,852 4,791,180 4,469,274
5,962,890 18,827,588 8,835,314 9,954,384
3,395,191 4,468,483 5,203,537 7,115,884
2,806,881 5,642,980 18,860,007 1,481,332
6,202,072 10,111,463 24,063,544 8,597,216
12,164,962$ 28,939,051$ 32,898,858$ 18,551,600$
717,741$ 12,105,321$ 116,180$ (246,288)$
3,095,672 5,440,250 19,873,873 2,312,039
3,813,413$ 17,545,571$ 19,990,053$ 2,065,751$

66
CITY OF FULSHEAR, TEXAS
CHANGES IN NET POSITION
Last Eight Fiscal Years
(Accrual Basis of Accounting)
2011 2012 2013 2014
General Revenues and Other
Changes in Net Position
Governmental activities:
Taxes:
Property taxes 434,664$ 572,879$ 732,475$ 943,721$
Sales and use taxes 242,167 333,383 404,418 522,563
Franchise taxes 123,906 128,454 173,011 197,620
Unrestricted grants and contributions
Investment earnings 12,858 9,838 7,112 7,993
Other Revenues 71,953 178,746 41,914 184,860
Transfers 376,871 (585,456) (257,644)
Total governmental activities 1,262,419 637,844 1,358,930 1,599,113
Business-type activities:
Sales and use taxes 897
Investment earnings 3,077 2,543 1,334 3,044
Other Revenues 379,488 2,179 16,970
Transfers (376,871) 585,456 257,644
Total business-type activities 5,694 590,178 2,231 277,658
Total primary government 1,268,113$ 1,228,022$ 1,361,161$ 1,876,771$
Change in Net Position
Governmental activities 800,488$ 446,018$ 2,506,486$ 7,287,400$
Business-type activities 348,106 888,550 3,731,804 10,061,504
Total primary government 1,148,594$ 1,334,568$ 6,238,290$ 17,348,904$
Source: City's Annual Financial Report or Comprehensive Annual Financial Report
Note: Fiscal year 2018 is the first year for Comprehensive Annual Financial Report.
Fiscal years 2009 and 2010 financial data are not available.

67
Table 2
Page 2 of 2
2015 2016 2017 2018
1,273,932$ 1,574,219$ 1,834,115$ 2,155,867$
665,127 689,508 827,480 1,526,998
380,718 384,885 514,470 647,039
9,527 21,867 47,221 107,636
222,988 115,358 244,036 532,474
(1,270,494) (79,986) 1,183,575
2,552,292 1,515,343 3,387,336 6,153,589
5,682 13,814 33,319 77,531
138,496
1,270,494 79,986 (1,183,575)
5,682 1,284,308 113,305 (967,548)
2,557,974$ 2,799,651$ 3,500,641$ 5,186,041$
3,270,033$ 13,620,664$ 3,503,516$ 5,907,301$
3,101,354 6,724,558 19,987,178 1,344,491
6,371,387$ 20,345,222$ 23,490,694$ 7,251,792$

68
CITY OF FULSHEAR, TEXAS
FUND BALANCES OF GOVERNMENTAL FUNDS
Last Eight Fiscal Years
(Modified Accrual Basis of Accounting)
2011 2012 2013 2014
General fund
Nonspendable $ 100$ 100$ $
Restricted:
Regional Park 131,733 131,733
Unassigned 1,785,765 2,328,542 3,094,550 4,303,085
Total General Fund 1,785,765$ 2,328,642$ 3,226,383$ 4,434,818$
All other governmental funds
Restricted:
Regional Park 213,215$ 350,026$ 578,251$ 978,311$
Other 14,790 19,585 46,748
Assigned:
Capital projects 377,075 83,724
Committed 33,084 270,908
Unassigned 32,666
Total all other governmental funds 605,080$ 453,335$ 644,001$ 1,295,967$
Note : In conforming to provisions of GASB Statement No. 54, fund balances of
prior periods were restated to the new fund balance classifications.
Source: City's Annual Financial Report or Comprehensive Annual Financial Report
Note: Fiscal year 2018 is the first year for Comprehensive Annual Financial Report.
Fiscal years 2009 and 2010 financial data are not available.

69
Table 3
2015 2016 2017 2018
$ $ $ $
131,733
5,307,210 3,206,004 3,579,243 6,321,266
5,438,943$ 3,206,004$ 3,579,243$ 6,321,266$
1,322,167$ 1,473,709$ 392,134$ 551,483$
61,699 91,219 376,296
147,353
271,113 1,440,178 1,127,327 833,515
1,654,979$ 3,005,106$ 1,666,814$ 1,761,294$

70
CITY OF FULSHEAR, TEXAS
CHANGES IN FUND BALANCES OF GOVERNMENTAL FUNDS
Last Eight Fiscal Years
(Modified Accrual Basis of Accounting)
2011 2012 2013
Revenues
Taxes:
Property taxes 415,340$ 581,481$ 747,961$
Sales and use taxes 242,167 333,383 404,418
Franchise taxes 123,906 128,454 173,011
Public improvement Fees 78,362 74,263 181,628
Licenses and Permits 482,847 661,739 1,503,252
Intergovernmental
Charges for services 478,873 633,747 461,282
Fines and forfeitures 70,197 98,298 129,108
Investment earnings 12,858 9,838 7,112
Capital grant and contributions 21,711 21,000
Other revenues 67,125 178,371 275,384
Total Revenues 1,993,386 2,720,574 3,883,156
Expenditures
General government 741,775 788,429 972,303
Permits and inspections 185,015
Public safety 551,206 476,212 639,517
Public works 197,739 399,239 198,683
Planning and Development
Capital outlay 645,940 778,667
Debt service:
Principal 32,661 42,686 19,240
Interest and other charges 3,127 1,789 1,324
Total Expenditures 1,526,508 2,354,295 2,794,749
Excess of revenues over (under) expenditures 466,878 366,279 1,088,407
Other Financing Sources (Uses)
Transfers in 376,871 275,000 525,370
Transfers out (275,000) (525,370)
Capital leases 24,478
Sale of capital assets 4,828 375
Total other financing sources (uses) 381,699 24,853
Net Change in Fund Balances 848,577$ 391,132$ 1,088,407$
Source: City's Annual Financial Report or Comprehensive Annual Financial Report
Note: Fiscal year 2018 is the first year for Comprehensive Annual Financial Report.
Fiscal years 2009 and 2010 financial data are not available.

71
Table 4
2014 2015 2016 2017 2018
966,619$ 1,264,271$ 1,556,311$ 1,857,472$ 2,137,299$
522,563 665,127 689,508 827,480 1,526,998
197,620 380,718 361,528 514,470 647,039
531,303 345,803 216,099 232,276 353,186
1,401,279 1,872,346 1,731,465 1,993,927 2,759,307
255,917 236,838
574,811 744,125 1,129,918 1,344,285 1,800,981
159,109 193,957 170,292 214,685 305,589
7,993 9,529 21,867 46,505 106,854
608,248 578,740 381,027 383,996 366,797
4,969,545 6,054,616 6,258,015 7,671,013 10,240,888
1,215,147 2,014,649 2,712,933 2,430,917 2,683,837
406,484 517,507 297,752 791,896 540,513
880,686 1,382,908 1,579,291 2,157,402 2,367,813
341,709 466,294 740,437 1,872,025 2,218,008
401,682
76,363 310,121 539,920 1,303,840 376,107
8,045
642
2,929,076 4,691,479 5,870,333 8,556,080 8,587,960
2,040,469 1,363,137 387,682 (885,067) 1,652,928
23,218 42,650 1,707,760 1,140,928 1,378,575
(280,862) (42,650) (2,978,254) (1,220,914) (195,000)
(257,644) (1,270,494) (79,986) 1,183,575
1,782,825$ 1,363,137$ (882,812)$ (965,053)$ 2,836,503$

72
CITY OF FULSHEAR, TEXAS
ASSESSED VALUE AND ESTIMATED ACTUAL VALUE
OF TAXABLE PROPERTY
Last Ten Fiscal Years
Fiscal
Year
Tax
Year
Residential
Property
Commercial
Property Ag Value
Personal
Property
Value (1)
Less Tax
Exempt Real
Property
2009 2008 58,763,320$ 45,850,940$ 69,760,050$ 7,529,970$ 89,647,832$
2010 2009 73,192,190 104,244,640 87,663,810 7,919,236 118,753,600
2011 2010 110,208,430 100,204,290 76,557,470 7,126,552 106,880,821
2012 2011 179,105,310 98,477,920 80,912,780 7,083,434 120,119,059
2013 2012 265,605,630 104,186,000 78,310,890 8,654,622 132,046,664
2014 2013 343,235,210 126,424,910 92,420,620 12,562,884 158,539,541
2015 2014 551,206,916 172,331,340 86,252,280 12,094,152 195,581,525
2016 2015 816,201,256 209,501,120 82,898,180 14,580,274 241,737,243
2017 2016 926,516,590 269,791,580 107,753,270 36,613,901 287,313,916
2018 2017 1,149,298,638 456,557,613 122,805,510 38,591,624 421,315,214
(1) The value is the appraised value at original certification and fluctuates due to
property owner protests and preliminary appraisal values at the time of certification.
(2) Tax rate per $100 assessed valuation.
(3) All properties are assessed at 100% of actual taxable value. The difference between
market value is the value of exemptions given for statutory purposes.
Source: County Tax/Assessor Reports
Real Property Value (1)

73
Table 5
Estimated
Total Taxable
Assessed Value
Total
Direct Tax
Rate (2)
Actual
Taxable
Value
Assessed Value as
a Percentage of
Actual Value (3)
92,256,448$ 0.20592 92,256,448$ 100.00%
154,266,276 0.20592 154,266,276 100.00%
187,215,921 0.20592 187,215,921 100.00%
245,460,385 0.20592 245,460,385 100.00%
324,710,478 0.20366 324,710,478 100.00%
416,104,083 0.19713 416,104,083 100.00%
626,303,163 0.17829 626,303,163 100.00%
881,443,587 0.16163 881,443,587 100.00%
1,053,361,425 0.15690 1,053,361,425 100.00%
1,345,938,171 0.15691 1,345,938,171 100.00%

74
CITY OF FULSHEAR, TEXAS Table 6
PROPERTY TAX RATES (1)
DIRECT AND OVERLAPPING GOVERNMENTS (2)
Last Ten Fiscal Years
City of Fulshear
Fiscal
Year
Operating
Tax Rate
Debt
Service Tax
Rate
Total Tax
Rate
Lamar
Consolidated
School District
Katy
Independent
School
District
Fort Bend
County
2009 0.20592$ 0.20592$ 1.29765$ 1.52660$ 0.48376$
2010 0.20592 0.20592 1.29765 1.52660 0.47900
2011 0.20592 0.20592 1.36455 1.52660 0.48016
2012 0.20592 0.20592 1.39005 1.52660 0.48096
2013 0.20366 0.20366 1.39005 1.52660 0.48076
2014 0.19713 0.19713 1.39005 1.52660 0.48476
2015 0.17829 0.17829 1.39005 1.52660 0.47276
2016 0.16163 0.16163 1.39005 1.51660 0.46500
2017 0.15690 0.15690 1.39005 1.51660 0.45800
2018 0.15869 0.15869 1.39005 1.51660 0.45300
(1) Tax rate per $100 assessed valuation
(2) Overlapping rates are those of local and county governments that apply
to property owners within the City of Fulshear. Not all overlapping rates
apply to all City of Fulshear property owners (e.g., the county rates apply
only to the proportion of the City's property owners whose property is
located within the geographic boundaries of the specific county).
Source: Tax department records of various taxing authorities.

75
CITY OF FULSHEAR, TEXAS Table 7
PRINCIPAL PROPERTY TAXPAYERS
Current Year and One Year Ago
Taxpayer
Taxable
Assessed Value
(1) Rank
% of Total
Assessed
Valuation (2)
Taxable
Assessed Value
(1) Rank
% of Total
Assessed
Valuation (2)
CCR Loan Subsidiary 1 LP 14,325,910$ 1 0.9% 21,094,050$ 2 1.6%
HEB Grocery Company LP 11,110,190 2 0.7%
Trendmaker Homes INC 10,813,220 3 0.7% 12,655,470 4 0.9%
DHK Fulshear LP 9,931,480 4 0.7% 14,357,210 3 1.1%
TLM-CCR Phase II LLC 9,858,110 5 0.7% 7,413,590 7 0.6%
Taylor Morrison of Texas INC 7,801,840 6 0.5%
A-S 132 S Fry Road-FM 1463 L P 7,621,295 7 0.5% 6,971,660 9 0.5%
CCR 21 LLC 7,506,260 8 0.5%
Texas Petroleum Group LLC 5,985,860 9 0.4% 5,374,450 10 0.4%
Stefano-Ratcliff Interest Inc 5,154,820 10 0.3%
Enterprise Crude Pipeline Lp 4,985,100 11 0.3%
Shops at Cross Creek II LLC 4,398,020 12 0.3%
TP Fulshear Self Storage Ltd 4,294,390 13 0.3%
Rk CCR Phase 1 LLC 4,289,047 14 0.3%
Yurdy LLC 4,047,770 15 0.3%
The Market At CCR Ltd 3,966,530 16 0.3%
Landmark Industries 3,830,000 17 0.3% 12,202,394 5 0.9%
CCR Texas Holding LP 3,503,190 18 0.2% 7,037,120 8 0.5%
MGJ Holdings LP 3,452,428 19 0.2%
Mobley David Michael & Lisa Lynn 3,345,670 20 0.2%
CCOC LLC 42,799,809 1 3.2%
130,223,148 8.6% 129,905,753 9.7%
Other taxpayers 1,378,229,841 91.4% 1,216,032,418 90.3%
Total Assessed Valuation 1,508,452,989$ 100.0% 1,345,938,171$ 100.0%
(1) Assessed (taxable) value equals appraised value after exemptions.
(2) See the Schedule of Assessed Value and Estimated Actual Value of Taxable Property for valuation data.
Source: Fort Bend County Appraisal District
Note: Fiscal year 2018 is the first year for Comprehensive Annual Financial Report. Data from nine years ago are not available.
20172018

76
CITY OF FULSHEAR, TEXAS
PROPERTY TAX LEVIES AND COLLECTIONS
Last Ten Fiscal Years
Collected Within the Fiscal Year
of the Levy
Collections in
Subsequent
Years
Fiscal
Year
Tax
Year Tax Rate (1)
Total Tax Levy
for Fiscal Year Amount
Percentage of
Levy Amount
2009 2008 0.20592$ 190,069$ 171,369$ 90.2% 182,759$
2010 2009 0.20592 319,812 294,680 92.1% 316,249
2011 2010 0.20592 414,794 393,244 94.8% 412,216
2012 2011 0.20592 538,621 521,640 96.8% 536,146
2013 2012 0.20366 661,375 685,060 103.6% 658,030
2014 2013 0.19713 829,012 897,005 108.2% 825,770
2015 2014 0.17829 1,197,031 1,192,635 99.6% 1,194,162
2016 2015 0.16163 1,513,831 1,499,858 99.1% 1,508,628
2017 2016 0.15690 1,840,239 1,824,840 99.2% 1,833,410
2018 2017 0.15869 2,102,986 2,086,847 99.2% 2,086,876
(1) Tax rate per $100 assessed valuation
Source: City Finance Department
Fort Bend County Tax Office

77
Table 8
Total Collections to Date
Amount
Percentage of
Levy
182,759$ 96.2%
316,249 98.9%
412,216 99.4%
536,146 99.5%
658,030 99.5%
825,770 99.6%
1,194,162 99.8%
1,508,628 99.7%
1,833,410 99.6%
2,086,876 99.2%

78
CITY OF FULSHEAR, TEXAS
TAXABLE SALES BY CATEGORY
LAST TEN CALENDAR YEARS
(in Thousands of Dollars)
2008 2009 2010 2011
Public Administration $ $ $ $
Admin/Support/Waste Mgmt/Remediation 521,650 617,025 558,332 440,142
Retail Trade 4,519,859 4,348,288 5,031,419 4,795,280
Construction 1,037,920 365,903 5,446 65,447
Manufacturing 11,284 24,554 215,628
Mining/Quarrying/Oil and Gas Extraction 13,500 13,500
Wholesale Trade
Transportation/Warehousing 2,688,376 477,623
Information
Arts/Entertainment/Recreation
Real Estate/Rental/Leasing
Other Services (except Public Administration) 479,121 549,487 538,816 666,252
Accommodation/Food Services 2,872,403 3,125,500 3,268,597 3,724,970
Professional/Scientific/Technical Services 57,766 51,140 53,364 64,195
Other 2 1
Total Taxable Sales 12,177,097$ 9,559,751$ 9,494,028$ 9,971,914$
City direct sales tax rate (1) 1.00% 1.00% 1.00% 1.00%
(1) The City direct sales tax rate includes the City only.
Note: Taxable sales for calendar year 2018 were not available at the date of this report.
Source: State Comptroller's Office

79
Table 9
2012 2013 2014 2015 2016 2017
$ $ $ $ $ 565,074$
356,696 512,242 736,591 717,428 717,120 797,500
5,244,862 6,258,550 25,154,631 43,500,951 45,332,799 49,982,542
134,059 84,428 594 844,183 3,213,700 2,696,718
570,401 532,885 847,415 1,203,498 821,844 1,154,776
42,875
901,333
8,181 13,988 22,741 28,541 35,725
40,235 20,036
7,886 10,496 6,689 6,588 122,357 492,043
6,959 497,675 1,211,971 825,650 995,769
698,929 647,901 908,401 1,045,581 1,178,494 1,905,629
6,484,729 8,810,293 9,984,358 9,998,796 11,857,090 13,417,178
67,472 103,953 457,417 394,905 272,884 353,454
13,573,215$ 17,050,817$ 38,627,795$ 58,946,642$ 64,370,479$ 73,297,741$
1.00% 1.00% 1.00% 1.00% 1.00% 1.00%

80
CITY OF FULSHEAR, TEXAS Table 10DIRECT AND OVERLAPPING GOVERNMENTAL
ACTIVITIES DEBT
As of September 30, 2018
Name of Governmental Unit
Net Debt
Outstanding
Percentage
Applicable to
City
Estimated Debt
Applicable to
City
Katy Independent School District 1,675,973,206$ 7.27% 121,843,252$
Lamar Consolidated Independent School District 1,062,884,484 3.48% 36,988,380
Fort Bend County 507,913,816 0.21% 1,066,619
Fort Bend County MUD #169 699,693 100.00% 699,693
Fort Bend County MUD #170 28,363,629 100.00% 28,363,629
Fort Bend County MUD #171 43,804,538 100.00% 43,804,538
Fort Bend County MUD #172 72,165,492 100.00% 72,165,492
Fort Bend County MUD #173 41,316,386 100.00% 41,316,386
Fulshear MUD#1 19,706,895 100.00% 19,706,895
City of Fulshear 100.00%
Total Direct and Overlapping Net Debt 365,954,884$
Ratio of total direct and overlapping
net debt to assessed valuation (1) 34.74%
Direct and overlapping net debt per capita (2) 32,751$
(1) See the Schedule of Assessed Value and Estimated Actual Value of Taxable Property for valuation data.
(2) See the Schedule of Demographic and Economic Statistics for population data.
Source: Texas Municipal Advisory Council
Note: Overlapping governments are those that coincide, at least in part, with geographic boundaries of the
City. This schedule estimates the portion of the outstanding debt of those overlapping governments
that is borne by the property taxpayers of the City. This process recognizes that, when considering the
government's ability to issue and repay long-term debt, the entire debt burden borne by the property
taxpayers should be taken into account. However, this does not imply that every taxpayer is a
resident, and therefore responsible for repaying the debt, of each overlapping government.

81
CITY OF FULSHEAR, TEXAS Table 11
DEMOGRAPHIC AND ECONOMIC STATISTICS
Last Ten Fiscal Years
Fiscal
Year
Population
(1)
Personal
Income (2)
Per Capita
Personal
Income (3)
Median
Age (4)
Education
Level in Years
of Formal
Schooling (5)
School
Enrollment
(5)
Unemployment
Rate (6)
2009 968 N/A N/A 33.00 14 N/A 9.7%
2010 1,134 N/A N/A 40.00 14 N/A 9.1%
2011 1,177 N/A N/A 41.00 14 N/A 8.5%
2012 1,886 N/A N/A 39.00 14 N/A 7.8%
2013 2,948 N/A 56,203 36.00 14 N/A 6.6%
2014 4,287 N/A 56,203 36.00 14 N/A 5.7%
2015 5,849 N/A 56,203 35.00 14 N/A 5.0%
2016 7,914 N/A 56,203 34.00 14 N/A 4.7%
2017 10,044 N/A 56,203 34.00 14 N/A 4.1%
2018 11,174 N/A 56,203 34.00 14 7,139 3.9%
Data Sources:
(1) United States Census Bureau, Public Data
(2) Data to compute not available
(3) United States Census Bureau
(4) United States Census Bureau, American Fact Finder (some data not available)
(5) Katy Independent School District & Lamar Consolidated ISD
(6) Texas Workforce Commission (Data for Fort Bend County)
Note: Personal income information is a total for the year. Unemployment rate information is an adjusted
yearly average. School enrollment is based on the census at the start of the school year.

82
(This page intentionally left blank.)

83
CITY OF FULSHEAR, TEXAS Table 12
PRINCIPAL EMPLOYERS
Current Year and Nine Years Ago
Employer Employees Rank Employees Rank
Lamar Consolidated ISD 368 1 N/A
HEB #65 325 2 N/A
Katy ISD 201 3 N/A
City of Fulshear 56 4 N/A
Civil Corp 20 5 N/A
Moore Control 6 N/A
Total 970
Source: Personnel department of each employer above
2018 2009

84
CITY OF FULSHEAR, TEXAS
FULL-TIME EQUIVALENT CITY GOVERNMENT EMPLOYEES BY FUNCTION
Last Ten Fiscal Years
Function 2009 2010 2011 2012 2013
General government
Administrative 1 1 4
Municipal Court 1 1 1 1 1
City secretary 1 1 1 1 1
Finance 1 1 1 1 1
Utilities/Customer Service
Economic Development
Police 8 10 12 14 15
Planning & Development
Building Inspection 4 4 4 4 6
Code Enforcement
Public Works 1 1 1 1 2
Total 16 18 21 23 30
(1) City council are not full-time paid employees
Source: City finance department
Note: Fire service provided by Emergency Medical District

85
Table 13
2014 2015 2016 2017 2018
4 4 5 5 7
1 1 2 2 2
1 2 2 2 2
1 3 2 2.5 3
1 1 2 2.5 2.5
1 1 2 2 2
16 17 18 22 23.5
1 1 1 1 1
6 6 6 7 9
1 1 1 1
2 2 3 3 3
34 39 44 50 56

86
CITY OF FULSHEAR, TEXAS
OPERATING INDICATORS BY FUNCTION
Last Ten Fiscal Years
Function 2009 2010 2011 2012 2013
Police
Physical arrests 27 68 116
Parking violations 1
Traffic violations 2,457 3,448 3,454
Highways and streets
Street resurfacing (miles) 4 1
Potholes repaired 8 8 6 6 6
Water
New connections 92 197 263
Water main breaks 1 3
Average daily consumption 631 656
(thousands of gallons)
Sewer
Average daily sewage treatment 182 212
(thousands of gallons)
Source: Various City departments
Note: Some Indicators are not available for the general government function

87
Table 14
2014 2015 2016 2017 2018
172 449 273 403 381
1 1 22 5 6
5,624 5,633 6,069 9,300 9,708
0.8
6 5 7 4 10
381 479 569 688
5 7 2 2 4
895 904 1,046 1,224 1,328
247 329 416 548 789

88
CITY OF FULSHEAR, TEXAS
CAPITAL ASSETS STATISTICS BY FUNCTION
Last Ten Fiscal Years
Function 2009 2010 2011 2012
Public safety
Police
Stations
Patrol units 2 2 3 4
Fire
Fire stations
Volunteers
Highways and streets
Streets (miles) 70 75 75 80
Streetlights
Culture and recreation
Parks acreage 5 5
Water
Water wells 3 3 3 3
Water mains (miles) 33.9 34.3 35.4 40.2
Fire hydrants 441 446 455 520
Maximum daily capacity
(thousands of gallons) 655 655 655 655
Sewer
Sanitary sewers (miles) 32.2 32.6 33.6 36.4
Storm sewers (miles) 20.5 21.1 22.2 25.3
Maximum daily treatment capacity
(thousands of gallons) 500 500 750 750
Source: Various City departments
Note: No capital asset indicators are available for the general government function

89
Table 15
2013 2014 2015 2016 2017 2018
1 1 1 1
4 4 7 10 12 12
80 80 80 89 89 89
146 146
5 5 5 25 25 25
4 4 4 4 4 4
42.9 45.3 48.2 49.2 49.2 49.2
558 588 626 641 641 641
1075 1075 1075 1745 1745 1745
38.8 40.7 42.8 45.1 45.1 45.1
27 29.3 31.2 33.5 33.5 33.5
2100 2100 2100 2100 2100 2100