Embed Size (px)
Citation preview

COMPREHENSIVE ANNUAL FINANCIAL REPORT
West Virginia Parkways Authority (A Component Unit of the State of West Virginia)
Fiscal Years Ended June 30, 2017 and 2016

WEST VIRGINIA PARKWAYS AUTHORITY (a Component Unit of the State of West Virginia)
Comprehensive Annual Financial Report
Fiscal Years Ended June 30, 2017 and 2016
Prepared by: Director of Finance, West Virginia Parkways Authority

West Virginia Parkways Authority
Comprehensive Annual Financial Report
Fiscal Years Ended June 30, 2017 and 2016
Table of Contents INTRODUCTORY SECTION List of Authority Members, Administrative Staff, and Professional Consultants .....................1 Organization Chart .....................................................................................................................2 Letter of Transmittal to General Manager and Authority Members ..........................................3 Certificate of Achievement for Excellence in Financial Reporting .........................................11 FINANCIAL SECTION Independent Auditor’s Report ..................................................................................................13 Management’s Discussion and Analysis .................................................................................15 Statements of Net Position .......................................................................................................21 Statements of Revenues, Expenses, and Changes in Net Position ..........................................22 Statements of Cash Flows ........................................................................................................23 Notes to the Financial Statements, an Integral Part of the Basic Financial Statements ...........24 Required Supplementary Information Schedule of Proportionate Share of the Net Pension Liability ..........................................48 Schedule of Pension Contributions ....................................................................................49 Note to Required Supplementary Information ...................................................................50 STATISTICAL SECTION Condensed Schedules of Net Position .....................................................................................53 Condensed Schedules of Revenues, Expenses, and Changes in Net Position .........................54 Financial Ratios .......................................................................................................................55 Revenue Bond Coverage ..........................................................................................................56 Traffic Statistics .......................................................................................................................57 Number of Employees/Traffic Accident and Policing Statistics .............................................58 Population Demographics ........................................................................................................59 Significant Dates ......................................................................................................................60 Miscellaneous Data and Statistics ............................................................................................63 Toll Rates and Vehicle Classifications ....................................................................................64 Map of West Virginia Turnpike ...............................................................................................65

Introductory Section
West Virginia Parkways Authority

West Virginia Parkways Authority
List of Authority Members, Administrative Staff, and Professional Consultants
Authority Members Date
Appointed Term
Expires (2)
Chairman The Honorable James C. Justice, II Governor, State of West Virginia January 16, 2017 (1)
Governor’s Chairman Designee Ann V. Urling September 28, 2017 (1) Secretary of Transportation Thomas J. Smith January 14, 2017 (1) Vice Chairman, At Large
Member Mike Vinciguerra, Jr. June 2, 2006 June 30, 2021 Secretary, 1st Congressional
District Tom Mainella July 10, 2010 June 30, 2020 3rd Congressional District William Seaver, IV July 9, 2007 June 30, 2020 3rd Congressional District Douglas M. Epling January 29, 2009 June 30, 2022 1st Congressional District William Cipriani May 10, 2013 June 30, 2019 2nd Congressional District Troy N. Giatras January 12, 2017 June 30, 2019 2nd Congressional District Alisha G. Maddox July 1, 2017 June 30, 2021 Administrative Staff General Manager Gregory C. Barr Executive Assistant Robin Shamblin General Counsel A. David Abrams, Jr. Director of Finance Parrish T. French Chief Engineer Ronald B. Hamilton Director of Maintenance James F. Meadows Director of Tolls Douglas E. Ratcliff Director of Customer Service D. Wayne Webb Director of Purchasing Margaret Vickers Director of Operations and
Training Tyrone C. Gore Director of Human Resources Sherry Lilly Officer in Charge of State Police Captain T. L. Bragg Executive Director – Tamarack Jim Browder Professional Consultants Trustee United Bank, Inc., Charleston, West Virginia Independent Auditor Suttle & Stalnaker, PLLC, Charleston, West Virginia General Counsel Abrams & Byron, Beckley, West Virginia
Bond Counsel Bowles Rice, LLP Charleston, West Virginia Spilman, Thomas & Battle, Charleston, West Virginia
Consulting Engineers HNTB Corporation, Scott Depot, West Virginia Traffic Engineers CDM Smith, New Haven, Connecticut Financial Advisor Public Resources Advisory Group, New York, New York Investment Advisor BB&T Scott & Stringfellow (1) Under the provisions of the Act which created the Authority, the Governor or his designee serves as Authority
Chairman and the Secretary of Transportation is also a member. (2) Public members may continue to serve until a successor has been appointed and has qualified.
1

West Virginia Parkways AuthorityOrganization Chart
West Virginia Parkways Authority Members
General ManagerExecutive Secretary
BondholdersIndependent
Auditors
General Counsel
Trustee
Consulting Engineers
Toll Systems Consultant
Traffic Engineers
TreasurerDirector of Finance
Director of Toll
Director of Human Resources
Director of Customer Service
Director of Purchasing
Officer in Charge of State Police
General Manager Tamarack
Director of Operations and
Training
FinancialAdvisor
Investment Manager
Director of Maintenace
2

December 22, 2017 The Honorable James C. Justice, II, Governor and The Honorable Members of the West Virginia Parkways Authority The Comprehensive Annual Financial Report (CAFR) of the West Virginia Parkways Authority (the Authority) for the fiscal years ended June 30, 2017 and 2016, is hereby submitted. Responsibility for both the accuracy of the data, and the completeness and fairness of the financial presentation, including all disclosures, rests with the Authority. To the best of our knowledge and belief, the accompanying data are accurate in all material respects and are reported in a manner designed to present fairly the financial position, changes in financial position, and cash flows of the Authority. All disclosures necessary to enable the reader to gain an understanding of the Authority’s financial activities have been included. Management’s Discussion and Analysis (MD&A) immediately follows the independent auditor’s report and provides a narrative overview and analysis of the basic financial statements. The MD&A complements this letter of transmittal and should be read in conjunction with it. The accompanying financial statements include only the accounts and transactions of the Authority. The Authority has no component units. However, the Authority is considered a component unit of the State of West Virginia (the State) and the West Virginia Department of Transportation (the Department) and its financial statements are discretely presented in the comprehensive annual financial report of the State. ORGANIZATION AND BACKGROUND The Authority was formed as successor-in-interest to the West Virginia Turnpike Commission (the Turnpike Commission) which had been created by the West Virginia Legislature in l947. Because of highway funding limitations, the legislation authorized the construction of highways through the issuance of revenue bonds, with the bonds to be retired through the collection of tolls. The highway was envisioned to become part of a major highway network extending from Michigan to Florida. For the first stage of development, a route was identified from Charleston to Princeton that would lessen by only 22 miles the original mileage between the two cities, but would reduce the estimated driving time from four to two hours. Due to financial constraints, the project plans were revised to build only a two-lane expressway with right turn only interchanges and no crossing lines of traffic.
3

The West Virginia Turnpike (Turnpike) opened in 1954, and in 1958 it was incorporated into the nationwide Interstate and Defense Highway System. The Federal Highway Act of 1968 included a provision permitting interstate funding to be used for the reconstruction of the Turnpike. Beginning in 1970 and concluding September 2, 1987, the Turnpike was upgraded to meet four-lane interstate design standards. Financing was accomplished through the use of Federal highway funds on a 90% Federal/10% state-matching basis. The Authority repaid the Department for the matching funds with the last payment made in June, 1994. These repaid funds were used by the Department for highway projects located within 75 miles of the Turnpike. The Turnpike System The West Virginia Turnpike consists of 88 miles of limited access highway, which are an integral part of the U.S. Interstate Highway System. It carries the designations of Interstate 77 (I-77) for its entire length and Interstate 64 (I-64) from Charleston to Beckley. I-77 is a north-south interstate route connecting Cleveland, Ohio to Columbia, South Carolina. I-64 is an east-west route connecting St. Louis, Missouri to Virginia Beach, Virginia. From its beginning, the Turnpike has been an important route for commercial truck traffic serving the northeast and upper Midwest industrial areas to industrial areas and population centers of the South. Today, heavy truck traffic accounts for over 20% of total transactions and approximately 50% of toll revenues. The Turnpike is also important to summer and holiday travelers. Average daily passenger car traffic increases by approximately 28% during the summer travel months of June, July and August. Studies have indicated approximately 76% of toll revenues are collected from out-of-state vehicles. Turnpike operations are financed almost entirely by Turnpike toll revenues. Toll revenues must pay for operating and routine maintenance expenses, debt service, renewal and replacement requirements and deferred maintenance and capital needs. The Turnpike does not regularly receive any other State or Federal funds to assist with maintenance or operations. The Turnpike uses a toll barrier system with three mainline toll plazas strategically located between Charleston and Princeton. There are 18 entrance-exit ramps from the Turnpike serving local traffic. All ramps are toll-free except for the U.S. Rte. 19 interchange north of Beckley where there is a toll barrier facility. The Authority is a member of the E-ZPass® Group which develops guidelines for and facilitates the electronic collection of tolls among at least 27 toll agencies from 16 states in the Eastern and Midwest portions of the U.S. The E-ZPass program is the largest, most successful interoperable toll collection program anywhere in the world, servicing more than 32 million customers and processing more than 3 billion electronic toll transactions in 2016. The West Virginia Turnpike processes 38.8% of toll transactions and collects 45.7% of toll revenue with the E-ZPass® system.
4

Reorganization In 2010, the Authority’s enabling legislation was amended to rename and reorganize the organization as the West Virginia Parkways Authority. The structure of the Authority's governance board was expanded to nine members and includes two members from each of the State's three congressional districts, one at-large member, the Secretary of Transportation and the Governor or his designee, as Chairman. Members are appointed to five year terms. Governor’s Road To Prosperity On June 22, 2017, West Virginia Governor Jim Justice signed Senate Bill 1003 (S.B. 1003) into law, creating a “public-public” partnership between the Authority and the West Virginia Department of Transportation. Effective June 16, 2017, S.B. 1003 authorizes the Authority to continue collecting tolls on the Turnpike, to deposit proceeds from the issuance of Parkways Revenue Bonds to the newly created special State Road Construction Account and requires the Authority to implement the West Virginia Parkways Authority Single Fee program allowing non-commercial purchasers of West Virginia E-ZPass transponders to have unlimited passage on toll roads within the State for an annual flat fee once the Authority increases any of its currently existing tolling rates. S.B. 1003 is part of a series of measures collectively referred to as the Governor’s Roads to Prosperity Highway Program envisioned as a centerpiece of economic recovery for West Virginia. The program includes measures for the State to fund over $2.6 billion in transportation infrastructure projects by issuing Parkways, General Obligation and GARVEE Bonds and by revising Private-Public Partnership and Design Build Project legislation. The Authority is expected to issue toll revenue bonds to fund in total approximately $500 million in transportation projects to be issued in multiple series over the next three years. For its first issuance, the Authority in conjunction with the West Virginia Division of Highways seeks to construct various projects including a portion of the King Coal Highway, West Virginia Route 10 improvements and other major bridge rehabilitation and reconstruction projects. S.B. 1003 includes various provisions that govern the amounts and processes the Authority must follow in order to continue to charge tolls and the amount of revenues for which the tolls must generate. Specifically, the provisions require the Authority to implement a Single Fee Program in order to continue and/or raise tolls on the Turnpike beyond 2019. The Single Fee Program is intended to enable the Authority to allow purchasers of West Virginia E-ZPass transponders to have unlimited passage on toll roads within the State for an annual flat fee. The flat fee shall be set by the Authority (with certain limitations including, but not limited to, a cap at $25 per year) at a rate or amount so that the aggregate of all toll revenues estimated to be received by the Authority at the time of fixing any such rate or amount, or any increase thereof, provides sufficient toll revenues to pay debt service, fund necessary reserves and to cover the administrative costs of the Single Fee Program.
5

The Single Fee Program only applies to passenger motor vehicles, not commercial vehicles, and would entitle purchasers of a West Virginia E-ZPass transponder to traverse all toll roads within the State of West Virginia without stopping to pay individual tolls for one year from the time of payment of the annual flat fee. The Single Fee Program will be made available to any purchaser of a West Virginia E-ZPass transponder, whether such purchaser is a resident of West Virginia or any other state. Highway and Bridge Rehabilitation Projects Effective August 1, 2009 the Authority adopted a revised toll rate schedule, its first rate increase in over 28 years. As a result, the Authority has substantially increased the breadth and scope of its rehabilitation and repair projects on the Turnpike including full depth concrete repairs and undersealing, asphalt pavement overlay, bridge deck overlay, bridge and facilities retrofit work, guardrails, median barriers, retaining walls, buildings, toll plazas, culverts and drainage pipes, and signs and pavement markings. In accordance with a 10-year capital plan developed with the consulting engineer, the increased toll revenues will be used to alleviate an estimated $335 million in essential deferred maintenance and capital needs backlog, including $242 million for paving. Beginning in 2010, improvements in pavement ride quality on some sections of the Turnpike became apparent. While approximately 40% of pavements were condition assessed as good or very good in 2010, by May, 2017 the goal of having 80% of pavements condition assessed as good or very good had been attained. Major construction projects in 2017 included the continuation of asphalt overlay and paving on the northern portion of the Turnpike. Following Memorial Day, most work is performed at night, Monday through Thursday from 6:00 p.m. to 6:00 a.m., in order to keep traffic delays at a minimum. Bridge deck replacement using accelerated bridge construction (ABC) method In 2015, the Parkways Authority awarded a contract for the Turnpike’s first bridge deck replacement on the Turnpike. It was the first use of the Accelerated Bridge Construction (ABC) method of replacing bridge decks in the State of West Virginia and it had a minimal impact on traffic. The contractor was given less than two weeks to complete the project from the time of the first lane closure until all lanes were open to traffic. This is in contrast to a 6-8 month construction period for a traditional method bridge deck replacement. The project replaced a 220 foot, two-lane bridge deck and was completed in May 2016. Accelerated Bridge Construction is a method in which the decks are brought in as pre-cast units and provides better quality control as the units are made in a casting plant. Once the casts are brought in, the old deck is replaced and the new deck is put into place with a crane and locked in place. Two bridges were replaced similarly in 2017. There are 116 bridges on the West Virginia Turnpike and this was the first bridge deck replacement since the Turnpike’s upgrade was completed in 1987. The Authority began a program to rout and seal deck cracks in the late 1980’s with a two-part epoxy which continues to this day. Starting in 2006, 36 bridge decks have been overlaid with a thin epoxy/aggregate combination for water sealing benefits and traction improvement. Since 2010, water based sealers have been applied to approximately 40 decks. Up to nine tons of salt are applied to some bridges each year. Over the next 30 years, at least 80% of bridge decks will need to be replaced at an estimated annual cost of $22 million.
6

Routine Maintenance In addition to snow removal and ice control, road and bridge maintenance crews perform activities associated with all aspects of highway maintenance including: pavements, drainage, signage and other traffic control devices, bridge repairs, bench cleaning, vegetation control and litter pickup. Utilizing the Maintenance Management System (MMS), the Maintenance Division prepares periodic condition ratings on maintenance performance areas. Actual conditions are compared to established performance targets to assess the effectiveness of the maintenance program. The Division found that asphalt pavement conditions continued to exceed targets due to the pavement rehabilitation and preservation program as a result of the toll rate increase and the Division’s aggressive crack sealing program. The Authority continued its focus on preventive bridge maintenance including protective deck overlays which provides skid resistant surfaces and helps seal the bridge deck from salt intrusion and sizable spot painting contracts which help to preserve the steel structures. Traffic Management and Safety The Turnpike is patrolled by an up to 31 member group designated as Troop 7 of the West Virginia State Police who are responsible for traffic safety management and drug interdiction. With its 24-hour patrol, the State Police are dedicated to making the road safer by monitoring compliance with posted speed limits, assisting disabled motorists, detecting impaired drivers, and apprehending drug traffickers. Troop 7's efforts are strengthened by two Public Service Commission (PSC) officers whose focus is inspection and enforcement of commercial vehicle safety and operating regulations. The Authority provides roadside assistance to Turnpike travelers with disabled vehicles. In winter, snow and ice removal is a top priority and major concern of the Maintenance Department. The Authority's annual operating budget includes funds necessary to adequately maintain safe highways during the winter storm season. Speed monitoring awareness radar trailers are employed to remind motorists of their speed. Rumble strips and eight inch edge lines are utilized to enhance the travel lane for the safety of motorists. Travel Plazas and Tourist Information Centers The Authority has contracted with two private companies to operate restaurants and service stations at three travel plazas on the Turnpike. The facilities provide convenient service to Turnpike travelers and also serve as tourist information centers. On May 31, 2013, a trucker’s shower facility opened at the Beckley Travel Plaza. Tickets for the showers are being sold at the shower facility and by Petroleum Marketers, Inc., the fuel service provider. Attendants provide towels and other amenities to customers, and are available every day from 6:00 A.M. to 10:00 P.M.
7

Two other rest areas are accessible to southbound motorists. The rest area at mile 69 provides restrooms, snacks and sandwiches, and vending machines while the rest area at mile 18 has no facilities, but provides a scenic view. A new facility at the rest area at mile marker 69 was completed during 2017. The old structure was in dire need of replacement. The new facility offers Turnpike customers a modern, state of the art rest area with additional car parking and an upgraded snack shop. The Authority also operates the West Virginia Welcome Center, located near milepost 9, Princeton, WV, which contains restrooms, vending machines and tourist information. Retail shops featuring The Best of West Virginia handmade crafts, art and specialty foods are also located at the travel plazas and the Welcome Center. Long-Range Financial Planning The Authority is required by its Trust Indenture to prepare an annual budget prior to the start of each fiscal year. The adopted budget is used for control of operating and renewal and replacement expenditures and for financial planning. The budget is approved by the Authority, but does not require the approval of the State legislature. Additionally, the consulting engineer assists and presents the Authority each year with an updated needs assessment and five year plan. Economic Development and Tourism In 1989, the Authority became responsible for the promotion and enhancement of the State tourism industry and to assist in economic and tourism development opportunities. The Authority designated revenues from restaurants and service stations to be used for this new responsibility. No toll revenues were used for economic development and tourism projects. During the April 12, 2007 Authority board meeting, a resolution was passed to refocus the Authority's core and principal mission to operating and maintaining the Turnpike as a modern, efficient and safe roadway. All economic development and tourism projects, except Tamarack-the Best of West Virginia, have been eliminated. Legislation approved in 2010 further restricted the Authority from future involvement in any other economic development projects. Accounting Policies and Internal Controls The Authority's accounting policies are briefly described in Note 2 of the financial statements. Management of the Authority is responsible for establishing and maintaining internal controls designed to ensure that the assets of the Authority are protected from loss, theft, or misuse and to ensure that adequate accounting data are compiled to allow for the preparation of financial statements in conformity with accounting principles generally accepted in the United States of America. Internal controls are designed to provide reasonable, but not absolute, assurance that these objectives are met. The concept of reasonable assurance recognizes that: (1) the cost of a control should not exceed the benefits likely to be derived; and (2) the valuation of costs and benefits requires estimates and judgments by management.
8

In June 2012, the Authority voted to participate in the State of West Virginia’s Enterprise Resource Planning (ERP) project as an agency of the Department of Transportation. In 2014, the Authority began the transition to the State’s new ERP System. The State calls this project wvOASIS and it is a comprehensive suite of commercially available integrated modules that provide end-to-end support for statewide administrative functions. ERP includes personnel, payroll, procurement, accounts payable, accounting and project management. The Authority began using the new system on July 8, 2014 for financial and procurement purposes. Also, the new wvOASIS system is designed to provide for integration of Purchasing Card (“P-Card”) use to enhance the efficiencies of purchasing and reduce the number of disbursements as well as on-line reconciliation of monthly usage by P-Card holders. All purchasing policies, including bidding and approvals for different levels of purchasing authority, will still apply. The Authority participated in “Wave 2” implementation of the human resources and payroll modules which occurred during 2016. Tri-Party Agreement of 1988 and Trust Indentures In 1971, the Turnpike Commission, the Federal Highway Administration (FHWA), and the Department, adopted an agreement necessary for the Department to participate in the reconstruction of the Turnpike. This document charged the Turnpike Commission with the responsibility for all maintenance of the improved facility utilizing toll revenues. The 1971 agreement was superseded and replaced in 1988. The 1988 agreement specifies (a) that tolls collected be used only on the Turnpike for construction and reconstruction costs, and for costs necessary for operations, maintenance, payment and refinancing of debt service including resurfacing, reconstruction, rehabilitation and restoration; (b) that any bonds issued or any costs incurred will not cause tolls to be increased to an unreasonable amount, and that prior to issuing any bonds the Authority will notify the Department and FHWA of the total amount to be issued and the specific amounts and purposes for which proceeds of such bonds are to be used; and (c) that all records are subject to audit by the Department and/or FHWA. Operations of the Authority are also controlled by the provisions of a Trust Indenture, dated February 15, 1993, as supplemented. The indenture requires, among other things, the establishment and maintenance of various accounts, which are restricted to use for construction, renewal and replacement, operations and debt service. The Authority's Trustee works closely with staff to ensure the Authority is in compliance with the terms and covenants of the Bond Indenture and that all financial and operational decisions are made in the best interest of the Authority's bondholders. AWARDS AND ACKNOWLEDGEMENTS Independent Audit The trust indentures also require an annual audit by independent certified public accountants. The accounting firm of Suttle & Stalnaker, PLLC was engaged by the Authority to perform the audit for the fiscal years ended June 30, 2017 and 2016.
9

Awards The Government Finance Officers Association of the United States and Canada (GFOA) awarded a Certificate of Achievement for Excellence in Financial Reporting to the Authority for its comprehensive annual financial report for each of the 27 years through the period ended June 30, 2016, including the first year of operations of the Authority. In order to be awarded a Certificate of Achievement, a governmental unit must publish an easily readable and efficiently organized comprehensive annual financial report, the contents of which conform to program standards. Such reports must satisfy both generally accepted accounting principles and applicable legal requirements. A Certificate of Achievement is valid for a period of one year only. We believe that our current report continues to meet the Certificate of Achievement Program's requirements and we are submitting it to the GFOA to determine its eligibility for another certificate. Acknowledgements The preparation of this comprehensive annual financial report on a timely basis was made possible with the assistance of the Authority's administrative and accounting staff, the consulting engineers, the independent auditor, and the leadership and support of the Members of the West Virginia Parkways Authority. We express our sincere appreciation for the professional contributions made by these individuals in the preparation of this report.
Respectfully submitted, Gregory C. Barr, General Manager Parrish T. French, Director of Finance
10

11

Financial Section
West Virginia Parkways Authority
12

The Virginia Center 1411 Virginia Street, East Suite 100 Charleston, WV 25301 Phone (304) 343-4126 or 1(800) 788-3844 Fax (304) 343-8008
Wharf District 68 Clay Street Suite C Morgantown, WV 26501 Phone (304) 554-3371 Fax (304) 554-3410
Towne Square 201 Third Street PO Box 149 Parkersburg, WV 26102 Phone (304) 485-6584 Fax (304) 485-0971
www.suttlecpas.com E-mail: [email protected] A Professional Limited Liability Company
INDEPENDENT AUDITOR’S REPORT To the Members of the West Virginia Parkways Authority Charleston, West Virginia Report on the Financial Statements We have audited the accompanying financial statements of the West Virginia Parkways Authority (the Authority), a component unit of the State of West Virginia, as of and for the years ended June 30, 2017 and 2016, and the related notes to the financial statements, which collectively comprise the Authority’s basic financial statements as listed in the table of contents. Management’s Responsibility for the Financial Statements Management is responsible for the preparation and fair presentation of these financial statements in accordance with accounting principles generally accepted in the United States of America; this includes the design, implementation, and maintenance of internal control relevant to the preparation and fair presentation of financial statements that are free from material misstatement, whether due to fraud or error. Auditor’s Responsibility Our responsibility is to express opinions on these financial statements based on our audits. We conducted our audits in accordance with auditing standards generally accepted in the United States of America. Those standards require that we plan and perform the audits to obtain reasonable assurance about whether the financial statements are free from material misstatement. An audit involves performing procedures to obtain audit evidence about the amounts and disclosures in the financial statements. The procedures selected depend on the auditor’s judgment, including the assessment of the risks of material misstatement of the financial statements, whether due to fraud or error. In making those risk assessments, the auditor considers internal control relevant to the entity’s preparation and fair presentation of the financial statements in order to design audit procedures that are appropriate in the circumstances, but not for the purpose of expressing an opinion on the effectiveness of the entity’s internal control. Accordingly, we express no such opinion. An audit also includes evaluating the appropriateness of accounting policies used and the reasonableness of significant accounting estimates made by management, as well as evaluating the overall presentation of the financial statements. We believe that the audit evidence we have obtained is sufficient and appropriate to provide a basis for our audit opinions.
13

Opinions In our opinion, the financial statements referred to above present fairly, in all material respects, the financial position of the Authority as of June 30, 2017 and 2016, and the respective changes in financial position and cash flows thereof for the years then ended in conformity with accounting principles generally accepted in the United States of America. Other Matters Required Supplementary Information Accounting principles generally accepted in the United States of America require that the management’s discussion and analysis on pages 15 through 20, the schedule of proportionate share of the net pension liability, and schedule of pension contributions, and related note on pages 48 through 50 be presented to supplement the basic financial statements. Such information, although not a part of the basic financial statements, is required by the Governmental Accounting Standards Board, who considers it to be an essential part of financial reporting for placing the basic financial statements in an appropriate operational, economic, or historical context. We have applied certain limited procedures to the required supplementary information in accordance with auditing standards generally accepted in the United States of America, which consisted of inquiries of management about the methods of preparing the information and comparing the information for consistency with management’s responses to our inquiries, the basic financial statements, and other knowledge we obtained during our audit of the basic financial statements. We do not express an opinion or provide any assurance on the information because the limited procedures do not provide us with sufficient evidence to express an opinion or provide any assurance. Other Information Our audit was conducted for the purpose of forming an opinion on the financial statements that collectively comprise the Authority’s basic financial statements. The introductory section and statistical section are presented for purposes of additional analysis and is not a required part of the basic financial statements. The introductory section and statistical section have not been subjected to the auditing procedures applied in the audit of the basic financial statements and, accordingly, we do not express an opinion or provide any assurance on them.
Charleston, West Virginia October 2, 2017
14
WEST VIRGINIA PARKWAYS AUTHORITY (A Component Unit of the State of West Virginia)
Management’s Discussion and Analysis (Unaudited) Years Ended June 30, 2017 and 2016
The management of the West Virginia Parkways Authority (hereinafter referred to as the Authority) offers this narrative overview and analysis of the Authority’s financial activities for the year ended June 30, 2017 which should be read in conjunction with the Authority’s basic financial statements. FINANCIAL HIGHLIGHTS The total number of transactions on the West Virginia Turnpike during fiscal year 2017 increased
1.1% from fiscal year 2016. Total net toll revenues including an increase in the utilization of available discount programs and results of toll enforcement collections programs resulted in a decrease in toll revenue of approximately $840 thousand or 0.9%.
In conjunction with the adoption of the new toll rate schedule in August 2009, the Authority
implemented a ten-year program to address the then approximately $335 million backlog of essential deferred maintenance and capital needs identified with the Authority’s consulting engineers. In addition to the increased activity of the Authority’s own maintenance staff, the Authority has utilized over $249.6 million of capital towards roadway reconstruction, rehabilitation and repair and other capital expenditures since the rate increase. At June 30, 2017, the Authority had contractual commitments totaling approximately $28.7 million for various Turnpike System improvement projects.
Excluding depreciation, operating expenses decreased $835 thousand or 1.71% from 2016. Decreases in expenditures related to salt, damage claims and recoveries, guardrail replacement, and other maintenance expenses.
Basic Financial Statements The Authority accounts for its operations and financial transactions in a manner similar to that used by private business enterprises: the accrual basis of accounting. In these statements, revenue is recognized in the period in which it is earned, and an expense is recognized in the period in which it is incurred, regardless of the timing of its related cash flow. Overview of the Financial Statements This discussion and analysis are intended to serve as an introduction to the Authority’s basic financial statements. For each fiscal year, the Authority’s basic financial statements are comprised of the following:
Statements of Net Position
Statements of Revenues, Expenses and Changes in Net Position
Statements of Cash Flows
Notes to Financial Statements The Statements of Net Position present information on all of the Authority’s assets, deferred outflows of resources, liabilities, and deferred inflows of resources with the difference between the four reported as net position. Increases or decreases in net position, over time, may serve as a useful indicator of whether the financial position of the Authority is improving or deteriorating.
15

WEST VIRGINIA PARKWAYS AUTHORITY (A Component Unit of the State of West Virginia)
Management’s Discussion and Analysis (Unaudited) Years Ended June 30, 2017 and 2016
The Statements of Revenues, Expenses and Changes in Net Position present revenue and expense information and how the Authority’s net position changed during the fiscal year as a result of these transactions. The Statements of Cash Flows present sources and uses of cash for the fiscal year, displayed in the following categories: cash flows from operating activities, cash flows from capital and related financing activities, and cash flows from investing activities. The Notes provide additional information that is essential to a full understanding of the data provided in the basic financial statements. They are an integral part of the basic financial statements. FINANCIAL ANALYSIS Operating Revenue Toll revenues represent the major source of funding for the Authority. Passenger car traffic volume increased 0.8% and large commercial traffic volume increased by 2.4% during 2017. Passenger car toll revenues increased 0.4% and large commercial toll revenues increased by 1.5%. Total net toll revenues including an increase in the utilization of available discount programs and results of toll enforcement collections programs resulted in a decrease in toll revenue of approximately $840 thousand or 0.9%.
CHANGES IN NET POSITION INFORMATION (in Thousands)
Change 2017 2016 2015 ‘17-‘16
Revenues: Operating revenues: Toll revenues $ 92,739 $ 93,579 $ 88,697 (0.9)% Other revenues 7,370 7,404 6,797 (0.5)% Nonoperating revenues: Net investment revenue 280 336 338 (16.7)% Total revenues 100,389 101,319 95,832 (0.9)% Expenses: Operating expenses: Maintenance 24,546 24,791 25,488 (1.0)% Toll collection 9,857 9,566 9,273 3.0% Traffic enforcement and communications 3,231 3,172 3,912 1.9% General and administrative 10,308 11,248 9,093 (8.4)% Depreciation 37,318 36,929 35,357 1.1% Nonoperating expenses: Interest expense 2,210 2,631 2,784 (16.0)% Total expenses 87,470 88,337 85,907 1.0% Change in net position 12,919 12,982 9,925 (0.5)% Net position, beginning of year 488,099 475,117 472,883 2.7% Net effect of change in accounting policy - - (7,691) 0.0% Net position, beginning of year, as restated 488,099 475,117 465,192 2.7% Net position, end of year $ 501,018 $ 488,099 $ 475,117 2.6%
16

WEST VIRGINIA PARKWAYS AUTHORITY (A Component Unit of the State of West Virginia)
Management’s Discussion and Analysis (Unaudited) Years Ended June 30, 2017 and 2016
In early 2009, the Authority engaged its consulting engineer to study the Turnpike’s projected operating expenses, renewal and replacement requirements and essential deferred maintenance and capital needs. Factors prompting this decision included a combination of increasing costs and declining traffic and toll revenues exacerbated by the global economic recession, a growing backlog of essential deferred maintenance and capital needs and the potential for a technical default on the Turnpike Bonds. A technical default could have occurred if the Authority had adopted a fiscal year 2010 budget based on the old toll rate schedule and the debt service coverage requirement under its bond indentures had not been met. In April 2009, the consulting engineers recommended the Authority implement a ten-year program to address the backlog of essential deferred maintenance and capital needs estimated to cost $335 million. It was estimated that the Authority would need just over $20 million of additional revenue for fiscal year 2010 increasing each future fiscal year by approximately 4% per year for inflation and escalation. The additional toll revenue is anticipated to fully fund this program without the issuance of additional debt by the Authority. Concurrently, the Authority engaged its traffic engineer to study and report on recent transaction and revenue trends and to develop traffic and revenue forecasts under the previous toll rate schedule as well as under various levels of toll rates, and to make a recommendation as to the least increase in toll rates, combined with the largest discount for electronic toll customers, that is estimated to produce enough annual toll revenue to meet the ten year program as outlined by the consulting engineer. On July 1, 2009, the Authority adopted a new toll and discount rate schedule that became effective August 1, 2009. Cash toll rates were increased by approximately 60% from $1.25 to $2.00 per barrier for passenger cars and from $4.25 to $6.75 per barrier for 5-axle tractor-trailers. All other classes were increased proportionately. As required by State Code, discounts for all classes of vehicles paying by electronic transponders issued by the Parkways Authority were also adopted. For passenger cars, the discount for paying with an Authority issued E-ZPass® transponder is 35%. For commercial trucks, the discount for using any E-ZPass® is 13%, and for using an Authority issued E-ZPass® is 20%. Beginning in the fiscal year ended June 30, 2010, toll revenues exceeded projections allowing the Authority to proceed with the plan ahead of schedule. The Authority has utilized over $249.6 of capital towards roadway reconstruction, rehabilitation and repair and other capital expenditures since the rate increase. Operating Expenses For the year ended June 30, 2017, total operating expenses decreased 0.5% or $446 thousand. Depreciation expense increased $389 thousand due to the increasing amount of infrastructure projects being placed in service. Decreases in expenditures were related to salt, damage claims and recoveries, guardrail replacement and other maintenance expenses. For the year ended June 30, 2016, total operating expenses increased 3.1% or $2.6 million. Depreciation expense increased $1.6 million due to the increasing amount of infrastructure projects being placed in service. Additionally, there were increases in other expenditures related to salt, damage claims and recoveries, guardrail replacement, and other maintenance expenses.
17

WEST VIRGINIA PARKWAYS AUTHORITY (A Component Unit of the State of West Virginia)
Management’s Discussion and Analysis (Unaudited) Years Ended June 30, 2017 and 2016
Non-operating Revenue and Expense Interest expense decreased 16.0% in 2017 and 5.5% in 2016 due to the amortization of principal and stabilization of the Authority’s variable interest rate associated with the Series 2008 Toll Revenue Bonds. Net investment revenue has been reduced to historically low levels as a result of the low interest rates on low risk securities such as those held as investments by the Authority.
CONDENSED STATEMENTS OF NET POSITION INFORMATION (in Thousands)
ASSETS AND DEFERRED OUTFLOWS OF RESOURCES 2017 2016 2015
Change ‘17-‘16
Current assets $ 68,601 $ 61,088 $ 61,774 12.3% Long-term investments 27,806 25,603 22,989 8.6% Capital assets, net 451,041 453,833 458,292 (0.6)% Total assets 547,448 540,524 543,055 1.3% Deferred outflows 8,126 7,402 7,663 9.8% Total assets plus deferred outflows $ 555,574 $ 547,926 $ 550,718 1.4% LIABILITIES, DEFERRED INFLOWS OF RESOURCES, AND NET POSITION Current liabilities $ 21,367 $ 18,720 $ 24,704 14.1% Long-term revenue bonds 10,523 20,479 29,939 (48.6)% Other long-term liabilities 21,465 17,033 14,495 26.0% Total liabilities 53,355 56,232 69,138 (5.1)% Deferred inflows 1,201 3,595 6,463 (66.6)% Total liabilities plus deferred inflows 54,556 59,827 75,601 (8.8)% Net position: Net investment in capital assets 432,154 426,447 422,704 1.3% Restricted 65,834 58,626 51,094 12.3% Unrestricted 3,030 3,026 1,319 0.1% Total net position 501,018 488,099 475,117 2.6% Total liabilities, deferred inflows and
net position $ 555,574 $ 547,926 $ 550,718 1.4% Assets The Authority’s cash and investment balances increased by $10.8 million in the year ended June 30, 2017. For the years ended June 30, 2017 and 2016, ending cash balances remained relatively consistent. For the year ended June 30, 2017, net capital assets decreased $2.8 million with capital improvements of $34.5 million less depreciation expense of $37.3 million. For the year ended June 30, 2016, net capital assets decreased by $4.4 million as the result of capital improvements of $32.5 million offset by $36.9 million of depreciation expense.
18

WEST VIRGINIA PARKWAYS AUTHORITY (A Component Unit of the State of West Virginia)
Management’s Discussion and Analysis (Unaudited) Years Ended June 30, 2017 and 2016
Liabilities For the year ended June 30, 2017, total liabilities and deferred inflows of resources decreased $5.3 million. Current liabilities increased due to the timing of invoices related to infrastructure projects in progress. Regularly scheduled principal maturities contributed to the decrease in long-term debt. Other long-term liabilities increased due to an increase in the net pension liability. The Authority’s credit ratings are among the best for similar facilities worldwide. The current agency ratings are as follows:
Agency Rating Standard & Poor’s AA- Moody’s Investors Service Aa3
CAPITAL ASSETS The Authority’s capital assets consist of land, buildings, equipment and infrastructure. Infrastructure assets are typically items that are immovable such as highways and bridges. The Authority’s investment in capital assets at June 30, 2017 amounted to approximately $1.213 billion of gross asset value with accumulated depreciation of approximately $762 million, leaving a net book value of approximately $451 million. Capital assets represented 81.2% of the Authority’s total assets and deferred outflows of resources at June 30, 2017. Additional information on the Authority’s capital assets can be found in the Note 5 to the financial statements. LONG-TERM DEBT In 2002, the Authority issued $44.2 million in Revenue Refunding Bonds which are due in varying installments through May 2019. These Bonds were issued for the express purpose of defeasing $36.0 million of the Authority’s Series 1993 Bonds. In 2008, the Authority issued $59.1 million of Variable Rate Demand Revenue Refunding Bonds which are due in varying installments through May 2019. These Bonds were issued for the express purpose of refunding $59.1 million of the Authority’s Series 2003 Bonds. Additional information on the Authority’s long-term liabilities activity can be found in Notes 6, 7, and 8 to the financial statements. FACTORS IMPACTING FUTURE OPERATIONS On June 27, 2017 Senate Bill 1003 was enacted giving the Authority the ability to issue bonds for the purpose of funding infrastructure projects as defined in the statute. The legislation created a special revenue account known as the State Road Construction Account within the State Road Fund to be expended by the Division of Highways for construction, maintenance and repair of public highways and bridges in the state. The bill also included new authorizations, requirements and limitations on the Authority’s electronic toll collection programs and discounts to the published cash rates. An unlimited use single annual fee discount program for passenger cars utilizing an Authority issued EZPass transponder is required under these new provisions.
19

WEST VIRGINIA PARKWAYS AUTHORITY (A Component Unit of the State of West Virginia)
Management’s Discussion and Analysis (Unaudited) Years Ended June 30, 2017 and 2016
CONTACTING THE AUTHORITY’S FINANCIAL MANAGEMENT This financial report is designed to provide our bondholders, patrons, and other interested parties with a general overview of the Authority’s finances and to demonstrate the Authority’s accountability for the money it receives. If you have questions about this report or need additional financial information, contact the West Virginia Parkways Authority, Director of Finance, P. O. Box 1469, Charleston, West Virginia 25325-1469.
20

ASSETS AND DEFERRED OUTFLOWS OF RESOURCES 2017 2016Current assets:
Cash and cash equivalents 31,872$ 31,713$ Short-term investments 28,790 20,384 Accounts receivable 3,518 3,624 Accrued interest receivable 102 93 Inventory 3,780 3,891 Other 539 1,383
Total current assets 68,601 61,088
Noncurrent assets:Investments in securities maturing beyond one year 27,806 25,603 Capital assets, net 451,041 453,833
Total noncurrent assets 478,847 479,436
Total assets 547,448 540,524
Deferred outflows of resources:Deferred outflows related to pension 6,052 3,515 Fair value of hedging derivative instrument 633 1,484 Deferred bond refunding loss:
Series 2002 revenue bonds 588 959 Series 2008 revenue bonds 853 1,444
Total deferred outflows of resources 8,126 7,402
Total assets plus deferred outflows of resources 555,574$ 547,926$
LIABILITIES, DEFERRED INFLOWS OF RESOURCES AND NET POSITIONCurrent liabilities:
Accounts payable 5,023$ 2,648$ Accrued interest payable 115 166 Customer deposits 2,357 2,459 Other accrued liabilities 3,294 3,402 Current portion of compensated absences 773 735 Current portion of long-term revenue bonds 9,805 9,310
Total current liabilities 21,367 18,720
Noncurrent liabilities:Noncurrent portion of long-term revenue bonds, net of
unamortized premiums:Series 2002 revenue bonds 3,823 7,379 Series 2008 revenue bonds 6,700 13,100
10,523 20,479 Noncurrent portion of compensated absences 224 262 Net pension liability 10,007 5,848 Accrued post-employment benefits other than pensions 11,234 10,923
Total noncurrent liabilities 31,988 37,512
Total liabilities 53,355 56,232
Deferred inflows of resources:Fair value of hedging derivative instrument 633 1,484 Deferred inflows related to pension 568 2,111
Total deferred inflows of resources 1,201 3,595
Total liabilities plus deferred inflows of resources 54,556 59,827
Net position:
Net investment in capital assets 432,154 426,447
Restricted by trust indenture and tri-party agreement 65,834 58,626
Unrestricted 3,030 3,026
Total net position 501,018 488,099
Total liabilities, deferred inflows of resources and net position 555,574$ 547,926$
The accompanying notes are an integral part of these financial statements.
(A Component Unit of the State of West Virginia)
WEST VIRGINIA PARKWAYS AUTHORITY
(In Thousands)June 30, 2017 and 2016
STATEMENTS OF NET POSITION
21

2017 2016
Operating revenues:Toll revenues 92,739$ 93,579$ Other revenues 7,370 7,404
Total operating revenues 100,109 100,983
Operating expenses:Maintenance 24,546 24,791 Toll collection 9,857 9,566 Traffic enforcement and communications 3,231 3,172 General and administrative 10,308 11,248 Depreciation 37,318 36,929
Total operating expenses 85,260 85,706
Operating income 14,849 15,277
Nonoperating revenues (expenses):Interest expense (2,210) (2,631) Net investment revenue 280 336
Nonoperating revenues (expenses), net (1,930) (2,295)
Change in net position 12,919 12,982
Net position, beginning of year 488,099 475,117
Net position, end of year 501,018$ 488,099$
The accompanying notes are an integral part of these financial statements.
WEST VIRGINIA PARKWAYS AUTHORITY
(In Thousands)Years Ended June 30, 2017 and 2016
STATEMENTS OF REVENUES, EXPENSES, AND CHANGES IN NET POSITION
(A Component Unit of the State of West Virginia)
22

2017 2016
Cash flows from operating activities:
Cash received from customers and users 100,007$ 101,202$
Cash paid to employees (24,417) (25,476)
Cash paid to suppliers (21,971) (26,353)
Net cash provided by operating activities 53,619 49,373
Cash flows from capital and related financing activities:
Acquisition of property and equipment (32,420) (38,829)
Debt service for revenue bonds:
Principal (9,311) (8,994)
Interest (1,399) (1,839)
Net cash used in capital and related financing activities (43,130) (49,662)
Cash flows from investing activities:
Purchase of investments (45,351) (49,865)
Proceeds from sales and maturities of investments 34,741 45,605
Interest from investments 280 336
Net cash used in investing activities (10,330) (3,924)
Increase (decrease) in cash and cash equivalents 159 (4,213)
Cash and cash equivalents, beginning of year 31,713 35,926
Cash and cash equivalents, end of year 31,872$ 31,713$
Reconciliation of operating income to net cash provided
by operating activities:
Operating income 14,849$ 15,277$
Adjustments to reconcile operating income to net
cash provided by operating activities:
Depreciation 37,318 36,929
Change in assets and liabilities:
(Increase) decrease in accounts receivable 98 (809)
(Increase) decrease in inventory 111 (546)
(Increase) decrease in other current assets 844 (524)
(Increase) decrease in deferred outflows of resources (2,537) (1,462)
Increase (decrease) in accounts payable and other liabilities 8 43
Increase (decrease) in deferred inflows of resources (1,543) (2,088)
Increase (decrease) in net pension liability 4,159 1,923
Increase (decrease) in accrued post-employment benefits 312 630
Net cash provided by operating activities 53,619$ 49,373$
The accompanying notes are an integral part of these financial statements.
WEST VIRGINIA PARKWAYS AUTHORITY
(In Thousands)Years Ended June 30, 2017 and 2016
STATEMENTS OF CASH FLOWS
(A Component Unit of the State of West Virginia)
23

WEST VIRGINIA PARKWAYS AUTHORITY (A Component Unit of the State of West Virginia)
NOTES TO FINANCIAL STATEMENTS Years Ended June 30, 2017 and 2016
(In thousands)
NOTE 1 - FINANCIAL REPORTING ENTITY Pursuant to Senate Bill 427, the Authority’s legal name was changed to the West Virginia Parkways Authority effective July 1, 2010. The West Virginia Parkways Economic Development and Tourism Authority was created as the successor-in-interest to the West Virginia Turnpike Commission (the Turnpike Commission) by an Act (the Act) of the West Virginia Legislature effective June 1, 1989. All the duties, powers, and functions of the Turnpike Commission were transferred to the Authority. Under the Act, the Authority assumed all assets, property, obligations, indebtedness, and other liabilities of the Turnpike Commission and personnel of the Turnpike Commission were transferred to the employment of the Authority. The Authority has the power to enact and amend its operating budget, and receives no appropriations from the State of West Virginia (the State). The State’s Governor or his designee serves as chairman of the Authority and the State’s Secretary of Transportation serves as a board member. The other seven Authority members are appointed by the Governor with the approval of the Senate. As the State is able to impose its will over the Authority, the Authority is considered a component unit of the State and its financial statements are discretely presented in the comprehensive annual financial report of the State. In evaluating how to define the Authority for financial reporting purposes, management has considered all potential component units. The decision to include a potential component unit in the reporting entity is made by applying the criteria set forth in generally accepted accounting principles. Generally accepted accounting principles define component units as those entities which are legally separate governmental organizations for which the appointed members of the Authority are financially accountable, or other organizations for which the nature and significance of their relationship with the Authority are such that exclusion would cause the Authority’s financial statements to be misleading. Since no such organizations exist which meet the above criteria, the Authority has no component units. NOTE 2 - SIGNIFICANT ACCOUNTING POLICIES Basis of Accounting The Authority is accounted for as a government entity engaged in business-type activities. In accordance with Governmental Accounting Standards Board (GASB) Statement No. 34, Basic Financial Statements and Management’s Discussion and Analysis for State and Local Governments, and accounting principles generally accepted in the United States of America, the financial statements are prepared on the accrual basis of accounting, using the flow of economic resources measurement focus. Under this basis of accounting, revenues are recognized when earned and expenses are recognized when incurred. The Authority is included in the State’s basic financial statements as a business-type activity using the accrual basis of accounting. Because of the Authority’s business-type activities, there may be differences between the amounts reported in these financial statements and the basic financial statements of the State as a result of major fund determination. Cash Equivalents For purposes of the statement of cash flows, the Authority considers all highly liquid investment securities purchased with an original maturity of three months or less to be cash equivalents.
24

WEST VIRGINIA PARKWAYS AUTHORITY (A Component Unit of the State of West Virginia)
NOTES TO FINANCIAL STATEMENTS Years Ended June 30, 2017 and 2016
(In thousands)
NOTE 2 - SIGNIFICANT ACCOUNTING POLICIES (Continued) Investments Investments are reported at fair value as determined by published sources and realized and unrealized gains or losses are reported in the statements of revenues, expenses, and changes in net position as a component of investment income. Allowance for Doubtful Accounts It is the Authority’s policy to provide for future losses on uncollectible accounts based on an evaluation of the underlying accounts, the historical collectability experienced by the Authority on such balances and such other factors which, in the Authority’s judgment, require consideration in estimating doubtful accounts. As of June 30, 2017 and 2016, management believes that all accounts receivable will be collected; therefore, no allowance for doubtful accounts has been booked. Inventory Inventory is valued at the lower of cost (first-in, first-out method) or market. Capital Assets Capital assets, which include property, plant, equipment, and infrastructure assets (e.g. roads, bridges, and similar items), are reported at historical cost and include interest on funds borrowed to finance construction. Capital assets are defined by the Authority as assets with an initial, individual cost of more than $30,000 for Turnpike activities and $2,500 for economic development activities and an estimated useful life in excess of one year. Contributed infrastructure assets are stated at the Department of Highways cost basis, adjusted for depreciation occurring from the date the assets were placed in service through the date of transfer of such assets to the Authority. Depreciation is computed using the straight-line method over the following estimated economic useful lives of the assets; buildings (30 years); equipment (5-10 years); and infrastructure (10-50 years). Deferred Outflow of Resources A deferred outflow of resources is a consumption of net position by the government that is applicable to a future reporting period. Compensated Absences Employees fully vest in all earned but unused vacation and the Authority accrues for obligations that may arise in connection with compensated absences for vacation at the current rate of employee pay. To the extent that accumulated sick leave is expected to be converted to benefits on termination or retirement, the Authority participates in another post-employment benefit plan (see Note 7).
25

WEST VIRGINIA PARKWAYS AUTHORITY (A Component Unit of the State of West Virginia)
NOTES TO FINANCIAL STATEMENTS Years Ended June 30, 2017 and 2016
(In thousands)
NOTE 2 - SIGNIFICANT ACCOUNTING POLICIES (Continued) Pensions For purposes of measuring the net pension liability, deferred outflows of resources and deferred inflows of resources related to pensions, and pension expense, information about the fiduciary net position of the Public Employee Retirement System (PERS) and additions to/deductions from PERS's fiduciary net position have been determined on the same basis as they are reported by PERS. For this purpose, benefit payments (including refunds of employee contributions) are recognized when due and payable in accordance with the benefit terms. Investments are reported at fair value. Customer Deposits Customer deposits consist of prepaid deposits made by personal and commercial customers into E-ZPass® toll collection accounts held by the Authority. Bond Discounts, Premiums and Deferred Loss on Advance Refunding Bond discounts and premiums are being accreted and amortized over the varying terms of the bonds issued. The difference between the reacquisition price and the net carrying amount of refunded debt is reported in the financial statements as a deferred outflow of resources, with the related amortization of such deferral being charged to interest expense using the straight-line method. Net Position Net position represents assets, plus deferred outflows of resources, less liabilities, less deferred inflows of resources. Net investment in capital assets consists of all capital assets, plus deferred refunding loss on debt related to the acquisition, construction or improvement of those assets, less accumulated depreciation and any outstanding debt related to the acquisition, construction or improvement of those assets. Net position is restricted when there are legal limitations imposed on their use by legislation or external restrictions by other governments, creditors, or grantors. When an expense is incurred for purposes for which both restricted and unrestricted net position are available, restricted resources are applied first. Restricted net position consists of amounts restricted by trust indenture and the tri-party agreement that can only be used for maintenance and operation of the Turnpike and for debt service. Deferred Inflow of Resources A deferred inflow of resources is an acquisition of net position by the government that is applicable to a future reporting period. Operating Revenues and Expenses Operating revenues and expenses are those that result from providing services and producing and delivering goods. Revenues and expenses related to capital and related financing, non-capital financing, or investing activities are not included as operating revenues and expenses. Other items not meeting these definitions are reported as nonoperating revenues and expenses.
26

WEST VIRGINIA PARKWAYS AUTHORITY (A Component Unit of the State of West Virginia)
NOTES TO FINANCIAL STATEMENTS Years Ended June 30, 2017 and 2016
(In thousands)
NOTE 2 - SIGNIFICANT ACCOUNTING POLICIES (Continued) Other Revenues Other revenues primarily consist of concession sales at the travel centers on the West Virginia Turnpike and craft and food sales at the Caperton Center (also known as TAMARACK-The Best of West Virginia). The amount of sales reported is net of costs of goods sold. The related general and administrative expenses are included under operating expenses in the statements of revenues, expenses, and changes in net position. Estimates The preparation of financial statements in conformity with accounting principles generally accepted in the United States of America requires management to make estimates and assumptions that affect the reported amounts of assets and liabilities and disclosure of contingent assets and liabilities at the date of the financial statements and the reported amounts of revenues and expenditures during the reporting period. Actual results could differ from those estimates. Subsequent Events In preparing these financial statements, the Authority has evaluated events and transactions for potential recognition or disclosure through October 2, 2017, the date the financial statements were issued. NOTE 3 - DEPOSITS AND INVESTMENTS All of the Authority’s cash on hand is held with outside bank accounts and the West Virginia State Treasurer’s Office, totaling approximately $31,872 and $31,713 in 2017 and 2016, respectively. A reconciliation of the investments disclosed in this Note to the amounts reported in the Statements of Net Position is as follows:
As disclosed in this Note: Total deposits with outside banks $ 26,185 Total WV State Treasurer’s Office 5,687 Total WV Short Term Bond Pool 3,248 Total other investments 53,348 $ 88,468 As reported on the Statement of Net Position: Cash and cash equivalents $ 31,872 Short-term investments 28,790 Investments in securities maturing beyond one year 27,806 $ 88,468
27

WEST VIRGINIA PARKWAYS AUTHORITY (A Component Unit of the State of West Virginia)
NOTES TO FINANCIAL STATEMENTS Years Ended June 30, 2017 and 2016
(In thousands)
NOTE 3 - DEPOSITS AND INVESTMENTS (Continued) The cost of investment securities is allocated at June 30, 2017 and 2016, among the following restricted and designated accounts created under the various Trust Indentures or by the adoption of Authority resolution (in thousands):
June 30 2017 2016 Restricted and designated assets:
Assets restricted by trust indenture and tri-party agreement Series 1993, 2002, and 2008 Reserves $ 10,808 $ 10,851 Renewal and replacement 13,832 14,437 Operating and maintenance 4,974 4,976 Series 2002 debt service 1,191 1,426 Series 2008 debt service 2,052 700 Reserve revenue, restricted by tri-party agreement 41,230 29,292 Insurance liability 1,000 1,000 Patron account 2,357 2,459 Total restricted 77,444 65,141 Non toll revenue fund 3,030 3,026
Total restricted and designated assets as allocated by trust indentures $ 80,474 $ 68,167
The assets restricted by the 1993 Trust Indenture, as supplemented, must be used for construction, Turnpike maintenance and operation, and debt service. The Trust Indentures require that the balance in the 1993, 2002, and 2008 Reserve Account equal maximum annual debt service for such bonds. The balance in the 1993, 2002, and 2008 Debt Service Accounts are required by the Trust Indentures to have a balance equal to accrued debt service for the current year plus one-twelfth of the debt service which will accrue in the next succeeding fiscal year. The Trust Indentures also require that a reserve be established for Renewal and Replacement that equals the consulting engineer’s recommendations for the year. The Operations and Maintenance Account is required by the Trust Indentures to maintain a balance equal to one-eighth of budgeted operating expenses for the fiscal year. The Insurance Liability account is a self-insured fund that covers the Authority against risk of loss from natural disaster, among other items, and is designated as the Authority’s percentage of contribution in the event of a disaster.
The Non Toll Revenue Fund is designated to be used for Non Turnpike activities. This balance is shown as unrestricted net position on the Statements of Net Position. The Reserve Revenue Account, restricted by the Tri-Party Agreement dated December 1988 among the West Virginia Department of Transportation, the Federal Highway Administration, and the Authority, can only be used for maintenance and operation of the Turnpike and for debt service.
28

WEST VIRGINIA PARKWAYS AUTHORITY (A Component Unit of the State of West Virginia)
NOTES TO FINANCIAL STATEMENTS Years Ended June 30, 2017 and 2016
(In thousands)
NOTE 3 - DEPOSITS AND INVESTMENTS (Continued) Interest rate risk - Interest rate risk is the risk that changes in interest rates will adversely affect the fair value of an investment. All of the Authority’s investments are subject to interest rate risk. As a means of limiting its exposure to fair value losses resulting from rising interest rates, the Authority’s investment policies limit individual securities in the Authority’s investment portfolio to remaining maturities of less than five years and the weighted dollar average maturity is capped at three years. As of June 30, 2017, the Authority had the following investments and maturities (in years):
Investment Type Fair Value Less than 1 1 - 5 6 - 10 10+ Government agency bonds $ 42,103 $ 15,442 $ 26,661 $ - $ - Corporate bonds 3,248 3,248 - - - Certificate of deposit – financial institution 11,245 10,100 1,145 - - $ 56,596 $ 28,790 $ 27,806 $ - $ -
Concentration of credit risk - Concentration of credit risk is the risk of loss attributed to the magnitude of the Authority’s investment in a single issuer. The Authority’s cash deposits with financial institutions were $26,185 and $29,080 at June 30, 2017 and 2016, respectively. These deposits, which had a bank balance of $25,883 and $25,610, respectively, are insured by the Federal Deposit Insurance Corporation and/or collateralized with securities held in the Authority’s name by its agent. As of June 30, 2017, the Authority had investment balances with the following issuers which were greater than or equal to 5% of the Authority’s total investment balance:
Percentage of Security Type Issuer Investments Government agency bonds Federal Home Loan Mortgage Corp. 30% Federal National Mortgage Association 28 Federal Farm Credit Bank 7 Freddie Mac Sovereign Agency 5
Custodial credit risk - Custodial credit risk of deposits is the risk that in the event of failure of a depository financial institution, the Authority will not be able to recover deposits or will not be able to recover collateral securities that are in the possession of an outside party. Deposits include nonnegotiable certificates of deposit. None of the Authority’s investments contain nonnegotiable certificates of deposit. Foreign currency risk - Foreign currency risk is the risk that changes in exchange rates will adversely affect the fair value of an investment or a deposit. The Authority does not hold any foreign currency or hold any interests in foreign currency.
29

WEST VIRGINIA PARKWAYS AUTHORITY (A Component Unit of the State of West Virginia)
NOTES TO FINANCIAL STATEMENTS Years Ended June 30, 2017 and 2016
(In thousands)
NOTE 3 - DEPOSITS AND INVESTMENTS (Continued) BTI DISCLOSURE INFORMATION The BTI has adopted an investment policy in accordance with the “Uniform Prudent Investor Act.” The “prudent investor rule” guides those with responsibility for investing the money for others. Such fiduciaries must act as a prudent person would be expected to act, with discretion and intelligence, to seek reasonable income, preserve capital, and, in general, avoid speculative investments. The BTI’s investment policy is to invest assets in a manner that strives for maximum safety, provides adequate liquidity to meet all operating requirements, and achieves the highest possible investment return consistent with the primary objectives of safety and liquidity. The BTI recognizes that risk, volatility, and the possibility of loss in purchasing power are present to some degree in all types of investments. Due to the short-term nature of the Consolidated Fund, the BTI believes that it is imperative to review and adjust the investment policy in reaction to interest rate market fluctuations/trends on a regular basis and has adopted a formal review schedule. Investment policies have been established for each investment pool and account of the Consolidated Fund. WV Short Term Bond Pool: Credit Risk — The BTI limits the exposure to credit risk in the WV Short Term Bond Pool by requiring all corporate bonds to be rated BBB- or higher by Standard & Poor’s (or its equivalent). Commercial paper must be rated at least A-1 by Standard & Poor’s and P-1 by Moody’s. Mortgage-backed and asset-backed securities must be rated AAA by Standard & Poor’s and Aaa by Moody’s. The pool must have at least 15% of its assets in U.S. Treasury obligations or obligations guaranteed as to repayment of interest and principal by the United States of America. The following table provides information on the credit ratings of the WV Short Term Bond Pool’s investments: Credit Rating
Security Type Moody’s S&P Carrying
Value Percent of Pool Assets
Commercial paper P-1 A-1+ $ 9,963 1.32% P-1 A-1 13,940 1.85 Corporate asset backed securities Aaa AAA 68,441 9.06 Aaa NR 79,853 10.58 NR AAA 67,375 8.92 NR AA 2,003 0.26 Corporate bonds and notes Aaa AA+ 2,935 0.39 Aaa AA+ 4,019 0.53 Aa1 AA+ 5,027 0.67 Aa2 AA+ 4,036 0.53 Aa2 AA 6,989 0.93 Aa2 AA- 17,124 2.27 Aa3 AA- 15,106 2.00 Aa2 A 4,011 0.53 Aa3 A+ 1,104 0.15 A1 AA- 16,588 2.20 A1 A+ 19,078 2.53 A1 A 6,355 0.84 A1 A- 7,276 0.96 A2 A+ 2,616 0.35 A2 A 25,032 3.32 A2 A- 10,079 1.33 A3 A 10,747 1.42
30

WEST VIRGINIA PARKWAYS AUTHORITY (A Component Unit of the State of West Virginia)
NOTES TO FINANCIAL STATEMENTS Years Ended June 30, 2017 and 2016
(In thousands)
NOTE 3 - DEPOSITS AND INVESTMENTS (Continued) Corporate bonds and notes (continued) A3 A- 30,242 4.01 A3 BBB+ 20,183 2.67 Baa1 A 1,501 0.20 Baa1 A- 11,991 1.59 Baa1 BBB+ 47,392 6.28 Baa1 BBB 8,495 1.12 Baa2 A- 1,018 0.13 Baa2 BBB 28,770 3.81 Baa2 BBB- 3,000 0.40 Baa2 NR 2,000 0.26 Baa2 BBB+ 10,268 1.36 Baa3 BBB 15,627 2.07 Baa3 BBB- 7,166 0.95 Ba1 BBB 2,005 0.27 Ba1 BBB- 2,304 0.31 Ba2 BBB- 824 0.11 NR BBB+ 2,637 0.35 NR BBB- 1,990 0.26 U.S. agency mortgage backed securities Aaa AA+ 37,287 4.94 Corporate mortgage backed securities Aaa AAA 4,217 0.56 Aaa NR 17,281 2.29 U.S. Treasury notes * Aaa AA+ 87,588 11.60 Money market funds Aaa AAAm 11,479 1.52 $ 754,962 100.00% NR = Not Rated * U.S. agency mortgage-backed securities are explicitly guaranteed by the United States Government and are not subject to credit risk.
At June 30, 2017 and 2016, the Authority ownership of approximately $3,248 represents 0.4% and ownership of approximately $3,208 represents 0.4%, respectively, of these amounts held by the BTI. Interest Rate Risk - Interest rate risk is the risk that changes in interest rates will adversely affect the fair value of an investment. All the BTI’s Consolidated Fund pools and accounts are subject to interest rate risk. The overall effective duration of the investments of the WV Short Term Bond Pool cannot exceed 731 days. Maximum effective duration of individual securities cannot exceed 1,827 days (five years) from date of purchase. The following table provides information on the effective duration for the various asset types in the WV Short Term Bond Pool:
2017 2016
Security Type Carrying Value (In Thousands)
Effective Duration (Days)
Carrying Value (In Thousands)
Effective Duration (Days)
Corporate mortgage-backed securities $ 21,498 347 $ 29,402 338 Corporate bonds and notes 355,535 412 386,556 480 Corporate asset-backed securities 217,672 423 227,907 302 Commercial paper 23,903 113 - - U.S. Treasury bonds and notes 87,588 766 89,497 1,034 U.S. agency mortgage-backed securities 37,287 148 47,311 175 Money market funds 11,479 1 10,077 1 $ 754,962 426 $ 790,750 462
31

WEST VIRGINIA PARKWAYS AUTHORITY (A Component Unit of the State of West Virginia)
NOTES TO FINANCIAL STATEMENTS Years Ended June 30, 2017 and 2016
(In thousands)
NOTE 3 - DEPOSITS AND INVESTMENTS (Continued) Other Investment Risks - Other risks of investing include concentration of credit risk, custodial credit risk, and foreign currency risk. Concentration of credit risk is the risk of loss attributed to the magnitude of a Consolidated Fund pool or account’s investment in a single corporate issuer. The BTI investment policy prohibits those pools and accounts permitted to hold corporate securities from investing more than 5% of their assets in any one corporate name or one corporate issue. The custodial credit risk for investments is the risk that, in the event of the failure of the counterparty to a transaction, the BTI will not be able to recover the value of investment or collateral securities that are in the possession of an outside party. Repurchase agreements are required to be collateralized by at least 102% of their value, and the collateral is held in the name of the BTI. The BTI or its agent does not release cash or securities until the counterparty delivers its side of the transaction. Foreign currency risk is the risk that changes in exchange rates will adversely affect the fair value of an investment or a deposit. None of the Consolidated Fund’s investment pools or accounts holds interests in foreign currency or interests valued in foreign currency. NOTE 4 - FAIR VALUE MEASUREMENTS The Authority uses fair value measurements of certain assets and liabilities to record fair value adjustments and to determine fair value disclosures. Professional standards establish a fair value hierarchy that prioritizes the inputs to valuation techniques used to measure fair value. The hierarchy, as defined below, gives the highest priority to unadjusted quoted prices in active markets for identical assets or liabilities and the lowest priority to unobservable inputs.
Level 1 is defined as observable inputs such as quoted prices in active markets for identical assets or liabilities or the publicly available amount at which the asset or liability can be redeemed. Level 1 assets include the Authority’s bond investments.
Level 2 is defined as observable inputs other than Level 1 prices. These include quoted prices for
similar assets or liabilities in an active market, quoted prices for identical assets and liabilities in markets that are not active, or other inputs that are observable or can be corroborated by observable market data for substantially the full term of the assets or liabilities. Level 2 assets include certificates of deposit not considered cash equivalents.
Level 3 is defined as unobservable inputs in which little or no market data exists, therefore
requiring an entity to develop its own assumptions. Level 3 assets include the interest rate swap on the series 2008 refunding variable rate bonds.
32

WEST VIRGINIA PARKWAYS AUTHORITY (A Component Unit of the State of West Virginia)
NOTES TO FINANCIAL STATEMENTS Years Ended June 30, 2017 and 2016
(In thousands)
NOTE 4 - FAIR VALUE MEASUREMENTS (Continued) Fair values of assets measured on a recurring basis at December 31, are as follows: Fair Value Measurements at Reporting Date Using
June 30, 2017 Fair Value
Quoted Prices in Active Markets
for Identical Assets/Liabilities
(Level 1)
Significant
Other Observable
Inputs (Level 2)
Significant Unobservable
Inputs (Level 3)
Government agency bonds $ 42,103 $ 42,103 $ - $ - Corporate bonds 3,248 3,248 - - Certificates of deposit 11,245 - 11,245 -
Total investments at fair value $ 56,596 $ 45,351 $ 11,245 $ - Deferred outflows of hedging derivative instrument $ 633 $ - $ - $ 633 Deferred inflows of hedging derivative instrument (633) - - (633) Total hedging derivative instrument at fair value $ - $ - $ - $ -
June 30, 2016 Fair Value
Quoted Prices in Active Markets
for Identical Assets/Liabilities
(Level 1)
Significant
Other Observable
Inputs (Level 2)
Significant Unobservable
Inputs (Level 3)
Government agency bonds $ 31,518 $ 31,518 $ - $ - Corporate bonds 3,208 3,208 - - Certificates of deposit 11,261 - 11,261 -
Total investments at fair value $ 45,987 $ 34,726 $ 11,261 $ - Deferred outflows of hedging derivative instrument $ 1,484 $ - $ - $ 1,484 Deferred inflows of hedging derivative instrument (1,484) - - (1,484) Total hedging derivative instrument at fair value $ - $ - $ - $ -
33

WEST VIRGINIA PARKWAYS AUTHORITY (A Component Unit of the State of West Virginia)
NOTES TO FINANCIAL STATEMENTS Years Ended June 30, 2017 and 2016
(In thousands)
NOTE 5 - CAPITAL ASSETS A summary of capital assets at June 30 follows:
2017 Beginning Balance
Increases
Decreases
Ending Balance
Capital assets, non-depreciable: Land $ 53,247 $ - $ - $ 53,247 Capital assets, depreciable: Buildings 103,237 - - 103,237 Equipment 16,785 2,483 - 19,268 Infrastructure 1,005,361 32,043 - 1,037,404 Total capital assets being depreciated 1,125,383 34,526 - 1,159,909 Less accumulated depreciation for: Buildings (76,791) (2,531) - (79,322) Equipment (11,167) (796) - (11,963) Infrastructure (636,839) (33,991) - (670,830) Total accumulated depreciation (724,797) (37,318) - (762,115) Total depreciable capital assets, net 400,586 (2,792) - 397,794 Total capital assets, net $ 453,833 $ (2,792) $ - $ 451,041
2016 Beginning Balance
Increases
Decreases
Ending Balance
Capital assets, non-depreciable: Land $ 53,247 $ - $ - $ 53,247 Capital assets, depreciable: Buildings 103,237 - - 103,237 Equipment 14,861 1,924 - 16,785 Infrastructure 974,815 30,546 - 1,005,361 Total capital assets being depreciated 1,092,913 32,470 - 1,125,383 Less accumulated depreciation for: Buildings (73,252) (3,539) - (76,791) Equipment (10,472) (695) - (11,167) Infrastructure (604,144) (32,695) - (636,839) Total accumulated depreciation (687,868) (36,929) - (724,797) Total depreciable capital assets, net 405,045 (4,459) - 400,586 Total capital assets, net $ 458,292 $ (4,459) $ - $ 453,833
Interest cost capitalized was $138 and $177 for the years ended June 30, 2017 and 2016, respectively.
34

WEST VIRGINIA PARKWAYS AUTHORITY (A Component Unit of the State of West Virginia)
NOTES TO FINANCIAL STATEMENTS Years Ended June 30, 2017 and 2016
(In thousands)
NOTE 6 - REVENUE BONDS PAYABLE Revenue bonds payable consisted of the following at June 30:
2017 2016 Series 2002 Serial Bonds, issued $44,205 in February 2002 at 3.50% to 5.25%, due in varying installments from May 2002 through May 2019 $ 6,990 $ 10,200 Series 2008 Variable Rate Demand Revenue Refunding Bonds, $59,100 at variable rates, due in varying installments through April 2019 13,100 19,200 Total revenue bonds payable 20,090 29,400 Add: Unamortized premium 238 389 Less: Current portion of revenue bonds payable (9,805) (9,310) Total long term revenue bonds payable 10,523 20,479 Less: Unamortized deferred loss on advance refunding (1,441) (2,403)
$ 9,082 $ 18,076
The Revenue Bonds under the 1993, 2002, 2003, and 2008 Trust Indentures are secured by a pledge of the Authority’s toll revenues and all monies deposited into accounts created by the Trust Indentures. Total debt service was $10,760, $10,755, and $10,577, for the years ended June 30, 2017, 2016, and 2015, respectively. Total pledged revenues were approximately $50,815, $54,100, and $47,721, which represents 472.26%, 503.02%, and 451.18% of the total debt service, respectively, for the years ended June 30, 2017, 2016, and 2015. In 2002, $44,205 of Revenue Refunding Bonds were issued for the express purpose of defeasing $36,036 of Series 1993 Bonds. The advance refunding resulted in a $6,313 deferred loss arising from the difference between the reacquisition price and the net carrying amount of the refunded debt. Amortization of this deferral, charged annually to interest expense through 2019, approximated $371 in 2017 and 2016. The Authority completed the advance refunding to reduce its aggregate debt service payments by almost $3,003 over an 18-year period (life of the refunding bonds) and obtain an economic gain (difference between the present values of the old and new debt service payments) of $1,624. In July 2008, the Authority issued $59,100 of Variable Rate Demand Revenue Refunding Bonds for the express purpose of refunding $59,100 of the Authority’s Series 2003 Bonds. This refunding resulted in a $5,972 deferred loss arising from the difference between the reacquisition price and the net carrying amount of the refunded debt. Amortization of this deferral, charged annually to interest expense through 2019, approximated $569 in 2017 and 2016, respectively. The Authority completed the refunding to remove the requirement for bond insurance that was included in the Series 2003 Bonds.
35

WEST VIRGINIA PARKWAYS AUTHORITY (A Component Unit of the State of West Virginia)
NOTES TO FINANCIAL STATEMENTS Years Ended June 30, 2017 and 2016
(In thousands)
NOTE 6 - REVENUE BONDS PAYABLE (Continued) In July 2011, the Authority converted the Series 2008 Variable Rate Demand Revenue Refunding Bonds to a LIBOR Index rate and placed the bonds with a direct purchaser. The supplemental indenture established eight distinct registered bonds in principal amounts identical to the principal maturity schedule prior to the conversion. The Indenture establishes an applicable factor ranging from 67% to 82% of the one-month LIBOR Index with an additional spread ranging from 70 to 110 basis points on each bond. The Interest Rate Swap associated with the Series 2008 Variable Rate Bonds was amended to relate to the new index rate bonds under substantially similar terms. The Authority has an interest rate swap derivative instrument to synthetically fix, on a current basis, the Series 2008 Refunding Variable Rate Bonds in order to hedge interest rate fluctuations. The key provisions of the instrument are:
Type Pay-fixed interest rate swap Objective Hedge changes in cash flows on the Series 2008
Refunding Variable Rate Bonds Notional Amount $13,100 Effective Date July 2, 2008 Maturity Date April 15, 2019 Terms Pay 4.387%, receive 67% of One Month LIBOR
The fair value of this interest rate swap is estimated using the zero-coupon method. This method calculates the future net settlement payments required by the swap, assuming that the current forward rate implied by the yield curve correctly anticipates future spot interest rates. These payments are then discounted using the spot rate implied by the current yield curve for hypothetical zero-coupon bonds due on the date of the future net settlement on the swap. At June 30, 2017 and 2016, the decrease in the value of the swap since inception was equal to the market value of the swap creating a deferred inflow of resources that offsets the deferred outflow of resources in the Statements of Net Position. The fair value balance for the hedging derivative instrument outstanding at June 30, 2017, and the change in fair value of the instrument for the year ended June 30, 2017, as reported in the 2017 financial statements are as follows:
Changes in fair value: Increase (decrease) $ (851) Fair value at June 30, 2017 Amount $ 633
Risks Credit Risk - The credit ratings of the counterparty to the interest rate swap are A1 from Moody’s, A+ from Standard & Poor’s, and A+ from Fitch. The interest rate swap agreement requires certain collateralization if the credit rating of the counterparty falls below specific levels. As of June 30, 2017, no collateralization was required by the interest rate swap agreement. Interest Rate Risk - Interest rate risk is the risk that changes in interest rates will adversely affect the fair value of the interest rate swap.
36

WEST VIRGINIA PARKWAYS AUTHORITY (A Component Unit of the State of West Virginia)
NOTES TO FINANCIAL STATEMENTS Years Ended June 30, 2017 and 2016
(In thousands)
NOTE 6 - REVENUE BONDS PAYABLE (Continued) Basis Risk - The Authority is exposed to basis risk on the fixed interest rate swap because the variable-rate payments received by the Authority on this hedging derivative instrument are based on rates other than the interest rate the Authority pays on the hedged variable-rate debt. Termination Risk - The interest rate swap agreement provides for certain events that could cause the counterparty or the Authority to terminate the swap. The swap may be terminated by the counterparty or the Authority if the other party fails to make payments when due, there is a material breach of representations and warranties, an event of illegality occurs, and failure to comply with any other provisions of the agreement after a specified notice period. In addition, if the counterparty fails to maintain ratings of at least Baa3 by Moody’s and BBB- by Standard and Poor’s, the swap may be terminated by the Authority. If the Authority fails to maintain ratings of at least Baa3 by Moody’s and BBB- by Standard and Poor’s, the swap may be terminated by the counterparty. The amount of the termination payment is determined by market quotation by obtaining pricing levels from at least three reference market makers. The Authority has the right to optionally terminate the swap agreement at any time. The termination amount owed by either the Authority or the counterparty may be determined by market quotation. If at the time of termination the swap has a negative fair value, the Authority would owe the counterparty a payment equal to the swap’s fair value. Rollover Risk - The Authority is exposed to rollover risk on the hedging interest rate swap that may be terminated prior to the maturity of the hedged debt. Swap Payments and Associated Debt - Using rates as of June 30, 2017, debt service requirements of the variable rate debt and net swap payments, assuming current interest rates remain the same for their term, were as follows. As rates vary, variable rate bond interest payments and net swap payments will vary.
Year Ending Variable-Rate Bonds Interest Rate June 30 Principal Interest Swap, Net Total
2018 $ 6,400 $ 246 $ 472 $ 7,118 2019 6,700 128 241 7,069
$ 13,100 $ 374 $ 713 $ 14,187
Bonds Payable Progression and Maturities The following schedule summarizes the revenue bonds outstanding as of June 30:
Beginning Ending Due Within 2017 Balance Additions Retired Amortization Balance One Year
Series 2002 $ 10,589 $ - $ (3,210) $ (150) $ 7,229 $ 3,405 Series 2008 19,200 - (6,100) - 13,100 6,400 $ 29,789 $ - $ (9,310) $ (150) $ 20,329 $ 9,805
37

WEST VIRGINIA PARKWAYS AUTHORITY (A Component Unit of the State of West Virginia)
NOTES TO FINANCIAL STATEMENTS Years Ended June 30, 2017 and 2016
(In thousands)
NOTE 6 - REVENUE BONDS PAYABLE (Continued)
Beginning Ending Due Within 2016 Balance Additions Retired Amortization Balance One Year
Series 2002 $ 13,834 $ - $ (3,095) $ (150) $ 10,589 $ 3,210 Series 2008 25,100 - (5,900) - 19,200 6,100 $ 38,934 $ - $ (8,995) $ (150) $ 29,789 $ 9,310
Debt service requirements for the Revenue Bonds subsequent to June 30, 2017, are as follows:
Interest, Year Ending Principal Including
June 30 Maturities Accretion Total
2018 $ 9,805 $ 914 $ 10,719 2019 10,285 454 10,739
$ 20,090 $ 1,368 $ 21,458
Principal outstanding June 30, 2017 $ 20,090 Add:
Unamortized premium 238 Less:
Current portion of revenue bonds payable (9,805) Long-term portion $ 10,523
The Revenue Bonds are subject to the arbitrage rebate provisions of the Internal Revenue Code (the Code). The Code requires that 90% of excess investment earnings on the Bond proceeds be paid to the Internal Revenue Service every five years in order for the Bonds to maintain their tax-exempt status. At June 30, 2017 and 2016, the Authority’s estimated arbitrage rebate liability was zero. NOTE 7 - POST-EMPLOYMENT BENEFITS OTHER THAN PENSIONS Plan Description The Authority participates in the West Virginia Other Post-employment Benefit Plan (OPEB Plan) of the West Virginia Retiree Health Benefit Trust Fund (RHBT), a cost-sharing multiple-employer defined benefit post-employment healthcare plan administered by the West Virginia Public Employees Insurance Agency (WVPEIA). The OPEB Plan provides retiree post-employment health care benefits for participating state and local government employers. The provisions of the Code of West Virginia, 1931, as amended (the Code), assigns the authority to establish and amend benefit plans to the WVPEIA Board of Trustees. The WVPEIA issues a publicly available financial report that includes financial statements and required supplementary information for the OPEB Plan. That report may be obtained by writing to Public Employees Insurance Agency, 601 57th Street, S.E., Suite 2, Charleston, West Virginia, 25304-2345, or by calling 1-888-680-7342.
38

WEST VIRGINIA PARKWAYS AUTHORITY (A Component Unit of the State of West Virginia)
NOTES TO FINANCIAL STATEMENTS Years Ended June 30, 2017 and 2016
(In thousands)
NOTE 7 - POST-EMPLOYMENT BENEFITS OTHER THAN PENSIONS (Continued) Funding Policy The Code requires the OPEB Plan to bill the participating employers 100% of the Annual Required Contribution (ARC), an amount actuarially determined in accordance with the parameters of GASB Statement 45. The ARC represents a level of funding that, if paid on an ongoing basis, is projected to cover normal cost each year and amortize any unfunded actuarial liabilities (or funding excess) of the plan over a period not to exceed thirty years. Participating plan employers are billed per active health policy per month. The Authority’s OPEB liability was $11,234, $10,923, and $10,293, and total OPEB expense was $1,024, $1,368, and $1,320, for the years ended June 30, 2017, 2016, and 2015, respectively. The Authority has paid premiums of $713, $738, and $779, which represents approximately 70%, 54%, and 59% of the required contributions, respectively, for the years ended June 30, 2017, 2016, and 2015. During fiscal year 2012, the West Virginia Legislature passed legislation to provide alternate funding sources for the RHBT OPEB unfunded liability. In addition, the WVPEIA Finance Board imposed limits on the retiree subsidy currently provided for WVPEIA premiums for retirees. Future increases in the subsidy will be limited to no more than 3% per year. These actions have had a material impact on the amounts billed by the RHBT to the Authority as well as an expected material impact on amounts billed in the future, resulting in decreases in the recorded OPEB liability. NOTE 8 - PENSION PLAN All full-time Authority employees are eligible to participate in the State of West Virginia Public Employees’ Retirement System (PERS), a cost-sharing multiple-employer public employee retirement system. PERS also provides delayed retirement, early retirement, death and disability benefits. The West Virginia Consolidated Public Retirement Board issues a publicly available financial report that includes financial statements and required supplementary information for PERS. That report may be obtained by writing to West Virginia Consolidated Public Retirement Board, 4101 MacCorkle Avenue S.E., Charleston, WV 25304-1636 or by calling (304) 558-3570. Benefits Provided Benefits are provided through PERS using a two-tiered system. Effective July 1, 2015, PERS implemented the second tier, Tier II. Employees hired, for the first time, on or after July 1, 2015 are considered Tier II members. Tier I and Tier II members are subject to different regulations.
39

WEST VIRGINIA PARKWAYS AUTHORITY (A Component Unit of the State of West Virginia)
NOTES TO FINANCIAL STATEMENTS Years Ended June 30, 2017 and 2016
(In thousands)
NOTE 8 - PENSION PLAN (Continued) Tier I: Employees who retire at or after age 60 with five or more years of credited service, or at least age 55 with age and service equal to 80 years or greater, are entitled to a retirement benefit established by State statute, payable monthly for life, in the form of a straight-life annuity equal to two percent of the employee’s final average salary multiplied by years of service. Final average salary is the average of the highest annual compensation received by an employee during any period of three consecutive years of credited service included within fifteen years of credited service immediately preceding the termination date of employment with a participating public employer or, if the employee has less than three years of credited service, the average of the annual rate of compensation received by the employee during the total years of credited service. Terminated members with at least five years of contributory service who do not withdraw their accumulated contributions may elect to receive their retirement annuity beginning at age 62. Tier II: Employees who retire at or after age 62 with ten or more years of credited service are entitled to a retirement benefit established by State statute, payable monthly for life, in the form of a straight-life annuity equal to two percent of the employee’s final average salary multiplied by years of service. Final average salary is the average of the highest annual compensation received by an employee during any period of five consecutive years of credited service included within fifteen years of credited service immediately preceding the termination date of employment with a participating public employer. Terminated members with at least ten years of contributory service who do not withdraw their accumulated contributions may elect to receive their retirement annuity beginning at age 64. Contributions While contribution rates are legislatively determined, actuarial valuations are performed to assist PERS and the State Legislature in determining contribution rates. Current funding policy requires employer contributions of 12.0%, 13.5%, and 14.0% for the years ended June 30, 2017, 2016, and 2015, respectively. Effective July 1, 2017, a decrease in the contribution rate of 1.0%, will decrease the Authority’s contribution rate to 11.0%. The employee contribution rate is 4.5% and 6.0% for Tier I and Tier II employees, respectively. Total contributions to PERS, for the fiscal years ended June 30, 2017, 2016, and 2015, were $1,873, $2,081, and $2,053 from the Authority and $703, $773, and $660 from the covered employees, respectively. Pension Liabilities, Pension Expense, and Deferred Outflows of Resources and Deferred Inflows of Resources Related to Pensions At June 30, 2017 and 2016, the Authority reported a liability of $10,007 and $5,848, respectively, for its proportionate share of the net pension liability. The June 30, 2017 net pension liability was measured as of June 30, 2016 and the total pension liability used to calculate the net pension liability was determined by an actuarial valuation as of June 30, 2015, rolled forward to the measurement date of June 30, 2016. The June 30, 2016 net pension liability was measured as of June 30, 2015 and the total pension liability used to calculate the net pension liability was determined by an actuarial valuation as of June 30, 2014, rolled forward to the measurement date of June 30, 2015. The Authority’s proportion of the net pension liability was based on a projection of the Authority’s long-term share of contributions to the pension plan relative to the projected contributions of all participating employers, actuarially determined. At June 30, 2016, the Authority’s proportionate share was 1.09%, which was an increase of .04% from its proportionate share measured as of June 30, 2015.
40

WEST VIRGINIA PARKWAYS AUTHORITY (A Component Unit of the State of West Virginia)
NOTES TO FINANCIAL STATEMENTS Years Ended June 30, 2017 and 2016
(In thousands)
NOTE 8 - PENSION PLAN (Continued) For the years ended June 30, 2017 and 2016, the Authority recognized pension expense of $1,669 and $628, respectively. At June 30, 2017 and 2016, the Authority reported deferred outflows of resources and deferred inflows of resources related to pensions from the following sources: June 30, 2017
Deferred Outflows
of Resources Deferred Inflows
of Resources Net difference between projected and actual earnings
on pension plan investments $ 3,145 $ - Difference between expected and actual experience 834 - Changes of assumptions - 488 Changes in proportion and differences between
Authority contributions and proportionate share of contributions 200 80
Authority contributions subsequent to the measurement date 1,873 -
Total $ 6,052 $ 568 June 30, 2016
Deferred Outflows
of Resources Deferred Inflows
of Resources Net difference between projected and actual earnings
on pension plan investments $ - $ 1,282 Difference between expected and actual experience 1,196 - Changes of assumptions - 703 Changes in proportion and differences between
Authority contributions and proportionate share of contributions - 126
Authority contributions subsequent to the measurement date 2,319 -
Total $ 3,515 $ 2,111 $1,873 reported as deferred outflows of resources related to pensions resulting from the Authority’s contributions subsequent to the measurement date will be recognized as a reduction of the net pension liability in the year ended June 30, 2017. Other amounts reported as deferred outflows of resources and deferred inflows of resources related to pensions will be recognized in pension expense as follows:
Year ended June 30: 2018 $ 649 2019 664 2020 1,336 2021 962 Total $ 3,611
41

WEST VIRGINIA PARKWAYS AUTHORITY (A Component Unit of the State of West Virginia)
NOTES TO FINANCIAL STATEMENTS Years Ended June 30, 2017 and 2016
(In thousands)
NOTE 8 - PENSION PLAN (Continued) Actuarial assumptions and methods - The total pension liability in the June 30, 2016 actuarial valuation was determined using the following actuarial assumptions, applied to all periods in the measurement:
Inflation 3.00% Salary increases 3.0% – 6.0%, average, including inflation Investment rate of return 7.5%, net of pension plan investment expense
Mortality rates were based on 110% of RP-2000 Non-Annuitant, Scale AA for healthy males, 101% of RP-2000 Non-Annuitant, Scale AA for healthy females, 96% of RP-2000 Disabled Annuitant Scale AA for disabled males, and 107% of RP-2000 Disabled Annuitant, Scale AA for disabled females. The actuarial assumptions used in the June 30, 2016 valuation were based on the results of an actuarial experience study for the period July 1, 2009 through June 30, 2014. Long-term expected rates of return - The long-term rates of return on pension plan investments were determined using a building-block method in which estimates of expected real rates of return (expected returns, net of pension plan investment expense and inflation) are developed for each major asset class. These ranges are combined to produce the long-term expected rate of return by weighting the expected future real rates of return by the target asset allocation percentages and by adding expected inflation. The target allocation and best estimates of arithmetic real rates of return for each major asset class are summarized in the following table:
Asset Class Target Allocation Long-Term Expected Real Rate of Return
Core Fixed Income 7.5% 2.7% High Yield Fixed Income 7.5% 5.5% Domestic Equity 27.5% 7.0% International Equity 27.5% 7.7% Real Estate 10.0% 5.6% Private Equity 10.0% 9.4% Hedge Funds 10.0% 4.7% Total 100.0%
Discount rate - The discount rate used to measure the total pension liability was 7.5%. The projections of cash flows used to determine the discount rate assumed that employee contributions will be made at the current contribution rate and that employer contributions from employers will continue to be made at statutorily required rates, which are determined annually based on actuarial valuations. Based on those assumptions, the pension plan’s fiduciary net position was projected to be available to make all projected future benefit payments of current active and inactive employees. Therefore, the long-term expected rates of return on pension plan investments were applied to all periods of projected benefit payments to determine the total pension liability. Although discount rates are subject to change between measurement dates, there were no changes in the discount rate in the current period.
42

WEST VIRGINIA PARKWAYS AUTHORITY (A Component Unit of the State of West Virginia)
NOTES TO FINANCIAL STATEMENTS Years Ended June 30, 2017 and 2016
(In thousands)
NOTE 8 - PENSION PLAN (Continued) Sensitivity of the Authority’s proportionate share of the net pension liability to changes in the discount rate - The following table presents the Authority’s proportionate share of the net pension liability calculated using the current discount rate of 7.5% as well as what the Authority’s proportionate share of the net pension liability would be if it were calculated using a discount rate that is one-percentage-point lower or one-percentage-point higher than the current rate:
Total Net Pension Liability 1% Decrease
6.5% Discount Rate
7.5% 1% Increase
8.5% PERS $ 18,114 $ 10,007 $ 3,122
Pension plan fiduciary net position - Detailed information about the pension plan's fiduciary net position is available in the separately issued PERS financial report available at the Consolidated Public Retirement Board’s website at www.wvretirement.com. NOTE 9 - NONCURRENT LIABILITIES The following is a summary of long-term obligation transactions for the Authority for the years ended June 30: 2017 Beginning Ending Current Balance Additions Reductions Balance Portion Compensated absences $ 997 $ - $ - $ 997 $ 773 OPEB liability 10,923 1,024 (713) 11,234 - Net pension liability 5,848 6,478 (2,319) 10,007 - Total noncurrent liabilities $ 17,768 $ 7,502 $ (3,032) $ 22,238 $ 773
2016 Beginning Ending Current Balance Additions Reductions Balance Portion Compensated absences $ 997 $ - $ - $ 997 $ 735 OPEB liability 10,293 1,368 (738) 10,923 - Net pension liability 3,925 3,976 (2,053) 5,848 - Total noncurrent liabilities $ 15,215 $ 5,344 $ (2,791) $ 17,768 $ 735
43

WEST VIRGINIA PARKWAYS AUTHORITY (A Component Unit of the State of West Virginia)
NOTES TO FINANCIAL STATEMENTS Years Ended June 30, 2017 and 2016
(In thousands)
NOTE 10 - LEASES The Authority leases certain facilities and service areas to third party businesses under operating lease agreements. The cost of the facilities and service areas were $36,180 and $36,180 at June 30 2017 and 2016, respectively. Accumulated depreciation on the facilities and service areas was $27,561 and $26,334 at June 30, 2017 and 2016, respectively. The Authority receives both guaranteed payments and contingent payments under the leases. Aggregate rental income from the lease agreements was approximately $3,344 and $3,296 for the years ended June 30, 2017 and 2016, respectively. Total contingent rental income received was approximately $2,577 and $2,529 for the years ended June 30, 2017 and 2016, respectively. Future minimum rentals are as follows at June 30:
2018 $ 767 2019 383 $ 1,150
NOTE 11 - RISK MANAGEMENT The Authority is exposed to various risks of loss related to torts; theft of, damage to, and destruction of assets; errors and omissions; injuries to and illnesses of employees; and natural disasters. The Authority has obtained coverage for job-related injuries of employees and health coverage for its employees from a commercial insurer, and the West Virginia Public Employees Insurance Agency (PEIA). In exchange for the payment of premiums to PEIA and the commercial insurer, the Authority has transferred its risks related to health coverage for employees and job-related injuries of employees. The Authority, for an annual premium, obtains insurance coverage for general liability, property damage, business interruption, errors and omissions, and natural disasters through the West Virginia Board of Risk and Insurance Management, a public risk pool entity insuring the State of West Virginia, its component units, local government entities, and eligible not-for-profit organizations. Liability coverage provided to all insured entities under this policy is limited to $1,000 per occurrence, subject to an annual aggregate limit of coverage of $22,000. To further reduce its risk of loss, the Authority, for an annual premium paid to a commercial insurer, has obtained an additional liability policy which provides coverage of $10,000 over and above the coverage provided by the West Virginia Board of Risk and Insurance Management. For the fiscal years ended June 30, 2017, 2016, and 2015, the Authority’s insurance coverage has been sufficient to meet all claims and settlements against the Authority. NOTE 12 - COMMITMENTS AND CONTINGENCIES Litigation The Authority is a defendant in certain legal proceedings pertaining to matters incidental to routine operations. Based on the current status of these legal proceedings, it is the opinion of Authority management and counsel that the ultimate resolution of these matters will not have a material effect on the Authority’s financial position.
44

WEST VIRGINIA PARKWAYS AUTHORITY (A Component Unit of the State of West Virginia)
NOTES TO FINANCIAL STATEMENTS Years Ended June 30, 2017 and 2016
(In thousands)
NOTE 12 - COMMITMENTS AND CONTINGENCIES (Continued) Construction Commitments At June 30, 2017, the Authority had contractual commitments totaling $28,722 for various Turnpike System improvement projects. Subsequent to June 30, 2017, the Authority entered into additional contractual commitments totaling $5,131. Potential Bond Issuance On June 27, 2017 Senate Bill 1003 was enacted giving the Authority the ability to issue bonds for the purpose of funding infrastructure projects as defined in the statute. The legislation created a special revenue account known as the State Road Construction Account within the State Road Fund to be expended by the Division of Highways for construction, maintenance and repair of public highways and bridges in the state. The bill also included new authorizations, requirements and limitations on the Authority’s electronic toll collection programs and discounts to the published cash rates. An unlimited use single annual fee discount program for passenger cars utilizing an Authority issued EZPass transponder is required under these new provisions. NOTE 13 - ACCOUNTING PRONOUNCEMENTS Newly Adopted Statements Issued by the Governmental Accounting Standards Board The Authority implemented Statement No. 74, Financial Reporting for Postemployment Benefit Plans Other Than Pension Plans, effective for fiscal years beginning after June 15, 2016. The requirements of this Statement will improve the usefulness of information about postemployment benefits other than pensions (other postemployment benefits or OPEB) included in the general purpose external financial reports of state and local governmental OPEB plans for making decisions and assessing accountability. The adoption of GASB Statement No. 74 had no impact on the June 30, 2017 financial statements. The Authority implemented Statement No. 77, Tax Abatement Disclosures, effective for fiscal years beginning after December 15, 2015. The requirements of this Statement will improve financial reporting by giving users of financial statements essential information that is not consistently or comprehensively reported to the public at present. Disclosure of information about the nature and magnitude of tax abatements will make these transactions more transparent to financial statement users. As a result, users will be better equipped to understand (1) how tax abatements affect a government's future ability to raise resources and meet its financial obligations and (2) the impact those abatements have on a government's financial position and economic condition. The adoption of GASB Statement No. 77 had no impact on the June 30, 2017 financial statements. The Authority implemented Statement No. 80, Blending Requirements for Certain Component Units an amendment of GASB Statement No. 14, effective for fiscal years beginning after June 15, 2016. The objective of this Statement is to improve financial reporting by clarifying the financial statement presentation requirements for certain component units. This Statement amends the blending requirements established in paragraph 53 of Statement No. 14, The Financial Reporting Entity, as amended. The adoption of GASB Statement No. 80 had no impact on the June 30, 2017 financial statements.
45

WEST VIRGINIA PARKWAYS AUTHORITY (A Component Unit of the State of West Virginia)
NOTES TO FINANCIAL STATEMENTS Years Ended June 30, 2017 and 2016
(In thousands)
NOTE 13 - ACCOUNTING PRONOUNCEMENTS (Continued) The Authority implemented Statement No. 81, Irrevocable Split-Interest Agreements, effective for fiscal years beginning after December 15, 2016. The objective of this Statement is to improve accounting and financial reporting for irrevocable split-interest agreements by providing recognition and measurement guidance for situations in which a government is a beneficiary of the agreement. The adoption of GASB Statement No. 81 had no impact on the June 30, 2017 financial statements. The Authority implemented Statement No. 86, Certain Debt Extinguishment Issues, effective for fiscal years beginning after June 15, 2017. The requirements of this Statement will increase consistency in accounting and financial reporting for debt extinguishments by establishing uniform guidance for derecognizing debt that is defeased in substance, regardless of how cash and other monetary assets placed in an irrevocable trust for the purpose of extinguishing that debt were acquired. The requirements of this Statement also will enhance consistency in financial reporting of prepaid insurance related to debt that has been extinguished. In addition, this Statement will enhance the decision-usefulness of information in notes to financial statements regarding debt that has been defeased in substance. The adoption of GASB Statement No. 86 had no impact on the June 30, 2017 financial statements. Recent Statements Issued by the Governmental Accounting Standards Board The Governmental Accounting Standards Board has issued Statement No. 75, Accounting and Financial Reporting for Postemployment Benefits Other Than Pensions, effective for fiscal years beginning after June 15, 2017. The requirements of this Statement will improve accounting and financial reporting by state and local governments for postemployment benefits other than pensions (other postemployment benefits or OPEB). It also improves information provided by state and local governmental employers about financial support for OPEB that is provided by other entities. The Authority has not yet determined the effect that the adoption of GASB Statement No. 75 may have on its financial statements. The Governmental Accounting Standards Board has also issued Statement No. 83, Certain Asset Retirement Obligations, effective for fiscal years beginning after June 15, 2018. The requirements of this Statement will enhance comparability of financial statements among governments by establishing uniform criteria for governments to recognize and measure certain asset retirement obligations (AROs), including obligations that may not have been previously reported. This Statement also will enhance the decision-usefulness of the information provided to financial statement users by requiring disclosures related to those AROs. The Authority has not yet determined the effect that the adoption of GASB Statement No. 83 may have on its financial statements. The Governmental Accounting Standards Board has also issued Statement No. 84, Fiduciary Activities, effective for fiscal years beginning after December 15, 2018. The requirements of this Statement will enhance consistency and comparability by (1) establishing specific criteria for identifying activities that should be reported as fiduciary activities and (2) clarifying whether and how business-type activities should report their fiduciary activities. Greater consistency and comparability enhances the value provided by the information reported in financial statements for assessing government accountability and stewardship. The Authority has not yet determined the effect that the adoption of GASB Statement No. 84 may have on its financial statements.
46
WEST VIRGINIA PARKWAYS AUTHORITY (A Component Unit of the State of West Virginia)
NOTES TO FINANCIAL STATEMENTS Years Ended June 30, 2017 and 2016
(In thousands)
NOTE 13 - ACCOUNTING PRONOUNCEMENTS (Continued) The Governmental Accounting Standards Board has also issued Statement No. 85, Omnibus 2017, effective for fiscal years beginning after June 15, 2017. The requirements of this Statement will enhance consistency in the application of accounting and financial reporting requirements. Consistent reporting will improve the usefulness of information for users of state and local government financial statements. The Authority has not yet determined the effect that the adoption of GASB Statement No. 85 may have on its financial statements. The Governmental Accounting Standards Board has also issued Statement No. 87, Leases, effective for fiscal years beginning after December 15, 2019. The requirements of this Statement will increase the usefulness of governments’ financial statements by requiring reporting of certain lease liabilities that currently are not reported. It will enhance comparability of financial statements among governments by requiring lessees and lessors to report leases under a single model. This Statement also will enhance the decision-usefulness of the information provided to financial statement users by requiring notes to financial statements related to the timing, significance, and purpose of a government’s leasing arrangements. The Authority has not yet determined the effect that the adoption of GASB Statement No. 87 may have on its financial statements.
47

2017
2016
2015
2014
2013
2012
2011
2010
2009
2008
Aut
hori
ty's
pro
port
ion
of th
e ne
t pen
sion
liab
ilit
y (a
sset
) (p
erce
ntag
e)1.
09%
1.05
%1.
06%
1.07
%
Aut
hori
ty's
pro
port
iona
te s
hare
of
the
net p
ensi
on li
abil
ity
(ass
et)
10,0
07$
5,84
8$
3,92
5$
9,75
6$
Aut
hori
ty's
cov
ered
-em
ploy
ee p
ayro
ll15
,415
$
14
,664
$
14
,241
$
14
,321
$
Aut
hori
ty's
prop
orti
onat
esh
are
ofth
ene
tpe
nsio
nli
abil
ity
(ass
et)
asa
perc
enta
ge o
f it
s co
vere
d-em
ploy
ee p
ayro
ll64
.92%
39.8
8%27
.56%
68.1
2%
Pla
n fi
duci
ary
net p
osit
ion
as a
per
cent
age
of th
e to
tal p
ensi
on li
abil
ity
86.1
1%91
.29%
93.9
8%79
.70%
* -
The
am
ount
s pr
esen
ted
for
each
fis
cal y
ear
wer
e de
term
ined
as
of J
une
30th
of
the
prev
ious
yea
r.T
his
sche
dule
is p
rese
nted
to il
lust
rate
the
requ
irem
ent t
o sh
ow in
form
atio
n fo
r 10
yea
rs. H
owev
er, u
ntil
a f
ull 1
0-ye
ar tr
end
is c
ompi
led,
gov
ernm
ents
sho
uld
pres
ent i
nfor
mat
ion
for
thos
e ye
ars
for
whi
ch in
form
atio
n is
ava
ilab
le.
WE
ST
VIR
GIN
IA P
AR
KW
AY
S A
UT
HO
RIT
Y
SC
HE
DU
LE
OF
PR
OP
OR
TIO
NA
TE
SH
AR
E O
F T
HE
NE
T P
EN
SIO
N L
IAB
ILIT
Y
Jun
e 30
, 201
7
Pu
bli
c E
mp
loye
es R
etir
emen
t S
yste
mL
ast 1
0 F
isca
l Yea
rs*
(In
Tho
usan
ds)
RE
QU
IRE
D S
UP
PL
EM
EN
TA
RY
IN
FO
RM
AT
ION
48

2017
2016
2015
2014
2013
2012
2011
2010
2009
2008
Con
trac
tual
ly r
equi
red
cont
ribu
tion
1,87
3$
2,08
1$
2,05
3$
2,06
5$
2,00
5$
2,06
1$
1,78
7$
1,68
1$
1,54
1$
1,59
4$
Con
trib
utio
ns in
rel
atio
n to
the
cont
ract
uall
y re
quir
ed c
ontr
ibut
ion
(1,8
73)
(2
,081
)
(2,0
53)
(2
,065
)
(2,0
05)
(2
,061
)
(1,7
87)
(1
,681
)
(1,5
41)
(1
,594
)
Con
trib
utio
n de
fici
ency
(ex
cess
)-
$
-$
-
$
-$
-
$
-$
-
$
-$
-
$
-$
Aut
hori
ty's
cov
ered
-em
ploy
ee p
ayro
ll15
,612
$
15
,415
$
14
,664
$
14
,241
$
14
,321
$
14
,214
$
14
,296
$
15
,282
$
14
,676
$
15
,181
$
Con
trib
utio
ns a
s a
perc
enta
ge o
f co
vere
d-em
ploy
ee p
ayro
ll12
.00%
13.5
0%14
.00%
14.5
0%14
.00%
14.5
0%12
.50%
11.0
0%10
.50%
10.5
0%
WE
ST
VIR
GIN
IA P
AR
KW
AY
S A
UT
HO
RIT
Y
SC
HE
DU
LE
OF
PE
NS
ION
CO
NT
RIB
UT
ION
S
Jun
e 30
, 201
7
Pu
bli
c E
mp
loye
es R
etir
emen
t S
yste
mL
ast 1
0 F
isca
l Yea
rs
(In
Tho
usan
ds)
RE
QU
IRE
D S
UP
PL
EM
EN
TA
RY
IN
FO
RM
AT
ION
49

WEST VIRGINIA PARKWAYS AUTHORITY (A Component Unit of the State of West Virginia)
NOTE TO REQUIRED SUPPLEMENTARY INFORMATION Year Ended June 30, 2017
Amounts reported during the year ended June 30, 2017 reflect an assumed inflation rate of 3.0% rather than an assumed rate of 1.9% that was used in the prior year. There were no other factors that affected trends in the amounts reported. If necessary, additional information can be obtained from the CPRB Comprehensive Annual Financial Report for the year ended June 30, 2016.
50

Statistical Section
West Virginia Parkways Authority
51

Statistical Section This part of the West Virginia Parkways Authority’s Comprehensive Annual Financial Report presents detailed information as a context for understanding what the information in the financial statements, note disclosures, and required supplementary information say about the Authority’s overall financial health. Contents _________________________________________________________________ Page Financial Trends ........................................................................................................................ 53 These schedules contain trend information to help the reader understand how the Authority’s financial performance and well-being have changed over time. Debt Capacity ............................................................................................................................. 55 These schedules contain trend information to help the reader understand the Authority’s outstanding debt, the capacity to repay that debt, and the ability to issue additional debt in the future. Revenue Capacity....................................................................................................................... 57 This schedule contains trend information to help the reader understand the Authority’s capacity to earn revenues and the primary sources of those revenues. Demographic and Economic Information ............................................................................... 58 These schedules offer indicators to help the reader understand the environment within which the Authority’s financial activities take place and to help make comparisons. Miscellaneous Statistics ............................................................................................................. 60 This information may provide the reader with more insight into the Authority’s financial history and operating environment.
52

2017
2016
2015
2014
2013
2012
2011
2010
2009
2008
AS
SE
TS
AN
D D
EF
ER
RE
D O
UT
FL
OW
S O
F R
ES
OU
RC
ES
Cur
rent
ass
ets
68,6
01$
61,0
88$
61,7
74$
53,6
78$
49,5
13$
42,2
59$
62,3
91$
48,6
26$
29,2
62$
18,6
33$
Lon
g-te
rm in
vest
men
ts27
,806
25
,603
22
,989
26
,240
20
,401
24
,528
8,
662
11,8
94
15,4
08
27,5
89
Cap
ital
ass
ets,
net
451,
041
453,
833
45
8,29
2
458,
490
47
0,88
9
470,
161
46
6,39
8
472,
092
48
4,03
8
506,
746
Def
erre
d ou
tflo
ws
of r
esou
rces
8,12
6
7,
402
7,66
3
7,
603
9,71
7
12
,481
13
,046
-
-
-
Tot
al a
sset
s pl
us d
efer
red
outf
low
s of
res
ourc
es55
5,57
4$
54
7,92
6$
550,
718
$
54
6,01
1$
550,
520
$
54
9,42
9$
550,
497
$
53
2,61
2$
528,
708
$
55
2,96
8$
LIA
BIL
ITIE
S, D
EF
ER
RE
D I
NF
LO
WS
OF
RE
SO
UR
CE
S A
ND
NE
T P
OS
ITIO
N
Cur
rent
liab
ilit
ies
21,3
67$
18,7
20$
24,7
04$
20,6
89$
22,3
63$
18,3
56$
21,5
16$
20,6
97$
15,7
53$
16,4
43$
Lon
g-te
rm r
even
ue b
onds
, net
10,5
23
20,4
79
29,9
39
39,0
84
47,7
75
55,8
36
63,8
81
62,2
54
73,7
54
80,7
63
Oth
er lo
ng-t
erm
liab
ilit
ies
21,4
65
17,0
33
14,4
95
10,0
39
9,90
1
9,
522
6,90
8
4,
415
1,86
8
1,
638
Def
erre
d in
flow
s of
res
ourc
es1,
201
3,59
5
6,
463
3,31
6
4,
489
6,31
4
5,
938
-
-
-
Tot
al li
abil
itie
s pl
us d
efer
red
infl
ows
of r
esou
rces
54,5
56
59,8
27
75,6
01
73,1
28
84,5
28
90,0
28
98,2
43
87,3
66
91,3
75
98,8
44
Net
pos
itio
n:
Net
inve
stm
ent i
n ca
pita
l ass
ets
432,
154
426,
447
42
2,70
4
415,
153
42
0,43
2
412,
527
40
8,15
7
402,
069
40
1,73
5
416,
812
R
estr
icte
d by
trus
t ind
entu
re a
nd tr
i-pa
rty
agre
emen
t65
,834
58
,626
51
,094
56
,020
43
,824
45
,127
40
,961
39
,570
30
,175
32
,096
Unr
estr
icte
d3,
030
3,02
6
1,
319
1,71
0
1,
736
1,74
7
3,
136
3,60
7
5,
423
5,21
6
Tot
al n
et p
osit
ion
501,
018
488,
099
47
5,11
7
472,
883
46
5,99
2
459,
401
45
2,25
4
445,
246
43
7,33
3
454,
124
Tot
al li
abil
itie
s, d
efer
red
infl
ows
of r
esou
rces
and
net
pos
itio
n55
5,57
4$
54
7,92
6$
550,
718
$
54
6,01
1$
550,
520
$
54
9,42
9$
550,
497
$
53
2,61
2$
528,
708
$
55
2,96
8$
Yea
r E
nded
Jun
e 30
,
WE
ST
VIR
GIN
IA P
AR
KW
AY
S A
UT
HO
RIT
Y
CO
ND
EN
SE
D S
CH
ED
UL
ES
OF
NE
T P
OS
ITIO
N
(In
Tho
usan
ds)
Sou
rce:
Wes
t Vir
gini
a P
arkw
ays
Aut
hori
ty
53

2017
2016
2015
2014
2013
2012
2011
2010
2009
2008
Ope
rati
ng r
even
ues:
Tol
l rev
enue
s92
,739
$
93,5
79$
88,6
97$
84,9
07$
83,5
19$
83,9
07$
81,9
60$
79,8
71$
53,3
41$
56,5
63$
Oth
er r
even
ues
7,37
0
7,40
4
6,
797
6,74
9
6,
944
7,21
7
7,
010
7,08
7
6,
923
7,45
9
100,
109
100,
983
95
,494
91
,656
90
,463
91
,124
88
,970
86
,958
60
,264
64
,022
Ope
rati
ng e
xpen
ses:
Mai
nten
ance
24,5
46
24
,791
25
,488
23
,028
21
,907
22
,337
23
,827
21
,287
17
,664
17
,448
T
oll c
olle
ctio
n9,
857
9,
566
9,27
3
9,
826
10,3
32
11,4
11
10,9
84
11,0
58
10,2
07
10,1
17
Tra
ffic
enf
orce
men
t3,
231
3,
172
3,91
2
3,
487
3,58
1
3,
744
3,18
8
2,
650
2,97
3
2,
815
Gen
eral
and
adm
inis
trat
ive
10,3
08
11
,248
9,
093
9,15
4
9,
159
9,59
0
9,
446
9,60
5
9,
022
9,89
6
D
epre
ciat
ion
37,3
18
36
,929
35
,357
36
,294
35
,595
32
,924
32
,227
31
,160
31
,406
31
,064
85,2
60
85
,706
83
,123
81
,789
80
,574
80
,006
79
,672
75
,760
71
,272
71
,340
Ope
rati
ng in
com
e (l
oss)
14,8
49
15
,277
12
,371
9,
867
9,88
9
11
,118
9,
298
11,1
98
(11,
008)
(7
,318
)
Non
oper
atin
g re
venu
es (
expe
nses
):
Net
inve
stm
ent r
even
ue28
0
33
6
338
30
2
122
24
2
355
1,
377
1,30
7
2,
293
Inte
rgov
ernm
enta
l-
-
-
-
-
-
2,83
4
99
3
-
-
In
tere
st e
xpen
se(2
,210
)
(2,6
31)
(2
,784
)
(3
,278
)
(3
,420
)
(4,2
13)
(4,6
30)
(5,6
55)
(7,0
90)
(7
,330
)
O
n-be
half
con
trib
utio
ns-
-
-
-
-
-
-
-
-
49
6
(1,9
30)
(2
,295
)
(2,4
46)
(2,9
76)
(3,2
98)
(3
,971
)
(1
,441
)
(3
,285
)
(5
,783
)
(4,5
41)
Cha
nge
in n
et p
osit
ion
12,9
19
12
,982
9,
925
6,89
1
6,
591
7,14
7
7,
857
7,91
3
(1
6,79
1)
(11,
859)
Cum
ulat
ive
effe
ct o
f im
plem
enta
tion
of
GA
SB
Sta
tem
ent 6
8 (2
015)
, 65
(201
1), a
nd 4
3 (2
008)
-
-
(7,6
91)
-
-
-
(8
49)
-
-
2,55
7
Net
pos
itio
n, b
egin
ning
of
year
488,
099
475,
117
47
2,88
3
465,
992
45
9,40
1
45
2,25
4
445,
246
43
7,33
3
454,
124
463,
426
Net
pos
itio
n, e
nd o
f ye
ar50
1,01
8$
48
8,09
9$
475,
117
$
47
2,88
3$
465,
992
$
459,
401
$
45
2,25
4$
445,
246
$
43
7,33
3$
45
4,12
4$
(In
Tho
usan
ds)
Yea
r E
nded
Jun
e 30
,
WE
ST
VIR
GIN
IA P
AR
KW
AY
S A
UT
HO
RIT
Y
CO
ND
EN
SE
D S
CH
ED
UL
ES
OF
RE
VE
NU
ES
, EX
PE
NS
ES
AN
D C
HA
NG
ES
IN N
ET
PO
SIT
ION
Sou
rce:
Wes
t Vir
gini
a P
arkw
ays
Aut
hori
ty
54

2017
2016
2015
2014
2013
2012
2011
2010
2009
2008
Lon
g-te
rm s
erie
s 20
01 r
even
ue b
onds
to to
tal a
sset
s pl
us
defe
rred
out
flow
s of
res
ourc
es0.
00%
0.00
%0.
00%
0.00
%0.
00%
0.00
%0.
00%
0.00
%0.
99%
1.10
%L
ong-
term
ser
ies
2002
rev
enue
bon
ds to
tota
l ass
ets
plus
de
ferr
ed o
utfl
ows
of r
esou
rces
0.65
%1.
28%
1.85
%2.
43%
3.10
%3.
63%
4.14
%4.
08%
4.52
%4.
67%
Lon
g-te
rm s
erie
s 20
03 r
even
ue b
onds
to to
tal a
sset
s pl
us
defe
rred
out
flow
s of
res
ourc
es0.
00%
0.00
%0.
00%
0.00
%0.
00%
0.00
%0.
00%
0.00
%0.
00%
8.83
%L
ong-
term
ser
ies
2008
rev
enue
bon
ds to
tota
l ass
ets
plus
de
ferr
ed o
utfl
ows
of r
esou
rces
1.21
%2.
39%
3.49
%4.
60%
5.58
%6.
53%
7.46
%7.
61%
8.44
%0.
00%
Tot
al lo
ng-t
erm
rev
enue
bon
ds to
tota
l ass
ets
plus
def
erre
d ou
tflo
ws
of r
esou
rces
1.85
%3.
67%
5.34
%7.
03%
8.68
%10
.16%
11.6
0%11
.69%
13.9
5%14
.60%
Net
pos
itio
n to
tota
l ass
ets
plus
def
erre
d ou
tflo
ws
of r
esou
rces
90
.18%
89.0
8%86
.27%
86.6
1%84
.65%
83.6
1%82
.15%
83.6
0%82
.72%
82.1
2%
Lon
g-te
rm b
onds
to la
ne m
iles
24.1
447
.16
69.0
190
.13
112.
1513
1.07
149.
9614
6.14
173.
1318
9.58
Lon
g-te
rm b
onds
to n
umbe
r of
tran
sact
ions
/veh
icle
s0.
280.
540.
821.
101.
391.
391.
621.
812.
192.
34
Yea
r E
nded
Jun
e 30
,
WE
ST
VIR
GIN
IA P
AR
KW
AY
S A
UT
HO
RIT
Y
FIN
AN
CIA
L R
AT
IOS
Sou
rce:
Wes
t Vir
gini
a P
arkw
ays
Aut
hori
ty
55

2017
2016
2015
2014
2013
2012
2011
2010
2009
2008
Rev
enue
s:T
oll r
even
ues
92,7
39$
93,5
79$
88,6
97$
84,9
07$
83,5
19$
83
,907
$
81
,960
$
79
,871
$
53
,341
$
56
,563
$
A
djus
tmen
t to
toll
reve
nues
per
Tru
st I
nden
ture
s(3
03)
(356
)
(7
2)
(177
)
(8
1)
(3
33)
480
(683
)
20
0
12
7
Tot
al r
even
ues
92,4
36
93,2
23
88,6
25
84,7
30
83,4
38
83
,574
82
,440
79
,188
53
,541
56
,690
Ope
rati
ng e
xpen
ses
85,2
60
85,7
06
83,1
23
81,7
89
80,5
74
80
,006
79
,496
75
,760
71
,272
71
,340
A
djus
tmen
ts to
ope
rati
ng e
xpen
ses
per
Tru
st I
nden
ture
s:D
epre
ciat
ion
(37,
318)
(36,
929)
(35,
357)
(36,
294)
(35,
595)
(32,
924)
(32,
227)
(31,
160)
(31,
406)
(31,
064)
Ren
ewal
and
rep
lace
men
t pro
vide
d fo
r by
res
erve
s(2
,031
)
(2,7
01)
(2
,476
)
(3,1
39)
(2
,789
)
(2,8
88)
(3
,280
)
(2,6
17)
(2
,963
)
(2,7
14)
E
cono
mic
dev
elop
men
t and
tour
ism
cos
ts(4
,931
)
(4,8
99)
(4
,850
)
(5,0
87)
(5
,132
)
(6,7
48)
(5
,000
)
(5,1
02)
(5
,020
)
(5,5
90)
O
ther
641
(2,0
54)
46
4
1,
801
(1
,286
)
(2,4
03)
(3
,098
)
(3,7
47)
(9
75)
(789
)
Tot
al o
pera
ting
exp
ense
s41
,621
39
,123
40
,904
39
,070
35
,772
35,0
43
35,8
91
33,1
34
30,9
08
31,1
83
Net
rev
enue
s av
aila
ble
for
debt
ser
vice
50,8
15$
54,1
00$
47,7
21$
45,6
60$
47,6
66$
48
,531
$
46
,549
$
46
,054
$
22
,633
$
25
,507
$
Rev
enue
bon
d co
vera
ge it
ems:
Tot
al d
ebt s
ervi
ce10
,760
10
,755
10
,577
10
,529
11
,186
10,5
41
10,5
15
10,6
70
12,2
18
11,8
52
Ren
ewal
and
rep
lace
men
t res
erve
req
uire
men
tpe
r re
com
men
dati
on o
f co
nsul
ting
eng
inee
r12
,553
13
,952
11
,187
11
,163
10
,280
11,1
28
8,67
3
8,74
3
10,0
77
9,07
3
Tot
al d
ebt s
ervi
ce a
nd r
enew
al a
nd r
epla
cem
ent
23,3
13$
24,7
07$
21,7
64$
21,6
92$
21,4
66$
21
,669
$
19
,188
$
19
,413
$
22
,295
$
20
,925
$
Cov
erag
e pe
rcen
tage
s:T
otal
deb
t ser
vice
(15
0% r
equi
red
sinc
e 20
02,
125%
pre
viou
sly
requ
ired
) (1
)47
2.26
%50
3.02
%45
1.18
%43
3.66
%42
6.12
%46
0.40
%44
2.69
%43
1.62
%18
5.24
%21
5.21
%
Tot
al d
ebt s
ervi
ce a
nd r
enew
al a
nd r
epla
cem
ent
per
reco
mm
enda
tion
of
cons
ulti
ng e
ngin
eer
(100
% r
equi
red)
217.
97%
218.
97%
219.
27%
210.
49%
222.
05%
223.
97%
242.
59%
237.
23%
101.
52%
121.
90%
(In
Tho
usan
ds)
WE
ST V
IRG
INIA
PA
RK
WA
YS
AU
TH
OR
ITY
RE
VE
NU
E B
ON
D C
OV
ER
AG
E (
1)
Yea
r E
nded
Jun
e 30
(1) O
n March 11, 1993,$111,245,000
of Series 1
989 Re
venu
e Bo
nds w
ere refund
ed with
1993 Serie
s Reven
ue Bon
ds issued
und
er a Trust Inde
nture da
ted Februa
ry 15, 1993. On Februa
ry 1, 2002,
$36,036,000 of th
e Serie
s 1993 Re
venu
e bo
nds w
ere refund
ed with
the 2002
Series R
even
ue Bon
ds issued
und
er a Trust Inde
nture da
ted Februa
ry 1, 2002. On Februa
ry 18, 2003, $61,280,000
of the
Series
1993
Reven
ue bon
ds were refund
ed with
the Serie
s 2003 Va
riable Ra
te Dem
and Re
fund
ing Bo
nds issue
d un
der a
Trust Inde
nture da
ted Februa
ry 18, 2003. During fiscal year 2
009, th
e Serie
s 2003 Bo
nds
were refund
ed by the Serie
s 2008 Va
riable Ra
te Dem
and Re
fund
ing Bo
nds issue
d un
der a
Sup
plem
ental Trust Inde
nture da
ted July 2, 2008. The
revenu
e bo
nd co
verage re
quire
men
ts increased to 150% from
125%
und
er th
e 2003
trust ind
enture and
remain un
der the
2008 trust ind
enture at 1
50%. The
abo
ve presentation for e
ach of th
eten years e
nded
June
30, 2017, re
lates o
nly to deb
t service re
quire
men
ts
unde
r the
1993, 2002, 2003, and
2008 Trust Ind
entures. Und
er th
e term
s of the
se trust ind
entures, re
venu
es available for d
ebtservice are com
prise
d of collected
toll revenu
es less ope
ratin
g expe
nses,
exclusive of dep
reciation, other co
sts fun
ded by
bon
d proceeds or d
esigna
ted establish
ed re
serves and
accruals, and
furthe
r red
uced
by capital expen
ditures fun
ded by
amou
nts o
ther th
an bon
d proceeds.
Sou
rce:
Wes
t Vir
gini
a P
arkw
ays
Aut
hori
ty
56

2017
2016
2015
2014
2013
2012
2011
2010
2009
2008
Num
ber
of tr
ansa
ctio
ns:
Pas
seng
er c
ars
29,1
46
28
,924
28
,006
27
,154
26
,934
27
,549
27
,140
27
,043
26
,511
26
,413
C
omm
eric
al v
ehic
les
8,25
0
8,05
7
7,
890
7,62
1
7,
462
7,51
5
7,
328
7,32
9
7,
098
8,01
8
Tot
al tr
ansa
ctio
ns37
,396
36,9
81
35,8
96
34,7
75
34,3
96
35,0
64
34,4
68
34,3
72
33,6
09
34,4
31
ET
C p
enet
rati
on r
ate
- tr
ansa
ctio
ns38
.83%
37.2
4%36
.54%
35.7
0%34
.20%
32.6
9%30
.16%
29.0
0%26
.25%
26.3
0%
Num
ber
of m
iles
:P
asse
nger
car
s68
0,26
1
67
6,65
1
651,
789
62
9,90
8
623,
890
639,
854
63
4,05
3
633,
550
61
6,63
3
60
1,89
1
Com
mer
cial
veh
icle
s33
6,06
7
32
8,14
6
320,
245
30
8,08
2
300,
589
302,
644
29
6,47
3
297,
710
28
5,68
9
32
2,68
3
Tot
al m
iles
1,01
6,32
8
1,00
4,79
7
97
2,03
4
937,
990
92
4,47
9
94
2,49
8
930,
526
93
1,26
0
902,
322
924,
574
Tot
al r
even
ues:
Pas
seng
er c
ars
48,8
47$
50
,333
$
46
,309
$
44
,032
$
43
,429
$
43
,280
$
42
,066
$
40
,685
$
26
,584
$
26
,381
$
Com
mer
cial
veh
icle
s43
,892
43,2
46
42,3
88
40,8
75
40,0
90
40,6
27
39,8
94
39,1
86
26,7
57
30,1
82
Tot
al to
ll r
even
ues
92,7
39$
93
,579
$
88
,697
$
84
,907
$
83
,519
$
83
,907
$
81
,960
$
79
,871
$
53
,341
$
56
,563
$
ET
C p
enet
rati
on r
ate
- re
venu
e45
.66%
43.6
3%42
.15%
40.8
0%39
.09%
36.7
0%35
.60%
33.3
7%35
.06%
35.2
0%
Tol
l rev
enue
per
tran
sact
ion:
Pas
seng
er c
ars
1.68
$
1.74
$
1.
65$
1.62
$
1.
61$
1.
57$
1.55
$
1.
50$
1.00
$
1.00
$
C
omm
erci
al v
ehic
les
5.32
5.37
5.
37
5.36
5.
37
5.
41
5.44
5.
35
3.77
3.76
Tol
l rev
enue
per
mil
e:P
asse
nger
car
s0.
072
$
0.
074
$
0.07
1$
0.
070
$
0.07
0$
0.
068
$
0.06
6$
0.
064
$
0.04
3$
0.
044
$
Com
mer
cial
veh
icle
s0.
131
0.
132
0.13
2
0.
133
0.13
3
0.
134
0.13
4
0.
132
0.09
4
0.
094
Mil
es p
er tr
ansa
ctio
n:
Pas
seng
er c
ars
23
23
23
23
23
23
23
23
23
23
Com
mer
cial
veh
icle
s41
41
41
40
40
40
40
41
40
40
Yea
r E
nded
Jun
e 30
,
WE
ST
VIR
GIN
IA P
AR
KW
AY
S A
UT
HO
RIT
Y
TR
AF
FIC
ST
AT
IST
ICS
(In
Tho
usan
ds, e
xcep
t per
tran
sact
ion
and
per
mil
e am
ount
s)
Sou
rce:
Wes
t Vir
gini
a P
arkw
ays
Aut
hori
ty
57

2017
2016
2015
2014
2013
2012
2011
2010
2009
2008
Per
man
ent e
mpl
oyee
sT
oll
154
156
16
0
156
16
0
160
16
2
168
16
1
163
M
aint
enan
ce15
9
14
7
145
14
6
141
14
0
141
14
3
147
14
4
Oth
er61
60
55
57
53
53
55
49
49
59
374
363
36
0
359
35
4
353
35
8
360
35
7
366
Tem
pora
ry75
76
74
78
43
98
82
69
36
65
Lea
sed
empl
oyee
sS
tate
pol
ice
30
28
28
29
31
31
27
23
24
25
T
amar
ack
134
144
13
2
147
14
9
146
14
6
139
13
9
135
Sou
rce:
Wes
t Vir
gini
a P
arkw
ays
Aut
hori
ty
2017
2016
2015
2014
2013
2012
2011
2010
2009
2008
Num
ber
of f
atal
itie
s8
7
5
1
8
7
7
6
9
4
F
atal
ity
rate
per
100
mil
lion
mil
es tr
avel
ed
0.8
0.
7
0.5
0.
1
0.9
0.
8
0.8
0.
6
1.0
0.
4
Pol
icin
g st
atis
tics
Arr
ests
6,06
5
10,4
45
9,60
4
10
,189
12
,019
10
,943
11
,033
6,
254
5,79
3
5,
959
War
ning
tick
ets
17,8
70
20,7
94
25,0
89
24,6
77
24,3
77
20,0
69
16,3
40
17,4
15
23,9
68
24,9
32
Ass
ists
to m
otor
ists
2,32
2
3,22
2
2,
948
2,91
4
3,
633
2,81
6
2,
382
2,08
3
2,
605
2,58
1
Sou
rce:
Wes
t Vir
gini
a P
arkw
ays
Aut
hori
ty
NU
MB
ER
OF
EM
PL
OY
EE
S
TR
AF
FIC
AC
CID
EN
T A
ND
PO
LIC
ING
ST
AT
IST
ICS
Yea
r E
nded
Jun
e 30
,
Yea
r E
nded
Jun
e 30
,
WE
ST
VIR
GIN
IA P
AR
KW
AY
S A
UT
HO
RIT
Y
58
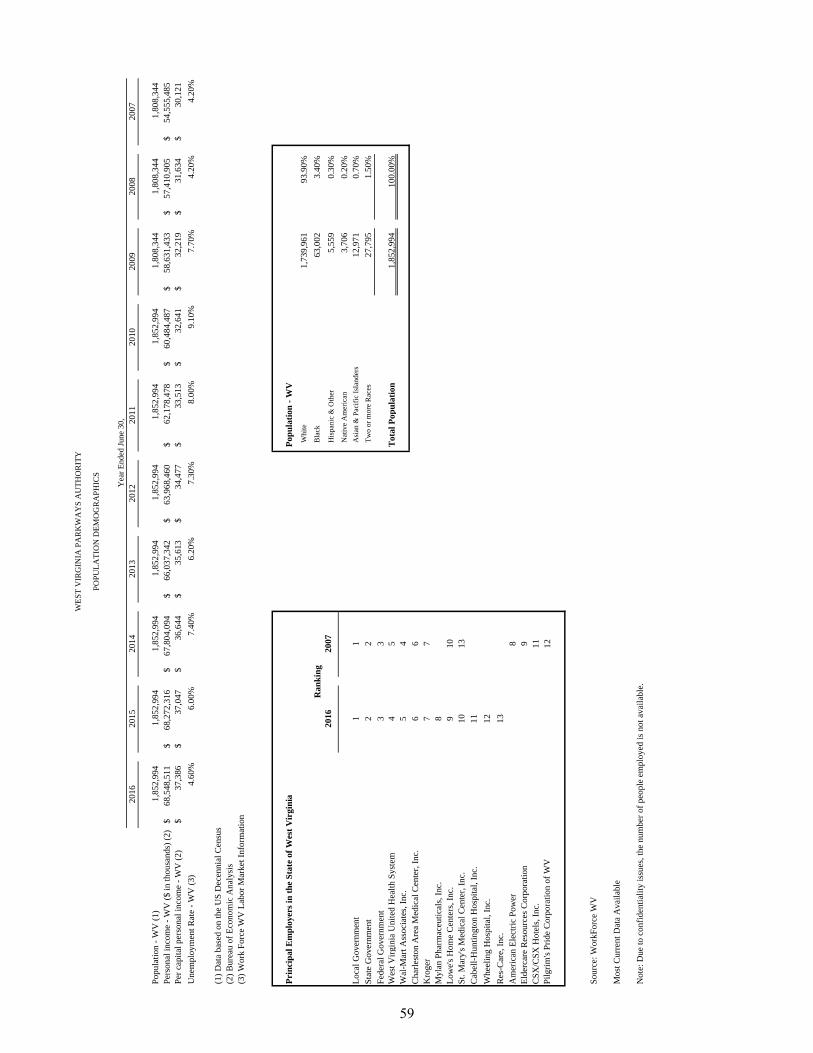
2016
2015
2014
2013
2012
2011
2010
2009
2008
2007
Pop
ulat
ion
- W
V (
1)1,
852,
994
1,85
2,99
4
1,
852,
994
1,85
2,99
4
1,
852,
994
1,85
2,99
4
1,85
2,99
4
1,
808,
344
1,80
8,34
4
1,
808,
344
Per
sona
l inc
ome
- W
V (
$ in
thou
sand
s) (
2)68
,548
,511
$
68
,272
,316
$
67
,804
,094
$
66
,037
,342
$
63
,968
,460
$
62
,178
,478
$
60,4
84,4
87$
58,6
31,4
33$
57,4
10,9
05$
54,5
55,4
85$
Per
cap
ital
per
sona
l inc
ome
- W
V (
2)37
,386
$
37
,047
$
36,6
44$
35,6
13$
34,4
77$
33
,513
$
32,6
41$
32,2
19$
31
,634
$
30
,121
$
Une
mpl
oym
ent R
ate
- W
V (
3)4.
60%
6.00
%7.
40%
6.20
%7.
30%
8.00
%9.
10%
7.70
%4.
20%
4.20
%
(1)
Dat
a ba
sed
on th
e U
S D
ecen
nial
Cen
sus
(2)
Bur
eau
of E
cono
mic
Ana
lysi
s(3
) W
ork
For
ce W
V L
abor
Mar
ket I
nfor
mat
ion
Pri
nci
pal
Em
plo
yers
in t
he
Sta
te o
f W
est
Vir
gin
iaP
opu
lati
on -
WV
Whi
te1,
739,
961
93.9
0%
Bla
ck63
,002
3.40
%20
1620
07H
ispa
nic
& O
ther
5,55
9
0.
30%
Nat
ive
Am
eric
an3,
706
0.20
%L
ocal
Gov
ernm
ent
11
Asi
an &
Pac
ific
Isl
ande
rs12
,971
0.70
%
Sta
te G
over
nmen
t2
2T
wo
or m
ore
Rac
es27
,795
1.50
%
Fed
eral
Gov
ernm
ent
33
Wes
t Vir
gini
a U
nite
d H
ealt
h S
yste
m4
5T
otal
Pop
ula
tion
1,85
2,99
4
10
0.00
%W
al-M
art A
ssoc
iate
s, I
nc.
54
Cha
rles
ton
Are
a M
edic
al C
ente
r, I
nc.
66
Kro
ger
77
Myl
an P
harm
aceu
tica
ls, I
nc.
8L
owe'
s H
ome
Cen
ters
, Inc
.9
10S
t. M
ary'
s M
edic
al C
ente
r, I
nc.
1013
Cab
ell-
Hun
ting
ton
Hos
pita
l, In
c.11
Whe
elin
g H
ospi
tal,
Inc.
12
Res
-Car
e, I
nc.
13
Am
eric
an E
lect
ric
Pow
er8
Eld
erca
re R
esou
rces
Cor
pora
tion
9C
SX
/CS
X H
otel
s, I
nc.
11P
ilgr
im's
Pri
de C
orpo
rati
on o
f W
V12
Sou
rce:
Wor
kFor
ce W
V
Mos
t Cur
rent
Dat
a A
vail
able
Not
e: D
ue to
con
fide
ntia
lity
issu
es, t
he n
umbe
r of
peo
ple
empl
oyed
is n
ot a
vail
able
.
Ran
kin
g
Yea
r E
nded
Jun
e 30
,
WE
ST
VIR
GIN
IA P
AR
KW
AY
S A
UT
HO
RIT
Y
PO
PU
LA
TIO
N D
EM
OG
RA
PH
ICS
59

WEST VIRGINIA PARKWAYS AUTHORITY
Significant Dates
June 30, 2017
February 1947 West Virginia Turnpike Commission created by State Legislature October 1949 West Virginia Turnpike Commission organized April 1952 $96 million revenue bonds issued to construct Turnpike August 1952 Groundbreaking April 1954 $37 million revenue bonds issued September 1954 36 miles of Turnpike opened (Princeton to Beckley) November 1954 Final 52 miles of Turnpike opened (Beckley to Charleston) August 1971 Tri-Party Agreement of 1971 May 1973 Commenced first contract for upgrade to interstate standards December 1979 Interest paid up-to-date on 1952 and 1954 bonds for first time October 1982 First bonds retired from 1952 and 1954 issues September 1987 Final upgrade to interstate standards July 1988 Final segment of I-64 completed December 1988 Tri-Party Agreement of 1988 June 1989 West Virginia Parkways, Economic Development and Tourism
Authority created to succeed the West Virginia Turnpike Commission by State Legislature
November 1989 Issued $143 million of Revenue Bonds November 1989 Removed side toll charges April 1990 Implemented commuter passes at North Beckley March 1991 The GFOA awarded the Authority a Certificate of Achievement for
Excellence in Financial Reporting for the Authority’s first component unit financial report for the year ended June 30, 1990
60

WEST VIRGINIA PARKWAYS AUTHORITY
Significant Dates (Continued)
June 30, 2017
March 1993 Issued $118 million of Series 1993 Revenue Refunding Bonds resulting in approximately $5.2 million in net present value savings
January 1994 Implemented Parkways Authority Commuter (“PAC”) card program December 1994 Issued $9 million of Series 1994 Raleigh County, West Virginia
Commercial Development Revenue Bonds to partially finance construction of TAMARACK-The Best of West Virginia arts and crafts center
May 1996 Opened TAMARACK-The Best of West Virginia and the new Beckley
Interchange (Exit 45) December 1999 New Electronic Toll Collection System with E-ZPass interoperability
through Inter Agency Group membership began operations at the Ghent toll facility. The remaining mainline toll facilities began operation in January 2000 and North Beckley began operations in March 2000
December 2001 Issued $5.7 million of Series 2001A Taxable Commercial Development
Refunding Revenue Bonds and $5.9 million of Series 2001B Commercial Development Bonds to advance refund series 1994 and 1996 Bonds and to construct Educational, Cultural, and Banquet facilities at the Caperton Center
February 2002 Issued $44.2 million of Series 2002 Refunding Revenue Bonds to advance
refund for savings $36 million of Series 1993 Bonds February 2003 Issued $63.9 million of Series 2003 Variable Rate Demand Revenue
Refunding Bonds to advance refund for savings $61.3 million of Series 1993 Bonds
June 2003 Opened Tamarack Conference Center February 2004 Passage of House Bill #4033 raising bonding capacity to $200 million November 2004 Celebrated 50th Anniversary of the WV Turnpike January 1, 2006 Tolls Increased for first time since 1981 February 14, 2006 Court orders Preliminary Injection to roll tolls back to December 31, 2005
levels. Parkways Board passes resolution to roll tolls back
61

WEST VIRGINIA PARKWAYS AUTHORITY
Significant Dates (Continued)
June 30, 2017
March 11, 2006 Senate Bill #557 passes Legislature that restricts bonding authority, requires public notice and hearings for future toll or rate increases, requires discount program prior to any increase in rates
April 2007 Board adopted Resolution to refocus the core mission of the Parkways
Authority to maintenance and upkeep of the Turnpike September 2007 Board adopted Resolution concerning the toll tax deduction pursuant to
Senate Bill #2001. WV Citizens who participate in the E-ZPass non-commercial commuter pass program are able to deduct from adjusted gross income up to $1,200 per year on their state income tax return for taxable years beginning on or after January 1, 2007 (minimum amount eligible for deduction is $25)
July 2008 Issued $59.1 million of Series 2008 Variable Rate Demand Revenue
Refunding Bonds to advance refund for savings $59.1 million of Series 2003 Bonds
August 2009 Adopted new toll rate schedule, the first increase in 28 years. Cash toll rates
increased 60%. Discounts were given to E-ZPass users July 2010 Renamed and reorganized as the West Virginia Parkways Authority December 2011 Completed upgrade of electronic toll collection system April 2012 Board approval of the final Incident Management Plan including use of new
detour system and barrier wall gates
Source: West Virginia Parkways Authority
62
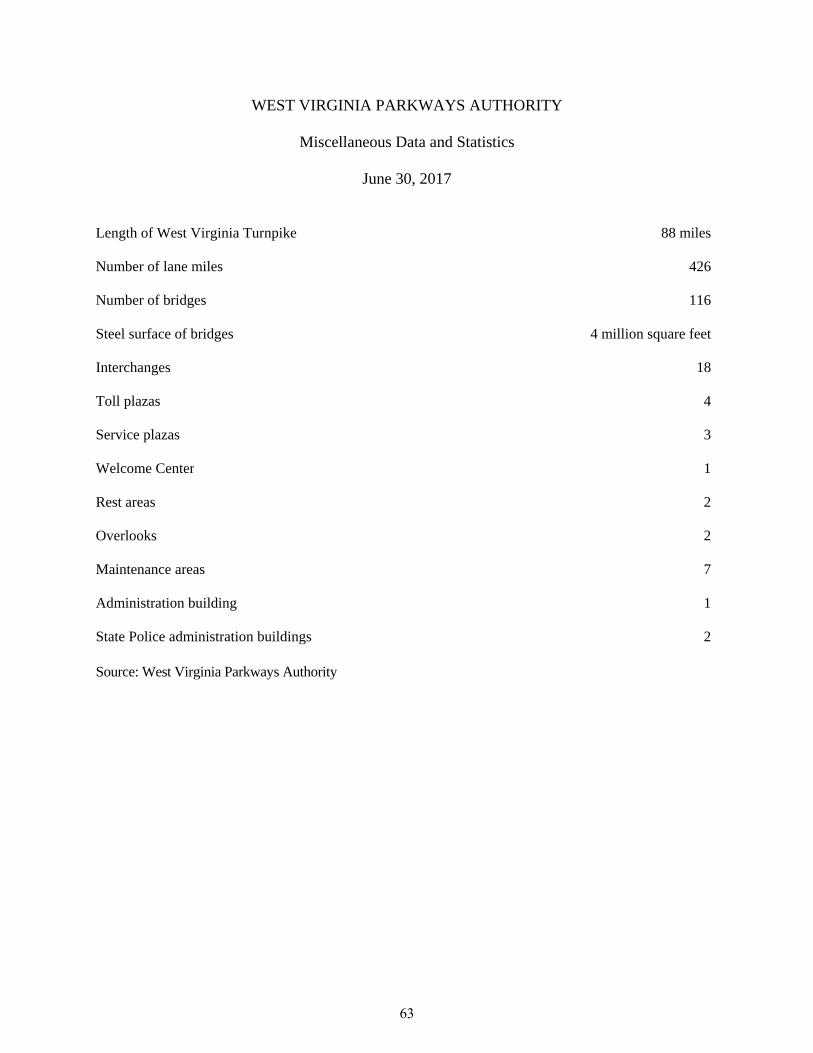
WEST VIRGINIA PARKWAYS AUTHORITY
Miscellaneous Data and Statistics
June 30, 2017
Length of West Virginia Turnpike 88 miles Number of lane miles 426 Number of bridges 116 Steel surface of bridges 4 million square feet Interchanges 18 Toll plazas 4 Service plazas 3 Welcome Center 1 Rest areas 2 Overlooks 2 Maintenance areas 7 Administration building 1 State Police administration buildings 2 Source: West Virginia Parkways Authority
63

WEST VIRGINIA PARKWAYS AUTHORITY
Toll Rates and Vehicle Classifications
June 30, 2017
Cash Rate Toll Mainline Corridor "L" Class Axles Description Plazas (U.S. Route 119) 1* 2 Passenger car $ 2.00 $ 0.40 2* 3+ Passenger car with trailer 2.50 0.80 3 2/3 Motor home 2.50 0.80 4 3+ Motor home with trailer 3.25 1.20 5 2 2-Axle, dual tire trucks, RVs and buses 3.25 0.80 6 3 3-Axle trucks and buses 4.50 1.20 7 4 4-Axle trucks and semi-trailers 6.50 1.60 8 5 5-Axle trucks and semi-trailers 6.75 1.60 9 6+ 6-Axle trucks and semi-trailers 9.50 2.40 10 - Oversize trucks 12.00 7.20 * Vehicle must be less than 7'6" in height. Passenger cars include station wagons, pickups, vans, panel
trucks, recreational vehicles, sport utility vehicles, motorcycles, and other two axle single-tired trucks.
DISCOUNT PLANS Personal Discount (Plan #1) - Formerly the Parkways Authority Commuter Card is available for noncommercial passenger cars and pickup trucks at $100 per year per mainline toll plaza, which includes the Corridor "L" Ramp Plaza, or $5 per year for the Corridor "L" Ramp Plaza only. A discount is allowed when buying an annual plan.
Plaza Location Fee Ghent (A) $25/quarter or $95/year Pax (B) $25/quarter or $95/year Chelyan (C) $25/quarter or $95/year Corridor "L" Ramp Plaza $5/year
Personal Discount (Plan #2) and Commercial Discount (Plan #3) - User prepays via a credit card or ACH and is issued an E-ZPass transponder ($25 fee to purchase transponder for commercial plan). The plan provides a 35% discount from the cash rate for mainline plazas for Toll Class 1 through 4 and a 20% discount for Toll Class 5 through 10. Commercial Discount (Plan #4) - For non-West Virginia issued E-ZPass and provides a 13% discount from the cash rate for mainline plazas for Toll Class 5 through 10. Source: West Virginia Parkways Authority
64

65


![TRANSMITTAL MEMORANDUM - Small Business …c] Audit Report 14-07...TRANSMITTAL MEMORANDUM . Report No. 14-07 ... In planning and perforn1ing our audit of the consolidated financial](https://img.dokumen.tips/doc/110x75/5b2b800d7f8b9a594c8b4fbc/transmittal-memorandum-small-business-c-audit-report-14-07transmittal-memorandum.jpg)