Embed Size (px)
Citation preview

WILLMAR
COMPREHENSIVE ANNUAL
FINANCIAL REPORT
DECEMBER 31, 2017

COMPREHENSIVE ANNUAL FINANCIAL
REPORT OF THE
CITY OF
WILLMAR, MINNESOTA
FOR THE
YEAR ENDED
DECEMBER 31, 2017
DIVISION OF FINANCE
STEVEN B. OKINS, DIRECTOR OF FINANCE MEMBER OF THE GOVERNMENT FINANCE OFFICERS
ASSOCIATION OF THE UNITED STATES AND CANADA & MINNESOTA FINANCE OFFICERS ASSOCIATION

CITY OF WILLMAR, MINNESOTA COMPREHENSIVE ANNUAL FINANCIAL REPORT
FOR THE FISCAL YEAR ENDED DECEMBER 31, 2017
TABLE OF CONTENTS
PAGE INTRODUCTORY SECTION List of Elected and Appointed Officials ............................................................................................................. i FINANCIAL SECTION-I Independent Auditor’s Report ........................................................................................................................... ii Independent Auditor’s Report on Internal Control Over Financial Reporting and on Compliance and Other Matters Based on an Audit of Financial Statements Performed in Accordance with Government Auditing Standards ................................................................................................................ iii Independent Auditor’s Report on Minnesota Legal Compliance ..................................................................... iv Schedule of Findings and Questioned Costs ..................................................................................................... v FINANCIAL SECTION-II Management’s Discussion and Analysis ........................................................................................................ 1 Basic Financial Statements: Government-Wide Financial Statements: Statement of Net Position .................................................................................................................... 11 Statement of Activities ........................................................................................................................ 13 Fund Financial Statements: Balance Sheet – Governmental Funds ................................................................................................. 15 Reconciliation of Net Position in the Government-Wide Financial Statements and Fund Balances in the Fund Basis Financial Statements ......................................................... 17 Statement of Revenues, Expenditures, and Changes in Fund Balances – Governmental Funds ................................................................................................... 18 Reconciliation of the Statement of Revenues, Expenditures, and Changes in Fund Balances of Governmental Funds to the Statement of Activities ......................................... 20 Statement of Revenues, Expenditures, and Changes in Fund Balances Budget to Actual – General Fund .................................................................................................. 21 Statement of Net Position – Proprietary Funds ................................................................................... 22
Statement of Revenues, Expenses, & Changes in Fund Net Position – Proprietary Funds ................ 23 Statement of Cash Flows – Proprietary Funds .................................................................................... 24 Notes to the Financial Statements ................................................................................................................ 26

CITY OF WILLMAR, MINNESOTA COMPREHENSIVE ANNUAL FINANCIAL REPORT
FOR THE FISCAL YEAR ENDED DECEMBER 31, 2017
TABLE OF CONTENTS (continued) PAGE FINANCIAL SECTION-II (continued) Required Supplementary Information: Individual Schedule of Revenue, Expenditures and Changes in Fund Balances – Budget and Actual: General Fund ....................................................................................................................................... 64 Industrial Development Special Revenue Fund .................................................................................. 69 Convention and Visitors’ Bureau Special Revenue Fund ................................................................... 70 Willmar Municipal Airport Special Revenue Fund ............................................................................. 71 Library Improvement Reserve Special Revenue Fund ........................................................................ 72 Community Investment Special Revenue Fund .................................................................................. 73 Public Works Reserve Special Revenue Fund .................................................................................... 74 Debt Service Funds/Special Assessments Bonds ................................................................................ 75 Debt Service Funds/Airport G.O. Revenue Bonds .............................................................................. 76 Debt Service Funds/Tax Increment Bonds .......................................................................................... 77 Schedules of Proportionate Share of Net Pension Liability and Employer Contributions – GERF ............... 78 Schedules of Proportionate Share of Net Pension Liability and Employer Contributions – PEPFF .............. 79 Schedule of Fund Progress – Other Post Employment Benefits ..................................................................... 80 Notes to the Required Supplementary Information ......................................................................................... 81 Other Supplementary Information: Combining Balance Sheet – Nonmajor Governmental Funds ........................................................................ 83 Combining Statement of Revenue, Expenditures and Changes in Fund Balances Nonmajor Governmental Funds ................................................................................................................ 84 Combining Balance Sheet – Nonmajor Special Revenue Funds ..................................................................... 85 Combining Statement of Revenue, Expenditures and Changes in Fund Balances – Nonmajor Special Revenue Funds ............................................................................................................ 86 Combining Balance Sheet – Nonmajor Capital Project Funds ....................................................................... 87 Combining Statement of Revenue, Expenditures and Changes in Fund Balances – Nonmajor Capital Project Funds ............................................................................................................................... 88 Combining Balance Sheet – Nonmajor Debt Service Funds ........................................................................... 89 Combining Statement of Revenue, Expenditures and Changes in Fund Balances – Nonmajor Capital Project Funds ............................................................................................................................... 90 Combining Statement of Net Position – Internal Service Funds ..................................................................... 91 Combining Statement of Revenues, Expenses, and Changes in Fund Net Position – Internal Service Funds ........................................................................................................................................... 92 Combining Statement of Cash Flows – Internal Service Funds ...................................................................... 93 Statement of Net Position – Fiduciary/Agency Fund ...................................................................................... 94 Statement of Revenues, Expenses and Changes in Fund Net Position – Fiduciary/Agency Fund ................. 95

CITY OF WILLMAR, MINNESOTA COMPREHENSIVE ANNUAL FINANCIAL REPORT
FOR THE FISCAL YEAR ENDED DECEMBER 31, 2017
TABLE OF CONTENTS (continued) PAGE STATISTICAL SECTION Capital Assets Used in the Operation of Governmental Funds: Comparative Schedules By Source ........................................................................................................... 96 Schedule of Changes by Function and Activity ........................................................................................ 97 Schedule By Function and Activity ........................................................................................................... 98 Government-Wide Information: Government-Wide Expenses By Function ................................................................................................ 99 Government-Wide Revenues ................................................................................................................... 100 Fund Information: General Governmental Expenditures by Function .................................................................................. 101 General Governmental Revenues by Source ........................................................................................... 102 Property Tax Levies and Collections ...................................................................................................... 103 Tax Capacities and Estimated Market Value of Taxable Property ......................................................... 104 Tax Capacity Rates – Direct and Overlapping Governments ................................................................. 106 Tax Levies – Direct and Overlapping Governments ............................................................................... 107 Principal Taxpayers ................................................................................................................................. 108 Special Assessments Billings and Collections ........................................................................................ 109 Computation of Legal Debt Margin ........................................................................................................ 110 Miscellaneous Statistics ........................................................................................................................... 111

CITY OF WILLMAR, MINNESOTA
INTRODUCTORY SECTION

COMPREHENSIVE ANNUAL FINANCIAL REPORT
CITY OF WILLMAR, MINNESOTA
2017
CITY COUNCIL
MARVIN CALVIN, MAYOR
COUNCIL MEMBERS:
FERNANDO ALVARADO RON CHRISTIANSON JULIE ASMUS RICK FAGERLIE SHAWN MUESKE AUDREY NELSEN ANDREW PLOWMAN KATHY SCHWANTES
FINANCE DIRECTOR
STEVEN B. OKINS
CITY ADMINISTRATOR
ISAAC HOLLAND i

CITY OF WILLMAR, MINNESOTA
FINANCIAL SECTION - I

ii
INDEPENDENT AUDITOR’S REPORT Honorable Mayor and Members of the City Council City of Willmar, Minnesota Report on the Financial Statements We have audited the accompanying financial statements of the governmental activities, the business-type activities, the aggregate discretely presented component units, each major fund, and the aggregate remaining fund information of the City of Willmar, Minnesota, as of and for the year ended December 31, 2017, and the related notes to the financial statements, which collectively comprise the City’s basic financial statements as listed in the table of contents. We did not audit the financial statements of Rice Memorial Hospital and Willmar Municipal Utilities, which are discretely presented component units. Those financial statements were audited by other auditors whose reports thereon have been furnished to us, and our opinion, in so far as it relates to the amounts included for Rice Memorial Hospital and Willmar Municipal Utilities is based on the reports of the other auditors. Management’s Responsibility for the Financial Statements Management is responsible for the preparation and fair presentation of these financial statements in accordance with accounting principles generally accepted in the United States of America; this includes the design, implementation, and maintenance of internal control relevant to the preparation and fair presentation of financial statements that are free from material misstatement, whether due to fraud or error. Auditor’s Responsibility Our responsibility is to express opinions on these financial statements based on our audit. We did not audit the financial statements of Rice Memorial Hospital and Willmar Municipal Utilities, which are discretely presented component units. Those financial statements were audited by other auditors whose reports thereon have been furnished to us, and our opinion, in so far as it relates to the amounts included for Rice Memorial Hospital and Willmar Municipal Utilities is based on the reports of the other auditors. We conducted our audit in accordance with auditing standards generally accepted in the United States of America and the standards applicable to financial audits contained in Government Auditing Standards issued by the Comptroller General of the United States. Those standards require that we plan and perform the audit to obtain reasonable assurance about whether the financial statements are free from material misstatement. The financial statements of Rice Memorial Hospital were not audited in accordance with Government Auditing Standards. An audit involves performing procedures to obtain audit evidence about the amounts and disclosures in the financial statements. The procedures selected depend on the auditor’s judgment, including the assessment of the risks of material misstatement of the financial statements, whether due to fraud or error. In making those risk assessments, the auditor considers internal control relevant to the entity’s preparation and fair presentation of the financial statements in order to design audit procedures that are appropriate in the circumstances, but

ii-1
not for the purpose of expressing an opinion on the effectiveness of the entity’s internal control. Accordingly, we express no such opinion. An audit also includes evaluating the appropriateness of accounting policies used and the reasonableness of significant accounting estimates made by management, as well as evaluating the overall presentation of the financial statements. We believe that the audit evidence we have obtained is sufficient and appropriate to provide a basis for our audit opinions. Opinions In our opinion, based on our audit and the report of the other auditors, the financial statements referred to above present fairly, in all material respects, the respective financial position of the governmental activities, the business -type activities, and the discretely presented component units, each major fund, and the aggregate remaining fund information of the City of Willmar, Minnesota, as of December 31, 2017, and the respective changes in financial position and, where applicable, cash flows thereof and the budgetary comparison for the General fund for the year then ended in accordance with accounting principles generally accepted in the United States of America. Other Matters Required Supplementary Information Accounting principles generally accepted in the United States of America require that the management’s discussion and analysis and required supplementary information as listed in the table of contents be presented to supplement the basic financial statements. Such information, although not a part of the basic financial statements, is required by the Governmental Accounting Standards Board who considers it to be an essential part of financial reporting for placing the basic financial statements in an appropriate operational, economic, or historical context. We and other auditors have applied certain limited procedures to the required supplementary information in accordance with auditing standards generally accepted in the United States of America , which consisted of inquiries of management about the methods of preparing the information and comparing the information for consistency with management’s responses to our inquiries, the basic financial statements, and other knowledge we obtained during our audit of the basic financial statements. We do not express an opinion or provide any assurance on the information because the limited procedures do not provide us with sufficient evidence to express an opinion or provide any assurance. Other Information Our audit was conducted for the purpose of forming opinions on the financial statements that collectively comprise the City of Willmar, Minnesota’s basic financial statements. The introductory section, combining and individual nonmajor fund financial statements and schedules, and statistical section are presented for purposes of additional analysis and are not a required part of the basic financial statements. The combining and individual nonmajor fund financial statements are the responsibility of management and were derived from and relate directly to the underlying accounting and other records used to prepare the basic financial statements. Such information has been subjected to the auditing procedures applied in the audit of the basic financial statements and certain additional procedures, including comparing and reconciling such information directly to the underlying accounting and other records used to prepare the basic financial statements or to the basic financial statements themselves, and other additional procedures in accordance with auditing standards generally accepted in the United States of America. In our opinion, the combining and
ii-2
individual nonmajor fund financial statements are fairly stated, in all material respects, in relation to the basic financial statements as a whole. The introductory and statistical sections have not been subjected to the auditing procedures applied in the audit of the basic financial statements, and accordingly, we do not express an opinion or provide any assurance on them. Other Reporting Required by Government Auditing Standards In accordance with Government Auditing Standards, we have also issued our report dated July 20, 2018 on our consideration of the City of Willmar, Minnesota’s internal control over financial reporting and on our tests of its compliance with certain provisions of laws, regulations, contracts, grant agreements, and other matters. The purpose of that report is to describe the scope of our testing of internal control over financial reporting and compliance and the results of that testing and not to provide an opinion on internal control over financial reporting or on compliance. That report is an integral part of an audit performed in accordance with Government Auditing Standards in considering the City of Willmar, Minnesota’s internal control over financial reporting and compliance. Westberg Eischens, PLLP Willmar, Minnesota July 20, 2018

iii
INDEPENDENT AUDITOR’S REPORT ON INTERNAL CONTROL OVER FINANCIAL REPORTING AND ON COMPLIANCE AND OTHER MATTERS BASED ON
AN AUDIT OF FINANCIAL STATEMENTS PERFORMED IN ACCORDANCE WITH GOVERNMENT AUDITING STANDARDS
Mayor and City Council City of Willmar, Minnesota We have audited, in accordance with the auditing standards generally accepted in the United States of America and the standards applicable to financial audits contained in Government Auditing Standards issued by the Comptroller General of the United States, the financial statements of the governmental activities, the business -type activities, the discretely presented component units, each major fund, and the aggregate remaining fund information of the City of Willmar, Minnesota, as of and for the year ended December 31, 2017, and the related notes to the financial statements, which collectively comprise the City of Willmar, Minnesota’s basic financial statements and have issued our report thereon dated July 20, 2018. Our report includes a reference to other auditors who audited the financial statements of Rice Memorial Hospital and Willmar Municipal Utilities, as described in our report on the City of Willmar, Minnesota’s financial statements. This report does not include the results of the other auditors’ testing of internal control over financial reporting or compliance and other matters that are reported on separately by those auditors. The financial statements of Rice Memorial Hospital were not audited in accordance with Government Auditing Standards. Internal Control Over Financial Reporting In planning and performing our audit of the financial statements, we considered the City of Willmar, Minnesota ’s internal control over financial reporting (internal control) to determine the audit procedures that are appropriate in the circumstances for the purpose of expressing our opinions on the financial statements, but not for the purpose of expressing an opinion on the effectiveness of the City of Willmar, Minnesota’s internal control. Accordingly, we do not express an opinion on the effectiveness of the Coty of Willmar, Minnesota’s internal control. A deficiency in internal control exists when the design or operation of a control does not allow management or employees, in the normal course of performing their assigned functions, to prevent, or detect and correct misstatements on a timely basis. A material weakness is a deficiency, or a combination of deficiencies, in internal control such that there is a reasonable possibility that a material misstatement of the entity’s financial statements will not be prevented, or detected and corrected on a timely basis. A significant deficiency is a deficiency, or a combination of deficiencies, in internal control that is less severe than a material weakness, yet important enough to merit attention by those charged with governance. Our consideration of internal control over financial reporting was for the limited purpose described in the preceding paragraph and was not designed to identify all deficiencies in internal control that might be material weaknesses or significant deficiencies and therefore, material weaknesses or significant deficiencies may exist

iii-1
that have not been identified. We did identify a deficiency in internal control described in the accompanying schedule of findings and recommendations as finding 2017-001, which we consider to be a material weakness. Compliance and Other Matters As part of obtaining reasonable assurance about whether the City of Willmar, Minnesota’s financial statements are free of material misstatement, we performed tests of its compliance with certain provisions of laws, regulations, contracts and grant agreements, noncompliance with which could have a direct and material effect on the determination of financial statement amounts. However, providing an opinion on compliance with those provisions was not an objective of our audit, and accordingly, we do not express such an opinion. The results of our tests disclosed no instances of noncompliance or other matters that are required to be reported under Government Auditing Standards. Purpose of this Report The purpose of this report is solely to describe the scope of our testing of internal control and compliance and the results of that testing, and not to provide an opinion on the effectiveness of the entity’s internal control or on compliance. This report is an integral part of an audit performed in accordance with Government Auditing Standards in considering the entity’s internal control and compliance. Accordingly, this communication is not suitable for any other purpose. Westberg Eischens, PLLP Willmar, Minnesota July 20, 2018

iv
INDEPENDENT AUDITOR’S REPORT ON MINNESOTA LEGAL COMPLIANCE Mayor and City Council City of Willmar, Minnesota We have audited, in accordance with auditing standards generally accepted in the United States of America, and the standards applicable to financial audits contained in Government Auditing Standards, issued by the Comptroller General of the United States, the financial statements of the City of Willmar, Minnesota, as of and for the year ended December 31, 2017, and the related notes to the financial statements, and have issued our report thereon dated July 20, 2018. The Minnesota Legal Compliance Audit Guide for Cities , promulgated by the State Auditor pursuant to Minn. Stat. § 6.65, contains seven main categories of compliance to be tested: contracting and bidding, deposits and investments, conflicts of interest, public indebtedness, claims and disbursements, miscellaneous provisions, and tax increment financing. Our audit considered all of the listed categories. In connection with our audit, nothing came to our attention that caused us to believe that City of Willmar, Minnesota failed to comply with the provisions of the Minnesota Legal Compliance Audit Guide for Cities , except as described in the schedule of findings and recommendations as items 2017-002 and 2017-003. However, our audit was not directed primarily toward obtaining knowledge of such noncompliance. Accordingly, had we performed additional procedures, other matters may have come to our attention regarding the City of Willmar, Minnesota’s noncompliance with the above referenced provisions. The purpose of this report is solely to describe the scope of our testing of compliance and the results of that testing, and not to provide an opinion on compliance. Accordingly, this communication is no suitable for any other purpose. Westberg Eischens, PLLP Willmar, Minnesota July 20, 2018

CITY OF WILLMAR, MINNESOTA
SCHEDULE OF FINDINGS AND RECOMMENDATIONS
For the Year Ended December 31, 2017
SECTION I: FINANCIAL STATEMENT FINDINGS
Finding 2017-001
Criteria:
A system of internal controls allows management or employees in the normal course of performing their assigned functions,
to prevent or detect misstatements of the financial statements on a timely basis.
Condition:
We proposed material adjustments to the construction in progress balance for the governmental activities.
Cause:
Activity in the project funds was not reconciled to the capital asset fund.
Effect:
Construction in progress was understated by approximately $2.7 million.
Recommendation:
We recommend management review the current year end procedures in place and make revisions necessary to address this
finding.
Explanation of Disagreement with Audit Finding:
There is no disagreement with the audit finding.
Actions Planned in Response to Finding:
Management will revise the year end procedures to ensure misstatements are detected and corrected.
Officer Responsible for Ensuring CAP:
Finance Director
Planned Completion Date:
December 2018
Plan to Monitor Completion of CAP:
City Administrator will monitor completion of corrective action plan.
v-1

CITY OF WILLMAR, MINNESOTA
SCHEDULE OF FINDINGS AND RECOMMENDATIONS
For the Year Ended December 31, 2017
SECTION II: MINNESOTA LEGAL COMPLIANCE
Finding 2017-002
Criteria:
Minnesota Statute § 15.17 and 138.17 require Cities to preserve all records necessary for “a full and accurate knowledge of
their official activities.” Bids and supporting documentation must be kept forever unless the city adopts the General Records
Retention Schedule for Cities, adopts its own properly approved records retention schedule or receives authority to dispose
of the records from the records disposition panel.
Condition:
Bid documentation for some of the 2017 projects was not retained.
Cause:
The record retention policy being followed is not consistent with the General Records Retention Schedule.
Effect:
The City was not in compliance with Minnesota Statutes.
Recommendation:
We recommend the City review the record retention policy and communicate the policy to all departments.
Explanation of Disagreement with Audit Finding:
There is no disagreement with the audit finding.
Actions Planned in Response to Finding:
The City will adopt the General Records Retention Schedule for Cities and communicate the policy to department directors.
Officer Responsible for Ensuring CAP:
City Clerk
Planned Completion Date:
July 2018
Plan to Monitor Completion of CAP:
City Administrator will monitor completion of corrective action plan.
v-2

CITY OF WILLMAR, MINNESOTA
SCHEDULE OF FINDINGS AND RECOMMENDATIONS
For the Year Ended December 31, 2017
SECTION II: MINNESOTA LEGAL COMPLIANCE (continued)
Finding 2017-003
Criteria:
Minnesota Statute § 471.38 specifies the requirements home rule charter cities must follow for making electronic funds
transfers. Subdivision 3 requires the local government to enact policy controls in order to be eligible to make electronic
funds transfers.
Condition:
The City does not have an electronic funds transfer policy that addresses the controls required by Minnesota Statute § 471.38
subd. 3a.
Cause:
The City was not aware the statute was revised in 2017.
Effect:
The City is not in compliance with Minnesota Statutes.
Recommendation:
We recommend the City adopt a policy and controls for electronic funds transfers.
Explanation of Disagreement with Audit Finding:
There is no disagreement with the audit finding.
Actions Planned in Response to Finding:
The City will adopt a formal policy that is in compliance with state statutes.
Officer Responsible for Ensuring CAP:
Finance Director
Planned Completion Date:
December 2018.
Plan to Monitor Completion of CAP:
City Administrator will monitor completion of corrective action plan.
v-3

CITY OF WILLMAR, MINNESOTA
SCHEDULE OF FINDINGS AND RECOMMENDATIONS
For the Year Ended December 31, 2017
SECTION III: PRIOR YEAR FINDINGS
Finding 2016-001
Criteria:
Minnesota Statute § 118A.03 requires City deposits that exceed federal deposit insurance to be protected by collateral
security or a corporate surety bond.
Condition:
At year end, the City had uncollateralized deposits of approximately $1.2 million.
Cause:
The City had reassigned some of the duties from the Clerk/Treasurer to the Finance department during 2016.
Effect:
The City was not in compliance with Minnesota Statute § 118A.03.
Recommendation:
We recommend the City document procedures for monitoring collateral requirements on a monthly basis.
Status:
Resolved
Finding 2016-002
Criteria:
Minnesota Statute § 471.665 specifies requirements for establishing automobile allowances in lieu of other mileage
reimbursements.
Condition:
Employees receiving an automobile allowance were reimbursed for mileage when required to travel outside of the county.
Cause:
The City’s established the automobile allowance based on expected travel within the county. In an effort to cover the costs
of extra travel, the City allowed reimbursement for travel outside the county. The City’s interpretation of the statute was
that this was allowed.
Effect:
The City was not in compliance with Minnesota Statute § 471.665.
Recommendation:
We recommend the City revise the mileage reimbursement policy to exclude employees that receive an automobile
allowance.
Status:
Resolved
v-4

CITY OF WILLMAR, MINNESOTA
FINANCIAL SECTION - II

MANAGEMENT DISCUSSION AND ANALYSIS

CITY OF WILLMAR, MINNESOTA MANAGEMENT’S DISCUSSION AND ANALYSIS
December 31, 2017 This section of the basic financial statements of the City of Willmar (the City) presents a discussion and analysis of the City’s financial performance during the fiscal year ended December 31, 2017. Please read it in conjunction with the City’s basic financial statements following this section.
Financial Highlights
- The assets of the City exceeded liabilities by $139,915,990 (net position). Of this amount, $40,249,539 (in Committed and Unrestricted net position) may be used to meet the government’s ongoing obligations to citizens and creditors in accordance with the City’s fund designations and fiscal policies.
- The City’s governmental funds reported combined ending fund balances of $35,302,613. Of this total amount,
approximately 2% is Nonspendable, 20% is Restricted, and 78% is Committed. - At the end of the current fiscal year, committed fund balance for the General Fund was $13,401,500, or 98% of
the total General Fund expenditures of $13,743,358.
Using this Annual Report
This annual report consists of a series of financial statements. The Statement of Net Position and the Statement of Activities provide information about the activities of the City as a whole and present a longer-term view of the City’s finances. Fund financial statements are presented after the Statement of Net Position. Fund financial statements also report the City’s operations in more detail than the government-wide statements by providing information about the City’s funds. The notes to the basic financial statements provide information that is essential to a full understanding of the data provided in the government-wide and fund financial statements. This report also contains other supplementary information in addition to the basic financial statements.
The City as a whole: Statement of Net Position and Statement of Activities
Our analysis of the City of Willmar begins with the Statement of Net Position and the Statement of Activities. One of the most important questions asked about the City’s finances is, “Is the City as a whole better off as a result of the year’s activities?” The Statement of Net Position and the Statement of Activities both report information about the City as a whole and about its activities in a way that helps answer this question. These statements include all assets and liabilities using the accrual basis of accounting, which is similar to the accounting used by most private-sector companies. All of the current year’s revenues and expenses are taken into account regardless of when cash is received or paid. These two statements report the City’s net position and changes thereto. You can think of the City’s net position – the difference between assets and liabilities – as one way to measure the City’s financial health. Over time, increases and decreases in the City’s net position is one indicator of whether the City’s financial health is improving or deteriorating. You will need to consider other nonfinancial factors, however, to assess the overall health of the City of Willmar. In the Statement of Net Position and the Statement of Activities, we divide the City into two kinds of activities: Governmental Activities - Most of the City’s basic services are reported here, including the police, public works, parks departments and general administration. Property taxes, franchise fees, and state and federal grants finance most of these activities. Business-Type Activities – The City charges a fee to customers to help cover all or most of the cost of certain services it provides. The City’s waste treatment fund and internal service fund are reported here.
1

CITY OF WILLMAR, MINNESOTA MANAGEMENT’S DISCUSSION AND ANALYSIS
December 31, 2017
The City’s Most Significant Funds: Fund Financial Statements
Our analysis of the City of Willmar’s major funds begins with the fund financial statements. These statements provided detailed information about the most significant funds – not the City as a whole. Some funds are required to be established by state law and by bond covenants. However, the City Council establishes other funds to help it control and manage money for particular purposes or to show that it is meeting legal responsibilities for using certain taxes, grants, and other money. The City of Willmar’s two kinds of funds – governmental and proprietary – use different accounting approaches. Governmental Funds – Most of the City of Willmar’s basic services are reported in governmental funds. Governmental funds focus on how money flows into and out of those funds and the balances left at year-end that are available for spending. These funds are reported using an accounting method called modified accrual accounting, which measures cash and all other financial assets that can readily be converted to cash. The governmental fund statements provide a detailed short-term view of the City’s general government operations and the basic services it provides. Governmental fund information helps the reader of the statements determine whether there are more or fewer financial resources that can be spent in the near future to finance the City’s programs. We describe the relationship (or differences) between governmental activities (reported in the Statement of Net Position and the Statement of Activities) and governmental funds in reconciliation after the fund financial statements. The governmental fund financial statements can be found on pages 15-21 of this report. Proprietary Funds – When the City of Willmar charges customers for the services it provides – whether to outside customers or to other units of the City – these services are generally reported in proprietary funds. Proprietary funds are reported in the same way that all activities are reported in the Statement of Net Position and the Statement of Activities. In fact, the City’s enterprise funds are the same as the business-type activities we report in the government-wide statements, but provide more detail and additional information, such as cash flows, for proprietary funds. The proprietary fund financial statements can be found on pages 22-25 of this report.
Notes to the Financial Statements
The notes provide additional information that is essential to a full understanding of the data provided in the government-wide and fund financial statements. The notes to the financial statements can be found on pages 26-63 of this report.
Statement of Net Position
The City of Willmar’s net position increased from a year ago. Our analysis below focuses on the net position (Table 1) and changes in net position (Table 3) of the City’s governmental and business-type activities.
2

CITY OF WILLMAR, MINNESOTA MANAGEMENT’S DISCUSSION AND ANALYSIS
December 31, 2017
Governmental Activities The net position of the City’s governmental activities increased by $579,597 in 2017. The increase was mainly due to a slight decrease in annual expenditures due to a number of vacant positions throughout the year.
Business-Type Activities
The total net position of the City’s business-type activities increased by $3,273,705 in 2017. The increase was due to rates being set through 2017 to handle the pending increase in debt service payments and future capital expenditure needs.
3
Table 1Condensed Statement of Net Position
2017 2016 2017 2016 2017 2016
Current and other assets 41,216,818$ 42,557,421$ 13,138,642$ 10,865,742 54,355,460$ 53,423,163$ Net capital assets 94,836,865 93,810,657 83,602,554 85,452,298 178,439,419 179,262,955
Total Assets 136,053,683 136,368,078 96,741,196 96,318,040 232,794,879 232,686,118
Deferred Outflows 6,830,963 8,558,147 262,931 336,352 7,093,894 94,010,445
Other liabilities 2,464,246 2,761,927 180,741 409,844 2,644,987 3,171,771 Long-term liabilities 20,298,475 28,718,815 68,914,218 71,756,416 89,212,693 100,475,231
Total Liabilities 22,762,721 31,480,742 69,094,959 72,166,260 91,857,680 103,647,002
Deferred Inflows 7,857,913 1,761,067 257,191 110,060 8,115,104 1,871,127
Net PositionNet Investment in Capital Assets 84,374,561 82,537,353 15,291,890 14,500,798 99,666,451 97,038,151 NonExpendable - - - - - - Restricted 21,250,871 35,591,625 667,804 581,584 21,918,675 36,173,209 Unrestricted 6,638,581 (6,444,562) 11,692,283 9,295,890 18,330,864 2,851,328
Total Net Position 112,264,013$ 111,684,416$ 27,651,977$ 24,378,272$ 139,915,990$ 136,062,688$
Governmental Activities Business-type Activities Total
2017 2016 2017 2016 2017 2016
Current and other assets 82,504,328$ 75,938,615$ 34,488,463$ 29,582,761$ 116,992,791$ 105,521,376$ Net capital assets 60,188,587 62,775,982 31,280,870 31,225,464 91,469,457 94,001,446
Total Assets 142,692,915 138,714,597 65,769,333 60,808,225 208,462,248 199,522,822
Deferred Outflows 19,977,667 23,662,096 944,351 2,105,518 20,922,018 25,767,614
Current and other liabilities 17,770,329 17,333,493 4,457,272 4,253,680 22,227,601 21,587,173 Long-term liabilities 89,405,651 101,360,252 9,690,106 11,668,579 99,095,757 113,028,831
Total Liabilities 107,175,980 118,693,745 14,147,378 15,922,259 121,323,358 134,616,004
Deferred Inflows 16,119,932 7,237,000 849,783 654,514 16,969,715 7,891,514
Net Position Net Investment in capital assets 18,701,189 19,651,343 25,898,387 25,275,464 44,599,576 44,926,807 Restricted 8,458,886 7,823,270 1,567,028 1,584,238 10,025,914 9,407,508 Unrestricted 12,214,595 8,971,335 24,051,108 19,477,268 36,265,703 28,448,603
Total Net Position 39,374,670$ 36,445,948$ 51,516,523$ 46,336,970$ 90,891,193$ 82,782,918$
Rice Memorial Hospital Municipal Utilities Total
Table 2Condensed Statement of Net Position

CITY OF WILLMAR, MINNESOTA MANAGEMENT’S DISCUSSION AND ANALYSIS
December 31, 2017
Primary Government
4
Table 3Condensed Statement of Activities
2017 2016 2017 2016 2017 2016Revenues
Program revenues:Charges for services 1,689,893$ 1,935,065$ 10,255,479$ 10,348,712$ 11,945,372$ 12,283,777$ Operating grants and
contributions 1,093,828 1,209,097 - - 1,093,828 1,209,097 Capital grants and contributions 3,747,878 1,920,469 - - 3,747,878 1,920,469
General revenues:Property and other taxes 5,328,601 4,948,435 - - 5,328,601 4,948,435 Grants and contributions notrestricted to specific program 4,686,694 4,677,513 - - 4,686,694 4,677,513 Other 1,635,515 1,144,280 292,770 (1,167,168) 1,928,285 (22,888) Intergovernmental - - - - - -
Total Revenues 18,182,409 15,834,859 10,548,249 9,181,544 28,730,658 25,016,403
ExpensesGeneral Government 3,704,457 3,907,763 - - 3,704,457 3,907,763 Public safety 5,735,917 6,277,277 - - 5,735,917 6,277,277 Public works 8,216,746 7,432,779 - - 8,216,746 7,432,779 Social services - - - - - - Culture and recreation 2,889,721 2,631,463 - - 2,889,721 2,631,463 Economic development 34,108 13,828 - - 34,108 13,828 Capital projects - - - - - - Debt service 230,050 259,475 - - 230,050 259,475 Office services - - - - - - Waste treatment - - 6,544,284 6,488,885 6,544,284 6,488,885
Total Expenses 20,810,999 20,522,585 6,544,284 6,488,885 27,355,283 27,011,470
Changes in Net PositionBefore Transfers (2,628,590) (4,687,726) 4,003,965 2,692,659 1,375,375 (1,995,067)
Transfers 3,208,187 3,094,022 (730,260) (702,000) 2,477,927 2,392,022
Changes in Net Position 579,597 (1,593,704) 3,273,705 1,990,659 3,853,302 396,955
Net Position, Beg. of Year 111,684,416 113,655,762 24,378,272 22,387,613 136,062,688 136,043,375 Prior period adjustment - (377,642) - - - (377,642)
Net Position, End of Year 112,264,013$ 111,684,416$ 27,651,977$ 24,378,272$ 139,915,990$ 136,062,688$
Governmental Activities Business-type Activities Total

CITY OF WILLMAR, MINNESOTA MANAGEMENT’S DISCUSSION AND ANALYSIS
December 31, 2017
Component Units
Component Units
The total net position of the City’s two component units increased by $8,332,378 in 2017. The net position of the Municipal Utilities Commission increased by $5,403,656, and the net position of Rice Memorial Hospital increased by $2,928,722.
5
2017 2016 2017 2016 2017 2016Revenues
Hospital 110,492,274$ 110,218,827$ -$ -$ 110,492,274$ 110,218,827$ Municipal Utility - - 33,950,617 32,461,809 33,950,617 32,461,809 Interest Earnings 1,213,415 1,151,857 173,775 279,832 1,387,190 1,431,689 Gain (Loss) on sale
of Capital Assets (90,647) (148,675) (326,302) 7,552 (416,949) (141,123) Miscellaneous 1,251,816 (47,877) 185 (7,363) 1,252,001 (55,240)
Total Revenues 112,866,858 111,174,132 33,798,275 32,741,830 146,665,133 143,915,962
ExpensesHospital 109,597,559 108,678,965 - - 109,597,559 108,678,965 Municipal Utility - - 26,257,777 26,745,927 26,257,777 26,745,927
Total Expenses 109,597,559 108,678,965 26,257,777 26,745,927 135,855,336 135,424,892
Changes in Net PositionBefore transfers 3,269,299 2,495,167 7,540,498 5,995,903 10,809,797 8,491,070
Transfers (340,577) (255,180) (2,136,842) (2,121,088) (2,477,419) (2,376,268)
Changes in Net Position 2,928,722 2,239,987 5,403,656 3,874,815 8,332,378 6,114,802
Net Position, Beginning 36,445,948 34,205,961 46,336,970 42,462,155 82,782,918 76,668,116 Prior Period Adjstmt - - (224,103) - (224,103) -
Net Pos., Beg. Restated 36,445,948 34,205,961 46,112,867 42,462,155 82,558,815 76,668,116
Net Position, Ending 39,374,670$ 36,445,948$ 51,516,523$ 46,336,970$ 90,891,193$ 82,782,918$
Table 4Condensed Statement of Activities
Rice Memorial Hospital Municipal Utilities Total

CITY OF WILLMAR, MINNESOTA MANAGEMENT’S DISCUSSION AND ANALYSIS
December 31, 2017
Governmental Activities
Revenues – The following chart visually illustrates the City’s revenues by source for its governmental activities:
Expenses – The following chart visually illustrates the City’s expenses by source for its governmental activities:
6
Charges for services, 9%
Operating grants and contributions, 6%
Capital grants and contributions, 21%
Property and other taxes, 29%
Grants and contributions not restricted to specific
programs, 26%
Other, 9%
Revenue by Source - Governmental Activities
General Government, 18%
Public Safety, 28%
Public Works, 39%
Social Services, 0%
Culture and Recreation, 14%
Economic Development, 0%
Debt Service, 1%
Expenses by Source - Governmental Activities

CITY OF WILLMAR, MINNESOTA MANAGEMENT’S DISCUSSION AND ANALYSIS
December 31, 2017
Financial Analysis of the City’s Funds
General Fund – The City’s General Fund Balance decreased by $705,098 in 2017 which is $701,073 less of a decrease than the final budget projection which reflected a decrease of $1,406,171. Most of the difference was due to a decrease in overall expenditures for Public Safety and Public Works Debt Service Funds – The Special Assessments Bond Debt Service Fund Balance increased by $1,544,808 in 2017. Most of this increase was attributable to transfers from finalized street project funds. Special Revenue Fund – The Industrial Development Fund Balance increased by $354,261 in 2017. The increase was due to sale of Industrial Park land. Special Revenue Fund – The Community Investment Fund Balance decreased by $104,358 in 2017. The decrease was mainly due to transfers out to various Special Assessment Bond Funds for bond payments. Capital Projects Fund – The Street, Water/Sewer Capital Projects Fund Balance decreased by $1,406,541 in 2017. The fund decrease was mostly due to transfers to associated Special Assessments Bond Debt Service Funds because street projects have been finalized. GENERAL FUND BUDGETARY HIGHLIGHTS: The City approved the 2017 general fund budget anticipating expenditures would exceed revenues by $1,406,171. There was no difference between the original and final budget totals, however, there were budget adjustments throughout the year transferring costs from one area to another. At the end of the year, revenues exceeded the final budget by $1,525 and expenditures were less than the final budget by $661,200. Transfers in were more than the final budget by $38,348. The most significant positive variance for revenues was in Licenses and Permits. Positive variances in expenditures were reflected in General Government, Public Safety, and Public Works.
7

2017 2016 2017 2016
Land and improvements 8,585,806$ 8,585,806$ 2,005,122$ 2,005,122$ Buildings 14,126,226 14,098,229 63,705,752 63,705,752 Furniture and equipment 3,484,594 3,335,503 434,173 513,168 Machinery and auto 9,672,141 9,026,127 6,606,882 6,404,539 Other improvements 128,923,694 119,312,161 27,882,552 26,779,976 Construction in progress 11,927,886 15,891,519 747,952 1,688,547
Less: Depreciation (81,883,482) (76,438,688) (17,779,879) (15,644,806)
94,836,865$ 93,810,657$ 83,602,554$ 85,452,298$
Government Activities Business-Type Activities
Table 5Capital Assets
CITY OF WILLMAR, MINNESOTA MANAGEMENT’S DISCUSSION AND ANALYSIS
December 31, 2017
Capital Assets
At the end of 2017, the Primary Government of the City of Willmar had over $178,000,000 (net of accumulated depreciation) invested in a broad range of capital assets. In addition, the Component Units had over $91,000,000 (net of accumulated depreciation) invested in capital assets. Refer to Note 3.A.2 of the Notes to the Financial Statements for a schedule showing the City’s capital asset activity. Primary Government
Component Units
8
2017 2016 2017 2016
Land 2,918,000$ 2,918,000$ 1,385,906$ 1,385,907$ Buildings 103,540,000 103,346,000 3,910,460 3,916,095 Furniture and equipment 47,257,000 44,931,982 80,383,366 78,814,034 Machinery and auto - - - - Other improvements 1,696,000 1,686,000 - - Utility Plant in Service - - - - Construction in progress 249,000 - 773,582 2,828,747
Less: Depreciation (95,471,413) (90,106,000) (55,172,444) (55,719,319)
60,188,587$ 62,775,982$ 31,280,870$ 31,225,464$
Rice Memorial Hospital Willmar Municipal Utilities
Table 6 Capital Assets

2017 2016 ChangeGovernmental Activites
G.O. Special Assessment Bonds 9,348,000$ 9,999,000$ (651,000)$ G.O. Revenue Bonds 520,000 680,000 (160,000) Note Payable - TIF 594,304 594,304 -
10,462,304$ 11,273,304$ (811,000)$
Business-Type ActivitiesG.O. Revenue Bonds 235,000$ 345,000$ (110,000)$ G.O. Revenue Notes 68,075,664 70,606,500 (2,530,836)
68,310,664$ 70,951,500$ (2,640,836)$
Table 7
CITY OF WILLMAR, MINNESOTA MANAGEMENT’S DISCUSSION AND ANALYSIS
December 31, 2017
Long-Term Debt
At year-end, the City of Willmar’s Primary Government had over $78,700,000 in bonds outstanding and its Component Units had over $48,600,000 in bonds outstanding. Refer to Note 3.C.2 of the Notes to the Financial Statements for a schedule showing the City’s long-term debt activity. Primary Government
Component Units
9
2017 2016 ChangeRice Memorial Hospital
G.O. Revenue Bonds 33,545,000$ 35,095,000$ (1,550,000)$ Hospital Revenue Notes 7,798,400 8,248,200 (449,800) Capital Lease 1,892,004 1,386,237 505,767
43,235,404$ 44,729,437$ (1,494,033)$
Willmar Municipal UtilitiesMunicipal Utility Revenue Bond 2009 5,400,000$ 5,950,000$ (550,000)$
5,400,000$ 5,950,000$ (550,000)$
Table 8

CITY OF WILLMAR, MINNESOTA MANAGEMENT’S DISCUSSION AND ANALYSIS
December 31, 2017
Economic Factors and Next Year’s Budget
In the City adopted budget for 2018, expenditures were forecast to exceed revenue by approximately $4,240,521, of which the General Fund expenditures were forecast to exceed revenue by approximately $1,451,937. The major difference again is the use of excess fund balances in the General Fund.
Contacting the City’s Financial Management
This financial report is designated to provide our residents, customers, and creditors with a general overview of the City of Willmar’s finances and to show the City’s accountability for the money it receives. If you have any questions about this report or need additional information, contact the City of Willmar, 333 6th St SW, Willmar, MN 56201 or by phone at (320) 235-4913.
10

BASIC FINANCIAL STATEMENTS
11
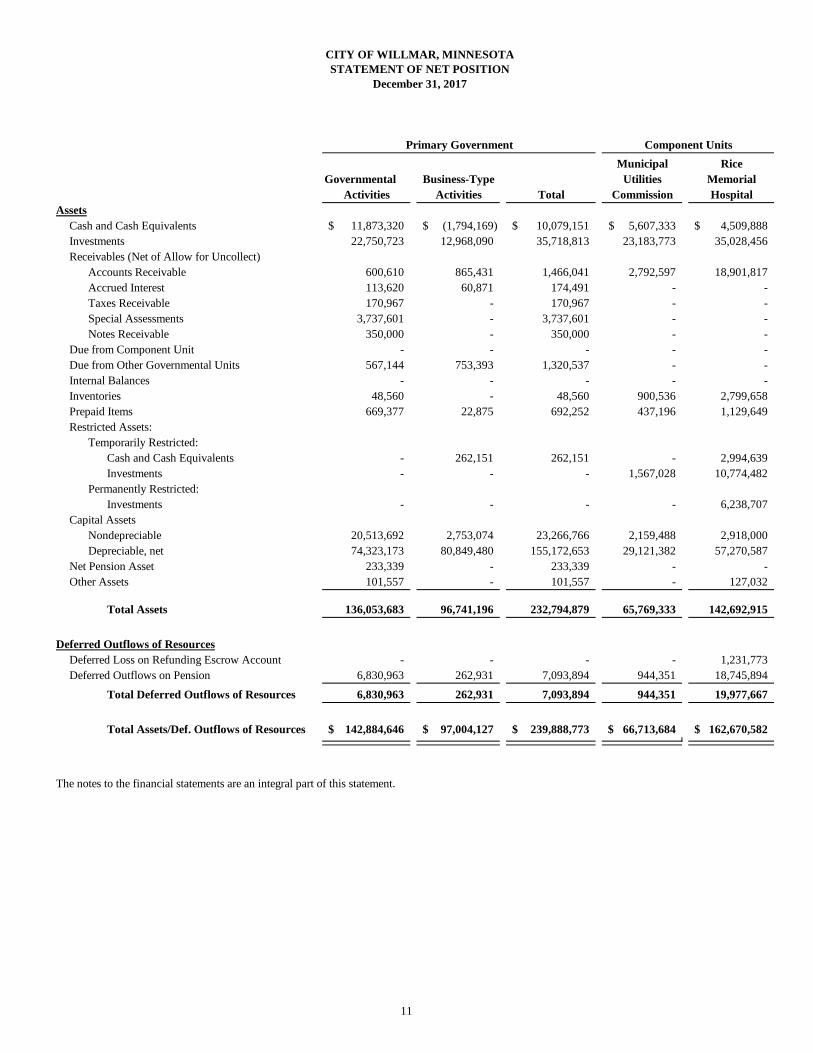
Municipal Rice
Governmental Business-Type Utilities MemorialActivities Activities Total Commission Hospital
Assets Cash and Cash Equivalents 11,873,320$ (1,794,169)$ 10,079,151$ 5,607,333$ 4,509,888$ Investments 22,750,723 12,968,090 35,718,813 23,183,773 35,028,456 Receivables (Net of Allow for Uncollect)
Accounts Receivable 600,610 865,431 1,466,041 2,792,597 18,901,817 Accrued Interest 113,620 60,871 174,491 - - Taxes Receivable 170,967 - 170,967 - - Special Assessments 3,737,601 - 3,737,601 - - Notes Receivable 350,000 - 350,000 - -
Due from Component Unit - - - - - Due from Other Governmental Units 567,144 753,393 1,320,537 - - Internal Balances - - - - - Inventories 48,560 - 48,560 900,536 2,799,658 Prepaid Items 669,377 22,875 692,252 437,196 1,129,649 Restricted Assets:
Temporarily Restricted:Cash and Cash Equivalents - 262,151 262,151 - 2,994,639 Investments - - - 1,567,028 10,774,482
Permanently Restricted:Investments - - - - 6,238,707
Capital AssetsNondepreciable 20,513,692 2,753,074 23,266,766 2,159,488 2,918,000 Depreciable, net 74,323,173 80,849,480 155,172,653 29,121,382 57,270,587
Net Pension Asset 233,339 - 233,339 - - Other Assets 101,557 - 101,557 - 127,032
Total Assets 136,053,683 96,741,196 232,794,879 65,769,333 142,692,915
Deferred Outflows of ResourcesDeferred Loss on Refunding Escrow Account - - - - 1,231,773 Deferred Outflows on Pension 6,830,963 262,931 7,093,894 944,351 18,745,894
Total Deferred Outflows of Resources 6,830,963 262,931 7,093,894 944,351 19,977,667
Total Assets/Def. Outflows of Resources 142,884,646$ 97,004,127$ 239,888,773$ 66,713,684$ 162,670,582$
The notes to the financial statements are an integral part of this statement.
CITY OF WILLMAR, MINNESOTASTATEMENT OF NET POSITION
December 31, 2017
Primary Government Component Units

12
Municipal Rice
Governmental Business-Type Utilities MemorialActivities Activities Total Commission Hospital
Liabilities Accounts and Contracts Payable 746,745$ 152,687$ 899,432$ 2,439,266$ 5,231,126$ Accrued Interest Payable 231,623 - 231,623 199 666,218 Due to Component Units 14,892 - 14,892 - - Due to Primary Government - - - 1,302,913 - Due to Other Governmental Units - - - - - Unearned Revenue 1,211,058 - 1,211,058 - - Accrued Compensation and Benefits 259,927 28,054 287,981 139,894 9,373,890 Noncurrent Liabilities
Due within one year 1,871,000 2,967,000 4,838,000 575,000 2,499,095 Due in more than one year 11,954,188 65,343,664 77,297,852 5,779,789 43,996,710 Net OPEB Liability 471,187 - 471,187 216,117 1,883,279 Net Pension Liability 6,002,100 603,554 6,605,654 3,894,200 43,525,662
Total Liabilities 22,762,720 69,094,959 91,857,679 14,347,378 107,175,980
Deferred Inflows of ResourcesDeferred Inflows on Pension 7,857,913 257,191 8,115,104 849,783 16,119,932
Total Deferred Inflows of Resources 7,857,913 257,191 8,115,104 849,783 16,119,932
Net PositionNet Investment in Capital Assets 84,374,561 15,291,890 99,666,451 25,898,387 18,701,189 Restricted
Capital Improvements 3,592,030 405,653 3,997,683 - - Debt Service 16,058,241 - 16,058,241 1,567,028 2,328,421 Specific Operating Activities 1,600,600 262,151 1,862,751 - 2,013,306 NonExpendable - - - - 4,117,159
Unrestricted 6,638,581 11,692,283 18,330,864 24,051,108 12,214,595 Total Net Position 112,264,013 27,651,977 139,915,990 51,516,523 39,374,670
Total Liabilities, Deferred Inflows of Resources, and Net Position 142,884,646$ 97,004,127$ 239,888,773$ 66,713,684$ 162,670,582$
The notes to the financial statements are an integral part of this statement.
CITY OF WILLMAR, MINNESOTASTATEMENT OF NET POSITION
December 31, 2017
Primary Government Component Units

13
Operating CapitalCharges for Grants and Grants and
Functions/Programs Expenses Services Contributions ContributionsPrimary Government:
Governmental Activities:General Government 3,704,457$ 574,910$ 269,306$ -$ Public Safety 5,735,917 334,868 458,586 2,703 Public Works 8,216,746 130,286 310,245 2,683,323 Culture and Recreation 2,889,721 565,200 55,691 1,061,852 Economic Development 34,108 84,629 - - Debt Service - interest 230,050 - - -
Total Governmental Activities 20,810,999 1,689,893 1,093,828 3,747,878
Business-Type Activities:Waste Treatment 6,544,284 10,255,479 - -
Total Business-Type Activities 6,544,284 10,255,479 - - Total Primary Government 27,355,283$ 11,945,372$ 1,093,828$ 3,747,878$
Component Units:Municipal Utilities 26,257,777$ 33,950,617$ -$ -$ Rice Memorial Hospital 109,597,559 108,889,464 812,269 790,541
Total Component Units 135,855,336$ 142,840,081$ 812,269$ 790,541$
General Revenues:Property TaxesSales TaxesOther TaxesGrants and contributions not restricted to specific programsInterest earningsNet increase (decrease) in fair value of investmentsGain (Loss) Capital AssetsMiscellaneous
Transfers Total General Revenues /Transfers
Change in Net Position
Net Position - Beginning, as originally statedPrior period adjustment see Note 13Net Position - Beginning, as restated
Net Position - Ending
The notes to the financial statements are an integral part of this statement.
City of WillmarStatement of Activities
For the Year Ended December 31, 2017
Program Revenues

14
Municipal RiceGovernmental Business-Type Utilities Memorial
Activities Activities Total Commission Hospital
(2,860,241)$ (2,860,241)$ (4,939,760) (4,939,760) (5,092,892) (5,092,892) (1,206,978) (1,206,978)
50,521 50,521 (230,050) (230,050)
(14,279,400) (14,279,400)
- 3,711,195$ 3,711,195
- 3,711,195 3,711,195 (14,279,400) 3,711,195 (10,568,205)
7,692,840$ -$ - 894,715
7,692,840 894,715
4,839,573 - 4,839,573 - - - - - - -
489,028 - 489,028 - - 4,686,694 - 4,686,694 - -
470,663 260,518 731,181 173,775 1,213,415 65,359 35,136 100,495 - 1,251,816
(43,741) (2,884) (46,625) (326,302) (90,647) 1,143,234 - 1,143,234 185 - 3,208,187 (730,260) 2,477,927 (2,136,842) (340,577)
14,858,997 (437,490) 14,421,507 (2,289,184) 2,034,007 579,597 3,273,705 3,853,302 5,403,656 2,928,722
111,684,416 24,378,272 136,062,688 46,336,970 36,445,948 - - - (224,103) -
111,684,416 24,378,272 136,062,688 46,112,867 36,445,948
112,264,013$ 27,651,977$ 139,915,990$ 51,516,523$ 39,374,670$
Primary Government Component UnitsNet (Expense) Revenue and Changes in Net Position

15
SpecialAssessments Street
Bonds Water/SewerGeneral Debt Service Capital Projects
ASSETSCash and Cash Equivalents 6,878,965$ 2,790,370$ 1,563,436$ Investments 7,076,252 2,684,204 498,964 Receivables (Net of Allowance for Uncollect)
Accounts 448,237 - 100,000 NSF Payments 9 - - Interest 33,252 12,594 2,346 Taxes Current 65,908 - - Delinquent 88,473 - - Assessments Delinquent - 38,696 - Deferred 1,704 2,552,448 - Notes - - -
Due From Other Funds 3,262 1,417,605 1,245 Due From Other Governments 7,503 94,344 133,405 Inventory 48,560 - - Prepaid Expenses 329,298 - 85,272 Deposits 12,813 - - Amount To Be Provided - - 86,000 Unamortized Discount - 2,744 -
Total Assets 14,994,236$ 9,593,005$ 2,470,668$
LIABILITIESAccounts Payable 299,366$ -$ 6,175$ Contracts Payable - - 153,695 Accrued Wages 259,927 - - Deposits 5,834 - - Due to Component Units 4,308 - - Due to Other Funds 603,571 - 1,463,952 Due to Other Governments - - -
Total Liabilities 1,173,006 - 1,623,822 DEFERRED INFLOWS OF RESOURCES
Unavailable Revenue 90,432 2,685,487 215,926
Total Deferred Inflows of Resources 90,432 2,685,487 215,926
FUND BALANCESNonspendable Fund Balance 329,298 - - Restricted Fund Balance - 6,907,518 - Committed Fund Balance 13,401,500 - 630,920
Total Fund Balances 13,730,798 6,907,518 630,920 Total Liabilities, Deferred Inflows
of Resources and Fund Balances 14,994,236$ 9,593,005$ 2,470,668$
The notes to the financial statements are an integral part of this statement.
December 31, 2017
CITY OF WILLMAR, MINNESOTABALANCE SHEETS
GOVERNMENTAL FUNDS

16
CommunityInvestment Other Total
Special Governmental GovernmentalRevenue Fund Funds Funds
(77,873)$ 547,393$ 11,702,291$ 9,228,950 3,262,353 22,750,723
- 52,284 600,521 - - 9
43,326 22,102 113,620
- 16,586 82,494 - - 88,473
260,835 - 299,531 883,918 - 3,438,070
- 350,000 350,000 - 745,000 2,167,112 - 331,892 567,144 - - 48,560 - 254,807 669,377 - - 12,813 - - 86,000 - - 2,744
10,339,156$ 5,582,417$ 42,979,482$
-$ 281,395$ 586,936$ - - 153,695 - - 259,927 - 280 6,114
10,584 - 14,892 40,898 62,263 2,170,684
- - - 51,482 343,938 3,192,248
1,134,170 358,606 4,484,621
1,134,170 358,606 4,484,621
- 284,807 614,105 - 129,648 7,037,166
9,153,504 4,465,418 27,651,342 9,153,504 4,879,873 35,302,613
10,339,156$ 5,582,417$ 42,979,482$
CITY OF WILLMAR, MINNESOTABALANCE SHEETS
GOVERNMENTAL FUNDSDecember 31, 2017

17
Amounts reported for governmental activities in the statement of net position are different because:
Total governmental fund balances 35,302,613$
Capital assets used in governmental activities are not financialresources and, therefore, are not reported in the funds.
Governmental funds - capital assets 176,720,347 Less: Accumulated depreciation (81,883,482)
94,836,865 Other long-term assets are not available to pay for current-period
expenditures and, therefore, are deferred in the funds.Delinquent property taxes 88,473 Unavailable special assessments 2,610,304 Due From State of Minnesota 129,926 Notes/Interest Receivable 356,806 Unavailable Revenue for 2017 88,054 Deferred Outflow of Resources - Pension 6,830,963 Net Pension Asset 233,339
10,337,865
Internal service funds are used by management to charge the costsof equipment, information technology and insurance to individualfunds. The assets and liabilities of the internal service funds areincluded in governmental activities in the statement of net position. 174,681 174,681
Long-term liabilities, including bonds payable, are not due and payablein the current period and therefore are not reported in the funds.
Bonds and notes payable (10,462,304) Compensated absences (3,362,884) Accrued interest (231,623) Net OPEB Liability (471,187) Net Pension Liability (6,002,100) Deferred Inflow of Resources - Pension (7,857,913)
(28,388,011)
Net position of governmental activities 112,264,013$
The notes to the financial statements are an integral part of this statement.
City of Willmar, MinnesotaReconciliation of Net Position in the
Government-Wide Financial Statements and Fund Balancesin the Fund Basis Financial Statements
December 31, 2017

18
SpecialAssessments Street
Bonds Water/SewerGeneral Debt Service Capital Projects
REVENUES General Property Taxes 4,793,499$ -$ -$ Sales Tax - - - Other Taxes 260,803 - - Special Assessments 1,273 1,276,033 60,973 License and Permits 554,249 - - Intergovernmental 5,433,283 - 985,574 Charges for Services 764,551 - - Fines and Forfeits 147,836 - - Investment Income 167,938 46,014 9,040 Change in market value 27,490 5,017 600 Miscellaneous Revenues 796,197 7,223 -
Total Revenues 12,947,119 1,334,287 1,056,187
EXPENDITURESCurrent:
General Government 3,686,249 - - Public Safety 4,850,002 - - Public Works 2,882,889 - - Culture & Recreation 2,324,218 - - Economic Development - - -
Debt Service:Principal - 1,751,000 - Interest - 235,556 - Other Charges and Services - 25,800 -
Capital Outlay - - 2,826,021 Total Expenditures 13,743,358 2,012,356 2,826,021
Excess (deficiency) of revenues over (under)expenditures (796,239) (678,069) (1,769,834)
OTHER FINANCING SOURCES (USES)Operating Tranfers In 2,762,427 2,334,729 641,245 Operating Transfers Out (2,671,286) (111,852) (1,377,952) Loan Proceeds - - - Bond Proceeds - - 1,100,000
Total Other Financing Sources (Uses) 91,141 2,222,877 363,293 Net Change in Fund Balances (705,098) 1,544,808 (1,406,541)
Fund Balances - Beginning 14,435,896 5,362,710 2,037,461
Fund Balances - Ending 13,730,798$ 6,907,518$ 630,920$
The notes to the financial statements are an integral part of this statement.
CITY OF WILLMAR, MINNESOTASTATEMENT OF REVENUES, EXPENDITURES AND CHANGES IN FUND BALANCES
GOVERNMENTAL FUNDSFor the Year Ended December 31, 2017

19
Community Other TotalInvestment Government Governmental
Special Revenue Funds Funds
-$ 46,074$ 4,839,573$ - - - - 228,225 489,028
137,273 - 1,475,552 - - 554,249 - 559,179 6,978,036 - 221,984 986,535 - - 147,836
180,316 67,355 470,663 23,221 9,031 65,359
742 339,072 1,143,234 341,552 1,470,920 17,150,065
- - 3,686,249 - 27,208 4,877,210 - 233,563 3,116,452 - 261,347 2,585,565 - 34,108 34,108
- 160,000 1,911,000 - 23,642 259,198 - 3,180 28,980 - 2,817,653 5,643,674 - 3,560,701 22,142,436
341,552 (2,089,781) (4,992,371)
511,852 2,728,929 8,979,182 (957,762) (652,143) (5,770,995)
- - - - - 1,100,000
(445,910) 2,076,786 4,308,187 (104,358) (12,995) (684,184)
9,257,862 4,892,868 35,986,797
9,153,504$ 4,879,873$ 35,302,613$
CITY OF WILLMAR, MINNESOTA
GOVERNMENTAL FUNDSFor the Year Ended December 31, 2017
STATEMENT OF REVENUES, EXPENDITURES AND CHANGES IN FUND BALANCES

20
Amounts reported for governmental activities in the statement of activities are different because:
Net Change in Fund Balances-Governmental Funds (684,184)$
Governmental funds reported capital outlays as expenditures. However, in the statement of activities the cost of those assetsis allocated over their estimated useful lives and reported asdepreciation expense.
Capital Outlay Expense 5,728,946 Depreciation Expense (5,779,691)
(50,745)
The net effect of various miscellaneous transactions involvingcapital assets (i.e., sales, trade-ins, and donations) is to increase/(decrease) net position 1,076,953
Revenues in the statement of activities that do not provide currentfinancial resources are not reported as revenues in the funds
Unavailable Revenue, December 31, 2017 3,273,563 Unavailable Revenue, December 31, 2016 (3,528,636) (255,073) OPEB Contribution 142,866 Pension Contribution 126,440
14,233 Some expenses reported in the statement of activities do not
require the use of current financial resources and, therefore,are not reported as expenditures in governmental funds.
Compensated absences, December 31, 2017 (3,362,884) Compensated absences, December 31, 2016 3,663,037 300,153 OPEB Expense (223,771) Pension Expense (693,190)
(616,808) Bond proceeds provide current financial resources to governmental
funds, but issuing debt increases long-term liabilities in the statement of net assets. Repayment of bond principle is an expenditure in the governmental fund, but the repayment reduces long-term liabilities in the statement of net position.
Principle Retirement of Long-Term Debt 1,911,000 Bond Proceeds (1,100,000) Change in accrued interest (231,623- 260,771) 29,148
840,148 Internal service funds are used by management to charge the
costs of equipment, information technology and insuranceto individual funds. The net revenue (expense) of the internalservice funds is reported with governmental activities -
Change in Net Position-Governmental Activities 579,597$
The notes to the financial statements are an integral part of this statement.
City of Willmar, MinnesotaReconciliation of the Statement of Revenues, Expenditures, and Changes in Fund Balances of
Governmental Funds to the Statement of ActivitiesFor the Year Ended December 31, 2017
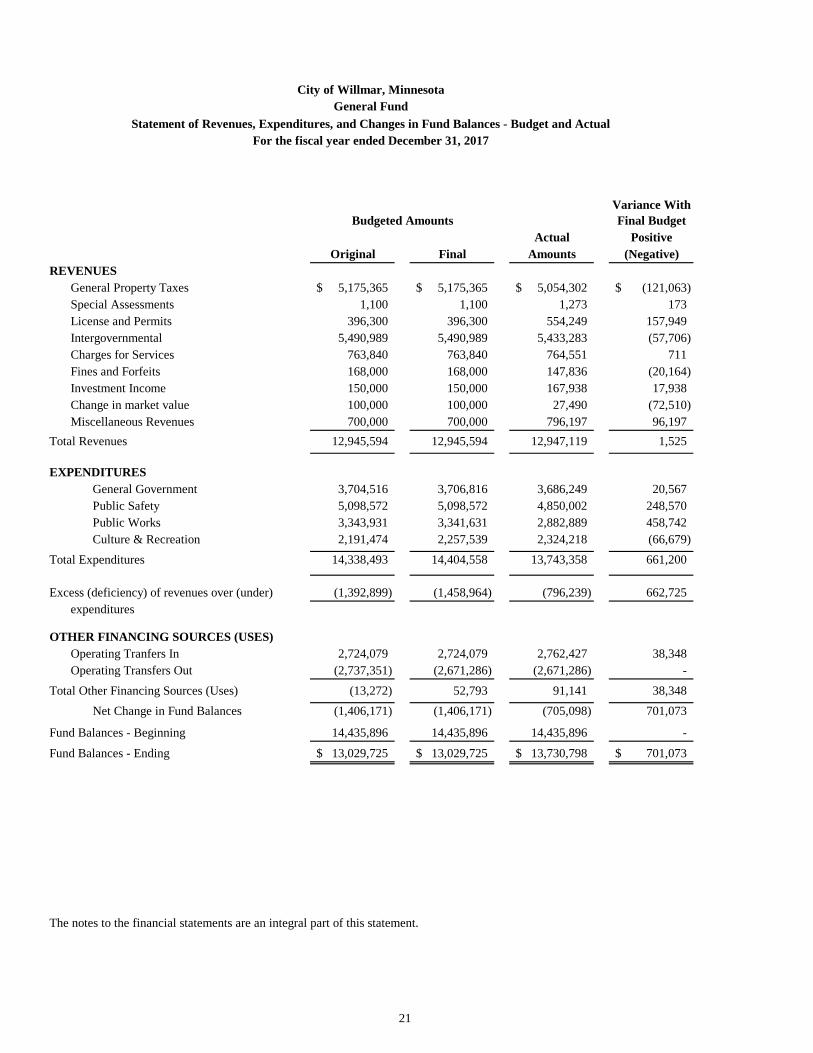
21
Variance WithFinal Budget
Actual PositiveOriginal Final Amounts (Negative)
REVENUESGeneral Property Taxes 5,175,365$ 5,175,365$ 5,054,302$ (121,063)$ Special Assessments 1,100 1,100 1,273 173 License and Permits 396,300 396,300 554,249 157,949 Intergovernmental 5,490,989 5,490,989 5,433,283 (57,706) Charges for Services 763,840 763,840 764,551 711 Fines and Forfeits 168,000 168,000 147,836 (20,164) Investment Income 150,000 150,000 167,938 17,938 Change in market value 100,000 100,000 27,490 (72,510) Miscellaneous Revenues 700,000 700,000 796,197 96,197
Total Revenues 12,945,594 12,945,594 12,947,119 1,525
EXPENDITURESGeneral Government 3,704,516 3,706,816 3,686,249 20,567 Public Safety 5,098,572 5,098,572 4,850,002 248,570 Public Works 3,343,931 3,341,631 2,882,889 458,742 Culture & Recreation 2,191,474 2,257,539 2,324,218 (66,679)
Total Expenditures 14,338,493 14,404,558 13,743,358 661,200
Excess (deficiency) of revenues over (under) (1,392,899) (1,458,964) (796,239) 662,725 expenditures
OTHER FINANCING SOURCES (USES)Operating Tranfers In 2,724,079 2,724,079 2,762,427 38,348 Operating Transfers Out (2,737,351) (2,671,286) (2,671,286) -
Total Other Financing Sources (Uses) (13,272) 52,793 91,141 38,348 Net Change in Fund Balances (1,406,171) (1,406,171) (705,098) 701,073
Fund Balances - Beginning 14,435,896 14,435,896 14,435,896 -
Fund Balances - Ending 13,029,725$ 13,029,725$ 13,730,798$ 701,073$
The notes to the financial statements are an integral part of this statement.
Budgeted Amounts
General FundStatement of Revenues, Expenditures, and Changes in Fund Balances - Budget and Actual
For the fiscal year ended December 31, 2017
City of Willmar, Minnesota

22
Business-Type GovernmentalActivities Activities
Waste Treatment Internal ServicePlant Funds
ASSETSCurrent Assets
Cash and Cash Equivalents (1,794,169)$ 171,029$ Investments 12,968,090 - Accounts Receivable 865,431 81 Due From Other Funds - 3,571 Due From Other Governmental Units 753,393 - Interest Receivable 60,871 - Inventories - - Prepaid Items 22,875 - Restricted Cash and Investments/System Replacement 262,151 -
Total Current Assets 13,138,642 174,681
Noncurrent AssetsCapital Assets:
Nondepreciable 2,753,074 - Depreciable 98,629,360 - Less: Accumulated Depreciation (17,779,880) -
Net capital assets 83,602,554 -
Total Noncurrent Assets 83,602,554 -
TOTAL ASSETS 96,741,196 174,681
DEFERRED OUTFLOWS OF RESOURCESRelated to Pensions 262,931 -
TOTAL DEFERRED OUTFLOWS OF RESOURCES 262,931 -
LIABILITIESCurrent Liabilities
Accounts Payable 142,067 - Contracts Payable 10,620 - Accrued Wages 28,054 - Due To Other Funds - - Current Portion of Debt 2,967,000 -
Total Current Liabilities 3,147,741 -
Noncurrent Liabilities:Notes Payable 65,343,664 Net Pension Liability 603,554 -
Total Noncurrent Liabilities 65,947,218 - TOTAL LIABILITIES 69,094,959 -
DEFERRED INFLOWS OF RESOURCESRelated to Pensions 257,191 -
TOTAL DEFERRED INFLOWS OF RESOURCES 257,191 -
NET POSITIONNet Investment in Capital Assets 15,291,890 - Restricted:
Capital Improvements 405,653 - System Replacement 262,151
Unrestricted 11,692,283 174,681
TOTAL NET POSITION 27,651,977$ 174,681$
The notes to the financial statements are an integral part of this statement.
City of Willmar, MinnesotaStatement of Net Position
Proprietary FundsDecember 31, 2017

23
Business-Type GovernmentalActivities Activities
Waste Treatment Internal ServicePlant Funds
Operating RevenuesIntergovernmental 90,950$ -$ Charges For Sales and Services: 10,164,529 -
Total Operating Revenues 10,255,479 -
Operating ExpensesPersonal Services 985,760 - Supplies 354,675 - Other Services and Charges 1,061,924 - Depreciation 2,135,074 -
Total Operating Expenses 4,537,433 -
Operating Income (Loss) 5,718,046 -
Nonoperating Revenues (Expenses)Investment Earnings 260,518 - Change in market value 35,136 - Capital Asset (Disposal)/Acquisition (2,884) - Interest Expense (2,006,851) -
Total Nonoperating Revenues (Expenses) (1,714,081) -
Income (Loss) Before Contributions and Transfers 4,003,965 -
Transfers Out (730,260) -
Change in Net Position 3,273,705 -
Net Position - Beginning 24,378,272 174,681
Total Net Position - Ending 27,651,977$ 174,681$
The notes to the financial statements are an integral part of this statement.
City of Willmar, MinnesotaStatement of Revenues, Expenses, and Changes in Fund Net Position
Proprietary FundsFor the Year Ended December 31, 2017

24
Business-Type GovernmentalActivities Activities
Waste Treatment Internal ServicePlant Funds
CASH FLOWS FROM OPERATING ACTIVITIES:Receipts from Customers and Users 10,265,417$ 535$ Payments to Suppliers (1,337,243) - Payments to Employees (962,835) - Liquidiation of Liabilities - -
Net Cash Provided by Operating Activities 7,965,339 535
CASH FLOWS FROM NONCAPITAL FINANCING ACTIVITIES:Transfer to Other Funds (753,231) -
Net Cash Provided (Used) by Noncapital Financing Activities (753,231) -
CASH FLOWS FROM CAPITAL AND RELATED FINANCING ACTIVITIES:Purchases of Capital Assets (587,470) - Interest Paid on Capital Debt (2,006,851) - Principal Paid on Capital Debt (2,894,158) - Proceeds from Debt 253,322 -
Net Cash Provided (Used) by Capital and Related Financing Activities (5,235,157) -
CASH FLOWS FROM INVESTING ACTIVITIES:Proceeds from Sales and Maturities of Investments - - Purchase of Investments (345,000) - Interest Received 253,940 -
Net Cash Provided/(Used) by Investing Activities (91,060) -
Net Increase (Decrease) in Cash and Cash Equivalents 1,885,891 535
Cash and Cash Equivalents - Beginning (3,417,909) 170,494 Cash and Cash Equivalents - Ending (1,532,018)$ 171,029$
Classified As:Cash and Cash Equivalents (1,794,169)$ 171,029$ Restricted Cash 262,151 -
Total Cash and Cash Equivalents, End of Year (1,532,018)$ 171,029$
The notes to the financial statements are an integral part of this statement.
City of Willmar, MinnesotaStatement of Cash Flows
Proprietary FundsFor the fiscal year ended December 31, 2017

25
Business-Type GovernmentalActivities Activities
Waste Treatment Internal ServicePlant Funds
Reconciliation of Operating Income to Net Cash Provided (Used) by Operating Activities:
Operating Income 5,059,970$ -$ Adjustments to Reconcile Operating Income to Net Cash Provided (Used) By Operating Activities:
Pension Expense for Required PERA Pension Liability 19,190 Depreciation 2,135,074 - Prior Period Adjustment of MUC Revenues from 2015 658,075 Change in Assets and Liabilities:
(Increase) Decrease in Acounts Receivable (708,996) 535 (Increase) Decrease in Due From Other Governmental Units 718,934 - (Increase) Decrease in Inventories 14,137 - (Increase) Decrease in Prepaid Items (1,397) - Increase (Decrease) in Accounts Payable 66,617 - Increase (Decrease) in Accrued Wages 3,735 -
Total Adjustments 2,905,369 535 Net Cash Provided (Used) by Operating Activities 7,965,339$ 535$
Non Cash Transactions:Net Increase (Decrease) in fair value of investments 35,137$ -$
The notes to the financial statements are an integral part of this statement.
Proprietary FundsFor the fiscal year ended December 31, 2017
City of Willmar, MinnesotaStatement of Cash Flows

NOTES TO FINANCIAL STATEMENTS

CITY OF WILLMAR, MINNESOTA NOTES TO FINANCIAL STATEMENTS
December 31, 2017 NOTE 1 SUMMARY OF SIGNIFICANT ACCOUNTING POLICIES The City of Willmar’s financial statements are prepared in accordance with generally accepted accounting principles (GAAP) as of and for the year ended December 31, 2017. The Governmental Accounting Standards Board (GASB) is responsible for establishing GAAP for state and local governments through its pronouncements (statements and interpretations). The more significant accounting policies established in GAAP and used by the City are discussed below. A. Financial Reporting Entity The City of Willmar was established in 1901 and is governed under a charter. The governing body consists of an eight member council, and mayor elected by eligible voters of the City. Four members are elected every two years for a four year term. The Mayor's office is for four years. The accompanying financial statements present the City's primary government and component units over which the City exercises significant influence. Significant influence or accountability is based primarily on operational or financial relationships with the City (as distinct from legal relationships). 1. Component Unit a. Discretely presented component units The component unit columns in the government-wide financial statements includes the financial data of the City's other component units. The units are reported in separate columns to emphasize that they are legally separate from the City but are included because the primary government is financially accountable and is able to impose its will on the organizations. Rice Memorial Hospital The hospital provides inpatient and outpatient health care services to the City of Willmar and surrounding area. The governing board of Rice Memorial Hospital is appointed by the City Council. The City may change the manner, mode and type of operations of the hospital to permit participation of other agencies. The City also has the power to overrule any decision, motion, resolution, rule, regulation, or order of the board and the legal liability for the general obligation portion of any debt remains with the City. Complete financial statements for Rice Memorial Hospital may be obtained at 301 Becker Avenue SW, Willmar, MN 56201. Willmar Municipal Utilities The Willmar Municipal Utilities (WMU) is responsible for the operation and management of the electric, water and district heating systems of the City of Willmar. WMU is governed by the Municipal Utilities Commission which is appointed by the Willmar City Council. The City also has the power to overrule any decision, motion, resolution, rule, regulation, or order of the board and the legal liability for the general obligation portion of any debt remains with the City. The rates for user charges and bond issuance authorizations are approved by the City Council. Complete financial statements for Willmar Municipal Utilities may be obtained at 700 Litchfield Avenue SW, Willmar, MN 56201. b. Excluded: Firefighters Association This association is organized as a non-profit organization by its members to provide pension and other benefits to such members in accordance with Minnesota Statutes. Their board of directors is appointed by the membership of the organization. All funding is conducted in accordance with Minnesota Statutes whereby State Aids flow to the association, tax levies are determined by the association and are only reviewed by the City, and the association pays benefits directly to its members.
26

CITY OF WILLMAR, MINNESOTA NOTES TO FINANCIAL STATEMENTS
December 31, 2017 B. Basic Financial Statements 1. Government-Wide Statements The government-wide financial statements (the statement of net position and the statement of activities) display information about the primary government and its component units. These statements include the financial activities of the overall City government, except for fiduciary activities. Eliminations have been made to minimize the double counting of internal activities. Governmental activities, which normally are supported by taxes and intergovernmental revenues, are reported separately from business-type activities, which rely to a significant extent on fees and charges to external parties for support. In the government-wide statement of net position, both the governmental and business-type activities columns: (a) are presented on a consolidated basis by column; and (b) are reported on a full accrual, economic resource basis, which recognizes all long-term assets and receivables as well as long-term debt and obligations. The City’s net position is reported in three parts: (1) invested in capital assets, net of related debt; (2) restricted net position; and (3) unrestricted net position. The statement of activities demonstrates the degree to which the direct expenses of each function of the City’s governmental activities and its business-type activities are offset by program revenues. Direct expenses are those clearly identifiable with a specific function or activity. Program revenues include: (1) fees, fines, and charges paid by the recipients of goods, services, or privileges provided by a given function or activity; and (2) grants and contributions restricted to meeting the operational or capital requirements of a particular function or activity. Revenues not classified as program revenues, including all taxes, are presented as general revenues. 2. Fund Financial Statements The accounts of the City are organized and operated on the basis of funds. A fund is an independent fiscal and accounting entity with a self-balancing set of accounts. Fund accounting segregates funds according to their intended purpose and is used to aid management in demonstrating compliance with finance-related legal and contractual provisions. The minimum number of funds is maintained consistent with legal and managerial requirements. The fund financial statements provide information about the City’s funds. Separate statements for each fund category-governmental, proprietary and fiduciary-are presented. The emphasis of governmental and proprietary fund financial statements is on major individual governmental and enterprise funds, with each displayed in a separate column in the fund financial statements. All remaining governmental and enterprise funds are aggregated and reported as nonmajor funds. a. Governmental Funds The City reports the following major governmental funds: General Fund The General Fund is the primary operating fund of the City and always classified as a major fund. It is used to account for all activities except those legally or administratively required to be accounted for in other funds. Debt Service Fund - Special Assessments Bond This fund accounts for the accumulation of financial resources for the payment of principal and interest on the City’s general obligation special assessment bonds.
27

CITY OF WILLMAR, MINNESOTA NOTES TO FINANCIAL STATEMENTS
December 31, 2017 Capital Project Fund – Street, Water and Sewer This fund is used to account for capital acquisition, construction and improvement projects related to streets, water and sewer. Special Revenue Fund – Industrial Development This fund is used to account for the local sales tax revenue. The resources are restricted for specific projects: connecting the Willmar Civic Center and Blue Line Center, the City walking and bike path system and the development of the land acquired through the relocation of the Willmar Airport. Special Revenue Fund – Community Investment This fund is used to account for surplus money in each separate improvement fund and in the improvement bond redemption fund which remain after the costs of each improvement have been fully funded. b. Enterprise Funds The City reports the following major enterprise fund: Waste Treatment Fund This fund is used to account for activities related to providing sewer services to the public. c. Internal Service Fund This fund is used to account for operations that provide services to other departments or agencies of the City, or to other governments, on a cost-reimbursement basis. d. Agency Funds Financial statements of agency funds, which are used to account for assets held by the City as an agent for individuals, private organizations, other governments, and/or other funds, are reported using the economic resources measurement focus and the accrual basis of accounting. Agency funds’ assets, liabilities, and net assets are included in the fiduciary statement of net assets. C. Measurement Focus and Basis of Accounting The government-wide statements are reported using the economic resources measurement focus and the accrual basis of accounting as are the proprietary fund financial statements. Revenues are recorded when earned, and expenses are recorded when a liability is incurred, regardless of the timing of related cash flows. Property taxes are recognized as revenues in the year for which they are levied. Shared revenues are generally recognized in the period the appropriation goes into effect. Grants and similar items are recognized as revenue as soon as all eligibility requirements imposed by the provider have been met. Governmental fund financial statements are reported using the current financial resources measurement focus and the modified accrual basis of accounting. Revenues are recognized as soon as they are both measurable and available. The City considers all revenues as available if collected within 60 days after the end of the current period, except for reimbursement (expenditure driven) grants for which the period is 90 days. Expenditures are recorded when the related fund liability is incurred, except for principal and interest on general long-term debt, compensated absences, and claims and judgments, which are recognized as expenditures to the extent
28

CITY OF WILLMAR, MINNESOTA NOTES TO FINANCIAL STATEMENTS
December 31, 2017 that they have matured. Proceeds of general long-term debt and acquisitions under capital leases are reported as other financing sources. Property taxes, sales taxes, hotel-motel taxes, licenses and permits, and interest associated with the current fiscal period are all considered to be susceptible to accrual and so have been recognized as revenues of the current fiscal period. Only the portion of special assessments receivable due within the current fiscal period is considered to be susceptible to accrual as revenue of the current period. All other revenue items are considered to be measurable and available only when cash is received by the City. Proprietary funds distinguish operating revenues and expenses from nonoperating items. Operating revenues and expenses generally result from providing services and producing and delivering goods in connection with a proprietary fund’s principal ongoing business operations. The principal operating revenues of the City’s enterprise and internal service funds are charges to customers for sales and services. Operating expenses for the City’s enterprise funds and internal service funds include the cost of sales and services, administrative expenses, and depreciation on capital assets. All revenues and expenses not meeting this definition are reported as nonoperating revenues and expenses.
When both restricted and unrestricted resources are available for use, it is the City’s policy to use unrestricted resources first, and then restricted resources as they are needed.
D. Assets, Deferred Outflows of Resources, Liabilities, Deferred Inflows of Resources, and Net Position/Fund Balance 1. Cash and Cash Equivalents The City has defined cash and cash equivalents to include cash on hand, demand deposits, and short-term investments with original maturities of three months or less from the date of acquisition. Additionally, each fund’s equity in the City’s investment pool is treated as a cash equivalent because the City can deposit or effectively withdraw cash at any time without prior notice or penalty. 2. Deposits and Investments The cash balances of substantially all funds are pooled and invested by the City in certificates of deposit and other authorized investments. Earnings on cash accounts are allocated to individual funds based upon an average of month-end balances. Investments are stated at fair value based on quoted market prices at the reporting date.
3. Receivables Activity between funds that are representative of lending/borrowing arrangements outstanding at the end of the fiscal year are referred to as either “due to/from other funds” (i.e., the current portion of interfund loans) or “advances to/from other funds” (i.e., the noncurrent portion of interfund loans). All other outstanding balances between funds are reported as “due to/from other funds”. Any residual balances outstanding between the governmental activities and business-type activities are reported in the government-wide financial statements as “internal balances”. Advances between funds, as reported in the fund financial statements, are offset by a fund balance reserve account in applicable governmental funds to indicate that they are not available for appropriation and are not expendable available financial resources. All receivables are shown net of an allowance for uncollectibles.
29

CITY OF WILLMAR, MINNESOTA NOTES TO FINANCIAL STATEMENTS
December 31, 2017 Property taxes are levied by the City Council in December of each year and are certified to Kandiyohi County for collection in the following year. The property taxes attach an enforceable lien on taxable property within the City on January 1 and are payable by the property owners in two installments in May and October. The County collects the taxes and periodically remits them to the City. The majority of these remittances are made in June and November. Taxes that are not received by the end of the year are classified as delinquent taxes receivable. Delinquent taxes receivable are offset by a deferred inflow of resources in the governmental funds of the fund financial statements because they are not available to finance current expenditures. Assessments are levied at various times upon City Council resolution for property owner improvements made by the City. Generally, assessment collections are deferred over periods ranging from one to ten years. Revenue from these assessments is recognized when assessed in the government-wide financial statements and as the annual installments become collectible in the governmental funds of the fund financial statements. Annual installments not collected as of each December 31 are classified as delinquent assessments receivable. Delinquent assessments receivable are offset by a deferred inflow of resources in the governmental funds of the fund financial statements because they are not available to finance current expenditures. 4. Prepaid Items Certain payments to vendors reflect costs applicable to future accounting periods and are reported as prepaid items in both government-wide and fund financial statements. 5. Capital Assets Capital assets include property, plant, equipment, and infrastructure assets (such as roads, bridges, sidewalks, and similar items), and are reported in the applicable governmental or business-type activities column in the government-wide financial statements and in the proprietary funds. Capital assets are defined by the government as assets with an initial, individual cost of more than $5,000 and an estimated useful life in excess of three years. Such assets are recorded at historical cost or estimated historical cost if purchased or constructed. Donated capital assets are recorded at estimated fair value at the date of donation. The costs of normal maintenance and repairs that do not add to the value of the asset or materially extend assets’ lives are not capitalized. Major outlays for capital assets and improvements are capitalized as projects are constructed. Interest incurred during the construction phase of capital assets of business-type activities is included as part of the capitalized value of the assets constructed. During the current period, the City did not have any capitalized interest. Property, plant, and equipment of the primary government are depreciated using the straight-line method over the following estimated useful lives:
Assets Years Buildings 25 - 50 Building improvements 25 - 50 Infrastructure 10 - 20 Furniture, equipment, and vehicles 3 - 20
30

CITY OF WILLMAR, MINNESOTA NOTES TO FINANCIAL STATEMENTS
December 31, 2017 6. Compensated Absences It is the City’s policy to permit employees to accumulate earned vacation and sick pay benefits. The liability for compensated absences is accrued when incurred in the government-wide and proprietary fund financial statements. A liability for these amounts is reported in the government funds only if they have matured. The City typically liquidates the liability for compensated absences to the fund where employees’ salaries were originally charged. 7. Deferred Outflows/Inflows of Resources In addition to assets, the statement of financial position and fund financial statements will sometimes report a separate section for deferred outflows of resources. Deferred outflows of resources represent a consumption of net position that applies to a future period(s) and so will not be recognized as an outflow of resources (expense/expenditure) until that time. The City of Willmar has one item that qualifies for reporting in this category – a deferred outflow relating to pension activity, reported in government-wide statement of net position and proprietary statement of net position. A deferred outflow relating to pension activity results from the net effect of the change in proportionate share and employer contributions. In addition to liabilities, the statement of financial position and fund financial statements will sometimes report a separate section for deferred inflows of resources. This separate financial statement element represents an acquisition of net position that applies to a future period(s) and so will not be recognized as an inflow of resources (revenue) until that time. The City of Willmar has one item that qualifies for reporting in this category under full accrual basis of accounting. Accordingly, the item, deferred inflow is reported in the government-wide statement of financial position and proprietary statement of net position. A deferred inflow relating to pension activity is a result of the net difference between projected and actual earning on plan investments. The City of Willmar also has one item that qualifies for reporting in this category under modified accrual basis of accounting. Accordingly, the item, unavailable revenue is reported only in the governmental funds balance sheet. The governmental funds report unavailable revenues from the following sources; taxes, special assessments and notes. These amounts are deferred and recognized as an inflow of resources in the period that the amounts become available. 8. Long-Term Obligations In the government-wide financial statements and proprietary fund types in the fund financial statements, long-term debt and other long-term obligations are reported as liabilities in the applicable governmental activities, business-type activities, or proprietary fund type statement of net position. Bond premiums and discounts are deferred and amortized over the life of the bonds using the straight-line method. Bonds payable are reported net of the applicable bond premium or discount. Bond issuance costs are reported as an expense in the period incurred. In the fund financial statements, governmental fund types recognize bond premiums and discounts, as well as bond issuance costs, during the current period. The face amount of the debt issued is reported as other financing sources. Premiums received on debt issuances are reported as other financing sources while discounts on debt issuances are reported as other financing uses. Issuance costs, whether or not withheld from the actual debt proceeds received, are reported as debt service expenditures. 9. Pensions For purposes of measuring the net pension liability or asset, deferred outflows/inflows of resources, and pension expense, information about the fiduciary net position of the Public Employees Retirement Association (PERA) and additions to/deductions from PERA’s fiduciary net position have been determined on the same basis as they are reported by PERA except that PERA’s fiscal year end is June 30. For this purpose, plan contributions are recognized as of employer payroll paid dates and benefit payments and refunds are recognized when due and payable in accordance with the benefit terms. Investments are reported at fair value.
31

CITY OF WILLMAR, MINNESOTA NOTES TO FINANCIAL STATEMENTS
December 31, 2017 10. Net Position/Fund Balances The government-wide and business-type activities fund financial statements use a net position presentation. Net position is categorized as net investment in capital assets (net of related debt), restricted and unrestricted:
Net Investment in Capital Assets - This category includes all capital assets, net of accumulated depreciation and the outstanding balances of debt that are attributable to the acquisition, construction or improvement of these assets. Restricted net position - This category presents external restrictions imposed by creditors, grantors, contributors or laws or regulations of other governments and restrictions imposed by law through constitutional provisions or enabling legislation.
Unrestricted net position – This category represents net position of the City, not restricted for any project or other purpose. In the governmental fund financial statements, fund balance is divided into five classifications based primarily on the extent to which the City is bound to observe constraints imposed upon the use of resources reported in governmental funds. These classifications are as follows: Nonspendable – Consists of amounts that cannot be spent because they are either not in spendable form or are legally or contractually required to be maintained intact, such as, inventories and prepaid items. Restricted – Consists of amounts related to externally imposed constraints established by creditors, grantors or contributors; or constraints imposed by state statutory provisions. Committed – Consists of amounts that are constrained for specific purposes that are internally imposed by formal action of the City Council. Those committed amounts cannot be used for any other purpose unless the Council removes or changes the specified use by taking the same type of action it employed to previously commit those amounts. Assigned – Consists of amounts intended for specific purposes set by the governing body itself or by an official to which the governing body delegates the authority. Pursuant to the City’s fund balance policy, the City Administrator is authorized to establish assignments of fund balance. Unassigned – Is the residual classification for the General Fund and reflects negative residual amounts in other funds. The City of Willmar uses unrestricted amounts to be spent first when both restricted and unrestricted fund balance is available. Additionally, the City would first use committed, then assigned, and lastly unassigned amounts of unrestricted fund balances when expenditures are made. 11. Use of Estimates The preparation of financial statements in conformity with accounting principles generally accepted in the United States of America requires management to make estimates and assumptions that affect the reported amounts of assets and liabilities and disclosure of contingent assets and liabilities at the date of the financial statements and the reported amounts of revenues and expenses during the reporting period. Actual results could differ from those estimates.
32

CITY OF WILLMAR, MINNESOTA NOTES TO FINANCIAL STATEMENTS
December 31, 2017
NOTE 2 STEWARDSHIP, COMPLIANCE AND ACCOUNTABILITY A. Budgets Annual budgets are adopted on a basis consistent with generally accepted accounting principles for all governmental funds and special revenue funds except some capital projects funds, which adopt project- length budgets. All annual appropriations except those for capital outlay lapse at fiscal yearend. On or before the first Tuesday in August of each year, all agencies of the government submit request for appropriations to the Mayor so that a budget may be prepared. In September, the proposed budget is presented to the City’s council for review. The council holds public hearings and a final budget must be prepared and adopted no later than December 31. The appropriated budget is prepared by fund, function and department. The government’s City Administrator may make transfers of appropriations within a department. Transfers of appropriations between departments require the approval of the governing council. The legal level of budgetary control is the department level. All supplemental budgetary appropriations in all funds were approved by the City Council.
B. Deficit Fund Balances There were no funds with a deficit fund balance as of December 31, 2017. NOTE 3 DETAILED NOTES ON ALL FUNDS A. Assets 1. Deposits and Investments Cash and cash equivalents 23,453,162$ Investments 112,511,259
135,964,421$
Primary GovernmentCash and cash equivalents 10,079,151$ Investments 35,718,813 Temporarily Restricted Cash 262,151
Total Primary Government 46,060,115$
Discretely Presented Component UnitsWillmar Municipal Utilities:
Cash and cash equivalents 5,607,333$ Investments 23,183,773 Restricted investments 1,567,028
Total Willmar Municipal Utilities 30,358,134$
Rice Memorial HospitalCash and cash equivalents 4,509,888$ Investments 35,028,456 Related-Party Investments - Temporarily restricted cash 2,994,639 Temporarily restricted investments 10,774,482 Permanently restricted investments 6,238,707
Total Rice Memorial Hospital 59,546,172$
Total 135,964,421$ 33

CITY OF WILLMAR, MINNESOTA NOTES TO FINANCIAL STATEMENTS
December 31, 2017 1. Deposits and Investments (continued) a. Deposits Minn. Stat. §§ 118A.02 and 118A.04 authorize the City to designate a depository for public funds and to invest in certificates of deposit. Minn. Stat. § 118A.03 requires that all City deposits be protected by insurance, surety bond, or collateral. The market value of collateral pledged shall be at least ten percent more than the amount on deposit plus accrued interest at the close of the financial institution’s banking day, not covered by insurance or bonds. Authorized collateral includes treasury bills, notes, and bonds; issues of U.S. government agencies; general obligations rated “A” or better, and revenue obligations rated “AA” or better; irrevocable standby letters of credit issued by the Federal Home Loan Bank; and certificates of deposit. Minnesota statutes require that securities pledged as collateral be held in safekeeping in a restricted account at the Federal Reserve Bank or in an account at a trust department of a commercial bank or other financial institution that is not owned or controlled by the financial institution furnishing the collateral. Custodial Credit Risk Custodial credit risk is the risk that in the event of a financial institution failure, the City’s deposits may not be returned to it. It is the City’s policy that collateral or bonds will be required for all uninsured amounts on deposit and the additional insurance will be documented to show compliance with state law and a perfected security interest under federal law. As of December 31, 2017, the City’s deposits were entirely covered by federal depository insurance or by collateral held by the City or its agent in the City’s name. b. Investments Minn. Stat. §§ 118A.04 and 118A.05 generally authorize the following types of investments as available to the City: (1) securities which are direct obligations or are guaranteed or insured issues of the United States, its agencies, its instrumentalities, or organizations created by an act of Congress, except mortgage-backed securities defined as “high risk” by Minn. Stat. § 118A.04, subd. 6; (2) mutual funds through shares of registered investment companies provided the mutual fund receives certain ratings depending on its investments; (3) general obligations of the State of Minnesota and its municipalities, and in certain state agency and local obligations of Minnesota and other states provided such obligations have certain specified bond ratings by a national bond rating service; (4) bankers’ acceptances of United States banks; (5) commercial paper issued by United States corporations or their Canadian subsidiaries that is rated in the highest quality category by two nationally recognized rating agencies and matures in 270 days or less; and (6) with certain restrictions, in repurchase agreements, securities lending agreements, joint powers investment trusts, and guaranteed investment contracts.
34

CITY OF WILLMAR, MINNESOTA NOTES TO FINANCIAL STATEMENTS
December 31, 2017 Interest Rate Risk Interest rate risk is the risk that changes in the market interest rates will adversely affect the fair value of an investment. It is the City’s policy to minimize its exposure to interest rate risk by investing in both shorter and longer-term investments and by timing cash flows from maturities so that a portion of the portfolio is maturing or coming close to maturity evenly over time, taking into account the City’s investment risk constraints, cash flow characteristics of the portfolio, and prudent investment principles.
Fair Value Less than 1 1-5 Years 6-10 YearsCertificates of Deposit 2,871,368$ 150,336$ 1,766,360$ 954,672$ Farmer Mac 1,866,758 - - 1,866,758 Federal Farm Credit Banks 4,869,694 - 1,949,974 2,919,720 Federal Home Loan Banks 18,709,143 - 983,115 17,726,028 Federal Home Loan Mortgage Corporation 8,277,549 - 994,420 7,283,129 Federal National Mortgage Association 5,070,979 - 986,680 4,084,299
41,665,491$ 150,336$ 6,680,549$ 34,834,606$
Investment Maturities in Years
Credit Risk Generally, credit risk is the risk that an issuer of an investment will not fulfill its obligation to the holder of the investment. This is measured by the assignment of a rating by a nationally recognized statistical rating organization. It is the City’s policy to invest only in securities that meet the ratings requirements set by state statute. The City’s investments are rated as follows:
Rating
Commerical Paper A1/P1 and A1+/P1US Government Securities AAAMutual/Bond Funds Not Rated
Custodial Credit Risk The custodial credit risk for investments is the risk that, in the event of the failure of the counterparty to a transaction, a government will not be able to recover the value of investment or collateral securities in the possession of an outside party. The City’s policy is that brokers may hold City investments only to the extent that there is SIPC and excess SIPC coverage available. The issuers and amounts that exceed five percent of the City’s investments are as follows:
Issuer Amount PercentMorgan Stanley Smith Barney 7,698,549$ 18%Multi-Bank Securities 8,919,462$ 21%United Bank Services 9,015,764$ 22%Wells Fargo 7,698,911$ 19%Wells Fargo Advisors 8,332,805$ 20%
35

CITY OF WILLMAR, MINNESOTA NOTES TO FINANCIAL STATEMENTS
December 31, 2017
Concentration of Credit Risk The concentration of credit risk is the risk of loss that may be caused by the City’s investment in a single issuer. The City’s investment policy dictates that it will diversify its investments by security type and by institution. The security types and amounts that exceed five percent of the City’s total investments are as follows:
Amount PercentCertificates of Deposit 2,871,638$ 7%Federal Farm Credit Banks 4,869,694$ 12%Federal Home Loan Banks 18,709,143$ 45%Federal Home Loan Mortgage Corporation 8,277,549$ 20%Federal National Mortgage Association 5,070,979$ 12%
Security Type
Fair Value Measurements Accounting guidance provides a framework for measuring fair value of certain assets and liabilities and requires certain disclosures about fair value measurements. As defined in GASB Statement No. 72, Fair Value Measurement and Application (GASB No. 72), fair value is the price that would be received to sell an asset or paid to transfer a liability in an orderly transaction between market participants at the measurement date. GASB No. 72 establishes a fair value hierarchy that prioritizes the inputs used to measure fair value. The hierarchy gives the highest priority to unadjusted quoted prices in active markets for identical assets or liabilities (Level 1 measurements) and the lowest priority to unobservable inputs (Level 3 measurements). The three levels of the fair value hierarchy defined by GASB No. 72 and description of the valuation methodologies used for instruments measured at fair value are as follows: Level 1: Inputs are quoted prices (unadjusted) in active markets for identical assets or liabilities as of the reporting date. Level 2: Pricing inputs are other than quoted prices included in Level 1 that are observable for an asset or liability, either directly or indirectly. Level 3: Pricing inputs include those that are significant to the fair value measurement of the financial asset or liability and are not observable from objective sources. These inputs may be used with internally developed methodologies that result in management’s best estimate of fair value. The City’s assets and liability measured at fair value on a recurring basis are limited to investments. The fair values of the City’s investments in mutual funds, corporate debt and notes, government and agency obligations and equity securities included in Level 1 were determined through unadjusted, quoted prices in active markets. The fair values of the Level 2 investments are recorded based on securities with similar characteristics in active markets. Due to the level of risk associated with certain investments, it is reasonably possible that changes in the values of the investments will occur in the near term and that such changes could materially affect the City’s investments and the amounts reported in the statements of revenues, expenses and changes in net position. These methods may produce a fair value calculation that may not be indicative of net realizable value or reflective of the future fair values. Furthermore, while the City believes it valuation methods are appropriate and consistent with other market participants, the use of different methodologies or assumptions to determine the fair value of certain financial instruments could result in a different estimate of fair value at the reporting date. The following table sets forth, by level within the fair value hierarchy, the City’s financial; assets measured at fair value on a recurring basis at December 31, 2017:
36

CITY OF WILLMAR, MINNESOTA NOTES TO FINANCIAL STATEMENTS
December 31, 2017 Fair Value Measurements (continued)
Quoted Prices in Significant Other SignificantActive Markets for Observable Unabservable
Identical Assets Inputs InputsFair Value (Level 1) (Level 2) (Level 3)
Financial Assets:Certificates of Deposit 2,871,368$ -$ 2,871,368$ -$ Farmer Mac 1,866,758 1,866,758 - - Federal Farm Credit Banks 4,869,694 4,869,694 - - Federal Home Loan Banks 18,709,143 18,709,143 - - Federal Home Loan Mortgage Corporation 8,277,549 8,277,549 - - Federal National Mortgage Association 5,070,979 5,070,979 - -
41,665,491$ 38,794,123$ 2,871,368$ -$
Fair Value Measurements at Reporting Date Using:
The financial assets disclosed in the fair value hierarchy above are reported in investments and restricted investments on the statement of net position. 2. Capital Assets Capital asset activity for the year ended December 31, 2017, was as follows: Governmental Activities
Balance BalanceJanuary 1, December 31,
2017 Additions Deletions 2017Governmental ActivitiesCapital assets not being depreciated
Land 8,585,806$ -$ -$ 8,585,806$ Construction in progress 15,891,519 5,618,770 9,582,403 11,927,886
Total 24,477,325 5,618,770 9,582,403 20,513,692
Capital assets being depreciatedBuildings and structures 14,098,229 27,997 - 14,126,226 Furniture and equipment 3,335,503 208,151 59,060 3,484,594 Machinery and auto 9,026,127 965,592 319,578 9,672,141 Other improvements 119,312,161 9,611,533 - 128,923,694
Total 145,772,020 10,813,273 378,638 156,206,655
Less accumulated depreciation for:Buildings 4,909,509 311,552 - 5,221,061 Furniture and equipment 1,847,271 139,636 53,154 1,933,753 Machinery and equipment 4,158,631 626,999 281,743 4,503,887 Other improvements 65,523,277 4,701,504 - 70,224,781
Total 76,438,688 5,779,691 334,897 81,883,482
Net property and equipment 93,810,657$ 10,652,352$ 9,626,144$ 94,836,865$
37

CITY OF WILLMAR, MINNESOTA NOTES TO FINANCIAL STATEMENTS
December 31, 2017 2. Capital Assets (continued) Business-Type Activities
Balance BalanceJanuary 1, December 31,
2017 Additions Deletions 2017Business-Type ActivitiesCapital assets not being depreciated
Land 2,005,122$ -$ -$ 2,005,122$ Construction in progress 1,688,547 66,103 1,006,698 747,952
Total 3,693,669 66,103 1,006,698 2,753,074
Capital assets being depreciatedBuildings and structures 63,705,752 - - 63,705,752 Furniture and equipment 513,168 - 78,995 434,173 Machinery and auto 6,404,539 232,050 29,707 6,606,882 Other improvements 26,779,976 1,102,576 - 27,882,552
Total 97,403,435 1,334,626 108,702 98,629,359
Less accumulated depreciation for:Buildings 9,586,948 1,254,728 - 10,841,676 Furniture and equipment 344,197 21,358 47,792 317,763 Machinery and auto 2,058,880 392,390 26,736 2,424,534 Other improvements 3,654,781 541,125 - 4,195,906
15,644,806 2,209,601 74,528 17,779,879
Net property and equipment 85,452,298$ (808,872)$ 1,040,872$ 83,602,554$
Component Units
38
2017 2016 2017 2016
Land 2,918,000$ 2,918,000$ 1,385,906$ 1,385,907$ Buildings 103,540,000 103,346,000 3,910,460 3,916,095 Furniture and equipment 47,257,000 44,931,982 80,383,366 78,814,034 Machinery and auto - - - - Other improvements 1,696,000 1,686,000 - - Utility Plant in Service - - - - Construction in progress 249,000 - 773,582 2,828,747
Less: Depreciation (95,471,413) (90,106,000) (55,172,444) (55,719,319)
60,188,587$ 62,775,982$ 31,280,870$ 31,225,464$
Rice Memorial Hospital Willmar Municipal Utilities

CITY OF WILLMAR, MINNESOTA NOTES TO FINANCIAL STATEMENTS
December 31, 2017 2. Capital Assets (continued)
Depreciation expense was charged to functions/programs of the primary government as follows: Governmental Activities
General government 58,050$ Public safety 252,899 Public works 5,172,578 Culture and recreation 296,163
Total Depreciation Expense - Governmental Activities 5,779,690$
Business-Type ActivitiesWaste treatment 2,209,601$
Total Depreciation Expense - Business-Type Activities 2,209,601$
Construction Commitments The City has active construction projects as of December 31, 2017. The projects include street improvements, airport turf runway improvements, and wastewater treatment improvements and storm water upgrades. At year end the City’s commitments with contractors were as follows:
RemainingConstruction Projects Commitment
Street Projects 11,927,886$ Waste Treatment Plant 747,952 Total 12,675,838$
B. Interfund Receivables, Payables and Transfers 1. Due from/Due to
Receivable fund Payable fund AmountGeneral Fund Capital Projects - Capital Improvements 3,263$ Special Revenue - Industrial Development Capital Projects - Street, Water, Sewer 86,000$ Debt Service - Special Assessment Bonds Special Revenue - Community Investment 39,653$ Debt Service - Special Assessment Bonds Capital Projects - Street, Water, Sewer 1,377,952$ Capital Projects - Street, Water, Sewer Special Revenue - Community Investment 1,245$ Capital Projects - Airport Special Revenue - Airport 59,000$ Capital Projects - Capital Improvements General Fund 600,000$ Office Services General Fund 3,571$
2,170,683$
39

CITY OF WILLMAR, MINNESOTA
NOTES TO FINANCIAL STATEMENTS December 31, 2017
2. Transfers Transfers are indicative of funding for capital projects, lease payments or debt service, subsidies of various City operations and re-allocations of special revenues. The following schedule briefly summarizes the City’s transfer activity:
C. Liabilities 1. Deferred Inflows of Resources Deferred Inflows of Resources consists of taxes and special assessments receivable that are not collected soon enough after year-end to pay liabilities of the current period and prepayments that have been received but not earned.
Unavailable Taxes 88,473$ Unavailable Special Assessments 3,821,362 Unavailable Notes Receivable 356,806 Unavailable Rental Revenue 2,054 Unavailable Interfund Loans 86,000 Unavailable Intergovernmental Revenue 129,926
4,484,621$
Deferred Inflows of Resources
40
Funds transferred to Funds transferred from
General Fund 285,008$ Nonmajor Special Revenue 9,500$ Enterprise Fund Waste Treatment 275,000 Agency Fund 508
285,008
Special Revenue - Community Investm. 511,852 Nonmajor Special Revenue Fund 400,000 Special Assessments Bonds 111,852
511,852
Nonmajor Special Revenue Funds 548,939 General Fund 133,939 Enterprise Fund - Waste Treatment 415,000
548,939
Special Assessments Bonds 2,334,729 Special Revenue - Community Investment 956,517 Capital Projects - Street, Water, Sewer 1,377,952 Enterprise Fund - Waste Treatment 260
2,334,729
Nonmajor Debt Service Fund 183,643 Nonmajor Special Revenue Fund 183,643
Capital Projects - Street, Water, Sewer 641,245 General Fund 600,000 Special Revenue - Community Investment 1,245 Enterprise Fund - Waste Treatment 40,000
641,245
Nonmajor Capital Projects 1,996,347 General Fund 1,937,347 Nonmajor Special Revenue Fund 59,000
1,996,347
Total 6,501,763$ Total 6,501,763$

CITY OF WILLMAR, MINNESOTA NOTES TO FINANCIAL STATEMENTS
December 31, 2017 C. Liabilities (continued) 2. Long-Term Debt The long-term debt obligations outstanding at year end are summarized as follows:
Primary Government Interest
Rates Date
Issued Date
Matures Original Issue Outstanding at
12/31/2017 Governmental Activities
G.O. Special Assessments2007A Improvement Bond 3.75-4.00 2007 2018 3,285,000 325,000 2007B Improvement Bond 4 2007 2018 1,725,000 185,000 2008 Improvement Bond 3.00-4.00 2008 2019 1,530,000 300,000 2010 Improvement Bond 2.00-3.00 2010 2021 1,785,000 700,000 2011 Improvement Bond .60-2.85 2011 2022 1,825,000 900,000 2012 Improvement Bond 2.00-2.25 2012 2023 1,460,000 800,000 2013 Improvement Bond 2.00-3.00 2013 2024 1,910,000 1,330,000 2014 Improvement Bond 2.17 2014 2025 1,000,000 817,000 2015 Improvement Bond 2.625 2015 2026 1,400,000 1,291,000 2016 Improvement Bond 2.50 2016 2027 1,600,000 1,600,000 2017 Improvement Bond 3.25 2017 2028 1,100,000 1,100,000
Total Special Assessment Bonds 18,620,000 9,348,000 G.O. Revenue Bonds
2004 Airport Bond 2.00-4.05 2004 2020 2,100,000 520,000
Total G.O. Revenue Bonds 2,100,000 520,000 Tax Increment Financing Notes
2015 Jennie-O Turkey Store 2015 594,304 594,304
Total Tax Increment Financing Notes 594,304 594,304 Total Governmental Activities 21,314,304$ 10,462,304$ Business-Type Activities
G.O. Revenue Notes and Bonds2008 Waste Treatment Note 3.275 2008 2028 42,001,362 31,575,000 2008 Waste Treatment Note 0 2008 2030 7,000,000 7,000,000 2009 Waste Treatment Note 2.457 2009 2029 1,711,867 1,123,151 2009 Waste Treatment Note 3.44 2009 2038 27,663,530 23,072,000 2013 Waste Treatment Note 1.124 2013 2042 1,886,812 * 1,560,407 2014 Waste Treatment Note 1.00 2014 2034 3,000,000 ^ 2,775,054 2016 Waste Treatment Note 1.04 2016 2036 1,046,528 > 970,052
Total G.O. Revenue Notes 84,310,099 68,075,664
2004 Waste Treatment Bond 1.45-4.15 2004 2019 1,410,000 235,000
Total G.O. Revenue Notes and Bonds 85,720,099 68,310,664 Total Business-Type Activities 85,720,099$ 68,310,664$
Total Primary Government 107,034,403$ 78,772,968$
*Includes Undrawn Proceeds of $304,593. Loan not finalized as of 12/31/17^Includes Undrawn Proceeds of $164,946. Loan not finalized as of 12/31/17>Includes Undrawn Proceeds of $56,948. Loan not finalized as of 12/31/17
41

CITY OF WILLMAR, MINNESOTA NOTES TO FINANCIAL STATEMENTS
December 31, 2017 2. Long-Term Debt (continued)
3. Long-Term Debt Maturities Long-Term Debt maturities are as follows:
Year Principal Interest
2018 1,706,000$ 214,157$ 2019 1,309,000 187,181 2020 1,164,000 155,053 2021 1,181,000 123,855 2022 1,025,000 94,401 2023-2027 2,836,000 178,918 2028-2032 127,000 2,064
Total 9,348,000$ 955,629$
Governmental Activities
General Obligation Special Assessments Bonds
42
Interest Rates
Date Issued
Date Matures Original Issue
Outstanding at 12/31/2017
Component Units Municipal Utilities
Revenue Bonds2009 Bond 3.50-5.00 2009 2025 8,120,000$ 5,400,000$
Total Revenue Bonds 8,120,000 5,400,000
Total Municipal Utilities 8,120,000$ 5,400,000$
Rice Memorial HospitalRevenue Notes
2013 Care Center 3.65-15.00 2013 2034 9,100,000$ 7,798,400$
G.O. Revenue Bonds2012 Bond 2.00-4.00 2012 2032 40,910,000 33,545,000
Lease PayableRice Home Medical Variable 2010 Ongoing 301,394 1,892,004
Total Rice Memorial Hospital 50,311,394$ 43,235,404$

CITY OF WILLMAR, MINNESOTA NOTES TO FINANCIAL STATEMENTS
December 31, 2017 3. Long-Term Debt Maturities (Continued) Long-Term Debt maturities (continued):
Year Principal Interest Principal Interest
2018 165,000 17,466 115,000 7,309 2019 175,000 10,790 120,000 2,490 2020 180,000 3,645 - -
Total 520,000$ 31,901$ 235,000$ 9,799$
Governmental Activities Business-Type Activities
General Obligation Revenue Bonds
Year Principal Interest
2018 2,852,000$ 1,911,077$ 2019 2,940,000 1,829,619 2020 3,050,000 1,740,758 2021 3,024,000 1,647,530 2022 3,116,000 1,553,195 2023-2027 24,290,000 6,015,320 2028-2032 19,352,151 2,376,396 2033-2037 7,974,000 1,053,193 2038-2042 2,004,000 68,780
Total 68,602,151$ 18,195,868$
Business-Type Activities
General Obligation Revenue Notes
43

CITY OF WILLMAR, MINNESOTA NOTES TO FINANCIAL STATEMENTS
December 31, 2017 4. Long-Term Debt Maturities (continued)
Component Units:Year Principal Interest Principal Interest
2018 575,000$ 255,031$ 2,071,300$ 1,664,852$ 2019 600,000 229,156 2,163,200 1,573,269 2020 625,000 202,156 2,265,900 1,469,023 2021 655,000 174,032 2,327,400 1,537,834 2022 685,000 143,738 2,288,000 1,441,634 2023-2027 2,260,000 227,700 13,282,700 5,346,697 2028-2032 - - 15,724,300 2,995,942 2033-2037 - - 1,220,600 143,707
Total 5,400,000$ 1,231,813$ 41,343,400$ 16,172,958$
Municipal Utilities Rice Memorial Hospital
5. Changes in Long-Term Liabilities
44
Balance 01/01/2017 Increases Decreases
Balance 12/31/2017
Due Within One Year
Primary Government Governmental Activities G.O. Special Assessment Bonds 9,999,000$ 1,100,000$ 1,751,000$ 9,348,000$ 1,706,000$ G.O. Revenue Bonds 680,000 - 160,000 520,000 165,000 TIF Note Payable-Jennie-O 594,304 - - 594,304 - Compensated Absences 3,663,037 14,190 314,343 3,362,884 - Net OPEB Liability 390,282 223,771 142,866 471,187 - Net Pension Liability 13,392,192 - 7,390,092 6,002,100 - Total Governmental Activities 28,718,815 1,337,961 9,758,301 20,298,475 1,871,000
Business-Type Activities G.O. Revenue Notes 70,606,500 253,322 2,784,158 68,075,664 2,852,000 G.O. Revenue Bonds 345,000 - 110,000 235,000 115,000 Net Pension Liability 804,916 - 201,362 603,554 - Total Business-Type Activities 71,756,416 253,322 3,095,520 68,914,218 2,967,000
Total Primary Government 100,475,231$ 1,591,283$ 12,853,821$ 89,212,693$ 4,838,000$
Component Units Municipal Utilities Revenue Bonds 5,950,000$ -$ 550,000$ 5,400,000$ 575,000$ Bond Discount (19,657) 2,140 - (17,517) -$ Compensated Absences 923,510 442,158 393,362 972,306 - OPEB Liability 262,259 93,624 139,766 216,117 - Net Pension Liability 5,082,810 1,638,090 2,826,700 3,894,200 - Total Municipal Utilities 12,198,922 2,176,012 3,909,828 10,465,106 575,000
Rice Memorial Hospital G.O. Revenue Bonds 35,095,000 - 1,550,000 33,545,000 1,605,000 Revenue Notes 8,248,200 - 449,800 7,798,400 466,300 Capital Lease Payable 1,386,237 869,194 363,427 1,892,004 427,795 Total Rice Memorial Hospital 44,729,437 869,194 2,363,227 43,235,404 2,499,095
Total Component Units 56,928,359$ 3,045,206$ 6,273,055$ 53,700,510$ 3,074,095$

CITY OF WILLMAR, MINNESOTA NOTES TO FINANCIAL STATEMENTS
December 31, 2017 D. Fund Balance Detail The following is a detail of Governmental Fund Balances at December 31, 2017:
Nonspendable Restricted CommittedGeneral Fund
Prepaids/Deposits 329,298$ -$ -$ Working Capital - - 4,000,000 Year 2018 - - 1,451,938 Year 2019 - - 849,079 Retirees Sick Leave Held - - 133,949 Self-Insurance - - 1,000,000 Petty Cash - - 3,650 Current Employees Ins BuyOut - - 1,137,006 Current Employees Sick Leave - - 1,493,834 Current Employees Vacation - - 413,414 Retiree Insurance BuyOut - - 318,630 Next Year's Budget - - 1,300,000 Current Year Emergency - - 1,300,000
Special Revenue FundsIndustrial Development - - 597,715 Industrial Development-CP Airport - - 17,110 Industrial Development-P.I.R. - - 1,000,000 CVB-Prepaids 8,730 - - CVB - - 231,540 CVB-Petty Cash - - 50 Willmar Municipal Airport 254 - 217,247 Library Improvement Reserve - - 162,193 Community Investment - - 8,403,504 Community Investment-PIR - - 750,000 Public Works Reserve - - 963,780 Law Enforcement Forfeiture Fund - 65,058 - Law Enforcement Explorer Fund - 6,630 -
Debt Service FundsSpecial Assessments Funds - 6,907,518 - Nonmajor Airport Debt Service 175,321 (5,179) - Nonmajor TIF Debt Service - 58,700 -
Capital Projects FundsStreet Projects - - 630,920 Nonmajor Capital Improvements
Airport - - 73,698 Year 2018 70,502 - 264,739 Fire Department - - 321,600 Public Works - - 130,000 Auditorium - - 100,000 Leisure Services - - 385,746
Permanent Funds 30,000 4,439 -
Totals 614,105$ 7,037,166$ 27,651,342$
Fund
45

CITY OF WILLMAR, MINNESOTA NOTES TO FINANCIAL STATEMENTS
December 31, 2017 NOTE 4 DEFINED BENEFIT PENSION PLANS A. Plan Description The City of Willmar participates in the following cost-sharing multiple-employer defined benefit pension plans administered by the Public Employees Retirement Association of Minnesota (PERA). PERA’s defined benefit pension plans are established and administered in accordance with Minnesota Statutes, Chapters 353 and 356. PERA’s defined benefit pension plans are tax qualified plans under Section 401(a) of the Internal Revenue Code. 1. General Employees Retirement Fund All full-time and certain part-time employees of the City of Willmar are covered by the General Employees Fund. General Employees Plan members belong to either the Coordinated Plan or the Basic Plan. Coordinated Plan members are covered by Social Security and Basic Plan members are not. The Basic Plan was closed to new members in 1967. All new members must participate in the Coordinated Plan.
2. Public Employees Police and Fire Fund The Police and Fire Plan, originally established for police officers and firefighters not covered by a local relief association, now covers all police officers and firefighters hired since 1980. Effective July 1, 1999, the Police and Fire Plan also covers police officers and firefighters belonging to local relief associations that elected to merge with and transfer assets and administration to PERA. Benefits Provided PERA provides retirement, disability, and death benefits. Benefits provisions are established by state statute and can only be modified by the state legislature. Benefit increases are provided to benefit recipients each January. Increases are related to the funding ratio of the plan. Members in plans that are at least 90% funded for two consecutive years are given 2.50% increases. Members in plans that have not exceeded 90% funded, or have fallen below 80%, are given 1% increases. The benefit provisions stated in the following paragraphs of this section are current provisions and apply to active plan participants. Vested, terminated employees who are entitled to benefits but are not receiving them yet are bound by the provisions in effect at the time they last terminated their public service. 1. General Employees Plan Benefits General Employees Plan benefits are based on a member’s highest average salary for any five successive years of allowable service, age, and years of credit at termination of service. Two methods are used to compute benefits for PERA’s Coordinated and Basic Plan members. The retiring member receives the higher of a step-rate benefit accrual formula (Method 1) or a level accrual formula (Method 2). Under Method 1, the annuity accrual rate for a Basic Plan member is 2.20% of average salary for each of the first ten years of service and 2.70% for each remaining year. The annuity accrual rate for a Coordinated Plan member is 1.20% of average salary for each of the first ten years and 1.70% for each remaining year. Under Method 2, the annuity accrual rate is 2.70% of average salary for Basic Plan members and 1.70% for Coordinated Plan members for each year of service. For members hired prior to July 1, 1989, a fully annuity is available when age plus year of service equal 90 and normal retirement age is 65. For members hired on or after July 1, 1989, normal retirement age is the age for unreduced Social Security benefits capped at 66. 2. Police and Fire Plan Benefits Benefits for the Police and Fire Plan members first hired after June 30, 2010, but before July 1, 2014, vest on a prorated basis from 50% after five years up to 100% after ten years of credited service. Benefits for Police and Fire members first hired after June 30, 2014, vest on a prorated basis from 50% after ten years up to 100% after
46

CITY OF WILLMAR, MINNESOTA NOTES TO FINANCIAL STATEMENTS
December 31, 2017 NOTE 4 DEFINED BENEFIT PENSION PLANS (continued) twenty years of credited service. The annuity accrual rate is 3% of average salary for each year of service. For Police and Fire Plan members who were first hired prior to July 1, 1989, a full annuity is available when age plus years of service equals at least 90. B. Contributions Minnesota Statutes Chapter 353 sets the rates for employer and employee contributions. Contribution rates can only be modified by the state legislature. 1. General Employees Fund Contributions Basic Plan members and Coordinated Plan members were required to contribute 9.10% and 6.50%, respectively, of their annual covered salary in calendar year 2017. The City of Willmar was required to contribute 11.78% of pay for Basic Plan members and 7.50% for Coordinated Plan members in calendar year 2017. The City of Willmar’s contributions to the General Employees Fund for the year ended December 31, 2017, were $279,953. The City of Willmar’s contributions were equal to the required contributions as set by state statute. 2. Police and Fire Fund Contributions Plan members were required to contribute 10.80% of their annual covered salary in calendar year 2017. The City of Willmar was required to contribute 16.20% of pay for members in calendar year 2017. The City of Willmar’s contributions to the Police and Fire Fund for the year ended December 31, 2017, were $390,745. The City of Willmar’s contributions were equal to the required contributions as set by state statute. C. Pension Costs 1. General Employees Fund Pension Cost At December 31, 2017, the City of Willmar reported a liability of $3,581,387 for its proportionate share of the General Employees Fund’s net pension liability. The City of Willmar’s net pension liability reflected a reduction due to the State of Minnesota’s contribution of $6 million to the fund in 2017. The State of Minnesota is considered a non-employer contributing entity and the state’s contribution meets the definition of a special funding situation. The State of Minnesota’s proportionate share of the net pension liability associated with the City of Willmar’s totaled $45,058. The net pension liability was measured as of June 30, 2017, and the total pension liability used to calculate the net pension liability was determined by an actuarial valuation as of that date. The City of Willmar’s proportion of the net pension liability was based on the City of Willmar’s contributions received by PERA during the measurement period for employer payroll paid dates from July 1, 2016, through June 30, 2017, relative to the total employer contributions received from all of PERA’s participating employers. At June 30, 2017, the City of Willmar’s proportion share was .0561% which was a decrease of .0026% from its proportion measured as of June 30, 2016. For the year ended December 31, 2017, the City of Willmar recognized pension expense of $146,901 for its proportionate share of the General Employees Plan’s pension expense. In addition, the City of Willmar recognized an additional $1,301 as pension expense (and grant revenue) for its proportionate share of the State of Minnesota’s contribution of $6 million to the General Employees Fund.
47

CITY OF WILLMAR, MINNESOTA NOTES TO FINANCIAL STATEMENTS
December 31, 2017 NOTE 4 DEFINED BENEFIT PENSION PLANS (continued) At December 31, 2017, the City of Willmar reported its proportionate share of the General Employees Plan’s deferred outflows of resources and deferred inflows of resources related to pensions from the following sources:
Deferred DeferredOutflows Inflows
of Resources of Resources
118,032$ 243,517$
622,144 359,034
667,345 608,092
- 306,046
143,398 -
Totals 1,550,919$ 1,516,689$
Difference between projected and actual investment earnings
Differences between expected and actual economic experience
Changes in proportion
Contributions paid to PERA subsequent to the measurement date
Changes in actuarial assumptions
Deferred outflows of resources related to pensions, resulting from the City of Willmar’s contributions made subsequent to the measurement date, of $143,398 will be recognized as a reduction of the net pension liability in the year ended December 31, 2018. Other amounts reported as deferred outflows and inflows of resources related to pensions will be recognized in pension expense as follows:
Year ended December 31:
Pension Expense Amount
2018 13,553$ 2019 142,275$ 2020 (112,972)$ 2021 (152,024)$
2. Police and Fire Fund Pension Costs At December 31, 2017, the City of Willmar reported a liability of $3,024,267 for its proportionate share of the Police and Fire Fund’s net pension liability. The net pension liability was measured as of June 30, 2017, and the total pension liability used to calculate the net pension liability was determined by an actuarial valuation as of that date. The City of Willmar’s proportion of the net pension liability was based on the City of Willmar’s contributions received by PERA during the measurement period for employer payroll paid dates from July 1, 2016 through June 30, 2017, relative to the total employer contributions received from all of PERA’s participating employers. At June 30, 2017, the City of Willmar’s proportion was .224% which was a decrease of .011% from its proportion measured as of June 30, 2016. The City of Willmar also recognized $20,160 for the year ended December 31, 2017 as revenue and an offsetting reduction of net pension liability for its proportionate share of the State of Minnesota’s on-behalf contributions to the Police and Fire Fund. Legislation passed in 2013 required the State of Minnesota to begin contributing $9 million to the Police and Fire Fund each year, starting in fiscal year 2014. For the year ended December 31, 2017, the City of Willmar recognized pension expense of ($388,765) for its proportionate share of the Police and Fire Plan’s pension expense.
48

CITY OF WILLMAR, MINNESOTA NOTES TO FINANCIAL STATEMENTS
December 31, 2017 NOTE 4 DEFINED BENEFIT PENSION PLANS (continued) At December 31, 2017, the City of Willmar reported its proportionate share of the Police and Fire Plan’s deferred outflows of resources and deferred inflows of resources related to pensions from the following sources:
Deferred outflows of resources related to pensions, resulting from the City of Willmar’s contributions made subsequent to the measurement date, of $199,589 will be recognized as a reduction of the net pension liability in the year ended December 31, 2017. Other amounts reported as deferred outflows and inflows of resources related to pensions will be recognized in pension expense as follows:
Year ended December 31:
Pension Expense Amount
2018 11,693$ 2019 11,693$ 2020 (107,089)$ 2021 (276,820)$ 2022 (918,393)$
D. Actuarial Assumptions The total pension liability in the June 30, 2017, actuarial valuation was determined using the following actuarial assumptions:
Inflation 2.5% per yearActive Member Payroll Growth 3.25% per yearInvestment Rate of Return 7.50%
Salary increases were based on a service-related table. Mortality rates for active members, retirees, survivors and disabilitants were based on RP 2014 tables for all plans males or females, as appropriate, with slight adjustments to fit PERA’s experience. Cost of living benefit increases for retirees are assumed to be 1.00% per year for the General Employees Plan through 2044 and Police and Fire Plan through 2064 and then 2.50% thereafter for both plans. Actuarial assumptions used in the June 30, 2017, valuation was based on the results of actuarial experience studies. The most recent four-year experience study in the General Employees Plan was completed in 2015. The most recent five-year experience study for Police and Fire Plan was completed in 2016.
49
Deferred DeferredOutflows Inflows
of Resources of Resources
Differences between expected and actual economic experience 69,612$ 853,736$ Changes in actuarial assumptions 4,152,215 4,293,708 Difference between projected and actual investment earnings 1,055,296 959,645 Change in proportion - 448,950 Contributions paid to PERA subsequent to the measurement date 199,589 -
Totals 5,476,712$ 6,556,039$

CITY OF WILLMAR, MINNESOTA NOTES TO FINANCIAL STATEMENTS
December 31, 2017 NOTE 4 DEFINED BENEFIT PENSION PLANS (continued) The following changes in actuarial assumptions occurred in 2017: General Employees Fund:
• The Combined Service Annuity (CSA) loads were changed from 0.80% for active members and 60% for vested and non-vested deferred members. The revised CSA loads are now 0.00% for active member liability, 15.00% for vested deferred member liability and 3.00% for non-vested deferred member liability.
• The assumed post-retirement benefit increase rate was changed from 1.00% per year for all years to 1.0% per year through 2044 and 2.50% per year thereafter.
Police and Fire Fund:
• Assumed salary increases were changed as recommended in the June 30, 2016 experience study. The net effect is proposed rates that average 0.34% lower than the previous rates.
• Assumed rates of retirement were changed, resulting in fewer retirements.
• The Combined Service Annuity (CSA) load was 30.00% for vested and non-vested deferred members. The CSA has been changed to 33.00% for vested members and 2.00% for non-vested members.
• The base mortality table for healthy annuitants was changed from the RP-2000 fully generational
table to the RP-2014 fully generational table (with a base year of 2006), with male rates adjusted by a factor of 0.96. The mortality improvement scale was changed from Scale AA to Scale MP-2016. The base mortality table for disabled annuitants was changed from the RP-2000 disabled mortality table to the mortality tables assumed for healthy retirees.
• Assumed termination rates were decreased to 3.00% for the first three years of service. Rates beyond
the select period of three years were adjusted, resulting in more expected terminations overall.
• Assumed percentage of married female members was decreased from 65.00% to 60.00%.
• Assumed age difference was changed from separate assumptions for male members (wives assumed to be three years younger) and female members (husbands assumed to be four years older) to the assumption that males are two years older than females.
• The assumed percentage of female members electing Joint and Survivor annuities was increased.
• The assumed post-retirement benefit increase rate was changed from 1.00% for all years to 1.00% per
year through 2064 and 2.50% thereafter.
50

CITY OF WILLMAR, MINNESOTA NOTES TO FINANCIAL STATEMENTS
December 31, 2017 NOTE 4 DEFINED BENEFIT PENSION PLANS (continued)
The State Board of Investment, which manages the investments of PERA, prepares an analysis of the reasonableness on a regular basis of the long-term expected rate of return using a building-block method in which best-estimate ranges of expected future rates of return are developed for each major asset class. These ranges are combined to produce an expected long-term rate of return by weighting the expected future rates of return by the target asset allocation percentages. The target allocation and best estimates of geometric real rate of return for each major asset class are summarized in the following table:
Long-Term
Target Expected RealAsset Class Allocation Rate of Return
Domestic Stocks 39% 5.10%International Stocks 19% 5.30%Bonds 20% 0.75%Alternative Assets 20% 5.90%Cash 2% 0.00%
100%
E. Discount Rate The discount rate used to measure the total pension liability in 2017 was 7.50%. The projection of cash flows used to determine the discount rate assumed that contributions from plan members and employers will be made at rates set in Minnesota Statutes. Based on these assumption, the fiduciary net position of the General Employees Fund and the Police and Fire Fund was projected to be available to make all projected future benefit payments of current plan members. Therefore, the long-term expected rate of return on pension plan investments was applied to all periods of projected benefit payments to determine the total pension liability. F. Pension Liability Sensitivity The following presents the City of Willmar’s proportionate share of the net pension liability for all plans it participates in, calculated using the discount rate disclosed in the preceding paragraph, as well as what the City of Willmar’s proportionate share of the net pension liability would be if it were calculated using a discount rate 1 percentage point lower or 1 percentage point higher than the current discount rate:
G. Pension Plan Fiduciary Net Position Detailed information about each pension plan’s fiduciary net position is available in a separately-issued PERA financial report that includes financial statements and required supplementary information. That report may be obtained on the Internet at www.mnpera.org; by writing to PERA at 60 Empire Drive #200, St. Paul, Minnesota, 55103-2088; or by calling (651) 296-7460 or 1-800-652-9026.
51
1% Lower 6.50% 5,554,997$ 6.50% 5,695,576$ CurrentDiscount 7.50% 3,581,387$ 7.50% 3,024,267$ Rate1% Higher 8.50% 1,965,628$ 8.50% 818,953$
Police and Fire FundGeneral Employees FundDiscount Rate
Sensitivity of Net Pension Liability at Current Single

CITY OF WILLMAR, MINNESOTA NOTES TO FINANCIAL STATEMENTS
December 31, 2017 NOTE 5 DEFINED BENEFIT PENSION PLANS – STATEWIDE VOLUNTEER FIREFIGHTERS
FUND Plan Description The Willmar Fire Department participates in the Statewide Volunteer Firefighter Retirement Plan (SVF), an agent multiple-employer lump-sum defined benefit pension plan administered by the Public Employees Retirement Association of Minnesota (PERA). The SVF plan covers volunteer firefighters of municipal fire departments or independent nonprofit firefighting corporations that have elected to join the plan. As of December 31, 2016, the plan covered 41 active firefighters and 9 vested terminated fire fighters whose pension benefits are deferred. The plan is established and administered in accordance with Minnesota Statutes, Chapter 353 G. Benefits Provided The Volunteer Firefighter Plan provides lump-sum retirement, death, and supplemental benefits to covered firefighters and survivors. Benefits are paid based on the number of years of service multiplied by a benefit level per year of service approved by the City. The benefit is selected from 71 possible levels in $100 increments ranging from $500 to $7,500 per year of service. Members are eligible for a lump-sum retirement benefit at 50 years of age with five years of service. Plan provisions include a pro-rated vesting schedule that increases from 5 years at 40% through 20 years at 100%. Contributions The Volunteer Firefighter Plan is funded by fire state aid, investment earnings and, if necessary, employer contributions as specified in Minnesota Statutes. The State of Minnesota contributed $104,601 in fire state aid to the fund for the year ended December 31, 2016. Required employer contributions are calculated annually based on statutory provisions. The City’s statutorily-required contributions to the Volunteer Firefighter Fund for the year ended December 31, 2016, was $0. The City’s contributions were equal to the required contributions as set by state statute.
52

CITY OF WILLMAR, MINNESOTA NOTES TO FINANCIAL STATEMENTS
December 31, 2017 NOTE 5 DEFINED BENEFIT PENSION PLANS – STATEWIDE VOLUNTEER FIREFIGHTERS
FUND (continued) Pension Costs At December 31, 2017, the City reported a net pension asset of $233,339 for the Volunteer Firefighter Fund. The net pension asset was measured as of December 31, 2016. The total pension liability used to calculate the net pension asset in accordance with GASB 68 was determined by PERA applying an actuarial formula to specific census data certified by the fire department. The following table presents the changes in net pension liability during the year.
There were no benefit provision changes during the measurement period. For the year ended December 31, 2017, the City recognized pension expense of $260,693. At December 31, 2017, the City reported deferred outflows and deferred inflows of resources related to pension from the following sources:
53
Total Pension Liability
Plan Fiduciary
Net Position
Net Pension Liability (Asset)
Beginning Balance 12/31/15 916,855$ 1,283,006$ (366,151)$ Changes for the Year
Service Cost 38,305 - 38,305 Interest on Pension Liability 54,564 - 54,564 Actuarial Experience (Gains)/Losses (17,553) - (17,553) Projected Investment Earnings - 76,980 (76,980) Changes in Benefit Level 249,237 - 249,237 Contributions (Employer) - - - Contributions (State) - 104,601 (104,601) Asset (Gain)/Loss - 11,547 (11,547) Benefit Payouts (91,514) (91,514) - PERA Administrative Fee - (1,387) 1,387
Net Changes 233,039 100,227 132,812
Balance End of Year 12/31/16 1,149,894$ 1,383,233$ (233,339)$
Deferred DeferredOutflows Inflows
of Resources of Resources
Differences between expected and actual economic experience 25,452$ 31,756$ Difference between projected and actual investment earnings 40,811 10,620 Contributions paid to plan subsequent to measurement date 106,874 - State revenue received for the plan subsequent to measurement date - 106,874
Totals 173,137$ 149,250$

CITY OF WILLMAR, MINNESOTA NOTES TO FINANCIAL STATEMENTS
December 31, 2017 NOTE 5 DEFINED BENEFIT PENSION PLANS – STATEWIDE VOLUNTEER FIREFIGHTERS
FUND (continued) $106,874 reported as deferred outflows of resources related to pensions resulting from City contributions to the pension plan subsequent to the measurement date will be recognized as an addition to the net pension liability (asset) in the year ended December 31, 2017. $106,874 reported as deferred inflows of resources related to pensions resulting from state revenue received by the City for the pension plan subsequent to the measurement date will be recognized as a reduction to the net pension liability (asset) in the year ended December 31, 2017. Other amounts reported as deferred outflows and inflows of resources related to pensions will be recognized in pension expense as follows:
Actuarial Assumptions The total pension liability at December 31, 2016, was determined using the entry age normal actuarial cost method and the following actuarial assumptions: • Retirement eligibility at the later of age 50 or 20 years of service • Investment rate of return of 6.00% • Inflation rate of 3.00% There were no changes in actuarial assumptions in 2017. Discount Rate The discount rate used to measure the total pension liability was 6.00%. The projection of cash flows used to determine the discount rate assumed that contributions to the Volunteer Firefighter Fund will be made as specified in statute. Based on that assumption and considering the funding ratio of the plan, the fiduciary net position was projected to be available to make all projected future benefit payments of current active and inactive members. Therefore, the long-term expected rate of return on pension plan investments was applied to all periods of projected benefit payments to determine the total pension liability. Pension Liability Sensitivity The following presents the City’s net pension asset for the SVF plan, calculated using the discount rate disclosed in the preceding paragraph, as well as what the City’s net pension asset would be if it were calculated using a discount rate 1% lower or 1% higher than the current discount rate:
54
Year ended December 31:
Pension Expense Amount
2018 13,916$ 2019 13,914$ 2020 1,877$ 2021 (5,820)$
1% Decrease 1% Increasein Discount Discount in DiscountRate (5.0%) Rate (6.0%) Rate (7.0%)
Net Pension Asset (456,312)$ (482,576)$ (507,985)$

CITY OF WILLMAR, MINNESOTA NOTES TO FINANCIAL STATEMENTS
December 31, 2017 NOTE 5 DEFINED BENEFIT PENSION PLANS – STATEWIDE VOLUNTEER FIREFIGHTERS
FUND (continued) Plan Investments Investment Policy: The Minnesota State Board of Investment (SBI) is established by Article XI of the Minnesota Constitution to invest all state funds. Its membership as specified in the Constitution is comprised of the Governor (who is designated as chair of the Board), State Auditor, Secretary of State and State Attorney General. All investments undertaken by the SBI are governed by the prudent person rule and other standards codified in Minnesota Statutes, Chapter 11A and Chapter 356A. Within the requirements defined by state law, the SBI, with assistance of the SBI staff and the Investment Advisory Council, establishes investment policy for all funds under its control. These investments policies are tailored to the particular needs of each fund and specify investment objectives, risk tolerance, asset allocation, investment management structure and specific performance standards. Studies guide the on-going management of the funds and are updated periodically. Asset Allocation: To match the long-term nature of the pension obligations, the SBI maintains a strategic asset allocation for the Statewide Volunteer Firefighter Plan that includes allocations to domestic equity, international equity, bonds and cash equivalents. The long-term target asset allocation and long-term expected real rate of return is the following:
The 6.00% long-term expected rate of return on pension plan investments was determined using a building-block method. Best estimates for expected future real rates of return (expected returns, net of inflation) were developed for each asset class using both long-term historical returns and long-term capital market expectations. The asset class estimates and the target allocations were then combined to produce a geometric, long-term expected real rate of return for the portfolio. Inflation expectations were applied to derive the nominal rate of return for the portfolio. Description of significant investment policy changes during the year: The SBI made no significant changes to their investment policy during Fiscal Year 2017 for the Statewide Volunteer Firefighter Retirement Plan. Pension Plan Fiduciary Net Position Detailed information about the Volunteer Firefighter Fund’s fiduciary net position as of June 30, 2017, is available in a separately-issued PERA financial report that includes financial statements and required supplementary information. That report may be obtained on the Internet at www.mnpera.org.
55
Long-TermTarget Expected Real
Asset Class Allocation Rate of Return
Domestic Stocks 35% 5.10%International Stocks 15% 5.30%Bonds 45% 0.75%Cash 5% 0.00%
100%

CITY OF WILLMAR, MINNESOTA NOTES TO FINANCIAL STATEMENTS
December 31, 2017
NOTE 6 DEFINED CONTRIBUTION PLAN
Nine council members and mayor, of the City of Willmar are covered by the Public Employees Defined Contribution Plan (PEDCP), a multiple-employer deferred compensation plan administered by PERA. The PEDCP is a tax qualified plan under Section 401(a) of the Internal Revenue Code and all contributions by or on behalf of employees are tax deferred until time of withdrawal.
Plan benefits depend solely on amounts contributed to the plan plus investment earnings, less administrative expenses. Minnesota Statutes, Chapter 353D.03, specifies plan provisions, including the employee and employer contribution rates for those qualified personnel who elect to participate. An eligible elected official who decides to participate contributes 5% of salary which is matched by the elected official's employer. For ambulance service personnel, employer contributions are determined by the employer, and for salaried employees must be a fixed percentage of salary. Employer contributions for volunteer personnel may be a unit value for each call or period of alert duty. Employees who are paid for their services may elect to make member contributions in an amount not to exceed the employer share. Employer and employee contributions are combined and used to purchase shares in one or more of the seven accounts of the Minnesota Supplemental Investment Fund. For administering the plan, PERA receives 2% of employer contributions and twenty-five hundredths of 1% (.0025) of the assets in each member's account annually.
Total contributions made by the City of Willmar during fiscal year 2017 were: $-0-
NOTE 7 OTHER POST EMPLOYMENT BENEFITS Primary Government The City has adopted Governmental Account Standards Board (GASB) Statement No. 45, Accounting and Financial Reporting by Employers for Post-employment Benefits Other than Pensions. Qualified employees may choose to participate in the City’s health, dental, and/or life insurance plans. There are 101 active participants and 18 retired participants. Benefit and eligibility provisions are established through negotiations between the City Council and employee groups including three unions. The union contracts are renegotiated periodically. There are no separate financial statements issued for the plan. The City has chosen to fund the plan on a pay-as-you-go basis. Annual OPEB Cost and Net OPEB Obligation The City’s annual other postemployment benefit (OPEB) costs (expense) is calculated based on the annual required contribution (ARC), an amount actuarially determined in accordance with the parameters of GASB
56

CITY OF WILLMAR, MINNESOTA NOTES TO FINANCIAL STATEMENTS
December 31, 2017 NOTE 7 OTHER POST EMPLOYMENT BENEFITS/Primary Government (continued) Statement No. 45. The ARC represents a level of funding that, if paid on an ongoing basis, is projected to cover normal costs each year and amortize any unfunded actuarial liabilities over a period not to exceed thirty years. The following table shows the components of the City’s annual OPEB cost for the year, contributions for the year, and the change in the City’s net OPEB obligation:
2017 2016
Net OPEB, beginning of the year 390,282$ 312,757$
Activity during the year:Annual Required Contribution 230,969 230,969 Interest on net OPEB Obligation 13,660 10,946 Adjustment to Annual Required Contribution (20,858) (16,715)
Annual OPEB Cost (Expense) 223,771 225,200 Contributions made during the year (142,866) (147,675)
Increase/(Decrease) in Net OPEB Obligation 80,905 77,525
Net OPEB Liability, end of the year 471,187$ 390,282$
The City’s annual OPEB cost, the percentage of the annual OPEB cost contributed to the Plan and the net OPEB liability consist of the following:
Annual Employer Percentage Net OPEBFiscal Year Ended OPEB Cost Contribution Contribution Obligation
2017 223,771$ 142,866$ 63.8% 390,282$ 2016 225,200$ 147,675$ 65.6% 390,282$ 2015 313,851 262,211 83.5% 312,757
Funding Status The following is a summary of the funding status at January 1, 2016, the most recent actuarial valuation date:
UnfundedActuarial Actuarial Actuarial UAAL as a
Actuarial Value Accrued Accrued Liability Funded Covered Percentage ofValuation of Assets Liability (UAAL) Ratio Payroll Covered Payroll
Date (a) (b) (b-a) (a/b) (c) ((b-a)/c)
2016 -$ 2,316,580$ 2,316,580$ 0.0% 5,650,403$ 41.0%
Actuarial Methods and Assumptions Projections of benefits for financial reporting purposes are based on the substantive plan (the plan as understood by the employer and plan members) and include the types of benefits provided at the time of each valuation and
57

CITY OF WILLMAR, MINNESOTA
NOTES TO FINANCIAL STATEMENTS December 31, 2017
NOTE 7 OTHER POST EMPLOYEMENT BENEFITS/Primary Government (continued) the historical pattern of sharing of benefit costs between the employer and plan members to that point. Assumptions about future employment, mortality, and health care costs trends are also taken into consideration. Amounts determined regarding the funding status of the plan and the annual required contributions of the City are subject to continual revision as actual results are compared with past expectations and new estimates are made about the future. In the January 1, 2016, actuarial valuation the projected unit credit actuarial cost method was used. The actuarial assumption included a 3.50% discount rate. The annual health care cost trend rate is 6.75 percent initially, grading to 5.00 percent over 7 years. The Amortization of Unfunded Accrued Liability (UAAL) is being amortized as a level dollar amount on a closed basis, meaning no new entrants. The Schedule of Funding Progress, presented as required supplementary information following the notes to the financial statements, presents multi-year trend information about whether the actuarial value of plan assets is increasing or decreasing over time relative to the actuarial accrued liabilities for benefits. Component Units Willmar Municipal Utilities The Utilities operates a single-employer defined benefit plan (“the Plan”) that provides health, dental, and life insurance to eligible employees and their families through the Utilities commercial insurance plans. There are 56 active participants and 13 retired participants. Benefit and eligibility provisions are established through negotiations between the Utilities and employee groups including a union. The union contract is renegotiated each two-year bargaining period. The Plan does not issue a publicly available financial report. Contribution requirements are negotiated between the Utilities and employees. The Utilities contributes 0% - 100% of the cost of current-year premiums for eligible retired plan members and their spouses. The Utilities contributed to the Plan $139,766 for 2017 and $107,926 for 2016. The Plan is financed on a pay-as-you-go basis. Annual OPEB Cost and Net OPEB Obligation The Utilities annual other postemployment benefit (OPEB) costs (expense) is calculated based on the annual required contribution (ARC), an amount actuarially determined in accordance with the parameters of GASB Statement No. 45. The ARC represents a level of funding that, if paid on an ongoing basis, is projected to cover normal costs each year and amortize any unfunded actuarial liabilities over a period not to exceed thirty years. The following table shows the components of the Utilities’ annual OPEB cost for the year, the amount actually paid from the plan, and changes in the Utilities’ net OPEB obligation.
2017 2016Annual Required Contribution 98,704$ 101,938$ Interest on Net OPEB Obligation 9,179 9,574 Adjustment to Annual Required Contribution (14,259) (14,873)
Annual OPEB Cost (Expense) 93,624 96,639 Contributions Made 139,766 107,926
Increase (Decrease) in Net OPEB Obligation (46,142) (11,287) Net OPEB Liability - Beginning of Year 262,259 273,546
Net OPEB Liability - End of Year 216,117$ 262,259$
58

CITY OF WILLMAR, MINNESOTA NOTES TO FINANCIAL STATEMENTS
December 31, 2017
NOTE 7 OTHER POST EMPLOYEMENT BENEFITS/Component Units –
Willmar Municipal Utilities (continued) The Utilities annual OPEB cost, the percentage of the annual OPEB cost contributed to the Plan and the net OPEB liability consist of the following:
PercentageAnnual of Annual
Fiscal Annual Plan Sponsor OPEB Cost Net OPEBYear Ended OPEB Cost Contribution Contributed Liability
2017 93,624$ 139,766$ 149.3% 216,117$ 2016 96,639$ 107,926$ 111.7% 262,259$ 2015 214,651$ 157,825$ 73.5% 273,546$
Funding Status As of December 31, 2016, the most recent actuarial valuation date, the Utilities’ unfunded actuarial accrued liability (UAAL) was $1,283,286 and the actuarial value of the assets was $0. The covered payroll (annual payroll of active employees covered by the Plan) was $3,887,200 and the ration of the UAAL to the covered payroll of 33.0%. Actuarial valuations of an ongoing plan involve estimates of the value of reported amounts and assumptions about the probability of occurrence of events far into the future. Examples include assumptions about future employment, mortality, and healthcare cost trends. Amounts determined regarding the funded status of the Plan and the annual required contributions of the employer are subject to continual revision as actual results are compared with the past expectations and the new estimates are made about the future. Rice Memorial Hospital The Hospital follows provisions of Governmental Accounting Standards Board (GASB) No. 45, Accounting and Financial Reporting by Employers for Post-employment Benefits Other than Pensions. Qualified employees may choose to participate in the Hospital’s insurance plan after retirement, with no contribution from the Hospital. The Hospital provides these benefits to retirees as required by Minnesota Statute 471.61 subdivision 2b. As of December 31, 2017, and 2016, there were approximately 640 active employees subject to potential future benefit and 26 retirees receiving benefits from the Hospital’s health insurance plan. There are no separate financial statements issued for the plan. The Hospital has chosen to fund the retiree medical plan on a pay-as-you-go basis. Annual OPEB Cost and Net OPEB Obligation The Hospital’s annual other post-employment benefit (OPEB) cost is calculated based on the annual required contribution (ARC) of the employer, an amount actuarially determined in accordance with the parameters of GASB No. 45. The ARC represents a level of funding that, if paid on an ongoing basis, is projected to cover normal cost each year and amortize any unfunded actuarial liabilities (or funding excess) over a period not to exceed thirty years.
59

CITY OF WILLMAR, MINNESOTA NOTES TO FINANCIAL STATEMENTS
December 31, 2017 NOTE 7 OTHER POST EMPLOYEMENT BENEFITS/Component Units –
Rice Memorial Hospital (continued)
The following table shows the components of the Hospital’s annual OPEB cost as of December 31, 2017, and 2016, the amount actually contributed to the insurance plan, and changes in the Hospital’s net OPEB obligation:
2017 2016
Net OPEB, Beginning of Year 1,799,623$ 1,707,523$
Activity During the Year: Annual Required Contribution (ARC) 290,698 286,290 Interest on Net OPEB Obligation 62,987 59,764 Adjustments to ARC (97,848) (92,841) Contributions during the fiscal year (172,181) (161,113)
Increase in Net OPEB Obligation 83,656 92,100
Net OPEB, End of the Year 1,883,279$ 1,799,623$
The Hospital’s annual OPEB cost, the percentage of annual OPEB cost contributed to the plan and the net OPEB obligation consist of the following:
OPEB Cost Contribution Contribution Obligation
12/31/2017 255,837$ 172,181$ 67.30% 1,883,279$ 12/31/2016 253,212$ 161,113$ 63.63% 1,799,623$ 12/31/2015 360,897$ 155,391$ 43.06% 1,707,523$
Funding Status The following is a summary of the funding status at January 1, 2016, the most recent actuarial valuation date:
Actuarial Actuarial Unfunded UAAL as a Value of Accrued Actuarial Accrued Funded Covered Percentage ofAssets Liability Liability Ratio Payroll Covered Payroll
(a) (b) (b-a) (a/b) (c) ((b-a)/c)-$ 2,131,652$ 2,131,652$ 0.00% 46,650,000$ 4.60%
NOTE 8 RISK MANAGEMENT The City is exposed to various risks of loss related to torts; theft of, damage to, and destruction of assets; errors and omissions; injuries to employees; and natural disasters for which the City carries insurance. The City obtains insurance through participation in the League of Minnesota Cities Insurance Trust (LMCIT) which is a risk sharing pool with approximately 800 other governmental units. This City pays an annual premium to LMCIT for its workers compensation and property and casualty insurance. The LMCIT is self-sustaining through member premiums and will reinsure for claims above a prescribed dollar amount for each insurance event. Settled claims have not exceeded the City’s coverage in any of the past three fiscal years.
60

CITY OF WILLMAR, MINNESOTA NOTES TO FINANCIAL STATEMENTS
December 31, 2017 NOTE 8 RISK MANAGEMENT (CONTINUED) The workers’ compensation policy is a retrospectively rated policy with premiums that accrue based on the ultimate cost of the experience to date. There is no way to estimate what the change in premium may be. Generally, it has been minimal. NOTE 9 CONTINGENCIES Amounts received or receivable from grantor agencies are subject to audit and adjustment by grantor agencies, principally the federal and state governments. Any disallowed claims, including amounts already collected, may constitute a liability of the applicable funds. The amount, if any, of expenditures which may be disallowed by the grantor cannot be determined at this time although the City expects such amounts, if any, to be immaterial. NOTE 10 LEASE AGREEMENTS The City has entered into an agreement with Kandiyohi County to lease space for the Willmar Police Department. The term of the lease is 20 years commencing October 2000. The agreement requires annual payments of $175,000. Future minimum lease payments are: NOTE 11 JOINTLY-GOVERNED ORGANIZATIONS Kandiyohi County and City of Willmar Economic Development Commission The EDC was established on July 1, 2003, by a joint-powers agreement between Kandiyohi County and the City of Willmar by resolution pursuant to Minn. Laws 1989, First Special Session, ch. 1, Art. 17, § 21. The EDC was set up to encourage, attract, promote, and develop economically sound industry and commerce within the County and City. The EDC has six members. Kandiyohi County appoints three members, and the City of Willmar appoints three members of the EDC. Each member is appointed to serve for three years. Complete financial information for the EDC can be obtained at Kandiyohi County and City of Willmar Economic Development Commission, 333 Litchfield Avenue S.W., P. O. Box 1783, Willmar, Minnesota 56201. Central Community Transit (CCT) Kandiyohi Area Transit was established on October 20, 1998 by a joint powers agreement between Kandiyohi County and the City of Willmar. Effective January 1, 2015, Kandiyohi Area Transit combined with Renville County Heartland Express to form Central Community Transit (CCT). The CCT Board is made up of two members appointed by Kandiyohi County, two members appointed by the City of Willmar, one elected official from other local governments in Kandiyohi County, and two members appointed from Renville County. Complete financial information for CCT can be obtained at Central Community Transit, 1320 22nd Street SW, Willmar, Minnesota 56201.
61
2018 175,000 2019 175,000 2020 175,000
525,000$

CITY OF WILLMAR, MINNESOTA NOTES TO FINANCIAL STATEMENTS
December 31, 2017 NOTE 12 SUBSEQUENT EVENTS In preparing these financial statements, the City of Willmar, Minnesota, has evaluated events and transactions for the potential recognition or disclosure through July 20, 2018, the date the financial statements were available to be issued. Rice Memorial Hospital – Component Unit of the City of Willmar All of the effects of subsequent events that provide additional evidence about conditions that existed at the financial statement date, including the estimates inherent in the process of preparing the financial statements, are recognized in the financial statements. The Hospital does not recognize subsequent events that provide evidence about conditions that did not exist at the financial statement date but arose after, but before the financial statements are available to be issued. In some cases, nonrecognized subsequent events are disclosed to keep the financial statements from being misleading. The Hospital has evaluated events and transactions occurring subsequent to December 31, 2017, through April 5, 2018, the date of issuance of the financial statements, and determined no additional disclosures, other than those noted below, are required. The City of Willmar, Rice Memorial Hospital Board of Directors (Rice Board), CentraCare Health System (CentraCare) and Carris Health, LLC (Carris) (collectively, the Parties) entered into an Affiliation Agreement and an Operating Lease Agreement dated December 31, 2017, effective January 1, 2018. These and other related agreements set forth the actions, terms, conditions, limitations, and responsibilities of the Parties for the transfer of the operations of the Hospital, which includes the Rice Care Center, Rice Home Medical and Rice Hospice (Rice Facilities). All tangible and intangible assets of the Hospital activities (see Note 1) will be leased or transferred, and liabilities (excluding Hospital bonded debt and pension liability) will be transferred or assigned to Carris Health, LLC. Carris, as an affiliated of CentraCare, will operate the Rice Facilities for the residents of the City and the surrounding area. In consideration of the terms of the leased assets, income earned on assets transferred and operations, Carris will pay rent to the City in amounts equal to the principal and interest due on the Hospital bonds. The City will apply all payments to the outstanding Hospital bonds when due. Additionally, Carris shall make monthly payments to the City in the initial amount of $300,000 per annum over the 30-year lease term. NOTE 13 PRIOR PERIOD ADJUSTMENT The City’s Component Unit of the Municipal Utilities reported a prior period adjustment of $144,833 to the beginning net position in 2016 plus an adjustment of $79,270 to the ending net position in 2016 for a total of $224,103 to reflect a correction for an accounting error for investment income.
62

CITY OF WILLMAR, MINNESOTA NOTES TO FINANCIAL STATEMENTS
December 31, 2017 NOTE 14 TAX ABATEMENTS The City of Wilmar negotiates property tax abatement agreements on an individual basis. The City has tax abatement agreements with six entities as of December 31, 2017:
Percentage Amount ofof Taxes Taxes Abated
Abated During DuringPurpose 2017 2017 Notes
MinnWest Technology Campus 100% 41,600 Expires 2025Torgerson Properties 100% 23,000 Expires 2025Willmar Redevelopment 100% 25,000 Expires 2024William & Deborah Donner 100% 23,000 Expires 2022RockStep Willmar 100% 37,526 Expires 2026
The City of Willmar enters into these agreements under authority of Minnesota Statutes Section 1165.993 through 1165.995 and 469.1812 through 469.1815. Businesses must fulfill all requirements of approved development agreements and state statutes in order to receive the allowed amount of their tax abatements.
63

BUDGET AND ACTUAL SCHEDULES

64
Variance WithFinal Budget
Actual PositiveOriginal Final Amounts (Negative)
REVENUESGENERAL PROPERTY TAXES
Current Ad Valorem 4,829,365$ 4,829,365$ 4,747,653$ (81,712)$ Delinquent Ad Valorem 90,000 90,000 45,846 (44,154) Franchise Fees 256,000 256,000 260,803 4,803
TOTAL TAXES 5,175,365 5,175,365 5,054,302 (121,063)
LICENSES/PERMITSBusiness License/Permit 60,850 60,850 55,833 (5,017) Non-Business License/Permit 335,450 335,450 498,416 162,966
TOTAL LICENSES & PERMITS 396,300 396,300 554,249 157,949
INTERGOVERNMENTALFEDERAL GOVERNMENT
Federal Grant 500 500 2,271 1,771 STATE GRANTS
Local Government Aid 4,629,548 4,629,548 4,514,548 (115,000) Police Department Aid 240,000 240,000 256,817 16,817 P.E.R.A. Aid 172,146 172,146 172,146 - State Grant - - 32,789 32,789 Fire Department Aid - - - - Shared Highway User Tax 280,000 280,000 281,505 1,505 Local Performance Aid - - - -
COUNTY GRANTSKandiyohi County Highways 3,795 3,795 3,795 - Kandiyohi County 15,000 15,000 16,412 1,412
SCHOOL DISTRICT #347School Liaison Officer 150,000 150,000 153,000 3,000
TOTAL INTERGOVERNMENTAL 5,490,989 5,490,989 5,433,283 (57,706)
SERVICE CHARGESGeneral Government 18,620 18,620 19,388 768 Public Safety 184,500 184,500 169,138 (15,362) Buildings & Grounds 25,200 25,200 24,545 (655) Civic Center 332,500 332,500 387,843 55,343 Leisure Services 159,950 159,950 140,386 (19,564) Highways & Streets 11,050 11,050 12,106 1,056 Community Center 12,020 12,020 11,145 (875) Transportation (Airport) 20,000 20,000 - (20,000)
TOTAL SERVICE CHARGES 763,840 763,840 764,551 711
FINES AND FORFEITSOther Fines and Forfeits - - - - Court Fines 115,000 115,000 102,073 (12,927) Parking Violations 18,000 18,000 18,482 482 Solid Waste Citations - - - - Impounding Fees 35,000 35,000 27,281 (7,719)
TOTAL FINES & FORFEITS 168,000 168,000 147,836 (20,164)
SPECIAL ASSESSMENTSSpecial Assessments 1,100 1,100 1,273 173
TOTAL SPECIAL ASSESSMENTS 1,100 1,100 1,273 173
See notes to required supplementary information.
Budgeted Amounts
City of Willmar, MinnesotaGeneral Fund
Schedule of Revenues, Expenditures, and Changes in Fund Balances - Budget and ActualFor the year ended December 31, 2017

65
Variance WithFinal Budget
Actual PositiveOriginal Final Amounts (Negative)
REVENUES (Con't)MISCELLANEOUS REVENUE
Miscellaneous 255,000 255,000 48,243 (206,757) Interest Earnings 150,000 150,000 167,938 17,938 Sale of Fixed Assets 45,000 45,000 14,201 (30,799) Sale of Materials 50,000 50,000 82,401 32,401 City Auditorium Rents - - 900 900 Other Rents - - 17,914 17,914 Market Value Increase/(Decrease) 100,000 100,000 27,490 (72,510) Insurance Reimbursements - - 349,561 349,561 Insurance Pass Through 350,000 350,000 282,977 (67,023) Restitution - - - -
TOTAL MISCELLANEOUS 950,000 950,000 991,625 41,625
TOTAL REVENUE 12,945,594 12,945,594 12,947,119 1,525
EXPENDITURESGENERAL GOVERNMENT
City AdministratorPersonal Services 394,050 394,050 382,672 11,378 Supplies 4,200 4,200 2,593 1,607 Other Services & Charges 18,300 18,300 19,531 (1,231) Total 416,550 416,550 404,796 11,754
Mayor and Council Personal Services 79,150 79,150 78,928 222 Supplies 4,350 4,350 6,291 (1,941) Other Services & Charges 130,000 130,000 85,879 44,121 Total 213,500 213,500 171,098 42,402
Planning & DevelopmentPersonal Services 488,881 488,881 521,231 (32,350) Supplies 8,000 8,000 5,889 2,111 Other Services & Charges 43,650 43,650 39,017 4,633 Total 540,531 540,531 566,137 (25,606)
City Clerk/TreasurerPersonal Services 145,769 145,769 147,848 (2,079) Supplies 6,050 6,050 6,058 (8) Other Services & Charges 4,445 4,445 8,764 (4,319) Total 156,264 156,264 162,670 (6,406)
Assessing Personal Services - - 157 (157) Other Services & Charges 241,870 241,870 241,869 1 Total 241,870 241,870 242,026 (156)
AccountingPersonal Services 350,971 350,971 355,817 (4,846) Supplies 4,850 4,850 3,975 875 Other Services & Charges 32,100 32,100 27,608 4,492 Total 387,921 387,921 387,400 521
See notes to required supplementary information.
City of Willmar, MinnesotaGeneral Fund
Schedule of Revenues, Expenditures, and Changes in Fund Balances - Budget and ActualFor the year ended December 31, 2017
Budgeted Amounts

66
Variance WithFinal Budget
Actual PositiveOriginal Final Amounts (Negative)
EXPENDITURES (Con't)GENERAL GOVERNMENT (Con't)
Legal Other Services & Charges 250,000 250,000 266,881 (16,881) Total 250,000 250,000 266,881 (16,881)
City HallPersonal Services 63,814 66,114 68,194 (2,080) Supplies 27,600 27,600 10,389 17,211 Other Services & Charges 66,850 66,850 48,490 18,360 Other Disbursements - - 1,168 (1,168) Total 158,264 160,564 128,241 32,323
Information Technology Personal Services 153,981 153,981 154,301 (320) Supplies 101,800 101,800 61,580 40,220 Other Services & Charges 233,455 233,455 187,366 46,089 Total 489,236 489,236 403,247 85,989
Office Services Supplies 5,000 5,000 21,192 (16,192) Other Services & Charges 5,700 5,700 7,349 (1,649) Total 10,700 10,700 28,541 (17,841)
Elections & Voters RegistrationPersonal Services 18,065 18,065 17,872 193 Supplies 100 100 - 100 Other Services & Charges 6,040 6,040 259 5,781 Total 24,205 24,205 18,131 6,074
Non-Departmental ExpensesPersonal Services 25,000 25,000 8,847 16,153 Other Charges/Services 97,475 97,475 88,222 9,253 Severance - - 20,968 (20,968) Re-Employment Insurance 3,000 3,000 1,346 1,654 Retired Employees Insurance 100,000 100,000 85,847 14,153 Insurance Pass Through 340,000 340,000 277,985 62,015 Insurance Deductible 50,000 50,000 191,320 (141,320) Refunds Paid 200,000 200,000 232,546 (32,546) Total 815,475 815,475 907,081 (91,606)
TOTAL GENERAL GOVERNMENT 3,704,516 3,706,816 3,686,249 20,567
PUBLIC SAFETYPolice Department
Personal Services 3,795,527 3,795,527 3,666,817 128,710 Supplies 264,350 264,350 186,008 78,342 Other Services & Charges 190,795 190,795 177,063 13,732 Lease Payments 175,000 175,000 175,000 - Other Disbursements - - 389 (389) Total 4,425,672 4,425,672 4,205,277 220,395
See notes to required supplementary information.
Schedule of Revenues, Expenditures, and Changes in Fund Balances - Budget and ActualFor the year ended December 31, 2017
Budgeted Amounts
City of Willmar, MinnesotaGeneral Fund

67
Variance WithFinal Budget
Actual PositiveOriginal Final Amounts (Negative)
EXPENDITURES (Con't)PUBLIC SAFETY (Con't)
Fire DepartmentPersonal Services 429,650 429,650 461,326 (31,676) Supplies 111,600 111,600 92,119 19,481 Other Services & Charges 114,150 114,150 74,225 39,925 Total 655,400 655,400 627,670 27,730
Non-Departmental ExpensesCivil Defense 7,500 7,500 5,458 2,042 Safety Program 10,000 10,000 7,597 2,403 Refunds Paid - - 4,000 (4,000) Total 17,500 17,500 17,055 445
TOTAL PUBLIC SAFETY 5,098,572 5,098,572 4,850,002 248,570
PUBLIC WORKSEngineering
Personal Services 569,257 566,957 423,393 143,564 Supplies 18,250 18,250 6,934 11,316 Other Services & Charges 66,850 66,850 39,489 27,361 Total 654,357 652,057 469,816 182,241
Public Works Personal Services 1,731,274 1,731,274 1,723,478 7,796 Supplies 553,700 553,700 366,056 187,644 Other Services & Charges 382,600 382,600 302,733 79,867 Total 2,667,574 2,667,574 2,392,267 275,307
TransitOther Services & Charges 20,000 20,000 20,000 - Total 20,000 20,000 20,000 -
Non-Departmental ExpensesOther Services & Charges 2,000 2,000 806 1,194 Total 2,000 2,000 806 1,194
TOTAL PUBLIC WORKS 3,343,931 3,341,631 2,882,889 458,742
CULTURE & RECREATION
WRAC 8 Personal Services 123,245 123,245 136,509 (13,264) Supplies 5,300 5,300 1,789 3,511 Other Services & Charges 15,295 15,295 9,707 5,588 Total 143,840 143,840 148,005 (4,165)
LibraryOther Services & Charges 512,227 512,227 511,899 328
Total 512,227 512,227 511,899 328
AuditoriumPersonal Services 4,000 4,000 3,409 591 Supplies 18,700 18,700 15,068 3,632 Other Services & Charges 48,351 84,616 81,984 2,632 Total 71,051 107,316 100,461 6,855
Non-Department Expenses Civic Promotion 99,692 99,692 92,705 6,987 Total 99,692 99,692 92,705 6,987
See notes to required supplementary information.
City of Willmar, MinnesotaGeneral Fund
Budgeted Amounts
For the year ended December 31, 2017Schedule of Revenues, Expenditures, and Changes in Fund Balances - Budget and Actual

68
Variance WithFinal Budget
Actual PositiveOriginal Final Amounts (Negative)
EXPENDITURES (Con't)CULTURE & RECREATION (Con't)
Leisure Services Personal Services 180,561 180,561 154,425 26,136 Supplies 23,650 23,650 22,094 1,556 Other Services & Charges 225,200 225,200 285,755 (60,555) Total 429,411 429,411 462,274 (32,863)
Civic Center - Ice ArenaPersonal Services 305,709 305,709 306,030 (321) Supplies 97,100 106,900 120,871 (13,971) Other Services & Charges 198,550 218,550 286,458 (67,908) Other Disbursements - - 3,874 (3,874) Total 601,359 631,159 717,233 (86,074)
Community CenterPersonal Services 58,329 58,329 31,041 27,288 Supplies 33,200 33,200 28,317 4,883 Other Services & Charges 33,900 33,900 32,838 1,062 Total 125,429 125,429 92,196 33,233
Aquatics Center Personal Services 129,550 129,550 122,147 7,403 Supplies 48,355 48,355 38,377 9,978 Other Services & Charges 30,560 30,560 38,157 (7,597) Other Disbursements - - 764 (764) Total 208,465 208,465 199,445 9,020
TOTAL CULTURE & RECREATION 2,191,474 2,257,539 2,324,218 (66,679)
TOTAL EXPENDITURES 14,338,493 14,404,558 13,743,358 661,200
Excess of Revenues Over Expenditures (1,392,899) (1,458,964) (796,239) 662,725
OTHER FINANCING SOURCES (USES)Transfers In 2,724,079 2,724,079 2,762,427 38,348 Transfers Out (2,737,351) (2,671,286) (2,671,286) -
Total Other Financing Sources (Uses) (13,272) 52,793 91,141 38,348
Net Change in Fund Balances (1,406,171) (1,406,171) (705,098) 701,073
Fund Balances - Beginning 14,435,896 14,435,896 14,435,896 -
Fund Balances - Ending 13,029,725$ 13,029,725$ 13,730,798$ 701,073$
See notes to required supplementary information.
For the year ended December 31, 2017
General FundCity of Willmar, Minnesota
Budgeted Amounts
Schedule of Revenues, Expenditures, and Changes in Fund Balances - Budget and Actual

69
Variance WithFinal Budget
PositiveOriginal Final Actual (Negative)
REVENUESMiscellaneous Revenue
Land Sales -$ -$ 270,545$ 270,545$ Rental of Land - - 84,629 84,629 Interest Earnings - - 30,005 30,005 Market Value Incr/(Decr) - - 3,190 3,190
Total Revenues - - 388,369 388,369
EXPENDITURESSupplies - - - - Other Services/Charges - - 34,108 (34,108) Capital Outlay - - - -
Total Expenditures - - 34,108 (34,108) Excess (Deficiency) of Revenues Over (Under) Expenditures - - 354,261 354,261
OTHER FINANCING SOURCES (USES)Transfer In - - - - Transfer Out - C.P. 2014 - - - - Transfer Out - Capital Improvments - - - - Transfer Out - C.P. 2013 - - - - Transfer Out - C.P. Waste Treatment - - - -
Total Other Financing Sources (Uses) - - - -
Net Change in Fund Balances - - 354,261 354,261
Fund Balance - Beginning 1,260,564 1,260,564 1,260,564 - Fund Balance - Ending 1,260,564$ 1,260,564$ 1,614,825$ 354,261$
See notes to required supplementary information.
City of Willmar, MinnesotaIndustrial Development Special Revenue Fund
Schedule of Revenues, Expenditures, and Changes in Fund Balances - Budget and ActualFor the Year Ended December 31, 2017
Budget Amounts

70
Variance WithFinal Budget
PositiveOriginal Final Actual (Negative)
REVENUESGeneral Taxes
Hotel-Motel Tax 190,000$ 190,000$ 228,225$ 38,225$ Intergovernmental
State Tourism Grant 7,000 7,000 5,828 (1,172) Kandiyohi County Camping Fees 14,500 14,500 15,863 1,363 Kandiyohi County Phone Reimb 1,000 1,000 - (1,000) Kandiyohi County Tourism Partner. 34,000 34,000 34,000 -
Total Intergovernmental 56,500 56,500 55,691 (809)
Service Charges 2,000 2,000 1,281 (719)
Miscellaneous RevenueInterest Earnings 3,000 3,000 4,510 1,510 Market Value Increase/(Decrease) - - 518 518 Miscellaneous 3,000 3,000 4,402 1,402
Total Miscellaneous Revenue 6,000 6,000 9,430 3,430 Total Revenue 254,500 254,500 294,627 40,127
EXPENDITURESPersonal Services 117,000 117,000 115,676 1,324 Supplies 8,700 8,700 6,481 2,219 Other Services and Charges 33,710 33,710 25,950 7,760 Tourism 40,000 40,000 35,532 4,468 Ad Development 300 300 80 220 Conference & Convention 29,000 29,000 33,775 (4,775) Group Tour Promotions 1,290 1,290 400 890 Leisure Travel 30,000 30,000 29,009 991 Sports Promotions 7,000 7,000 8,023 (1,023) Refunds & Reimbursements - - - - Special Projects 4,000 4,000 1,500 2,500 Strategic Marketing 4,000 4,000 - 4,000
Total Expenditures 275,000 275,000 256,426 18,574
Excess (Deficiency) of Revenues Over (Under) Expenditures (20,500) (20,500) 38,201 58,701
OTHER FINANCING SOURCES (USES)Transfers Out - General (9,500) (9,500) (9,500) -
Total Other Financing Sources (Uses) (9,500) (9,500) (9,500) -
Net Change in Fund Balances (30,000) (30,000) 28,701 58,701
Fund Balance - Beginning 211,619 211,619 211,619 - Fund Balance - Ending 181,619$ 181,619$ 240,320$ 58,701$
See notes to required supplementary information.
Budget Amounts
City of Willmar, Minnesota
Schedule of Revenues, Expenditures and Changes in Fund Balances - Budget and ActualFor the Year Ended December 31, 2017
Convention & Visitors' Bureau Special Revenue Fund

71
Variance WithFinal Budget
PositiveOriginal Final Actual (Negative)
REVENUESIntergovernmental
Federal Grant - - 500 500 State Airport Aid 54,863 54,863 24,445 (30,418)
Total Intergovernmental 54,863 54,863 24,945 (29,918)
Service ChargesRental Income 170,000 170,000 98,913 (71,087) Fuel Sales 80,000 80,000 19,267 (60,733)
Total Service Charges 250,000 250,000 118,180 (131,820)
Miscellaneous RevenueInterest Earnings - - 797 797 Market Value Increase/(Decrease) - - (524) (524) Miscellaneous - - 4,806 4,806
Total Miscellaneous Revenue - - 5,079 5,079 Total Revenue 304,863 304,863 148,204 (156,659)
EXPENDITURESPersonal Services - - 5,053 (5,053) Supplies 13,050 13,050 13,419 (369) Other Services and Charges 236,600 236,600 215,091 21,509
Total Expenditures 249,650 249,650 233,563 16,087
Excess (Deficiency) of Revenues Over (Under) Expenditures 55,213 55,213 (85,359) (140,572)
OTHER FINANCING SOURCES (USES)Transfers In - General Fund 133,939 133,939 133,939 - Transfers Out - D.S.. Airport (183,643) (183,643) (183,643) Transfers Out - C.P. Airport (59,000) (59,000) (59,000) -
Total Other Financing Sources (Uses) (108,704) (108,704) (108,704) -
Net Change in Fund Balances (53,491) (53,491) (194,063) (140,572)
Fund Balance - Beginning 411,564 411,564 411,564 - Fund Balance - Ending 358,073$ 358,073$ 217,501$ (140,572)$
See notes to required supplementary information.
City of Willmar, MinnesotaWillmar Municipal Airport Special Revenue Fund
Schedule of Revenues, Expenditures and Changes in Fund Balances - Budget and ActualFor the Year Ended December 31, 2017
Budget Amounts

72
Variance WithFinal Budget
PositiveOriginal Final Actual (Negative)
REVENUESMiscellaneous Revenue
Interest Earnings 3,000$ 3,000$ 3,321$ 321$ Market Value Incr/(Decr) - - 470 470
Total Revenues 3,000 3,000 3,791 791
EXPENDITURESOther Services and Charges - - 4,729 (4,729) Capital Outlay - - - -
Total Expenditures - - 4,729 (4,729) Excess (Deficiency) of Revenues Over (Under) Expenditures 3,000 3,000 (938) (3,938)
Net Change in Fund Balances 3,000 3,000 (938) (3,938)
Fund Balance - Beginning 163,131 163,131 163,131 - Fund Balance - Ending 166,131$ 166,131$ 162,193$ (3,938)$
See notes to required supplementary information.
City of Willmar, MinnesotaLibrary Improvement Reserve Special Revenue Fund
Schedule of Revenues, Expenditures, and Changes in Fund Balances - Budget and ActualFor the Year Ended December 31, 2017
Budget Amounts

73
Variance WithFinal Budget
PositiveOriginal Final Actual (Negative)
REVENUESSpecial Assessments 699$ 699$ 137,273$ 136,574$ Miscellaneous Revenue
Interest Earnings 180,000 180,000 180,316 316 Market Value Increase (Decrease) - - 23,221 23,221 Miscellaneous - - 742 742
Total Revenues 180,699 180,699 341,552 160,853
EXPENDITURESOther Charges - - - -
Total Expenditures - - - - Excess (Deficiency) of Revenues Over (Under) Expenditures 180,699 180,699 341,552 160,853
OTHER FINANCING SOURCES (USES)Transfers In 400,000 400,000 511,852 111,852 Transfers Out (725,941) (725,941) (957,762) (231,821)
Total Other Financing Sources (Uses) (325,941) (325,941) (445,910) (119,969)
Net Change in Fund Balances (145,242) (145,242) (104,358) 40,884
Fund Balance - Beginning, as restated 9,257,862 9,257,862 9,257,862 - Fund Balance - Ending 9,112,620$ 9,112,620$ 9,153,504$ 40,884$
See notes to required supplementary information.
Budget Amounts
City of Willmar, Minnesota
Schedule of Revenues, Expenditures, and Changes in Fund Balances - Budget and ActualCommunity Investment Special Revenue Fund
For the Year Ended December 31, 2017

74
Variance WithFinal Budget
PositiveOriginal Final Actual (Negative)
REVENUESMiscellaneous Revenue
Interest Earnings 16,500$ 16,500$ 18,993$ 2,493$ Market Value Incr/(Decr) - - 2,525 2,525 Miscellaneous - - - -
Total Revenues 16,500 16,500 21,518 5,018
EXPENDITURESOther Charges - - - -
Total Expenditures - - - - Excess (Deficiency) of Revenues Over (Under) Expenditures 16,500 16,500 21,518 5,018
OTHER FINANCING SOURCES (USES)Transfers In 415,000 415,000 415,000 - Transfers Out (400,000) (400,000) (400,000) -
Total Other Financing Sources (Uses) 15,000 15,000 15,000 -
Net Change in Fund Balances 31,500 31,500 36,518 5,018
Fund Balance - Beginning 927,262 927,262 927,262 - Fund Balance - Ending 958,762$ 958,762$ 963,780$ 5,018$
See notes to required supplementary information.
City of Willmar, MinnesotaPublic Works Reserve Special Revenue Fund
Schedule of Revenues, Expenditures, and Changes in Fund Balances - Budget and ActualFor the Year Ended December 31, 2017
Budget Amounts

75
Over (Under)Final
Original Final Actual BudgetREVENUES
Special AssessmentsSpecial Assessments 742,699$ 742,699$ 1,276,033$ 533,334$
Miscellaneous RevenueMiscellaneous 57,690 57,690 7,223 (50,467) Interest Earnings 64,500 64,500 46,014 (18,486) Net change in fair market value - - 5,017 5,017
Total Revenues 864,889 864,889 1,334,287 469,398
EXPENDITURES Bond Principal Payments 1,751,000 1,751,000 1,751,000 - Interest Payments 223,562 223,562 235,556 11,994 Other Charges 8,700 8,700 25,800 17,100
Total Expenditures 1,983,262 1,983,262 2,012,356 29,094
Excess (Deficiency) of Revenues Over (Under) Expenditures (1,118,373) (1,118,373) (678,069) 440,304
OTHER FINANCING SOURCES (USES)Transfers In 725,941 725,941 2,334,729 1,608,788 Transfers Out - - (111,852) (111,852) Bond Proceeds - - - -
Total Other Financing Sources (Uses) 725,941 725,941 2,222,877 1,496,936
Net Change in Fund Balances (392,432) (392,432) 1,544,808 1,937,240 Fund Balances - Beginning 5,362,710 5,362,710 5,362,710 - Fund Balances - Ending 4,970,278$ 4,970,278$ 6,907,518$ 1,937,240$
See notes to required supplementary information.
Budget Amounts
Debt Service Funds/Special Assessments Bonds
For the Year Ended December 31, 2017
City of Willmar, Minnesota
Schedule of Revenues, Expenditures, and Changes in Fund Balances - Budget and Actual

76
Over (Under)Original Final Actual Final Budget
REVENUESInterest Earnings -$ -$ -$ -$ Market Value Increase (Decrease) - - - -
Total Revenues - - - -
EXPENDITURES Bond Principal Payments 160,000 160,000 160,000 - Interest Payments 20,643 20,643 23,642 2,999 Other Charges 3,000 3,000 3,180 180
Total Expenditures 183,643 183,643 186,822 3,179
Excess (Deficiency) of Revenues Over (Under) Expenditures (183,643) (183,643) (186,822) 3,179
OTHER FINANCING SOURCES(USES)Transfers In 183,643 183,643 183,643 -
Total Other Financing Sources (Uses) 183,643 183,643 183,643 -
Net Change in Fund Balances - - (3,179) 3,179
Fund Balances - Beginning 173,321 173,321 173,321 - Fund Balances - Ending 173,321$ 173,321$ 170,142$ 3,179$
See notes to required supplementary information.
Budget Amounts
Debt Sevice Funds/ Airport G.O. Revenue Bonds
For the Year Ended December 31, 2017
City of Willmar, Minnesota
Schedule of Revenues, Expenditures, and Changes in Fund Balances - Budget and Actual

77
Over (Under)Original Final Actual Final Budget
REVENUESGeneral Taxes
Tax Increment -$ -$ 46,074$ 46,074$ Total Taxes - - 46,074 46,074
Total Revenues - - 46,074 46,074
EXPENDITURES Contracts - - - - Interest - - - - Other Charges - - - -
Total Expenditures - - - -
Excess (Deficiency) of Revenues Over (Under) Expenditures - - 46,074 46,074
OTHER FINANCING SOURCES(USES)Transfers Out - - - -
Total Other Financing Sources (Uses) - - - -
Net Change in Fund Balances - 46,074 46,074
Fund Balances - Beginning 12,626 12,626 12,626 - Fund Balances - Ending 12,626$ 12,626$ 58,700$ 46,074$
See notes to required supplementary information.
City of Willmar, MinnesotaDebt Sevice Funds/ Tax Increment Bonds
Schedule of Revenues, Expenditures, and Changes in Fund Balances - Budget and ActualFor the Year Ended December 31, 2017
Budget Amounts

See notes to required supplementary information 78
Fiscal Year Ending
Employer's Proportion
(Percentage) of the Net Pension Liability (Asset)
Employer's Proportionate
Share (Amount) of
the Net Pension Liability (Asset)
(a)
State's Proportionate
Share (Amount) of
the Net Pension Liability
Associated with the City
(b)
Employer's Proportionate Share of the Net Pension Liability and
the State's Proportionate Share of the Net Pension
Liability Associated
With the City (a) + (b)
Employer's Covered-Employee
Payroll (c)
Employer's Proportionate Share of the Net Pension
Liability (Asset) as a
Percentage of its Covered-Employee
Payroll ((a+b)/c)
Plan Fiduciary
Net Position as a
Percentage of the Total
Pension Liability
June 30, 2015 0.0615% 3,187,249$ -$ 3,187,249$ 3,618,192$ 88.1% 78.2%June 30, 2016 0.0587% 4,766,149$ 62,283$ 4,828,432$ 3,644,509$ 132.5% 68.9%June 30, 2017 0.0561% 3,581,387$ 45,058$ 3,626,445$ 3,616,140$ 100.3% 75.9%
Fiscal Year Ending
Employer's Proportion
(Percentage) of the Net Pension Liability (Asset)
Employer's Proportionate
Share (Amount) of
the Net Pension Liability (Asset)
(a)
State's Proportionate
Share (Amount) of
the Net Pension Liability
Associated with the City
(b)
Employer's Proportionate Share of the Net Pension Liability and
the State's Proportionate Share of the Net Pension
Liability Associated
With the City (a) + (b)
Employer's Covered-Employee
Payroll (c)
Employer's Proportionate Share of the Net Pension
Liability (Asset) as a
Percentage of its Covered-Employee
Payroll ((a+b)/c)
Plan Fiduciary
Net Position as a
Percentage of the Total
Pension Liability
June 30, 2015 0.2400% 2,726,962$ -$ 2,726,962$ 2,199,684$ 124.0% 86.6%June 30, 2016 0.2350% 9,430,959$ -$ 9,430,959$ 2,267,922$ 415.8% 63.9%June 30, 2017 0.2240% 3,024,267$ -$ 3,024,267$ 2,304,499$ 131.2% 85.4%
Note: Schedules are intended to show a 10 year trend. Additional years will be reported as they become available.
Public Employees Police and Fire Fund
General Employees Retirement Fund
CITY OF WILLMAR, MINNESOTA
For The Year Ended December 31, 2017SCHEDULES OF PROPORTIONATE SHARE OF NET PENSION LIABILITY

See notes to required supplementary information 79
Fiscal Year Ending
Statutorily Required
Contribution (a)
Contributions in Relation to the
Statutorily Required
Contribution (b)
Contribution Deficiency (Excess)
(a-b)
Covered-Employee
Payroll (d)
Contributions as a Percentage of
Covered-Employee
Payroll (b/d)
12/31/2015 265,540$ 265,540$ -$ 3,540,543$ 7.50%12/31/2016 275,718$ 275,718$ -$ 3,676,241$ 7.50%12/31/2017 279,953$ 279,953$ -$ 3,732,703$ 7.50%
Fiscal Year Ending
Statutorily Required
Contribution (a)
Contributions in Relation to the
Statutorily Required
Contribution (b)
Contribution Deficiency (Excess)
(a-b)
Covered-Employee
Payroll (d)
Contributions as a Percentage of
Covered-Employee
Payroll (b/d)
12/31/2015 359,668$ 359,668$ -$ 2,220,176$ 16.20%12/31/2016 369,900$ 369,900$ -$ 2,283,329$ 16.20%12/31/2017 390,745$ 390,745$ -$ 2,412,004$ 16.20%
Note: Schedules are intended to show a 10 year trend. Additional years will be reported as they become available.
General Employees Retirement Fund
CITY OF WILLMAR, MINNESOTASCHEDULES OF EMPLOYER CONTRIBUTIONS
For The Year Ended December 31, 2017
Public Employees Police and Fire Fund

80
The City provides to retirees the option to participate in the City's health, dental, and/or life insurance plans. Benefit and eligibilityprovisions are established through negotiations between the City Council and employee groups including three unions. The unioncontracts are renegotiated periodically.
The City currently has no assets that have been irrevocably deposited in a trust for future health benefits. Therefore, the actuarialvalue of the assets is $-0- at December 31, 2017. The following is a summary of the funding status at January 1 for the most recentactuarial valuation dates available:
UnfundedActuarial Actuarial Actuarial UAAL as a
Actuarial Value Accrued Accrued Liability Funded Covered Percentage ofValuation of Assets Liability (UAAL) Ratio Payroll Covered Payroll
Date (a) (b) (b-a) (a/b) (c) ((b-a)/c)
2016 -$ 2,316,580$ 2,316,580$ 0.0% 5,650,403$ 41.0%2013 -$ 3,267,760$ 3,267,760$ 0.0% 5,563,605$ 58.7%
CITY OF WILLMAR, MINNESOTA
SCHEDULE OF FUNDING PROGRESS - OTHER POST EMPLOYMENT BENEFITSDECEMBER 31, 2017

NOTES TO THE REQUIRED
SUPPLEMENTARY INFORMATION

CITY OF WILLMAR, MINNESOTA NOTES TO THE REQUIRED SUPPLEMENTARY INFORMATION
DECEMBER 31, 2017 NOTE 1 CHANGES IN PENSION LIABILITIES AND RELATED RATIOS General Employees Fund: 2017 Changes Changes in Actuarial Assumptions:
• The Combined Service Annuity (CSA) loads were changed from 0.80% for active members and 60.00% for vested and non-vested deferred members. The revised CSA loads are now 0.00% for active member liability, 15.00% for vested deferred member liability and 3.00% for non-vested deferred member liability.
• The assumed post-retirement benefit increase rate was changed from 1.00% per year for all years to
1.00% per year through 2044 and 2.50% per year thereafter. 2016 Changes Changes in Actuarial Assumptions:
• The assumed post-retirement benefit increase rate was changed from 1.00% per year through 2035 and 2.50% per year thereafter to 1.00% per year for all years.
• The assumed investment return was changed from 7.90% to 7.50%. The single discount rate was changed
from 7.90% to 7.50%.
• Other assumptions were changed pursuant to the experience study dated June 30, 2015. The assumed future salary increases, payroll growth, and inflation were decreased by 0.25% to 3.25% for payroll growth and 2.50% for inflation.
2015 Changes Changes in Plan Provisions:
• On January 1, 2015, the Minneapolis Employees Retirement Fund was merged into the General Employees Fund, which increased the total pension liability by $1.1 billion and increased the fiduciary plan net position by $892 million. Upon consolidation, state and employer contributions were revised.
Changes in Actuarial Assumptions:
• The assumed post-retirement benefit increase rate was changed from 1.00% per year through 2030 and 2.50% per year thereafter to 1.00% per year through 2035 and 2.50% per year thereafter.
Police and Fire Fund: 2017 Changes Changes in Actuarial Assumptions:
• Assumed salary increases were changed as recommended in the June 30, 2016 experience study. The net effect is proposed rates that average 0.34% lower than the previous rates.
• Assumed rates of retirement were changed, resulting in fewer retirements.
• The Combined Service Annuity (CSA) load was 30.00% for vested and non-vested deferred members.
The CSA has been changed to 33.00% for vested members and 2.00% for non-vested members.
81

CITY OF WILLMAR, MINNESOTA
NOTES TO THE REQUIRED SUPPLEMENTARY INFORMATION DECEMBER 31, 2017
Police and Fire Fund (Con’t):
• The base mortality table for healthy annuitants was changed from the RP-2000 fully generational table to
the RP-2014 fully generational table (with a base year of 2006), with male rates adjusted by a factor of 0.96. The mortality improvement scale was changed from Scale AA to Scale MP-2016. The base mortality table for disabled annuitants was changed from the RP-2000 disabled mortality table to the mortality tables assumed for healthy retirees.
• Assumed termination rates were decreased to 3.00% for the first three years of service. Rates beyond the
select period of three years were adjusted, resulting in more expected terminations overall.
• Assumed percentage of married female members was decreased from 65.00% to 60.00%.
• Assumed age difference was changed from separate assumptions for male members (wives assumed to be three years younger) and female members (husbands assumed to be four years older) to the assumption that males are two years older than females.
• The assumed percentage of female members electing Joint and Survivor annuities was increased.
• The assumed post-retirement benefit increase rate was changed from 1.00% for all years to 1.00% per
year through 2064 and 2.50% thereafter. 2016 Changes Changes in Actuarial Assumptions:
• The assumed post-retirement benefit increase rate was changed from 1.00% per year through 2037 and 2.50% thereafter to 1.00% per year for all future years.
• The assumed investment return was changed from 7.90% to 7.50%. The single discount rate changed
from 7.90% to 5.60%.
• The assumed future salary increases, payroll growth, and inflation were decreased by 0.25% to 3.25% for payroll growth and 2.50% for inflation.
2015 Changes Changes in Plan Provisions:
• The post-retirement benefit increases to be paid after attainment of the 90.00% funding threshold was changed, from inflation up to 2.50%, to a fixed rate of 2.50%.
Changes in Actuarial Assumptions:
• The assumed post-retirement benefit increase rate was changed from 1.00% per year through 2030 and 2.50% per year thereafter to 1.00% per year through 2037 and 2.50% per year thereafter.
82

COMBINING AND INDIVIDUAL FUND STATEMENTS AND SCHEDULES

83
TotalTotal Total Total Permanent Fund Nonmajor
Special Revenue Capital Projects Debt Service GovernmentalFunds Funds Funds Perpetual Care Funds
ASSETSCash and Cash Equivalents 123,172$ 369,510$ 53,521$ 1,190$ 547,393$ Investments 3,123,397 105,863 - 33,093 3,262,353 Receivables
Taxes Receivable - Current 16,586 - - - 16,586 Accounts Receivable 52,284 - - - 52,284 Notes Receivable 350,000 - - - 350,000 Interest Receivable 21,457 489 - 156 22,102
Due From Other Funds 86,000 659,000 - - 745,000 Due From Other Governments - 331,892 - - 331,892 Prepaid Items 8,984 70,502 175,321 - 254,807 Unamortized Discounts On Bonds - - - - -
Total Assets 3,781,880$ 1,537,256$ 228,842$ 34,439$ 5,582,417$
LIABILITIESAccounts Payable 93,687$ 187,708$ -$ -$ 281,395$ Contracts Payable - - - - - Due To Other Funds 59,000 3,263 - - 62,263 Deposits 280 - - - 280
Total Liabilities 152,967 190,971 - - 343,938
DEFERRED INFLOWS OF RESOURCESUnavailable Revenue 358,606 - - - 358,606
Total Deferred Inflows of Resources 358,606 - - - 358,606
FUND BALANCESNonspendable Fund Balance 8,984 70,502 175,321 30,000 284,807 Restricted Fund Balance 71,688 - 53,521 4,439 129,648 Committed Fund Balance 3,189,635 1,275,783 - - 4,465,418
Total Fund Balances 3,270,307 1,346,285 228,842 34,439 4,879,873 Total Liabilities, Deferred Inflowsof Resources, and Fund Balances 3,781,880$ 1,537,256$ 228,842$ 34,439$ 5,582,417$
City of Willmar, MinnesotaCombining Balance Sheet
NonMajor Governmental FundsDecember 31, 2017

84
TotalTotal Total Total Permanent Fund Nonmajor
Special Revenue Capital Projects Debt Service GovernmentalFunds Funds Funds Perpetual Care Funds
REVENUESGeneral Taxes -$ -$ 46,074$ -$ 46,074$ Other Taxes 228,225 - - - 228,225 Intergovernmental 80,636 478,543 - - 559,179 Charges for Services 221,984 - - - 221,984 Investment Income 57,682 9,011 - 662 67,355 Net change in fair market value 6,179 2,759 - 93 9,031 Contributions/Donations - - - - - Miscellaneous Revenue 279,753 59,319 - - 339,072
Total Revenues 874,459 549,632 46,074 755 1,470,920
EXPENDITURESPublic Safety 27,208 - - - 27,208 Public Works 233,563 - - - 233,563 Culture and Recreation 261,155 - - 192 261,347 Economic Development 34,108 - - - 34,108 Debt Service
Principal - - 160,000 - 160,000 Interest - - 23,642 - 23,642 Other Charges - - 3,180 - 3,180
Capital Projects - 2,817,653 - - 2,817,653 Total Expenditures 556,034 2,817,653 186,822 192 3,560,701
Excess (Deficiency) of Revenues Over (Under) Expenditures 318,425 (2,268,021) (140,748) 563 (2,089,781)
OTHER FINANCING SOURCES (USES)Operating Transfers In 548,939 1,996,347 183,643 - 2,728,929 Operating Transfers Out (652,143) - - - (652,143)
Total Other Financing Sources (Uses) (103,204) 1,996,347 183,643 - 2,076,786
Net Change in Fund Balances 215,221 (271,674) 42,895 563 (12,995)
Fund Balances - Beginning 3,055,086 1,617,959 185,947 33,876 4,892,868 Fund Balances - Ending 3,270,307$ 1,346,285$ 228,842$ 34,439$ 4,879,873$
City of Willmar, MinnesotaCombining Statement of Revenues, Expenditures, and Changes in Fund Balances
NonMajor Governmental FundsFor the Year Ended December 31, 2017

85
Law Law TotalConvention Willmar Library Enforcement Enforcement Special
Industrial and Visitors Community Municipal Improvement Public Works Forfeiture Explorer RevenueDevelopment Bureau Development Airport Reserve Reserve Fund Fund Funds
ASSETSCash and Cash Equivalents (85,304)$ 12,596$ -$ 123,404$ 362$ 426$ 65,058$ 6,630$ 123,172$ Investments 1,600,430 247,568 - 155,476 161,068 958,855 - - 3,123,397 Receivables
Taxes Receivable - 16,586 - - - - - - 16,586 Accounts Receivable 36,188 320 - 15,776 - - - - 52,284 Notes Receivable - - 350,000 - - - - - 350,000 Interest Receivable 7,511 1,154 6,806 724 763 4,499 - - 21,457
Due From Other Governments - - - - - - - - - Due From Other Funds 86,000 - - - - - 86,000 Prepaid Items - 8,730 - 254 - - - - 8,984
Total Assets 1,644,825$ 286,954$ 356,806$ 295,634$ 162,193$ 963,780$ 65,058$ 6,630$ 3,781,880$
LIABILITIESAccounts Payable 30,000$ 46,634$ -$ 17,053$ -$ -$ -$ -$ 93,687$ Contract Payable - - - - - - - - - Due To Other Governments - - - - - - - - - Due To Other Funds - - - 59,000 - - - - 59,000 Deposits - - - 280 - - - - 280
Total Liabilities 30,000 46,634 - 76,333 - - - - 152,967
DEFERRED INFLOWS OF RESOURCESUnavailable Revenue - - 356,806 1,800 - - - - 358,606
Total Deferred Inflows of Resources - - 356,806 1,800 - - - - 358,606
FUND BALANCESNonspendable Fund Balance - 8,730 - 254 - - - - 8,984 Restricted Fund Balance - - - - - - 65,058 6,630 71,688 Committed Fund Balance 1,614,825 231,590 - 217,247 162,193 963,780 - - 3,189,635
Total Fund Balances 1,614,825 240,320 - 217,501 162,193 963,780 65,058 6,630 3,270,307
Total Liabilities, Deferred Inflowsof Resources, and Fund Balances 1,644,825$ 286,954$ 356,806$ 295,634$ 162,193$ 963,780$ 65,058$ 6,630$ 3,781,880$
City of Willmar, MinnesotaCombining Balance Sheet
NonMajor Governmental Funds/Special RevenueDecember 31, 2017

86
Law Law TotalConvention Willmar Library Enforcement Enforcement Special
Industrial and Visitors Community Municipal Improvement Public Works Forfeiture Explorer RevenueDevelopment Bureau Development Airport Reserve Reserve Fund Fund Funds
REVENUESGeneral Taxes -$ -$ -$ -$ -$ -$ -$ -$ -$ Other Taxes - 228,225 - - - - - - 228,225 Intergovernmental - 55,691 - 24,945 - - - - 80,636 Service Charges 84,629 1,281 - 118,180 - - 12,494 5,400 221,984 Investment income 30,005 4,510 - 797 3,321 18,993 56 - 57,682 Fair Market Value Incr/(Decr) 3,190 518 - (524) 470 2,525 - - 6,179 Miscellaneous Revenue 270,545 4,402 - 4,806 - - - - 279,753
Total Revenues 388,369 294,627 - 148,204 3,791 21,518 12,550 5,400 874,459
EXPENDITURESPublic Safety - - - - - - 23,508 3,700 27,208 Streets and Highways - - - 233,563 - - - - 233,563 Culture and Recreation - 256,426 - - 4,729 - - - 261,155 Economic Development 34,108 - - - - - - - 34,108
Total Expenditures 34,108 256,426 - 233,563 4,729 - 23,508 3,700 556,034
Excess (Deficiency) of Revenues Over (Under) Expenditures 354,261 38,201 - (85,359) (938) 21,518 (10,958) 1,700 318,425
OTHER FIN. SOURCES (USES) Transfers In - - - 133,939 - 415,000 - - 548,939 Transfers Out - (9,500) - (242,643) - (400,000) - - (652,143)
Total Other Fin. Soursces (Uses) - (9,500) - (108,704) - 15,000 - - (103,204)
Net Change in Fund Balances 354,261 28,701 - (194,063) (938) 36,518 (10,958) 1,700 215,221
Fund Balances - Beginning 1,260,564 211,619 - 411,564 163,131 927,262 76,016 4,930 3,055,086 Fund Balances - Ending 1,614,825$ 240,320$ -$ 217,501$ 162,193$ 963,780$ 65,058$ 6,630$ 3,270,307$
City of Willmar, MinnesotaCombining Statement of Revenues, Expenditures, and Changes in Fund Balances
NonMajor Governmental Funds/Special RevenueFor the Year Ended December 31, 2017

87
TotalNonMajor
Airport Capital Capital ProjectCapital Project Improvement Funds
ASSETSCash (284,083)$ 653,593$ 369,510$ Investments - 105,863 105,863 Accounts Receivable - - - Interest Receivable - 489 489 Due From Other Funds 59,000 600,000 659,000 Due From Other Governments 331,892 - 331,892 Prepaid Expenses - 70,502 70,502
Total Assets 106,809$ 1,430,447$ 1,537,256$ LIABILITIES
Accounts Payable 33,111$ 154,597$ 187,708$ Contracts Payable - - - Due To Other Funds - 3,263 3,263 Due To Other Gov Units - - -
Total Liabilities 33,111 157,860 190,971 DEFERRED INFLOWS OF RESOURCES
Unavailable Revenue - - - Total Deferred Inflows of Resources - - -
FUND BALANCESNonspendable Fund Balance - 70,502 70,502 Restricted Fund Balance - - - Committed Fund Balance 73,698 1,202,085 1,275,783
Total Fund Balance 73,698 1,272,587 1,346,285 Total Liabilities, Deferred Inflowsof Resources and Fund Balances 106,809$ 1,430,447$ 1,537,256$
City of Willmar, MinnesotaCombining Balance Sheet
NonMajor Governmental Funds/Capital ProjectsDecember 31, 2017

88
TotalNonMajor
Airport Capital Capital ProjectCapital Project Improvement Funds
REVENUESIntergovernmental 478,543$ -$ 478,543$ Investment Income - 9,011 9,011 Market Value Incr/(Decr) - 2,759 2,759 Miscellaneous - 59,319 59,319
Total Revenues 478,543 71,089 549,632
EXPENDITURESCapital/Construction Projects 613,047 2,204,606 2,817,653
Total Expenditures 613,047 2,204,606 2,817,653
Excess (Deficiency) of Revenues Over (Under) Expenditures (134,504) (2,133,517) (2,268,021)
OTHER FINANCING SOURCES (USES)Operating Transfers In 59,000 1,937,347 1,996,347 Operating Transfers Out - - -
Total Other Financing Sources (Uses) 59,000 1,937,347 1,996,347
Net Change in Fund Balances (75,504) (196,170) (271,674)
Fund Balance - Beginning 149,202 1,468,757 1,617,959 Fund Balance- Ending 73,698$ 1,272,587$ 1,346,285$
City of Willmar, MinnesotaCombining Statement of Revenues, Expenditures, and Changes in Fund Balances
NonMajor Governmental Funds/Capital ProjectsFor the Year Ended December 31, 2017

89
Airport Tax TotalG.O. Revenue Increment Debt Service
Bond Bonds FundsASSETS
Cash and Cash Equivalents (5,179)$ 58,700$ 53,521$ Due From Other Funds - - - Prepaid Expenses 175,321 - 175,321 Unamort Discount On Bonds Sold - - -
Total Assets 170,142$ 58,700$ 228,842$
LIABILITIESAccounts Payable -$ -$ -$ Due To Other Funds - - -
Total Liabilities - - - FUND BALANCES
Nonspendable - Prepaid Expenses 175,321 - 175,321 Restricted (5,179) 58,700 53,521 Committed - - -
Total Fund Balances 170,142 58,700 228,842
Total Liabilities and Fund Balances 170,142$ 58,700$ 228,842$
City of Willmar, Minnesota
December 31, 2017
Non-Major Debt Service FundsCombining Balance Sheets

90
Airport Tax TotalG.O. Revenue Increment Debt Service
Bond Bonds FundsREVENUES
Tax Increment -$ 46,074$ 46,074$ Investment Income - - - Market Value Increase (Decrease) - - - Miscellaneous - - -
Total Revenues - 46,074 46,074
EXPENDITURES
Bond Principal Payments 160,000 - 160,000 Interest Payments 23,642 - 23,642 Other Charges 3,180 - 3,180
Total Expenditures 186,822 - 186,822 Excess (Deficiency) of Revenues Over (Under) Expenditures (186,822) 46,074 (140,748)
OTHER FINANCING SOURCES (USES)Transfers In 183,643 - 183,643 Transfers Out - - -
Total Other Financing Sources (Uses) 183,643 - 183,643
Net Change in Fund Balances (3,179) 46,074 42,895 Fund Balances - Beginning 173,321 12,626 185,947 Fund Balances - Ending 170,142$ 58,700$ 228,842$
City of Willmar, Minnesota
Combined Schedule of Revenues, Expenditures, and Changes in Fund BalancesNon-MajorDebt Service Funds
For the Year Ended December 31, 2017

91
OfficeServices
ASSETSCurrent Assets:
Cash And Cash Equivalents 171,029$ Investments - Accounts Receivable 81 Interest Receivable - Due From Component Unit - Intergovernmental Receivable - Due From Other Funds 3,571 Inventories - Merchandise For Resale - Prepaid Expenses - Amount To Be Provided -
Total Current Assets 174,681
Noncurrent Assets:Capital Assets:
Office Equipment - Less Accumulated Depreciation -
Total Capital Assets (net of accumulated depreciation) - Total Assets 174,681
LIABILITIES
Current LiabilitiesAccounts Payable - Due To Other Funds -
Total Current Liabilities -
NET POSITIONRestricted Fund Balance-Inventories - Restricted Fund Balance-Prepaids - Assigned Fund Balance 174,681 Assigned Fund Balance-Surplus Invested In Fixed Assets -
Total Net Position 174,681$
City of Willmar, MinnesotaInternal Service Funds
Combining Statement of Net PositionDecember 31, 2017

92
OfficeServices
Operating Revenues:Charges For Services -$
Total Operating Revenues -
Operating Expenses:Cost of Materials Used: Inventory, January 1 3,571 Purchases -
Total Available 3,571 Inventory, December 31 -
Total Cost of Materials Transferred 3,571 Inventory Transferred to General Fund (3,571) Other Services And Charges - Depreciation -
Total Operating Expenses - Operating Income (Loss) -
Nonoperating Revenues (Expenses):Interest On Investments - Market Value Increase/(Decrease) - Capital Asset Acquisition/(Disposal) -
Total Nonoperating Revenues -
Income (Loss) Before Contributions and Transfers -
Operating Transfers In - Operating Transfers Out -
Change in Net Position -
Total Net Position - Beginning 174,681 Total Net Position - Ending 174,681$
City of Willmar, MinnesotaInternal Service Funds
Combining Statement of Revenues, Expenses, and Changes in Fund Net PositionFor the Year Ended December 31, 2017

93
OfficeServices
CASH FLOWS FROM OPERATING ACTIVITIES:Receipts from Charges For Services 535$ Payments For Purchases - Payments For Other Services and Charges - Liquidation of Liabilities -
Net Cash Provided (Used) by Operating Activities 535
CASH FLOWS FROM NONCAPITAL FINANCING ACTIVITIES:Transfer from Other Funds - Transfer to Other Funds -
Net Cash Used in Noncapital and Related Financing Activities -
CASH FLOWS FROM CAPITAL AND RELATED FINANCING ACTIVITIES:Principal Payments on Long-Term Debt -
Net Cash Used in Capital and Related Financing Activities -
CASH FLOWS FROM INVESTING ACTIVITIES:Principal Collected on Loan - Proceeds from Sales and Maturities of Investments - Purchase of Investments - Interest and Dividends Received -
Net Cash Provided (Used) from Investing Activities -
Net Increase (Decrease) in Cash and Cash Equivalents 535 Cash and Cash Equivalents - Beginning 170,494 Cash and Cash Equivalents - Ending 171,029$
Reconciliation of Operating Income to Net Cash Provided (Used) by Operating Activities:
Operating Income (Loss) -$ Adjustments to Reconcile Operating Income from to Net Cash Provided (Used) by Operating Activities:
Depreciation - Change in Assets and Liabilities: (Increase) Decrease in Accounts Receivable 535 (Increase) Decrease in Prepaid Expenses - (Increase) Decrease in Due From Other Funds - (Increase) Decrease in Due From Component Units - (Increase) Decrease in Inventories - Increase (Decrease) in Accounts Payable - Increase (Decrease) in Due to Other Funds -
Total Adjustments 535 Net Cash Provided (Used) by Operating Activities 535$
City of Willmar, MinnesotaInternal Service Funds
Combining Statement of Cash FlowsFor the Year Ended December 31, 2017

94
Agency Fund Agency Fund Agency Fund Agency Fund Agency FundGovernor's Fishing Fire Insurance Bioscience Destination Donation
Opener Fund Escrow/Trust Fund Grant Fund Playground Fund FundASSETS
Cash and Cash Equivalents 7,120$ -$ -$ (233)$ 13,000$ Accounts Receivable - - - 233 - Due From General Fund - - - - -
Total Assets 7,120$ -$ -$ -$ 13,000$
LIABILITIESAccounts Payable 707$ -$ -$ -$ -$
Total Liabilities 707 - - - -
NET POSITIONRestricted 6,413 - - - 13,000
Total Net Position 6,413$ -$ -$ -$ 13,000$
City of Willmar, MinnesotaStatement of Net Position
Fiduciary Funds - Agency FundDecember 31, 2017

95
Agency Fund Agency Fund Agency Fund Agency Fund Agency FundGovernor's Fire Insurance Bioscience Destination
Fishing Opener Escrow/Trust Grant Playground DonationFund Fund Fund Fund Fund
ADDITIONSIntergovernmental
State Grant -$ -$ -$ -$ -$ Serv ice Charges
Miscellaneous - - - - - Miscellaneous
Miscellaneous - 16,294 - - - Contributions/Donations 7,220 - - 1,901,852 3,508 Insurance Reimbursement - - 1,931 - -
Total Additions 7,220 16,294 1,931 1,901,852 3,508
DEDUCTIONSSupplies
Supplies - - - 668,349 - Other Services
Other Services - 16,294 - 61,429 - Other Charges
Insurance and Bonds - - 1,931 - - Other Improvements - - - 1,172,074 - Other Charges 807 - - - -
TransfersTransfer Out - - - - 508
Total Deductions 807 16,294 1,931 1,901,852 508
Change in Net Position 6,413 - - - 3,000
Net Position - Beginning - - - - 10,000 Net Position - Ending 6,413$ -$ -$ -$ 13,000$
For the Year Ended December 31, 2017Fiduciary Funds - Agency Funds
Statement of Changes in Net PositionCity of Willmar, Minnesota

CITY OF WILLMAR, MINNESOTA
STATISTICAL SECTION

96
2017 2016Governmental Funds Capital Assets:
Land 8,585,806$ 8,585,806$ Buildings and Structures 14,126,227 14,098,229 Furniture and Equipment 3,484,595 3,335,503 Machinery and Auto Equipment 9,672,140 9,026,127 Other Improvements 128,923,693 119,312,160
Total Governmental Funds Capital Assets 164,792,461$ 154,357,825$
Investments in Governmental Funds Capital Assets By Source:
General Fund 139,824,055$ 129,389,419$ Special Revenue Fund 24,968,406 24,968,406 Capital Projects Funds - -
Total Governmental Funds Capital Assets 164,792,461$ 154,357,825$
*This schedule presents only the capital asset balances related to governmental funds.Accordingly, the capital assets reported in internal service funds are excluded from theabove amounts. Generally, the capital assets of internal service funds are included asgovernmental activities in the statement of net assets.
City of Willmar, Minnesota
Comparative Schedules By Source*
December 31, 2017 and 2016
Capital Assets Used in the Operation of Governmental Funds

97
Governmental GovernmentalFunds Capital Funds Capital
FIXED ASSETS-2017 Assets Assets01/01/2017 Additions Deductions 12/31/2017
GENERAL GOVERNMENT Mayor & Council 20,743$ -$ -$ 20,743$ Community Development 240,572 - - 240,572 City Clerk-Treasurer - - - - Assessing - - - - Accounting - 15,000 - 15,000 City Hall 829,429 20,047 - 849,476 Data Processing 364,711 81,293 24,083 421,921 Elections 83,370 - - 83,370 Non-Departmental 183,525 - - 183,525 Industrial Development 1,102,281 - - 1,102,281 Total 2,824,631 116,340 24,083 2,916,888 PUBLIC SAFETY Police Dept. 804,102 251,670 90,611 965,161 Trust & Agency K-9 - - - - Fire Dept. 3,919,515 325,506 59,068 4,185,953 Public Parking 631,870 - - 631,870 Total 5,355,487 577,176 149,679 5,782,984 PUBLIC WORKS Engineering 241,779 - - 241,779 Public Works 111,215,448 10,024,201 199,555 121,040,094 Airport 23,866,125 - - 23,866,125 Transit - - - - Total 135,323,352 10,024,201 199,555 145,147,998 CULTURE & RECREATION Auditorium 557,574 - - 557,574 Buildings & Grounds 1,262,739 - - 1,262,739 Leisure Services 171,094 70,691 - 241,785 Civic Center 5,846,054 - - 5,846,054 Community Center 494,032 - 5,321 488,711 Aquatic Center 2,093,577 7,950 - 2,101,527 WRAC-8 276,781 16,916 - 293,697 Library 152,504 - - 152,504 Total 10,854,355 95,557 5,321 10,944,591
GRAND TOTAL 154,357,825$ 10,813,274$ 378,638$ 164,792,461$
*This schedule presents only the capital asset balances related to governmental funds. Accordingly, thecapital assets reported in internal service funds are excluded from the above amounts. Generally, the capitalassets of internal service funds are included as governmental activities in the statement of net assets.
City of Willmar, MinnesotaCapital Assets Used in the Operation of Governmental Funds
Schedule of Changes By Function and Activity*For the Fiscal Year Ended December 31, 2017

98
FIXED ASSETS-2017 Buildings/ Furniture/ Machinery/ OtherTotal Land Structures Equipment Auto Improvements
GENERAL GOVERNMENTMayor & Council 20,743$ -$ -$ 20,743$ -$ -$ Community Development 240,572 174,960 - - 65,612 - City Clerk-Treasurer - - - - - - Assessing - - - - - - Accounting 15,000 - - 15,000 - - City Hall 849,476 40,000 785,528 - - 23,948 Data Processing 421,921 - - 289,847 - 132,074 Elections 83,370 - - 83,370 - - Non-Departmental 183,525 - - 183,525 - - Industrial Development 1,102,281 1,102,281 - - - - Total 2,916,888 1,317,241 785,528 592,485 65,612 156,022
PUBLIC SAFETYPolice Dept. 965,161 - - 92,680 850,281 22,200 Trust & Agency K-9 - - - - - - Fire Dept. 4,185,952 163,547 662,553 781,064 2,500,249 78,539 Public Parking 631,870 631,870 - - - - Total 5,782,983 795,417 662,553 873,744 3,350,530 100,739
PUBLIC WORKS Engineering 241,778 - - 90,867 113,397 37,514 Public Works 121,040,094 1,923,271 1,555,192 415,778 5,694,183 111,451,670 Airport 23,866,125 4,236,165 3,961,108 24,744 23,533 15,620,575 Transit - - - - - - Total 145,147,997 6,159,436 5,516,300 531,389 5,831,113 127,109,759
CULTURE & RECREATIONAuditorium 557,574 - 530,978 14,596 - 12,000 Buildings & Grounds 1,262,739 112,405 14,169 420,320 6,950 708,895 Leisure Services 241,785 14,900 11,660 99,923 19,961 95,341 Civic Center 5,846,055 23,572 4,532,077 437,852 397,974 454,580 Community Center 488,711 87,635 316,409 10,570 - 74,097 Aquatic Center 2,101,528 75,200 1,491,553 322,515 - 212,260 WRAC-8 293,697 - 112,496 181,201 - - Library 152,504 - 152,504 - - - Total 10,944,593 313,712 7,161,846 1,486,977 424,885 1,557,173
GRAND TOTAL 164,792,461$ 8,585,806$ 14,126,227$ 3,484,595$ 9,672,140$ 128,923,693$
*This schedule presents only the capital asset balances related to governmental funds. Accordingly, the capital assets reported in internalservice funds are excluded from the above amounts. Generally, the capital assets of internal service funds are included as governmentalactivities in the statement of net assets.
City of Willmar, MinnesotaCapital Assets Used in the Operation of Governmental Funds
Schedule By Function and Activity*December 31, 2017

99
Fiscal General Public Public Culture & Debt Waste OfficeYear Government Safety Works Miscellaneous Recreation Service Treatment Services Total
2008 3,120,895$ 5,483,622$ 3,174,692$ 4,778,060$ 2,023,979$ 2,120,587$ 2,775,907$ 27,311$ 23,505,053$
2009 3,190,772$ 4,451,561$ 2,992,636$ 3,277,484$ 2,213,398$ 2,354,859$ 2,851,067$ 21,458$ 21,353,235$
2010 3,207,918$ 4,552,433$ 3,133,761$ 4,000,966$ 2,167,668$ 2,455,304$ 4,854,543$ 22,486$ 24,395,079$
2011 2,917,909$ 4,666,965$ 7,367,466$ 665,894$ 2,489,029$ 413,242$ 6,952,251$ 18,366$ 25,491,122$
2012 3,561,177$ 4,491,386$ 7,629,637$ 61,642$ 2,333,523$ 404,292$ 6,870,154$ 19,924$ 25,371,735$
2013 3,789,359$ 4,721,161$ 6,342,972$ 38,864$ 2,476,352$ 369,360$ 6,734,381$ 17,816$ 24,490,265$
2014 4,411,086$ 4,725,380$ 7,506,805$ 863,301$ 2,344,720$ 307,220$ 6,749,481$ 18,283$ 26,926,276$
2015 4,052,775$ 5,055,428$ 6,949,073$ 896,033$ 2,441,662$ 297,324$ 6,773,721$ 16,137$ 26,482,153$
2016 3,907,763$ 6,277,277$ 7,432,779$ 13,828$ 2,631,463$ 259,475$ 6,488,885$ -$ 27,011,470$
2017 3,704,457$ 5,735,917$ 8,216,746$ 34,108$ 2,889,721$ 230,050$ 6,544,284$ -$ 27,355,283$
GOVERNMENT-WIDE EXPENSES BY FUNCTION
Years 2008 Through 2017
CITY OF WILLMAR, MINNESOTA

100
Program Revenues
Charges For MiscellaneousFiscal Year Services Taxes Revenue Total
2008 6,139,089$ 5,497,952$ 9,493,609$ 21,130,650$
2009 5,164,337$ 5,687,570$ 8,635,280$ 19,487,187$
2010 5,999,445$ 5,531,315$ 9,728,257$ 21,259,017$
2011 7,119,338$ 5,937,945$ 7,987,977$ 21,045,260$
2012 8,216,270$ 6,556,909$ 5,618,843$ 20,392,022$
2013 9,122,485$ 4,551,582$ 2,648,145$ 16,322,212$
2014 10,579,467$ 4,582,848$ 8,284,427$ 23,446,742$
2015 10,662,682$ 4,999,764$ 6,532,260$ 22,194,706$
2016 12,283,777$ 4,948,435$ 4,654,625$ 21,886,837$
2017 11,945,372$ 5,328,601$ 6,614,979$ 23,888,952$
General Revenues
CITY OF WILLMAR, MINNESOTA
GOVERNMENT-WIDE REVENUES
Years 2008 through 2017

101
Fiscal General Public Public Culture &Year Government Safety Works Miscellaneous Recreation Total
2008 3,120,895$ 5,483,622$ 3,174,692$ 6,898,647$ 2,023,979$ 20,701,835$
2009 3,190,772$ 4,451,561$ 2,992,636$ 5,632,343$ 2,213,398$ 18,480,710$
2010 3,207,918$ 4,552,433$ 3,133,761$ 6,456,270$ 2,167,668$ 19,518,050$
2011 3,418,244$ 4,405,813$ 3,002,099$ 6,333,895$ 2,124,155$ 19,284,206$
2012 3,514,064$ 4,247,132$ 2,726,069$ 5,786,080$ 2,098,772$ 18,372,117$
2013 3,744,641$ 4,497,748$ 2,735,734$ 7,978,526$ 2,238,245$ 21,194,894$
2014 3,955,656$ 4,468,517$ 3,148,422$ 9,527,501$ 2,095,665$ 23,195,761$
2015 3,800,646$ 4,687,727$ 3,149,546$ 10,166,863$ 2,172,120$ 23,976,902$
2016 3,791,773$ 4,741,831$ 3,092,997$ 7,251,799$ 2,292,543$ 21,170,943$
2017 3,686,249$ 4,877,210$ 3,116,452$ 7,876,960$ 2,585,565$ 22,142,436$
GENERAL GOVERNMENTAL EXPENDITURES BY FUNCTION
Years 2008 Through 2017
CITY OF WILLMAR, MINNESOTA

102
Fiscal Licenses Intergovernmental Charges for Fines and MiscellaneousYear Taxes and Permits Revenues Services Forfeitures Revenue Total
2008 5,497,952$ 1,454,324$ 6,887,102$ 886,291$ 236,776$ 3,941,369$ 18,903,814$
2009 5,687,570$ 447,306$ 7,142,387$ 919,809$ 188,957$ 3,397,091$ 17,783,120$
2010 5,531,315$ 382,526$ 6,465,918$ 1,283,366$ 168,716$ 3,087,542$ 16,919,383$
2011 5,937,945$ 297,119$ 6,493,563$ 957,293$ 163,098$ 3,995,684$ 17,844,702$
2012 6,556,909$ 293,104$ 5,116,594$ 899,220$ 153,648$ 3,064,880$ 16,084,355$
2013 4,551,582$ 542,406$ 7,155,696$ 941,224$ 153,774$ 502,949$ 13,847,631$
2014 4,582,848$ 544,182$ 6,325,521$ 971,092$ 167,157$ 4,944,871$ 17,535,671$
2015 4,999,764$ 474,907$ 7,521,732$ 1,002,048$ 189,682$ 2,970,082$ 17,158,215$
2016 4,948,435$ 698,062$ 6,402,935$ 1,061,549$ 158,377$ 2,572,567$ 15,841,925$
2017 5,328,601$ 554,249$ 6,978,036$ 986,535$ 147,836$ 3,154,808$ 17,150,065$
CITY OF WILLMAR, MINNESOTA
GENERAL GOVERNMENTAL REVENUES BY SOURCE
Years 2008 Through 2017

103
Collections DelinquentTotal Current Per Cent Delinquent Total As Per Cent Outstanding Taxes as
Fiscal Tax Tax Of Levy Tax Tax of Current Delinquent Per Cent ofYear Levy Collections Collected Collections Collections Levy Taxes Current Levy
2008 3,383,646 3,304,665 98.18% 49,576 3,354,241 99.94% 97,374 2.88%
2009 3,525,325 3,440,974 97.61% 64,902 3,505,876 99.45% 114,055 3.24%
2010 3,668,705 3,296,429 89.85% 72,658 3,369,087 91.83% 133,513 3.64%
2011 3,796,734 3,450,982 90.89% 111,257 3,562,239 93.82% 87,859 2.31%
2012 3,992,734 3,899,155 97.66% 66,276 3,965,431 99.32% 115,222 2.89%
2013 4,140,118 4,043,802 97.67% 83,792 4,127,594 99.70% 119,118 2.88%
2014 4,139,734 4,046,221 97.74% 84,538 4,130,759 99.78% 52,084 1.26%
2015 4,451,028 4,373,956 98.27% 98,147 4,472,103 100.47% 93,024 2.09%
2016 4,451,028 4,381,753 98.44% 76,376 4,458,129 100.16% 84,108 1.89%
2017 4,829,365 4,747,653 98.31% 45,846 4,793,499 99.26% 88,473 1.83%
CITY OF WILLMAR, MINNESOTA
PROPERTY TAX LEVIES AND COLLECTIONS
Years 2008 Through 2017

104
2008 2009 2010 2011
Population (*Census) 18,757 18,757 19,610 19,610
REAL PROPERTYTax Capacity 12,005,028 12,526,714 12,830,579 12,975,909
Less: Tax Increment Districts - Phoenix #95 15,031 15,031 15,031 15,031 Relco #05 27,154 0 0 0 Lakewood #06 7,382 7,834 7,834 7,834 Jennie-O (2) #07 0 0 0 0
JOBZ 82,927 99,310 113,205 118,210
Powerline 0 0 0 0
Agriculture District 0 0 0 0
Net Tax Capacity 11,872,534 12,404,539 12,694,509 12,834,834
Estimated Market Value 983,810,800 1,020,849,500 1,044,367,400 1,055,031,300
PERSONAL PROPERTYTax Capacity 110,372 112,608 113,796 129,053Estimated Market Value 5,921,300 6,095,700 6,201,500 6,969,200
TOTAL REAL AND PERSONAL PROPERTYTax Capacity 11,982,906 12,517,147 12,808,305 12,963,887Estimated Market Value 989,732,100 1,026,945,200 1,050,568,900 1,062,000,500
PERCENT OF TAX CAPACITY TOESTIMATED MARKET VALUE 0.012107 0.012189 0.012192 0.012207
PER CAPITA VALUATIONTax Capacity 639 667 653 661Estimated Market Value 52,766 54,750 53,573 54,156
NET BONDED DEBTNet Bonded Debt per Capita N/A N/A N/A N/ANet Bonded Debt per Tax Capacity N/A N/A N/A N/A
TAX CAPACITIES AND ESTIMATED MARKET VALUE OF TAXABLE PROPERTY
CITY OF WILLMAR, MINNESOTA
YEARS 2008 THROUGH 2017

105
2012 2013 2014 2015 2016 2017
19,694 19,694 19,694 19,694 19,694 19,694
11,959,117 12,120,212 12,093,317 12,546,465 12,758,485 13,084,650
0 0 0 0 0 00 0 0 0 0 00 0 0 0 0 00 0 0 1,506 9,544 43,820
143,402 181,069 181,807 181,807 181,807 0
0 0 0 0 0 1,664
0 0 0 0 0 125,368
11,815,715 11,939,143 11,911,510 12,363,152 12,567,134 12,913,798
1,065,852,600 1,064,093,500 1,054,462,700 1,094,771,600 1,091,900,300 1,118,592,200
131,992 137,153 140,199 146,908 202,716 207,0697,150,300 7,407,100 7,581,400 7,977,200 8,457,400 10,884,900
11,947,707 12,076,296 12,051,709 12,510,060 12,769,850 13,120,8671,073,002,900 1,071,500,600 1,062,044,100 1,102,748,800 1,100,357,700 1,129,477,100
0.011135 0.011270 0.011348 0.011344 0.011605 0.011617
607 613 612 635 648 66654,484 54,407 53,927 55,994 55,873 57,351
N/A N/A N/A N/A N/A N/AN/A N/A N/A N/A N/A N/A
CITY OF WILLMAR, MINNESOTA
TAX CAPACITIES AND ESTIMATED MARKET VALUE OF TAXABLE PROPERTY
YEARS 2008 THROUGH 2017

106
Year EDC/Tax Mid-MNDue City School *** County H.R.A. Dev. Total
2008 28.23 20.23 56.71 1.18 1.32 107.67
2009 28.16 20.54 56.88 1.51 1.25 108.34
2010 28.64 19.84 53.36 1.32 1.16 104.32
2011 29.28 19.93 55.94 1.30 1.16 107.61
2012 33.42 22.35 60.66 1.41 1.22 119.06
2013 34.28 19.72 59.06 0.96 1.17 115.19
2014 34.35 12.61 56.40 1.39 1.11 105.86
2015 35.58 8.41 54.18 1.07 1.02 100.26
2016 34.85 23.75 56.18 1.06 1.06 116.90
2017 36.81 27.37 57.33 1.12 1.11 123.74
*** Includes Mid Minnesota Development Commission.
CITY OF WILLMAR, MINNESOTA
A 10-YEAR COMPARISON OF TAX CAPACITY RATES
Years 2008 Through 2017
ALL OVERLAPPING GOVERNMENTS
TAX CAPACITY RATES

107
EDC/ Year Market Rural Tax Value Dev. Fin. Due *City School Ref. **County H.R.A. Auth. Total
2008 3,383,493 2,424,022 1,236,868 6,795,266 141,159 131,812 14,112,620
2009 3,525,204 2,571,272 1,724,036 7,145,914 188,884 129,302 15,284,612
2010 3,663,422 2,538,124 1,807,189 6,850,914 168,577 121,253 15,149,479
2011 3,755,160 2,555,586 1,840,022 7,199,752 166,953 121,945 15,639,418
2012 3,997,702 2,670,551 1,866,059 7,273,883 168,582 118,999 16,095,776
2013 4,139,754 2,381,446 1,670,118 7,158,587 168,585 114,846 15,633,336
2014 4,139,400 1,519,721 1,565,134 6,822,472 168,362 108,224 14,323,313
2015 4,450,579 1,052,346 1,649,161 6,800,969 133,733 104,834 14,191,622
2016 4,450,804 3,032,201 1,565,062 7,197,726 135,488 111,608 16,492,889
2017 4,828,905 3,625,557 1,608,842 7,594,913 148,907 147,184 17,954,308
* This Levy does not take into consideration the small reduction that resultsfrom agricultural property.
** Includes Mid Minnesota Development Commission.
CITY OF WILLMAR, MINNESOTA
A 10-YEAR COMPARISON OF TAX CAPACITY LEVIES
Years 2008 Through 2017
ALL OVERLAPPING GOVERNMENTS
TAX LEVIES

108
MarketValuationPayable
Taxpayer Type of Business 2018 Total Tax
Minnwest Technology Campus Technology Campus 16,078,900$ 314,002$ Rockstep Wilmar, LLC Shopping Mall 11,393,000$ 227,110$ Affiliated Community Health Medical Center 11,037,200$ 217,332$ WalMart Stores, Inc. Discount Retailer 10,270,200$ 204,654$ Mills Property Investments, LLC Vehicle Dealership 10,017,600$ 188,136$ Torgerson Properties, Inc. Hospitality/Hotel 9,142,600$ 180,602$ Menard, Inc. Retailer 7,937,100$ 157,992$ Jennie-O Turkey Store, Inc. Food Processing 7,162,700$ 142,458$ Willmar Ten Investors Investment Company 6,896,700$ 132,684$ Centerpoint Energy Minnegasco Utility Company 6,287,600$ 125,002$
CITY OF WILLMAR, MINNESOTA
December 31, 2017
PRINCIPAL TAXPAYERS

109
Percent of Total OutstandingCurrent Current Collections Current and
Fiscal Assessments Assessments To Amount DelinquentYear Due Collected Due Assessments
2008 1,497,645 1,459,639 97.46% 50,876
2009 1,268,693 1,145,147 90.26% 135,323
2010 1,149,652 1,031,192 89.70% 217,417
2011 1,129,081 1,014,192 89.82% 265,294
2012 1,162,674 1,074,741 92.44% 291,365
2013 1,095,335 985,263 89.95% 355,375
2014 1,008,979 974,209 96.55% 361,233
2015 920,213 881,012 95.74% 369,448
2016 729,647 695,150 95.27% 377,236
2017 698,213 688,739 98.64% 299,531
NOTE: Special Assessments are certified to the County Auditorof Kandiyohi County for collection. Special AssessmentBonds are general obligation pursuant to M.S.A.Section 430.12
CITY OF WILLMAR, MINNESOTA
SPECIAL ASSESSMENT BILLINGS AND COLLECTIONS
Year 2008 Through 2017

110
CITY OF WILLMAR, MINNESOTA
COMPUTATION OF LEGAL DEBT MARGIN
December 31, 2017
Legal Debt Limit and Margin
Legal Debt Limit (2% of Estimated Market Value $1,129,477,100) 22,589,542$ Less: Outstanding Debt Subject to Limit -$ Legal Debt Margin as of December 31, 2017 22,589,542$
General Obligation Debt Supported Solely by Taxes* -$
* Nothing subject to legal debt limit

111
Date of Incorporation November 19, 1901
Date of Adoption of City Charter November 5, 1968
Form of Government Administrator
Fiscal Year Begins January 1
Area - Acres (Land) 7,398- Acres (Water) 1,229
Miles of Streets and Alleys:Streets -
Paved 132.34Sidewalks 65.00Bike Paths 17.70
Building PermitsNumber of Permits Issued
Year 2017 599Year 2016 498Year 2015 439Year 2014 450Year 2013 414Year 2012 479Year 2011 533Year 2010 592Year 2009 772Year 2008 780
Estimated Construction CostsYear 2017 44,185,171$ Year 2016 58,648,616 Year 2015 34,088,689 Year 2014 48,558,272 Year 2013 49,216,963 Year 2012 17,114,395 Year 2011 13,041,853 Year 2010 22,520,064 Year 2009 30,922,465 Year 2008 70,002,629
*Information obtained from various Departmental Reports
CITY OF WILLMAR, MINNESOTA
MISCELLANEOUS STATISTICAL FACTS

112
2017 2016Public Safety:
Fire Protection: Number of Stations 1.00 1.00Number of Employees (Admin. & Clerical) 2.80 2.80Number of Volunteer Firefighters 40.00 38.00
Police Protection:Number of Stations 1.00 1.00Number of Employees (Admin. & Clerical) 4.00 4.00Number of Employees (Law Enforcement Officers) 34.00 31.00 Total Number of Employees 82.80 77.80
Leisure Services:Number of Full-Time Employees 4.6 5.5Number of Part-Time Employees 133 127Number of Wading Pools 0 0Number of Outdoor Swimming Pools 1 1Number of Shelters 30 30Number of Skating Rinks 4 4Number of Hockey Rinks 2 2Indoor Rinks 2 2Tennis Courts - Lighted 6 6
Non-Lighted 0 0Shared-Lighted 12 12
Lighted Softball, Football, Baseball and Soccer Fields 7 7Miles of Hiking and Bicycle Paths Est. 16 Miles Est. 16 MilesSkate Board Parks 1 1BMX Bike Tracks 0 018-Hole Frisbee Golf Course 1 1Number of Parks 37 37Park Acres 310 310Nature Areas 4 4
Parking Lots (Central Business District):Parking Spaces On Streets 380 380Parking Spaces Off Streets 417 417
*Information obtained from various Departmental Reports
CITY OF WILLMAR, MINNESOTA
MISCELLANEOUS STATISTICAL FACTS