Embed Size (px)
Citation preview

Comprehensive Annual Financial Report
For Fiscal Year Ended June 30, 2004
City of Flagstaff, Arizona
Prepared By: Management Services Department
Finance and Budget Division
i
City of Flagstaff Comprehensive Annual Financial Report For the Fiscal Year Ended June 30, 2004
TABLE OF CONTENTS
Page INTRODUCTORY SECTION Letter of Transmittal .........................................................................................................................................iii GFOA Certificate of Achievement ...................................................................................................................... x Organizational Chart.........................................................................................................................................xi List of Elected and Appointed Officials .............................................................................................................xii FINANCIAL SECTION Independent Auditor’s Report ........................................................................................................................... 1 MANAGEMENT’S DISCUSSION AND ANALYSIS........................................................................................................... 3 BASIC FINANCIAL STATEMENTS Government-wide Financial Statements: Statement of Net Assets ..................................................................................................................... 15 Statement of Activities ....................................................................................................................... 16 Fund Financial Statements: Balance Sheet – Governmental Funds.................................................................................................. 18 Reconciliation of the Balance Sheet to the Statement of Net Assets - Governmental Activities............ 20 Statement of Revenues, Expenditures, and Changes in Fund Balances – Governmental Funds ............ 22 Reconciliation of the Statement of Revenues, Expenditures and Changes in Fund Balances of Governmental Funds to the Statement of Activities ....................................... 24 General Fund - Statement of Revenues, Expenditures, and Changes in Fund Balances – Budget and Actual .............................................................................................. 25 Highway User Fund - Statement of Revenues, Expenditures, and Changes in Fund Balances – Budget and Actual .............................................................................................. 26 Transportation Fund - Statement of Revenues, Expenditures, and Changes in Fund Balances – Budget and Actual .............................................................................................. 27 BBB Fund - Statement of Revenues, Expenditures, and Changes in Fund Balances – Budget and Actual .............................................................................................. 28 Statement of Net Assets – Proprietary Funds ...................................................................................... 30 Statement of Revenues, Expenses, and Changes in Fund Net Assets – Proprietary Funds............................................................................................ 32 Statement of Cash Flows – Proprietary Funds ..................................................................................... 34 Statement of Fiduciary Net Assets – Fiduciary Funds .......................................................................... 38 Statement of Changes in Fiduciary Net Assets – Fiduciary Funds ........................................................ 39 Notes to the Financial Statements............................................................................................................. 41 COMBINING STATEMENTS Non-Major Funds – Other Governmental Funds: Special Revenue Funds ....................................................................................................................... 77 Debt Service Funds............................................................................................................................. 77 Permanent Fund ................................................................................................................................. 77 Non-Major Funds – Proprietary Funds ...................................................................................................... 78

ii
Combining and Individual Fund Statements and Schedules: Combining Balance Sheet – Non-major Governmental Funds ............................................................. 80 Combining Statement of Revenues, Expenditures and Changes in Fund Balances – Non-major Governmental Funds ........................................................................ 82 Combining Statement of Net Assets – Non-major Proprietary Fund.................................................... 84 Combining Statement of Revenues, Expenses, and Changes in Fund Net Assets – Non-major Proprietary Fund ........................................................................... 85 Combining Statement of Cash Flows – Non-major Proprietary Fund................................................... 86 SUPPLEMENTAL INFORMATION Capital Assets Used in the Operations of Governmental Funds: Schedule By Function and Activity ...................................................................................................... 88 Schedule of Changes By Function and Activity .................................................................................... 90 Schedules of Revenues, Expenditures, and Changes in Fund Balances – Budget and Actual: Library Fund ................................................................................................................................ 91 Real Estate Proceeds Fund............................................................................................................ 92 Community Redevelopment Fund ................................................................................................ 93 Metropolitan Planning Organization Fund .................................................................................... 94 General Obligation Bond Fund ..................................................................................................... 95 Special Assessment Bond Fund .................................................................................................... 96 Secondary Property Tax Revenue Fund......................................................................................... 97 STATISTICAL SECTION Government-wide information: Government-wide Expenses by Function ................................................................................................ 100 Government-wide Revenues ................................................................................................................... 101 Fund information: General Governmental Expenditures by Function.................................................................................... 102 General Governmental Revenues by Source ............................................................................................ 103 Tax Revenues by Source ......................................................................................................................... 104 Property Tax Levies and Collections........................................................................................................ 105 Primary Assessed Value and Estimated Actual Value of Taxable Property................................................ 106 Property Tax Rates – Direct and Overlapping Governments..................................................................... 107 Principal Taxpayers ................................................................................................................................ 108 Special Assessment Collections .............................................................................................................. 109 Computation of Legal Debt Margin ......................................................................................................... 110 Percent of Net General Bonded Debt to Secondary Assessed Value and Net General Bonded Debt Per Capita.......................................................................................... 111 Ratio of Annual Debt Service Expenditures for General Bonded Debt to Total General Governmental Expenditures ........................................................................... 112 Computation of Direct and Overlapping Bonded Debt............................................................................. 113 Schedule of Water and Wastewater Revenue Bond Coverage ................................................................... 114 Demographic Statistics ........................................................................................................................... 115 Property Value, Construction, and Bank Deposits ................................................................................... 116 Miscellaneous Statistics .......................................................................................................................... 117 Intergovernmental Revenue by Source .................................................................................................... 119 Insurance Summary ................................................................................................................................ 120

211 West Aspen Avenue, Flagstaff, Arizona 86001 Main & TDD (928) 774-5281, Arizona Relay 7-1-1, Fax (928) 779-7696
City of Flagstaff
January 14, 2005 The Honorable Mayor, City Council And Citizens of the City of Flagstaff, Arizona I am pleased to submit the Comprehensive Annual Financial Report (CAFR) for the City of Flagstaff, Arizona (City) for the fiscal year ended June 30, 2004, as required by Article VI, Section 5 of the City Charter. The report was prepared by the City’s Finance Division in accordance with U.S. generally accepted accounting principles (GAAP) and audited in accordance with U.S. generally accepted auditing standards by a firm of licensed certified public accountants. This report consists of management’s representations concerning the finances of the City of Flagstaff. Consequently, management assumes full responsibility for the completeness and reliability of all of the information presented in this report. To provide a reasonable basis for making these representations, management of the City of Flagstaff has established a comprehensive internal control framework that is designed both to protect the government’s assets from loss, theft or misuse and to compile sufficient reliable information for the preparation of the City of Flagstaff’s financial statements in conformity with GAAP. Because the cost of internal controls should not outweigh their benefits, the City of Flagstaff’s comprehensive framework of internal controls has been designed to provide reasonable rather than absolute assurance that the financial statements will be free from material misstatement. As management, we assert that, to the best of our knowledge and belief, this financial report is complete and reliable in all material respects. Nordstrom & Associates, PC, a firm of licensed certified public accountants have audited the City of Flagstaff’s financial statements. The goal of the independent audit was to provide reasonable assurance that the financial statements of the City of Flagstaff for the fiscal year ended June 30, 2004, are free of material misstatement. The independent audit involved examining, on a test basis, evidence supporting the amounts and disclosures in the financial statements; assessing the accounting principles used and significant estimates made by management; and evaluating the overall financial statement presentation. The independent auditor concluded based upon the audit, that there was a reasonable basis for rendering an unqualified opinion that the City of Flagstaff’s financial statements for the fiscal year ended June 30, 2004, are fairly presented in conformity with GAAP. The independent auditor’s report is presented as the first component of the financial section of this report. The independent audit of the financial statements of the City of Flagstaff was part of a broader, federally mandated “Single Audit” designed to meet the special needs of federal grantor agencies. The standards governing Single Audit engagements require the independent auditor to report not only on the fair presentation of the financial statements, but also on the audited government’s internal controls and compliance with legal requirements, with special emphasis on internal controls and legal requirements involving the administration of federal awards. These reports are available in the City of Flagstaff’s separately issued Single Audit Report.

iv
GAAP require that management provide a narrative introduction, overview, and analysis to accompany the basic financial statements in the form of Management’s Discussion and Analysis (MD&A). This letter of transmittal is designed to complement MD&A and should be read in conjunction with it. The City of Flagstaff’s MD&A can be found immediately following the report of the independent auditors. CITY OF FLAGSTAFF PROFILE Flagstaff is located in Coconino County, Arizona at the intersection of Interstate 17 and Interstate 40. Flagstaff is the largest city in Northern Arizona and is the regional center and county seat for Coconino County, the second largest county in the 48 contiguous states. The current population as of the 2003 census is approximately 61,030. The City of Flagstaff became a town in 1894, incorporated as a city in 1928 and its boundaries currently encompass an area of just over 64 square miles. Flagstaff is nestled at the base of the San Francisco Peaks and is surrounded by one of the largest ponderosa pine forests on earth. Flagstaff drew its name from a very tall pine tree made into a flagpole in 1876 to celebrate our nations centennial. At nearly 7,000 feet, Flagstaff is one of the highest elevation cities in the United States. Flagstaff enjoys four distinct seasons. Moderate summer temperatures average twenty degrees less than Phoenix, Arizona and are punctuated with afternoon rain showers in July and August. The winter brings an average snowfall of 99 inches, much to the enjoyment of skiers, ice skaters and snowboarders. As the snow thaws into spring, blooming wildflowers are abundant and fragrant along Flagstaff’s many hiking trails. Autumn is highlighted with the changing of the aspen leaves that transform the surrounding mountains into a golden tapestry of color. Flagstaff averages 283 days without precipitation each year, so it is not surprising that our residents love the great outdoors, and the mild climate encourages year-round outdoor activities. In 1855 Lieutenant Beale, in surveying a road from the Rio Grande in New Mexico to Fort Tejon in California, passed over the spot where Flagstaff now stands. While camping at the Eastern extremity of the present town, the lieutenant and his men cut the limbs from a straight pine tree in order to fly the United States flag. The town’s first recognized permanent resident, Thomas F. McMillan, arrived in 1876 and built a cabin at the base of Mars Hill. During the 1880’s Flagstaff began to grow, opening its first post office and welcoming the booming railroad industry. The town had timber, sheep and cattle and by 1886 Flagstaff was the biggest city on the main line between Albuquerque and the West Coast. In 1894 Dr. Percival Lowell chose Flagstaff, due to its great visibility, as the site for the now famous Lowell Observatory. Thirty-six years later, Pluto was discovered through the observatory’s telescopes. The Arizona Teacher’s College began in 1899, later becoming Northern Arizona University (1966). During the 1920’s, Route 66 was built and passed right through town making Flagstaff a popular tourist stop. Flagstaff was incorporated as a City in 1928. Today, Flagstaff is a community rich with cultural diversity, beauty and history, as well as amazing educational, recreational and scientific opportunities. The city is a year-round Mecca for visitors and many Arizonans maintain a second home here. Flagstaff operates under a council-manager form of government as provided by its Charter. The Mayor is elected at large on a non-partisan ballot for a two-year term and six City Council members are elected at large on a non-partisan ballot for a four-year term. The City Council appoints the City Manager, who has full responsibility for carrying out Council policies and administering City operations. The City manager, in turn, appoints City employees and department heads under service procedures specified by Charter. City service departments provide a full range of services including General Government, police and fire protection, Environmental Services, Transportation, Library, Parks and Recreation, Airport, Water and Sewer and Stormwater Services.
v
The annual budget serves as the foundation for Flagstaff’s financial planning and control. The City Council formally adopts the budget and legally allocates, or appropriates, available monies for all funds and entities related to the City. All of these funds and entities are included in the basic financial statements. The City Manager submits to the Council each spring a proposed budget for the fiscal year commencing the following July 1. The budget includes proposed expenditures and the means of financing them. Two public hearings are held prior to the budget’s final adoption in order to obtain taxpayer comments. The budget is legally enacted through the passage of an ordinance. The ordinance sets the limit for expenditures during the fiscal year. Additional expenditures may be authorized for unanticipated and/or inadequately budgeted events threatening the public health or safety as prescribed in the State Constitution, Article 9, Section 20. The City is subject to both legal and expenditure limitations as set out in the State Constitution. The City cannot adopt a budget that exceeds the expenditure limitation determined annually by the State of Arizona's Economic Estimates Commission. This limitation is based on 1979-80 actual expenditures, adjusted to reflect interim population and cost of living changes. Certain items are specifically exempted, including bond sale proceeds, debt service payments and other long-term obligations, interest earnings, a portion of Highway User Tax revenues, Federal and State grants, and monies received pursuant to intergovernmental agreements. On March 1, 1988, as provided by State statute, the voters of Flagstaff approved a permanent base adjustment of $1,900,000 to the 1979-80 base amount used in determining the annual expenditure limitation. The permanent increase was for the expenditure of the newly authorized Bed, Board and Booze Tax which was also approved in the March, 1988 election. FACTORS AFFECTING THE CITY’S FINANCIAL CONDITIONS The City’s employment base continues to be heavily government based. Although this provides stability to the economy during declines, it is subject to other factors. This last year the Arizona state retirement system increased employee mandated contributions which effectively reduced local disposable incomes for individuals working for the City, county, community college, flagstaff unified School district and to some extent Northern Arizona University. The City continues to see further development as a second home market to the Valley of the Sun. The City anticipates land development to slow as there are less residential lots available for construction and commercial land is at premium. However, despite these factors, at the time of this letter we see 4.6% growth in our retail sales and if we back out auto sales, that number climbs to 6.3%. The City recognizes the high cost of housing as a limiting factor in their ability to attract industrial business to the community, however the service industry has grown to keep up with the local demands. The City Council is looking at redevelopment opportunities and codes that encourage the conservation of precious resources, density awards in residential neighborhoods and traditional neighborhood designs. The Council recently adopted a Big box ordinance that will limit the size of these facilities and require parking garages versus surface parking. This ordinance has been referred by a group in town and will go to a vote of the community in May 2005. The Council goals have also provided for the expansion of the local Mall, which is a regional shopping center. With the Mall expansion would be the construction of an Auto mall. Construction is anticipated to begin this next year with completion planned for 2007. This project is a real boom to the local economy. It is a known fact that there is significant loss of sales tax revenues to the Valley for many retail items. This is exemplified when a new retailer such as Home Depot opened its first store in town and we experienced real retail growth of 35% in the building materials category. The City has taken steps to enhance existing employment with the USGS. The voters approved a bond to construct new facilities on the USGS campus in town as needed in the amount of $61.2 million. This will provide opportunity to meet the growing needs of the Survey. In addition the City is in the process of developing a Science

vi
park in the immediate vicinity to provide for private industry that may benefit from transfer technology from USGS activities. As we move forward we cannot ignore our biggest economic driver in the community, tourism. The City prepared a request for proposals to construct a conference center hotel and adjacent retail, office and residential development in the downtown area. The City cannot currently accommodate the demand for a conference center with existing facilities in town. The initial feasibility report indicates that the proposed facility in the downtown area would be successful. Financing hotels is a tentative proposal in today’s markets, with the downturn many saw as a result of September 11th. The current proposal team is conducting additional research and financial analysis on the project in its entirety. The community looks forward to moving this project forward. LONG-TERM FINANCIAL PLANNING The City’s responsiveness to emerging economic challenges and its careful long-range planning have been key factors in Flagstaff’s fiscal health. STRATEGIC FINANCIAL PLAN Flagstaff’s financial plan requires many elements working in concert with one another. Some of these financial plan elements are financial resource planning, multi-year budget planning, strategic capital improvement project planning and debt management, all of which are further identified below. Currently, due to the tenuous economic recovery, Flagstaff’s financial forecast includes very modest revenue growth, potential for State reductions of revenue sharing, and continued increases in demand for city services such as police, fire, transportation and social services. Financial services management role will be to maintain and enhance the continued financial stability for the City of Flagstaff. Financial Resource Planning – Strategic financial planning begins with determining the City’s fiscal capacity based upon long-term financial forecasts of recurring available revenues. Financial forecasts coupled with financial trend analysis help preserve the fiscal well being of Flagstaff. Strategic financial capacity planning is a critical element to reach long-term financial stability goals and to determine special financial needs for critical objectives of the City Council. Multi-Year Budget Planning – Multi-year budget planning encompasses long-range operating expenditure plans (including the operating impacts of capital projects), which are linked to the community expectations and broad goals of the City Council. The multi-year approach provides a better opportunity for staff to change its financial paradigm from what do we need this year to how do we accomplish our service objectives over-time, given our financial capacity. While the City is required to adopt an annual budget to meet State statutory requirements, Flagstaff builds a financial plan for the next five years to help anticipate future impacts and ensure achievement of City objectives. Strategic Capital Improvement Project Planning – Flagstaff Capital Improvement Projects are planned for five or more years and analyzed using City specific prioritization criteria. The operating cost impacts of projects are also planned and considered developing future operating budget plans. Projects with significant operating impacts are carefully timed to avoid contingent liabilities, which future operating resources cannot meet. Pay-as-you-go funding sources are also conservatively estimated to avoid over-committing to capital construction using revenues that are not certain. To the extent debt financing is used and/or required capital project plans are sized to conform to existing debt management policies. Debt Management – Flagstaff has a financial policy that prohibits the issuance of debt for operating expenses. All debt issuances by the City; therefore, are used for financing capital infrastructure or long-lived costly assets. Each debt issuance is evaluated against multiple financial policies, including debt service as a percent of operating expenditures, tax and revenue bases for the repayment of debt, the overall debt burden on the community,
vii
statutory limitations, and market factors affecting tax-exempt interest costs. For each debt issuance, a long-term analysis is performed of the financial (debt) capacity that fits the ability and willingness of the community to pay for the capital projects. Every additional $1 million in new debt costs approximately $100,000 in annual debt service operating expenses when amortized over 20 years. Sizing of the City’s Capital Improvement Plan based on debt capacity, in conjunction with conservatively estimated pay-as-you-go revenues, will help stabilize per capita debt and lower annual debt service costs to the City over the long-term. CASH MANAGEMENT POLICIES AND PRACTICES The City’s investment policy is to invest all temporarily idle cash in investments authorized by City resolution or State statute at the highest available interest rate while emphasizing safety of principal and liquidity. Excess funds were invested in the State Treasurer’s Local Government Investment Pool (LGIP) and in obligations of the U.S. Treasury and its agencies, demand deposits and repurchase agreements. RISK MANAGEMENT The City maintains a self-insurance program for liability claims, unemployment compensation, health and workers’ compensation. In addition, the City’s Risk Management division employs various risk control techniques, such as employee accident prevention training and inspection of City property and facilities, to minimize accident-related losses. MAJOR INITIATIVES AND SERVICE EFFORTS AND ACCOMPLISHMENTS During FY 2003-2004, Flagstaff continued work to maintain basic services while also fulfilling the City Council goals. These goals provide for strategies that move the community closer to economic viability and sustainable community objectives. The outcomes of these strategies have been many and in certain cases require sustained efforts over a period of time. The following are the some of the goals of the Council and the City’s’ accomplishments in FY2003-2004. Economic Development/Redevelopment The City continues to coordinate closely on economic development activities with the Greater Flagstaff Economic Council (GFEC). An additional 64-fulltime jobs at or above the county median wages were created in addition to 183,000 square feet being added to existing industry with a capital investment value of $11 million. Tourism continues as a mainstay industry in the community. Efforts included a publicity campaign to better inform tourist of conditions during fire and snow seasons and correct winter driving conditions through the “Clear the Road to Flagstaff” campaign. The industry saw a 5.2% increase in revenues. On the redevelopment front, many projects are in progress. Between inception and implementation redevelopment is a lengthy process. The Flagstaff Mall expansion received rezoning approval; this is a joint project that includes the establishment and reallocation of numerous auto dealers in the community. The City continues negotiations to partner with a private developer to establish a conference hotel and new retail/residential center in the eastern portion of the downtown. An RFP process was established to create a concept for redevelopment of the city’s Southside area. This project becomes feasible in the next several years as a result of the construction of the Rio de Flag flood control project in concert with the Army Corp of Engineers. Fiscal Health The City was successful in adopting and publishing their five-year capital improvement plan. The City presented to the voters over $155.1 million in new capital projects to be bond funded and received overwhelming approval. The projects include the relocation for four fire stations for better coverage, construction of a new fire training center and fire tower, a new aquatic facility, land for new parks, a renovated or new multi generational recreation facility, water rights acquisition, additional water wells, renovation of the City wildcat wastewater treatment plant, and expansion of the USGS campus.
viii
Public Safety The City Council recognizes that the role of public safety encompasses a broad array of interrelated activities. Public order and quality of life issues must be addressed on a broad front through a partnership of shared responsibility and trust between Police, Fire, other city departments, civic organizations and the community. Community safety and well-being must be built from within each neighborhood and cannot be imposed from the outside. The City conducted numerous community activities that strengthen neighborhoods. These included 120 block watch meetings by the police, two citizen police academies, and DARE and GREAT prevention programs in the public schools. Activities also include our partners. The City funds an after school program at various school district sites and works with United Way, whom supports numerous agencies in the community. Affordable Housing The goals are manifold to address affordable housing in a community with such a severe deficiency. The programs are many and diverse. The City assisted 38 low and middle income first time homebuyers, provided eviction/foreclosure prevention assistance to 80 households, provided adult day care to 120 individuals and caregivers, completed 8 owner occupied housing rehabilitation projects, and in conjunction with our partners, completed four affordable owner occupied homes. The biggest impact has been the sale of two city parcels for the development of a mixed use development with a 20% affordable factor in the units, some rentals and others owner occupied. Staff has completed training on development of a Land Trust and is awaiting technical assistance from HUD to implement this program locally. Capital Improvements Programmed capital infrastructure expenditures facilitate planned growth, economic development and protects existing community investments. Allocating resources through a coordinated planning and engineering process, with high levels of public involvement, assures our community is shaped in alliance with citizen support. The capital program worked on numerous projects through the year and continues to refine the process. Elements that were implemented included a schedule based work program, comprehensive 5-year CIP program, team chartering, project review process, and monthly financial reporting. Customer Service A positive customer service culture will enhance the delivery of service both externally and internally. Training was provided on customer service to all employees. Job description and employee evaluations were changed to incorporate customer service as a key element of job duties. Planning for Growth With a finite supply of land, we have to provide for the region’s growth in a manner that balances growth and conservation. Collaboration Strengthen the community by strengthening partnerships with sovereign nations, public, non-profit and private agencies and developing collaborative goals at all levels. The City continues its role with the alliance group that is comprised of Coconino County, Northern Arizona University, Coconino Community College, and the Flagstaff Unified School District. The alliance group sponsored a statement this year to the state legislature supporting the funding of education as a primary goal to the success of the community and the vitality of economic development. Quality of Life Consideration is given to quality of life preservation and enhancement in all City actions and appropriations. This is a diverse objective with many outcomes. The City was successful in securing voter authority to purchase $15 million in water rights to secure the community water needs. Recycling continues to grow increasing the tonnage at the materials recycling facility by 20%. The city also was successful in receiving authorization to issue $7.6
ix
million in bond financing for FUTS trail and open space land acquisition and $14.7 million for a multi generational facility and aquatic center. Organizational Support The City is preparing a succession plan, as we will experience significant turnover in the next five years due to retirements. The program will align skills assessment today and those needed for the future in a program to offer training to individuals in the City. The City continues its policy with regard to benefits and wages to maintain itself as a top-paying employer in the community. AWARDS AND ACKNOWLEGEMENTS The Government Finance Officers Association of the United States and Canada (GFOA) awarded a Certificate of Achievement for Excellence in Financial Reporting to the City of Flagstaff for its comprehensive annual financial report for the fiscal year ended June 30, 2003. This was the 10th consecutive year that the City has achieved this prestigious award. In order to be awarded a Certificate of Achievement, a governmental unit must publish an easily readable and efficiently organized comprehensive annual financial report. This report must satisfy both generally accepted accounting principles and applicable legal requirements. A Certificate of Achievement is valid for a period of one year only. We believe that our current comprehensive annual financial report continues to meet the Certificate of Achievement Program’s requirements and we are submitting it to GFOA to determine its eligibility. The City also received the GFOA’s award for Distinguished Budget Presentation for our 2003-2004 annual budget. In order to qualify for the Distinguished Budget Presentation award, the City’s budget document was judged to be proficient as a Policy Document, a Financial Plan, an Operation Guide, and as a Communication Device. Acknowledgments. A special word of appreciation is due to Barbara Goodrich, Finance Budget Manager and to the entire Accounting staff who prepared this CAFR. As an organization we would be remiss to not also personally recognize Maryellen Pugh, CPA for her tireless efforts in directing the statement drafting and coordination. Acknowledgment should also be made for the interest and support received from members of the Mayor and Council, the office of the City Manager, and the willing cooperation of the other operating and staff departments of the City. The cooperative assistance of our independent auditor, Nordstrom and Associates, also contributed significantly to this report.
x

xi

City of Flagstaff, Arizona List of Elected and Appointed Officials
June 30, 2004
Elected Officials Mayor Joseph C. Donaldson Vice Mayor Al White Councilmember Art Babbott Councilmember Karen K. Cooper Councilmember Joseph P. Haughey Councilmember Kara M. Kelty Councilmember Libby Silva
Appointed Officials City Manager David W. Wilcox City Attorney Harry Lane (acting) City Treasurer Mary Jo Jenkins City Clerk Margie Brown
xii
Bruce J . Nords t rom, CPA
Godfrey C. Loper , J r . , CPA
Marjor ie T . McClanahan, CPA
Timothy D. Hansen , CPA
CERTIFIED PUBLIC ACCOUNTANTS
ME M B E R S
Amer ican Ins t i tu te ofCer t i f ied Publ ic Accountant s
Ar izona Socie ty of Cer t i f ied Publ ic Accountant s
150 West Dale Avenue Suite 2 • Flagstaff • AZ 86001 MAIL TO Po Box 220 • Flagstaff • AZ 86002 TELEPHONE 928.774.5086 FAX 928.774.7908 EMAIL [email protected]
INDEPENDENT AUDITOR'S REPORT Honorable Mayor and Members of the City Council City of Flagstaff, Arizona
We have audited the accompanying financial statements of the governmental activities, business-type activities, discretely presented component unit, each major fund, and aggregate remaining fund information of City of Flagstaff, Arizona (the City), as of and for the year ended June 30, 2004, as listed in the table of contents, which collectively comprise the City’s basic financial statements. These financial statements are the responsibility of the City's management. Our responsibility is to express an opinion on these financial statements based on our audit.
We conducted our audit in accordance with auditing standards generally accepted in the United States of America and the standards applicable to financial audits contained in Government Auditing Standards, issued by the Comptroller General of the United States. Those standards require that we plan and perform the audit to obtain reasonable assurance about whether the financial statements are free of material misstatement. An audit includes examining, on a test basis, evidence supporting the amounts and disclosures in the financial statements. An audit also includes assessing the accounting principles used and significant estimates made by management, as well as evaluating the overall financial statement presentation. We believe that our audit and the report of the other auditors provide a reasonable basis for our opinion.
In our opinion, based on our audit, the financial statements referred to above present fairly, in all material respects, the respective financial position of the governmental activities, business-type activities, discretely presented component unit, each major fund, and aggregate remaining fund information of City of Flagstaff, Arizona, as of June 30, 2004, and the respective changes in financial position and cash flows, where applicable, thereof, and the budgetary comparison for the general, highway user, transportation and BBB funds for the year then ended in conformity with accounting principles generally accepted in the United States of America.

The management’s discussion and analysis on pages 3 through 14 is not a required part of the basic financial statements but is supplementary information required by the Governmental Accounting Standards Board. We have applied certain limited procedures, which consisted principally of inquiries of management regarding the methods of measurement and presentation of the required supplementary information. However, we did not audit the information and express no opinion on it.
Our audit was conducted for the purpose of forming opinions on the financial
statements that collectively comprise the City’s basic financial statements. The introductory section, combining and individual fund statements and schedules, capital assets schedules and statistical section listed in the table of contents are presented for purposes of additional analysis and are not a required part of the basic financial statements. The combining and individual fund statements and schedules, and capital assets schedules have been subjected to the auditing procedures applied in the audit of the basic financial statements and, in our opinion, are fairly stated in all material respects in relation to the basic financial statements taken as a whole. The introductory and statistical sections listed in the table of contents have not been subjected to the auditing procedures applied in our audit of the basic financial statements and, accordingly, we express no opinion on them. In accordance with Government Auditing Standards we have issued our report dated October 18, 2004 on our consideration of the City's internal control over financial reporting and our tests of its compliance with certain provisions of laws, regulations, contracts and grant agreements and of other matters. The purpose of that report is to describe the scope of our testing of internal control over financial reporting and compliance and the results of that testing, and not to provide an opinion on the internal control over financial reporting or on compliance. That report is an integral part of an audit performed in accordance with Government Auditing Standards and should be considered in assessing the results of our audit. Flagstaff, Arizona October 18, 2004
2

3
MANAGEMENT DISCUSSION AND ANALYSIS As management of the City of Flagstaff (the City), we offer readers of the City’s financials statements this narrative overview and analysis of the financial activities of the City for the fiscal year ended June 30, 2004. We encourage readers to consider the information presented here in conjunction with additional information that we have furnished in our letter of transmittal, which can be found on pages iii -ix of this report. FINANCIAL HIGHLIGHTS The assets of the City exceeded its liabilities at the close of the most recent fiscal year by $324.6 million (net
assets). Of this amount $57.6 million (unrestricted net assets) may be used to meet the government’s ongoing obligations to citizens and creditors.
The government’s total net assets increased by $25.8 million during the fiscal year. This increase is primarily related to capital improvement activity, including the 4th Street Overpass project ($11.3 million), Sunnyside improvements ($1.0 million), and contributions from private development ($7.7 million).
As of June 30, 2004, the City’s governmental funds reported combined ending fund balances of $62.3 million, an increase of $17.5 million in comparison with the prior fiscal year. Approximately 97% of this total amount ($60.4 million) is unreserved fund balance available for spending at the government’s discretion.
As of June 30, 2004, total unreserved fund balance for the general fund was $22.9 million, or 64.5% of total general fund expenditures ($35.5 million)
As of June 30, 2004, the City’s proprietary funds reported combined total net assets of $214.4 million, and total unrestricted net assets of $24.3 million. $20.9 million of the unrestricted net assets are in the Water and Wastewater Fund.
The City’s governmental activity long-term liabilities increased by $19.0 million (42.2%) during the current fiscal year. The primary factor in this increase was the $25 million issuance for the 4th Street Overpass bonds.
OVERVIEW OF THE FINANCIAL STATEMENTS This discussion and analysis is intended to serve as an introduction to the City’s basic financial statements. The City’s basic financial statements comprise three components: (1) Government-wide financial statements, (2) Fund financial statements, and (3) Notes to the financial statements. This report also contains other supplementary information in addition to the basic financial statements themselves. Government-wide Financial Statements The government-wide financial statements are designed to provide readers with a broad overview of the City’s finances, in a manner similar to a private-sector business. The statement of net assets presents information on all of the City’s assets and liabilities, with the difference between the two reported as net assets. Over time, increases or decreases in net assets may serve as a useful indicator of whether the financial position of the City is improving or deteriorating. The statement of activities presents information showing how the City’s net assets changed during the most recent fiscal year. All changes in net assets are reported as soon as the underlying event giving rise to the change occurs, regardless of the timing of related cash flows. Thus, revenues and expenses are reported in this statement for some items that will only result in cash flows in future fiscal periods such as revenues pertaining to uncollected taxes and earned but unused vacation leave.

4
Both of the government-wide financial statements distinguish functions of the City that are principally supported by taxes and intergovernmental revenues (government activities) from other functions that are intended to recover all or a significant portion of their costs through user fees and charges (business-type activities). The governmental activities of the City include Police, Fire, Community Development, Parks and Recreation, City Council, City Manager, City Attorney, Municipal Courts, Human Resources, Risk Management, Information Services, Library, and Economic Development. The business-type activities of the City include Water and Wastewater, Airport, Environmental Services, and Stormwater operations. The government-wide financial statements include not only the City itself (known as the primary government), but also a legally separate entity for which the City is financially accountable. Financial information for this component unit, the Greater Flagstaff Economic Council (GFEC) is reported separately from the financial information presented for the primary government itself. The Municipal Property Corporation, although also legally separate, functions for all practical purposes as a department of the City, and therefore has been included as an integral part of the primary government as a blended component unit. The government-wide financial statements can be found on pages 15-17 of this report. Fund financial statements The fund financial statements are designed to report information about groupings of related accounts that are used to maintain control over resources that have been segregated for specific activities or objectives. The City, like other state and local governments uses fund accounting to ensure and demonstrate compliance with finance-related legal requirements. All of the funds of the City can be divided into three categories: governmental funds, proprietary funds, and fiduciary funds.
Governmental funds: Governmental funds are used to account for essentially the same functions reported as governmental activities in the government-wide financial statements. However, unlike the government-wide financial statements, governmental funds financial statements focus on near-term inflows and outflows of spendable resources, as well as on balances of spendable resources available at the end of the fiscal year. Such information may be useful in evaluating a government’s near-term financing requirements. Because the focus of governmental funds is narrower than that of the government-wide financial statements, it is useful to compare the information presented for governmental funds with similar information presented for governmental activities in the government-wide financial statements. By doing so, readers may better understand the long-term impact of the government’s near-term financing decisions. Both the governmental fund balance sheet and the governmental fund statement of revenues, expenditures, and changes in fund balances provide a reconciliation to facilitate this comparison between governmental funds and governmental activities. The City maintains several individual government funds organized according to their type (special revenue and debt service). Information is presented separately in the governmental fund balance sheet and in the governmental fund statement of revenues, expenditures, and changes in fund balances for the General fund, Highway User Revenue fund, Transportation fund, and the BBB fund which are all considered to be major funds. Data from the remaining governmental funds are combined into a single aggregated presentation. Individual fund data for each of these non-major governmental funds is provided in the form of combining statements elsewhere in this report.
5
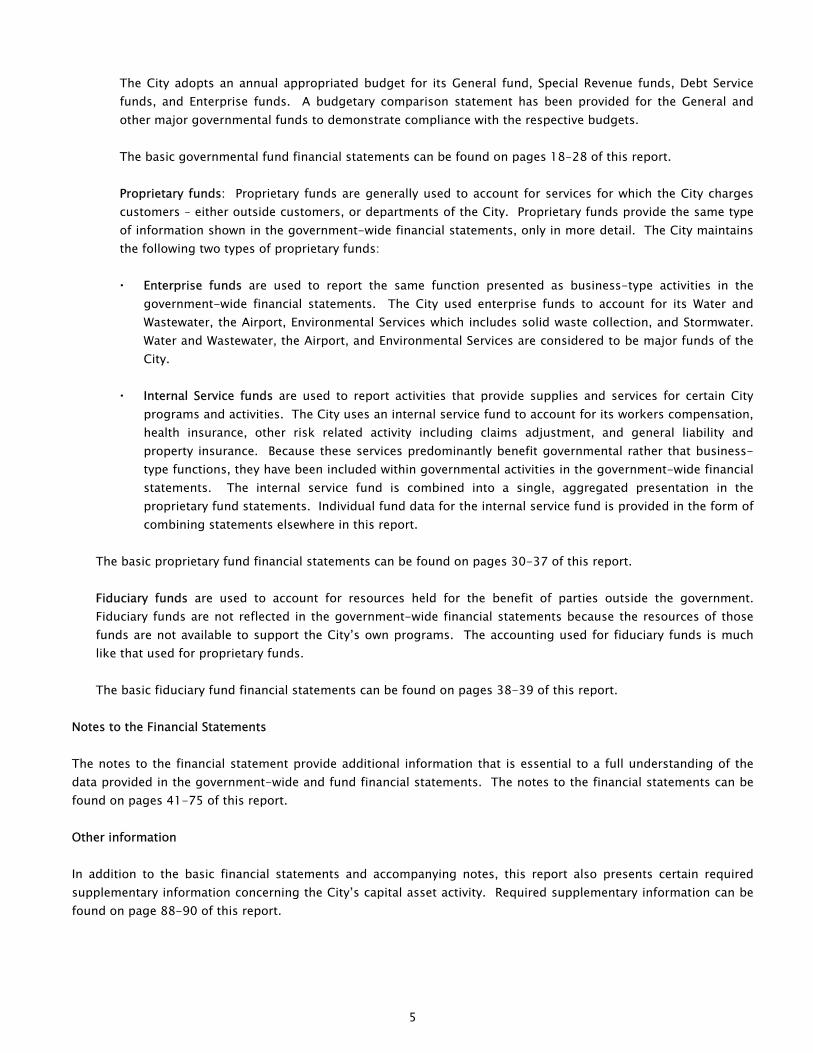
The City adopts an annual appropriated budget for its General fund, Special Revenue funds, Debt Service funds, and Enterprise funds. A budgetary comparison statement has been provided for the General and other major governmental funds to demonstrate compliance with the respective budgets. The basic governmental fund financial statements can be found on pages 18-28 of this report. Proprietary funds: Proprietary funds are generally used to account for services for which the City charges customers – either outside customers, or departments of the City. Proprietary funds provide the same type of information shown in the government-wide financial statements, only in more detail. The City maintains the following two types of proprietary funds: Enterprise funds are used to report the same function presented as business-type activities in the
government-wide financial statements. The City used enterprise funds to account for its Water and Wastewater, the Airport, Environmental Services which includes solid waste collection, and Stormwater. Water and Wastewater, the Airport, and Environmental Services are considered to be major funds of the City.
Internal Service funds are used to report activities that provide supplies and services for certain City
programs and activities. The City uses an internal service fund to account for its workers compensation, health insurance, other risk related activity including claims adjustment, and general liability and property insurance. Because these services predominantly benefit governmental rather that business-type functions, they have been included within governmental activities in the government-wide financial statements. The internal service fund is combined into a single, aggregated presentation in the proprietary fund statements. Individual fund data for the internal service fund is provided in the form of combining statements elsewhere in this report.
The basic proprietary fund financial statements can be found on pages 30-37 of this report.
Fiduciary funds are used to account for resources held for the benefit of parties outside the government. Fiduciary funds are not reflected in the government-wide financial statements because the resources of those funds are not available to support the City’s own programs. The accounting used for fiduciary funds is much like that used for proprietary funds.
The basic fiduciary fund financial statements can be found on pages 38-39 of this report.
Notes to the Financial Statements The notes to the financial statement provide additional information that is essential to a full understanding of the data provided in the government-wide and fund financial statements. The notes to the financial statements can be found on pages 41-75 of this report. Other information In addition to the basic financial statements and accompanying notes, this report also presents certain required supplementary information concerning the City’s capital asset activity. Required supplementary information can be found on page 88-90 of this report.

6
Combining statements The combining statements referred to earlier in connection with non-major governmental funds and the non-major proprietary fund are presented immediately following the notes to the financial statements. GOVERNMENT WIDE STATEMENTS FINANCIAL ANALYSIS Analysis of Net Assets As noted earlier, net assets may serve as a useful indicator or a government’s financial position. For the City, assets exceeded liabilities by $324.6 million as of June 30, 2004. Of the City’s net assets, 69.8% reflects its investment of $226.5 million in capital assets (e.g. land, buildings, and equipment), less any outstanding debt used to acquire those assets. The City uses these capital assets to provide services to citizens; consequently, these assets are not available for future spending. Although the City’s investment in its capital assets is reported net of related debt, it should be noted that the resources needed to repay this debt must be provided from other sources, since the capital assets themselves cannot be liquidated for these liabilities.
Net AssetsJune 30, 2004 and 2003 (in thousands of dollars)
Governmental Activities Business-type Activities Total
20042003
(as restated) 20042003
(as restated) 20042003
(as restated)
Current and other assets 82,122$ 61,865$ 43,032$ 43,370$ 125,154$ 105,235$ Capital assets 93,420 73,209 215,398 206,668 308,818 279,877 Total assets 175,542 135,074 258,430 250,038 433,972 385,112
Long-term liabilities 50,601 29,767 33,541 36,258 84,142 66,025 Other liabilities 14,436 10,775 10,772 9,509 25,208 20,284 Total liabilities 65,037 40,542 44,313 45,767 109,350 86,309
Invested in capital assets, net of related debt 41,667 45,411 184,864 173,369 226,531 218,780 Restricted 35,343 14,778 5,161 5,014 40,504 19,792 Unrestricted 33,495 34,343 24,092 25,888 57,587 60,231 Total net assets 110,505$ 94,532$ 214,117$ 204,271$ 324,622$ 298,803$
An additional portion of the City’s net assets, $40.5 million (12.5%) represents resources that are subject to external restriction on how they may be used. The remaining balance of unrestricted net assets, $57.6 million (17.7%) may be used to meet the government’s ongoing obligations to citizens and creditors. At the end of the current fiscal year, the City is able to report positive balances in all three categories of net assets for the government as a whole, as well as for the business-type activities with the exception of the Airport fund which ended the year with negative unrestricted net assets of $195,568. Current assets increased in governmental activities by 32.7% ($20.3 million) primarily due to the unspent cash proceeds related to the bonded debt issuance for the 4th Street Project. Approximately $14.4 million of the $25 bond issuance was restricted at fiscal year end for this project. In addition, capital projects increased by 27.6% ($20.2 million) also due to the 4th Street project and other contributed infrastructure from the private sector ($11.3

7
million and $4.3 million, respectively). The 70% increase ($20.8 million) in long-term liabilities is also due to the 4th Street bonded debt of $25 million. Overall business-type net assets increased by 4.8% ($9.8 million) also due primarily to capital asset additions including the Sunnyside project and a number of contributions from private development for infrastructure. Analysis of Change in Net Assets The City’s net assets increased by $25.8 million during the current fiscal year. These increases are explained in the government and business-type activities discussion to follow.
Changes in Net AssetsFor the Years Ended June 30, 2004 and 2003 (in thousands of dollars)
Governmental Activities Business-type Activities Total
20042003
(as restated) 20042003
(as restated) 20042003
(as restated)
RevenuesProgram Revenues: Charges for services 5,424$ 7,407$ 26,372$ 25,143$ 31,796$ 32,550$ Operating grants and contributions 2,679 3,429 287 382 2,966 3,811 Capital grants and contributions 11,757 9,646 10,483 9,461 22,240 19,107 General Revenues: Property taxes 7,932 8,010 - - 7,932 8,010 Sales taxes 25,683 23,971 - - 25,683 23,971 State shared taxes 12,123 12,073 - - 12,123 12,073 Unrestricted investment earnings 811 383 719 107 1,530 490 Other 1,773 952 17 24 1,790 976 Total revenues 68,182 65,871 37,878 35,117 106,060 100,988
Expenses General government 5,892 4,841 - - 5,892 4,841 Public safety 18,793 18,270 - - 18,793 18,270 Public works 1,178 1,169 - - 1,178 1,169 Economic and physical development 6,473 7,272 - - 6,473 7,272 Culture and recreation 8,694 8,468 - - 8,694 8,468 Highways and streets 8,887 6,185 - - 8,887 6,185 Interest on long-term debt 1,923 1,380 - - 1,923 1,380 Water and wastewater - - 17,250 16,142 17,250 16,142 Environmental - - 7,320 2,527 7,320 2,527 Airport - - 3,370 3,411 3,370 3,411 Stormwater - - 461 - 461 - Total expenses 51,840 47,585 28,401 22,080 80,241 69,665 Increase in net assets before transfers 16,342 18,286 9,477 13,037 25,819 31,323 Transfers (369) (476) 369 476 - - Change in net assets 15,973 17,810 9,846 13,513 25,819 31,323 Net assets at beginning of year 94,532 76,722 204,271 190,758 298,803 267,480 Net assets at end of year 110,505$ 94,532$ 214,117$ 204,271$ 324,622$ 298,803$
Governmental activities. Governmental activities increased the City’s net assets by $16.0 million, accounting for 61.9% of the total growth in the net assets of the City. The key factors for this increase are as follows: Sales tax revenues continued to increase at both the local and state level. State sales tax levels decreased
significantly in the post-9/11 environment and are returning to their normal levels. City sales tax has

8
maintained a constant level of growth and BBB taxes are returning to normalized levels with the return of previously realized tourism levels.
A loss of a total of $1.5 million in the State’s Local Government Investment Pool (LGIP) was recognized in
FY2003. The comparative increase in FY 2004 is more a result of interest earnings normalizing. A recoupment of this investment loss of $107,385 was recognized in FY 2004 and additional recoupment is not anticipated at this time.
In addition several large capital projects had to carryover budgeted balances due to the timing of the progress in
those projects including the Rio de Flag Flood Control Project ($3.3 million), the East Flagstaff Gateway ($8.4 million), and Redevelopment ($2.1 million).
Business-type activities Business type activity had net asset growth of $9.8 million. This is due to capital contributions received primarily in the water and wastewater fund. Also, a new fund, Stormwater, was initiated on July 1, 2003, with year-end net assets of $555,284.
Expenses and Program Revenues – Governmental Activities
$0
$5,000,000
$10,000,000
$15,000,000
$20,000,000
Generalgovernment
Public safety Public works Econ & physdevelopment
Culture &recreat ion
Highways &streets
Interest onlong-term debt
Expenses
Program Revenues

9
Revenues by Source – Governmental Activities
Investment earnings
0.3%
Charges for services
8.0%
Operating grants and contributions
3.9%
Miscellaneous3.5%
State shared tax17.8%
Capital grants and contributions
17.2%Property taxes
11.6%
Sales tax37.7%
These previous two charts illustrate the City's governmental expenses and revenues by function and its revenues by source. As shown, Public safety is the largest function in expense (36.3%), followed by Highways & streets (17.1%), Culture and recreation (16.8%), and Economic and physical development (12.5%). General revenues such as sales taxes, state shared taxes, and property taxes are not shown by program, but are effectively used to support program activities citywide. For governmental activities overall, without regard to program, sales taxes are the largest single source of funds (37.7%), followed by state shared taxes (17.8%), and capital grants and contributions (17.2%). For the most part, increases in expenses paralleled inflation and growth in the demand for services. However, exceptions did occur in both General government and Highways and streets that grew 21.7% and 43.7% respectively. The expenditure growth in General government occurred primarily due to ongoing downtown redevelopment efforts as facility purchases continued in designated areas. In addition, large insurance increases continued, particularly for liability insurance. The Highway and street expenditure increase is directly attributable to the 4th Street project.
Expenses and Program Revenues – Business Type Activities
-
5,000,000
10,000,000
15,000,000
20,000,000
25,000,000
30,000,000
Water andwastewater
Environmental Airport Stormwater
Expenses Program Revenues

10
Revenues by Source – Business-type activities
Charges for services
69.6%
Operating grants and contributions
0.8%
Capital grants and contributions
27.7%
Investment earnings
1.9%
Other0.0%
As shown in the previous chart, Water and Wastewater has expenses of $17.2 million for the fiscal year, followed by Environmental Services with $7.3 million, the Airport with $3.4 million and Stormwater with $0.5 million. For the fiscal year, revenues exceeded expense in Water and Wastewater, Environmental Services, and Stormwater. The Airport had expenses exceed revenues due to current year depreciation expense ($1.8 million). The Water and Wastewater, Environmental Services and Stormwater funds received the majority of their program revenues through charges for services (63.6%, 100% and 65.2%, respectively. The Airport receives 50.4% of support through charges for service and the other 49.6% through capital grants and contributions. Charges for services provided the largest share of revenues (71.0%) for all of the business-type activities, followed by capital grants and contributions (28.2%). Water and Wastewater expenses increased by 6.9% ($1.1 million) in comparison with FY 2003. This increase is contractual services, materials, and supplies and relate primarily to ongoing well maintenance. The Water and Wastewater fund also realized a 20.3% revenue increase which is attributable to the infrastructure contributions made by the private sector and previously referenced in this overview. Financial Analysis of the City’s Funds As noted earlier, the City uses fund accounting to ensure and demonstrate compliance with finance-related legal requirements. Governmental Funds The focus of the City’s governmental funds is to provide information on near-term inflows, outflows, and balances of resources that are available for spending. Such information is useful in assessing the City’s financing requirements. In particular, unreserved fund balance may serve as a useful measure of a government’s net resources available for spending at the end of the fiscal year. Types of Governmental funds reported by the City include the General fund, Special Revenue funds, and Debt Service funds.

11
At the end of the current fiscal year, the City’s governmental funds reported combined ending fund balances of $62.3 million, an increase of $17.5 million in comparison with the prior year. The Transportation fund accounts for 88.3% ($15.4 million) of this increase, which is primarily the unspent bond proceeds of the 4th Street project which equaled $14.4 million at June 30, 2004. Approximately $60.4 million of the total ending fund balance constitutes unreserved fund balance, which is available for spending at the City’s discretion. The remainder of fund balance is reserved to indicate that is it not available for new spending because it has already been committed (1) to pay debt service ($1,650,520), (2) for inventory reserve ($220,779), and perpetual care ($27,107). Revenues for governmental functions overall totaled $63.9 million in the fiscal year ended June 30, 2004 which represents an decrease of 1.0% or $481,992 from the fiscal year ended June 30, 2003. While the total dollars are relatively equal, variances existed within categories. Sales taxes (including the general sales tax, the transportation tax, and the BBB tax) increased by 7.0% ($2.2 million) due to a combination of economic growth and a rebound in tourist trade. This growth was offset by a 16.3% ($2.1 million) decrease in grants and entitlements. Highway User Revenue funds were reduced due to a change in the allocation methodology used by the State of Arizona (net decrease of funds of approximately $500,000). Additionally, one-time funds of $850,000 were received in FY 2003 for a one-time exchange transaction. Expenditures for governmental functions, totaling $72.7 million, increased by 9.7% ($6.4 million) from the fiscal year ended June 30, 2003. In the fiscal year ended June 30, 2004 expenditures for governmental functions exceeded revenues by approximately $8.9 million. Overall debt service (principal and interest) grew by 39.2% ($2.0 million) due primarily to the payments on the 4th Street bond. The General Fund is the chief operating fund of the City. At the end of the current fiscal year, the unreserved fund balance of the General Fund was $22.9 million. As a measure of liquidity, it may be useful to compare both total unreserved, undesignated fund balance and total fund balance to total fund expenditures. The unreserved, undesignated fund balance and total fund balance represent 64.5% and 65.1%, respectively, of general fund expenditures. The fund balance in the City’s General Fund increased by $1.2 million during the fiscal year mainly due to under expenditure (and resultant carryover into the FY 2005 budget year) of a number of capital projects including the Rio de Flag Flood control project and redevelopment efforts, $3.3 million and $2.1 million respectively. Overall, the General Fund’s performance resulted in revenues in excess of expenditures in the fiscal year ended June 30, 2004 of $1.0 million. This is a decrease of approximately $1.4 million over the comparable figure from the prior year of $2.4 million. The Highway User Revenue Fund decreased by $1.4 million during the fiscal year due to the ongoing completion of capital projects that represent a planned usage of fund balance for capital projects. The Transportation Fund increased by $15.4 million which has been documented previously as the restricted bond proceeds related to the 4th Street project. The BBB fund increased by $601,586 due to a number of capital projects that were budgeted, but not completed in FY 2004 including various Streetscape ($866,212), various FUTS ($1,342,308), and Recreation capital projects ($1,972,667). Proprietary funds The City’s proprietary funds provide the same type of information found in the government-wide financial statements, but in more detail. At the end of the fiscal year, the unrestricted net assets for the Water and Wastewater and Environmental Services were $20.9 million and $3.5 million, respectively. The Airport fund had a deficit balance of $195,568. The internal service fund, which is used to account for risk management and health insurance activities, had unrestricted net assets of $4.7 million.

12
The total growth in net assets for the proprietary funds was $9.9 million. Factors concerning the finances of these funds have been addressed previously in the discussion of the City’s business-type activities. Fiduciary funds The City maintains fiduciary funds for the assets of the Firemen’s Pension Trust Fund. As of June 30, 2004, the net assets had decreased by $2,516. Budget Highlights The City’s final budget differs from the original budget for certain divisions within the General fund even though the overall original budget remained the same. Council approved transfers from the contingency funds for the following divisions: General fund contingency transfer: $ 10,000 Sales Tax Audit Expenditure 10,000 Public Works - charge outs 60,000 Shop – decrease in shop charge outs $ 80,000 Capital Assets and Debt Administration Capital Assets The City’s capital assets (net of accumulated depreciation) for its governmental and business-type activities as of June 30, 2004 amount to $308.8 million. Capital assets include land, buildings, infrastructure, improvements, machinery and equipment, and construction in progress. The total increase in the City’s capital assets for the current year was 10.3% ($28.9 million). The following table reflects the capital assets at the end of the fiscal year:
Governmental Activities Business-Type Activities Total2004 2003 2004 2003 2004 2003
Land 9,889$ 9,843$ 2,357$ 2,357$ 12,246$ 12,200$ Buildings 25,501 24,384 47,641 49,160 73,142 73,544 Improvements 7,302 7,762 150,954 144,497 158,256 152,259 Machinery and equipment 8,462 8,623 7,929 4,517 16,391 13,140 Infrastructure 15,581 10,846 - - 15,581 10,846 Construction in progress 26,685 11,751 6,517 6,137 33,202 17,888 Total 93,420$ 73,209$ 215,398$ 206,668$ 308,818$ 279,877$
Capital Assets, Net of DepreciationJune 30, 2004 and 2003 (in thousands of dollars)
Major capital asset events during the current fiscal year included a 43.7% increase in infrastructure (primarily donated capital) and an 85.6% increase in construction in progress (predominantly the 4th Street project). For government-wide financial statement presentation, all depreciable capital assets are depreciated from acquisition date to the end of the current fiscal year. Fund financial statements record capital asset purchases as expenditures. Please refer to Note IV C on pages 59 - 61 of the Notes to the Financial Statements for further information regarding capital assets.

13
Long Term Debt At the end of the current fiscal year, the City had total long-term debt outstanding of $79.0 million. Of this amount, $27.0 million is general obligation bonds backed by the full faith and credit of the City, $19.7 million is revenue bonds, $0.7 million is improvement district bonds, $28.2 million is for the Municipal Facility Corporation, and $3.4 million are outstanding loans for the airport and water/wastewater.
Outstanding DebtJune 30, 2004 and 2003 (in thousands of dollars)
Governmental Activities Business-type Activities Total
2004 2003 2004 2003 2004 2003
General obligation bonds 5,795$ 7,485$ 21,253$ 22,958$ 27,048$ 30,443$ Special assessment bonds 685 944 - - 685 944 Revenue bonds 13,380 14,790 6,290 6,537 19,670 21,327 Other debt 28,170 4,445 - - 28,170 4,445 Loans - - 3,380 3,716 3,380 3,716 Total debt payable 48,030$ 27,664$ 30,923$ 33,211$ 78,953$ 60,875$
During fiscal year 2004, the City’s total bonded debt increased by approximately $18.4 million. The City issued $25 million in new Municipal Facility Corporation debt for the 4th Street Overpass project, as approved by voters in the 2000. This exceeded the debt retirement experience in other bond categories. The State constitution imposes certain debt limitations on the City of six percent (6%) and twenty percent (20%) of the outstanding assessed valuation of the City. The City’s available debt margin at June 30, 2004 is $27.5 million in the 6% category and $75.8 million in the 20% capacity. Additional information on the debt limitations and capacities may be found in Table XI in the statistical section of this report. During the year, the City maintained the following bond ratings:
City of Flagstaff Bonded Debt RatingsAs of June 30, 2004
Moody's Investors Service Standard & Poor's
General Obligation AAa3 A+Water and Sewer Revenue A-1 A Street and Highway Revenue A-1 A+
Additional information on the City’s long-term debt can be found in Section IV F of the Notes to the Financial Statements.

14
Economic Factors and Next Year’s Budget and Rates The Fiscal Year 2004/2005 budget preparation was influenced by the following factors: A conservative economic forecast and limited revenue growth Maintenance of level expenditures while minimizing the impact to health and/or safety services Maintenance of employee increases to minimize take home impacts after increased deductions due to other
employment benefit changes Assessment of long range operational impacts due to capital improvements Sustained funding of capital projects to better insure against economic downturns in the future
The City of Flagstaff held a bond election in May 2004. Ten capital projects totaling $155.2 million were approved by the voters. These projects will be funded through lease proceeds, user fees, and secondary property taxes. Requests for Information The financial report is designed to provide a general overview of the City’s finances for all of those with an interest in the government’s finances. If you have questions about this report or need additional financial information, contact: City of Flagstaff Management Services Department Finance and Budget Division 211 W. Aspen Flagstaff, AZ 86001 Main and TDD (928) 774-5281 Arizona Relay 7-1-1

Component Unit
Governmental
ActivitiesBusiness-type
Activities TotalGreater Flagstaff Economic Council
ASSETSCash and cash equivalents 50,249,198$ 27,178,954$ 77,428,152$ 264,539$ Cash with fiscal agents 5,468,392 3,775,442 9,243,834 -Investments 916,011 683,284 1,599,295 -Accounts receivables, net 5,553,055 3,179,583 8,732,638 111,386Interest receivable 249,166 165,283 414,449 -Intergovernmental receivable 2,089,247 580,161 2,669,408 -Bond proceeds receivable 956,509 - 956,509 -Special assessments receivable 252,450 - 252,450 -Internal balance 350,084 (350,084) - -Inventory 227,706 377,711 605,417 -
Deferred bond issuance costs, net 526,807 559,200 1,086,007 -Other assets - - - 12,049Restricted assets: Temporarily restricted: Cash and cash equivalents 15,282,973 6,881,817 22,164,790 60,000Capital assets: Non-depreciable 36,573,767 8,873,727 45,447,494 - Depreciable, net 56,846,604 206,524,512 263,371,116 9,032 Total assets 175,541,969 258,429,590 433,971,559 457,006
LIABILITIESAccounts payable 3,276,070 1,297,476 4,573,546 23,367Accrued payroll 840,106 170,456 1,010,562 -Interest payable 585,017 - 585,017 -Deferred revenue 747,408 244,983 992,391 -Deposits payable 1,395,800 40,002 1,435,802 -Matured bonds and lease payable 3,747,054 - 3,747,054 -
Unamortized bond premium 1,188,712 170,608 1,359,320 -Liabilities payable from restricted assets 2,656,655 8,847,984 11,504,639 -Noncurrent liabilities: Due within one year: Compensated absences 622,513 187,841 810,354 - Special assessment debt with governmental commitment 270,000 - 270,000 - Bonds and loans payable 4,610,000 3,008,828 7,618,828 - Due in more than one year: Compensated absences 1,948,014 238,932 2,186,946 - Landfill closure and postclosure care costs - 2,191,065 2,191,065 -
Due to primary government - - - 75,301 Special assessment debt with governmental commitment 415,000 - 415,000 - Bonds and loans payable 42,735,000 27,914,191 70,649,191 - Total liabilities 65,037,349 44,312,366 109,349,715 98,668
NET ASSETSInvested in capital assets, net of related debt 41,666,412 184,863,812 226,530,224 9,032Restricted for: Capital projects 31,859,130 1,991,708 33,850,838 - Debt service 3,456,432 3,169,655 6,626,087 - Perpetual care: Expendable 567 - 567 - Nonexpendable 27,107 - 27,107 -Unrestricted 33,494,972 24,092,049 57,587,021 349,306Total net assets 110,504,620$ 214,117,224$ 324,621,844$ 358,338$
The notes to the financial statements are an integral part of this statement
Primary Government
CITY OF FLAGSTAFF, ARIZONAStatement of Net Assets
June 30, 2004
15

ExpensesCharges for
Services
Operating Grants and
Contributions
Capital Grants and
Contributions
Primary government Governmental activities: General government 5,891,617$ 3,257,393$ 33,888$ 39,346$ Public safety 18,792,832 451,802 - - Public Works 1,178,137 976,793 - - Economic and physical development 6,473,290 16,164 690,914 - Culture and recreation 8,693,714 722,236 1,953,851 469,322 Highways and streets 8,886,947 - - 11,248,662 Interest on long-term debt 1,923,325 - - - Total governmental activities 51,839,862 5,424,388 2,678,653 11,757,330
Business-type activities: Water and wastewater 17,250,441 16,678,956 3,000 9,543,326 Environmental 7,319,602 8,201,566 - - Airport 3,370,447 944,983 260,343 670,785 Stormwater 460,936 546,807 23,576 268,880 Total business-type activities 28,401,426 26,372,312 286,919 10,482,991Total primary government 80,241,288$ 31,796,700$ 2,965,572$ 22,240,321$
Component units Greater Flagstaff Economic Council 584,308$ -$ 580,828$ -$
The notes to the financial statements are an integral part of this statement
Net assets - ending
CITY OF FLAGSTAFF, ARIZONAStatement of Activities
Year Ended June 30, 2004
Program Revenues
Transfers in (out) Total general revenues, contributions and transfers Change in net assets Net assets - beginning, as restated
Investment earnings Miscellaneous Gain on sale of capital assets Contributions to permanent fund
State shared sales taxes Grants and contributions not restricted to specific programs
General revenues: Property taxes, levied for general purposes Property tax, levied for debt service Sales taxes
16
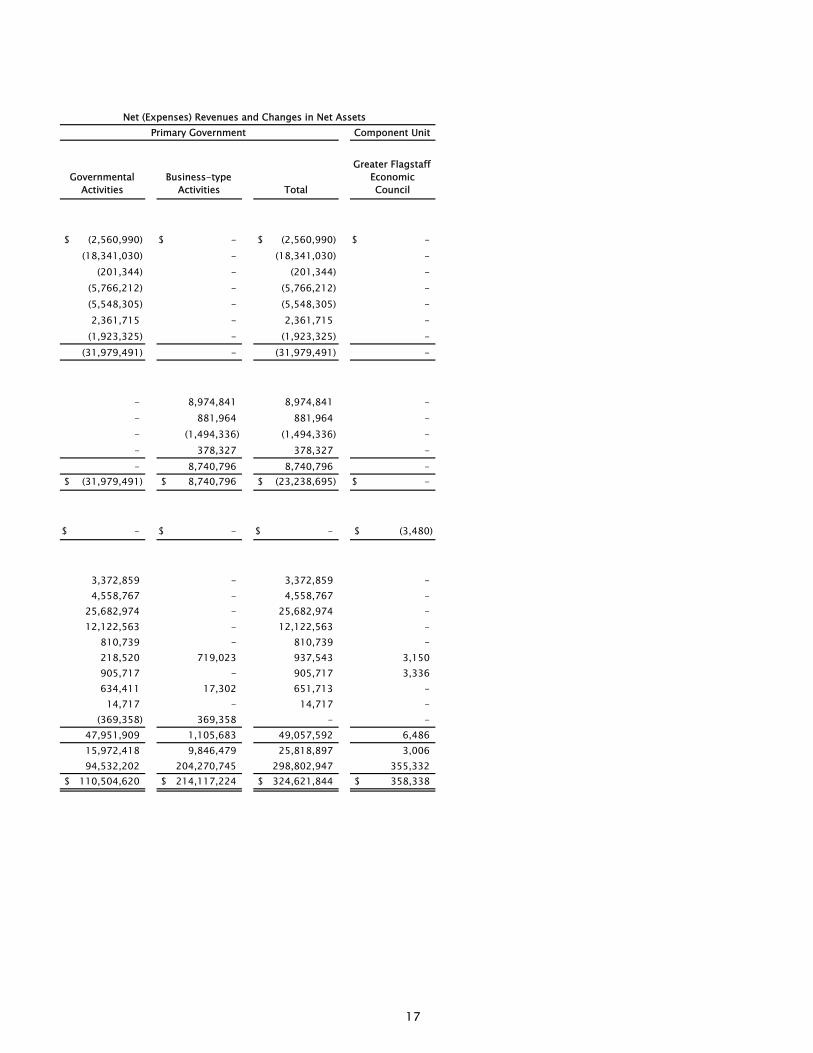
Component Unit
Governmental Activities
Business-type Activities Total
Greater Flagstaff Economic Council
(2,560,990)$ -$ (2,560,990)$ -$ (18,341,030) - (18,341,030) -
(201,344) - (201,344) -(5,766,212) - (5,766,212) -(5,548,305) - (5,548,305) -2,361,715 - 2,361,715 -
(1,923,325) - (1,923,325) -(31,979,491) - (31,979,491) -
- 8,974,841 8,974,841 -- 881,964 881,964 -- (1,494,336) (1,494,336) -- 378,327 378,327 -- 8,740,796 8,740,796 -
(31,979,491)$ 8,740,796$ (23,238,695)$ -$
-$ -$ -$ (3,480)$
3,372,859 - 3,372,859 -4,558,767 - 4,558,767 -
25,682,974 - 25,682,974 -12,122,563 - 12,122,563 -
810,739 - 810,739 -218,520 719,023 937,543 3,150905,717 - 905,717 3,336634,411 17,302 651,713 -
14,717 - 14,717 -(369,358) 369,358 - -
47,951,909 1,105,683 49,057,592 6,48615,972,418 9,846,479 25,818,897 3,00694,532,202 204,270,745 298,802,947 355,332
110,504,620$ 214,117,224$ 324,621,844$ 358,338$
Net (Expenses) Revenues and Changes in Net AssetsPrimary Government
17
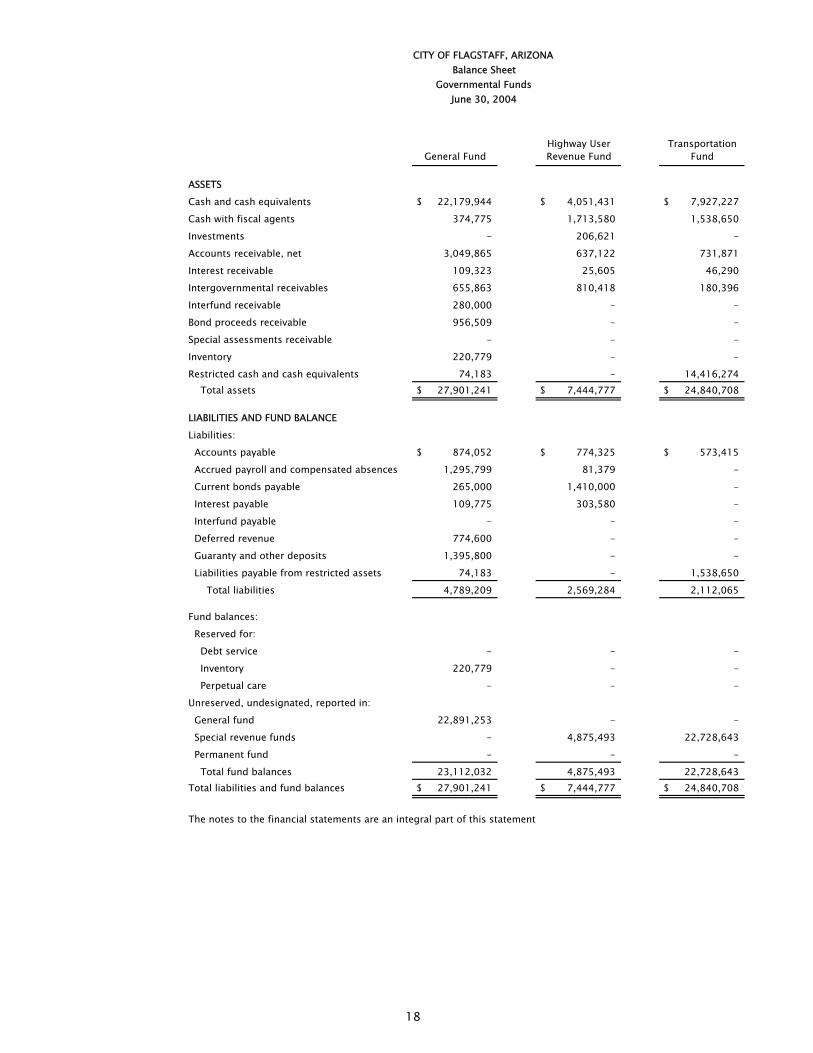
General FundHighway User Revenue Fund
Transportation Fund
ASSETS
Cash and cash equivalents 22,179,944$ 4,051,431$ 7,927,227$
Cash with fiscal agents 374,775 1,713,580 1,538,650
Investments - 206,621 -
Accounts receivable, net 3,049,865 637,122 731,871
Interest receivable 109,323 25,605 46,290
Intergovernmental receivables 655,863 810,418 180,396
Interfund receivable 280,000 - -
Bond proceeds receivable 956,509 - -
Special assessments receivable - - -
Inventory 220,779 - -
Restricted cash and cash equivalents 74,183 - 14,416,274 Total assets 27,901,241$ 7,444,777$ 24,840,708$
LIABILITIES AND FUND BALANCE
Liabilities:
Accounts payable 874,052$ 774,325$ 573,415$
Accrued payroll and compensated absences 1,295,799 81,379 -
Current bonds payable 265,000 1,410,000 -
Interest payable 109,775 303,580 -
Interfund payable - - -
Deferred revenue 774,600 - -
Guaranty and other deposits 1,395,800 - -
Liabilities payable from restricted assets 74,183 - 1,538,650
Total liabilities 4,789,209 2,569,284 2,112,065
Fund balances:
Reserved for:
Debt service - - -
Inventory 220,779 - -
Perpetual care - - -
Unreserved, undesignated, reported in:
General fund 22,891,253 - -
Special revenue funds - 4,875,493 22,728,643
Permanent fund - - -
Total fund balances 23,112,032 4,875,493 22,728,643Total liabilities and fund balances 27,901,241$ 7,444,777$ 24,840,708$
The notes to the financial statements are an integral part of this statement
CITY OF FLAGSTAFF, ARIZONABalance Sheet
Governmental FundsJune 30, 2004
18

BBB Fund
Other Governmental
Funds
Total Governmental
Funds
5,847,487$ 5,177,808$ 45,183,897$
- 1,841,387 5,468,392
709,390 - 916,011
490,319 487,225 5,396,402
27,228 16,127 224,573
18,620 423,950 2,089,247
- - 280,000
- - 956,509
- 252,450 252,450
6,927 - 227,706
- 792,516 15,282,9737,099,971$ 8,991,463$ 76,278,160$
364,014$ 128,017$ 2,713,823$
18,199 67,242 1,462,619
- 2,072,054 3,747,054
- 171,662 585,017
- 280,000 280,000
- 395,688 1,170,288
- - 1,395,800
- 1,043,822 2,656,655
382,213 4,158,485 14,011,256
- 1,650,520 1,650,520
- - 220,779
- 27,107 27,107
- - 22,891,253
6,717,758 3,154,784 37,476,678
- 567 567
6,717,758 4,832,978 62,266,9047,099,971$ 8,991,463$ 76,278,160$
19
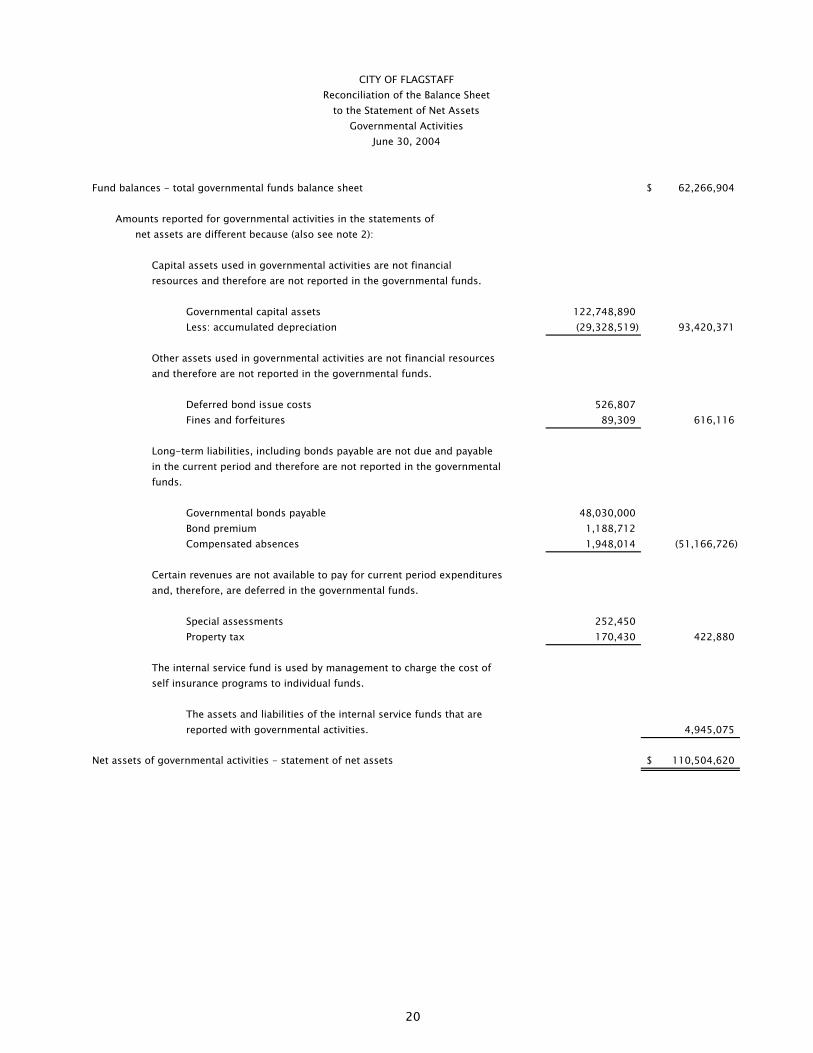
Fund balances - total governmental funds balance sheet 62,266,904$
Amounts reported for governmental activities in the statements ofnet assets are different because (also see note 2):
Capital assets used in governmental activities are not financialresources and therefore are not reported in the governmental funds.
Governmental capital assets 122,748,890 Less: accumulated depreciation (29,328,519) 93,420,371
Other assets used in governmental activities are not financial resourcesand therefore are not reported in the governmental funds.
Deferred bond issue costs 526,807 Fines and forfeitures 89,309 616,116
Long-term liabilities, including bonds payable are not due and payablein the current period and therefore are not reported in the governmentalfunds.
Governmental bonds payable 48,030,000 Bond premium 1,188,712 Compensated absences 1,948,014 (51,166,726)
Certain revenues are not available to pay for current period expendituresand, therefore, are deferred in the governmental funds.
Special assessments 252,450 Property tax 170,430 422,880
The internal service fund is used by management to charge the cost ofself insurance programs to individual funds.
The assets and liabilities of the internal service funds that arereported with governmental activities. 4,945,075
Net assets of governmental activities - statement of net assets 110,504,620$
June 30, 2004
CITY OF FLAGSTAFFReconciliation of the Balance Sheet
to the Statement of Net AssetsGovernmental Activities
20

21
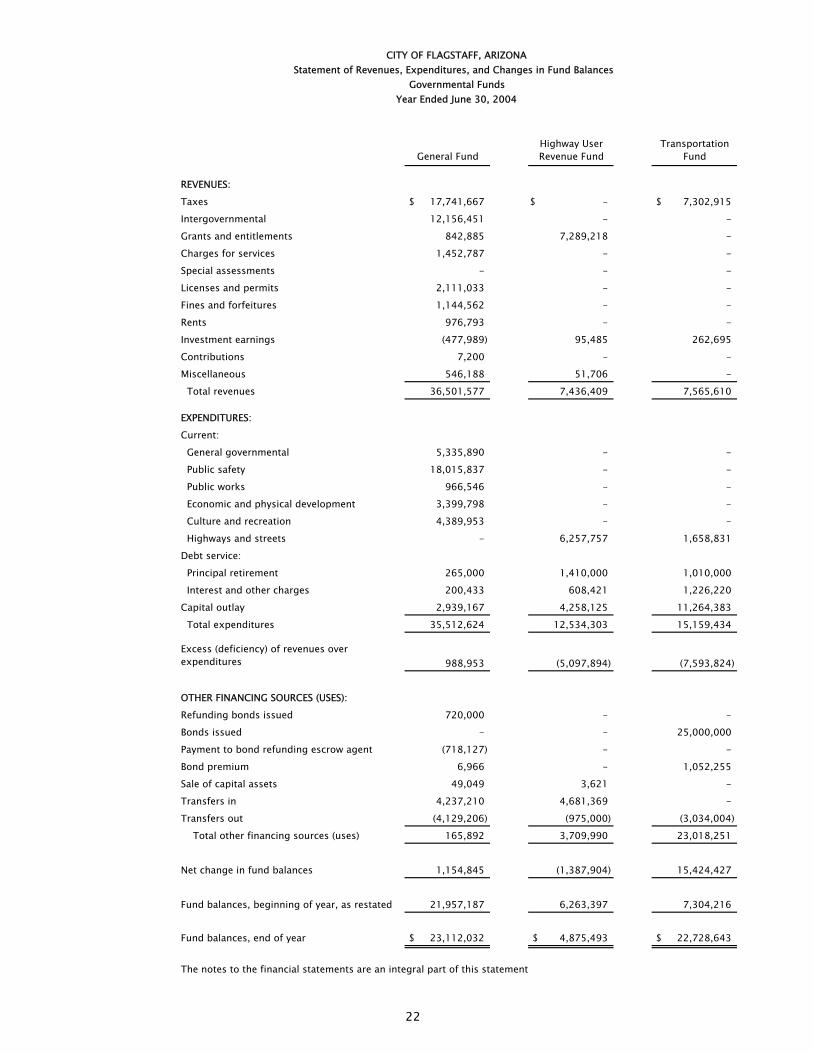
General FundHighway User Revenue Fund
Transportation Fund
REVENUES:
Taxes 17,741,667$ -$ 7,302,915$
Intergovernmental 12,156,451 - -
Grants and entitlements 842,885 7,289,218 -
Charges for services 1,452,787 - -
Special assessments - - -
Licenses and permits 2,111,033 - -
Fines and forfeitures 1,144,562 - -
Rents 976,793 - -
Investment earnings (477,989) 95,485 262,695
Contributions 7,200 - -
Miscellaneous 546,188 51,706 -
Total revenues 36,501,577 7,436,409 7,565,610
EXPENDITURES:
Current:
General governmental 5,335,890 - -
Public safety 18,015,837 - -
Public works 966,546 - -
Economic and physical development 3,399,798 - -
Culture and recreation 4,389,953 - -
Highways and streets - 6,257,757 1,658,831
Debt service:
Principal retirement 265,000 1,410,000 1,010,000
Interest and other charges 200,433 608,421 1,226,220
Capital outlay 2,939,167 4,258,125 11,264,383
Total expenditures 35,512,624 12,534,303 15,159,434
Excess (deficiency) of revenues over expenditures 988,953 (5,097,894) (7,593,824)
OTHER FINANCING SOURCES (USES):
Refunding bonds issued 720,000 - -
Bonds issued - - 25,000,000
Payment to bond refunding escrow agent (718,127) - -
Bond premium 6,966 - 1,052,255
Sale of capital assets 49,049 3,621 -
Transfers in 4,237,210 4,681,369 -
Transfers out (4,129,206) (975,000) (3,034,004)
Total other financing sources (uses) 165,892 3,709,990 23,018,251
Net change in fund balances 1,154,845 (1,387,904) 15,424,427
Fund balances, beginning of year, as restated 21,957,187 6,263,397 7,304,216
Fund balances, end of year 23,112,032$ 4,875,493$ 22,728,643$
The notes to the financial statements are an integral part of this statement
CITY OF FLAGSTAFF, ARIZONAStatement of Revenues, Expenditures, and Changes in Fund Balances
Governmental FundsYear Ended June 30, 2004
22

BBB Fund
Other Governmental
Funds
Total Governmental
Funds
4,063,049$ 4,628,523$ 33,736,154$
- - 12,156,451
164,066 2,644,765 10,940,934
7,050 - 1,459,837
- 291,684 291,684
- - 2,111,033
- - 1,144,562
9,114 - 985,907
115,054 120,188 115,433
- 14,717 21,917
34,438 273,385 905,717
4,392,771 7,973,262 63,869,629
- - 5,335,890
- - 18,015,837
- - 966,546
1,827,543 1,062,625 6,289,966
409,248 2,925,280 7,724,481
86,522 - 8,003,110
- 1,929,000 4,614,000
- 392,952 2,428,026
887,033 - 19,348,708
3,210,346 6,309,857 72,726,564
1,182,425 1,663,405 (8,856,935)
- - 720,000
- - 25,000,000
- - (718,127)
- - 1,059,221
- 581,741 634,411
528,056 3,549,899 12,996,534
(1,108,895) (4,118,787) (13,365,892)
(580,839) 12,853 26,326,147
601,586 1,676,258 17,469,212
6,116,172 3,156,720 44,797,692
6,717,758$ 4,832,978$ 62,266,904$
23
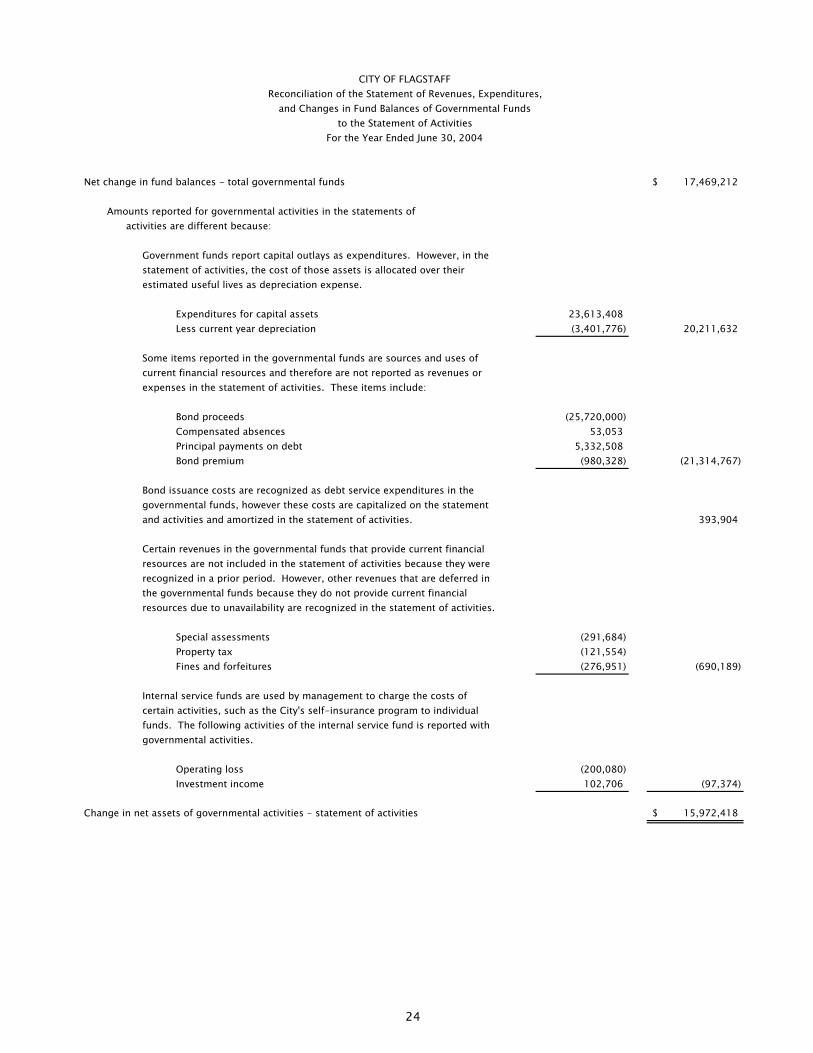
Net change in fund balances - total governmental funds 17,469,212$
Amounts reported for governmental activities in the statements ofactivities are different because:
Government funds report capital outlays as expenditures. However, in the statement of activities, the cost of those assets is allocated over theirestimated useful lives as depreciation expense.
Expenditures for capital assets 23,613,408 Less current year depreciation (3,401,776) 20,211,632
Some items reported in the governmental funds are sources and uses ofcurrent financial resources and therefore are not reported as revenues or expenses in the statement of activities. These items include:
Bond proceeds (25,720,000) Compensated absences 53,053 Principal payments on debt 5,332,508 Bond premium (980,328) (21,314,767)
Bond issuance costs are recognized as debt service expenditures in thegovernmental funds, however these costs are capitalized on the statementand activities and amortized in the statement of activities. 393,904
Certain revenues in the governmental funds that provide current financialresources are not included in the statement of activities because they wererecognized in a prior period. However, other revenues that are deferred in the governmental funds because they do not provide current financial resources due to unavailability are recognized in the statement of activities.
Special assessments (291,684) Property tax (121,554) Fines and forfeitures (276,951) (690,189)
Internal service funds are used by management to charge the costs of certain activities, such as the City's self-insurance program to individualfunds. The following activities of the internal service fund is reported withgovernmental activities.
Operating loss (200,080) Investment income 102,706 (97,374)
Change in net assets of governmental activities - statement of activities 15,972,418$
For the Year Ended June 30, 2004
CITY OF FLAGSTAFFReconciliation of the Statement of Revenues, Expenditures,
and Changes in Fund Balances of Governmental Fundsto the Statement of Activities
24
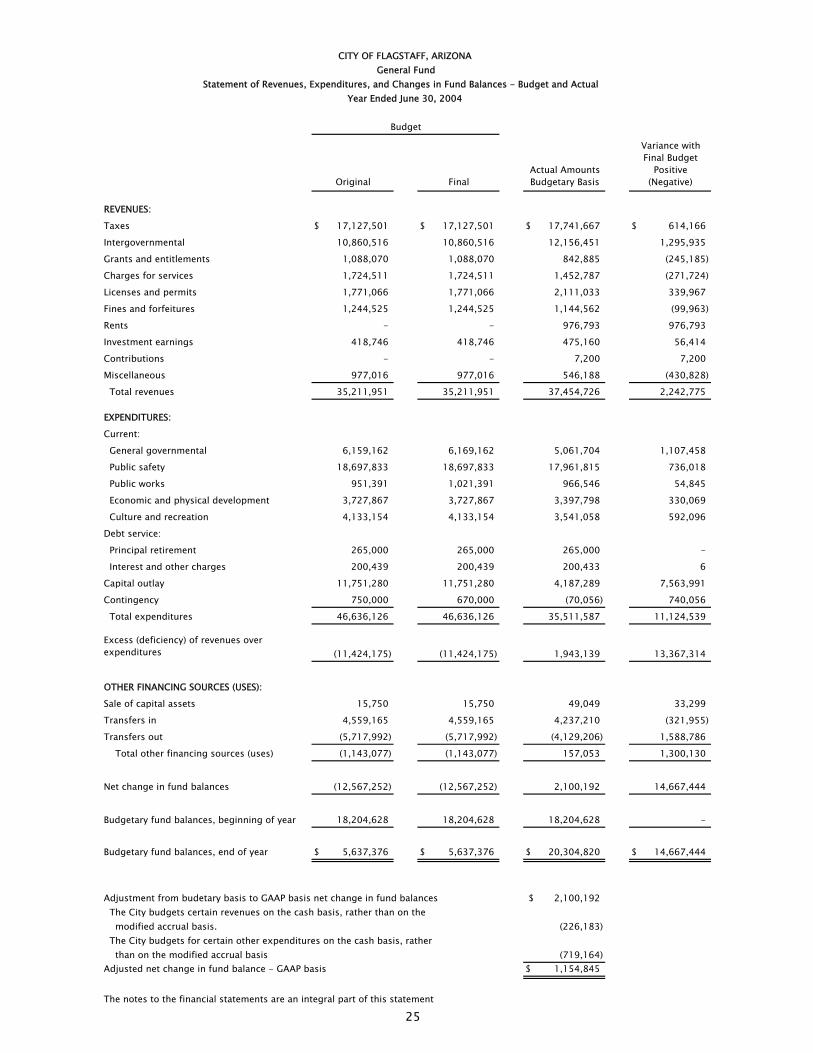
Original FinalActual Amounts Budgetary Basis
Variance with Final Budget
Positive (Negative)
REVENUES:
Taxes 17,127,501$ 17,127,501$ 17,741,667$ 614,166$
Intergovernmental 10,860,516 10,860,516 12,156,451 1,295,935
Grants and entitlements 1,088,070 1,088,070 842,885 (245,185)
Charges for services 1,724,511 1,724,511 1,452,787 (271,724)
Licenses and permits 1,771,066 1,771,066 2,111,033 339,967
Fines and forfeitures 1,244,525 1,244,525 1,144,562 (99,963)
Rents - - 976,793 976,793
Investment earnings 418,746 418,746 475,160 56,414
Contributions - - 7,200 7,200
Miscellaneous 977,016 977,016 546,188 (430,828)
Total revenues 35,211,951 35,211,951 37,454,726 2,242,775
EXPENDITURES:
Current:
General governmental 6,159,162 6,169,162 5,061,704 1,107,458
Public safety 18,697,833 18,697,833 17,961,815 736,018
Public works 951,391 1,021,391 966,546 54,845
Economic and physical development 3,727,867 3,727,867 3,397,798 330,069
Culture and recreation 4,133,154 4,133,154 3,541,058 592,096
Debt service:
Principal retirement 265,000 265,000 265,000 -
Interest and other charges 200,439 200,439 200,433 6
Capital outlay 11,751,280 11,751,280 4,187,289 7,563,991
Contingency 750,000 670,000 (70,056) 740,056
Total expenditures 46,636,126 46,636,126 35,511,587 11,124,539
Excess (deficiency) of revenues over expenditures (11,424,175) (11,424,175) 1,943,139 13,367,314
OTHER FINANCING SOURCES (USES):
Sale of capital assets 15,750 15,750 49,049 33,299
Transfers in 4,559,165 4,559,165 4,237,210 (321,955)
Transfers out (5,717,992) (5,717,992) (4,129,206) 1,588,786
Total other financing sources (uses) (1,143,077) (1,143,077) 157,053 1,300,130
Net change in fund balances (12,567,252) (12,567,252) 2,100,192 14,667,444
Budgetary fund balances, beginning of year 18,204,628 18,204,628 18,204,628 -
Budgetary fund balances, end of year 5,637,376$ 5,637,376$ 20,304,820$ 14,667,444$
Adjustment from budetary basis to GAAP basis net change in fund balances 2,100,192$ The City budgets certain revenues on the cash basis, rather than on the modified accrual basis. (226,183) The City budgets for certain other expenditures on the cash basis, rather than on the modified accrual basis (719,164) Adjusted net change in fund balance - GAAP basis 1,154,845$
The notes to the financial statements are an integral part of this statement
Budget
CITY OF FLAGSTAFF, ARIZONAGeneral Fund
Statement of Revenues, Expenditures, and Changes in Fund Balances - Budget and ActualYear Ended June 30, 2004
25
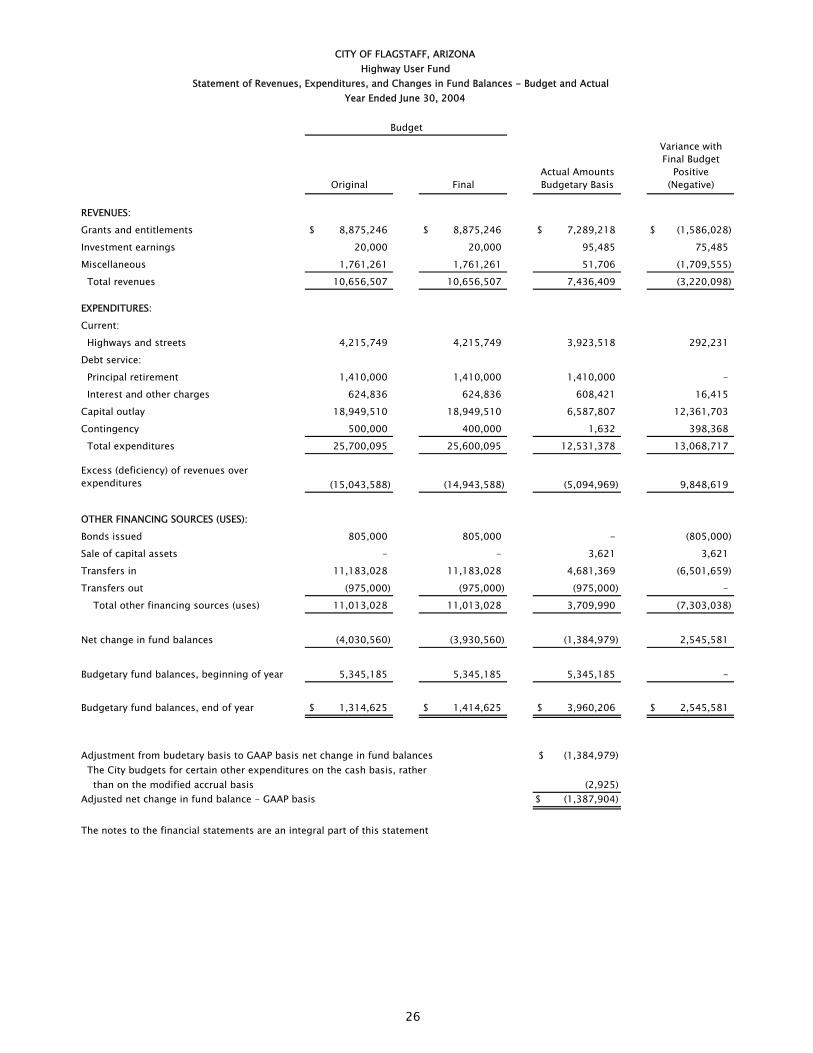
Original FinalActual Amounts Budgetary Basis
Variance with Final Budget
Positive (Negative)
REVENUES:
Grants and entitlements 8,875,246$ 8,875,246$ 7,289,218$ (1,586,028)$
Investment earnings 20,000 20,000 95,485 75,485
Miscellaneous 1,761,261 1,761,261 51,706 (1,709,555)
Total revenues 10,656,507 10,656,507 7,436,409 (3,220,098)
EXPENDITURES:
Current:
Highways and streets 4,215,749 4,215,749 3,923,518 292,231
Debt service:
Principal retirement 1,410,000 1,410,000 1,410,000 -
Interest and other charges 624,836 624,836 608,421 16,415
Capital outlay 18,949,510 18,949,510 6,587,807 12,361,703
Contingency 500,000 400,000 1,632 398,368
Total expenditures 25,700,095 25,600,095 12,531,378 13,068,717
Excess (deficiency) of revenues over expenditures (15,043,588) (14,943,588) (5,094,969) 9,848,619
OTHER FINANCING SOURCES (USES):
Bonds issued 805,000 805,000 - (805,000)
Sale of capital assets - - 3,621 3,621
Transfers in 11,183,028 11,183,028 4,681,369 (6,501,659)
Transfers out (975,000) (975,000) (975,000) -
Total other financing sources (uses) 11,013,028 11,013,028 3,709,990 (7,303,038)
Net change in fund balances (4,030,560) (3,930,560) (1,384,979) 2,545,581
Budgetary fund balances, beginning of year 5,345,185 5,345,185 5,345,185 -
Budgetary fund balances, end of year 1,314,625$ 1,414,625$ 3,960,206$ 2,545,581$
Adjustment from budetary basis to GAAP basis net change in fund balances (1,384,979)$ The City budgets for certain other expenditures on the cash basis, rather than on the modified accrual basis (2,925) Adjusted net change in fund balance - GAAP basis (1,387,904)$
The notes to the financial statements are an integral part of this statement
Budget
CITY OF FLAGSTAFF, ARIZONAHighway User Fund
Statement of Revenues, Expenditures, and Changes in Fund Balances - Budget and ActualYear Ended June 30, 2004
26

Original FinalActual Amounts Budgetary Basis
Variance with Final Budget
Positive (Negative)
REVENUES:
Taxes 7,050,874$ 7,050,874$ 7,302,915$ 252,041$
Investment earnings 1,364,000 1,364,000 262,695 (1,101,305)
Total revenues 8,414,874 8,414,874 7,565,610 (849,264)
EXPENDITURES:
Current:
Highways and streets 2,016,199 2,016,199 1,676,966 339,233
Debt service:
Principal retirement 500,000 500,000 1,010,000 (510,000)
Interest and other charges 1,250,000 1,250,000 1,226,220 23,780
Capital outlay 10,699,075 10,699,075 11,246,248 (547,173)
Total expenditures 14,465,274 14,465,274 15,159,434 (694,160)
Excess (deficiency) of revenues over expenditures (6,050,400) (6,050,400) (7,593,824) (1,543,424)
OTHER FINANCING SOURCES (USES):
Transfers out (8,267,692) (8,267,692) (3,034,004) 5,233,688
Total other financing sources (uses) (8,267,692) (8,267,692) (3,034,004) 5,233,688
Net change in fund balances (14,318,092) (14,318,092) (10,627,828) 3,690,264
Budgetary fund balances, beginning of year 27,275,704 27,275,704 27,275,704 -
Budgetary fund balances, end of year 12,957,612$ 12,957,612$ 16,647,876$ 3,690,264$
Adjustment from budetary basis to GAAP basis net change in fund balances (10,627,828)$ The City budgets certain revenues on the cash basis, rather than on the modified accrual basis. 26,052,255 Adjusted net change in fund balance - GAAP basis 15,424,427$
The notes to the financial statements are an integral part of this statement
Budget
CITY OF FLAGSTAFF, ARIZONATransportation Fund
Statement of Revenues, Expenditures, and Changes in Fund Balances - Budget and ActualYear Ended June 30, 2004
27

Original FinalActual Amounts Budgetary Basis
Variance with Final Budget
Positive (Negative)
REVENUES:
Taxes 3,885,294$ 3,885,294$ 4,063,049$ 177,755$
Grants and entitlements 1,775,000 1,775,000 164,066 (1,610,934)
Charges for services - - 7,050 7,050
Rents - - 9,114 9,114
Investment earnings 130,167 130,167 115,054 (15,113)
Miscellaneous 70,065 70,065 34,438 (35,627)
Total revenues 5,860,526 5,860,526 4,392,771 (1,467,755)
EXPENDITURES:
Current:
Economic and physical development 1,966,803 1,966,803 1,822,705 144,098
Culture and recreation 494,251 494,251 406,846 87,405
Highways and streets - - 36,408 (36,408)
Capital outlay 6,236,866 6,236,866 944,387 5,292,479
Contingency 95,000 95,000 - 95,000
Total expenditures 8,792,920 8,792,920 3,210,346 5,582,574
Excess (deficiency) of revenues over expenditures (2,932,394) (2,932,394) 1,182,425 4,114,819
OTHER FINANCING SOURCES (USES):
Transfers in 1,015,266 1,015,266 528,056 (487,210)
Transfers out (1,593,317) (1,593,317) (1,108,895) 484,422
Total other financing sources (uses) (578,051) (578,051) (580,839) (2,788)
Net change in fund balances (3,510,445) (3,510,445) 601,586 4,112,031
Budgetary fund balances, beginning of year 5,617,074 5,617,074 5,617,074 -
Budgetary fund balances, end of year 2,106,629$ 2,106,629$ 6,218,660$ 4,112,031$
The notes to the financial statements are an integral part of this statement
Budget
CITY OF FLAGSTAFF, ARIZONABBB Fund
Statement of Revenues, Expenditures, and Changes in Fund Balances - Budget and ActualYear Ended June 30, 2004
28

29

Water and Wastewater
FundEnvironmental Services Fund
ASSETS
Current assets:
Cash and cash equivalents 22,251,181$ 4,685,477$
Cash with fiscal agents 3,514,477 -
Restricted cash and cash equivalents 1,610,490 4,875,315
Investments 70,000 613,284
Accounts receivable, net 2,251,051 800,507
Interest receivable 126,040 36,589
Interfund receivables 400,000 -
Intergovernmental receivables - -
Inventory 377,711 -
Deferred bond issuance costs, net 559,200 -
Total current assets 31,160,150 11,011,172Noncurrent assets:
Capital assets, non-depreciable 5,754,611 1,971,748
Capital assets, depreciable, net 173,600,582 4,568,172
Total non-current assets 179,355,193 6,539,920
Total assets 210,515,343 17,551,092
LIABILITIES
Current liabilities:
Accounts payable 760,609 139,282
Accrued payroll and compensated absences 225,574 99,008
Deferred revenue 114,334 130,649
Unamortized bond premium 158,464 -
Interfund payable - -
Lease and notes payable - -
Liabilities payable from restricted assets 3,697,530 4,889,489
Deposits payable - 17,340
Total current liabilities 4,956,511 5,275,768
Noncurrent liabilities:
Compensated absences 177,201 51,106
Landfill closure and postclosure care costs - 2,191,065
Bonds and notes payable 28,981,423 -
Total noncurrent liabilities 29,158,624 2,242,171
Total liabilities 34,115,135 7,517,939
NET ASSETSInvested in capital assets, net of related debt 150,774,506 6,539,920Restricted:
Capital projects 1,593,915 -
Debt service 3,169,655 -
Unrestricted 20,862,132 3,493,233 Total net assets 176,400,208$ 10,033,153$
Some amounts reported for business-type activities in the statement of net assets are different because certaininternal service fund assets and liabilities are included with business-type activities.
The notes to the financial statements are an integral part of this statement
Business-type Activities - Enterprise Funds
CITY OF FLAGSTAFF, ARIZONAStatement of Net Assets
Proprietary FundsJune 30, 2004
30

Governmental Activities
Airport FundOther Proprietary
Fund Total Internal Service Fund
23,403$ 218,893$ 27,178,954$ 5,065,301$
260,965 - 3,775,442 -
396,012 - 6,881,817 -
- - 683,284 -
107,196 20,829 3,179,583 67,344
2,343 311 165,283 24,593
- - 400,000 94,897
570,971 9,190 580,161 -
- - 377,711 -
- - 559,200 -
1,360,890 249,223 43,781,435 5,252,135
1,018,569 128,799 8,873,727 -
28,088,711 267,047 206,524,512 -
29,107,280 395,846 215,398,239 -
30,468,170 645,069 259,179,674 5,252,135
318,034 79,551 1,297,476 562,247
26,759 6,956 358,297 -
- - 244,983 -
12,144 - 170,608 -
494,897 - 494,897 -
28,001 - 28,001 -
260,965 - 8,847,984 -
22,662 - 40,002 -
1,163,462 86,507 11,482,248 562,247
7,347 3,278 238,932 -
- - 2,191,065 -
1,913,595 - 30,895,018 -
1,920,942 3,278 33,325,015 -
3,084,404 89,785 44,807,263 562,247
27,181,541 395,846 184,891,813 -
397,793 - 1,991,708 -
- - 3,169,655 -
(195,568) 159,438 24,319,235 4,689,88827,383,766$ 555,284$ 214,372,411$ 4,689,888$
Net assets of business-type activities (255,187) 214,117,224$
Business-type Activities - Enterprise Funds
31

Water and Wastewater
FundEnvironmental Services Fund
OPERATING REVENUES:
Charges for services 16,670,981$ 8,200,245$
Miscellaneous 15,089 -
Total operating revenues 16,686,070 8,200,245
OPERATING EXPENSES:
Personal services 4,046,281 2,408,529
Contractual services, materials and supplies 6,598,792 4,036,094
Insurance claims and expenses - -
Depreciation and amortization 5,277,001 846,843
Total operating expenses 15,922,074 7,291,466
Operating income (loss) 763,996 908,779
NON-OPERATING REVENUES (EXPENSES):
Interest and investment income 541,778 166,941
Grants and entitlements 3,000 -
Gain on sale of capital asset 6,272 4,492
Interest expense (1,259,589) -
Miscellaneous (7,114) 1,321
Total non-operating revenues (expenses) (715,653) 172,754
Income (loss) before capital contributions and transfers 48,343 1,081,533
Capital contributions 9,543,326 -
Transfers in 2,018,421 15,000
Transfers out (2,018,421) (429,678)
Change in net assets 9,591,669 666,855
Total net assets, beginning of year, as restated 166,808,539 9,366,298
Total net assets, end of year 176,400,208$ 10,033,153$
Some amounts reported for business-type activities on the statement
of activities are different because the net revenue (expense) of certain
internal service funds is reported with business-type activities.
Change in net assets of business-type activites
The notes to the financial statements are an integral part of this statement
CITY OF FLAGSTAFF, ARIZONAStatement of Revenues, Expenses, and Changes in Fund Net Assets
Proprietary FundsYear Ended June 30, 2004
Business-type Activities - Enterprise Funds
32

Airport FundOther Proprietary
Fund Total Internal Service Fund
950,920$ 546,807$ 26,368,953$ 5,640,700$
- - 15,089 644
950,920 546,807 26,384,042 5,641,344
487,434 254,437 7,196,681 -
954,392 201,540 11,790,818 -
- - - 5,951,650
1,813,358 1,833 7,939,035 -
3,255,184 457,810 26,926,534 5,951,650
(2,304,264) 88,997 (542,492) (310,306)
9,473 831 719,023 102,706
931,128 23,576 957,704 -
6,538 - 17,302 -
(102,758) - (1,362,347) -
(5,937) - (11,730) (2,319)
838,444 24,407 319,952 100,387
(1,465,820) 113,404 (222,540) (209,919)
- 268,880 9,812,206 -
611,036 235,000 2,879,457 -
- (62,000) (2,510,099) -
(854,784) 555,284 9,959,024 (209,919)
28,238,550 - 204,413,387 4,899,807
27,383,766$ 555,284$ 214,372,411$ 4,689,888$
(255,187) 214,117,224$
Business-type Activities - Enterprise Funds Governmental Activities
33

Water and Wastewater Fund
Environmental Services Fund
Cash flows from operating activities: Receipts from customers 17,322,386$ 8,103,064$ Payments to suppliers (6,572,635) (3,936,050) Payments to employees (3,998,481) (2,414,556) Other receipts (payments) 7,975 (17,262) Net cash provided (used) by operating activities 6,759,245 1,735,196
Cash flows from noncapital financing activities: Transfer from other funds 2,018,421 15,000 Transfer to other funds (2,018,421) (429,678) Interfund loans paid (300,000) - Interfund loans received - - Net cash provided (used) by noncapital financing activities (300,000) (414,678)
Cash flows from capital and related financing activities: Receipts from grantors - - Capital contributions 1,893,566 - Acquisition and construction of capital assets (6,951,023) (960,745) Principal payments on capital debt (2,301,618) - Interest paid on capital debt (1,263,307) - Increase in deferred bond issuance costs (91,588) - Proceeds from insurance - 260,000 Proceeds from sales of capital assets 6,272 19,063 Net cash provided (used) by capital and related financing activities (8,707,698) (681,682)
Cash flows from investing activities: Interest received on investments 503,532 161,325 Net cash provided (used) by investing activities 503,532 161,325
Net increase (decrease) in cash and cash equivalents (1,744,921) 800,161Cash and cash equivalents at beginning of year 29,191,069 9,373,915Cash and cash equivalents at end of year 27,446,148$ 10,174,076$
Classified as: Cash, cash equivalents, and investments 22,251,181$ 4,685,477$ Cash and investments 70,000 613,284 Restricted cash with fiscal agents 3,514,477 - Restricted cash and cash equivalents 1,610,490 4,875,315 Totals 27,446,148$ 10,174,076$
The notes to the financial statements are an integral part of this statement
Business-type Activities - Enterprise Funds
(continued)
Proprietary FundsFor the Year Ended June 30, 2004
City of Flagstaff, ArizonaStatement of Cash Flows
34
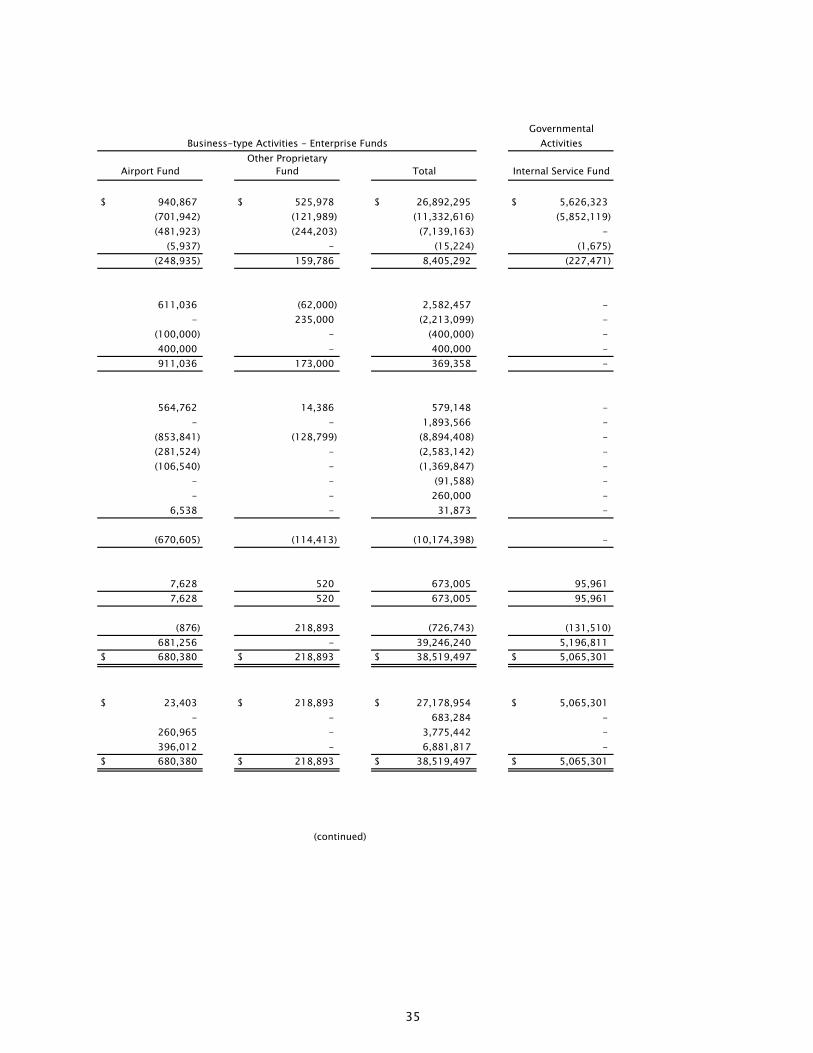
GovernmentalActivities
Airport FundOther Proprietary
Fund Total Internal Service Fund
940,867$ 525,978$ 26,892,295$ 5,626,323$ (701,942) (121,989) (11,332,616) (5,852,119)(481,923) (244,203) (7,139,163) -
(5,937) - (15,224) (1,675)(248,935) 159,786 8,405,292 (227,471)
611,036 (62,000) 2,582,457 -- 235,000 (2,213,099) -
(100,000) - (400,000) -400,000 - 400,000 -911,036 173,000 369,358 -
564,762 14,386 579,148 -- - 1,893,566 -
(853,841) (128,799) (8,894,408) -(281,524) - (2,583,142) -(106,540) - (1,369,847) -
- - (91,588) -- - 260,000 -
6,538 - 31,873 -
(670,605) (114,413) (10,174,398) -
7,628 520 673,005 95,9617,628 520 673,005 95,961
(876) 218,893 (726,743) (131,510)681,256 - 39,246,240 5,196,811680,380$ 218,893$ 38,519,497$ 5,065,301$
23,403$ 218,893$ 27,178,954$ 5,065,301$
- - 683,284 - 260,965 - 3,775,442 -396,012 - 6,881,817 -680,380$ 218,893$ 38,519,497$ 5,065,301$
Business-type Activities - Enterprise Funds
(continued)
35

Water and Wastewater Fund
Environmental Services Fund
Reconciliation of operating income (loss) to net cash provided (used) by operating activities
Operating income (loss) 763,996$ 908,779$
Adjustments to reconcile operating income (loss) to net cash provided (used) by operating activities: Depreciation and amortization 5,277,001 846,843 Landfill closure and postclosure costs - (46,513) Non-operating inflow (outflow) (7,114) 1,321(Increase) decrease in assets: Accounts receivable 648,612 (98,502) Inventories (46,299) -Increase (decrease) in liabilities: Accounts payable 72,456 129,295 Accrued payroll and compensated absences 47,800 (6,027) Deposits payable (12,589) - Deferred revenue 15,382 -Total adjustments 5,995,249 826,417
Net cash provided (used) by operating activities 6,759,245$ 1,735,196$
Noncash investing, capital and financing activities: Capital assets acquired through contributions from developers 7,649,760$ -$ Total noncash investing, capital and financing activities 7,649,760$ -$
The notes to the financial statements are an integral part of this statement
Business-type Activities - Enterprise Funds
Proprietary FundsFor the Year Ended June 30, 2004
City of Flagstaff, ArizonaStatement of Cash Flows
36

GovernmentalActivities
Airport FundOther Proprietary
Fund Total Internal Service Fund
(2,304,264)$ 88,997$ (542,492)$ (310,306)$
1,813,358 1,833 7,939,035 -- - (46,513) -
(5,937) - (11,730) (2,319)
(2,483) (20,829) 526,798 (14,377)- - (46,299) -
252,450 79,551 533,752 99,5315,511 10,234 57,518 -
697 - (11,892) -(8,267) - 7,115 -
2,055,329 70,789 8,947,784 82,835
(248,935)$ 159,786$ 8,405,292$ (227,471)$
-$ 268,880$ 7,918,640$ -$ -$ 268,880$ 7,918,640$ -$
37

Firemen's Pension Fund
ASSETS
Cash and cash equivalents 218,208$
Interest receivable 1,006
Total assets 219,214
LIABILITIES
Other liabilities -
Total liabilities -
NET ASSETSHeld in trust for pension benefits and other purposes 219,214$
The notes to the financial statements are an integral part of this statement
CITY OF FLAGSTAFF, ARIZONAStatement of Fiduciary Net Assets
Fiduciary FundsJune 30, 2004
38

Firemen's Pension Fund
ADDITIONS:
Investment earnings 4,367$
Other income 317
Total additions 4,684
DEDUCTIONS:
Retirement payments 7,200
Total deductions 7,200
Change in net assets (2,516)
Net assets - beginning of year 221,730Net assets - end of year 219,214$
The notes to the financial statements are an integral part of this statement
CITY OF FLAGSTAFF, ARIZONAStatement of Changes in Fiduciary Net Assets
Fiduciary FundsJune 30, 2004
39

40
41
CITY OF FLAGSTAFF, ARIZONA Notes to the Financial Statement
June 30, 2004
I. SUMMARY OF SIGNIFICANT ACCOUNTING POLICIES A. FINANCIAL REPORTING ENTITY The City of Flagstaff (the City) was incorporated as a town in 1894 and as a city in 1928. The current City Charter was approved June 29, 1998. The Charter provides for the Council-Mayor form of government and the authority to provide municipal services, as limited by the State Constitution. The accounting policies of the City of Flagstaff conform to United States of America generally accepted accounting principles (GAAP) as applicable to Governmental Units. The Governmental Accounting Standards Board (GASB) is the accepted standard-setting body for establishing governmental accounting and financial reporting principles. The City of Flagstaff is a municipal corporation governed by an elected Mayor and six-member council. The accompanying financial statements include the City and all of its component, entities for which the government is considered to be financially accountable. Blended component units, although legally separate entities are, in substance, part of the government’s operations and so data from these units are combined with data of the primary government. The discretely presented component unit is reported in a separate column in the Government Wide Statement of Net Assets and Activities to emphasize it is legally separate from the government. The discretely presented component unit year-end is June 30. Blended Component Unit: The Municipal Facilities Corporation (MFC) is a non-profit corporation created by the City for the purpose of constructing, acquiring and equipping municipal facilities. For Financial reporting purposes, transactions of the MFC are included as if it were part of the City’s operations. In fiscal year 2004 the MFC issued $25 million in bonds for construction of the Fourth Street Overpass. The voters approved this debt financing in the May 2000 General Election. These bonds will be repaid with the transportation sales tax that was also approved in the May 2000 Election. Discretely Presented Component Unit: The Greater Flagstaff Economic Council (GFEC) is responsible for planning and encouraging economic growth within the City of Flagstaff’s jurisdiction. GFEC has an eighteen member Board of Directors, of which the Mayor and Vice Mayor are Directors who can directly or indirectly appoint two additional Directors. The remaining members of the Board are voted in by GFEC members. The economic resources of the GFEC are used almost entirely for the benefit of the City’s constituents. Of the $584,164 reported in program revenue, 71.3% ($416,717) was funded by the City of Flagstaff signifying the organization is fiscally dependent on the City. GFEC is presented as a governmental fund type. Complete financial statements for the Greater Flagstaff Economic Council may be obtained at the entity’s office: 1300 South Milton #125, Flagstaff, AZ 86001. Related Organizations: The City of Flagstaff officials are also responsible for appointing board members of other organizations. However, as the City’s control is limited to making the appointments and there is not a significant operational nor a significant financial relationship between these organizations and the City, they are not included as part of these financial statements.

42
B. GOVERNMENT-WIDE AND FUND FINANCIAL STATEMENTS The government-wide financial statements (statement of net assets and statement of activities) report on the City and its component units as a whole, excluding fiduciary activities. Governmental activities, which normally are supported by taxes and intergovernmental revenues, are reported separately from business-type activities, which rely to a significant extent on fees and charges for support. All activities, both governmental and business type, are reported in the government-wide financial statements using the economic resources measurement focus and the accrual basis of accounting, which includes long-term assets and receivables as well as long-term debt and obligations. The government-wide financial statements focus more on the sustainability of the City as an entity and the change in aggregate financial position resulting from the activities of the fiscal period. Generally, the effect of interfund activity has been removed from the government-wide financial statement. Net interfund activity and balances between governmental activities and business-type activities are shown in the government-wide financial statements. Interdepartmental services performed by one department for another are credited to the performing department and charged to the receiving department to reflect the accurate costs of programs. These indirect costs have been included as part of the program expenses reported for the various functional activities. The rates used are intended to reflect full costs in accordance with generally accepted cost accounting principles. The government-wide statement of net assets reports all financial and capital resources of the government (excluding fiduciary funds). It is displayed in a format of assets less liabilities equals net assets, with the assets and liabilities shown in order of their relative liquidity. Net assets are required to be displayed in three components: 1) invested in capital assets, net of related debt, 2) restricted, and 3) unrestricted. Invested in capital assets, net of related debt is capital assets net of accumulated depreciation and reduced by outstanding balances of any bonds, mortgages, notes or other borrowings that are attributable to the acquisition, construction, or improvement of those assets. Restricted net assets are those with constraints placed on their use by either: 1) externally imposed by creditors (such as through debt covenants), grantors, contributors, or law or regulations of other governments, or 2) imposed by law through constitutional provisions or enabling legislation. All net assets not otherwise classified as restricted, are shown as unrestricted. Generally, the City would first apply restricted resources when an expense is incurred for purposes for which both restricted and unrestricted net assets are available. Reservations or designations of net assets imposed by the reporting government, whether by administrative policy or legislative actions of the reporting government, are not shown on the government-wide financial statements. The government-wide statement of activities demonstrates the degree to which the direct expenses of the various functions and segments of the City are offset by program revenues. Direct expenses are those that are clearly identifiable with a specific function or segment. Interest on general long-term debt and depreciation expense on assets shared by multiple functions are not allocated to the various functions. Program revenues include: 1) charges to customers or users who purchase, use or directly benefit from goods, services or privileges provided by a particular function or segment, and 2) grants and contributions that are restricted to meeting the operational or capital requirements of a particular function or segment. Taxes, investment income and other revenues not identifiable with particular functions or segments are included as general revenues. The general revenues support the net costs of the functions and segments not covered by program revenues. Also part of the basic financial statements are fund financial statements for governmental funds, proprietary funds and fiduciary funds, even though the latter are excluded from the government-wide financial statements. The focus of the fund financial statements is on major funds, as defined by GASB Statement No. 34. Although the new model sets forth minimum criteria for determination of major funds (a percentage of assets, liabilities, revenues, or

43
expenditures/expenses of fund category and of the governmental and enterprise funds combined), it also gives governments the option of displaying other funds as major funds. The City has opted to add the Bed, Board, and Booze (BBB) Fund as major fund because of community focus. Other non-major funds are combined in a single column on the fund financial statements and are detailed in combining statements included as supplementary information after the basic financial statements. GASB Statement 34 requires reporting of infrastructure such as roads, bridges, canal systems, ditches, water systems, sewer systems, and recreational assets on a prospective basis effective July 1, 2002 and retrospectively for all major infrastructure assets acquired or constructed since 1980. This reporting is required to be in place by fiscal year 2007. Accordingly, infrastructure assets acquired or constructed beginning in 1980 through June 30, 2002 are not included in the government-wide financial statements.
C. MEASUREMENT FOCUS, BASIS OF ACCOUNTING, AND FINANCIAL STATEMENT PRESENTATION The government-wide financial statements are reported using the economic resources measurement focus and the accrual basis of accounting, as are the proprietary fund and fiduciary fund financial statements. Revenues are recorded when earned and expenses are recorded when a liability is incurred, regardless of the timing of related cash flows. Property taxes are recorded as revenues in the year for which they are levied. Grants and similar items are recognized as revenue as soon as all eligibility requirements imposed by the provider have been met. The governmental fund financial statements are prepared on a current financial resources measurement focus and modified accrual basis of accounting. This is the traditional basis of accounting for governmental funds. This presentation is deemed most appropriate to 1) demonstrate legal and covenant compliance, 2) demonstrate the sources and uses of liquid resources, and 3) demonstrate how the City’s actual revenues, and expenditures conform to the annual budget. Since the governmental fund financial statements are presented on a different basis than the governmental activities column of the governmental-wide financial statements, a reconciliation is provided immediately following each fund statement. These reconciliations explain the adjustments necessary to transform the fund financial statements into the governmental activities column of the government-wide financial statements. The proprietary (enterprise) fund and fiduciary fund financial statements are prepared on the same basis (economic resources measurement focus and accrual basis of accounting) as the government-wide financial statements. Therefore, most lines for the total enterprise funds on the proprietary fund financial statements will directly reconcile to the business-type activities column on the government-wide financial statements. Because the enterprise funds are combined into a single business-type activities column on the government-wide financial statements, certain interfund activities between these funds may be eliminated in the consolidation for the government-wide financial statements, but are included in the fund columns in the proprietary fund financial statements. The City uses funds to report its financial position and the results of its operations. Fund accounting segregates funds according to their intended purpose and is designed to demonstrate legal compliance and to aid financial management by segregating transactions related to certain governmental functions or activities. A fund is a separate accounting entity with a self-balancing set of accounts, which includes assets, liabilities, fund equity, revenues and expenditures/expenses.

44
The City uses the following fund categories: GOVERNMENTAL FUND TYPES Governmental funds are those through which most of the governmental functions of the City are financed. The measurement focus is based upon determination of changes in financial position rather than upon net income determination. General Fund is the primary operating fund of the City. It is used to account for all financial resources except those required to be accounted for in another fund. The General fund will always be considered a major fund in the basic financial statements. Special Revenue Funds are used to account for the proceeds of specific revenue sources (other than special assessments or major capital projects) that are legally restricted to expenditures for specified purposes. There are three special revenue funds that are presented as major funds in the basic financial statements. They are the: Highway User Revenue Fund, which receives and expends the City’s allocation of the Highway User Revenue
money. Monies allocated to this fund must be used for Street construction, reconstruction and maintenance. Transportation Tax Fund that accounts for the receipt and expenditures of the Transportation Tax money.
These monies are restricted to financing improvements in the Areas of the 4th Street overpass project, Safe to School/Pedestrian and Bike projects, Traffic Flow and Safety improvements, and Transit Service operations and enhancements.
Bed, Board and Booze Tax Fund that accounts for the Bed, Board and Booze tax revenues and expenditures. These monies are restricted for use in the areas of Beautification, Economic Development, Tourism, Arts & Science, and Recreation.
Debt Service Funds are used to account for the accumulation of resources for, and the payment of, general long-term obligation principal and interest. Permanent Funds are used to account for resources that are legally restricted to the extent that only earnings, and not principal, may be used for purposes that support the reporting government’s programs. The Perpetual Care Fund accounts for the perpetual care of the City’s cemetery.
PROPRIETARY FUND TYPES Proprietary Funds are used to account for the City’s ongoing organizations and activities, which are similar to those found in the private sector and where cost recovery and the determination of net income is useful or necessary for sound fiscal management. The measurement focus is based upon determination of net income, changes in net assets, financial position, and cash flows. Enterprise Funds are used to account for operations that provide services to the general public for a fee. Under GASB Statement No. 34, enterprise funds are also required for any activity whose principal revenue sources meet any of the following criteria: 1) any activity that has issued debt backed solely by the fees and charges of the activity, 2) if the cost of providing services for an activity, including capital costs such as depreciation or debt service, must legally be recovered through fees and charges, or 3) it is the policy of the City to establish activity fees or charges to recover the cost of providing services, including capital costs. The City has four enterprise funds; three are presented as major funds in the basic financial statements and are used to account for the operation of the City’s water and wastewater system, environmental services, and airport.

45
Private Sector Standards Private-sector standards of accounting and financial reporting issued prior to December 1, 1989, generally are followed in both the government-wide and enterprise fund financial statements to the extent that those standards do not conflict with or contradict guidance of the Governmental Accounting Standards Board. Governments also have the option of following subsequent private-sector guidance for their business-type activities and enterprise funds, subject to this same limitation. The City has elected not to follow subsequent private-sector guidance. FIDUCIARY FUND TYPES Fiduciary Funds are used to account for assets held by the City in a trustee capacity or as an agent for individuals, private organizations, other governmental units, and other funds. The reporting focus is upon net assets and changes in net assets and employs accounting principles similar to proprietary funds. Fiduciary funds are not included in the government-wide financial statements since they are not assets of the City available to support City programs. Firemen’s Pension Fund is a pension trust fund that is used to account for the activity of the City’s single-employer retirement system. This fund is accounted for on the same basis as a proprietary fund, using the same measurement focus and basis of accounting. Non-Current Governmental Assets/Liabilities GASB Statement No. 34 eliminates the presentation of account groups (formerly the general fixed asset account group and the general long-term debt account group). The governmental long-term assets and liabilities continue to be maintained in the account groups for tracking purposes, but are presented with the governmental activities in the government-wide statement of net assets. Basis of Accounting The accounting and financial reporting treatment applied to a fund is determined by its measurement focus. Governmental funds are accounted for using a current financial resources measurement focus whereby only current assets and current liabilities are generally included on the balance sheet. Operating statements present increases (i.e., revenues and other financing sources) and decreases (i.e., expenditures and other financing uses) in net current assets. Enterprise funds and pension trust funds are accounted for on a flow of economic resources measurement focus whereby all assets and liabilities associated with the operation of these funds are included on the balance sheet. Operating statements present increases (i.e., revenues) and decreases (i.e., expenses) in net total assets. The modified accrual basis of accounting is used by governmental funds. Revenues are recognized when susceptible to accrual (i.e., when they become both measurable and available). “Measurable” means the amount of the transaction can be determined and “available” means collectible within the current period or soon enough thereafter to be used to pay liabilities of the current period. The City considers revenues to be available if they are collected within 60 days after year-end. Expenditures are recorded when the related fund liability is incurred. Principal and interest on general long-term debt are recorded as fund liabilities when due or when amounts have been accumulated in the debt service fund for payments to be made early in the following year. Revenues susceptible to accrual include property tax, privilege license tax, highway user tax, state shared sales tax, vehicle license tax, and interest earned on investments. Licenses and permits, charges for services, fines and forfeitures, parks and recreation charges and miscellaneous revenues are recorded when received in cash since they are generally not measurable until actually received.

46
The accrual basis of accounting is followed for all enterprise funds and the pension trust fund, whereby revenues are recognized in the accounting period in which they are earned and become measurable, and expenses are recognized when incurred. Enterprise funds distinguish operating revenues and expenses from non-operating items. Operating revenues and expenses generally result from providing services and producing and delivering goods in connection with the fund’s principal ongoing operations. Operating expenses for enterprise funds include the cost of sales and services, administrative expenses, and depreciation on capital assets. All revenues and expenses not meeting this definition are reported as non-operating items.
D. ASSETS, LIABILITIES, AND NET ASSETS Pooled Cash and Investments The City’s cash and cash equivalents are considered to be cash on hand, demand deposits and short-term investments with original maturities of three months or less from the date of acquisition. State statutes authorized the government to invest in the State’s Local Government Investment Pool, in obligations of the U.S. Treasury, commercial paper and repurchase agreements. Investment Income from pooled cash and investments is allocated monthly based on the percentage of a fund’s average daily equity in pooled cash and investments to the total average daily-pooled equity in pooled cash and investments. Investments are stated at fair value. For purposes of the statement of cash flows, the City considers cash and cash equivalents, including restricted cash and cash equivalents, to be currency on hand, demand deposits with banks, amounts included in pooled cash and investment accounts and liquid investments with a maturity of three months or less when purchased. Cash and cash equivalents are included in both unrestricted as well as restricted assets. Receivables and Payables Accounts receivable and taxes receivable, are shown net of an allowance for uncollectible accounts. The City’s property tax is levied each year on or before the third Monday in August based on the previous January 1, full cash value as determined by the Coconino County Assessor. Levies are due and payable in two installments on September 1 and March 1. First half installments become delinquent on November 1; second half installments become delinquent on May 1. Interest at the rate of 12% per annum accrues following delinquent dates. Coconino County bills and collects all property taxes, at no charge to the taxing entities. A lien against property assessed attaches on the first day of January preceding assessment and levy thereon. Under Arizona tax laws, there are two property tax levies, primary and secondary. Primary property taxes are not restricted as to use and are used to finance the general operations of the City. Secondary property taxes are restricted for general obligation bonded debt service. The secondary property tax levy is recorded as revenue in a debt service fund and transferred to the Water and Wastewater Enterprise Fund, the BBB Fund, the Airport Enterprise Fund and the General Obligation Bond Fund. General Obligation bonds are serviced by each of these funds. For fiscal year 2003-2004, primary and secondary property tax collections amounted to $3,424,657 and $4,628,523 respectively. Inventory Inventory is valued at cost, which approximates market, using the weighted average cost method. Inventory consists of expendable supplies held for consumption and is charged to expenditure accounts as consumed.

47
Restricted Assets Certain debt proceeds of the City’s bonds, as well as certain resources set aside for their repayment, are classified as restricted on the balance sheet, or statement of net assets, because they are maintained in trust accounts and their use is limited by applicable debt covenants. Grant Revenue The City, a recipient of grant revenues, recognizes revenues (net of estimated uncollectible amounts, if any), when all applicable eligibility requirements, including time requirements, are met. Resources transmitted to the City before the eligibility requirements are met are reported as deferred revenues. Some grants and contributions consist of capital assets or resources that are restricted for capital purposes – to purchase, construct, or renovate capital assets associated with a specific program. These are reported separately from grants and contributions that may be used either for operating expenses or for capital expenditures of the program at the discretion of the City. Capital Assets Prior to GASB Statement No. 34, capital assets for governmental funds were recorded in the General Fixed Assets Account Group and were not depreciated. The new reporting model requires that all capital assets, whether owned by governmental activities or business-type activities, be recorded and depreciated (unless the modified approach is used) in the government-wide financial statements. The City has chosen not to apply the modified approach to any networks or subsystems of infrastructure assets. No long-term assets or depreciation are shown in the governmental fund financial statements. Capital assets, including public domain infrastructure (i.e., roads, bridges, curbs and gutters, streets and sidewalks, drainage systems, and other assets that are immovable and of value only to the City) are reported in the applicable governmental or business-type activities columns in the government-wide financial statements. The government defines capital assets as assets with an initial, individual cost of more than $5000 ($25,000 for capital improvement projects and infrastructure assets) and an estimated useful life greater than three years. Such assets are recorded at historical cost if purchased or constructed. Donated capital assets are recorded at estimated fair value at the date of donation. The cost of normal maintenance and repairs that do not add to the value of the asset or materially extend its life, are not capitalized. Major improvements are capitalized and depreciated over the remaining useful lives of the related fixed assets. Major capital outlays for capital assets and improvements are capitalized as projects are constructed. Interest incurred during the construction phase of capital assets of business-type activities is included as part of the capitalized value of the assets constructed, if material. Property, plant and equipment is depreciated using the straight-line method over the following estimated useful lives (land and construction-in-progress are not depreciated): Assets Useful life (years) Buildings 20-50 Improvements 10-20 Machinery and Equipment 5-20 Infrastructure 10-50

48
Committed Construction At June 30, 2004 there were major uncompleted construction contracts as follows:
HURF/Transportation Fund $ 3,427,283 Airport Fund 4,978,322 Water/Wastewater Fund 2,055,669 BBB Fund 1,176,499 $ 11,637,773
Compensated Absences Vacation and sick leave is granted to all regular and part-time employees. The annual amount of vacation time accrued varies depending on years of service. Accumulated vacation leave vests and the City is obligated to make payment if the employee terminates. For the governmental fund financial statements, the current payroll and current portion of the compensated absences are recorded as a current liability of the applicable funds. Long-term liabilities of governmental funds are not shown on the fund financial statements. For the government-wide financial statements, as well as the proprietary fund financial statements, all of the accrued liabilities for compensated absences are recorded as a liability. Sick leave accrues at rates based on the classification of each employee and years of service. Vested (at least 20 years of service) sick leave is payable upon retirement, disability or death of up to 50 percent (not more than 520 hours) of accumulated sick leave. These amounts are also accumulated in the government and business-type fund statements as well as the government-wide statements. Long-Term Obligations In the government-wide financial statements, and enterprise fund types in the fund financial statements, long-term debt and other long-term obligations are reported as liabilities in the applicable statement of net assets. Bond premiums and discounts are deferred and amortized over the life of the bonds using the effective interest method. Bonds payable are reported net of the applicable bond premium or discount. In the fund financial statements, governmental fund types recognize bond premiums and discounts, as well as bond issuance costs in the period in which the bonds are issued. The face amount of debt issued is reported as other financing sources. Premiums received on debt issuance are reported as other financing sources, while discounts on debt issuances are reported as other financing uses. Issuance costs, whether or not withheld from the actual debt proceeds received, are reported as debt service expenditures. Interfund Transactions Interfund transactions, consisting of services performed for other funds or costs billed to other funds are treated as expenditures in the fund receiving the services and as a reimbursement reducing expenditures in the fund performing the services. Exceptions include water sales, sewer charges, and environmental service charges that are recorded as revenue in the enterprise funds and expenses or expenditures in the department receiving the service. In addition, operating transfers are made between funds to shift resources from a fund legally authorized to receive revenue to a fund authorized to expend the revenue. Fund Equity In the fund financial statements, reserved fund equity is defined as that portion of fund equity that has legally been segregated for specific purposes. Designated fund equity is defined as that portion of fund equity for which the City has made tentative plans for future use of financial resources. Unreserved/Undesignated fund equity is defined as that portion of fund equity, which is available for use in a future period.

49
Statement of Cash Flows The City considers all high liquid investments (including restricted assets) with an original maturity of three months or less to be cash equivalents. In a statement of cash flows, cash receipts and payments are classified according to whether they stem from operating, noncapital financing, capital and related financing, or investing activities. Use of Estimates The preparation of the financial statements in conformity with GAAP requires management to make estimates and assumptions that affect the reported amount of assets and liabilities and disclosure of contingent assets and liabilities at the date of the financial statements and the reported amounts of revenues and expenses during the reporting period. Actual results could differ from those estimates. Arbitrage Arbitrage is generated when the a local government temporarily reinvests bond proceeds (generally during construction periods) and interest earnings are generated in excess of the interest due and payable on the bond. While there are certain exceptions in which the local government may keep the excess earnings, most instances require that the local government remit these excess earnings to the federal government. Rebatable amounts are recorded at such time they are actually due and payable to the federal government. The City of Flagstaff did not have any rebatable arbitrage for the year ended June 30, 2004.
II. Reconciliation of government-wide and fund financial statements
A. Explanation of certain differences between the governmental fund balance sheet and the government-wide statement of net assets The governmental fund financial statements are presented on a current financial resources measurement focus and modified accrual accounting basis while the government-wide financial statements are prepared on a long-term economic resources measurement focus and accrual accounting basis. Reconciliation’s briefly explaining the adjustments necessary to transform the fund financial statements into the governmental activities column of the government-wide financial statements immediately follow each fund financial statement. Additional reconciliation’s are provided as shown on the following page:
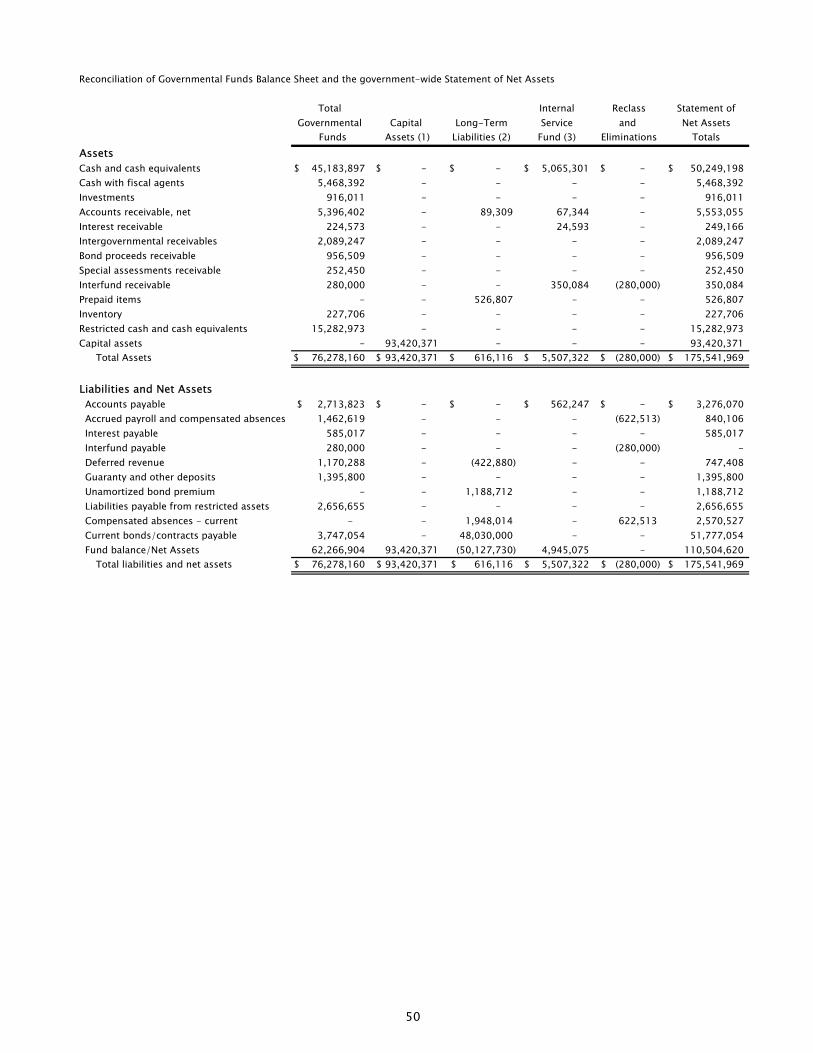
50
Reconciliation of Governmental Funds Balance Sheet and the government-wide Statement of Net Assets
Total Internal Reclass Statement ofGovernmental Capital Long-Term Service and Net Assets
Funds Assets (1) Liabilities (2) Fund (3) Eliminations TotalsAssetsCash and cash equivalents 45,183,897$ -$ -$ 5,065,301$ -$ 50,249,198$ Cash with fiscal agents 5,468,392 - - - - 5,468,392 Investments 916,011 - - - - 916,011 Accounts receivable, net 5,396,402 - 89,309 67,344 - 5,553,055 Interest receivable 224,573 - - 24,593 - 249,166 Intergovernmental receivables 2,089,247 - - - - 2,089,247 Bond proceeds receivable 956,509 - - - - 956,509 Special assessments receivable 252,450 - - - - 252,450 Interfund receivable 280,000 - - 350,084 (280,000) 350,084 Prepaid items - - 526,807 - - 526,807 Inventory 227,706 - - - - 227,706 Restricted cash and cash equivalents 15,282,973 - - - - 15,282,973 Capital assets - 93,420,371 - - - 93,420,371
Total Assets 76,278,160$ 93,420,371$ 616,116$ 5,507,322$ (280,000)$ 175,541,969$
Liabilities and Net Assets Accounts payable 2,713,823$ -$ -$ 562,247$ -$ 3,276,070$ Accrued payroll and compensated absences 1,462,619 - - - (622,513) 840,106 Interest payable 585,017 - - - - 585,017 Interfund payable 280,000 - - - (280,000) - Deferred revenue 1,170,288 - (422,880) - - 747,408 Guaranty and other deposits 1,395,800 - - - - 1,395,800 Unamortized bond premium - - 1,188,712 - - 1,188,712 Liabilities payable from restricted assets 2,656,655 - - - - 2,656,655 Compensated absences - current - - 1,948,014 - 622,513 2,570,527 Current bonds/contracts payable 3,747,054 - 48,030,000 - - 51,777,054 Fund balance/Net Assets 62,266,904 93,420,371 (50,127,730) 4,945,075 - 110,504,620
Total liabilities and net assets 76,278,160$ 93,420,371$ 616,116$ 5,507,322$ (280,000)$ 175,541,969$

51
(1) Capital assets (land, buildings, equipment, etc.) that are to be used in governmental activitiesare purchased or constructed, the costs of those assets are reported as expenditures in governmental funds, and thus a reduction in fund balance. However, the statement of net assetsincludes those capital assets among the assets of the City as a whole.
Costs of capital assets 122,748,890$ Accumulated depreciation (29,328,519)
93,420,371$
(2) Bond issuance costs are expensed when incurred in governmental funds, but are deferred and amortizedover the life of the bonds in the statement of net assets.
Unamortized bond issue costs 526,807$
Certain receivables are not recognized in the govermental funds, but are earned in the statement of net assets.Deferred court receivables 89,309$
Long-term liabilities applicable to the City's governmental activities are not due and payable in thecurrent period, and accordingly are not reported as fund liabilities in the governmental fundstatement. All liabilities, both current and long-term are reported in the statement of net assets.
Bonds payable 52,910,000$ Compensated absences 2,589,072 Unamortized bond premium 1,188,712 Subtotal 56,687,784 Less: current compensated absences 641,058 current portion of bonds 4,880,000
51,166,726$
Deferred revenue for the long-term special assessment receivables and property tax shown on the governmental fund statements is not deferred on the statements of net assets.
Deferred special assessment 252,450$ Deferred property tax 170,430
422,880$ (3) Internal service funds are used by management to charge the costs self insurance
to the individual funds. The assets and liabilities of the internal servicefunds are included in the governmental activities in the statement of net assets, butare not included on the governmental fund balance sheet.

52
B. Explanation of certain differences between the governmental fund statement of revenues, expenditures, and changes in fund balances and the government-wide statement of activities Reconciliation of Governmental Funds Statements of Revenues, Expenditures and Changes in FundBalance and the government-wide Statement of Activities:
Total Capital Long-Term Internal Adjustments Statement ofGovernmental Related Revenues/ Service and Activities
Funds Items (1) Expenses (2) Fund (3) Eliminations TotalsRevenues and Other SourcesTaxes 33,736,154$ -$ (121,554)$ -$ -$ 33,614,600$ Intergovernmental 12,156,451 - - - - 12,156,451 Grants and entitlements 10,940,934 - - - - 10,940,934 Charges for services 1,459,837 - - - - 1,459,837 Special assessments 291,684 - (291,684) - - - Licenses and permits 2,111,033 - - - - 2,111,033 Fines and forfeitures 1,144,562 - (276,951) - - 867,611 Rent 985,907 - - - - 985,907 Investment earnings 115,433 - 381 102,706 - 218,520 Contributions 21,917 4,264,700 - - - 4,286,617 Miscellaneous 905,717 - - - - 905,717
Total revenue 63,869,629 4,264,700 (689,808) 102,706 - 67,547,227
Expenditures/Expenses General governmental 5,335,890 592,159 (61,441) 25,009 - 5,891,617 Public safety 18,015,837 701,965 - 75,030 - 18,792,832 Public works 966,546 205,338 - 6,253 - 1,178,137 Economic and physical development 6,289,966 157,312 1,002 25,010 - 6,473,290 Culture and recreation 7,724,481 940,082 (5,238) 34,389 - 8,693,714 Highways and streets 8,003,110 804,920 44,528 34,389 - 8,886,947 Principal retirement 4,614,000 - (4,614,000) - - - Interest and other charges 2,428,026 - (504,701) - - 1,923,325 Capital outlay 19,348,708 (19,348,708) - - - -
Total expenditures/expenses 72,726,564 (15,946,932) (5,139,850) 200,080 - 51,839,862
OTHER FINANCING SOURCES (USES):Refunding bonds issued 720,000 - (720,000) - - - Bonds issued 25,000,000 - (25,000,000) - - - Payment to bond refunding escrow agent (718,127) - 718,127 - - - Bond (discount) premium 1,059,221 - (1,059,221) - - - Sale of capital assets 634,411 - - - - 634,411 Transfers in 12,996,534 - - - - 12,996,534 Transfers out (13,365,892) - - - - (13,365,892)
Total other financing sources (uses) 26,326,147 - (26,061,094) - - 265,053 Net change for the year 17,469,212$ 20,211,632$ (21,611,052)$ (97,374)$ -$ 15,972,418$

53
(1) When capital assets that are to be used in the governmental activities are purchasedor constructed, the resources expended for those assets are reported as expendituresin governmental funds. However, in the statement of activities, the cost of thoseassets is allocated over their useful lives and reported as depreciation expense. As aresult, fund balance decreases by the amount of the financial resources expended,whereas net assets decrease by the amount of depreciation expense charged for the year.
Capital outlay 19,348,708$ Depreciation expense (3,401,776) Donated assets 4,264,700
20,211,632$
(2) Special assessment principal payments received are reported as revenue on the governmental fundstatements, but are reductions to the outstanding special assessment debt for government-widereporting. Property tax revenue not received within 30 days of year end are deferred for governmental fundreporting, but are not deferred for government-wide reporting.
Special assessment received (291,684)$ Property tax (121,554) Court revenue (276,951)
(690,189)$
The costs of issuing bonds are reported as an expenditure in governmental funds in the year of bond issuance.For the City as a whole, however, the bond issuance costs are deferred and amortized (expensed) over the lifeof the bonds. Issuance costs on bonds issued and refunding 454,614$
Amortization of bond issuance costs (39,420) 415,194$
Some expenses reported in the statement of activities do not require the use of current financialresources and therefore are not reported as expenditures in governmental funds.
Accrual of long-term compensated absences 53,053$
Prepayment of bond principal is reported as an expenditure in governmental funds and thus has the effect ofreducing fund balance because current financial resources have been used. For the City as a whole, however,the principal payments reduce the long-term liabilities in the statement of net assets and do not result in an expense in the statement of activities.
Principal bond payments 4,614,381$ Bond refunding (720,000) Bonds issued (25,000,000) Payment to bond refunding escrow agent 718,127 Bond premium on bonds issued and refunding (1,009,714) Amortization of bond premium 8,096
(21,389,110)$ (3) Internal service funds are used by management to charge the costs of self insurance
to the individual funds. The adjustments for internal service funds "close" thosefunds by charging the additional amounts to participating governmental activities to completely cover the internal service funds' costs for the year.
Revenue 102,706$ Expenditures (200,080)
(97,374)$
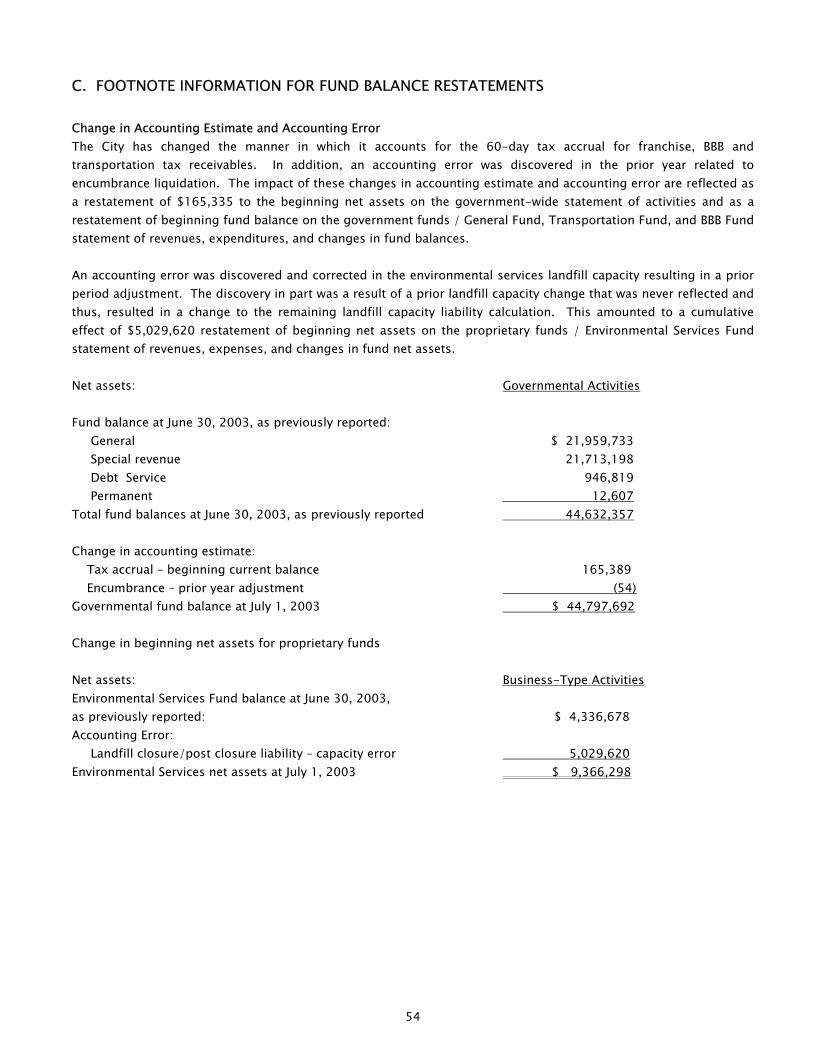
54
C. FOOTNOTE INFORMATION FOR FUND BALANCE RESTATEMENTS Change in Accounting Estimate and Accounting Error The City has changed the manner in which it accounts for the 60-day tax accrual for franchise, BBB and transportation tax receivables. In addition, an accounting error was discovered in the prior year related to encumbrance liquidation. The impact of these changes in accounting estimate and accounting error are reflected as a restatement of $165,335 to the beginning net assets on the government-wide statement of activities and as a restatement of beginning fund balance on the government funds / General Fund, Transportation Fund, and BBB Fund statement of revenues, expenditures, and changes in fund balances. An accounting error was discovered and corrected in the environmental services landfill capacity resulting in a prior period adjustment. The discovery in part was a result of a prior landfill capacity change that was never reflected and thus, resulted in a change to the remaining landfill capacity liability calculation. This amounted to a cumulative effect of $5,029,620 restatement of beginning net assets on the proprietary funds / Environmental Services Fund statement of revenues, expenses, and changes in fund net assets. Net assets: Governmental Activities Fund balance at June 30, 2003, as previously reported: General $ 21,959,733 Special revenue 21,713,198 Debt Service 946,819 Permanent 12,607 Total fund balances at June 30, 2003, as previously reported 44,632,357 Change in accounting estimate: Tax accrual – beginning current balance 165,389 Encumbrance – prior year adjustment (54) Governmental fund balance at July 1, 2003 $ 44,797,692 Change in beginning net assets for proprietary funds Net assets: Business-Type Activities Environmental Services Fund balance at June 30, 2003, as previously reported: $ 4,336,678 Accounting Error: Landfill closure/post closure liability – capacity error 5,029,620 Environmental Services net assets at July 1, 2003 $ 9,366,298

55
III. STEWARDSHIP, COMPLIANCE AND ACCOUNTABILITY A. BUDGETARY INFORMATION Budget Basis of Accounting The City's accounting records for General Government operations (General, Special Revenue, and Debt Service Funds) are maintained on a basis consistent with Generally Accepted Accounting Principles (GAAP) with measurable revenues recorded when they become available to finance expenditures in the current fiscal year. "Available" is defined as: collectible within the current period or soon enough thereafter to be used to pay liabilities of the current period. Expenditures, other than principal and interest on debt, are recognized in the accounting period in which the liability arises. State statute allows for encumbrances to be recognized for a 60-day period following the end of the prior fiscal year as uses of prior year appropriations. To ensure that appropriations do not lapse, departments are directed to re-budget for all items that are expected to be delivered after June 30. For the Enterprise Funds, the annual budget is prepared on a basis that differs from GAAP because state law requires capital purchases and debt service payments to be budgeted as expenses, and bond proceeds and grants that are to be utilized are to be budgeted as revenues. The accounting and budgeting systems for the City are in accordance with Generally Accepted Accounting Principles (GAAP) format, with minimal variances between the two systems. Budget basis for enterprise funds differ primarily due to state laws. The major differences are as follows: • Encumbrances (contractual commitments) are considered the equivalent of expenditures. Encumbrances at
year-end for goods or services, which are not received prior to the end of the fiscal year, are cancelled. • Fund balances reserved to inventory and bonded debt are not included in the budget. • Certain expenditures, such as depreciation and landfill closure and post closure accrual, are not included in the
budget. • All funds except the Internal Service Fund are budgeted. • Enterprise funds budget capital expenditures and debt service payments as expenses. • Enterprise funds budget bond proceeds and grants as revenues. The City will utilize a number of different fund types to segregate the financial activity within the City either due to regulatory reasons or as designated internally. The fund classifications are Governmental funds, Proprietary funds and Fiduciary funds. Review and Approval Issues presented during the review and approval period include discussion topics of the Council fall and spring retreats. The fall and spring retreats were held in November and February respectively, to give City staff the opportunity to present major discussion points to Council and the public. The goal is for Council to make policy decisions and direct staff in preparing the budget. This provides adequate time for the Council to gather input on major budget issues prior to preparation of the budget. The City Council holds Study Sessions in May. The Council reviews and discusses the issue papers included in the Budget Review Book as well as all personnel recommendations, capital equipment recommendations, and the capital improvement plan. The Council arrives at a consensus for all decisions needed. The Study Sessions provide the opportunity for City management, departments and the public to offer information and recommendations to the City Council. The proposed budget is presented to Council for tentative adoption on or before the third Monday in July. Two public hearings are held on the content of the budget. Final adoption occurred on July 1, 2003. State law requires the operating budget to be all-inclusive. Therefore, the budget includes provisions for contingent revenues, e.g., Passengers Facility Charges, and expenditures that cannot be accurately determined when the budget is adopted,
56
e.g., grants. The Resolution adopting the annual budget requires Council authorization for any expenditure from contingencies, as well as transfer of budget authority between departments. The City operates under the State Expenditure Limitation with a one-time adjustment to the base. The adjustment provided for an increase to the base limit to allow for the expenditure of funds resulting from the addition of a 2% Bed, Board, & Booze Tax. Flagstaff is not a Home Rule city. Alternative [Home Rule] Expenditure Control municipalities require voter approval every four years. The Adopted Budget reflects the total funds appropriated. Certain exclusions are allowed by the state [e.g., bond proceeds, debt service, grants] in computing the Expenditure Limitation and this total cannot be exceeded. Budget authority can be transferred between line items within a Division. At year-end, Department budgets are reviewed and budget authority is transferred from contingencies by Resolution as necessary. Additionally, any inter-fund transfer of appropriations requires Council approval. Council can also amend total appropriations for a fund during the year by Resolution as long as there is a corresponding increase/decrease in another fund so that the expenditure limitation is not exceeded.
B. EXCESS OF EXPENDITURES OVER APPROPRIATIONS The City did not realize any excess expenditure over appropriations at the department level (the legal level of budgetary control). However, there were six divisions that did have excess expenditures. In the General Fund, the Capital Improvement Division expenditures exceeded appropriations by $139,978, the Risk Management Division expenditures exceeded appropriations by $1,897, the Community Development Administration Division expenditures exceeded appropriations by $15,177, the Building and Development Services Division expenditures exceeded appropriations by $7,319, and the G.O. Debt Division expenditures exceeded appropriations by $786. These over expenditures were funded by under expenditures of other divisions within their respective department. In the Transportation Fund, the Fourth Street Overpass capital division expenditures exceeded appropriations by $547,173 and the Fourth Street Debt Service division expenditures exceeded appropriations by $486,220. This over expenditure was funded by available fund balance. In the Airport Fund, the Contingencies division expenses exceeded appropriations by $200. This over expense was funded by under expenses in the airport operating division.

57
IV. DETAILED NOTES ON ALL FUNDS AND ACCOUNT GROUPS A. DEPOSITS AND INVESTMENTS The City maintains a cash and investment pool that is available for use by all funds. Each fund type’s portion of this pool is displayed on the government-wide Statement of Net Assets as “Cash and cash equivalents”, “Cash with fiscal agents”, “Investments”, and “Restricted cash and cash equivalents”. At June 30, 2004, the carrying amount of the City’s deposits was $20,490,097 and the bank balance was $19,307,342. The $1,182,755 difference represents deposits in transit, outstanding checks, and other reconciling items at June 30, 2004. Of the City’s deposits, $10,281,715 was covered by federal depository insurance or by collateral held by the City’s agent in the City’s name. The remaining $9.2 million was not collateralized as it was anticipated that funding would transfer to fiscal agents for June 30, 2004 bond payments. As the City was not aware of the transaction delay, the City was not able to notify the banking institution in advance. The bank generally monitors and collateralizes the City balance within 24 hours, so the City was over-collateralized on July 1. The trust department pledges a pool of collateral against all trust deposits it holds. At year-end, the book value of deposits for GFEC, a discretely presented component unit, was $264,539, which was covered by federal depository insurance or by collateral held by the entity’s agent in GFEC’s name. Investments: City resolution and State Statutes authorized the City to invest in obligations of the U.S. Treasury, its agencies and instrumentalities, repurchase agreements, money market accounts, certificates of deposit and the State of Arizona Local Government Investment Pool (LGIP). The LGIP is a part of the State Treasurer’s office. The State Board of Deposit provides oversight for the State Treasurer’s pools, and the LGIP Advisory Committee provides consultation and advice to the Treasurer. The fair value of the participant’s position in the pool approximates the value of that participant pool shares. Those shares are not identified with specific investments and are not subject to custodial credit risk. All other investments were insured or registered in the City’s name, or were held by the City or its agent in the City’s name. It is the City’s policy generally to hold investments until maturity. The fair value of the investments is based on quoted market values. The City has no investments held by a counter party’s trust department or agent. The City is in compliance with the provisions of Statement No. 31 of the Governmental Accounting Standards Board (GASB), Accounting and Financial Reporting for Certain Investments and for External Investment Pools, which require certain investments to be reported at fair value rather than at cost. The City’s investments at June 30, 2004 are summarized below to give an indication of risk assumed by the City at year-end. Category 1 included investments that are insured or registered or for which the securities are held by the City or its agent in the City’s name. Category 2 includes uninsured and unregistered investments for which the securities are held by the financial institution’s trust department or agent in the City’s name. Category 3 includes uninsured and unregistered investments for which the securities are held by the broker of dealer, but not in the City’s name. The City’s investment in the State of Arizona’s local government investment pool is stated at fair value, which also approximates the value of the investment upon withdrawal.

58
At June 30, 2004, the City’s investments included the following:
1 2 3 Fair Amount
U.S. Government Securities 58,149,827$ 14,416,275$ -$ 72,566,102$ Certificate of Deposit 7,409,153 - - 7,409,153 Local Government Securities 126,822 - - 126,822 Municipal Securities 70,000 - - 70,000
65,755,802$ 14,416,275$ -$ 80,172,077
Investments Not Categorized:State of Arizona Investment Pool 9,773,897 Total Investments 89,945,974$
Reconciliation of pooled cash and investments as reported on the Government-wide Statement of Net Assets
Carrying Amount of Investments 89,945,974$ Carrying Amount of Cash Deposits 20,490,097 Total Pooled Cash and Investments 110,436,071$
Pooled Cash and Investments - Unrestricted 79,027,447$ Restricted Cash with Fiscal Agent and Investments 31,408,624 Total Pooled Cash and Investments 110,436,071$
Category

59
B. RECEIVABLES Receivables as of June 30, 2004, including allowances for uncollectible accounts, are as follows:
Intergov- Bond Special Total Fund Accounts Interest ernmental Proceeds Assessments Receivables
Governmental ActivitiesGeneral 4,072,349$ 109,323$ 655,863$ 956,509$ -$ 5,794,044$ Highway User Revenue 637,122 25,605 810,418 - - 1,473,145 Transportation 731,871 46,290 180,396 - - 958,557 BBB 490,319 27,228 18,620 - - 536,167 Other Governmental Funds 487,225 16,127 423,950 - 252,450 1,179,752 Less: Allowance for Uncollectibles (933,175) - - - - (933,175)
Total Government Funds 5,485,711 224,573 2,089,247 956,509 252,450 9,008,490 Internal Services Funds 67,344 24,593 - - - 91,937
Total Governmental Activities 5,553,055 249,166 2,089,247 956,509 252,450 9,100,427
Business-Type ActivitiesWater and Wastewater 2,291,051 126,040 - - - 2,417,091 Environmental Services 815,507 36,589 - - - 852,096 Airport 112,196 2,343 570,971 - - 685,510 Stormwater 20,829 311 9,190 - - 30,330 Less: Allowance for Uncollectibles (60,000) - - - - (60,000)
Total Business-Type Activities 3,179,583 165,283 580,161 - - 3,925,027
Grand Totals 8,732,638$ 414,449$ 2,669,408$ 956,509$ 252,450$ 13,025,454$
C. CAPITAL ASSETS The City has not completed its evaluation of the City’s entire infrastructure as of June 30, 2004, and therefore, is considered to be in a transition period. This period represents the timing between the adoption of the general provisions of GASB Statement No. 34 and when the City begins to report its retroactive major general infrastructure assets. Infrastructure assets currently reported represent assets placed in service since the inception of GASB Statement No. 34, which became instrumental as of June 30, 2003. No infrastructure prior to this date has been accounted for. The City will complete the infrastructure evaluation prior to June 30, 2007.

60
A summary of capital asset activity, for the government-wide financial statements, for the fiscal year ended June 30, 2004 is as follows:
Balance Deletions and Transfers BalancesJuly 1, 2003 Additions Retirements In (out) June 30, 2004
Governmental activities: Non-depreciable assets: Land 9,842,489$ 46,360$ -$ -$ 9,888,849$ Construction -in-progress 11,750,626 15,004,325 - (70,033) 26,684,918 Total non-depreciable assets 21,593,115 15,050,685 - (70,033) 36,573,767
Depreciable assets: Buildings 33,532,760 1,926,435 - - 35,459,195 Improvements 13,235,365 244,454 - 32,068 13,511,887 Machinery and equipment 20,153,228 1,361,030 (358,311) (32,068) 21,123,879 Infrastructure 10,979,326 5,030,803 - 70,033 16,080,162 Total depreciable assets 77,900,679 8,562,722 (358,311) 70,033 86,175,123 Accumulated depreciation: Buildings (9,148,320) (809,613) - - (9,957,933) Improvements (5,472,888) (737,199) - - (6,210,087) Machinery and equipment (11,530,493) (1,489,592) 358,311 - (12,661,774) Infrastructure (133,354) (365,371) - - (498,725) Total accumulated depreciation (26,285,055) (3,401,775) 358,311 - (29,328,519) Governmental activities capitalassets, net 73,208,739$ 20,211,632$ -$ -$ 93,420,371$
Balances Transfers BalancesJuly 01, 2003 Additions Retirements In (out) June 30, 2004
Business-type activities: Non-depreciable assets: Land 2,357,360$ -$ -$ -$ 2,357,360$ Construction -in-progress 6,137,036 5,802,763 - (5,423,432) 6,516,367 Total non-depreciable assets 8,494,396 5,802,763 - (5,423,432) 8,873,727
Depreciable assets: Buildings 72,488,407 27,890 84,006 72,600,303 Improvements 208,510,672 9,688,818 - 1,989,449 220,188,939 Machinery and equipment 14,805,618 1,293,577 (1,141,652) 3,349,977 18,307,520 Total depreciable assets 295,804,697 11,010,285 (1,141,652) 5,423,432 311,096,762 Accumulated depreciation: Buildings (23,328,420) (1,630,892) - - (24,959,312) Improvements (64,013,650) (5,221,084) - - (69,234,734) Machinery and equipment (10,288,874) (1,087,060) 997,730 - (10,378,204) Total accumulated depreciation (97,630,944) (7,939,036) 997,730 - (104,572,250) Business-type activities capitalassets, net 206,668,149$ 8,874,012$ (143,922)$ -$ 215,398,239$

61
Depreciation expense was charged to the governmental functions in the government-wide financial statements as follows:
D. INTERFUND RECEIVABLES, PAYABLES, and TRANSFERS Interfund receivables and payables Net interfund receivables and payables between governmental activities and business-type activities of $350,084 are included in the government-wide financial statements at June 30, 2004. The interfund balances at June 30, 2004 are short-term loans to cover temporary cash deficits in various funds. This occasionally occurs prior to bond sales or grant reimbursements. All interfund balances outstanding at June 30, 2004 are expected to be repaid within one year. The following interfund receivables and payables are included in the fund financial statements at June 30, 2004:
Interfund InterfundFund Receivables PayablesGovernmental Funds:
General 280,000$ -$ Other Governmental Funds - 280,000 Internal Service 94,897 -
Total governmental funds 374,897 280,000 Business-Type Funds:
Water and Wastewater 400,000 - Airport - 494,897
Total enterprise funds 400,000 494,897 Grand Totals 774,897$ 774,897$
General government $ 592,158 Public safety 701,965 Public works 205,338 Economic and physical development 157,312 Culture and recreation 940,082 Highway and streets 804,920 Total depreciation expense - governmental activities $ 3,401,775

62
Transfers The net transfers of $369,358 from governmental activities to business-type activities on the government-wide statement of activities are primarily debt service and operational subsidies from the General Fund. The following transfers are reflected in the fund financial statements for the year ended June 30, 2004:
Fund Transfers out Transfers InGovernmental Funds:
General 4,129,206$ 4,237,210$ Highway User Revenue 975,000 4,681,369 Transportation 3,034,004 - BBB 1,108,895 528,056 Other Governmental Funds 4,118,787 3,549,899
Total governmental funds 13,365,892 12,996,534 Business-Type Funds:
Water and Wastewater 2,018,421 2,018,421 Environmental Services 429,678 15,000 Airport - 611,036 Other Proprietary 62,000 235,000
Total enterprise funds 2,510,099 2,879,457 Grand Totals 15,875,991$ 15,875,991$
E. LEASES Operating Leases Expenditures The City leases library space under a non-cancelable operating lease. The lease is for the East Flagstaff Library. The terms of the contract is for a period of 10 years with adjustments on July 1st to the lease amount based on the prior year change in the Consumer Price Index for the prior year. Fiscal Year 2004 lease expense for the library was $61,924. The schedule below for future minimum lease expenses reflects the change in the rental rate as of July 1, 2004. Fiscal Year Ending June 30
East Flagstaff
Library
2005 $ 63,336 2006 63,336 2007 63,336 2008 63,336 2009 63,336 2010-2013 232,231 Total $ 548,911
The City has entered into several operating lease agreements, with cancellation provisions, for the purpose of leasing office space and land. Lease expenditures for these items for the period ending June 30, 2004 were $119,424.

63
Operating Lease Revenues The City leases several City-owned buildings under cancelable and non-cancelable agreements. The carrying value of the leased assets is $4,976,224 (cost of $5,252,367 less accumulated depreciation of $276,143) with current depreciation of $145,614. Certain leases contain provisions for future rate increases based on changes in the Consumer Price Index. Total revenue for fiscal year 2004 was $890,485. The City currently has one lease with non-cancelable terms that is for USGS building #6, which is guaranteed through August 2013. The following table represents the future minimum lease receivable from the lease with non-cancelable terms. The amounts shown include revenue related to the asset and the operational expenses. Fiscal Year Ending June 30
USGS
Building #6
2005 $ 762,999 2006 763,675 2007 763,675 2008 763,675 2009 763,675 2010-2013 2,418,305 Total $ 6,236,004 In addition, the Airport Fund has several leases under cancelable agreements. The leases are for terminal space, hangars, shades, tiedowns, and ground leases. Lease revenue in the Airport fund for fiscal year 2004 was $716,986. The carrying value of the leased assets is $3,668,356 (cost of $6,508,528 less accumulated depreciation of $2,840,172) with current year deprecation of $149,635.
F. LONG-TERM DEBT General Obligation Bonds The City of Flagstaff issues general obligation bonds to provide funds for the acquisition and construction of major capital facilities. General obligation bonds have been issued for both governmental and business-type activities. The original amount of general obligations bonds issued in prior years was $30,442,848. During the year, $30,054 of accretion had been added to Water and Wastewater General Obligation bonds. General obligation bonds are direct obligations and pledge the full faith and credit of the government. The Water and Wastewater General Obligation Bonds are backed by the ultimate taxing power and general revenues of the City; however, these bonds are carried as a liability of the Water and Wastewater Fund to reflect the intention of the City to retire those bonds from resources in the Water and Wastewater Fund.

64
General obligation bonds outstanding at June 30, 2004 are: Purpose Amount Governmental activities $ 5,075,000 Governmental activities – refunding 720,000 Business type activities 2,147,902 Business type activities – refunding 19,105,000 $27,047,902 General obligation bonds payable at June 30, 2004 are comprised of the following individual issues: Governmental Activities:
$5,500,000 Public Safety Bonds, Series 1997 due in annual installments of $1,105,000 through July 1, 2005; interest at 4.7% to 6.5%.
$ 1,105,000
$4,000,000 Parks and Recreation Bonds, Series 1997 due in annual installments of $405,000 to $465,000 through July 1, 2006; interest rate at 4.6% to 4.8%.
870,000
$3,100,000 Parks and Recreation, Series 2001 due in annual installments of $385,000 to $505,000 through July 1, 2014; interest rate at 4.375% to 4.75%. $720,000 Parks and Recreation Refunding Series 2003 due in annual installments of $255,000 to $465,000 through July 1, 2008; interest rate at 3.0% - 3.25%.
3,100,000
720,000
Total Governmental Activities 5,795,000

65
Business-type activities: Water and Wastewater:
$924,240 Wastewater Improvement Project of 1991 Capital Appreciation Bonds due in three installments: $595,827 due July 1, 1997, plus interest at 5.8%; $124,349 due July 1, 2002, plus interest at 6.3%; $204,064 due July 1, 2007, plus interest at 6.75%. Shown at combined accreted value.
$ 467,902
$8,000,000 Water Improvement Project Bonds Series 1997, due in annual installments of $1,680,000, through July 1, 2013; interest at 4.5%. Fiscal years 2007 – 2012 refunded in December, 2003.
1,680,000
$13,845,000 Water and Wastewater Refunding Bonds Series 2001, due in annual installments of $1,605,000 to $2,355,000 through July 1, 2009; interest at 3% to 5%. 9,895,000 $8,230,000 Water Refunding bond Series 2003, due in annual installments of $190,000 to $1,960,000 through July 1, 2013; interest at 3.0% - 3.25%. 7,760,000Total Water and Wastewater 19,802,902
Airport:
$2,025,000 Airport Refunding Bonds Series 2001 due in annual installments of $235,000 to $345,000 through July 1, 2009; interest at 3% to 5%.
1,450,000
Total Business-type Activities 21,252,902Total General Obligation Bonds $ 27,047,902
Annual debt service requirements to maturity for general obligation bonds are as follows:
Year Ending Governmental Activities Business-type Activities June 30 Principal Interest Principal Interest
2005 $ 1,510,000 $ 256,531 $ 2,405,000 $ 831,643 2006 465,000 185,559 2,495,000 750,293 2007 465,000 163,238 3,042,902 763,714 2008 640,000 149,289 2,795,000 545,350 2009 405,000 124,158 3,055,000 409,988 2010-2014 2,310,000 330,042 7,460,000 696,628 Total $ 5,795,000 $ 1,208,817 $ 21,252,902 $ 3,997,616
Special Assessment Bonds Proceeds from special assessment bonds are used for improvements such as paving, sidewalks, and sewers. Payments made by the assessed property owners are pledged as collateral. In the event of default by a property owner, the lien created by the assessment is sold at public auction and the proceeds are used to offset the defaulted

66
assessment. If there is no purchase at the public auction, the City is required to buy the property with funds appropriated from the General Fund. Special assessment bonds outstanding at June 30, 2004 are: Purpose Amount Governmental Activities $685,000 Special assessment bonds payable at June 30, 2004 are comprised of the following individual issues: Governmental Activities
$1,525,000 1994 Improvement District series bonds due in annual installments of $55,000 to $200,000, through January 1, 2005; interest at 5.7%.
$ 200,000
$720,000 1999 Improvement District series bonds due in annual installments of $43,000 to $94,000, through January 1, 2010; interest at 4.9%. 485,000 Total Special Assessment Bonds $ 685,000
Annual debt service requirements to maturity for special assessment bonds are as follows:
Year Ending Governmental Activities June 30 Principal Interest
2005 $ 270,000 $ 27,750 2006 75,000 18,497 2007 76,000 14,799 2008 82,000 10,927 2009 88,000 6,761 2010 94,000 2,303 Total $ 685,000 $ 81,037
Revenue Bonds Highway User Revenue Fund bonds (HURF) are issued specifically for the purpose of constructing street and highway projects. These bonds are repaid out of the HURF fund by gas tax revenues collected by the State of Arizona and distributed to cities and towns based on a formula of population and gas sales within each county. Water & Sewer Revenue bonds are issued as authorized by the voters for the construction, acquisition, furnishing, and/or equipping of water and sewer facilities and related systems. The Water & Sewer Revenue bonds are collateralized by revenue in excess of operating and maintenance expenses of the City’s water & sewer utility system, and are repaid via user charges or fees for service.

67
Revenue bonds outstanding at June 30, 2004 are: Purpose Amount Governmental activities $ 5,580,000 Governmental activities – refunding 7,800,000 Business type activities 6,290,440 $19,670,440 Revenue bonds at June 30, 2004 are comprised of the following individual issues: Governmental Activities: Street Construction:
$5,580,000 Junior Lien Street and Highway User Revenue Bonds, Series 1992 serial bonds due in installments of $350,000 to $1,725,000 through July 1, 2012; interest at 6.12%. $9,375,000 Street and Highway Revenue Refunding Bond Series 2003 serial bonds due in installments of $165,000 to $1,940,000 through July 1, 2009; interest at 2% to 3.5%
$ 5,580,000
7,800,000
Total Governmental Activities 13,380,000 Business-type Activities: Water & Sewer:
$6,775,760 Water and Wastewater Revenue Bonds due in annual installments of $238,431 to $462,398 through July 1, 2022; interest at 3.548%. 6,290,440 Total Revenue Bonds $ 19,670,440
Annual debt service requirements to maturity for revenue bonds are as follows:
Year Ending Governmental Activities Business-type Activities June 30 Principal Interest Principal Interest
2005 $ 1,825,000 $ 571,910 $ 255,648 $ 223,153 2006 1,890,000 526,285 264,717 214,084 2007 1,940,000 469,585 274,108 204,693 2008 1,400,000 411,385 283,832 194,969 2009 1,460,000 344,010 293,900 184,901 2010-2014 4,865,000 565,465 1,633,492 760,514 2015-2019 - - 1,944,532 449,474 2020-2023 - - 1,340,211 96,193 Total $ 13,380,000 $ 2,888,640 $ 6,290,440 $ 2,327,981

68
Other Debt Municipal Facility Corporation Bonds The Municipal Facilities Corporation (MFC) is a non-profit corporation created by the City for the purpose of constructing, acquiring and equipping municipal facilities. In fiscal year 2001 the MFC issued $4.7 million in bonds for the construction of a new United States Geological Survey (USGS) facility on land owned by the City. In fiscal year 2004, the MFC issued $25 million in bonds for the construction of the Fourth Street Overpass on land owned by the City. The City will make lease payments equal to the debt service on both issues and will obtain legal title upon payment in full of the bonds. The City has collateralized the contracts payable to the MFC by a pledge of the City’s State Shared Revenues which comprise sales and income taxes imposed and collected by the State and distributed to counties and municipal governments pursuant to law and State revenue-sharing which the City presently or in the future receives from the State and which are not earmarked by the State for a contrary or inconsistent purpose. Municipal facility corporation bonds outstanding at June 30, 2004 are: Purpose Amount Governmental Activities $28,170,000 Municipal facility corporation bonds are comprised of the following issue:
$4,700,000 USGS Project Bonds Series 12 (2001) due in annual installments of $255,000 to $440,000 through August 1, 2016; interest at 4% to 4.75%
$ 4,180,000 $25,000,000 Fourth Street Municipal Facility Corporation Revenue Bonds, Series 2003 due in annual installments of $1,000,000 to $2,145,000 through July 1, 2020; interest at 2% to 5.25%.
23,990,000
Total Other Debt $ 28,170,000
Year Ending Governmental Activities June 30 Principal Interest
2005 $ 1,275,000 $ 1,223,699 2006 1,285,000 1,162,699 2007 1,295,000 1,128,799 2008 1,315,000 1,094,499 2009 1,375,000 1,031,385 2010-2014 9,360,000 4,241,973 2015-2020 12,265,000 2,213,025 Total $ 28,170,000 $ 12,096,079
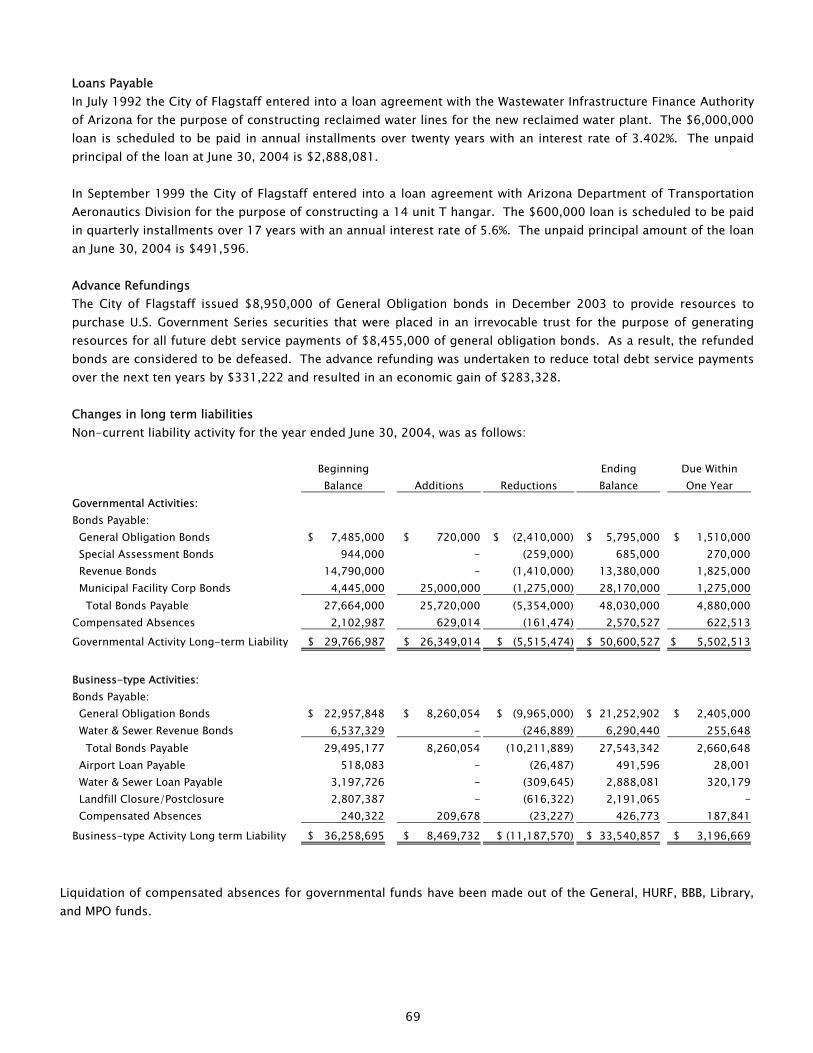
69
Loans Payable In July 1992 the City of Flagstaff entered into a loan agreement with the Wastewater Infrastructure Finance Authority of Arizona for the purpose of constructing reclaimed water lines for the new reclaimed water plant. The $6,000,000 loan is scheduled to be paid in annual installments over twenty years with an interest rate of 3.402%. The unpaid principal of the loan at June 30, 2004 is $2,888,081. In September 1999 the City of Flagstaff entered into a loan agreement with Arizona Department of Transportation Aeronautics Division for the purpose of constructing a 14 unit T hangar. The $600,000 loan is scheduled to be paid in quarterly installments over 17 years with an annual interest rate of 5.6%. The unpaid principal amount of the loan an June 30, 2004 is $491,596. Advance Refundings The City of Flagstaff issued $8,950,000 of General Obligation bonds in December 2003 to provide resources to purchase U.S. Government Series securities that were placed in an irrevocable trust for the purpose of generating resources for all future debt service payments of $8,455,000 of general obligation bonds. As a result, the refunded bonds are considered to be defeased. The advance refunding was undertaken to reduce total debt service payments over the next ten years by $331,222 and resulted in an economic gain of $283,328. Changes in long term liabilities Non-current liability activity for the year ended June 30, 2004, was as follows: Beginning Ending Due Within Balance Additions Reductions Balance One Year Governmental Activities: Bonds Payable: General Obligation Bonds $ 7,485,000 $ 720,000 $ (2,410,000) $ 5,795,000 $ 1,510,000 Special Assessment Bonds 944,000 - (259,000) 685,000 270,000 Revenue Bonds 14,790,000 - (1,410,000) 13,380,000 1,825,000 Municipal Facility Corp Bonds 4,445,000 25,000,000 (1,275,000) 28,170,000 1,275,000 Total Bonds Payable 27,664,000 25,720,000 (5,354,000) 48,030,000 4,880,000 Compensated Absences 2,102,987 629,014 (161,474) 2,570,527 622,513
Governmental Activity Long-term Liability $ 29,766,987 $ 26,349,014 $ (5,515,474) $ 50,600,527 $ 5,502,513
Business-type Activities: Bonds Payable: General Obligation Bonds $ 22,957,848 $ 8,260,054 $ (9,965,000) $ 21,252,902 $ 2,405,000 Water & Sewer Revenue Bonds 6,537,329 - (246,889) 6,290,440 255,648 Total Bonds Payable 29,495,177 8,260,054 (10,211,889) 27,543,342 2,660,648 Airport Loan Payable 518,083 - (26,487) 491,596 28,001 Water & Sewer Loan Payable 3,197,726 - (309,645) 2,888,081 320,179 Landfill Closure/Postclosure 2,807,387 - (616,322) 2,191,065 - Compensated Absences 240,322 209,678 (23,227) 426,773 187,841
Business-type Activity Long term Liability $ 36,258,695 $ 8,469,732 $ (11,187,570) $ 33,540,857 $ 3,196,669
Liquidation of compensated absences for governmental funds have been made out of the General, HURF, BBB, Library, and MPO funds.
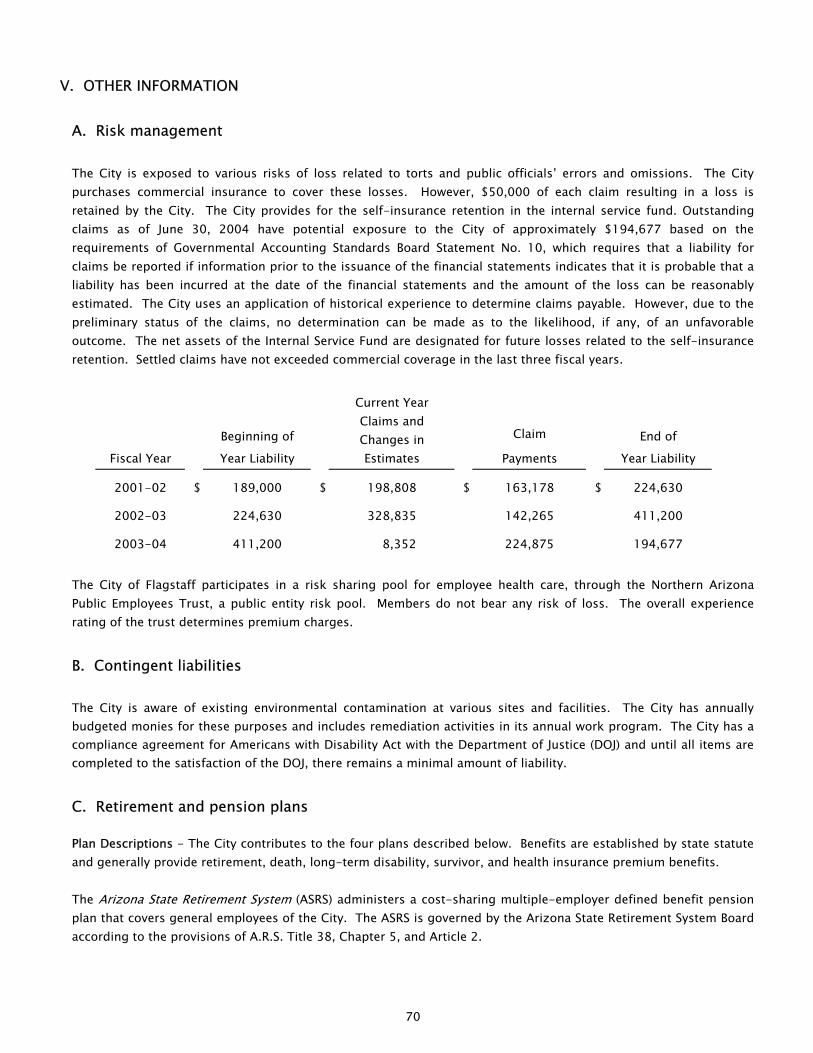
70
V. OTHER INFORMATION A. Risk management The City is exposed to various risks of loss related to torts and public officials’ errors and omissions. The City purchases commercial insurance to cover these losses. However, $50,000 of each claim resulting in a loss is retained by the City. The City provides for the self-insurance retention in the internal service fund. Outstanding claims as of June 30, 2004 have potential exposure to the City of approximately $194,677 based on the requirements of Governmental Accounting Standards Board Statement No. 10, which requires that a liability for claims be reported if information prior to the issuance of the financial statements indicates that it is probable that a liability has been incurred at the date of the financial statements and the amount of the loss can be reasonably estimated. The City uses an application of historical experience to determine claims payable. However, due to the preliminary status of the claims, no determination can be made as to the likelihood, if any, of an unfavorable outcome. The net assets of the Internal Service Fund are designated for future losses related to the self-insurance retention. Settled claims have not exceeded commercial coverage in the last three fiscal years.
Fiscal Year
Beginning of
Year Liability
Current Year Claims and Changes in Estimates
Claim
Payments
End of
Year Liability
2001-02 $ 189,000 $ 198,808 $ 163,178 $ 224,630
2002-03 224,630 328,835 142,265 411,200
2003-04 411,200 8,352 224,875 194,677
The City of Flagstaff participates in a risk sharing pool for employee health care, through the Northern Arizona Public Employees Trust, a public entity risk pool. Members do not bear any risk of loss. The overall experience rating of the trust determines premium charges.
B. Contingent liabilities The City is aware of existing environmental contamination at various sites and facilities. The City has annually budgeted monies for these purposes and includes remediation activities in its annual work program. The City has a compliance agreement for Americans with Disability Act with the Department of Justice (DOJ) and until all items are completed to the satisfaction of the DOJ, there remains a minimal amount of liability.
C. Retirement and pension plans Plan Descriptions - The City contributes to the four plans described below. Benefits are established by state statute and generally provide retirement, death, long-term disability, survivor, and health insurance premium benefits. The Arizona State Retirement System (ASRS) administers a cost-sharing multiple-employer defined benefit pension plan that covers general employees of the City. The ASRS is governed by the Arizona State Retirement System Board according to the provisions of A.R.S. Title 38, Chapter 5, and Article 2.
71
The Public Safety Personnel Retirement System (PSPRS) is an agent multiple-employer defined benefit pension plan that covers public safety personnel who are regularly assigned hazardous duty as employees of the State of Arizona or one of its political subdivisions. The PSPRS, acting as a common investment and administrative agent, is governed by a five-member board, known as The Fund Manager, and the participating local boards according to the provisions of A.R.S. Title 38, Chapter 5, Article 4. The Elected Officials Retirement Plan (EORP) is a cost-sharing multiple-employer defined benefit pension plan that covers elected officials and judges of certain state and local governments. The EORP is governed by The Fund Manager of PSPRS according to the provisions of A.S.R. Title 38, Chapter 5, and Article 3. Each plan issues a publicly available financial report that includes its financial statements and required supplementary information. A report may be obtained by writing or calling the applicable plan. ASRS PSPRS and EORP 3300 N. Central Ave. 1020 E. Missouri Ave. P.O. Box 33910 Phoenix, AZ 85014 Phoenix, AZ 85067-3910 (602) 240-2200/(800) 621-3778 (602) 255-5575 Funding Policy - The Arizona State Legislature establishes and may amend active plan members' and the City's contribution rates. Cost Sharing Plans - For the year ended June 30, 2004, active ASRS members and the City were each required by statute to contribute at the actuarially determined rate of 5.70% (5.20% retirement and 0.50% long-term disability) of the members' annual covered payroll. The City's contributions to ASRS for the years ended June 30, 2004, 2003, and 2002 were $1,170,656, $578,235 and $488,126, respectively, which were equal to the required contributions for the year. In addition, active EORP members were required by statute to contribute 7.00% of the members' annual covered payroll. The City was required to contribute 14.54% of the members' annual covered payroll, as determined by actuarial valuation. The City's contributions to EORP for the years ended June 30, 2004, 2003, and 2002 were $3,804, $1,861 and $3,928 respectively, which were equal to the required contributions for the year. In addition, a payment of $4,220 was made in each year as an installment due for its unfunded accrued liability. Agent Plan - For the year ended June 30, 2004, active PSPRS members were required by statute to contribute 7.65% of the members' annual covered payroll, and the City was required to contribute at the actuarially determined rate of 11.78% and 9.05 % for Police and Fire respectively.

72
Annual Pension Cost - The City's pension cost for the agent plan for the year ended June 30, 2003, the date of the most recent actuarial valuation, and related information follow.
Contribution rates: PSPRS City – Police 11.78% City – Fire 9.05% Plan members 7.65% Annual pension cost $ 636,801 Contributions made $ 636,801 Actuarial valuation date 6/30/04 Actuarial cost method Individual entry age Actuarial assumptions: Investment rate of return 9.0% Projected salary increases 6.5% - 9.5% Includes inflation at 5.5% Amortization method Level percentage open Remaining amortization period from 7-1-00
20 years
Asset valuation method Smoothed market value Trend Information - Information for the agent plan as of most recent actuarial valuations follows.
Contributions Required and Contributions Made
Plan
Annual Pension Cost (APC)
Percentage of APC Contributed
Net Pension Obligation
PSPRS 2004
Police $443,928 100% $ -0-
Fire 192,873 100% -0-
PSPRS 2003
Police 199,908 100% -0-
Fire 78,897 100% -0-
PSPRS 2002
Police 252,029 100% -0-
Fire 126,024 100% -0-
Funding Progress - An analysis of funding progress for each of the agent plans as of the most recent actuarial valuations, June 30, 2003 follows.
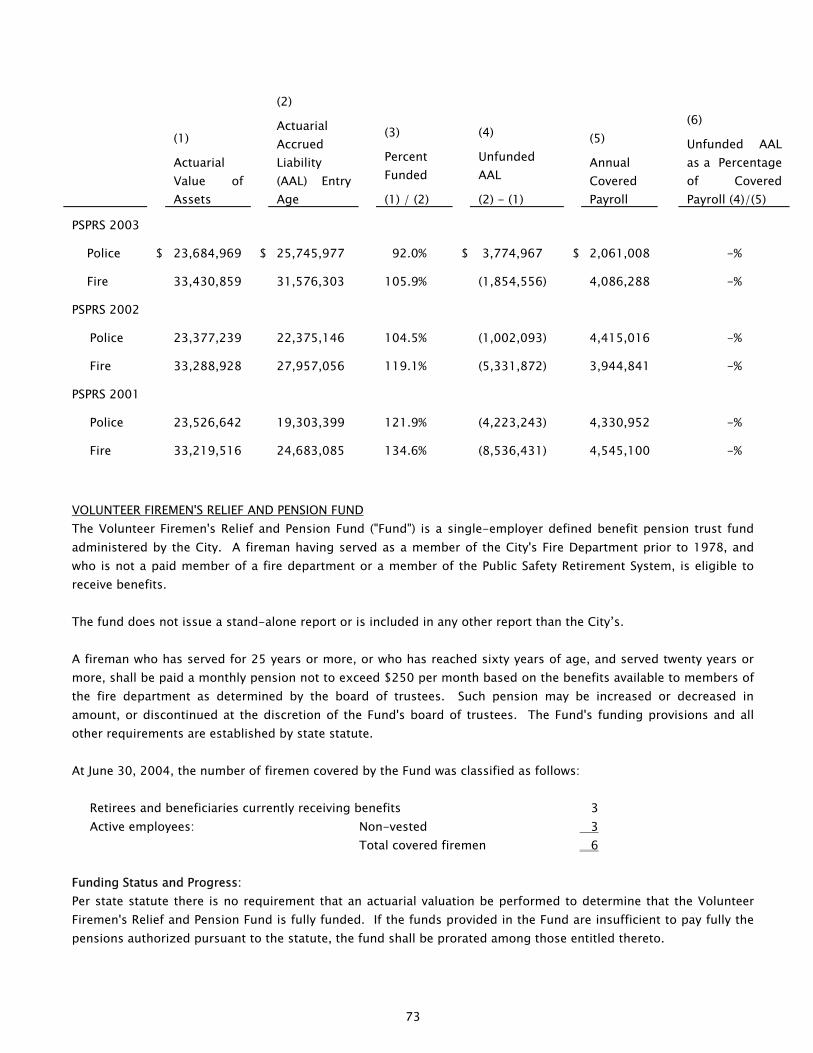
73
VOLUNTEER FIREMEN'S RELIEF AND PENSION FUND The Volunteer Firemen's Relief and Pension Fund ("Fund") is a single-employer defined benefit pension trust fund administered by the City. A fireman having served as a member of the City's Fire Department prior to 1978, and who is not a paid member of a fire department or a member of the Public Safety Retirement System, is eligible to receive benefits. The fund does not issue a stand-alone report or is included in any other report than the City’s. A fireman who has served for 25 years or more, or who has reached sixty years of age, and served twenty years or more, shall be paid a monthly pension not to exceed $250 per month based on the benefits available to members of the fire department as determined by the board of trustees. Such pension may be increased or decreased in amount, or discontinued at the discretion of the Fund's board of trustees. The Fund's funding provisions and all other requirements are established by state statute. At June 30, 2004, the number of firemen covered by the Fund was classified as follows: Retirees and beneficiaries currently receiving benefits 3 Active employees: Non-vested 3 Total covered firemen 6 Funding Status and Progress: Per state statute there is no requirement that an actuarial valuation be performed to determine that the Volunteer Firemen's Relief and Pension Fund is fully funded. If the funds provided in the Fund are insufficient to pay fully the pensions authorized pursuant to the statute, the fund shall be prorated among those entitled thereto.
(1)
Actuarial Value of Assets
(2)
Actuarial Accrued Liability (AAL) Entry Age
(3)
Percent Funded
(1) / (2)
(4)
Unfunded AAL
(2) - (1)
(5)
Annual Covered Payroll
(6)
Unfunded AAL as a Percentage of Covered Payroll (4)/(5)
PSPRS 2003
Police $ 23,684,969 $ 25,745,977 92.0% $ 3,774,967 $ 2,061,008 -%
Fire 33,430,859 31,576,303 105.9% (1,854,556) 4,086,288 -%
PSPRS 2002
Police 23,377,239 22,375,146 104.5% (1,002,093) 4,415,016 -%
Fire 33,288,928 27,957,056 119.1% (5,331,872) 3,944,841 -%
PSPRS 2001
Police 23,526,642 19,303,399 121.9% (4,223,243) 4,330,952 -%
Fire 33,219,516 24,683,085 134.6% (8,536,431) 4,545,100 -%

74
Contributions: State statute requires a 5% contribution of annual compensation each from the City and the employee. Because no compensation was paid by the City to volunteer firemen, no contribution was made during the current fiscal year. No member or City contributions have been made to this fund since fiscal year ended June 30, 1979. Trend Information: Trend information for ten years is presented below:
Revenues
Expenses
Fiscal Year
June 30
Net Assets Available
for Benefits
Employee Contributions
Employer Contributions
Investment Income
Other Income
Benefit Payments
1995 $ 209,232 $ - $ - $ 11,396 $ 166 $ 4,8001996 211,198 - - 11,390 177 9,6011997 213,721 - - 11,922 201 9,6001998 216,843 - - 12,332 390 9,6001999 218,401 - - 11,068 89 9,6002000 221,678 - - 12,877 - 9,6002001 226,593 - - 13,620 96 8,8002002 226,632 - - 7,125 114 7,2002003 221,202 - - 4,630 122 7,2002004 218,208 - - 4,367 318 7,200
D. Landfill closure and postclosure care cost State and federal laws and regulations require the City to place a final cover on its Cinderlake landfill site when it stops accepting waste and to perform certain maintenance and monitoring functions at the site for thirty years after closure. In addition to operating expenses related to current activities of the landfill, an expense provision and related liability are being recognized based on the future closure and postclosure care costs that will be incurred near or after the date the landfill no longer accepts waste. The City reports a portion of these closures and postclosure care costs as an operating expense in each period based on landfill capacity used as of each balance sheet date. The estimated liability for landfill closure and postclosure care costs has a balance of $7,080,554 as of June 30, 2004, which is based on 52 percent usage of the landfill. The remaining $6,525,478 will be accrued over the remaining life of the landfill, which is currently estimated to be 18 years. The accrual for these closure and postclosure care costs for fiscal year 2004 was $(46,513), which reflects a decrease in liability due to the correction of accounting estimate for the landfill capacity. Based on current estimates for landfill closure and postclosure care costs, the City is setting aside legally restricted funds to insure sufficient funds will be available to meet these requirements. The City makes annual contributions to finance closure and postclosure care costs; at June 30, 2004 the balance of the investments held for those purposes is $4,875,315. These investments are reported as restricted cash and investments in the City’s Environmental Service Fund, and are held by the State of Arizona Local Government Investment Pool. The estimated total current cost of the landfill closure and postclosure care, $13,606,033, is based on the amount that would be paid if all equipment, facilities, and services required to care, monitor and maintain the landfill were acquired as of June 30, 2004. However, the actual cost of closure and postclosure care may be higher or lower due to other factors such as; inflation, changes in technology, or changes in landfill laws and regulations.

75
According to state and federal laws and regulations, the City must comply with the local government financial test requirements that assure the City can meet the cost of landfill closure, post-closure and corrective action when needed. The City, which has pledged its full faith and credit to meet state financial responsibility requirements, is in compliance with these requirements. In March of 1999, the City purchased 343.9 acres of land from the Forest Service. This land is adjacent to the existing landfill and will be used to open additional cells as needed. As these cells are utilized, additional liabilities for closure and postclosure care requirements will be accrued. The City applied existing policy to the Environmental Services Fund increasing its’ expenditures as City residential and commercial collection programs are now charged for landfill fees.

76
NON-MAJOR FUNDS
OTHER GOVERNMENTAL FUNDS
Special Revenue Funds Special Revenue Funds are used to account for revenues derived from specific taxes or other earmarked revenue sources. They are usually required by statute, charter provision or ordinance to finance particular functions or activities. Library Fund
The City Library is financed through City sales tax allocations, State and County grants and individual contributions. Funds provided must be used for library activities such as cultural and educational programs and technical services.
Real Estate Proceeds Fund This fund was established by the City Council by resolution in fiscal year 1985-86 to account for the proceeds received from the sale of excess real estate.
Community Redevelopment This fund was established in fiscal year 1997 to account for the funding received for the Community Development Block Grant program and affordable housing activities.
Metropolitan Planning Organization This fund was established in fiscal year 1997 to account for funding derived from the City’s status as a Metropolitan Planning Organization.
Debt Service Funds Debt service funds are used to account for the accumulation of resources for, and the payment of, general long-term debt principal, interest and related costs. General Obligation Bond
This fund accounts for the accumulation of resources for and the payments of principal, interest and costs of General Obligation Bonds.
Special Assessment Bond Fund This fund accounts for the accumulation of resources for and the payment of principal, interest and related costs for all improvement district bonds issued by the City.
Secondary Property Tax Revenue Fund This fund is used to account for secondary property tax revenues. Monies received by this fund are legally restricted to payment of general obligation debt.
Permanent Fund Permanent funds are used to account for resources that are legally restricted to the extent that only earnings, and not principal, may be used for purposes that support the reporting government’s programs. Perpetual Care
This fund accounts for the perpetual care of the City’s cemetery.
77
NON-MAJOR FUNDS
PROPRIETARY FUNDS
Enterprise Funds Enterprise funds are used to account for operations that provide services to the general public for a fee. Stormwater fund
This fund is to minimize public and private losses due to flood conditions within the City of Flagstaff, and to comply with the applicable stormwater regulations.
78

79

Library FundReal Estate
Proceeds Fund
Community Redevelopment
Fund
Metropolitan Planning
Organization Fund
ASSETS
Cash and cash equivalents 930,994$ 900,921$ 1,673,351$ 20,117$
Cash with fiscal agents - - - -
Accounts receivable, net 277,739 144,101 51,060 13,750
Interest receivable 5,986 4,803 5,239 -
Intergovernmental receivables - - 174,384 249,566
Special assessments receivable - - - -
Restricted cash and cash equivalents 766,083 - - - Total assets 1,980,802$ 1,049,825$ 1,904,034$ 283,433$
LIABILITIES AND FUND BALANCE
Liabilities:
Accounts payable 48,061$ -$ 78,801$ 92$
Accrued payroll and compensated absences 63,901 - - 3,341
Current bonds payable - - 402,054 -
Interest payable - - - -
Interfund payable - - - 280,000
Deferred revenue - 143,238 - -
Liabilities payable from restricted assets 1,043,822 - - -
Total liabilities 1,155,784 143,238 480,855 283,433
Fund balances:
Reserved for:
Debt service - - - -
Perpetual care - - - -
Unreserved, undesignated, reported in:
Special revenue funds 825,018 906,587 1,423,179 -
Permanent fund - - - -
Total fund balances 825,018 906,587 1,423,179 -Total liabilities and fund balances 1,980,802$ 1,049,825$ 1,904,034$ 283,433$
Special Revenue Funds
CITY OF FLAGSTAFF, ARIZONACombining Balance Sheet
Non-Major Governmental FundsJune 30, 2004
80

Permanent Fund
General Obligation Bond
Fund
Special Assessment Bond Fund
Secondary Property Tax
Revenue Fund Perpetual Care
Total Other Governmental
Funds
11,730$ 533,319$ 1,106,809$ 567$ 5,177,808$
1,825,519 15,868 - - 1,841,387
- - - 575 487,225
- - - 99 16,127
- - - - 423,950
- 252,450 - - 252,450
- - - 26,433 792,5161,837,249$ 801,637$ 1,106,809$ 27,674$ 8,991,463$
-$ 1,063$ -$ -$ 128,017$
- - - - 67,242
1,670,000 - - - 2,072,054
155,519 16,143 - - 171,662
- - - - 280,000
- 252,450 - - 395,688
- - - - 1,043,822
1,825,519 269,656 - - 4,158,485
11,730 531,981 1,106,809 - 1,650,520
- - - 27,107 27,107
- - - - 3,154,784
- - - 567 567
11,730 531,981 1,106,809 27,674 4,832,9781,837,249$ 801,637$ 1,106,809$ 27,674$ 8,991,463$
Debt Service Funds
81

Library FundReal Estate
Proceeds Fund
Community Redevelopment
Fund
Metropolitan Planning
Organization Fund
REVENUES:
Taxes -$ -$ -$ -$
Grants and entitlements 1,953,851 - 359,503 331,411
Special assessments - - - -
Investment earnings 20,429 30,942 15,904 -
Contributions - - - -
Miscellaneous 73,472 879 196,607 -
Total revenues 2,047,752 31,821 572,014 331,411
EXPENDITURES:
Current:
Economic and physical development - 9,649 721,565 331,411
Culture and recreation 2,925,280 - - -
Debt service:
Principal retirement - - - -
Interest and other charges - - - -
Total expenditures 2,925,280 9,649 721,565 331,411
Excess (deficiency) of revenues over expenditures (877,528) 22,172 (149,551) -
OTHER FINANCING SOURCES (USES):
Sale of capital assets - 13,418 568,323 -
Transfers in 1,155,256 - 375,400 -
Transfers out - (150,000) - -
Total other financing sources (uses) 1,155,256 (136,582) 943,723 -
Net change in fund balances 277,728 (114,410) 794,172 -
Fund balances, beginning of year 547,290 1,020,997 629,007 -
Fund balances, end of year 825,018$ 906,587$ 1,423,179$ -$
Year Ended June 30, 2004
Special Revenue Funds
CITY OF FLAGSTAFF, ARIZONACombining Statement of Revenues, Expenditures, and Changes in Fund Balances
Non-Major Governmental Funds
82
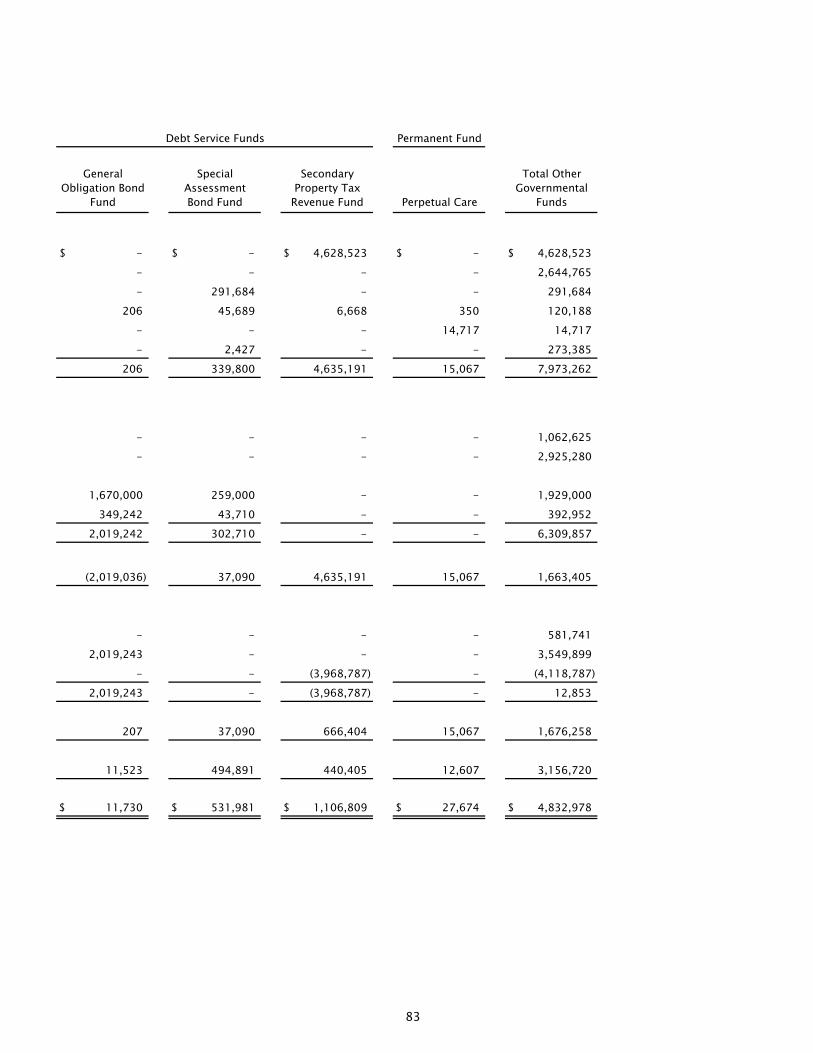
Permanent Fund
General Obligation Bond
Fund
Special Assessment Bond Fund
Secondary Property Tax
Revenue Fund Perpetual Care
Total Other Governmental
Funds
-$ -$ 4,628,523$ -$ 4,628,523$
- - - - 2,644,765
- 291,684 - - 291,684
206 45,689 6,668 350 120,188
- - - 14,717 14,717
- 2,427 - - 273,385
206 339,800 4,635,191 15,067 7,973,262
- - - - 1,062,625
- - - - 2,925,280
1,670,000 259,000 - - 1,929,000
349,242 43,710 - - 392,952
2,019,242 302,710 - - 6,309,857
(2,019,036) 37,090 4,635,191 15,067 1,663,405
- - - - 581,741
2,019,243 - - - 3,549,899
- - (3,968,787) - (4,118,787)
2,019,243 - (3,968,787) - 12,853
207 37,090 666,404 15,067 1,676,258
11,523 494,891 440,405 12,607 3,156,720
11,730$ 531,981$ 1,106,809$ 27,674$ 4,832,978$
Debt Service Funds
83

Stormwater FundTotal Other
Proprietary Fund
ASSETS
Current assets:
Cash and cash equivalents 218,893$ 218,893$
Accounts receivable, net 20,829 20,829
Interest receivable 311 311
Intergovernmental receivables 9,190 9,190
Total current assets 249,223 249,223Noncurrent assets:
Capital assets, non-depreciable 128,799 128,799
Capital assets, depreciable, net 267,047 267,047
Total non-current assets 395,846 395,846
Total assets 645,069 645,069
LIABILITIES
Current liabilities:
Accounts payable 79,551 79,551
Accrued payroll and compensated absences 6,956 6,956
Total current liabilities 86,507 86,507
Noncurrent liabilities:
Compensated absences 3,278 3,278
Total noncurrent liabilities 3,278 3,278
Total liabilities 89,785 89,785
NET ASSETSInvested in capital assets, net of related debt 395,846 395,846Restricted:
Unrestricted 159,438 159,438 Total net assets 555,284$ 555,284$
CITY OF FLAGSTAFF, ARIZONACombining Statement of Net Assets
Non-Major Proprietary FundJune 30, 2004
84

Stormwater FundTotal Other
Proprietary Fund
OPERATING REVENUES:
Charges for services 546,807$ 546,807$
Total operating revenues 546,807 546,807
OPERATING EXPENSES:
Personal services 254,437 254,437
Contractual services, materials and supplies 201,540 201,540
Depreciation and amortization 1,833 1,833
Total operating expenses 457,810 457,810
Operating income (loss) 88,997 88,997
NON-OPERATING REVENUES (EXPENSES):
Interest and investment income 831 831
Grants and entitlements 23,576 23,576
Total non-operating revenues (expenses) 24,407 24,407
Income (loss) before capital contributions and transfers 113,404 113,404
Capital contributions 268,880 268,880
Transfers in 235,000 235,000
Transfers out (62,000) (62,000)
Change in net assets 555,284 555,284
Total net assets, beginning of year - -
Total net assets, end of year 555,284$ 555,284$
CITY OF FLAGSTAFF, ARIZONACombining Statement of Revenues, Expenses, and Changes in Fund Net Assets
Non-Major Proprietary FundYear Ended June 30, 2004
85

StormwaterTotal Other
Proprietary Fund Cash flows from operating activities: Receipts from customers 525,978$ 525,978$ Payments to suppliers (121,989) (121,989) Payments to employees (244,203) (244,203) Net cash provided (used) by operating activities 159,786 159,786
Cash flows from noncapital financing activities: Transfer from other funds (62,000) (62,000) Transfer to other funds 235,000 235,000 Net cash provided (used) by noncapital financing activities 173,000 173,000
Cash flows from capital and related financing activities: Receipts from grantors 14,386 14,386 Acquisition and construction of capital assets (128,799) (128,799) Net cash provided (used) by capital and related financing activities (114,413) (114,413)
Cash flows from investing activities: Interest received on investments 520 520 Net cash provided (used) by investing activities 520 520
Net increase (decrease) in cash and cash equivalents 218,893 218,893Cash and cash equivalents at beginning of year - -Cash and cash equivalents at end of year 218,893$ 218,893$
Classified as: Cash, cash equivalents, and investments 218,893$ 218,893$ Totals 218,893$ 218,893$
Reconciliation of operating income (loss) to net cash provided (used) by operating activitiesOperating income (loss) 88,997$ 88,997$
Adjustments to reconcile operating income (loss) to net cash provided (used) by operating activities: Depreciation and amortization 1,833 1,833(Increase) decrease in assets: Accounts receivable (20,829) (20,829)Increase (decrease) in liabilities: Accounts payable 79,551 79,551 Accrued payroll and compensated absences 10,234 10,234Total Adjustments 70,789 70,789
Net cash provided (used) by operating activities 159,786$ 159,786$
Noncash investing, capital and financing activities: Capital assets acquired through contributions from developers 268,880$ 268,880$ Total noncash investing, capital and financing activities 268,880$ 268,880$
City of Flagstaff, ArizonaCombining Statement of Cash Flows
Business-type Activities - Enterprise Funds
Non-major Proprietary FundsFor the Year Ended June 30, 2004
86

Page
Capital Assets Used in the Operation of Governmental Funds Schedule By Function and Activity 88 Schedule of Changes By Function and Activity 90
Schedule of Revenues, Expenditures, and Changes in Fund Balances - Budget and Actual Library Fund 91 Real Estate Proceeds Fund 92 Community Redevelopment Fund 93 Metropolitan Planning Organization Fund 94 General Obligation Bond Fund 95 Special Assessment Bond Fund 96 Secondary Property Tax Revenue Fund 97
Other Supplementary Information
87

Program Land Buildings Improvements
General government 4,557,137$ 12,252,201$ 16,142$ Public safety 265,259 12,038,695 61,303 Public works - 5,924,036 192,887 Economic and physical development 1,292,918 2,752,669 12,983 Culture and recreation 3,055,060 2,389,283 11,293,780 Highway and streets 718,475 102,310 1,934,792
Subtotal 9,888,849 35,459,194 13,511,887
Less: accumulated depreciation - (9,957,932) (6,210,087) Total governmental funds capital assets 9,888,849$ 25,501,262$ 7,301,800$
City of Flagstaff, ArizonaCapital Assets Used in the Operation of Governmental Funds
Schedule By Function and ActivityJune 30, 2004
88

Machineryand Construction
Equipment Infrastructure In Progress Total
3,288,088$ -$ 5,525,634$ 25,639,202$ 6,727,145 - - 19,092,402
907,889 - - 7,024,812 842,668 - - 4,901,238
2,559,816 446,862 409,742 20,154,543 6,798,274 15,633,300 20,749,542 45,936,693
21,123,880 16,080,162 26,684,918 122,748,890
(12,661,775) (498,725) - (29,328,519)
8,462,105$ 15,581,437$ 26,684,918$ 93,420,371$
89

Balance Transfers BalanceProgram July 1, 2003 Additions Retirements In (out) June 30, 2004
General government 25,184,614$ 454,587.69$ -$ -$ 25,639,202$ Public safety 18,949,132 383,189 (239,919) - 19,092,402 Public works 7,035,000 - (10,188) - 7,024,812 Economic and physical development 2,929,048 1,984,694 (12,504) - 4,901,238 Culture and recreation 18,912,804 1,271,351 (29,612) - 20,154,543 Highway and streets 26,483,196 19,519,585 (66,088) - 45,936,693
Total 99,493,794$ 23,613,407$ (358,311)$ -$ 122,748,890$
City of Flagstaff, ArizonaCapital Assets Used in the Operation of Governmental Funds
Schedule of Changes By Function and ActivityJune 30, 2004
90

Original FinalActual Amounts Budgetary Basis
Variance with Final Budget
Positive (Negative)
REVENUES:
Grants and entitlements 2,460,151$ 2,460,151$ 1,953,851$ (506,300)$
Investment earnings 21,000 21,000 20,429 (571)
Miscellaneous 29,000 29,000 73,472 44,472
Total revenues 2,510,151 2,510,151 2,047,752 (462,399)
EXPENDITURES:
Current:
Culture and recreation 3,554,990 3,554,990 2,885,185 669,805
Capital outlay 158,394 158,394 40,095 118,299
Contingency 100,000 100,000 - 100,000
Total expenditures 3,813,384 3,813,384 2,925,280 888,104
Excess (deficiency) of revenues over expenditures (1,303,233) (1,303,233) (877,528) 425,705
OTHER FINANCING SOURCES (USES):
Transfers in 1,155,256 1,155,256 1,155,256 -
Transfers out (250,000) (250,000) - 250,000
Total other financing sources (uses) 905,256 905,256 1,155,256 250,000
Net change in fund balances (397,977) (397,977) 277,728 675,705
Budgetary fund balances, beginning of year 564,830 564,830 564,830 -
Budgetary fund balances, end of year 166,853$ 166,853$ 842,558$ 675,705$
Budget
CITY OF FLAGSTAFF, ARIZONALibrary Fund
Schedule of Revenues, Expenditures, and Changes in Fund Balances - Budget and ActualYear Ended June 30, 2004
91

Original FinalActual Amounts Budgetary Basis
Variance with Final Budget
Positive (Negative)
REVENUES:
Investment earnings 30,350$ 30,350$ 30,942$ 592$
Miscellaneous - - 879 879
Total revenues 30,350 30,350 31,821 1,471
EXPENDITURES:
Capital outlay 685,000 685,000 9,649 675,351
Total expenditures 685,000 685,000 9,649 675,351
Excess (deficiency) of revenues over expenditures (654,650) (654,650) 22,172 676,822
OTHER FINANCING SOURCES (USES):
Sale of capital assets 297,000 297,000 13,418 (283,582)
Transfers out - - (150,000) (150,000)
Total other financing sources (uses) 297,000 297,000 (136,582) (433,582)
Net change in fund balances (357,650) (357,650) (114,410) 243,240
Budgetary fund balances, beginning of year 1,021,900 1,021,900 1,021,900 -
Budgetary fund balances, end of year 664,250$ 664,250$ 907,490$ 243,240$
Budget
CITY OF FLAGSTAFF, ARIZONAReal Estate Proceeds Fund
Schedule of Revenues, Expenditures, and Changes in Fund Balances - Budget and ActualYear Ended June 30, 2004
92

Original FinalActual Amounts Budgetary Basis
Variance with Final Budget
Positive (Negative)
REVENUES:
Grants and entitlements 1,463,261$ 1,463,261$ 359,503$ (1,103,758)$
Investment earnings 1,500 1,500 15,904 14,404
Miscellaneous 1,946 1,946 196,607 194,661
Total revenues 1,466,707 1,466,707 572,014 (894,693)
EXPENDITURES:
Current:
Economic and physical development 2,380,271 2,380,271 721,565 1,658,706
Total expenditures 2,380,271 2,380,271 721,565 1,658,706
Excess (deficiency) of revenues over expenditures (913,564) (913,564) (149,551) 764,013
OTHER FINANCING SOURCES (USES):
Sale of capital assets - - 568,323 568,323
Transfers in 375,400 375,400 375,400 -
Total other financing sources (uses) 375,400 375,400 943,723 568,323
Net change in fund balances (538,164) (538,164) 794,172 1,332,336
Budgetary fund balances, beginning of year 545,036 545,036 545,036 -
Budgetary fund balances, end of year 6,872$ 6,872$ 1,339,208$ 1,332,336$
Budget
CITY OF FLAGSTAFF, ARIZONACommunity Redevelopment Fund
Schedule of Revenues, Expenditures, and Changes in Fund Balances - Budget and ActualYear Ended June 30, 2004
93

Original FinalActual Amounts Budgetary Basis
Variance with Final Budget
Positive (Negative)
REVENUES:
Grants and entitlements 298,126$ 298,126$ 331,411$ 33,285$
Total revenues 298,126 298,126 331,411 33,285
EXPENDITURES:
Current:
Economic and physical development 298,126 398,126 331,411 66,715
Total expenditures 298,126 398,126 331,411 66,715
Excess (deficiency) of revenues over expenditures - (100,000) - 100,000
Net change in fund balances - (100,000) - 100,000
Budgetary fund balances, beginning of year - - - -
Budgetary fund balances, end of year -$ (100,000)$ -$ 100,000$
Budget
CITY OF FLAGSTAFF, ARIZONAMetropolitan Planning Organization Fund
Schedule of Revenues, Expenditures, and Changes in Fund Balances - Budget and ActualYear Ended June 30, 2004
94
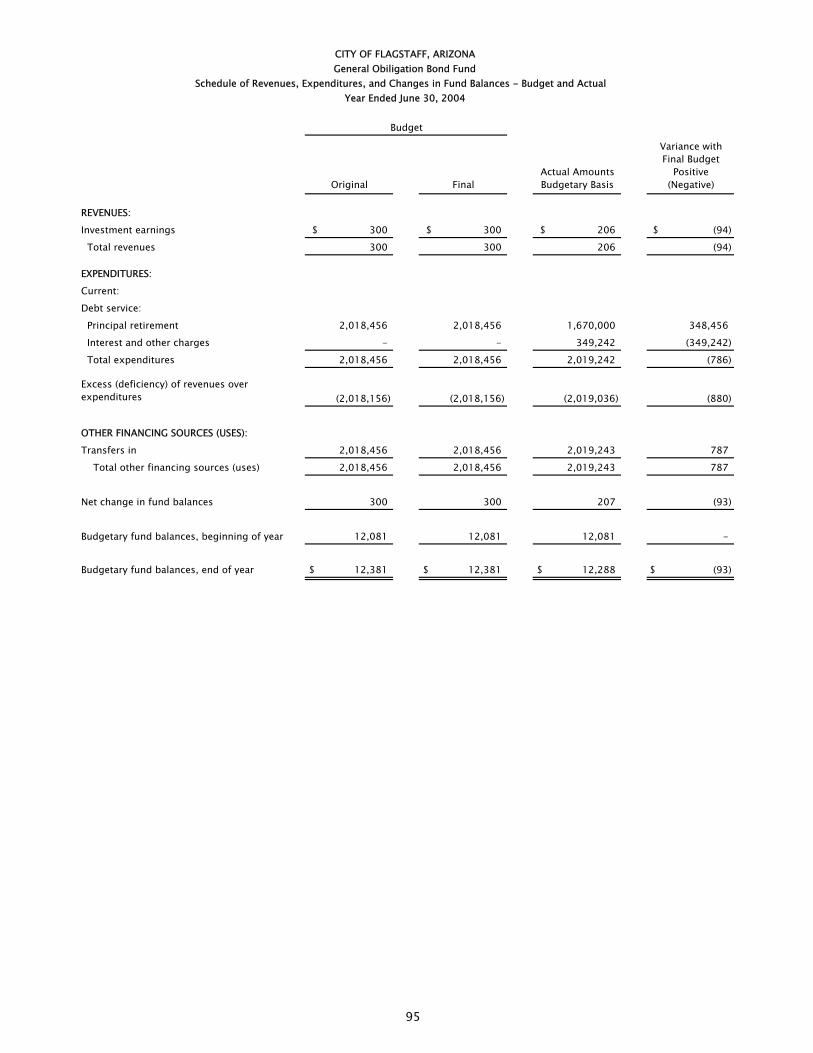
Original FinalActual Amounts Budgetary Basis
Variance with Final Budget
Positive (Negative)
REVENUES:
Investment earnings 300$ 300$ 206$ (94)$
Total revenues 300 300 206 (94)
EXPENDITURES:
Current:
Debt service:
Principal retirement 2,018,456 2,018,456 1,670,000 348,456
Interest and other charges - - 349,242 (349,242)
Total expenditures 2,018,456 2,018,456 2,019,242 (786)
Excess (deficiency) of revenues over expenditures (2,018,156) (2,018,156) (2,019,036) (880)
OTHER FINANCING SOURCES (USES):
Transfers in 2,018,456 2,018,456 2,019,243 787
Total other financing sources (uses) 2,018,456 2,018,456 2,019,243 787
Net change in fund balances 300 300 207 (93)
Budgetary fund balances, beginning of year 12,081 12,081 12,081 -
Budgetary fund balances, end of year 12,381$ 12,381$ 12,288$ (93)$
Budget
CITY OF FLAGSTAFF, ARIZONAGeneral Obiligation Bond Fund
Schedule of Revenues, Expenditures, and Changes in Fund Balances - Budget and ActualYear Ended June 30, 2004
95

Original FinalActual Amounts Budgetary Basis
Variance with Final Budget
Positive (Negative)
REVENUES:
Special assessments 203,214$ 203,214$ 291,684$ 88,470$
Investment earnings 30,197 30,197 45,689 15,492
Miscellaneous - - 2,427 2,427
Total revenues 233,411 233,411 339,800 106,389
EXPENDITURES:
Current:
Debt service:
Principal retirement 259,000 259,000 259,000 -
Interest and other charges 43,568 43,568 43,710 (142)
Total expenditures 302,568 302,568 302,710 (142)
Excess (deficiency) of revenues over expenditures (69,157) (69,157) 37,090 106,247
Net change in fund balances (69,157) (69,157) 37,090 106,247
Budgetary fund balances, beginning of year 453,031 453,031 453,031 -
Budgetary fund balances, end of year 383,874$ 383,874$ 490,121$ 106,247$
Budget
CITY OF FLAGSTAFF, ARIZONASpecial Assessment Bond Fund
Schedule of Revenues, Expenditures, and Changes in Fund Balances - Budget and ActualYear Ended June 30, 2004
96

Original FinalActual Amounts Budgetary Basis
Variance with Final Budget
Positive (Negative)
REVENUES:
Taxes 4,550,192$ 4,550,192$ 4,628,523$ 78,331$
Investment earnings 7,200 7,200 6,668 (532)
Total revenues 4,557,392 4,557,392 4,635,191 77,799
OTHER FINANCING SOURCES (USES):
Transfers out (3,972,564) (3,972,564) (3,968,787) 3,777
Total other financing sources (uses) (3,972,564) (3,972,564) (3,968,787) 3,777
Net change in fund balances 584,828 584,828 666,404 81,576
Budgetary fund balances, beginning of year 357,631 357,631 357,631 -
Budgetary fund balances, end of year 942,459$ 942,459$ 1,024,035$ 81,576$
Budget
CITY OF FLAGSTAFF, ARIZONASecondary Property Tax Revenue Fund
Schedule of Revenues, Expenditures, and Changes in Fund Balances - Budget and ActualYear Ended June 30, 2004
97

98

Table Page
Government-wide information:Government-wide Expenses by Function I 100Government-wide Revenues II 101
Fund information:General Governmental Expenditures by Function III 102General Governmental Revenues by Source IV 103Tax Revenues by Source V 104Property Tax Levies and Collections VI 105Primary Assessed Value and Estimated Actual Value of Taxable Property VII 106Property Tax Rates – Direct and Overlapping Governments VIII 107Principal Taxpayers IX 108Special Assessment Collections X 109Computation of Legal Debt Margin XI 110Percent of Net General Bonded Debt to Secondary Assessed Value and Net General Bonded Debt Per Capita XII 111Ratio of Annual Debt Service Expenditures for General Bonded Debt to Total General Governmental Expenditures XIII 112Computation of Direct and Overlapping Bonded Debt XIV 113Schedule of Water and Wastewater Revenue Bond Coverage XV 114Demographic Statistics XVI 115Property Value, Construction, and Bank Deposits XVII 116Miscellaneous Statistics XVIII 117Intergovernmental Revenue by Source XIX 119Insurance Summary XX 120
Statistical Section
99

Table I
City of Flagstaff, ArizonaGovernment-Wide Expenses by Function
Last Ten Fiscal Years
Economic Culture Interest onFiscal General Public Public and Physical and Highways Long Tem Water and EnvironmentalYear Government Safety Works Development Recreation and Streets Debt Wastewater Services Airport Storwmater Total
2003 4,840,896$ 18,270,468$ 1,169,302$ 7,272,115$ 8,467,575$ 6,184,553$ 1,380,182$ 16,142,040$ 7,556,614$ 3,411,603$ -$ 74,695,348$
2004 5,891,617 18,792,832 1,178,137 6,473,290 8,693,714 8,886,947 1,923,325 17,250,441 7,319,602 3,370,447 460,936 80,241,288
The City implemented GASB 34 for the fiscal year ended June 30, 2003.Prior statements have not been restated to comply with the new requirements.These amounts are presented on the accrual basis of accounting.
100

Table II
City of Flagstaff, ArizonaGovernment-Wide Revenues
Last Ten Fiscal Years
Program Revenues General Revenues
Operating CapitalFiscal Charges for Grants and Grants and Property State InvestmentYear Service Contributions Contributions Tax Sales Tax Shared Tax Earnings Miscellaneous Total
2003 32,550,332$ 3,810,679$ 19,106,918$ 8,010,293$ 23,805,566$ 12,073,108$ 383,111$ 952,308$ 100,692,315$
2004 31,796,700 2,965,572 22,240,321 7,931,626 25,682,974 12,122,563 218,520 3,101,909 106,060,185
The City implemented GASB 34 for the fiscal year ended June 30, 2003.Prior statements have not been restated to comply with the new requirements.These amounts are presented on the accrual basis of accounting.101

Table III
City of Flagstaff, ArizonaGeneral Government Expenditures by Function
Last Ten Fiscal Years
EconomicFiscal General Public Public Works and Physical Culture and Highway Debt Year Government Safety Development Development Recreation and Streets Service Capital Total
2003 4,453,180$ 17,202,980$ 948,944$ 7,060,275$ 7,599,703$ 5,676,050$ 5,059,182$ 18,304,161$ 66,304,475$
2004 5,335,890 18,015,837 966,546 6,289,966 7,724,481 8,003,110 7,042,026 19,348,708 72,726,564
Includes all governmenal fund types.The City implemented GASB 34 for the fiscal year ended June 30, 2003.Prior statements have not been restated to comply with the new requirements.These amounts are presented on the modified accrual basis of accounting.
102

Fiscal Licenses Intergovernmental Charges for Fines and OtherYear Taxes and Permits Revenues Services Forfeits Revenues Total
1995 17,576,915$ 834,368$ 15,322,232$ 720,238$ 572,728$ 3,450,303$ 38,476,784$
1996 18,112,121 1,322,309 16,095,776 872,608 808,543 1,581,552 38,792,909
1997 18,776,929 1,279,410 17,704,496 871,284 782,451 2,333,295 41,747,865
1998 19,576,193 1,246,090 19,079,704 920,566 783,854 2,497,159 44,103,566
1999 20,582,542 1,335,184 22,621,143 837,373 838,306 2,468,401 48,682,949
2000 22,197,133 1,324,340 26,778,117 1,030,249 837,695 5,243,779 57,411,313
2001 28,340,957 1,318,450 26,203,650 1,025,625 993,585 3,570,180 61,452,447
2002 30,986,091 2,014,357 24,008,885 1,676,615 991,131 3,520,493 63,197,572
2003 31,523,875 2,378,728 24,820,870 1,729,275 1,303,069 2,595,804 64,351,621
2004 33,736,154 2,111,033 23,097,385 1,459,837 1,144,562 2,320,658 63,869,629
Includes all governmental fund types.
Table IV
General Government Revenues by SourceLast Ten Fiscal Years
City of Flagstaff, Arizona
103

Table V
City of FlagstaffTax Revenues by Source
Last Ten Fiscal Years
Bed, BoardFiscal General Secondary Franchise and City and Booze TransportationYear Property Tax Property Tax Other Taxes Sales Tax Tax Tax Total
1995 1,868,077$ 4,062,533$ 1,304,684$ 7,362,140$ 2,979,481$ -$ 17,576,915$
1996 2,137,125 3,344,441 1,260,317 8,240,709 3,129,529 - 18,112,121
1997 2,243,818 3,402,803 1,358,283 8,491,913 3,280,112 - 18,776,929
1998 2,405,865 3,355,628 1,512,456 8,966,287 3,335,957 - 19,576,193
1999 2,577,557 3,537,987 1,560,789 9,369,406 3,536,803 - 20,582,542
2000 2,759,130 3,777,091 1,505,710 10,510,380 3,644,822 - 22,197,133
2001 2,853,091 3,896,103 1,690,043 10,810,658 3,747,822 5,343,240 28,340,957
2002 3,070,491 4,197,777 1,790,846 11,782,781 3,817,028 6,327,168 30,986,091
2003 3,427,509 4,415,081 1,783,098 11,468,608 3,826,975 6,602,604 31,523,875
2004 3,424,657 4,628,523 2,262,292 12,054,718 4,063,049 7,302,915 33,736,154
104

Table VI
City of Flagstaff, ArizonaProperty Tax Levies and Collections
Last Ten Fiscal Years
Total OutstandingPercent Delinquent Collections Outstanding Delinquent
Fiscal Total Current Tax of Levy Tax Total Tax as a Percent Delinquent Taxes as a PercentYear Tax Levy Collections Collected Collections Collections of Current Levy Collections of Current Levy
1995 5,910,644$ 5,610,061$ 94.9% 320,549$ 5,930,610$ 100.3% 186,826$ 3.2%
1996 5,424,449 5,400,777 99.6% 80,789 5,481,566 101.1% 265,339 4.9%
1997 5,638,222 5,566,676 98.7% 79,945 5,646,621 100.1% 248,572 4.4%
1998 5,754,253 5,651,170 98.2% 110,323 5,761,493 100.1% 217,244 3.8%
1999 6,138,071 6,036,950 98.4% 78,594 6,115,544 99.6% 216,717 3.5%
2000 6,526,010 6,443,879 98.7% 92,342 6,536,221 100.2% 211,305 3.2%
2001 6,936,955 6,658,250 96.0% 90,944 6,749,194 97.3% 218,230 3.1%
2002 7,271,109 7,194,162 98.9% 74,106 7,268,268 100.0% 257,060 3.5%
2003 7,613,349 7,625,852 100.2% 92,457 7,718,309 101.0% 292,203 3.8%
2004 7,897,298 7,791,735 98.7% 261,445 8,053,180 102.0% 170,430 2.2%
105
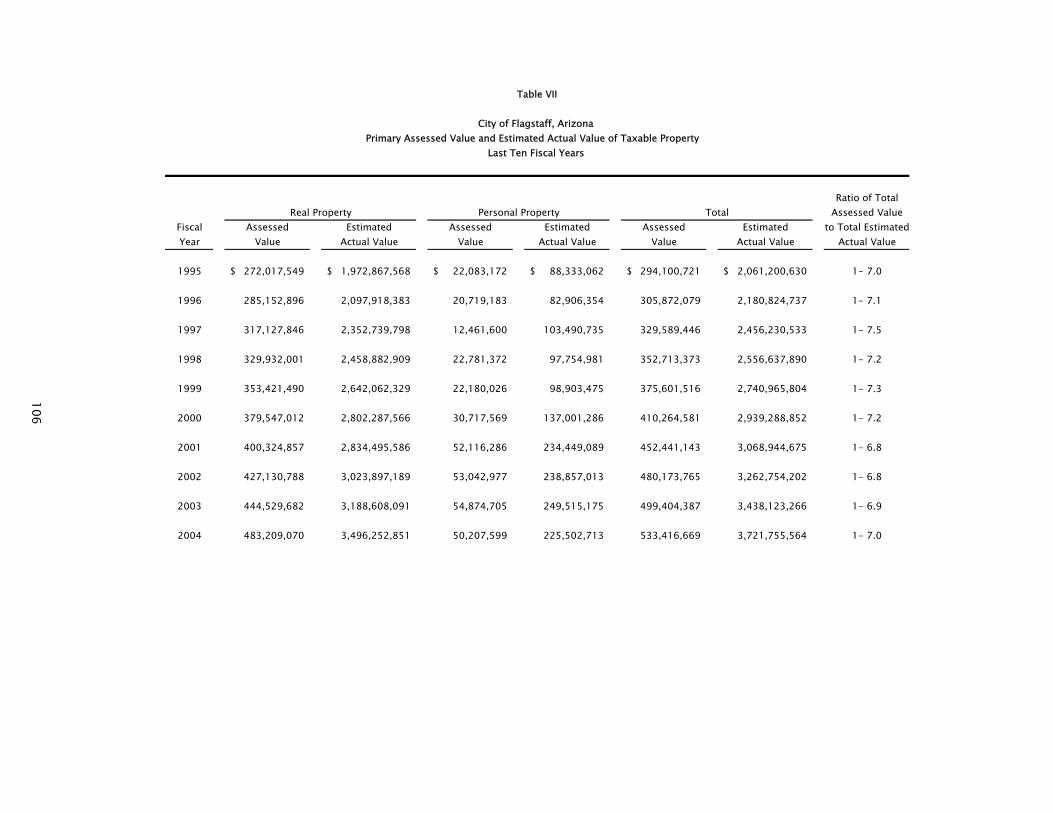
Table VII
City of Flagstaff, ArizonaPrimary Assessed Value and Estimated Actual Value of Taxable Property
Last Ten Fiscal Years
Ratio of TotalAssessed Value
Fiscal Assessed Estimated Assessed Estimated Assessed Estimated to Total EstimatedYear Value Actual Value Value Actual Value Value Actual Value Actual Value
1995 272,017,549$ 1,972,867,568$ 22,083,172$ 88,333,062$ 294,100,721$ 2,061,200,630$ 1- 7.0
1996 285,152,896 2,097,918,383 20,719,183 82,906,354 305,872,079 2,180,824,737 1- 7.1
1997 317,127,846 2,352,739,798 12,461,600 103,490,735 329,589,446 2,456,230,533 1- 7.5
1998 329,932,001 2,458,882,909 22,781,372 97,754,981 352,713,373 2,556,637,890 1- 7.2
1999 353,421,490 2,642,062,329 22,180,026 98,903,475 375,601,516 2,740,965,804 1- 7.3
2000 379,547,012 2,802,287,566 30,717,569 137,001,286 410,264,581 2,939,288,852 1- 7.2
2001 400,324,857 2,834,495,586 52,116,286 234,449,089 452,441,143 3,068,944,675 1- 6.8
2002 427,130,788 3,023,897,189 53,042,977 238,857,013 480,173,765 3,262,754,202 1- 6.8
2003 444,529,682 3,188,608,091 54,874,705 249,515,175 499,404,387 3,438,123,266 1- 6.9
2004 483,209,070 3,496,252,851 50,207,599 225,502,713 533,416,669 3,721,755,564 1- 7.0
TotalReal Property Personal Property
106
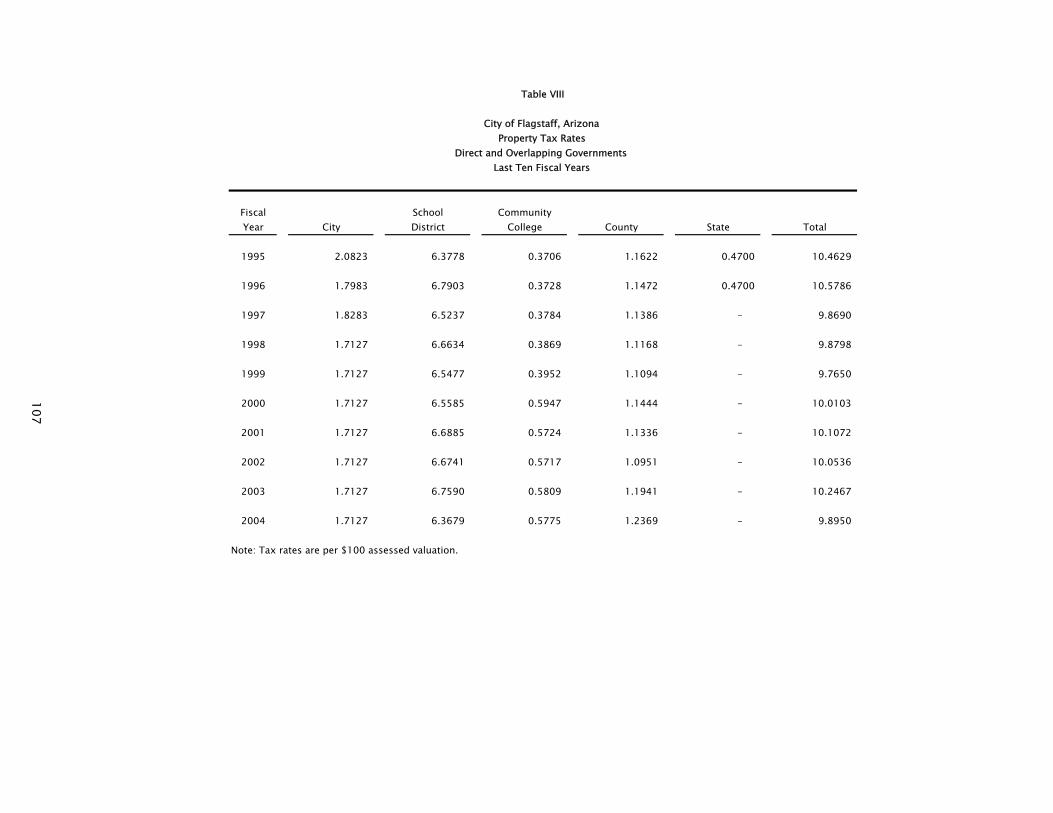
Fiscal School CommunityYear City District College County State Total
1995 2.0823 6.3778 0.3706 1.1622 0.4700 10.4629
1996 1.7983 6.7903 0.3728 1.1472 0.4700 10.5786
1997 1.8283 6.5237 0.3784 1.1386 - 9.8690
1998 1.7127 6.6634 0.3869 1.1168 - 9.8798
1999 1.7127 6.5477 0.3952 1.1094 - 9.7650
2000 1.7127 6.5585 0.5947 1.1444 - 10.0103
2001 1.7127 6.6885 0.5724 1.1336 - 10.1072
2002 1.7127 6.6741 0.5717 1.0951 - 10.0536
2003 1.7127 6.7590 0.5809 1.1941 - 10.2467
2004 1.7127 6.3679 0.5775 1.2369 - 9.8950
Note: Tax rates are per $100 assessed valuation.
Table VIII
Property Tax Rates
Last Ten Fiscal YearsDirect and Overlapping Governments
City of Flagstaff, Arizona
107
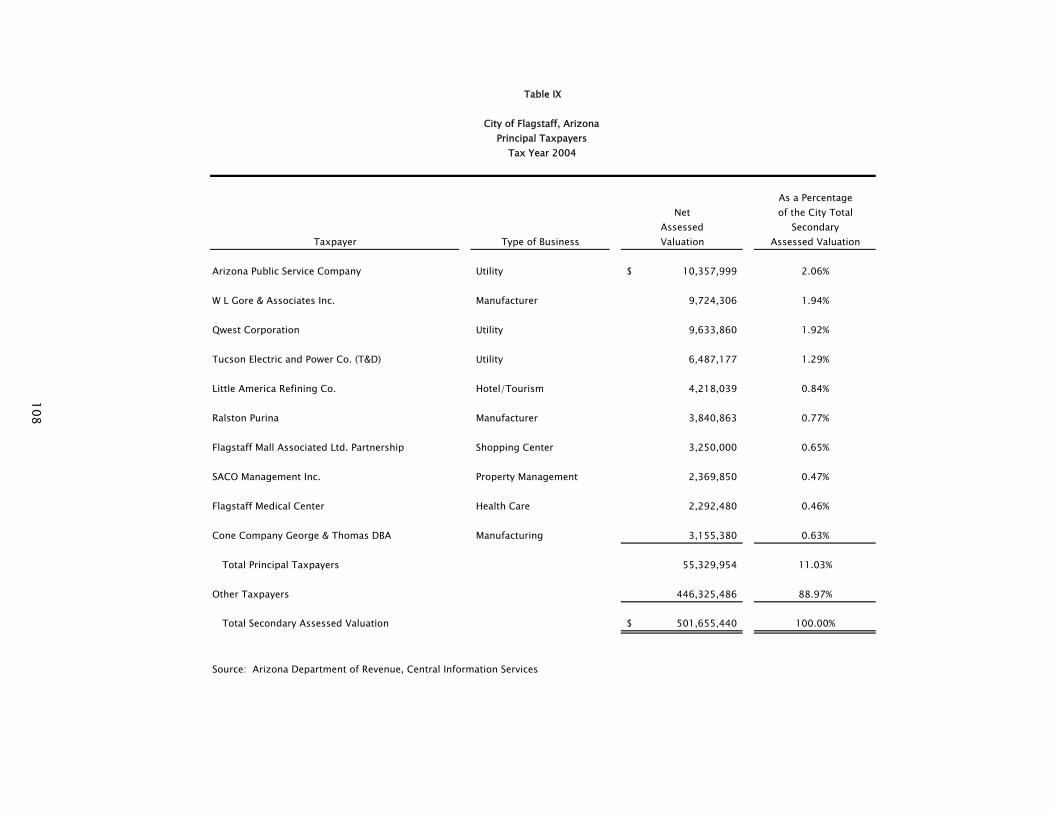
As a PercentageNet of the City Total
Assessed SecondaryTaxpayer Type of Business Valuation Assessed Valuation
Arizona Public Service Company Utility 10,357,999$ 2.06%
W L Gore & Associates Inc. Manufacturer 9,724,306 1.94%
Qwest Corporation Utility 9,633,860 1.92%
Tucson Electric and Power Co. (T&D) Utility 6,487,177 1.29%
Little America Refining Co. Hotel/Tourism 4,218,039 0.84%
Ralston Purina Manufacturer 3,840,863 0.77%
Flagstaff Mall Associated Ltd. Partnership Shopping Center 3,250,000 0.65%
SACO Management Inc. Property Management 2,369,850 0.47%
Flagstaff Medical Center Health Care 2,292,480 0.46%
Cone Company George & Thomas DBA Manufacturing 3,155,380 0.63%
Total Principal Taxpayers 55,329,954 11.03%
Other Taxpayers 446,325,486 88.97%
Total Secondary Assessed Valuation 501,655,440$ 100.00%
Source: Arizona Department of Revenue, Central Information Services
Table IX
Principal TaxpayersTax Year 2004
City of Flagstaff, Arizona
108

TotalOutstanding
Current Current Ratio of Current andFiscal Assessments Assessments Collections to DelinquentYear Due Collected (1) Amounts Due Assessments (2)
1995 -$ -$ N/A 3,408$
1996 53,958 53,958 100.00% 3,408
1997 127,535 132,847 104.17% 1,058
1998 136,791 170,026 124.30% -
1999 137,661 157,640 114.51% -
2000 145,142 175,863 121.17% 529
2001 186,494 269,794 144.67% 5,379
2002 207,154 350,894 169.39% 5,923
2003 206,129 360,158 174.72% -
2004 203,214 291,684 143.54% 414
(1) Includes prepayments.(2) Includes principal and interest.
Table X
Special Assessment CollectionsLast Ten Fiscal Years
City of Flagstaff, Arizona
109
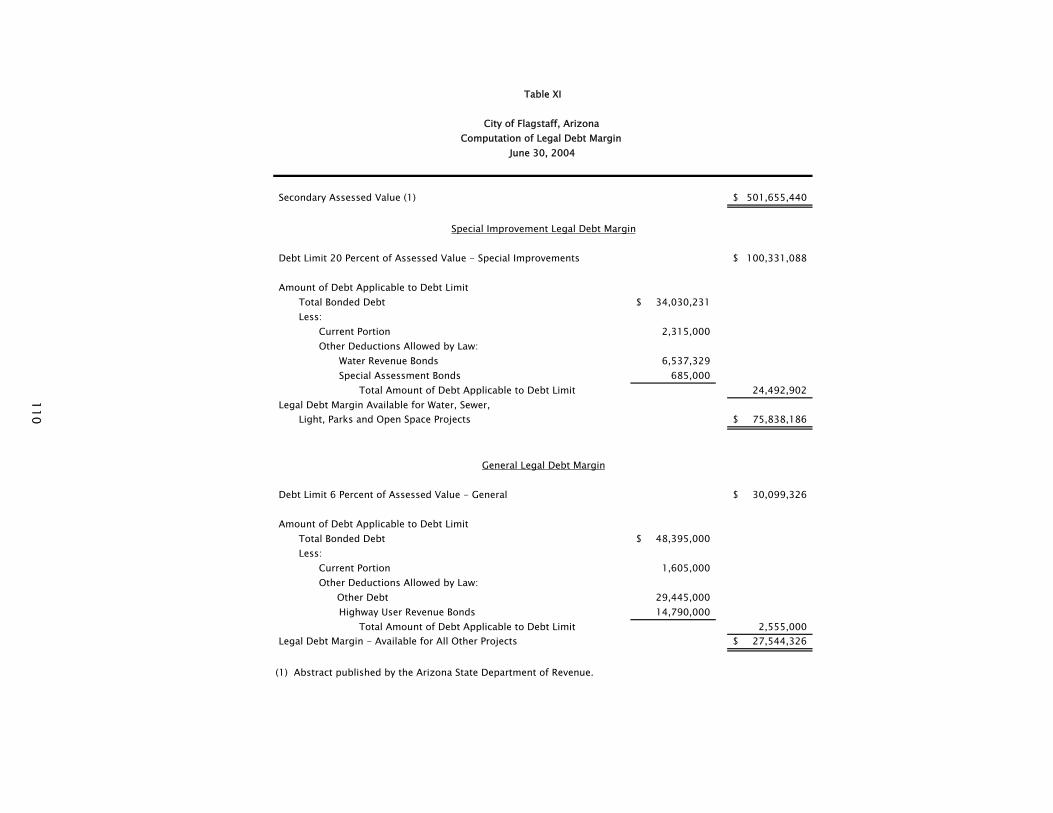
Secondary Assessed Value (1) 501,655,440$
Debt Limit 20 Percent of Assessed Value - Special Improvements 100,331,088$
Amount of Debt Applicable to Debt LimitTotal Bonded Debt 34,030,231$ Less:
Current Portion 2,315,000 Other Deductions Allowed by Law:
Water Revenue Bonds 6,537,329 Special Assessment Bonds 685,000
Total Amount of Debt Applicable to Debt Limit 24,492,902 Legal Debt Margin Available for Water, Sewer,
Light, Parks and Open Space Projects 75,838,186$
Debt Limit 6 Percent of Assessed Value - General 30,099,326$
Amount of Debt Applicable to Debt LimitTotal Bonded Debt 48,395,000$ Less:
Current Portion 1,605,000 Other Deductions Allowed by Law: Other Debt 29,445,000
Highway User Revenue Bonds 14,790,000 Total Amount of Debt Applicable to Debt Limit 2,555,000
Legal Debt Margin - Available for All Other Projects 27,544,326$
(1) Abstract published by the Arizona State Department of Revenue.
General Legal Debt Margin
Special Improvement Legal Debt Margin
Table XI
Computation of Legal Debt MarginJune 30, 2004
City of Flagstaff, Arizona
110

Percent ofNet Bonded
Secondary Gross Less Net Debt to Net BondedFiscal Assessed Bonded Current Bonded Assessed Debt PerYear Population (1) Value (2) Debt Portion Debt Value Capita
1995 52,701 * 284,954,647$ 44,029,701$ 4,270,000$ 39,759,701$ 14% 754$
1996 53,966 294,100,721 39,830,151 3,595,000 36,235,151 12% 671.44
1997 55,885 310,066,911 53,809,898 4,371,000 49,438,898 16% 884.65
1998 58,145 340,743,258 49,470,273 4,170,000 45,300,273 13% 779.09
1999 59,945 362,625,557 45,333,746 4,465,000 40,868,746 11% 681.77
2000 52,894 ** 385,566,202 40,904,461 4,405,000 36,499,461 9% 690.05
2001 57,700 408,592,733 36,537,570 2,805,000 33,732,570 8% 584.62
2002 59,160 429,030,400 36,873,231 2,888,505 33,984,726 8% 574.45
2003 61,030 464,257,886 34,012,849 3,570,000 30,442,849 7% 498.82
2004 61,270 501,655,440 30,967,902 3,920,000 27,047,902 5% 441.45
(1) Arizona Department of Economic Security projected population increases except 1995 and 2000, which are official census figures.
(2) From County Assessors Office.
* 1995 Special Census.
** Census estimates exceeded actual 2000 census results. FY2000 adjusted to reflect population per U.S. Census official results
Table XII
Percent of Net General Bonded Debt to Secondary Assessed Value
Last Ten Fiscal Yearsand Net General Bonded Debt Per Capita
City of Flagstaff, Arizona
111
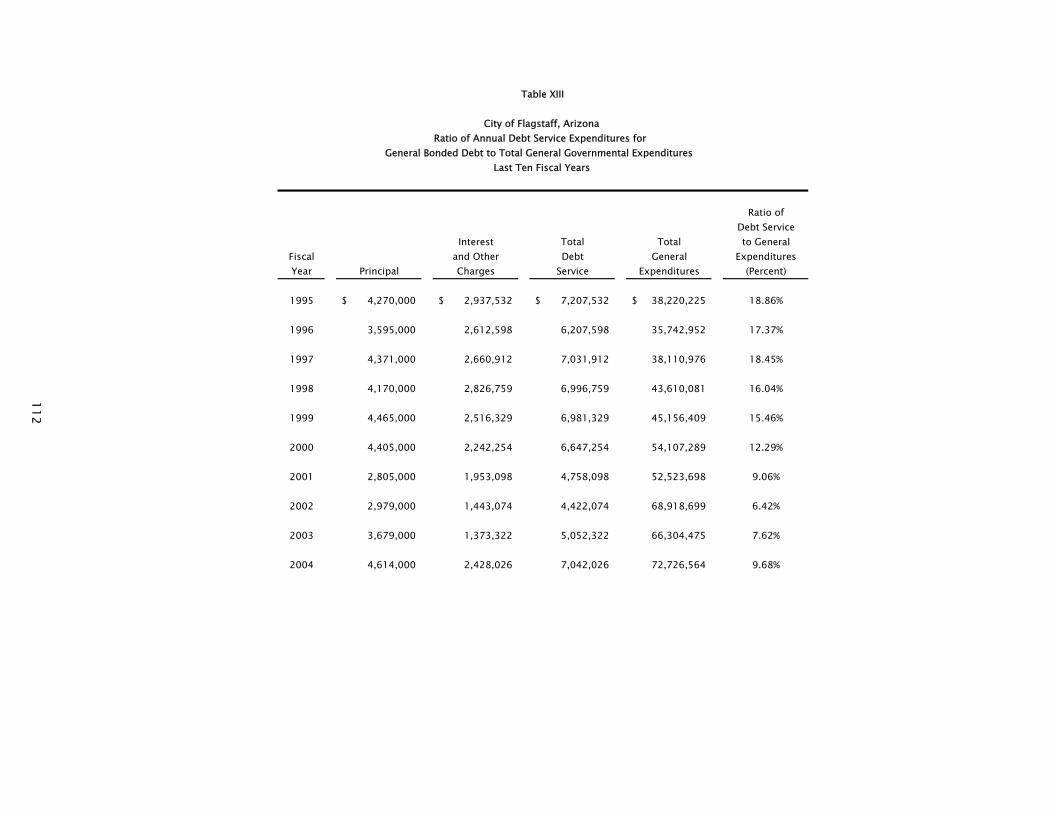
Ratio ofDebt Service
Interest Total Total to GeneralFiscal and Other Debt General ExpendituresYear Principal Charges Service Expenditures (Percent)
1995 4,270,000$ 2,937,532$ 7,207,532$ 38,220,225$ 18.86%
1996 3,595,000 2,612,598 6,207,598 35,742,952 17.37%
1997 4,371,000 2,660,912 7,031,912 38,110,976 18.45%
1998 4,170,000 2,826,759 6,996,759 43,610,081 16.04%
1999 4,465,000 2,516,329 6,981,329 45,156,409 15.46%
2000 4,405,000 2,242,254 6,647,254 54,107,289 12.29%
2001 2,805,000 1,953,098 4,758,098 52,523,698 9.06%
2002 2,979,000 1,443,074 4,422,074 68,918,699 6.42%
2003 3,679,000 1,373,322 5,052,322 66,304,475 7.62%
2004 4,614,000 2,428,026 7,042,026 72,726,564 9.68%
Table XIII
Ratio of Annual Debt Service Expenditures for
Last Ten Fiscal YearsGeneral Bonded Debt to Total General Governmental Expenditures
City of Flagstaff, Arizona
112

The general obligation debt of all local governmental units which provide services within theCity's boundaries, and which must be borne by properties in the City (commonly calledoverlapping debt), is summarized below:
Percentage Direct andNet Debt Applicable Overlapping
Governmental Units Outstanding to the City Debt
City of Flagstaff 27,047,902$ 100.0% 27,047,902$ School District #1 46,827,861 65.0% 30,438,110
57,486,012$
Table XIV
Computation of Direct and Overlapping DebtJune 30, 2004
City of Flagstaff, Arizona
113

NetRevenueAvailable
Fiscal Gross for DebtYear Revenues Expenses Service Principal Interest Total Coverage
1995 14,916,620$ 7,097,153$ 7,819,467$ -$ -$ -$ -$
1996 16,475,146 7,136,236 9,338,910 - - - -
1997 16,515,478 7,973,540 8,541,938 - - - -
1998 16,767,650 7,916,657 8,850,993 - - - -
1999 16,773,884 7,700,535 9,073,349 - - - -
2000 17,606,349 8,311,186 9,295,163 - - - -
2001 18,337,310 9,757,448 8,579,862 - - - -
2002 17,637,708 9,587,743 8,049,965 - - - -
2003 16,769,463 9,865,571 6,903,892 238,431 17,741 256,172 26.95
2004 17,227,848 10,645,073 6,582,775 246,890 231,034 477,924 13.77
Debt Service Requirements
Table XV
Schedule of Water and Wastewater Revenue Bond CoverageLast Ten Fiscal Years
City of Flagstaff, Arizona
114

School UnemploymentFiscal Population Enrollment RateYear (1) (2) (3)
1995 52,701 11,880 6.6%
1996 53,966 11,826 6.1%
1997 55,885 12,679 6.5%
1998 58,145 13,249 6.6%
1999 59,945 12,880 6.6%
2000 52,894 12,682 5.2%
2001 57,700 13,969 4.8%
2002 59,160 13,566 5.1%
2003 61,030 12,905 5.8%
2004 61,270 13,176 5.2%
(1) Arizona Department of Economic Security estimated projected population except for the years, 2000, which are official census figures and 1995, which represent the special census figures.
(2) Arizona Department of Education and National Center for Education Statistics.
(3) Arizona Department of Economic Security.(2004 is a draft estimate provided by AZ DES)
Note: Annual per capita income, median age, and education level data are not available.
Table XVI
Demographic StatisticsLast Ten Fiscal Years
City of Flagstaff, Arizona
115

Table XVII
City of Flagstaff, ArizonaProperty Value, Construction, and Bank Deposits
Last Ten Fiscal Years
QuarterlyBank Deposits
Fiscal Number of Number of Coconino County EstimatedYear Permits Value Permits Value ($000) (2) Cash Value Commercial Residential Nontaxable
1995 488 46,305,342$ 181 15,953,231$ 464,764$ 1,929,201,462$ 768,914,972$ 1,041,012,663$ 119,273,827$
1996 564 68,880,721 169 24,418,924 462,848 2,170,269,429 818,081,181 1,205,903,371 146,284,877
1997 513 58,580,988 198 39,495,278 347,956 * 2,219,561,893 832,894,205 1,238,946,076 147,721,612
1998 528 45,783,140 182 33,570,116 482,770 2,458,001,305 849,315,340 1,446,181,407 162,504,558
1999 524 78,015,349 183 35,999,041 458,285 2,644,019,764 867,782,208 1,609,395,170 166,842,386
2000 586 46,399,420 122 43,592,693 460,217 2,813,033,675 930,939,338 1,698,835,707 183,258,630
2001 550 50,615,526 127 35,722,301 490,905 2,991,862,619 992,147,419 1,795,884,090 203,831,110
2002 758 69,026,395 152 43,642,285 615,806 3,134,105,000 1,037,581,165 1,886,615,936 209,907,899
2003 740 67,267,554 170 38,865,819 881,222 3,329,380,591 1,072,502,563 1,997,820,625 259,057,403
2004 709 87,188,212 139 20,152,607 788,255 3,485,996,311 1,096,247,804 2,123,907,477 265,841,030
(1) City Building Department.
(2) Arizona Bankers Association. This represents deposits in the 2nd quarter of the fiscal year for banks which reported.
(3) Abstract published by the Arizona State Department of Revenue.
* Number is exclusive of one large non-participating financial institute in Coconino County.
Property Value (3)Construction (1)Commercial and Industrial
Construction (1)Residential
116

Date of Incorporation Employees as of June 30, 2004 ElectionsMay 26, 1894 Merit System 549 Number of Registered Voters
Date Charter Adopted Exempt 113 Last Municipal Election May 2004 29,068 October 3, 1958 Temporary 213 Number of Votes Cast
Date of Latest Charter Amendment Elected Officials 7 Last Municipal Election May 2004 11,650 June 29, 1998 Percentage of Registered Voters
Total Payroll for the Year Ending 2004: 31,659,134$ Voting in Last Municipal Election 40.08%Form of Government
Council, City Manager Fire Protection Parks and RecreationNumber of Stations 6 Number of Developed Parks 27
Area - Square Miles Number of Employees (FTE) 96.75 Number of Un-developed Parks 4 2004 64.400 Park Acreage 702.34
Police Protection Flagstaff Urban Trail System-Miles 32.32 Miles of Streets, Alleys and Sidewalks Number of Employees (FTE) 151
Streets 213.72 Number of Calls for Service per Number of Other Facilities:Alleys 10.15 Annual Report-12/31/02 55,709 Recreation Centers 4 Sidewalks 152.40 Ave. Patrol Officers for 24 hour period 19 Tennis Courts 17
Vehicular Patrol Units 26 Racquetball Courts 4 Miles of Sewer Ramadas 11
Storm 41.96 Coconino County Jail Prisoner Capacity 562 Softball/Baseball Fields 17 Sanitary 247.21 Ice Rinks 1
Pulliam Airport Playgrounds 20 Number of Street Lights 2,980 Fixed Base Operators 1 Skate Tracks 2
Locally Based Aircraft 130 Soccer Fields 4 Number of Fire Hydrants 2,539 Tiedowns 29 Disc Golf Course 1
Enclosed Hangars 42 Basketball Courts 19 Number of Manholes 6,402 Open Hangars 38 Volleyball Courts 6
Horseshoe Courts 12 Off Leash Areas-Bark Parks 2 Swimming Pools (School Owned) 2
Table XVIII
City of Flagstaff, ArizonaMiscellaneous Statistics
117

Education Sales Tax PopulationNumber of Schools: Retail Sales Last 15 Fiscal Years: Census Population Count-Last Five Censuses:
Public Elementary 12 2004 1,593,931,781$ 2004*** 61,270 Public Middle School 2 2003 1,458,775,346 2003** 61,030 Public High School 3 2002 1,404,232,492 2002** 59,160 Alternative Schools 2 2001 1,324,735,136 2001** 57,700 Magnet Schools 3 2000 1,238,195,104 2000 52,894 Charter Schools 11 1999 1,117,197,604 1995* 52,701 Private Schools 6 1998 1,065,133,746 1990 45,854 Community College (Coconino) 1 1997 1,016,570,260 1985* 38,247 University (Northern Arizona) 1 1996 965,100,588 1980 34,743
1995 905,801,130 *Special CensusNumber of Teachers (Fall 2003): 1994 867,566,687 **DES Estimate
Flagstaff Unified School District 836 1993 776,546,307 **Preliminary DES EstimateNo. AZ University Faculty-Full Time 711 1992 686,784,204 Coconino Community College Faculty 299 1991 659,778,700 2000 Census Information:
1990 631,835,742 Age Distribution of PopulationNumber of Students (Fall 2003): Total Sales Tax Revenue for Fiscal Year 2004 for Urbanized Areas Only
Flagstaff Unified School District 11,377 11,544,443$ 1-4 Years 3,546 Charter 1,484 5-17 Years 9,288 Private (Fall 2001) 315 Utility Enterprise 18-24 Years 11,487 Northern Arizona University Total Active Accounts on June 30, 2004 25-44 Years 16,111
Flagstaff Campus 12,874 Water 18,039 45-64 Years 8,309 All Locations 18,824 Sewer 17,588 65+ Years 4,153
Coconino Community College Average Gallons/Household/Month 6,096 52,894 Flagstaff Campuses (2) 3,165 All Locations 3,785 Plants Capacity (Million Gallons per Day): Number of Housing Units 21,396
Water Treatment Plant 7 Average Persons per Housing Unit 2.59 Reservoir Filtration Plant 2 Average Family Size 3.13 Wildcat Hill Plant 6 Median Household Income 37,146$ Rio de Flag Reclaim Plant 4 Per Capita Income (2000) 18,637$
Wells 24 Reservoirs 8 2000 Census information available at the following websites:Reclaimed Reservoirs 1 http://www.census.gov/census2000/states/az.htmlMiles of Water Lines 365.03 http://www.de.state.az.us/links/economic/webpage/index.htmlMiles of Reclaimed Lines 14.77 Miles of Sewer Lines 247.21
Table XVIII (continued)
City of Flagstaff, ArizonaMiscellaneous Statistics
118

Table XIX
City of Flagstaff, ArizonaIntergovernmental Revenue by Source
Governmental FundsLast Ten Fiscal Years
LocalFiscal State State County Auto Highway Transportation State Federal State Grants County County LibraryYear Sales Tax Income Tax In-Lieu Tax User Tax Assistance HB 2565 Grants & Other State LEAF IGA District Funding Other Total
1995 NA NA NA NA NA NA NA NA NA NA NA NA
1996 3,734,332$ 3,553,021$ 1,355,828$ 5,700,737$ 364,931$ -$ 360,439$ 115,134$ -$ 911,354$ -$ 16,095,776$
1997 3,845,330 4,170,641 1,504,060 5,852,957 366,453 - 694,916 380,042 - 890,097 - 17,704,496
1998 4,061,346 4,725,837 1,533,501 5,371,446 394,318 - 1,448,951 553,963 - 955,342 35,000 19,079,704
1999 4,353,556 5,489,912 1,847,142 7,207,158 367,911 - 1,763,054 272,297 - 1,101,729 218,384 22,621,143
2000 4,785,424 6,062,290 1,902,188 7,427,210 367,461 312,249 1,474,751 370,391 - 1,068,817 3,007,336 26,778,117
2001 4,919,575 6,432,879 1,913,662 7,969,703 360,806 142,793 1,731,823 317,059 - 1,835,109 580,241 26,203,650
2002 4,076,034 5,526,159 1,803,900 7,771,416 300,246 47,598 2,348,793 437,543 - 1,423,105 274,091 24,008,885
2003 4,136,724 5,557,918 2,378,466 7,408,116 315,026 - 1,743,613 823,701 - 1,607,306 850,000 24,820,870
2004 4,449,982 4,777,145 2,427,367 6,975,351 313,868 - 1,160,966 454,212 468,069 1,921,433 148,992 23,097,385
119

Table XX
City of Flagstaff, ArizonaInsurance Summary
In Effect June 1, 2003 to May 31 , 2004
Coverage Limit of Liability Coverage Limit of Liability
Liability Insurance: Property Insurance:General Liability* 1,000,000$ / per occurrence Blanket Building and Contents,
(Includes 2 Skateboard Parks) 2,000,000$ / aggregate including light and signals 95,866,723$ / $25,000 deductibleLaw Enforcement Liability* 1,000,000$ / each wrongful act Flood Zones B and C 10,000,000$ / $25,000 deductible
1,000,000$ / aggregate Earthquakes 10,000,000$ / $25,000 deductibleAuto Liability* 1,000,000$ / each accident Flood Zone A PropertiesPublic Entrity Management Errors and Omissions* 1,000,000$ / each claim Municipal Court 220,000$ / building
(Claims Made Retro Date 6-1-95) 1,000,000$ / aggregate 116,900$ / contentsEmployment Practices Liability* 2,000,000$ / each wrongful act City Hall, Library 500,000$ / each building
(Claims Made Retro Date 6-1-95) 2,000,000$ / aggregate 500,000$ / contents eachHealthcare Professional (for EMTs)* 2,000,000$ / each person
(Claims Made Retro Date 6-1-95) 2,000,000$ / aggregate Contractors Equipment (actual cash value) 6,292,799$ / $5,000 deductibleEmployee Benefits Liability* 1,000,000$ each employee Computer Equipment and Peripherals 5,818,610$ / $1,000 deductible
3,000,000$ aggregate Computer Data and Media 500,000$ / $1,000 deductible* Liability Claims are Subject to a $50,000 Self Insurance Retention Laptops and Portables -
Replacement Cost Coverage 248,500$ / $1,000 deductibleEmployer's Liability 1,000,000$ / each accident Fine Arts Exhibition Floater 25,000$ / each location
1,000,000$ / disease employee City Hall, Visitor Center, Airport Terminal $1,000 deductible1,000,000$ / disease policy limit Boiler and Machinery 25,000,000$ / $5,000 deductible
Worker's Compensation StatutoryCrime:
Excess Liability #1 Following Form Over General Liability, Auto, Law Enforcement, Public Blanket Public Employees and Treasurer 1,000,000$ / $5,000 deductibleEntity Management, Employee Benefits Liability 10,000,000$ / each occurrence Dishonesty Bond Including Faithful Performance of Duty
Wrongful Act / aggregate Computer Fraud 250,000$ / $5,000 deductible(Excludes Employment Practices and Healthcare Professional) Theft, Disappearance, & Destruction
(Inside and Outside) 5,000$ / $500 deductibleExcess Liability #2 Following Form Over Excess Liability # 1
Excluding Discrimination, Employment-related 15,000,000$ / each occurrence Aviation: Practices, and Failure to supply. Wrongful Act / aggregate Products/Completed Operations Liability, 30,000,000$ / each occurrence
Contractual, Construction & Demolition 30,000,000$ / aggregateHangar Keepers Liability 30,000,000$ / each aircraft
30,000,000$ / each occurrence
($5,000 deductible)
120