Embed Size (px)
DESCRIPTION
Â
Citation preview
COMPREHENSIVE ANNUAL FINANCIAL REPORT
For the Fiscal Year Ended September 30, 2017
Prepared by:
Business Services Department
1
City of Mansfield, Texas Comprehensive Annual Financial Report
For the Fiscal Year Ended September 30, 2017
TABLE OF CONTENTS Page INTRODUCTORY SECTION (unaudited) Letter of Transmittal ...................................................................................................................... 3 GFOA Certificate of Achievement ................................................................................................ 8 Organizational Chart ...................................................................................................................... 9 Principal Officers ......................................................................................................................... 10 FINANCIAL SECTION Independent Auditors’ Report ...................................................................................................... 11 Management’s Discussion and Analysis (unaudited) .................................................................. 14 Basic Financial Statements: Government-wide Financial Statements: Statement of Net Position ................................................................................................. 28 Statement of Activities ...................................................................................................... 29 Fund Financial Statements: Balance Sheet – Governmental Funds .............................................................................. 30 Statement of Revenues, Expenditures, and Changes in Fund Balances – Governmental Funds ...................................................................................... 31 Reconciliation of the Statement of Revenues, Expenditures, and Changes in Fund Balances of Governmental Funds to the Statement of Activities .................................................................................................... 32 Statement of Net Position – Proprietary Funds ................................................................. 33 Statement of Revenues, Expenses, and Changes in Net Position– Proprietary Funds ............................................................................................ 34 Statement of Cash Flows – Proprietary Funds .................................................................. 35 Statement of Fiduciary Net Position – Fiduciary Funds ................................................... 36 Notes to Financial Statements ................................................................................................. 37 Required Supplementary Information (unaudited): Schedule of Changes in Net Pension Liability and Related Ratios……………………...82 Schedule of Contributions……………………………………………………………….83 Schedules of Funding Progress………………………………………………………….84 Schedule of Revenues, Expenditures, and Changes in Fund Balance – Budget and Actual – General Fund ............................................................................ 85 Notes to Required Supplementary Information – General Fund ...................................... 86 Supplementary Information –Non-major Governmental Funds................................................... 87 Combining Balance Sheet – Non-major Governmental Funds .................................................... 88 Combining Statement of Revenues, Expenditures, and Changes in Fund Balances – Non-major Governmental Funds .......................................................................... 89 Schedules of Revenues, Expenditures, and Changes in Fund Balances – Budget and Actual: Debt Service Fund ................................................................................................................... 90 Mansfield Parks Facilities Development Corporation Debt Service Fund .............................. 91 Statement of Changes in Assets and Liabilities Agency Funds ................................................... 92

Capital Assets Used in the Operation of Governmental Funds: Comparative Schedules By Source ................................................................................... 93 Schedule by Function and Activity ................................................................................... 94 Schedule of Changes by Function and Activity. ............................................................... 95 Balance Sheet – Mansfield Economic Development Corporation .......................................... 97 Statement of Revenues, Expenditures, and Changes in Fund Balances Mansfield Economic Development Corporation. .............................................. 98 Reconciliation of the Statement of Revenues, Expenditures, and Changes in Fund Balances - Mansfield Economic Development Corporation to the Statement of Activities ...................................................................................................... 99 STATISTICAL SECTION (unaudited) Net Position by Component .................................................................................................. 101 Changes in Net Position of Governmental and Business-Type Activities ........................... 102 Governmental Activities Tax Revenue by Source ................................................................ 104 Fund Balances of Governmental Funds ................................................................................ 105 Changes in Fund Balances of Governmental Funds .............................................................. 106 Assessed Value and Estimated Actual Value of Taxable Property ....................................... 108 Property Tax Rates – Direct and Overlapping Governments ................................................ 109 Principal Property Taxpayers ................................................................................................ 110 Property Tax Levies and Collections .................................................................................... 111 Ratio of Outstanding Debt by Type ...................................................................................... 112 Ratios of General Bonded Debt Outstanding ........................................................................ 113 Direct and Overlapping Governmental Activities Debt ........................................................ 114 Legal Debt Margin Information ............................................................................................ 115 Pledged-Revenue Coverage .................................................................................................. 116 Demographic and Economic Statistics .................................................................................. 117 Principal Employers .............................................................................................................. 118 Full-Time Equivalent City Government Employees by Function ......................................... 119 Operating Indicators by Function .......................................................................................... 120

3
1200 E. Broad Street Mansfield, Texas 76063 817-276-4200 February 7, 2018 To the Honorable Mayor, Members of City Council, and Citizens of the City of Mansfield, Texas
State law requires that all general-purpose local governments publish within six months of the close of each fiscal year a complete set of financial statements presented in conformity with generally accepted accounting principles (GAAP) and audited in accordance with generally accepted auditing standards by a firm of licensed certified public accountants. Pursuant to that requirement, we hereby issue the Comprehensive Annual Financial Report of the City of Mansfield, Texas (the City) for the fiscal year ended September 30, 2017.
This report consists of management’s representations concerning the finances of the City.
Consequently, management assumes full responsibility for the completeness and reliability of all of the information presented in this report. To provide a reasonable basis for making these representations, management of the City has established a comprehensive internal control framework that is designed both to protect the government’s assets from loss, theft, or misuse and to compile sufficient reliable information for the preparation of the City’s financial statements in conformity with GAAP. Because the cost of internal controls should not outweigh their benefits, the City’s comprehensive framework of internal controls has been designed to provide reasonable rather than absolute assurance that the financial statements will be free from material misstatement. As management, we assert that, to the best of our knowledge and belief, this financial report is complete and reliable in all material respects.
The City’s financial statements have been audited by KPMG, LLP, a firm of licensed certified
public accountants. The purpose of the independent audit was to provide reasonable assurance that the financial statements of the City for the fiscal year ended September 30, 2017 are free of material misstatement. The independent audit involved examining, on a test basis, evidence supporting the amounts and disclosures in the financial statements; assessing the accounting principles used and significant estimates made by management; and evaluating the overall financial statement presentation. The independent auditors concluded, based upon the audit, that there was a reasonable basis for rendering an unmodified opinion that the City’s financial statements for the fiscal year ended September 30, 2017 are fairly presented in conformity with GAAP. The independent auditors’ report is presented as the first component of the financial section of this report.
GAAP requires that management provides a narrative introduction, overview, and analysis to
accompany the basic financial statements in the form of Management’s Discussion and Analysis (MD&A). This letter of transmittal is designed to complement MD&A and should be read in conjunction with it. The City’s MD&A can be found immediately following the report of the independent auditors.

4
Profile of the Government
The City, incorporated in 1890, is located in the southeastern portion of Tarrant County, with small areas of the City extending into Johnson and Ellis counties, and is considered to be one of the top growth areas in the Dallas/Fort Worth Metropolitan Area (Metroplex). The City currently occupies a land area of 36.69 square miles and serves an approximate population of 68,784. The City is empowered to levy a property tax on both real and personal properties located within its boundaries. It is also empowered by state statute to extend its corporate limits by annexation, which occurs periodically when deemed appropriate by the governing council.
The City is a home rule-city and operates under the council-manager form of government. Policy-making and legislative authority are vested in a governing council consisting of the mayor and six other members. The governing council is responsible for, among other things, passing ordinances, adopting the budget, appointing committees, and hiring the City’s manager. The City Manager is responsible for carrying out the policies and ordinances of the governing council, for overseeing the day-to-day operations of the government, and for appointing the heads of the various departments. The council is elected on a nonpartisan, at-large basis. Council members serve three-year staggered terms so that at least two members are elected every year. The Mayor and each Council member, unless sooner removed under the provisions of the City Charter, hold office until a qualified successor is elected. Regular terms of office commence at the beginning of the first regular meeting of the Council in May or following the final election as provided in Section 4.05 (Charter Amendment of August 11, 1979).
This report includes all funds of the City. The City provides a full range of services. These services include police and fire protection; sanitation services; the construction and maintenance of highways, streets, traffic engineering, and infrastructure; planning and zoning; general administrative services; water treatment and distribution; sewer service; drainage enhancements and improvements; and recreational and cultural activities. In addition to general government activities, the Mansfield Park Facilities Development Corporation and the Mansfield Economic Development Corporation are required to be included in the City’s reporting entity. For additional information, see note I.A. of the notes to financial statements.
The annual budget serves as the foundation for the City’s financial planning, financial policies, and financial control. All agencies of the City are required to submit requests for appropriation to the City Manager. The City Manager uses these requests as the starting point for developing a proposed budget. The City Manager then presents this proposed budget to the Council for review prior to September 1. The City Council is required to hold public hearings on the proposed budget and to adopt a final budget no later than September 15. The appropriated budget is prepared by fund, function (e.g., public safety), and department (e.g., police). However, the statutory authority or legal level of control for the authority of annual expenditures is appropriated at the fund level by the City Council. Department heads may make transfers of appropriations within a department. Transfers of appropriations between departments, however, require the special approval of the governing council, if requested by the City Council. Budget-to-actual comparisons are provided in this report for each individual governmental fund for which an appropriated annual budget has been adopted. For the general fund, this comparison is presented on page 86 as part of the required supplementary information. For governmental funds, other than the general fund, with appropriated annual budgets, this comparison is presented in the combining and individual fund statements and schedules section, which starts on page 89.
Factors Affecting Financial Condition
The information presented in the financial statements is perhaps best understood when it is considered from the broader perspective of the specific environment within which the City operates.
5
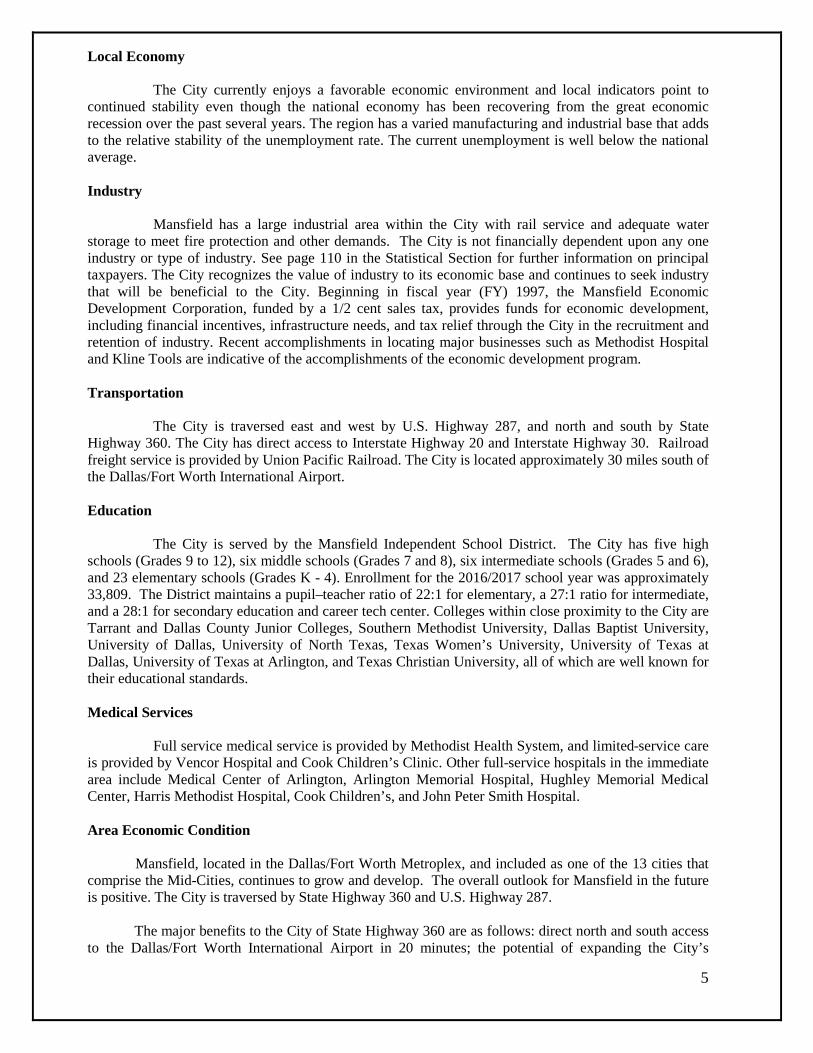
Local Economy The City currently enjoys a favorable economic environment and local indicators point to continued stability even though the national economy has been recovering from the great economic recession over the past several years. The region has a varied manufacturing and industrial base that adds to the relative stability of the unemployment rate. The current unemployment is well below the national average. Industry Mansfield has a large industrial area within the City with rail service and adequate water storage to meet fire protection and other demands. The City is not financially dependent upon any one industry or type of industry. See page 110 in the Statistical Section for further information on principal taxpayers. The City recognizes the value of industry to its economic base and continues to seek industry that will be beneficial to the City. Beginning in fiscal year (FY) 1997, the Mansfield Economic Development Corporation, funded by a 1/2 cent sales tax, provides funds for economic development, including financial incentives, infrastructure needs, and tax relief through the City in the recruitment and retention of industry. Recent accomplishments in locating major businesses such as Methodist Hospital and Kline Tools are indicative of the accomplishments of the economic development program. Transportation The City is traversed east and west by U.S. Highway 287, and north and south by State Highway 360. The City has direct access to Interstate Highway 20 and Interstate Highway 30. Railroad freight service is provided by Union Pacific Railroad. The City is located approximately 30 miles south of the Dallas/Fort Worth International Airport. Education The City is served by the Mansfield Independent School District. The City has five high schools (Grades 9 to 12), six middle schools (Grades 7 and 8), six intermediate schools (Grades 5 and 6), and 23 elementary schools (Grades K - 4). Enrollment for the 2016/2017 school year was approximately 33,809. The District maintains a pupil–teacher ratio of 22:1 for elementary, a 27:1 ratio for intermediate, and a 28:1 for secondary education and career tech center. Colleges within close proximity to the City are Tarrant and Dallas County Junior Colleges, Southern Methodist University, Dallas Baptist University, University of Dallas, University of North Texas, Texas Women’s University, University of Texas at Dallas, University of Texas at Arlington, and Texas Christian University, all of which are well known for their educational standards. Medical Services Full service medical service is provided by Methodist Health System, and limited-service care is provided by Vencor Hospital and Cook Children’s Clinic. Other full-service hospitals in the immediate area include Medical Center of Arlington, Arlington Memorial Hospital, Hughley Memorial Medical Center, Harris Methodist Hospital, Cook Children’s, and John Peter Smith Hospital.
Area Economic Condition Mansfield, located in the Dallas/Fort Worth Metroplex, and included as one of the 13 cities that comprise the Mid-Cities, continues to grow and develop. The overall outlook for Mansfield in the future is positive. The City is traversed by State Highway 360 and U.S. Highway 287.
The major benefits to the City of State Highway 360 are as follows: direct north and south access to the Dallas/Fort Worth International Airport in 20 minutes; the potential of expanding the City’s

6
commercial/industrial and residential developments along the corridor of State Highway 360, as well as the numerous industrial parks located within the close proximity of State Highway 360 and U.S. Highway 287 intersection.
Over the past several years, the City and the local economy have experienced increasing property values and sales tax revenues. Current real estate values are trending upward, and the City is continuing to experience positive growth in residential, industrial, and commercial properties. Long-Term Financial Planning The City of Mansfield, Texas has a long-term financial plan that includes ten years of projected financial data. The plan is intended to guide management in the daily decisions of managing the City’s business matters and long-term capital projects. The plan assembles the visions of City Council, Management and City Staff, into a working plan that allows the vision of the City to be implemented over the course of time. The plan includes variables that allow for current and projected economic factors including: Review population growth projections Identify potential high-growth areas Specify major infrastructure improvements Analyze the financial impact of the improvements Comprehensive planning documents, Land Use Plan, Thoroughfare Plan, Water & Sewer master
plan
The Council adopted the plan in November 2000, and it has been revised, modified, and amended since the original adoption of the plan.
Awards and Acknowledgments
The Government Finance Officers’ Association of the United States and Canada (GFOA) awarded a Certificate of Achievement for Excellence in Financial Reporting to the City for its comprehensive annual financial report for the fiscal year ended September 30, 2016. This was the 30th consecutive year that the government has achieved this prestigious award. In order to be awarded a Certificate of Achievement, a government must publish an easily readable and efficiently organized comprehensive annual financial report. This report must satisfy both GAAP and applicable legal requirements.
A Certificate of Achievement is valid for a period of one year only. We believe that our current comprehensive annual financial report continues to meet the Certificate of Achievement Program’s requirements and we are submitting it to the GFOA to determine its eligibility for another certificate.
In addition, the government also received the GFOA’s Distinguished Budget Presentation Award for its annual budget document dated October 1, 2016. In order to qualify for the Distinguished Budget Presentation Award, the City’s budget document was judged to be proficient in several categories, including as a policy document, a financial plan, an operations guide, and a communications device.
The preparation of this report would not have been possible without the efficient and dedicated services of the entire staff of the finance and administration department. We would like to express our appreciation to all members of the department who assisted and contributed to the preparation of this report. Credit also must be given to the mayor and the governing council for their unfailing support for maintaining the highest standards of professionalism in the management of the City’s finances.


8
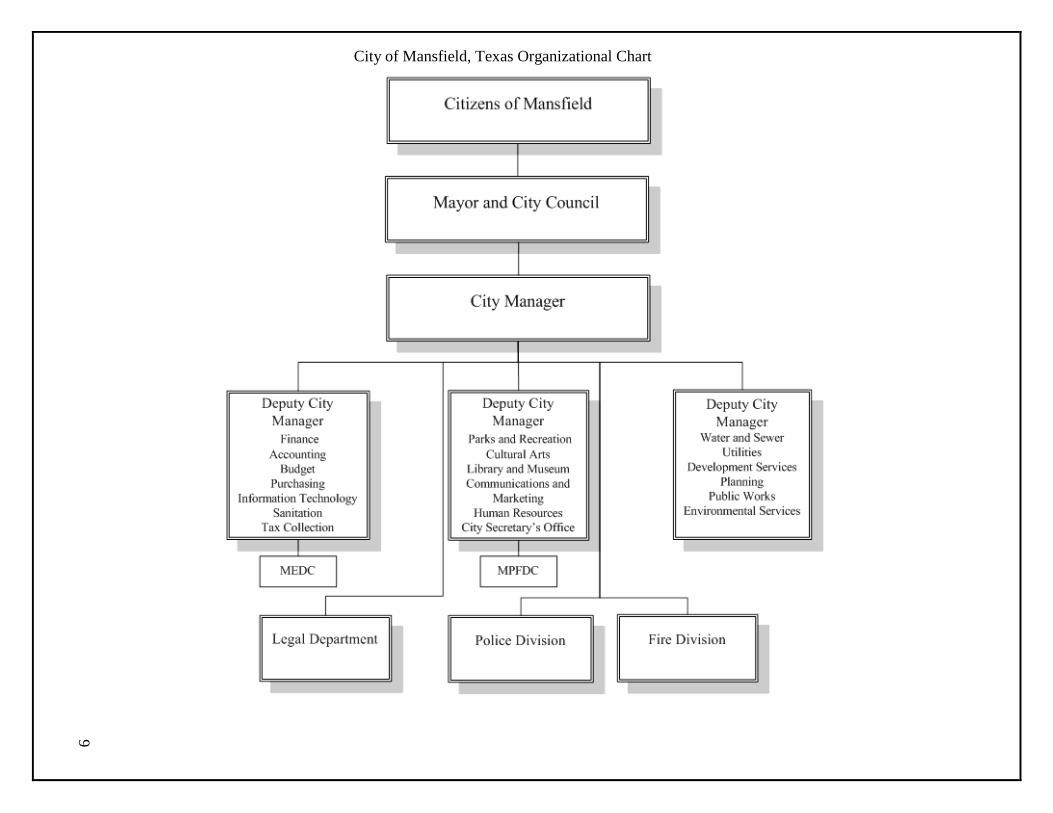
City of Mansfield, Texas Organizational Chart
9

10
CITY OF MANSFIELD, TEXAS
PRINCIPAL OFFICERS
SEPTEMBER 30, 2017
MAYOR
David Cook
MAYOR PRO TEM
Cory Hoffman
CITY COUNCIL
Stephen Lindsey Darryl Haynes Larry Broseh
Brent Newsom Terry Moore
CITY MANAGER
Clayton W. Chandler
DEPUTY CITY MANAGER
Peter K. Phillis, CPA
ASSISTANT FINANCE DIRECTOR
Troy Lestina

11

12
13

14
Management’s Discussion and Analysis
As management of the City of Mansfield, Texas (City), we offer readers of the City’s financial statements this narrative overview and analysis of the financial activities of the City for the fiscal year ended September 30, 2017. We encourage readers to consider the information presented here in conjunction with additional information that we have furnished in our letter of transmittal.
Financial Highlights
• The City’s net position or assets and deferred outflows less its liabilities and deferred inflows at the close of the City’s fiscal year is approximately $453 million. Of this amount, approximately $25 million may be used to meet the government’s ongoing obligations to its citizens and creditors.
• The City recognized approximately $132 million in revenue from various sources of taxes, services,
and capital contributions and recognized approximately $118 million in expenses in servicing the City’s governmental and business enterprises.
• As of the close of the current fiscal year, the City’s governmental funds reported a combined ending
fund balance of approximately $50 million. Approximately 29% of this $50 million is available for spending at the City’s discretion (unassigned fund balance).
• At the end of the current fiscal year, unassigned fund balance for the general fund was approximately
$14 million or 29% of total general fund expenditures. • The City’s total debt obligations increased by $28.5 million (14.29%) during the current fiscal year.
This is from approximately $44 million in new bond proceeds offset by $16 million in scheduled principal payments and payments to escrow agents during the year. The key factors affecting the City’s debt position are as follows:
Certificates of Obligation of $2.960 million for the purpose of constructing a public recreational facility. Certificates of Obligation of $18.975 million for the purpose of street improvements and other public purposes. Sales Tax Revenue Improvement Bonds of $8.295 million for the purpose of constructing a public recreational facility. Sales Tax Revenue Improvement Bonds of $14.125 million for the purpose of street improvements and other public purposes.
Overview of the Financial Statements
This discussion and analysis are intended to serve as an introduction to the City’s basic financial statements. The City’s basic financial statements comprise three components: 1) government-wide financial statements, 2) fund financial statements, and 3) notes to financial statements. This report also contains other supplementary information in addition to the basic financial statements themselves. Government-Wide Financial Statements The government-wide financial statements are designed to provide readers with a broad overview of the City’s finances, in a manner similar to a private-sector business.
15
The Statement of Net Position presents information on the City’s assets less liabilities as the City’s net financial position, or remaining net position. Over time, increases or decreases in net position may serve as a useful indicator of whether the financial position of the City is improving or deteriorating.
The Statement of Activities presents information showing how the City’s net position changed during the most recent fiscal year. All changes in net position are reported as soon as the underlying event giving rise to the change occurs, regardless of the timing of related cash flows. Thus, revenues and expenses are reported in this statement for some items that will only result in cash flows in future fiscal years (e.g., uncollected taxes).
Both of the government-wide financial statements distinguish functions of the City that are principally
supported by taxes and intergovernmental revenues (governmental activities) from other functions that are intended to recover all or a significant portion of their costs through user fees and charges (business-type activities). The governmental activities of the City include general government, public safety, public works, and culture and recreation. The business-type activities of the City include a Water and Sewer Fund, Law Enforcement Center Fund, and Drainage Utility Fund.
The government-wide financial statements include not only the City itself (known as the primary government), but also a legally separate Mansfield Economic Development Corporation for which the City is financially accountable. Financial information for this component unit is reported separately from the financial information presented for the primary government itself. The Mansfield Parks Facilities Development Corporation, although also legally separate, functions for all practical purposes as a department of the City and, therefore, has been included as an integral part of the primary government. The City has two Tax Increment Financing Reinvestment Zones (TIRZs), both legally separate entities, which are geographically defined regions within the City limits established by the City. The purpose of the reinvestment zone is to pay for the public’s infrastructure to be owned by the City within the region. The TIRZs are an integral part of the primary government. Fund Financial Statements
A fund is a grouping of related accounts that is used to maintain control over resources that have been segregated for specific activities or objectives. The City, like other state and local governments, uses fund accounting to ensure and demonstrate compliance with finance-related legal requirements. All of the funds of the City can be divided into three categories: governmental funds, proprietary funds, and fiduciary funds. Governmental Funds
Governmental funds are used to account for essentially the same functions reported as governmental activities in the government-wide financial statements. However, unlike the government-wide financial statements, governmental fund financial statements focus on near-term inflows and outflows of spendable resources as well as on balance of spendable resources available at the end of the fiscal year. Such information may be useful in evaluating a government’s near-term financing requirements.
Because the focus of governmental funds is narrower than that of the government-wide financial statements, it is useful to compare the information presented for governmental funds with similar information presented for governmental activities in the government-wide financial statements. By doing so, readers may better understand the long-term impact of the government’s near-term financing decisions. Both the governmental fund balance sheet and the governmental fund statement of revenues, expenditures, and changes in fund balances provide a reconciliation to facilitate this comparison between governmental funds and governmental activities.
The City maintains 11 individual governmental funds. Information is presented separately in the governmental fund balance sheet and in the governmental fund statement of revenues, expenditures, and changes in fund balances for the general fund, the debt service fund, the street construction fund, the building
16
construction fund, and the TIRZ Fund Number 1, all of which are considered to be major funds. Data from the other 6 governmental funds are combined into a single, aggregated presentation. Individual fund data for each of these non-major governmental funds are provided in the form of combining statements elsewhere in this report. Proprietary Funds
The City maintains three different proprietary funds. Enterprise funds are used to report the same functions presented as business-type activities in the government-wide financial statements. The City uses enterprise funds to account for its Water and Sewer Fund, Law Enforcement Center Fund, and Drainage Utility Fund.
Proprietary funds provide the same type of information as the government-wide financial statements, only in more detail. The proprietary fund financial statements provide separate information for the Water and Sewer Fund, the Law Enforcement Center Fund, and the Drainage Utility Fund, all of which are considered to be major funds of the City. Fiduciary Funds
Fiduciary funds are used to account for resources held for the benefit of parties outside the government. Fiduciary funds are not reflected in the government-wide financial statement because the resources of those funds are not available to support the City’s own programs. The accounting used for fiduciary funds is much like that used for proprietary funds. Notes to Financial Statements
The notes provide additional information that is essential to a full understanding of the data provided in the government-wide and fund financial statements. Other Information
The City adopts an annual appropriated budget for its general fund and both debt service funds. A budgetary comparison statement has been provided for these funds to demonstrate compliance with this budget. In addition to the basic financial statements and accompanying notes, this report also presents certain information concerning the City’s progress in funding its obligation to provide pension benefits to its employees.
The combining statements referred to earlier in connection with non-major governmental funds are presented immediately following the notes to the required supplementary information. Government-Wide Financial Analysis
As noted earlier, net position may serve over time as a useful indicator of a government’s financial
position. In the case of the City, assets and deferred outflows exceeded liabilities and deferred inflows by $453,128,857 at the close of the most recent fiscal year. By far, the largest portion of the City’s net position (84.48%) reflects its investment in capital assets (e.g., land, buildings, machinery, and equipment); less any related debt used to acquire those assets that are still outstanding. The City uses these capital assets to provide services to citizens; consequently, these assets are not available for future spending. Although the City’s investment in its capital assets is reported net of related debt, it should be noted that the resources needed to repay this debt must be provided from other sources, since the capital assets themselves cannot be used to liquidate these liabilities.
17
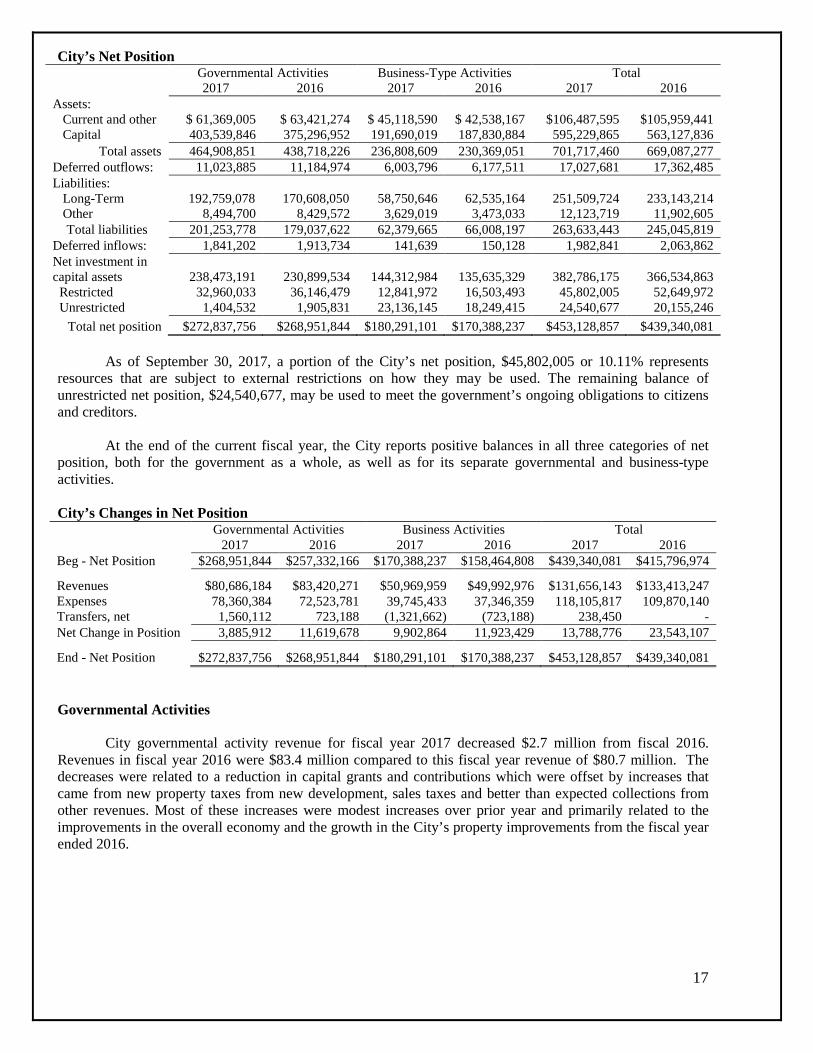
City’s Net Position Governmental Activities Business-Type Activities Total 2017 2016 2017 2016 2017 2016
Assets: Current and other $ 61,369,005 $ 63,421,274 $ 45,118,590 $ 42,538,167 $106,487,595 $105,959,441 Capital 403,539,846 375,296,952 191,690,019 187,830,884 595,229,865 563,127,836
Total assets 464,908,851 438,718,226 236,808,609 230,369,051 701,717,460 669,087,277 Deferred outflows: 11,023,885 11,184,974 6,003,796 6,177,511 17,027,681 17,362,485 Liabilities: Long-Term 192,759,078 170,608,050 58,750,646 62,535,164 251,509,724 233,143,214 Other 8,494,700 8,429,572 3,629,019 3,473,033 12,123,719 11,902,605
Total liabilities 201,253,778 179,037,622 62,379,665 66,008,197 263,633,443 245,045,819 Deferred inflows: 1,841,202 1,913,734 141,639 150,128 1,982,841 2,063,862 Net investment in capital assets
238,473,191
230,899,534
144,312,984
135,635,329
382,786,175
366,534,863
Restricted 32,960,033 36,146,479 12,841,972 16,503,493 45,802,005 52,649,972 Unrestricted 1,404,532 1,905,831 23,136,145 18,249,415 24,540,677 20,155,246 Total net position $272,837,756 $268,951,844 $180,291,101 $170,388,237 $453,128,857 $439,340,081
As of September 30, 2017, a portion of the City’s net position, $45,802,005 or 10.11% represents
resources that are subject to external restrictions on how they may be used. The remaining balance of unrestricted net position, $24,540,677, may be used to meet the government’s ongoing obligations to citizens and creditors.
At the end of the current fiscal year, the City reports positive balances in all three categories of net position, both for the government as a whole, as well as for its separate governmental and business-type activities.
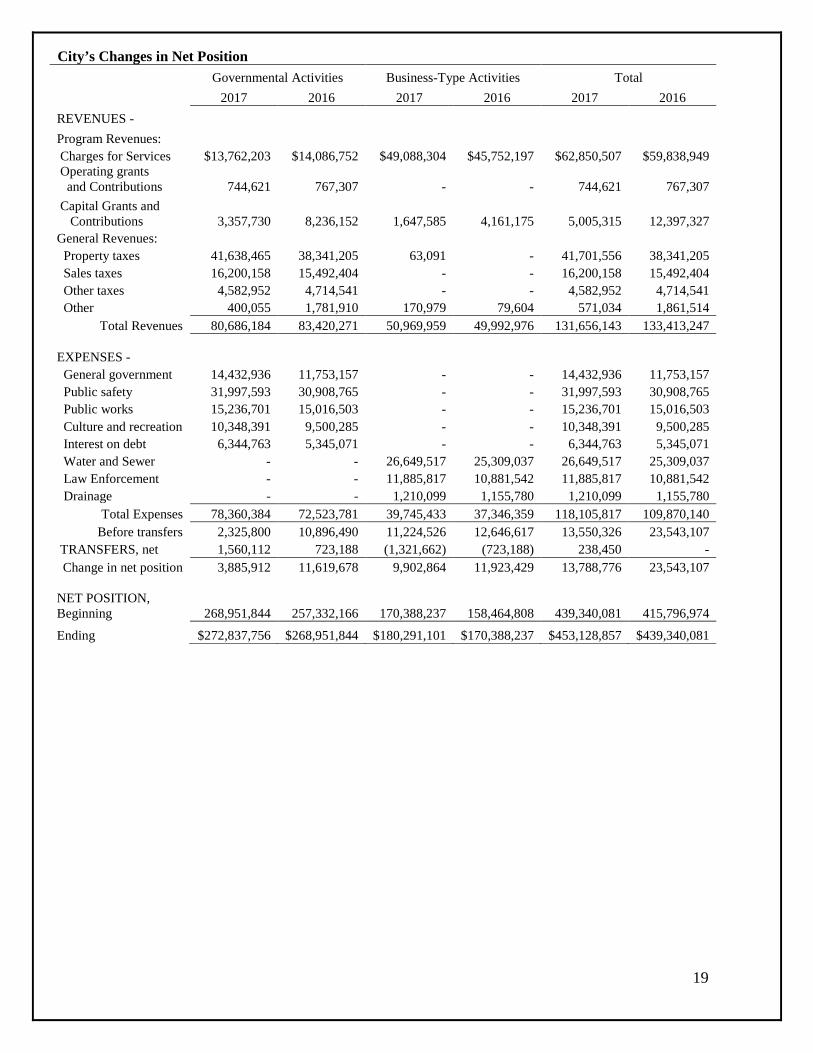
City’s Changes in Net Position
Governmental Activities Business Activities Total 2017 2016 2017 2016 2017 2016
Beg - Net Position $268,951,844 $257,332,166 $170,388,237 $158,464,808 $439,340,081 $415,796,974 Revenues $80,686,184 $83,420,271 $50,969,959 $49,992,976 $131,656,143 $133,413,247 Expenses 78,360,384 72,523,781 39,745,433 37,346,359 118,105,817 109,870,140 Transfers, net 1,560,112 723,188 (1,321,662) (723,188) 238,450 - Net Change in Position 3,885,912 11,619,678 9,902,864 11,923,429 13,788,776 23,543,107 End - Net Position $272,837,756 $268,951,844 $180,291,101 $170,388,237 $453,128,857 $439,340,081 Governmental Activities City governmental activity revenue for fiscal year 2017 decreased $2.7 million from fiscal 2016. Revenues in fiscal year 2016 were $83.4 million compared to this fiscal year revenue of $80.7 million. The decreases were related to a reduction in capital grants and contributions which were offset by increases that came from new property taxes from new development, sales taxes and better than expected collections from other revenues. Most of these increases were modest increases over prior year and primarily related to the improvements in the overall economy and the growth in the City’s property improvements from the fiscal year ended 2016.

18
Governmental Activities - Revenues by Source for fiscal year ending 2017
Expenses in fiscal year 2017 compared to expenses in fiscal year 2016 increased by 8.05% or $5.8
million. The demand for services increased expenditures in fiscal 2017 compared to prior year. The increases: legal services, infrastructure costs and public safety have been a priority of the administration in recent years. The increases occurred in public safety primarily due to added new personnel and this department represents the greatest number of employees working for the City. The increase in public works was related to additional expenses for aging streets.
The public works program of the City spends most of its money on street improvements, which are
recognized over the course of time through depreciation expense after the improvements have been capitalized. In fiscal 2017, the City recognized $11.09 million in depreciation expense for street-related assets. Street improvements are expected to last twenty-five years with the appropriate level of maintenance and repair. This year, the City spent over $2.9 million in maintenance and repairs on its 590 plus miles of linear streets.
This year the City recognized $6.3 million in interest, amortization and associated issuance costs.
Interest expense is the cost the City incurs for borrowing money to make long-term improvements that are generally regarded as long-term assets of the City.
This fiscal year, the Governmental activities increased the City’s net position by $3.6 million. The
increase in the City net position primarily occurred because of capital contributions received by the City in the amount of $3.4 million.
Property Taxes 52%
Sales Taxes 20%
Other Taxes 6%
Other 0%
Grants and Contributions 5%
Charges for Services 17%
19
City’s Changes in Net Position Governmental Activities Business-Type Activities Total 2017 2016 2017 2016 2017 2016
REVENUES - Program Revenues:
Charges for Services $13,762,203 $14,086,752 $49,088,304 $45,752,197 $62,850,507 $59,838,949 Operating grants and Contributions
744,621
767,307
-
-
744,621
767,307
Capital Grants and Contributions
3,357,730
8,236,152
1,647,585
4,161,175
5,005,315
12,397,327
General Revenues: Property taxes 41,638,465 38,341,205 63,091 - 41,701,556 38,341,205 Sales taxes 16,200,158 15,492,404 - - 16,200,158 15,492,404 Other taxes 4,582,952 4,714,541 - - 4,582,952 4,714,541 Other 400,055 1,781,910 170,979 79,604 571,034 1,861,514
Total Revenues 80,686,184 83,420,271 50,969,959 49,992,976 131,656,143 133,413,247 EXPENSES - General government 14,432,936 11,753,157 - - 14,432,936 11,753,157 Public safety 31,997,593 30,908,765 - - 31,997,593 30,908,765 Public works 15,236,701 15,016,503 - - 15,236,701 15,016,503 Culture and recreation 10,348,391 9,500,285 - - 10,348,391 9,500,285 Interest on debt 6,344,763 5,345,071 - - 6,344,763 5,345,071 Water and Sewer - - 26,649,517 25,309,037 26,649,517 25,309,037 Law Enforcement - - 11,885,817 10,881,542 11,885,817 10,881,542 Drainage - - 1,210,099 1,155,780 1,210,099 1,155,780
Total Expenses 78,360,384 72,523,781 39,745,433 37,346,359 118,105,817 109,870,140 Before transfers 2,325,800 10,896,490 11,224,526 12,646,617 13,550,326 23,543,107
TRANSFERS, net 1,560,112 723,188 (1,321,662) (723,188) 238,450 - Change in net position 3,885,912 11,619,678 9,902,864 11,923,429 13,788,776 23,543,107
NET POSITION, Beginning 268,951,844 257,332,166 170,388,237 158,464,808 439,340,081 415,796,974
Ending $272,837,756 $268,951,844 $180,291,101 $170,388,237 $453,128,857 $439,340,081
20
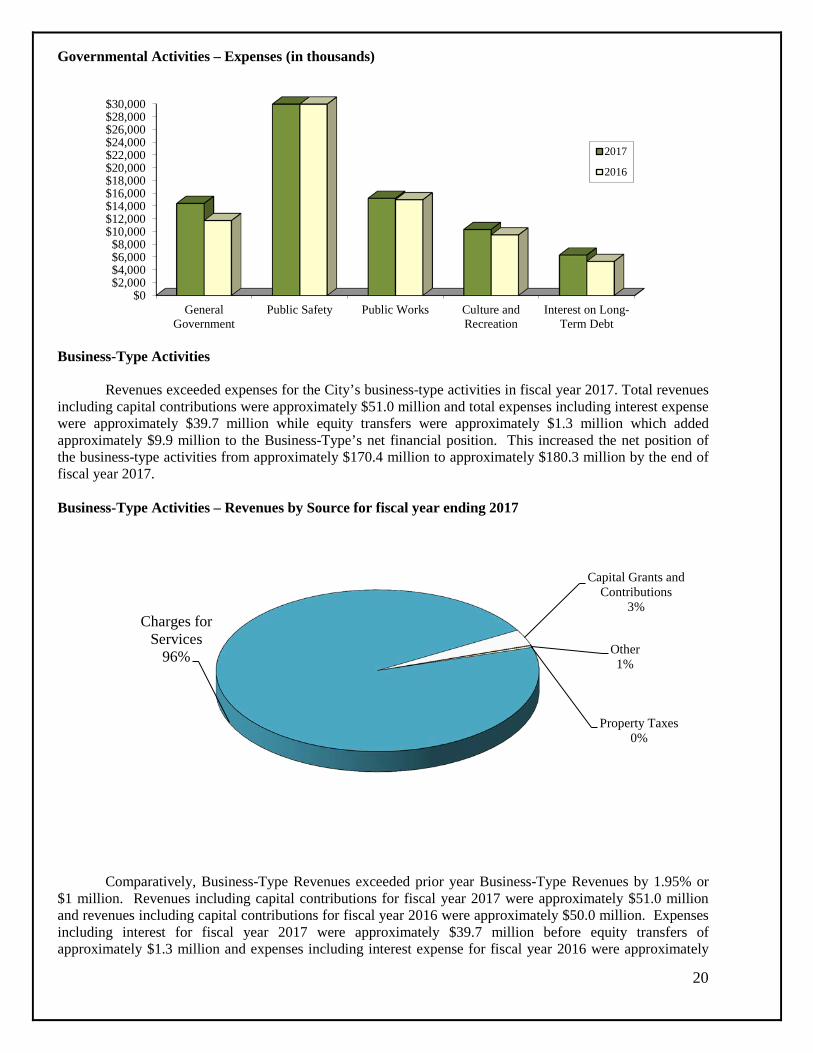
Governmental Activities – Expenses (in thousands)
Business-Type Activities Revenues exceeded expenses for the City’s business-type activities in fiscal year 2017. Total revenues including capital contributions were approximately $51.0 million and total expenses including interest expense were approximately $39.7 million while equity transfers were approximately $1.3 million which added approximately $9.9 million to the Business-Type’s net financial position. This increased the net position of the business-type activities from approximately $170.4 million to approximately $180.3 million by the end of fiscal year 2017. Business-Type Activities – Revenues by Source for fiscal year ending 2017
Comparatively, Business-Type Revenues exceeded prior year Business-Type Revenues by 1.95% or $1 million. Revenues including capital contributions for fiscal year 2017 were approximately $51.0 million and revenues including capital contributions for fiscal year 2016 were approximately $50.0 million. Expenses including interest for fiscal year 2017 were approximately $39.7 million before equity transfers of approximately $1.3 million and expenses including interest expense for fiscal year 2016 were approximately
$0$2,000$4,000$6,000$8,000
$10,000$12,000$14,000$16,000$18,000$20,000$22,000$24,000$26,000$28,000$30,000
GeneralGovernment
Public Safety Public Works Culture andRecreation
Interest on Long-Term Debt
2017
2016
Capital Grants and Contributions
3%
Property Taxes 0%
Other 1%
Charges for Services
96%

21
$37.4 million before equity transfers of approximately $.7 million. The increase in net position was primarily the result of the activity of the City’s Water & Sewer Fund as the financial results of the City’s other Business-Type Funds, Law Enforcement Center Fund, and Drainage Utility Fund, for fiscal year 2017 was five percent of the change in the net position of the City’s Business-Type Activities. Capital contributions have been a revenue source for the Business-Type Activities. These capital contributions are from the public improvements donated by developers. The City requires developers to pay for the cost of public improvements or infrastructure needed to support their developments, and in fiscal year 2017, developers contributed public improvements or assets of $1.6 million. These assets are considered revenue in the year of acceptance or in the year of contribution. Generally, these capital contributions are non-cash contributions from developers and are in the form of water and sewer lines which are conveyed to the City as the developer finishes the developments. The City’s Law Enforcement Center charges a fee for the Services rendered to support the contracts that the City has with other governmental agencies for the housing of inmates. These fees are recognized as Charges for Services in the Business-Type Activities and are used to pay for the cost of housing inmates in this Business-Type Activity. The City’s Drainage Utility charges a fee for the maintenance and continuance of the drainage improvement program of the City. The City has drainage basins that require extensive maintenance. The fee is used to service the improvement cost, debt service, and annual maintenance of the basins. Business-Type Activities - Program Revenues and Expenses for fiscal year ending 2017
Financial Analysis of the Government’s Funds
As discussed earlier, the City uses fund accounting to ensure and demonstrate compliance with finance-related legal requirements. Governmental Funds
The focus of the City’s governmental funds is to provide information on near-term inflows, outflows, and balances of spendable resources. Such information is useful in assessing the City’s financing requirements.
$0
$4,000,000
$8,000,000
$12,000,000
$16,000,000
$20,000,000
$24,000,000
$28,000,000
$32,000,000
$36,000,000
Water and Sewer Law EnforcementCenter
Drainage
Program Revenues
Expenses

22
In particular, unassigned fund balance may serve as a useful measure of a government’s net resources available for spending at the end of the fiscal year.
As of the end of the current fiscal year, the City’s governmental funds reported combined ending fund balances of $49,656,506, a decrease of $2,310,823 in comparison with the prior year. The majority of the decrease is from the use of bond proceeds that were used to construct infrastructure and purchase equipment. Approximately 29.15% or $14,476,031 of the ending fund balance of $49,656,506 constitutes unassigned fund balance and is available for spending at the government’s discretion. The remainder of fund balance is dedicated for legally specific or defined purposes. To indicate that it is not available for new spending because it has already been committed, defined or legally restricted for specific purposes, the City has labeled the remaining fund balances as follows: 1) debt service or for future construction contracts, $30,913,672; 3) for committed purposes, $4,085,623, such as park improvements; and 4) for assigned purposes, $181,180, such as capital improvements and land acquisition.
The general fund is the chief operating fund of the City. At the end of the current fiscal year, the fund balance of the general fund was $14,476,031. As a measure of the general fund’s liquidity, it may be useful to compare both unassigned fund balance and total fund balance to total fund expenditures. Unassigned fund balance and total fund balance represent 29% of total general fund expenditures for fiscal year 2017.
The City’s General Fund unassigned fund balance and fund balance increased $1,399,050 in fiscal
year 2017. The key reasons for the increases are as follows:
• Actual revenues exceeded actual expenditures by $178,835 in the general fund.
• Other Sources of revenue included the Water and Sewer Utility Fund’s payment in-lieu of taxes to the City’s General Fund for the use of the City’s right of way. This amount was $1,321,662 in fiscal year 2017.
• The City operating expenses increased because of the City’s goal to maintain a quality workforce.
Funds were spent to maintain the workforce and maintain the morale through the administration of compensation. The primary increases are in the City’s Public Safety function as most of the employee group is in the City’s Public Safety function. The City has maintained a conservative strategy in managing the human resources of the City. Overall, a few new personnel were added during fiscal year 2017 and personnel costs were managed and funded based on demand for services.
The debt service fund has a fund balance of $622,577, which is restricted for the payment of debt
service. The net increase in fund balance during the current year in the debt service fund was $139,553. The City generally budgets to maintain a constant fund balance within the debt service fund during the fiscal year, and any excess collection in a year is generally spent or used in the following year. The City pays for tax-pledged debt through the Debt Service Fund.
The street construction fund balance increased by $5,617,946 during fiscal year 2017. This fund’s
fund balance increased as a result of bonds issued and contributions received offset by construction payments of $14,533,643 for the improvement of major streets and neighborhood streets in and throughout the City. Other activity within the street construction fund included additional revenues from development fees charged by the City for the impact or costs that new development has on primary streets within the City. The fee generated $2,084,019 in fiscal year 2017. The building construction fund expended $12,120,991 for the construction of the Field House and Stars Center recreational facilities. These facilities will add additional basketball, volleyball and ice skating venues to the City’s recreational programs. TIRZ #1 spent $185,170 for minor infrastructure improvements in the tax increment reinvestment zone.

23
Proprietary Funds
The City’s proprietary funds provide the same type of information found in the government-wide financial statements, but in more detail.
Unrestricted net position (deficit) of the Water and Sewer Fund at the end of the year amounted to
$22,946,896, for the Law Enforcement Center amounted to $(2,895,777), and for the Drainage Utility Fund amounted to $3,085,026. Factors affecting the performance of these activities are as follows:
• The City treats lake water and sells it to consumers for a fee. In fiscal year 2017, Water and Sewer
revenue increased $1,848,503 or 6.3%. The increase is attributable to new connects to the system in fiscal year 2017, and a water and sewer fee increase in fiscal year 2017. Weather influences the system’s revenue. Fiscal year 2017 was a fairly normal year in the North Texas area as the temperatures were considered to be average. The result was a fairly consistent year in Water and Sewer revenue for the City. Weather extremes can test the City’s ability to produce water for consumption and it can test the system’s ability to finance the infrastructure to supply the water to meet the demand of the consumer. A rainy year creates less demand for water, which creates less revenue to support the cost of financing the infrastructure, which is built to supply the demand for water in a year without rain.
• During fiscal year 2017, the City distributed 4.5 billion gallons of water while billing customers for
4.090 billion gallons of water usage or 91% of the actual plant’s production. In fiscal year 2016, the City billed for 3.968 billion gallons of water usage compared to actual plant production of 4.2 billion. Actual water and sewer revenue in fiscal year 2017 increased compared to fiscal year 2016. Actual water and sewer revenue in 2017 was $31.2 million compared to $29.3 million in fiscal 2016. Demand for water in fiscal year 2017 was consistent with demand for water in fiscal year 2016 even though the total number of customers increased year over year by 502 new accounts. The water and sewer activity of the business-type activities produced operating income of $10.4 million for fiscal year 2017 as compared to $9.9 million in fiscal year 2016.
• Unrestricted net position increased in the Water and Sewer Fund by $3,979,630. Operating expenses increased $1,581,410 over last year, excluding depreciation. Operating expenses are controlled through the direct administration of personnel costs and variable costs, which are directly caused by consumers’ demand for the water. The City spent $5,082,946 for raw water in fiscal year 2017 compared to $4,538,749 in fiscal year 2016, and the City spent $5,876,036 to treat the City wastewater in fiscal 2017 compared to $5,750,311 in fiscal year 2016. The cost for raw water increased year over year by $544,197 while the cost to treat used water increased year over year by $125,725.
• The Law Enforcement Center Fund had operating loss of ($415,044) this fiscal year. The operating
loss is attributable to the increase in operating expenses to manage the facility in fiscal year 2017. These costs are offset by transfers from the General Fund, which pay for the City’s portion of jail services. No transfers from the General Fund were made in fiscal year 2017 as transfers were made in fiscal year 2016.
• The Drainage Utility Fund revenue had operating income of $1,432,958 this fiscal year. Drainage Fees were approximately $2.494 million and operating expenses excluding depreciation were $922,507. The City raised the drainage fees in fiscal year 2016. The revenue increase is attributable to the fee increase that occurred in fiscal year 2016. The average residential customer fee increased $3 per month.

24
Budgetary Highlights General Fund
The City opted to compare the final budget to the actual amounts for comparative purposes. The differences can be briefly summarized as follows:
Revenue results exceeded budgeted estimates by $614,198 for fiscal year ended 2017:
• Property Taxes were below budgeted estimates by $655,851 as collections were less than anticipated.
Property valuations improved year over year which has improved overall property tax revenue compared to prior year; however, collections were anticipated to be greater than actual collections.
Sales Taxes exceeded budgeted projections by $390,149 as the effects of the national economy
loosened its hold on consumer spending in Mansfield, Texas, during fiscal 2017. New development occurred in 2017 that created new sales tax collections as well.
Licenses and permits exceeded budgeted estimates by $286,514. The City’s building permit revenues
were above expectations because of the economic recovery in the residential construction sector in the area; although the City’s economy performed well during the great recession, development has generally improved in the area because the region has been improving.
Intergovernmental revenue was unexpected grant revenue that was awarded to the City in fiscal year
2017. The grant revenue was received by the City in fiscal year 2017 and used for purpose of public safety.
Charges for services exceeded budgeted estimates by $606,048 as the majority of the better than
expected revenue was derived from the collections of fees for trash services within the City. Fees did increase for this service in fiscal year 2016 as the fees were raised to keep pace with the cost of inflation.
The most significant expenditure of the City was human capital. Management has been effective in
maintaining the human capital costs of the organization. With the other financing sources and uses activity included with the operational activity, the City’s revenue exceeded its expenditures for the fiscal year. The City was within the overall budget of $52,208,793 inclusive of all financial activity for the fiscal year 2017.
Capital Asset and Debt Administration Capital Assets The City’s investment in capital assets for its governmental and business-type activities as of September 30, 2017 amounts to $595,229,865 (net of accumulated depreciation). This investment in capital assets includes land, buildings and system, improvements, machinery and equipment, park facilities, roads, highways, and bridges.

25
City’s Capital Assets (net of depreciation)
Governmental Capital Assets Roadway expansion and improvements remain a primary element of the City’s public works program. In 2017, several major arterial thoroughfares in the City were widened to provide access to Mansfield’s developing retail centers. Mansfield has leveraged future tax revenue with general obligation bonds and anticipated the collection of roadway impact fees to pay for an expected $124 million in new street improvements over the next 10 years. Street projects in fiscal year 2017:
The City began to improve Debbie Lane west of FM157. Other road improvements include the
completion of Holland Road.
Several small arterial streets are under construction and design throughout neighborhoods.
In total, the City spent $14,533,643 in street improvements and related work during fiscal year 2017.
Most of the capital assets that were added to construction in progress or the asset base of the City during fiscal year 2017 were planned or budgeted expenditures during fiscal year 2017. The City plans its asset expansion with deliberate budgetary control and oversight as these costs are substantial and have a significant effect on the operational cost and performance of the City. Business-Type Assets
The City’s municipally owned and operated water and sewer system has maintained its superior rating by the Texas Commission on Environmental Quality. Approximately 24% of the City’s more than $62.8 million water/sewer improvement tab is expected to be paid by impact fees over the next ten years. These fees are designed to reduce the system’s initial costs in building and running water and sewer lines to the user. These impact fees must be used for capital purposes and are restricted as to use by law.
The City’s drainage program had some improvements this year which were mostly related improving systems detention basins. The City has spent over $7.5 million on the drainage improvements as of September 30, 2017.
For additional information on the City’s capital assets, see note III.C. of the basic financial statements.
Governmental Activities Business-Type Activities Total 2017 2016 2017 2016 2017 2016 Land $100,908,564 $100,312,730 $2,045,523 $2,125,523 $102,954,087 $102,438,253 Buildings and system
72,111,048
55,305,817
136,229,320
137,396,780
208,340,368
192,702,597
Improvements 6,684,582 7,793,237 2,382,642 2,430,432 9,067,224 10,223,669 Machinery and equipment
9,117,577
8,732,845
1,512,916
1,639,378
10,630,493
10,372,223
Infrastructure 174,677,980 174,172,081 39,348,135 38,791,702 214,026,115 212,963,783 Construction in progress
40,040,095
28,980,242
10,171,483
5,447,069
50,211,578
34,427,311
Total $403,539,846 $375,296,952 $191,690,019 $187,830,884 $595,229,865 $563,127,836

26
Long-Term Debt
At the end of the current fiscal year, the City had total principal outstanding of $227,730,000. Of this amount, $127,860,000 comprises debt backed by the full faith and credit of the government. The remainder of the City’s debt represents bonds secured solely by specified revenue sources (i.e., revenue bonds). The City’s Component Unit, Mansfield Economic Development Corporation, MEDC, has $22,030,000 in outstanding debt backed by a voter passed sales tax.
City’s Outstanding Debt - Tax Obligations and Revenue Bonds
Governmental Business-Type Component Unit Total Activities Activities MEDC 2017 Security Instrument: Tax obligation bonds $ 127,275,000 $ 585,000 $ - $ 127,860,000 Sales tax revenue bonds 32,135,000 - 22,030,000 54,165,000 Revenue bonds - 45,705,000 - 45,705,000
Total $ 159,410,000 $ 46,290,000 $22,030,000 $ 227,730,000
The City’s total debt increased $28,480,000 or 14.29% during the current fiscal year. Key factors for the increase are from the issuance of additional bonds, which were offset by principal payments on existing outstanding debt. The City issued $44,355,000 in new bonds proceeds. The City maintains bond ratings from three rating agencies:
Company
General Fund Bonds
Water and Sewer Revenue Bonds
Sales Tax Revenue Bonds
Drainage Revenue Bonds
Moody’s “Aa2” “Aa2” “Aa3” “Aa2” Standard & Poor’s “AAA” “AA+” “A+” “AA” Fitch “AA+” “AA+” “AA+” “AA” For additional information on the City’s debt obligations, see note III. H, of the basic financial
statements. The City Charter of the City and the statutes of the State of Texas do not prescribe a legal debt limit.
However, Article XI, Section 5 of the Texas Constitution, applicable to cities of more than 5,000 populations, limits the ad valorem tax rate to $2.50 per $100 assessed valuation. The City operates under a Home Rule Charter, which also imposes a limit of $2.50. The FY 2016/2017 Property Tax Rate was $0.71000 per $100 valuation with a tax margin of $1.79000 per $100 valuation based upon the maximum ad valorem tax rate noted above. Additional revenues up to $105,854,114 per year could be raised before reaching the maximum allowable tax base on the current year's appraised net taxable value of $5,913,637,667.
Economic Factors: Next Year’s Budgets and Rates The City Economy New residential construction is expected to add 1,032 units with approximately 540 single-family units in
2018. The City’s tax year is one year in arrear; the housing starts in calendar year 2017 are for budget year or fiscal year 2019. The new development is expected to generate additional ad valorem tax for fiscal year 2019.
The City’s annual growth in property valuation has increased 5.52% annually on average for the past ten
years. For fiscal years 2018 and 2019, the City’s valuations are expected to increase 11.41% and 6.9%, respectively. Generally, the City has weathered the great recession and property valuations are expected to improve in fiscal 2018 and into 2019. The improvements are expected because of limited residential

27
inventory, that the City is a good place to live as crime is low, that school ratings are fairly high, that land is affordable and the City’s proximity to Dallas and Fort Worth. The City is developing a discernable and identifiable character of being a place to enjoy a life and a good quality life. These intangible characteristics developed recently - over the last decade. The City is also seeing the continued demand for commercial development because of the significant discretionary spending ability of its residents and the relatively stable economy within the City.
Sales tax revenue is expected to increase with the new residential development and will grow annually;
like property valuations, the City has adjusted its projections of anticipated sales tax receipts in 2018 and 2019. The expected budgeted sales tax receipts in 2018 are anticipated to exceed actual collections of 2017 by 5%. Management is monitoring the collections of sales tax revenue and may modify projections into 2018 depending upon the overall economy.
Retail developments continue into 2018 and 2019. The challenge has been the effect of the national
economy and the ability of companies and businesses to obtain capital financing. The City has taken an aggressive position in continuing development in the City because of the support for continued retail development and the community’s expectation of additional retail. Development is expected to continue and new property valuations are expected from these developments.
Median income continues to be an attractive asset for additional development and many in the
development community are planning on capturing this income through commercial developments. The City has developed stringent building standards that require sustainable developments to assist in
extending the asset life of the tax base into the future.
Efforts have been made to revitalize the City’s downtown. The area has suffered in past years from the lack of commerce and trade. The City has created a reinvestment zone to restore and generate new development in this area of the City. The City has purchased land and offered incentives to businesses for locating their new operations in the downtown area. The area is beginning to show signs of growth from the efforts and incentivization.
These variables were considered in preparing the City’s budget for the 2018 fiscal year.
The City’s 2018 General Fund Operating Revenue Budget increased approximately 10.1% or $5.3
million over the fiscal year 2017 budget. Most of this revenue growth was from new development in the City that generated additional property tax and sales tax revenue of almost $5 million. The tax rate was held constant in 2018 at $0.71 per $100 in assessed valuation of property within the City limits. Unassigned fund balance is expected to grow over fiscal year 2017 by $1.0 million. Any additional appropriations made during fiscal year 2018 will be offset through the management of the operating expenditures of the General Fund during the course of fiscal year 2018. Requests for Information
This financial report is designed to provide a general overview of the City’s finances for all those with an interest in the City’s finances. Questions concerning any of the information provided in this report or requests for additional financial information should be addressed to the City of Mansfield, 1200 E. Broad Street, Mansfield, Texas 76063. Questions may also be directed to 817-276-4257.
28
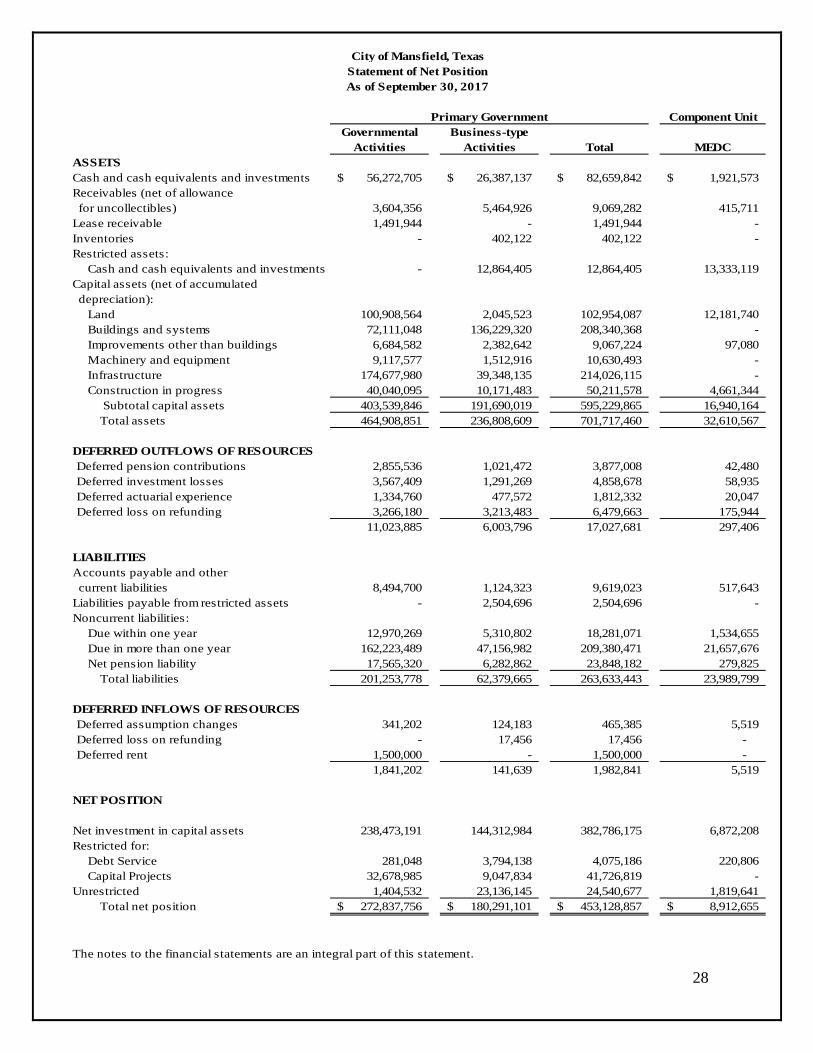
Component UnitGovernmental Business-type
Activities Activities Total MEDCASSETSCash and cash equivalents and investments 56,272,705$ 26,387,137$ 82,659,842$ 1,921,573$ Receivables (net of allowance for uncollectibles) 3,604,356 5,464,926 9,069,282 415,711 Lease receivable 1,491,944 - 1,491,944 - Inventories - 402,122 402,122 - Restricted assets: Cash and cash equivalents and investments - 12,864,405 12,864,405 13,333,119 Capital assets (net of accumulated depreciation): Land 100,908,564 2,045,523 102,954,087 12,181,740 Buildings and systems 72,111,048 136,229,320 208,340,368 - Improvements other than buildings 6,684,582 2,382,642 9,067,224 97,080 Machinery and equipment 9,117,577 1,512,916 10,630,493 - Infrastructure 174,677,980 39,348,135 214,026,115 - Construction in progress 40,040,095 10,171,483 50,211,578 4,661,344 Subtotal capital assets 403,539,846 191,690,019 595,229,865 16,940,164 Total assets 464,908,851 236,808,609 701,717,460 32,610,567
DEFERRED OUTFLOWS OF RESOURCESDeferred pension contributions 2,855,536 1,021,472 3,877,008 42,480 Deferred investment losses 3,567,409 1,291,269 4,858,678 58,935 Deferred actuarial experience 1,334,760 477,572 1,812,332 20,047 Deferred loss on refunding 3,266,180 3,213,483 6,479,663 175,944
11,023,885 6,003,796 17,027,681 297,406
LIABILITIESAccounts payable and other current liabilities 8,494,700 1,124,323 9,619,023 517,643 Liabilities payable from restricted assets - 2,504,696 2,504,696 - Noncurrent liabilities: Due within one year 12,970,269 5,310,802 18,281,071 1,534,655 Due in more than one year 162,223,489 47,156,982 209,380,471 21,657,676 Net pension liability 17,565,320 6,282,862 23,848,182 279,825 Total liabilities 201,253,778 62,379,665 263,633,443 23,989,799
DEFERRED INFLOWS OF RESOURCESDeferred assumption changes 341,202 124,183 465,385 5,519 Deferred loss on refunding - 17,456 17,456 - Deferred rent 1,500,000 - 1,500,000 -
1,841,202 141,639 1,982,841 5,519
NET POSITION
Net investment in capital assets 238,473,191 144,312,984 382,786,175 6,872,208 Restricted for: Debt Service 281,048 3,794,138 4,075,186 220,806 Capital Projects 32,678,985 9,047,834 41,726,819 - Unrestricted 1,404,532 23,136,145 24,540,677 1,819,641 Total net position 272,837,756$ 180,291,101$ 453,128,857$ 8,912,655$
The notes to the financial statements are an integral part of this statement.
City of Mansfield, TexasStatement of Net PositionAs of September 30, 2017
Primary Government
29
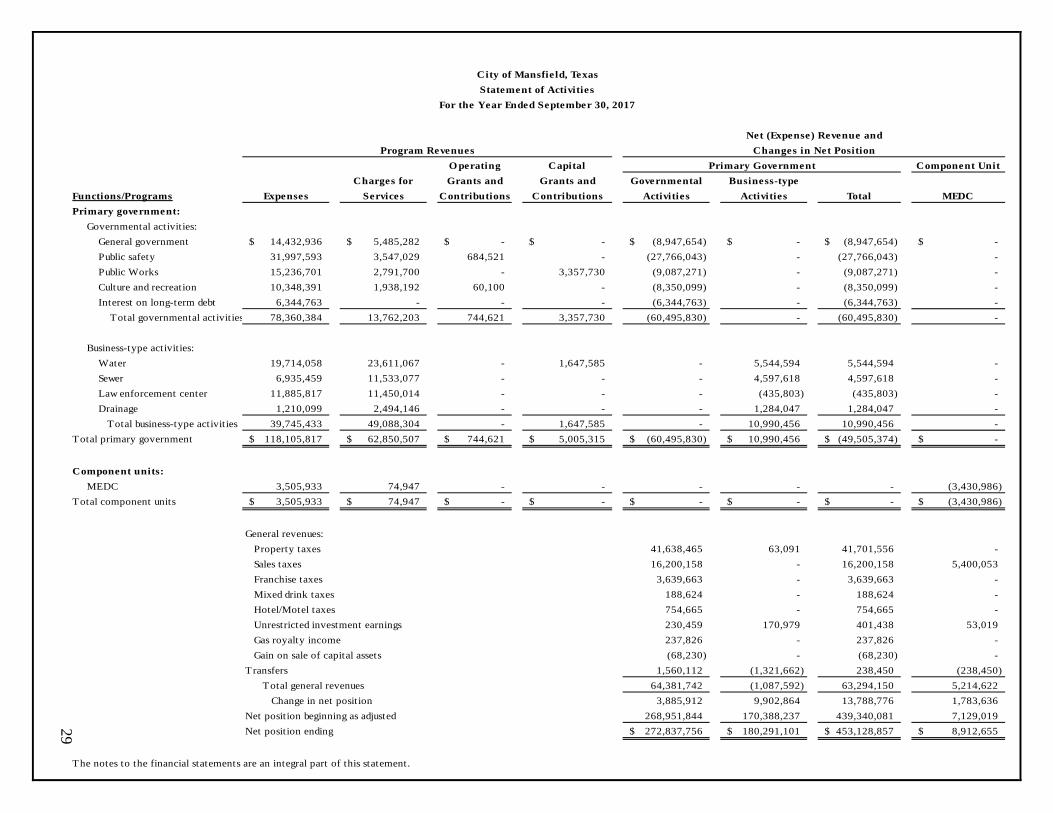
O perating Capital Component UnitCharges for Grants and Grants and Governmental Business-type
Functions/Programs Expenses Services Contributions Contributions Activities Activities Total MEDCPrimary government: Governmental activities: General government 14,432,936$ 5,485,282$ -$ -$ (8,947,654)$ -$ (8,947,654)$ -$ Public safety 31,997,593 3,547,029 684,521 - (27,766,043) - (27,766,043) - Public Works 15,236,701 2,791,700 - 3,357,730 (9,087,271) - (9,087,271) - Culture and recreation 10,348,391 1,938,192 60,100 - (8,350,099) - (8,350,099) - Interest on long-term debt 6,344,763 - - - (6,344,763) - (6,344,763) - Total governmental activities 78,360,384 13,762,203 744,621 3,357,730 (60,495,830) - (60,495,830) -
Business-type activities: Water 19,714,058 23,611,067 - 1,647,585 - 5,544,594 5,544,594 - Sewer 6,935,459 11,533,077 - - - 4,597,618 4,597,618 - Law enforcement center 11,885,817 11,450,014 - - - (435,803) (435,803) - Drainage 1,210,099 2,494,146 - - - 1,284,047 1,284,047 - Total business-type activities 39,745,433 49,088,304 - 1,647,585 - 10,990,456 10,990,456 - Total primary government 118,105,817$ 62,850,507$ 744,621$ 5,005,315$ (60,495,830)$ 10,990,456$ (49,505,374)$ -$
Component units: MEDC 3,505,933 74,947 - - - - - (3,430,986) Total component units 3,505,933$ 74,947$ -$ -$ -$ -$ -$ (3,430,986)$
General revenues: Property taxes 41,638,465 63,091 41,701,556 - Sales taxes 16,200,158 - 16,200,158 5,400,053 Franchise taxes 3,639,663 - 3,639,663 - Mixed drink taxes 188,624 - 188,624 - Hotel/Motel taxes 754,665 - 754,665 - Unrestricted investment earnings 230,459 170,979 401,438 53,019 Gas royalty income 237,826 - 237,826 - Gain on sale of capital assets (68,230) - (68,230) - T ransfers 1,560,112 (1,321,662) 238,450 (238,450) Total general revenues 64,381,742 (1,087,592) 63,294,150 5,214,622 Change in net position 3,885,912 9,902,864 13,788,776 1,783,636 Net position beginning as adjusted 268,951,844 170,388,237 439,340,081 7,129,019 Net position ending 272,837,756$ 180,291,101$ 453,128,857$ 8,912,655$
The notes to the financial statements are an integral part of this statement.
Primary Government
City of Mansfie ld, TexasStatement of Activities
For the Year Ended September 30, 2017
Net (Expense) Revenue andProgram Revenues Changes in Net Position

30
Other TotalDebt Street Building TIRZ Governmental Governmental
General Service Construction Construction #1 Funds FundsASSETSCash, cash equivalents, and investments 14,626,524$ 622,577$ 19,188,883$ 6,779,135$ 2,935,684$ 12,119,902$ 56,272,705$ Receivables (net of allowance for uncollectibles) 2,554,996 97,598 - - 24,582 927,180 3,604,356 Due from other funds 201,241 - - - - - 201,241 Total assets 17,382,761$ 720,175$ 19,188,883$ 6,779,135$ 2,960,266$ 13,047,082$ 60,078,302$
LIABILITIES AND FUND BALANCESLiabilities: Accounts payable 1,198,666$ -$ 821,268$ 1,312,740$ 963,890$ 938,989 5,235,553 Due to other funds - - - 21,241 - 180,000 201,241 Accrued liabilities 1,046,223 - 6,946 - - 625,349 1,678,518 Retainage payable - - 134,970 523,388 - 59,077 717,435 Unearned revenue 661,841 97,598 - - - 1,829,610 2,589,049 Total liabilities 2,906,730 97,598 963,184 1,857,369 963,890 3,633,025 10,421,796
Fund balances: Restricted - 622,577 18,225,699 4,921,766 1,996,376 5,147,254 30,913,672 Commited - - - - - 4,085,623 4,085,623 Assigned - - - - - 181,180 181,180 Unassigned 14,476,031 - - - - - 14,476,031 Total fund balances 14,476,031 622,577 18,225,699 4,921,766 1,996,376 9,414,057 49,656,506 Total liabilities and fund balances 17,382,761$ 720,175$ 19,188,883$ 6,779,135$ 2,960,266$ 13,047,082$
Amounts reported for governmental activities in the statement of net position are different because: Capital assets used in governmental activities are not financial resources and, therefore, are not reported in the funds. 403,539,846 Lease receivables in the governmental activities are not financial resources and, therefore, are not reported in the funds. 1,491,944 Other long-term assets are not available to pay for current-period expenditures and, therefore, are deferred in the funds. 2,589,049 Long-term liabilities, including bonds payable and pension expense, are not due and payable in the current period and therefore are (184,439,589) not reported in the funds Net position of governmental activities 272,837,756$
The notes to the financial statements are an integral part of this statement.
City of Mansfield, TexasBalance Sheet
Governmental FundsAs of September 30, 2017

31
Other TotalDebt Street Building TIRZ Governmental Governmental
General Service Construction Construction #1 Funds FundsREVENUESTaxes: Property 26,950,057$ 13,962,963$ -$ -$ 724,669$ 62,732$ 41,700,421$ Sales 10,800,106 - - - - 5,400,052 16,200,158 Franchise 3,639,663 - - - - - 3,639,663 Mixed drink 188,624 - - - - - 188,624 Hotel/motel - - - - - 754,665 754,665 Licenses and permits 1,759,695 - - - - 215,043 1,974,738 Intergovernmental 684,521 - - - - 16,061 700,582 Charges for services 4,764,006 - - - - 1,008,433 5,772,439 Fines 1,840,769 - - - - 131,715 1,972,484 Interest earnings 88,435 2,736 67,569 10,329 9,923 51,467 230,459 Contributions and donations - - - - - 44,039 44,039 Impact fees - - 2,084,019 - - 411,250 2,495,269 Miscellaneous 898,601 17,993 350,000 - - 168,509 1,435,103 Total revenues 51,614,477 13,983,692 2,501,588 10,329 734,592 8,263,966 77,108,644
EXPENDITURESCurrent: - General government 11,952,386 - - - - 1,023,621 12,976,007 Public safety 30,308,335 - - 135 - 296,108 30,604,578 Public works 4,244,277 - - - - - 4,244,277 Culture and recreation 4,291,402 - - - - 3,817,158 8,108,560 Debt service: Principal - 8,820,000 - - - 1,035,000 9,855,000 Interest - 4,993,351 - - - 1,124,287 6,117,638 Fiscal charges - 18,328 407 916 - 3,800 23,451 Bond issuance cost - 12,460 154,781 251,310 - 21,880 440,431 Capital outlay: Land 409,408 - - - - 186,426 595,834 Highways and streets - - 14,533,643 - 185,170 - 14,718,813 Buildings - - - 12,120,991 - 6,908,891 19,029,882 Improvements other than buildings 120,347 - - - - 84,347 204,694 Equipment 109,487 - - - - 1,137,694 1,247,181 Parks - - - - - 3,723,887 3,723,887 Total expenditures 51,435,642 13,844,139 14,688,831 12,373,352 185,170 19,363,099 111,890,233 Excess (deficiency) of revenues over (under) expenditures 178,835 139,553 (12,187,243) (12,363,023) 549,422 (11,099,133) (34,781,589)
OTHER FINANCING SOURCES (USES)Transfers in 1,562,352 - - - - 1,633,236 3,195,588 Transfers out (372,496) - - - (2,240) (1,260,740) (1,635,476) Sale of city property 30,359 - - - - 24,680 55,039 Bonds issued - - 17,174,808 11,718,065 - 1,337,127 30,230,000 Premium on bonds issued - - 630,381 25,001 - 41,073 696,455 Discounts on bonds issued - - - (70,840) - - (70,840) Total other financing sources and uses 1,220,215 - 17,805,189 11,672,226 (2,240) 1,775,376 32,470,766 Net change in fund balances 1,399,050 139,553 5,617,946 (690,797) 547,182 (9,323,757) (2,310,823) Fund balances - beginning 13,076,981 483,024 12,607,753 5,612,563 1,449,194 18,737,814 51,967,329 Fund balances - ending 14,476,031$ 622,577$ 18,225,699$ 4,921,766$ 1,996,376$ 9,414,057$ 49,656,506$
The notes to the financial statements are an integral part of this statement.
City of Mansfield, TexasStatement of Revenues, Expenditures, and Changes in Fund Balances
Governmental FundsFor the Year Ended September 30, 2017

32
Amounts reported for governmental activities in the statement of activities are different because:
Net change in fund balances total governmental funds (2,310,823)$
Governmental funds report capital outlays as expenditures. However, in the statement of activities, the cost of those assets is allocated over their estimated useful lives and reported as depreciation expense. This is the amount by which capital outlays exceeded depreciation in the current period. 25,008,438
The net effect of various miscellaneous transactions involving capital assets (i.e., sales, trade-ins, and donations) is to increase net assets. 3,234,461
Lease revenues in the statement of activities do not provide current financial resources and, therefore, are not reported as revenue in the funds. 350,000
Revenues in the statement of activities that do not provide current financial resources are not reported as revenue in the funds. (61,956)
Deferred outflows of resources represent a consumption of net position that applies to future periods and will not be recognized as an outflow until then. Deferred outflows are deferred pension contributions, deferred investment losses, deferred charges on refunding and deferred pension expenses. (161,091)
Deferred inflows of resources represent a consumption of net position that applies to future periods and will not be recognized as an inflow until then. Deferred inflows are deferred pension contributions
72,533 The issuance of long-term debt (e.g., bonds, leases) provides current financial resources to governmental funds, while the repayment of the principal of long-term debt consumes the current financial resources of governmental funds. Neither transaction, however, has any effect on net assets. Also, governmental funds report the effect of premiums, discounts, and similar items when debt is first issued, whereas these amounts are deferred and amortized in the treatment of long-term debt and related items. Also included is net pension liability which is the difference in Total Pension Liabilty less the Plan Fiduciary Net Position. (22,245,650)
Changes in net position of governmental activities 3,885,912$
The notes to the financial statements are an integral part of this statement.
City of Mansfield, TexasReconciliation of the Statement of Revenues,
Expenditures, and Changes in Fund Balances of Governmental Fundsto the Statement of Activities
For the Year Ended September 30, 2017
33
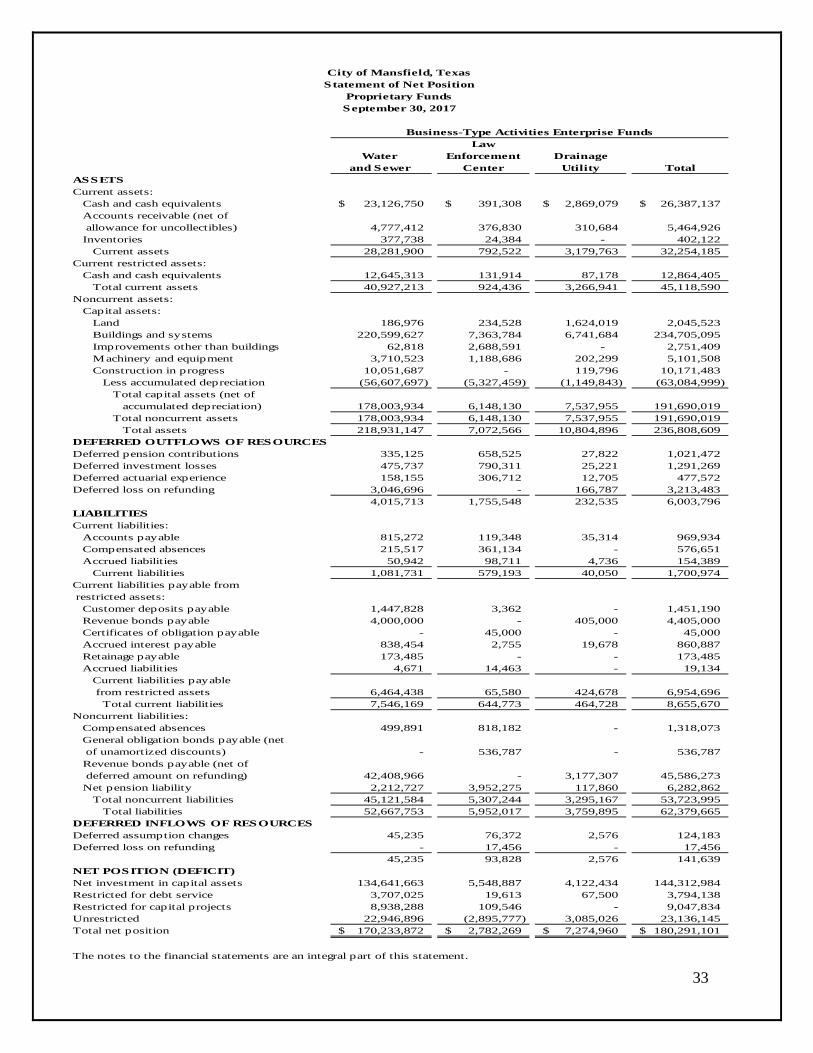
LawWater Enforcement Drainage
and Sewer Center Utility TotalASSETSCurrent assets: Cash and cash equivalents 23,126,750$ 391,308$ 2,869,079$ 26,387,137$ Accounts receivable (net of allowance for uncollectibles) 4,777,412 376,830 310,684 5,464,926 Inventories 377,738 24,384 - 402,122 Current assets 28,281,900 792,522 3,179,763 32,254,185 Current restricted assets: Cash and cash equivalents 12,645,313 131,914 87,178 12,864,405 Total current assets 40,927,213 924,436 3,266,941 45,118,590 Noncurrent assets: Capital assets: Land 186,976 234,528 1,624,019 2,045,523 Buildings and systems 220,599,627 7,363,784 6,741,684 234,705,095 Improvements other than buildings 62,818 2,688,591 - 2,751,409 Machinery and equipment 3,710,523 1,188,686 202,299 5,101,508 Construction in progress 10,051,687 - 119,796 10,171,483 Less accumulated depreciation (56,607,697) (5,327,459) (1,149,843) (63,084,999) Total capital assets (net of accumulated depreciation) 178,003,934 6,148,130 7,537,955 191,690,019 Total noncurrent assets 178,003,934 6,148,130 7,537,955 191,690,019 Total assets 218,931,147 7,072,566 10,804,896 236,808,609 DEFERRED OUTFLOWS OF RESOURCESDeferred pension contributions 335,125 658,525 27,822 1,021,472Deferred investment losses 475,737 790,311 25,221 1,291,269Deferred actuarial experience 158,155 306,712 12,705 477,572Deferred loss on refunding 3,046,696 - 166,787 3,213,483
4,015,713 1,755,548 232,535 6,003,796 LIABILITIESCurrent liabilities: Accounts payable 815,272 119,348 35,314 969,934 Compensated absences 215,517 361,134 - 576,651 Accrued liabilities 50,942 98,711 4,736 154,389 Current liabilities 1,081,731 579,193 40,050 1,700,974 Current liabilities payable from restricted assets: Customer deposits payable 1,447,828 3,362 - 1,451,190 Revenue bonds payable 4,000,000 - 405,000 4,405,000 Certificates of obligation payable - 45,000 - 45,000 Accrued interest payable 838,454 2,755 19,678 860,887 Retainage payable 173,485 - - 173,485 Accrued liabilities 4,671 14,463 - 19,134 Current liabilities payable from restricted assets 6,464,438 65,580 424,678 6,954,696 Total current liabilities 7,546,169 644,773 464,728 8,655,670 Noncurrent liabilities: Compensated absences 499,891 818,182 - 1,318,073 General obligation bonds payable (net of unamortized discounts) - 536,787 - 536,787 Revenue bonds payable (net of deferred amount on refunding) 42,408,966 - 3,177,307 45,586,273 Net pension liability 2,212,727 3,952,275 117,860 6,282,862 Total noncurrent liabilities 45,121,584 5,307,244 3,295,167 53,723,995 Total liabilities 52,667,753 5,952,017 3,759,895 62,379,665 DEFERRED INFLOWS OF RESOURCESDeferred assumption changes 45,235 76,372 2,576 124,183Deferred loss on refunding - 17,456 - 17,456
45,235 93,828 2,576 141,639 NET POSITION (DEFICIT)Net investment in capital assets 134,641,663 5,548,887 4,122,434 144,312,984 Restricted for debt service 3,707,025 19,613 67,500 3,794,138 Restricted for capital projects 8,938,288 109,546 - 9,047,834 Unrestricted 22,946,896 (2,895,777) 3,085,026 23,136,145 Total net position 170,233,872$ 2,782,269$ 7,274,960$ 180,291,101$
The notes to the financial statements are an integral part of this statement.
City of Mansfield, TexasStatement of Net Position
Proprietary FundsSeptember 30, 2017
Business-Type Activities Enterprise Funds

34
LawWater Enforcement Drainage
and Sewer Center Utility TotalOperating revenues: Charges for sales and services: Water sales 19,639,307$ -$ -$ 19,639,307$ Sewer charges 11,533,077 - - 11,533,077 Drainage fees - - 2,476,251 2,476,251 Housing services - 11,176,874 - 11,176,874 Other services 3,971,760 273,140 17,895 4,262,795 Total operating revenues 35,144,144 11,450,014 2,494,146 49,088,304
Operating expenses: Costs of sales and services 16,955,343 10,902,129 433,594 28,291,066 Administration 3,316,384 712,383 488,913 4,517,680 Depreciation 4,441,803 250,546 138,681 4,831,030 Total operating expenses 24,713,530 11,865,058 1,061,188 37,639,776 Operating income (loss) 10,430,614 (415,044) 1,432,958 11,448,528
Nonoperating revenues (expenses): Interest earnings 164,312 - 6,667 170,979 Interest expense (1,935,987) (20,759) (148,911) (2,105,657) Property tax revenue - 63,091 - 63,091 Total nonoperating revenue (expenses) (1,771,675) 42,332 (142,244) (1,871,587) Income (loss) before contributions and transfers 8,658,939 (372,712) 1,290,714 9,576,941 Capital contributions 1,647,585 - - 1,647,585 Transfers in (out) (1,321,662) - - (1,321,662) Change in net position 8,984,862 (372,712) 1,290,714 9,902,864 Total net position - beginning 161,249,010 3,154,981 5,984,246 170,388,237 Total net position- ending 170,233,872$ 2,782,269$ 7,274,960$ 180,291,101$
The notes to the financial statements are an integral part of this statement.
City of Mansfield, TexasStatement of Revenues, Expenses, and Changes in Fund Net Position
Proprietary FundsFor the Year Ended September 30, 2017
Business-type Activities Enterprise Funds

35
Law DrainageWater and Enforcement Utility
Sewer Fund Center Fund TotalsCASH FLOWS FROM OPERATING ACTIVITIES Receipts from customer and users 34,812,166$ 11,322,046$ 2,488,665$ 48,622,877$ Payments to suppliers (14,693,121) (1,316,639) (513,609) (16,523,369) Payments to employees (5,196,256) (9,576,631) (361,709) (15,134,596) Net cash provided by operating activities 14,922,789 428,776 1,613,347 16,964,912 CASH FLOWS FROM NONCAPITAL FINANCING ACTIVITIES Property tax revenue - 63,091 - 63,091 Transfer to/from other funds (1,321,662) - - (1,321,662) Net cash provided by (used in) capital and related financing activities (1,321,662) 63,091 - (1,258,571) CASH FLOWS FROM CAPITAL AND RELATED FINANCING ACTIVITIES Acquisition and construction of capital assets (6,996,415) (65,412) (4,841) (7,066,668) Principal paid on capital debt (4,020,000) (45,000) (400,000) (4,465,000) Interest paid on capital debt (2,039,234) (18,091) (128,170) (2,185,495) Net cash used in capital and related financing activities (13,055,649) (128,503) (533,011) (13,717,163) CASH FLOWS FROM INVESTING ACTIVITIES Interest and dividends received 164,312 - 6,667 170,979 Net cash provided by investing activities 164,312 - 6,667 170,979 Net increase in cash and cash equivalents 709,790 363,364 1,087,003 2,160,157
Cash and cash equivalents, October 1 35,062,273 159,858 1,869,254 37,091,385 Cash and cash equivalents, September 30 (including $12,645,313; $131,914; and $87,178 for the Water and Sewer fund, Law Enforcement Center fund, and Drainage Utility fund, respectively, reported in restricted accounts) 35,772,063$ 523,222$ 2,956,257$ 39,251,542$ Reconciliation of operating income to net cash provided by operating activities: Operating income (loss) 10,430,614$ (415,044)$ 1,432,958$ 11,448,528$ Adjustments to reconcile operating income to net cash provided by operating activities: Depreciation expense 4,441,803 250,546 138,681 4,831,030 (Increase) in accounts receivable (331,978) (127,968) (5,481) (465,427) Decrease in inventories 42,245 2,917 - 45,162 Increase in accounts payable 340,105 718,325 47,189 1,105,619 Total adjustments 4,492,175 843,820 180,389 5,516,384 Net cash provided by operating activities 14,922,789$ 428,776$ 1,613,347$ 16,964,912$ Noncash capital activities: Contributions of capital assets from developers 1,647,585$ -$ -$ 1,647,585$
The notes to the financial statements are an integral part of this statement.
City of Mansfield, TexasStatement of Cash Flows
Proprietary FundsFor the Year Ended September 30, 2017
Business-type Activities - Enterprise Funds
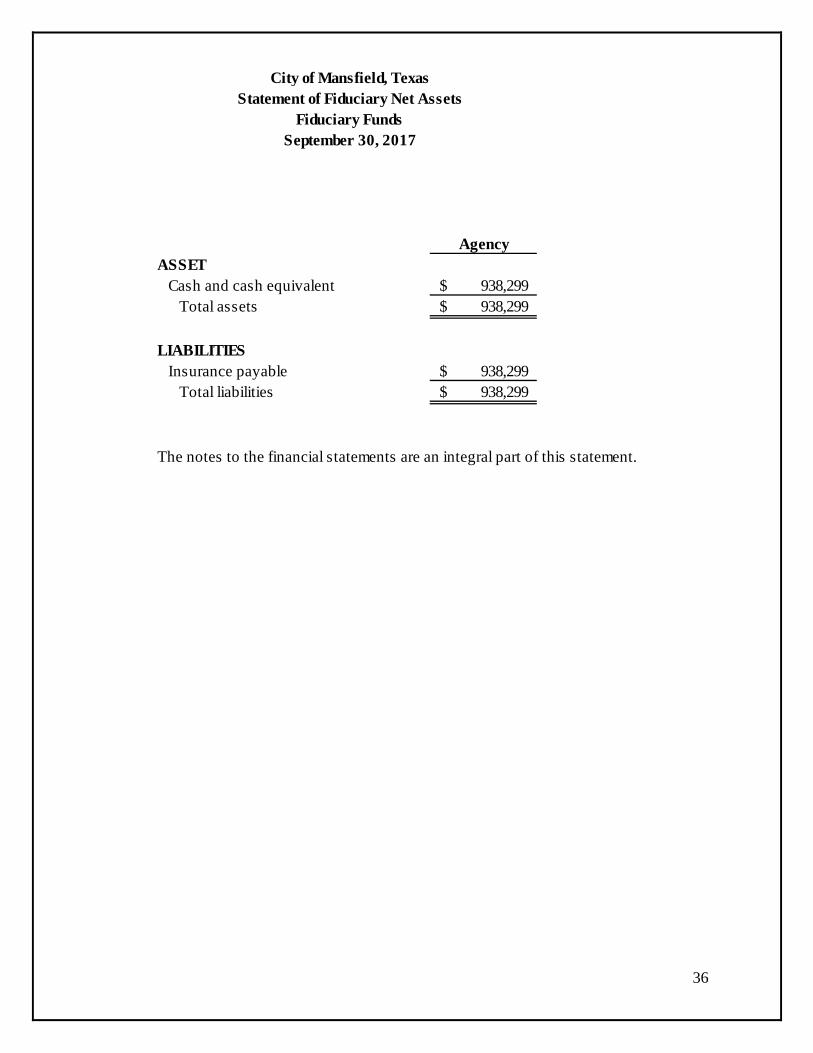
36
AgencyASSET Cash and cash equivalent 938,299$ Total assets 938,299$
LIABILITIES Insurance payable 938,299$ Total liabilities 938,299$
The notes to the financial statements are an integral part of this statement.
City of Mansfield, TexasStatement of Fiduciary Net Assets
Fiduciary FundsSeptember 30, 2017

37
CITY OF MANSFIELD, TEXAS
NOTES TO FINANCIAL STATEMENTS
SEPTEMBER 30, 2017
I. Summary of Significant Accounting Policies
The financial statements of the City of Mansfield, Texas (the City), have been prepared in conformity with accounting principles generally accepted in the United States of America (GAAP). The Governmental Accounting Standards Board (GASB) is the accepted standard-setting body for establishing governmental accounting and financial reporting principles. The significant accounting policies of the City are described herein.
New Accounting Pronouncements Implemented in Fiscal Year 2017 For fiscal year 2017, the City implemented the following statement issued by GASB.
GASB issued Statement No. 80, Blending Requirements for Certain Component Units – An Amendment of GASB Statement No. 14. The objective of this Statement is to improve financial reporting by clarifying the financial statement presentation requirements for certain component units. This Statement amends the blending requirements established in paragraph 53 of Statement No. 14, The Financial Reporting Entity, as amended. The requirements of this Statement are effective for financial statements for periods beginning after June 15, 2016. The implementation of this statement did not result in any significant changes to the financial statements.
A. Reporting Entity
The City is a municipal corporation governed by an elected mayor and six-member Council. As
required by GAAP, these financial statements present the City and its component units, for which the City is considered to be financially accountable. Blended component units, although legally separate entities, are in substance, part of the City’s operations, and data from these units are combined with data from the primary government. A discretely presented component unit, on the other hand, is reported in a separate column in the government-wide financial statements to emphasize that it is legally separate from the City.
Blended Component Units
Mansfield Park Facilities Development Corporation (MPFDC) - The MPFDC board of directors is
appointed by the City Council, and the City management maintains significant continuing management responsibility with respect to MPFDC policies. Additionally, the City is ultimately responsible for MPFDC fiscal matters. The MPFDC provides services exclusively to the City (i.e., the MPFDC constructs capital assets on behalf of the City). The MPFDC does not issue separate financial statements and the MPFDC is included in the other governmental funds.
Mansfield Tax Increment Financing Reinvestment Zone Number One (TIRZ #1) - The City and the City’s management maintain significant influence and management responsibility in the approval of programs, expenditures, and obligations of the TIRZ #1. The TIRZ #1 board of directors is a seven-member board; four members of the board of directors are members of the City’s Council with the remaining three board members appointed by the participating entities of the TIRZ #1 unless the participating entity waives its right to board membership, which at such time the City may appoint a member in its stead. Two Counties, Tarrant, and Ellis County, participate in the City’s TIRZ #1 as it is a
38
3,100-acre tract of land that is in three Counties. The TIRZ #1 does not issue separate financial statements, as the TIRZ #1 is included as a major fund of the City. The TIRZ #1 was established in December 2006 and is for the primary benefit of the City. The benefits include financing of the City’s infrastructure within the TIRZ #1, which are owned and maintained by the City.
Mansfield Tax Increment Financing Reinvestment Zone Number Two (TIRZ #2) – The City and
the City’s management maintain significant influence and responsibility in the approval of programs, expenditures, and obligations of the TIRZ #2. The TIRZ #2 board of directors is a five-member board; four members of the board of directors are members of the City’s Council with the remaining board member appointed by Tarrant County, the other participating entity. This TIRZ #2 was established to revitalize the City’s Historic Downtown area, which includes 317 developed acres. The TIRZ #2 does not issue separate financial statements, as the TIRZ #2 is included as a non-major fund of the City. The TIRZ #2 was established in December 2012 and is for the primary benefit of the City. The benefits include financing of the City’s infrastructure within the TIRZ #2, which will be owned and maintained by the City.
South Pointe Public Improvement District – The City established a public improvement district for
the purpose of maintaining public improvements on approximately 873 acres in the TIRZ number one area. An annual assessment will fund the public improvement district. There was no financial activity for fiscal year 2017.
Discretely Presented Component Unit
Mansfield Economic Development Corporation (MEDC) – In 1997, the voters passed an additional 1/2 cent sales tax to fund an aggressive economic development program and provide financial incentives, infrastructure needs, and tax relief in the recruitment and retention of industry. Although the City Council appoints all board members, none of the board members are currently City Council members or City employees. In addition, City management maintains significant continuing management responsibility with respect to MEDC financial matters. Although the MEDC financial matters are ratified or denied by the City, the City is not legally entitled to the MEDC resources or is it legally obligated for the indebtedness of the MEDC. The MEDC provides financial incentives to business and industry as permitted by statute and does not provide services entirely or almost entirely to the City and does not issue separate financial statements. B. Government-Wide and Fund Financial Statements
The basic financial statements include both government-wide (based on the City as a whole) and
fund financial statements. The government-wide financial statements (i.e., the statement of net position and the statement of activities) report information on all of the non-fiduciary activities of the primary government and its component units. As a general rule, the effect of interfund activity has been eliminated from the government-wide financial statements. Exceptions to this general rule are payments-in-lieu of taxes where amounts reasonably equivalent in value to the interfund services provided and other charges between the government’s water and sewer function and various other functions of the government. Elimination of these charges would distort the direct costs and program revenues reported for the various functions concerned.
Governmental activities, which normally are supported by taxes and intergovernmental revenues, are reported separately from business-type activities, which rely to a significant extent on fees and charges for support. Likewise, the primary government is reported separately from certain legally separate component units for which the primary government is financially accountable. The previous reporting model emphasized fund types (the total of all funds of a particular type); in the reporting model as defined by GASB Statement No. 34, Basic Financial Statements – and Management’s Discussion and Analysis – for State and Local Governments, the focus is either the City as a whole or major individual fund (within the fund financial statements).

39
The government-wide statement of activities demonstrates the degree to which the direct expenses
of a functional category (Police, Fire, Public Works, etc.) or segment are offset by program revenues. Direct expenses are those that are clearly identifiable with specific function or segment. Program revenues include 1) charges to customers or applicants who purchase, use, or directly benefit from goods, services, or privileges provided by a given function or segment, 2) grants and contributions that are restricted to meeting the operational requirements of a particular function or segment, and 3) grants and contributions that are restricted to meeting the capital requirements of a particular function or segment. Taxes and other items not properly included among program revenues are reported instead as general revenues.
The net cost (by function or business-type activity) is normally covered by general revenue
(property, sales, franchise taxes, interest income, etc.).
Separate fund-based financial statements are provided for governmental funds, proprietary funds, and fiduciary funds, even though the latter are excluded from the government-wide financial statements. Major individual governmental funds and major individual enterprise funds are reported as separate columns in the fund financial statements. The major governmental funds are the general fund, debt service fund, street construction fund, building construction fund, and TIRZ fund #1. The major enterprise funds are the water and sewer fund, the law enforcement center fund, and the drainage utility fund. GASB Statement No. 34 sets forth minimum criteria (percentage of assets, liabilities, revenues, or expenditures/expenses of either fund category for the governmental and enterprise combined) for the determination of major funds along with other qualitative factors. The non-major funds are combined in a separate column in the fund financial statements. The non-major funds are detailed in the combining section of the statements.
The City’s fiduciary funds are presented in the fund financial statements by type. Since by
definition these assets are being held for the benefit of a third party (other local governments, individuals, pension participants, etc.) and cannot be used to address activities or obligations of the government, these funds are not incorporated into the government-wide statements.
The government-wide focus is more on the sustainability of the City as an entity and the change in
aggregate financial position resulting from the activities of the fiscal period. The focus of the fund financial statements is on the major individual funds of the governmental and business-type categories, as well as the fiduciary fund (by category) and the component units. Each presentation provides valuable information that can be analyzed and compared to enhance the usefulness of the information. C. Measurement Focus and Basis of Accounting
The government-wide financial statements are reported using the economic resources measurement
focus. The government-wide financial statements are presented using the accrual basis of accounting, as are the proprietary fund and fiduciary fund statements. Revenues are recorded when earned and expenses are recorded when a liability is incurred, regardless of the timing of related cash flows. Property taxes are recognized as revenues in the year for which they are levied. Grants and similar items are recognized as revenue as soon as all eligibility requirements have been met.
Governmental fund financial statements are reported using the current financial resources
measurement focus and the modified accrual basis of accounting. Revenues are recognized when they are susceptible to accrual, as soon as they are both measurable and available. Revenues are considered to be available when they are collectible within the current period or soon enough thereafter to pay liabilities of the current period. For this purpose, the government considers ad valorem tax, sales tax, hotel/motel tax, mixed drink tax, and investment earnings to be available if they are collected within 60 days of the end of the current fiscal period. Franchise tax revenues are considered to be available if collected within 30 days of
40
the end of the current fiscal year. Expenditures generally are recorded when a liability is incurred, as under accrual accounting. However, debt service expenditures, as well as expenditures related to compensated absences and claims and judgments, are recorded only when the obligation has matured and will be paid shortly after year-end (not to exceed one month).
Licenses and permits, charges for services, fines, contributions and donations, impact fees, and
miscellaneous revenues are recorded as revenues when received in cash, as the amounts are typically not known until received. Investment earnings are recorded as earned since they are measurable and available. In applying the susceptible to accrual concept to intergovernmental revenues, the legal and contractual requirements of the numerous individual programs are used as guidance. There are, however, essentially two types of these revenues. In one, as soon as all eligibility requirements have been met, moneys must be expended for the specific purpose or project before any amounts will be paid to the City; therefore, revenues are recognized based upon the expenditures recorded. In the other, moneys are virtually unrestricted as to purpose of expenditure and are usually revocable only for failure to comply with prescribed compliance requirements. These resources are reflected as revenues at the time of receipt or earlier if all eligibility requirements are met.
A portion of the City’s revenues are derived from developer contributions. The effect of these
transactions, recorded as revenue, in the City’s water and sewer funds was significant. Developer’s contributions of $1,647,585 are recorded as non-operating revenue in the water and sewer fund financial statements. These amounts represent revenues from non-exchange transactions during the fiscal year. For reporting non-exchange transactions for the governmental activities, in the government-wide financial statements on the accrual basis of accounting, the revenues are recorded as capital contributions program revenue, which totaled $3,357,730.
Business-type activities and all proprietary funds are accounted for on a flow of economic resources measurement focus. With this measurement focus, all assets and all liabilities associated with the operation of these funds are included on the balance sheet. Proprietary fund-type operating statements present increases (e.g., revenues) and decreases (e.g., expenses) in net total assets. Proprietary funds distinguish operating revenues and expenses from non-operating items. Operating revenues and expenses generally result from providing services and producing and delivering goods in connection with a proprietary fund’s principal ongoing operations. The principal operating revenues of the City’s Water and Sewer Fund, Law Enforcement Center Fund, and Drainage Utility Fund are charges to customers for sales and services. Operating expenses for the proprietary funds include the cost of sales and services, administrative expenses, and depreciation on capital assets. All revenues and expenses not meeting this definition are reported as non-operating revenues and expenses. The government reports the following major governmental funds:
The General Fund is the operating fund of the City. All general tax revenues and other receipts that are not restricted by law or contractual agreement to some other fund are accounted for in this fund. General operating expenditures, the fixed charges, and the capital improvement costs that are not paid through other funds are paid from the General Fund.
The General Obligation Debt Service Fund (Debt Service) is used to account for the accumulation
of resources for and the payment of, principal and interest on general long-term obligation debt. The primary source of revenue is ad valorem taxes, which are levied by the City.
The Street Construction Fund accounts for the financial resources to be used in the construction of
roadways and bridges. The Fund is financed from general obligation bond proceeds, certificates of obligation proceeds, impact fees, developer contributions, or other sources.

41
The Building Construction Fund accounts for the financial resources to be used in the construction of general governmental buildings and facilities. The Fund is financed from general obligation bond proceeds, certificates of obligation proceeds, or other sources.
The TIRZ One Fund accounts for the financial resources to be used in the development,
construction, improvements, and acquisition of land within a boundary that encompasses 3,100 acres of mixed-use property. The Fund is financed from the increased property values above a preexisting property tax base on January 1, 2006. The year-over-year increase in property values will be contributed by the City and the participating Counties. The City’s contribution of property tax from the increased property values is 65% of the increased property within the TIF boundary, and the County’s contribution of property tax from the increased property values is 30% of the increased property within Counties limits within the TIF boundary.
The other governmental funds column is a summarization of all the non-major governmental fund
types.
The government reports the following major proprietary funds: The Water and Sewer Fund accounts for the operation of the City’s water and sewer system.
Activities of the Fund include administration, operation, and maintenance of the water and sewer system and billing and collection activities. The Fund also accounts for the accumulation of resources for, and the payment of, long-term debt principal and interest for general obligation, and revenue bonds. All costs are financed through charges made to utility customers with rates reviewed regularly and adjusted if necessary to ensure the integrity of the Fund.
The Law Enforcement Center Fund accounts for the operation of the City’s jail facility. The Drainage Utility Fund accounts for the operation of the City’s drainage system. Activities of
the Fund include administration, operation, and maintenance of the drainage system. The Fund also accounts for the accumulation of resources for, and the payment of, long-term debt principal and interest for revenue bonds. All costs are financed through charges made to utility customers with rates reviewed regularly and adjusted if necessary to ensure integrity of the Fund. Additionally, the government reports the following fund type:
Agency Funds are used to account for assets held by the City in a trustee capacity for others or for
other funds. Agency Funds are custodial in nature (assets equal liabilities) and do not have a measurement focus. They do, however, use the accrual basis of accounting to recognize receivables and payables. The Payroll Fund and the Employee Group Health Insurance Fund are the Agency Funds currently administered by the City. D. Assets, Liabilities, and Net Position or Equity
1. Deposits and Investments:
The City’s cash and cash equivalents are considered to be cash on hand, demand deposits, and investments with original maturities of three months or less from the end of the fiscal year.
The City maintains a cash and investment pool that is available for use by all funds. Each fund’s
portion of this pool is reflected on the balance sheet or statement of net position as “Cash, Cash Equivalents, and Investments” under each fund’s caption. Except for bond-related and other restricted transactions, the City conducted all its banking and investment transactions with the depository bank, JPMorgan Chase Bank, Mansfield.
42
For fiscal year 2017, the City invested in direct obligations of the U.S. government, or its agencies
and mutual funds as authorized by the City’s investment policy. The City records interest revenue earned from investment activities in each respective fund and recognizes its investments on a fair value basis, which is based on quoted market prices.
2. Inventory:
Inventory consists primarily of supplies, valued at cost. Cost is determined using the weighted average method. Inventory is charged to the user departments and recorded as expenses/expenditures when consumed rather than when purchased. 3. Prepaid Items:
Payments made to vendors for services that will benefit periods beyond are recorded as prepaid items. The non-spendable portion of the fund balance is provided equal to the amount of inventory, as the amount is not available for expenditure. These payments are recognized under the consumption method.
4. Capital Assets:
Capital assets, property, plant, equipment, and infrastructure assets (e.g., roads, bridges, sidewalks, and similar items) are reported in the applicable governmental or business-type activities columns in the government-wide financial statements. The government defines capital assets as assets with an initial, individual cost of more than $5,000 (amount not rounded) and an estimated useful life in excess of one year. Such assets are recorded at cost where historical records are available and at an estimated historical cost where no historical records exist. Donated fixed assets are valued at their estimated fair value on the date of donation.
The costs of normal maintenance and repairs that do not add to the value of the asset or materially
extend asset lives are not capitalized, while improvements and betterments are capitalized.
Depreciation has been calculated on each class of depreciable property using the straight-line method. Estimated useful lives are as follows:
Building and Improvements 50 years Water and Sewer Lines 50 years Vehicles, Machinery, and Equipment 4-10 years Infrastructure 25 years
Interest is capitalized on proprietary fund assets acquired with tax-exempt debt. The amount of
interest to be capitalized is calculated by offsetting interest expense incurred from the date of the borrowing until completion of the project with the interest earned on invested proceeds over the same period. The City capitalized $0 of interest during fiscal year 2017.
5. Deferred Inflows and Outflows:
In addition to assets, the statement of financial position will sometimes report a separate section for deferred outflows of resources. This separate financial statement element, deferred outflows of resources, represents a consumption of net position that applies to a future periods and will not be recognized as an outflow of resources (expense/expenditure) until the appropriate future period. The City has four items that qualify for this category. Deferred pension contributions relate to contributions made by the City after the measurement date so they are deferred and recognized in the upcoming fiscal year. Deferred investment losses are the differences in the projected and actual earnings on the pension assets. This difference is

43
deferred and amortized over a closed five year period. Deferred actuarial expense is the difference in the expected and actual pension experience. This difference is deferred and amortized over the estimated average remaining lives of all members determined as of the measurement date. Deferred loss on refunding are the differences in carrying value of the refunded debt compared to its acquisition price. This difference is deferred and amortized over the remaining life of the refunded debt.
This separate financial statement element, deferred inflows of resources is used to report revenues
of the City that are applicable to a future reporting period. Deferred inflows of resources are used to report acquisitions of net assets by the City that are applicable to future reporting periods. The deferred inflow is reclassified to revenue on the government-wide financial statements. Deferred pension contribution is the difference in assumption changes or actuarial gains or losses. This difference is deferred and amortized over the estimated average remaining lives of all members determined as of the measurement date. Deferred rent is the prepaid rent relating to a lease agreement and will be amortized over a period of 20 years.
6. Compensated Absences:
Vested or accumulated vacation leave is accrued in the government-wide and proprietary fund financial statements when incurred. No liability is recorded for non-vesting, accumulating rights to receive sick pay benefits. Vacation is earned in varying amounts up to a maximum of fifteen (15) days for employees with ten (10) or more years of service. Unused vacation leave is carried forward from one year to the next without limit with regards to years of service. As of September 30, 2017, the liability for accrued vacation was $8,834,693. The amount applicable to the Proprietary Funds $1,894,724 and the MEDC $79,044 have been recorded in these funds, and the amount applicable to other funds of $6,860,926 has been recorded in the government-wide financial statements.
7. Interfund Charges:
The City allocates to the Water and Sewer Fund, a percentage of the salaries and wages and related costs of personnel who perform administrative services for the fund but are paid through the General Fund. During the year ended September 30, 2017, the City allocated $147,980 to the Water and Sewer Fund for these services. 8. Property Tax:
Property taxes attach as an enforceable lien on property as of January 1. Taxes are levied on October 1 and are due and payable on or before January 31 of the following year. All unpaid taxes become delinquent on February 1 of the following year. The City contracts with Tarrant County to bill and collect its property taxes. Property tax revenues are recognized when they are both measurable and available. Revenues are considered both measurable and available when they are collectible within the current period or soon enough thereafter to pay liabilities of the current period. For this purpose, the government considers revenues to be available if they are collected within 30 days of the end of the current fiscal period.
9. Long-Term Obligations:
In the government-wide financial statements, and proprietary fund types in the fund financial statements, long-term debt and other long-term obligations are reported as liabilities in the applicable governmental activities, business-type activities, or proprietary fund type statement of net position. Bond premiums and discounts are deferred and amortized over the life of the bonds using the straight-line method. Bonds payable are reported net of the applicable bond premium or discount. Net pension liability is the liability of employers and non-employer contribution entities to plan members for benefits provided through a defined benefit plan.
44
In the fund financial statements, governmental fund types recognize bond premiums and discounts, as well as bond issuance costs, during the current period. The face amount of debt issued is reported as other financing sources. Premiums received on debt issuances are reported as other financing sources while discounts on debt issuances are reported as other financing uses. Issuance costs, whether or not withheld from the actual debt proceeds received, are reported as debt service expenditures. 10. Restricted Assets:
Certain proceeds of Proprietary Fund Revenue Bonds, as well as certain resources set aside for their repayment, are classified as restricted assets on the statement of net position because their use is limited by applicable bond covenants. Additionally, amounts held by the City for inmates of the Law Enforcement Center are also classified as restricted assets on the statement of net position.
11. Use of Estimates:
The preparation of financial statements in conformity with generally accepted accounting principles requires management to make estimates and assumptions that affect the reported amounts of assets and liabilities, disclosures of contingent assets and liabilities at the date of the financial statements, and the reported amounts of revenues and expenses during the reporting periods. Final settlement amounts could differ from those estimates. 12. Fund Balance Classification:
The preparation of financial statements in conformity with U.S. generally accepted accounting principles requires management to classify the fund balances.
Committed fund balances are amounts that can only be used for specific purposes with constraints
imposed by formal action of the City Council and do not lapse at year-end. This formal action consists of a written ordinance voted and approved by a majority of the City Council. For assigned fund balance classification, the City Manager with concurrence of the Deputy City Manager is authorized to assign amounts for a specific purpose as permitted by Section 9.12 of the City Charter. The restricted fund balance classification includes amounts that have constraints that are externally imposed (creditors, grantors, etc.) or imposed by enabling legislation. The non-spendable classification includes amounts that are not in spendable form or required to be maintained intact. The unassigned fund balance classification represents fund balance that has not been classified to another category.
The City considers an amount spent when the expenditure is incurred when restricted or
unrestricted fund balances are available. In addition, the City considers an amount spent when expenditure is incurred for purposes for which an amount in the committed, assigned, or unassigned amounts could be used. The City considers expenditure to be made from the most restrictive resources/funds when more than one classification is available.
The City has a minimum General Fund balance policy requirement. This policy established by
resolution of the Council requires General Fund unassigned fund balance to be 25% of the ensuing fiscal year’s General Fund operating budget. The detailed fund balance classifications are as follows:
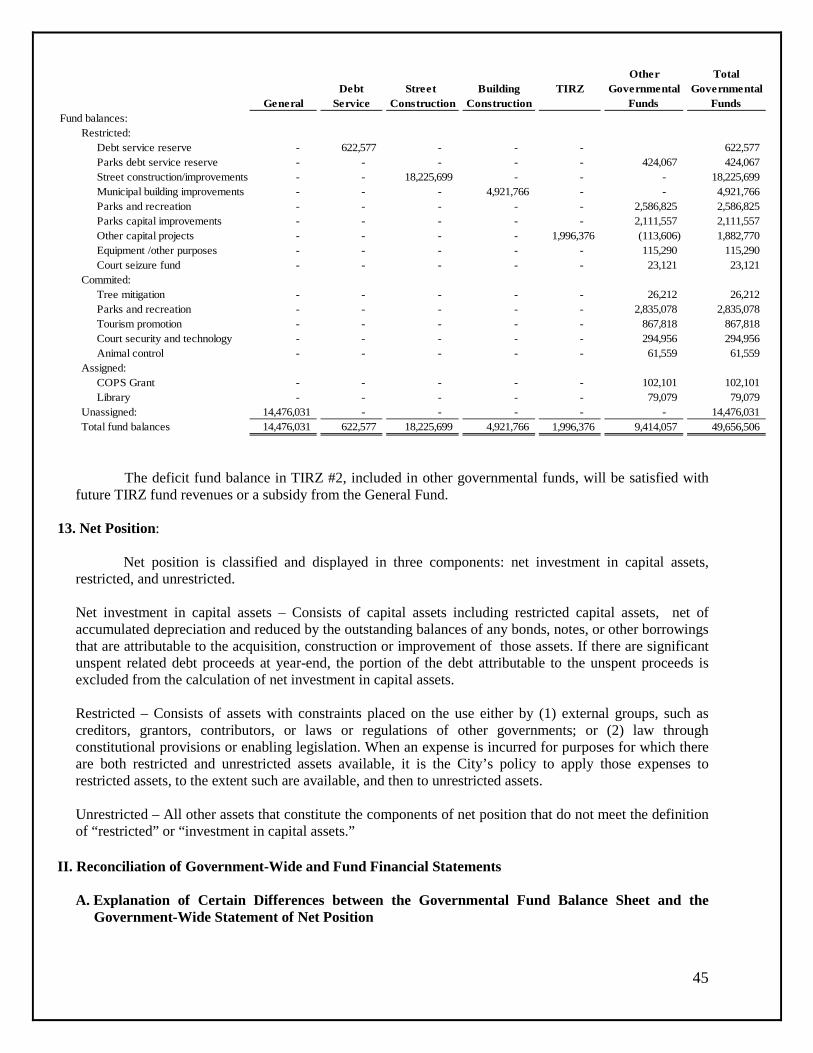
45
The deficit fund balance in TIRZ #2, included in other governmental funds, will be satisfied with
future TIRZ fund revenues or a subsidy from the General Fund. 13. Net Position:
Net position is classified and displayed in three components: net investment in capital assets,
restricted, and unrestricted. Net investment in capital assets – Consists of capital assets including restricted capital assets, net of accumulated depreciation and reduced by the outstanding balances of any bonds, notes, or other borrowings that are attributable to the acquisition, construction or improvement of those assets. If there are significant unspent related debt proceeds at year-end, the portion of the debt attributable to the unspent proceeds is excluded from the calculation of net investment in capital assets. Restricted – Consists of assets with constraints placed on the use either by (1) external groups, such as creditors, grantors, contributors, or laws or regulations of other governments; or (2) law through constitutional provisions or enabling legislation. When an expense is incurred for purposes for which there are both restricted and unrestricted assets available, it is the City’s policy to apply those expenses to restricted assets, to the extent such are available, and then to unrestricted assets. Unrestricted – All other assets that constitute the components of net position that do not meet the definition of “restricted” or “investment in capital assets.”
II. Reconciliation of Government-Wide and Fund Financial Statements
A. Explanation of Certain Differences between the Governmental Fund Balance Sheet and the Government-Wide Statement of Net Position
Other TotalDebt Street Building TIRZ Governmental Governmental
General Service Construction Construction Funds FundsFund balances: Restricted: Debt service reserve - 622,577 - - - 622,577 Parks debt service reserve - - - - - 424,067 424,067 Street construction/improvements - - 18,225,699 - - - 18,225,699 Municipal building improvements - - - 4,921,766 - - 4,921,766 Parks and recreation - - - - - 2,586,825 2,586,825 Parks capital improvements - - - - - 2,111,557 2,111,557 Other capital projects - - - - 1,996,376 (113,606) 1,882,770 Equipment /other purposes - - - - - 115,290 115,290 Court seizure fund - - - - - 23,121 23,121 Commited: Tree mitigation - - - - - 26,212 26,212 Parks and recreation - - - - - 2,835,078 2,835,078 Tourism promotion - - - - - 867,818 867,818 Court security and technology - - - - - 294,956 294,956 Animal control - - - - - 61,559 61,559 Assigned: COPS Grant - - - - - 102,101 102,101 Library - - - - - 79,079 79,079 Unassigned: 14,476,031 - - - - - 14,476,031 Total fund balances 14,476,031 622,577 18,225,699 4,921,766 1,996,376 9,414,057 49,656,506

46
The governmental fund balance sheet includes reconciliation between fund balance – total governmental funds and net position – governmental activities as reported in the government-wide statement of net position. One element of that reconciliation explains, “long-term liabilities, including bonds payable, are not due and payable in the current period and, therefore, are not reported in the funds.”
The details of this $184,439,589 difference are as follows:
Bonds payable 159,410,000 Premium on issuance of bonds 9,968,415 Discounts on issuance of bonds (1,045,580) Deferred loss on refunding (3,266,180) Accrued interest payable 863,191 Compensated absences 6,860,926 Deferred pension contributions (2,855,536) Deferred investment losses (3,567,409) Net pension liability 17,565,320 Deferred pension expense (1,334,760) Deferred rent 1,500,000 Deferred pension contributions 341,202 Net adjustment to reduce fund balance – total governmental funds to arrive at net position– governmental activities $184,439,589
B. Explanation of Certain Differences between the Governmental Fund Statement of Revenues,
Expenditures, and Changes in Fund Balances and the Government-Wide Statement of Activities
The governmental funds statement of revenues, expenditures, and changes in fund balances includes reconciliation between net changes in fund balances – total governmental funds and changes in net position of governmental activities as reported in the government-wide statement of activities. One element of that reconciliation explains that “Governmental funds report capital outlays as expenditures. However, in the statement of activities, the cost of those assets is allocated over their estimated useful lives and reported as depreciation expense.” The details of this $25,008,438 difference are as follows: Capital outlay $39,520,291 Depreciation expense (14,511,853)
Net adjustment to decrease net changes in fund balances – total governmental funds to arrive at changes in net position of governmental activities $ 25,008,438
Another element of that reconciliation states “The net effect of various miscellaneous transactions involving capital assets (i.e., sales, trade-ins, and donations) is to increase net position.” The statement of activities reports contributions of capital assets. Conversely, the governmental funds do not report any contributions of capital assets. The $3,234,461 difference is as follows:
Net adjustment to increase changes in fund balances – total government funds to
arrive at changes in net position of governmental activities $ 3,234,461 Another element of that reconciliation states that “revenues recognizing future lease payments on a
straight-line basis in the statement of activities do not provide current financial resources and, therefore, are not reported as revenues in the funds.” The $350,000 difference is as follows:
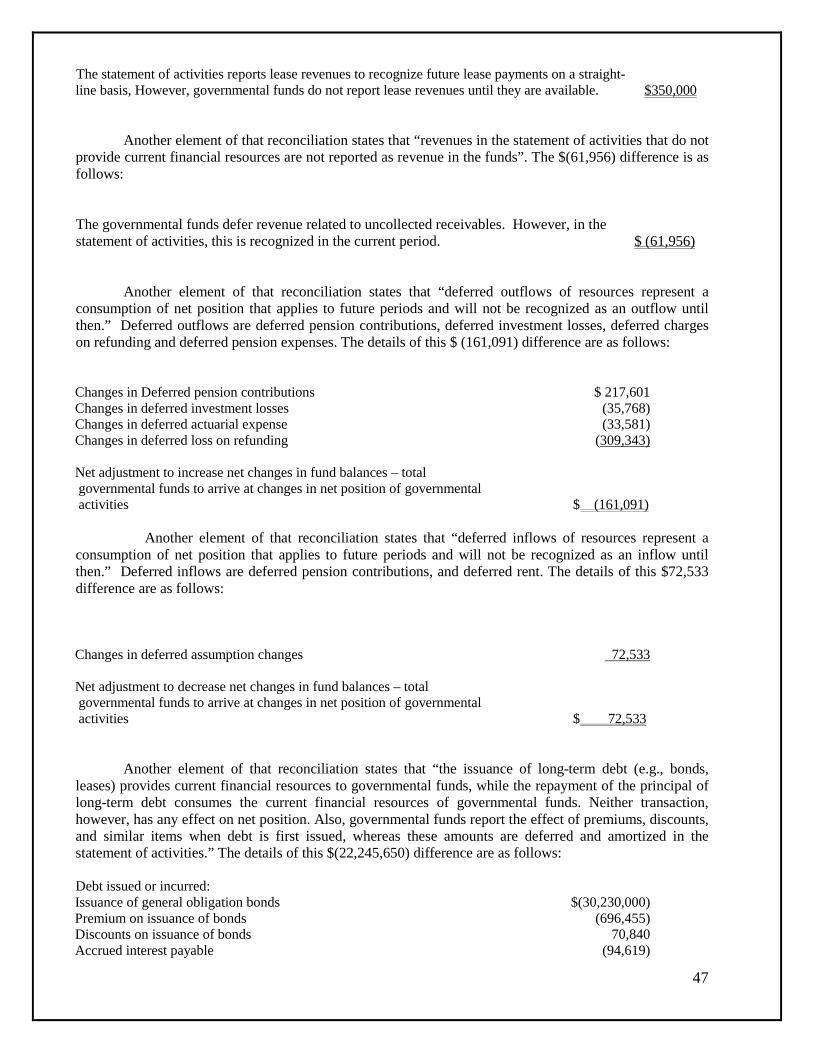
47
The statement of activities reports lease revenues to recognize future lease payments on a straight- line basis, However, governmental funds do not report lease revenues until they are available. $350,000
Another element of that reconciliation states that “revenues in the statement of activities that do not
provide current financial resources are not reported as revenue in the funds”. The $(61,956) difference is as follows:
The governmental funds defer revenue related to uncollected receivables. However, in the statement of activities, this is recognized in the current period. $ (61,956)
Another element of that reconciliation states that “deferred outflows of resources represent a
consumption of net position that applies to future periods and will not be recognized as an outflow until then.” Deferred outflows are deferred pension contributions, deferred investment losses, deferred charges on refunding and deferred pension expenses. The details of this $ (161,091) difference are as follows:
Changes in Deferred pension contributions $ 217,601 Changes in deferred investment losses (35,768) Changes in deferred actuarial expense (33,581) Changes in deferred loss on refunding (309,343) Net adjustment to increase net changes in fund balances – total governmental funds to arrive at changes in net position of governmental activities $ (161,091)
Another element of that reconciliation states that “deferred inflows of resources represent a
consumption of net position that applies to future periods and will not be recognized as an inflow until then.” Deferred inflows are deferred pension contributions, and deferred rent. The details of this $72,533 difference are as follows:
Changes in deferred assumption changes 72,533 Net adjustment to decrease net changes in fund balances – total governmental funds to arrive at changes in net position of governmental activities $ 72,533
Another element of that reconciliation states that “the issuance of long-term debt (e.g., bonds, leases) provides current financial resources to governmental funds, while the repayment of the principal of long-term debt consumes the current financial resources of governmental funds. Neither transaction, however, has any effect on net position. Also, governmental funds report the effect of premiums, discounts, and similar items when debt is first issued, whereas these amounts are deferred and amortized in the statement of activities.” The details of this $(22,245,650) difference are as follows:
Debt issued or incurred: Issuance of general obligation bonds $(30,230,000) Premium on issuance of bonds (696,455) Discounts on issuance of bonds 70,840 Accrued interest payable (94,619)

48
Amortization of premiums/discounts 640,720 Compensated absences 32,941 Principal payments or payments to escrow agent 9,855,000 Change in net pension liability (1,824,077) Net adjustment to decrease net changes in fund balances – total governmental funds to arrive at changes in net position of governmental activities $ (22,245,650)
III. Detailed Notes on All Funds
A. Deposits and Investments
As of September 30, 2017, the primary government had cash and cash equivalents of $38,055,636 and the following investments, which are recorded as cash equivalents (maturities of investments are measured in weighted average maturities or WAM): Primary Government - Governmental Activities and Business-type Activities Fair Value
WAM (Years)
Investment Type - Money Market Mutual Funds Total Fair Value and Weighted Average Maturity $57,468,611 0.08
As of September 30, 2017, the Mansfield Economic Development Corporation had cash and cash
equivalents of $5,848,291 and the following investments, which are recorded as cash equivalents (maturities of investments are measured in weighted average maturities or WAM)
Component Unit - Mansfield Economic Development Corporation Fair Value
WAM (Years)
Investment Type - Money Market Mutual Funds
Total Fair Value and Weighted Average Maturity 9,406,401 0.08 Money market accounts are marketable securities in active markets that have observable inputs and prices. Interest Rate Risk –
In accordance with its investment policy, the City manages its exposure to declines in fair values by limiting the weighted average maturity of its investment portfolio to less than one year. Credit Risk –
The City is authorized to invest in U.S. government obligations and its agencies or instrumentalities, obligations of Texas and its agencies, fully insured or collateralized certificates of deposit, fully collateralized direct repurchase agreements, government pools and money market funds consisting of any of these securities listed, and obligations of states, cities, and other political subdivisions with a rating of “A” or its equivalent. As of September 30, 2017, the City’s investment in the money market mutual funds was rated “AAA” by Standard and Poor’s and “Aaa” by Moody’s Investment Service.
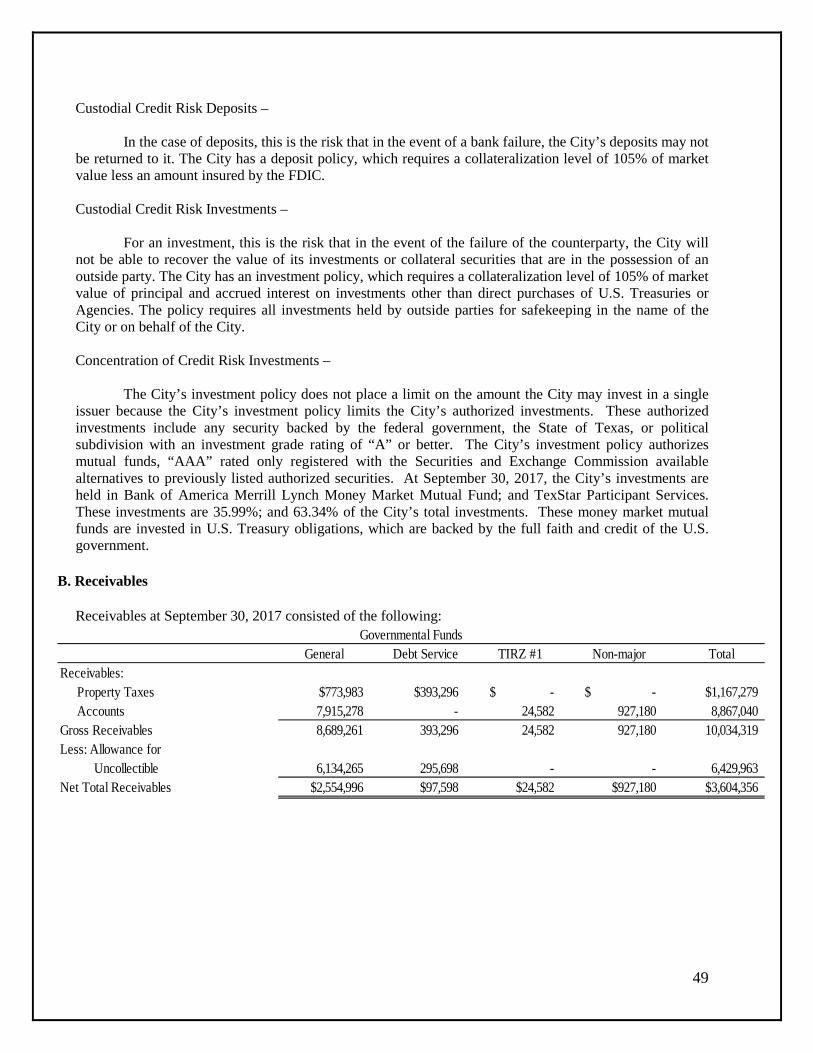
49
Custodial Credit Risk Deposits –
In the case of deposits, this is the risk that in the event of a bank failure, the City’s deposits may not be returned to it. The City has a deposit policy, which requires a collateralization level of 105% of market value less an amount insured by the FDIC. Custodial Credit Risk Investments –
For an investment, this is the risk that in the event of the failure of the counterparty, the City will not be able to recover the value of its investments or collateral securities that are in the possession of an outside party. The City has an investment policy, which requires a collateralization level of 105% of market value of principal and accrued interest on investments other than direct purchases of U.S. Treasuries or Agencies. The policy requires all investments held by outside parties for safekeeping in the name of the City or on behalf of the City. Concentration of Credit Risk Investments –
The City’s investment policy does not place a limit on the amount the City may invest in a single issuer because the City’s investment policy limits the City’s authorized investments. These authorized investments include any security backed by the federal government, the State of Texas, or political subdivision with an investment grade rating of “A” or better. The City’s investment policy authorizes mutual funds, “AAA” rated only registered with the Securities and Exchange Commission available alternatives to previously listed authorized securities. At September 30, 2017, the City’s investments are held in Bank of America Merrill Lynch Money Market Mutual Fund; and TexStar Participant Services. These investments are 35.99%; and 63.34% of the City’s total investments. These money market mutual funds are invested in U.S. Treasury obligations, which are backed by the full faith and credit of the U.S. government.
B. Receivables
Receivables at September 30, 2017 consisted of the following:
General Debt Service TIRZ #1 Non-major TotalReceivables: Property Taxes $773,983 $393,296 -$ -$ $1,167,279 Accounts 7,915,278 - 24,582 927,180 8,867,040Gross Receivables 8,689,261 393,296 24,582 927,180 10,034,319Less: Allowance for Uncollectible 6,134,265 295,698 - - 6,429,963Net Total Receivables $2,554,996 $97,598 $24,582 $927,180 $3,604,356
Governmental Funds
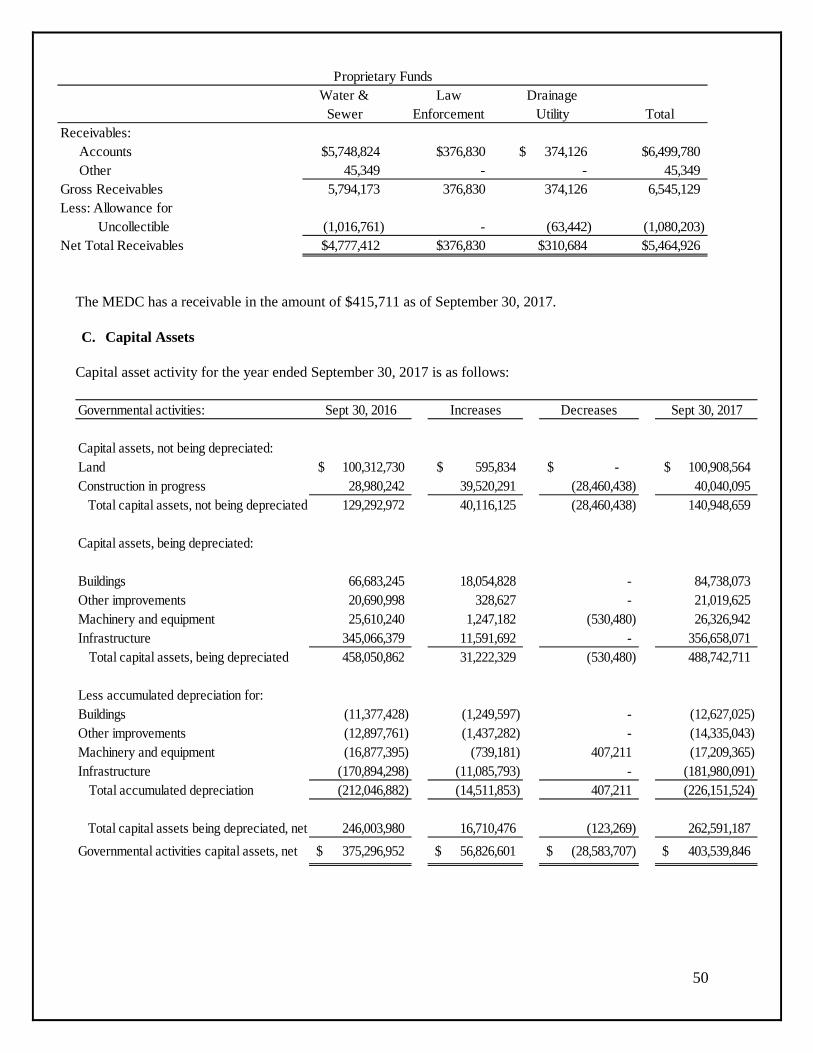
50
The MEDC has a receivable in the amount of $415,711 as of September 30, 2017.
C. Capital Assets
Capital asset activity for the year ended September 30, 2017 is as follows:
Water & Sewer
Law Enforcement
Drainage Utility Total
Receivables: Accounts $5,748,824 $376,830 374,126$ $6,499,780 Other 45,349 - - 45,349Gross Receivables 5,794,173 376,830 374,126 6,545,129Less: Allowance for Uncollectible (1,016,761) - (63,442) (1,080,203)Net Total Receivables $4,777,412 $376,830 $310,684 $5,464,926
Proprietary Funds
Governmental activities: Sept 30, 2016 Increases Decreases Sept 30, 2017
Capital assets, not being depreciated:Land 100,312,730$ 595,834$ -$ 100,908,564$ Construction in progress 28,980,242 39,520,291 (28,460,438) 40,040,095
Total capital assets, not being depreciated 129,292,972 40,116,125 (28,460,438) 140,948,659
Capital assets, being depreciated:
Buildings 66,683,245 18,054,828 - 84,738,073 Other improvements 20,690,998 328,627 - 21,019,625 Machinery and equipment 25,610,240 1,247,182 (530,480) 26,326,942 Infrastructure 345,066,379 11,591,692 - 356,658,071 Total capital assets, being depreciated 458,050,862 31,222,329 (530,480) 488,742,711
Less accumulated depreciation for:Buildings (11,377,428) (1,249,597) - (12,627,025) Other improvements (12,897,761) (1,437,282) - (14,335,043) Machinery and equipment (16,877,395) (739,181) 407,211 (17,209,365) Infrastructure (170,894,298) (11,085,793) - (181,980,091) Total accumulated depreciation (212,046,882) (14,511,853) 407,211 (226,151,524)
Total capital assets being depreciated, net 246,003,980 16,710,476 (123,269) 262,591,187 Governmental activities capital assets, net 375,296,952$ 56,826,601$ (28,583,707)$ 403,539,846$

51
Capital assets continued Depreciation expense was charged to functions/programs of the primary government as follows: Governmental Activities: General Government $ 804,919 Public Safety 688,353 Public Works 11,156,230 Culture and Recreation 1,862,351 Total Depreciation Expense – Governmental Activities $14,511,853 Business-Type Activities: Water and Sewer $ 4,441,803 Law Enforcement Center 250,546 Drainage Utility Fund 138,681 Total Depreciation Expense – Business-Type Activities $ 4,831,030 Construction Commitments The general government had outstanding commitments at September 30, 2017, under authorized construction contracts of approximately $9,261,415. These outstanding commitments will be financed by proceeds from prior bond issuances and other funding sources. These outstanding commitments relate to the major funds.
Business-type activities: Sept 30, 2016 Increases Decreases Sept 30, 2017
Capital assets, not being depreciated:Land 2,125,523$ -$ (80,000)$ 2,045,523$ Construction in progress 5,447,069 7,150,105 (2,425,691) 10,171,483
Total capital assets, not being depreciated 7,572,592 7,150,105 (2,505,691) 12,217,006
Capital assets, being depreciated:
Buildings and systems 176,020,969 2,207,701 - 178,228,670 Improvements other than buildings 2,751,409 - - 2,751,409 Machinery and equipment 4,955,280 217,990 (71,762) 5,101,508 Infrastructure 54,828,840 1,647,585 - 56,476,425 Total capital assets, being depreciated 238,556,498 4,073,276 (71,762) 242,558,012
Less accumulated depreciation for:Buildings and systems (38,626,471) (3,375,161) - (42,001,632) Improvements other than buildings (320,976) (47,790) - (368,766) Machinery and equipment (3,313,621) (316,926) 44,237 (3,586,310) Infrastructure (16,037,138) (1,091,153) - (17,128,291) Total accumulated depreciation (58,298,206) (4,831,030) 44,237 (63,084,999)
Total capital assets being depreciated, net 180,258,292 (757,754) (27,525) 179,473,013 Business-type activities capital assets, net 187,830,884$ 6,392,351$ (2,533,216)$ 191,690,019$

52
The MPFDC had outstanding commitments at September 30, 2017, under authorized construction contracts of approximately $1,522,901. These outstanding commitments will be financed by proceeds from prior bond issuances and other funding sources.
The Water and Sewer Fund had outstanding commitments at September 30, 2017, under authorized construction contracts of approximately $3,704,218. These outstanding commitments will be financed by proceeds from prior bond issuances and other funding sources. The Drainage Fund had outstanding commitments at September 30, 2017, under authorized construction contracts of approximately $10,932. These outstanding commitments will be financed by proceeds from prior bond issuances and other funding sources. The Law Enforcement Complex Fund had outstanding commitments at September 30, 2017, under authorized construction contracts of approximately $16,537. These outstanding commitments will be financed by proceeds from other funding sources.
Discretely Presented Component Unit Activity for the MEDC for the year ended September 30, 2017 was as follows:
The MEDC had outstanding commitments at September 30, 2017 under authorized construction contracts of approximately $5,551,360. E. Deferred Outflows and Inflows of Resources The City has four types of deferred outflows of resources. Deferred pension contributions relate to contributions made by the City after the measurement date so they are deferred and recognized in the upcoming fiscal year. Deferred investment losses are the differences in the projected and actual earnings
Mansfield Economic Development Corporation: Sept 30, 2016 Increases Decreases Sept 30, 2017
Capital assets, not being depreciated:Land $7,074,948 $5,106,792 - $12,181,740Construction in progress 1,293,468 3,367,876 - 4,661,344
Total capital assets, not being depreciated 8,368,416 8,474,668 - 16,843,084
Capital assets, being depreciated:
Other Improvements 167,248 - - 167,248Machinery and equipment 72,312 - - 72,312 Total capital assets, being depreciated 239,560 - - 239,560
Less accumulated depreciation for:Other improvements (67,115) (3,053) - (70,168)Machinery and equipment (72,312) - - (72,312) Total accumulated depreciation (139,427) (3,053) - (142,480)
Total capital assets being depreciated, net 100,133 (3,053) - 97,080MEDC capital assets, net $8,468,549 $8,471,615 -$ $16,940,164
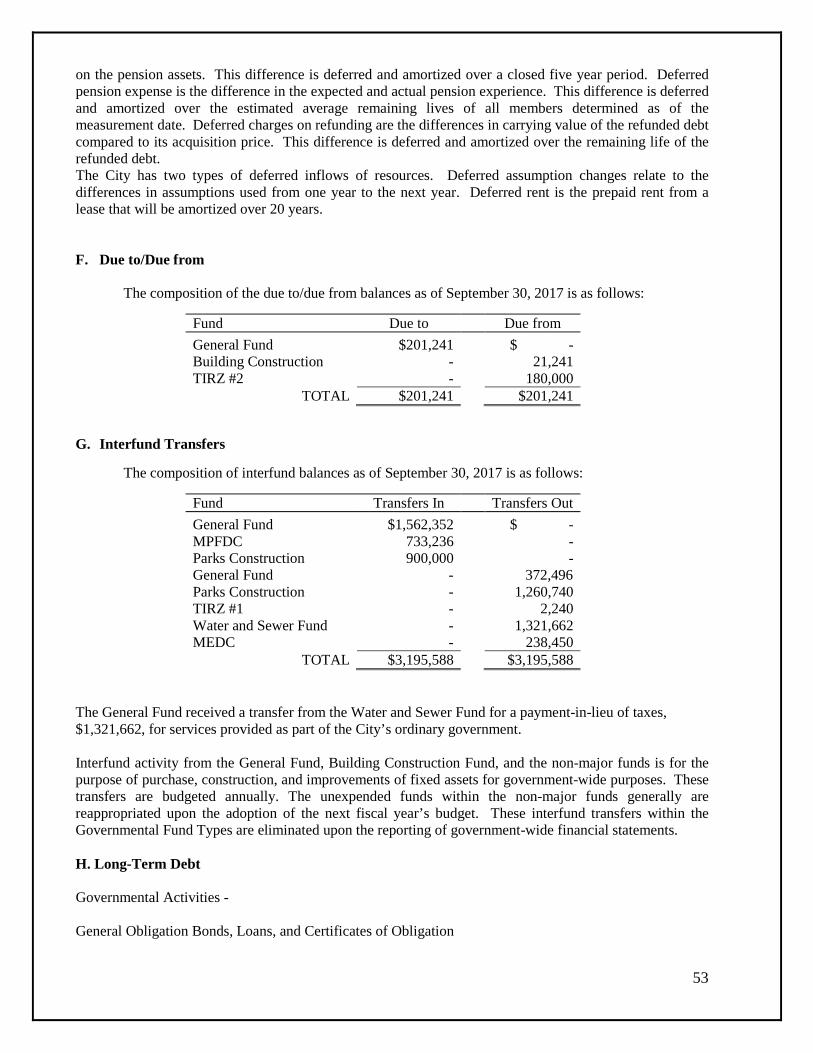
53
on the pension assets. This difference is deferred and amortized over a closed five year period. Deferred pension expense is the difference in the expected and actual pension experience. This difference is deferred and amortized over the estimated average remaining lives of all members determined as of the measurement date. Deferred charges on refunding are the differences in carrying value of the refunded debt compared to its acquisition price. This difference is deferred and amortized over the remaining life of the refunded debt. The City has two types of deferred inflows of resources. Deferred assumption changes relate to the differences in assumptions used from one year to the next year. Deferred rent is the prepaid rent from a lease that will be amortized over 20 years. F. Due to/Due from
The composition of the due to/due from balances as of September 30, 2017 is as follows:
Fund Due to Due from General Fund $201,241 $ - Building Construction - 21,241 TIRZ #2 - 180,000
TOTAL $201,241 $201,241
G. Interfund Transfers
The composition of interfund balances as of September 30, 2017 is as follows:
Fund Transfers In Transfers Out General Fund $1,562,352 $ - MPFDC 733,236 - Parks Construction 900,000 - General Fund - 372,496 Parks Construction - 1,260,740 TIRZ #1 - 2,240 Water and Sewer Fund - 1,321,662 MEDC - 238,450
TOTAL $3,195,588 $3,195,588
The General Fund received a transfer from the Water and Sewer Fund for a payment-in-lieu of taxes, $1,321,662, for services provided as part of the City’s ordinary government. Interfund activity from the General Fund, Building Construction Fund, and the non-major funds is for the purpose of purchase, construction, and improvements of fixed assets for government-wide purposes. These transfers are budgeted annually. The unexpended funds within the non-major funds generally are reappropriated upon the adoption of the next fiscal year’s budget. These interfund transfers within the Governmental Fund Types are eliminated upon the reporting of government-wide financial statements. H. Long-Term Debt
Governmental Activities - General Obligation Bonds, Loans, and Certificates of Obligation

54
The general obligation bonds, loans, and certificates of obligation are serial and term debt collateralized by the full faith and credit of the City and are payable from property taxes. The debt matures annually in varying amounts through 2041, and interest is payable semiannually. Proceeds of general obligation bonds are recorded in the Capital Projects Funds and are restricted to the use for which they were approved in the bond elections. Certificates of obligation bonds and loan proceeds are recorded in the appropriate fund for which the debt was issued and approved by the City. The City Charter expressly prohibits the use of bond proceeds to fund operating expenditures.
In 2013, the City issued $4,200,000 in General Obligation Refunding Bonds, Series 2013, for the
purpose of refunding $4,505,000 of the City’s outstanding debt. The bonds of $4,200,000 plus premiums of $418,231, less discounts of $26,939 and less issuance costs of $86,000 were used to refund a portion of the City’s outstanding debt.
The City refunded debt at which time the reacquisition price exceeded the net carrying amount of
the old debt by $99,624 and resulted in an economic gain of $712,222. This deferred amount on refunding is being netted against the new debt and amortized over the refunded debt’s life using the straight-line method, since the refunded debt’s life was shorter than the life of the new debt. The deferred amount on refunding was $60,730 at September 30, 2017.
In 2013, the City issued $2,880,000 in General Obligation Refunding Bonds, Series 2013, for the
purpose of refunding $2,915,000 of the City’s outstanding debt. The bonds of $2,880,000 plus premiums of $120,815, less discounts of $20,667 and less issuance costs of $68,262 were used to refund a portion of the City’s outstanding debt.
The City refunded debt at which time the reacquisition price exceeded the net carrying amount of
the old debt by $76,966 and resulted in an economic gain of $464,895. This deferred amount on refunding is being netted against the new debt and amortized over the refunded debt’s life using the straight-line method, since the refunded debt’s life was shorter than the life of the new debt. The deferred amount on refunding was $41,007 at September 30, 2017.
In 2014, the City issued $16,500,000 in Combination Tax and Revenue Certificates of Obligation
Bonds, Series 2014, for the purpose of construction of street improvements and building improvements. The bonds of $16,500,000 plus premiums of $234,249, less discounts of $109,661 and less issuance costs of $125,247 were used to construct and design street improvements and building improvements.
In 2014, the City issued $1,255,000 in Combination Tax and Revenue Certificates of Obligation Bonds, Series 2014A, for the purpose of purchasing equipment and building improvements. The bonds of $1,255,000 plus premiums of $24,276, less discounts of $13,534 and less issuance costs of $10,742 were used to purchase equipment and building improvements.
In 2014, the City issued $6,710,000 in General Obligation Refunding Bonds, Series 2014, for the
purpose of refunding $6,610,000 of the City’s outstanding debt. The bonds of $6,710,000 plus premiums of $192,313, less discounts of $33,333 and less issuance costs of $103,837 were used to refund a portion of the City’s outstanding debt.
The City refunded debt at which time the reacquisition price exceeded the net carrying amount of
the old debt by $153,534 and resulted in an economic gain of $450,680. This deferred amount on refunding is being netted against the new debt and amortized over the refunded debt’s life using the straight-line method, since the refunded debt’s life was shorter than the life of the new debt. The deferred amount on refunding was $57,579 at September 30, 2017.
In 2015, the City issued $15,870,000 in Combination Tax and Revenue Certificates of Obligation
Bonds, Series 2015, for the purpose of construction of street improvements and building improvements.

55
The bonds of $15,870,000 plus premiums of $2,223,562, less discounts of $100,908 and less issuance costs of $142,655 were used to construct and design street improvements and to purchase equipment.
In 2015, the City issued $11,700,000 in General Obligation Refunding Bonds, Series 2015, for the
purpose of refunding $12,940,000 of the City’s outstanding debt. The bonds of $11,700,000 plus premiums of $1,773,891, less discounts of $68,304 and less issuance costs of $136,800 were used to refund a portion of the City’s outstanding debt.
The City refunded debt at which time the reacquisition price exceeded the net carrying amount of
the old debt by $708,384 and resulted in an economic gain of $1,035,085. This deferred amount on refunding is being netted against the new debt and amortized over the refunded debt’s life using the straight-line method, since the refunded debt’s life was shorter than the life of the new debt. The deferred amount on refunding was $550,966 at September 30, 2017.
In 2016, the City issued $13,705,000 in Combination Tax and Revenue Certificates of Obligation
Bonds, Series 2016, for the purpose of construction of street improvements and building improvements. The bonds of $13,705,000 plus premiums of $2,078,521, less discounts of $86,147 and less issuance costs of $127,374 will be used to construct and design street improvements and to purchase equipment.
In 2016, the City issued $14,885,000 in General Obligation Refunding and Improvements Bonds,
Series 2016, for the purpose of refunding $14,475,000 of the City’s outstanding debt. The bonds of $14,885,000 plus premiums of $2,510,526, less discounts of $92,270 and less issuance costs of $148,038 were used to refund a portion of the City’s outstanding debt and to fund municipal library improvements.
The City refunded debt at which time the reacquisition price exceeded the net carrying amount of
the old debt by $1,545,218 and resulted in an economic gain of $1,942,477. This deferred amount on refunding is being netted against the new debt and amortized over the refunded debt’s life using the straight-line method, since the refunded debt’s life was shorter than the life of the new debt. The deferred amount on refunding was $1,416,450 at September 30, 2017.
In 2016, the City issued $3,770,000 in General Obligation Refunding, Series 2016 for the purpose
of refunding $3,550,000 of the City’s outstanding debt. The bonds of $3,550,000 less discounts of $23,640 and less issuance costs of $54,832 were used to refund a portion of the City’s outstanding debt.
In 2016, the City refunded debt at which time the reacquisition price exceeded the net carrying
amount of the old debt by $312,126 and resulted in an economic gain of $493,265. This deferred amount on refunding is being netted against the new debt and amortized over the refunded debt’s life using the straight-line method, since the refunded debt’s life was shorter than the life of the new debt. The deferred amount on refunding was $268,775 at September 30, 2017.
In 2017, the City issued $18,975,000 in Combination Tax and Revenue Certificates of Obligation
Bonds, Series 2017, for the purpose of construction of street improvements and building improvements. The bonds of $18,975,000 plus premiums of $696,455 and less issuance costs of $171,455 will be used to construct and design street improvements and to purchase equipment.
In 2017, the City issued $2,960,000 in Combination Tax and Revenue Certificates of Obligation
Bonds, Series 2017, for the purpose of construction of a public recreational facility. The bonds of $2,960,000 less discounts of $19,340 and less issuance costs of $85,660 will be used to construct and design a public recreational ice skating facility.
As of September 30, 2017 there was $10,165,000 of defeased debt outstanding related to the
General Obligation Bonds.
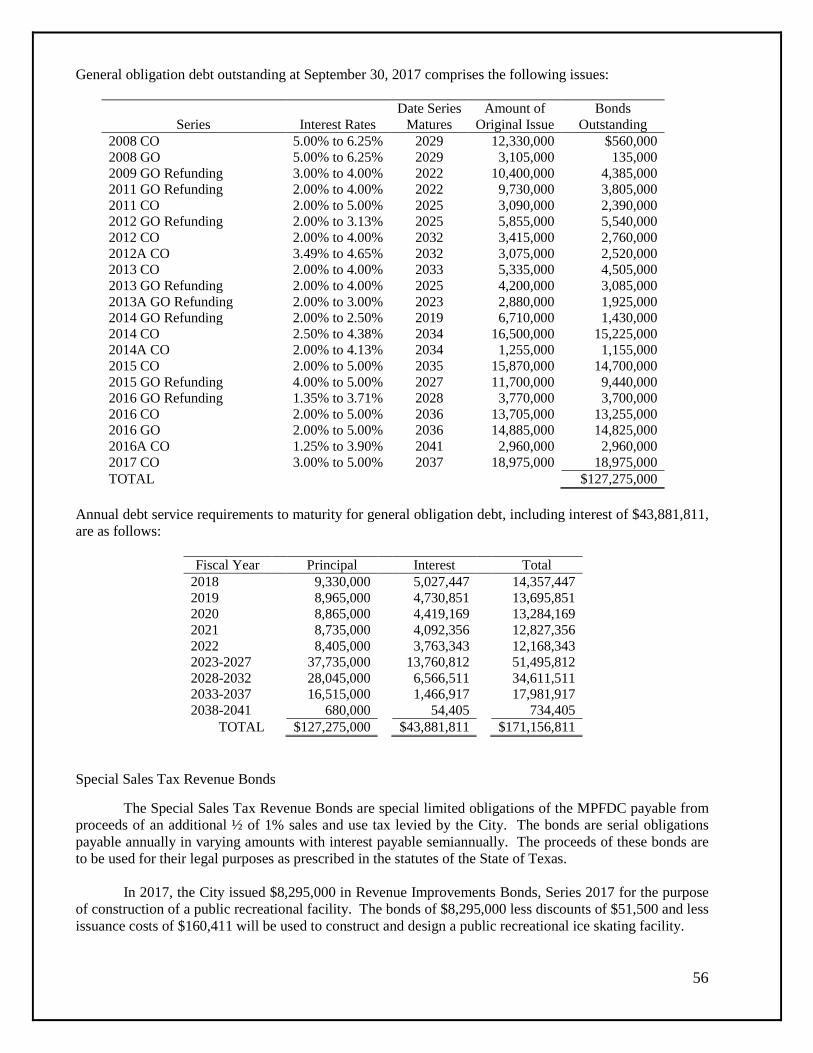
56
General obligation debt outstanding at September 30, 2017 comprises the following issues:
Date Series Amount of Bonds Series Interest Rates Matures Original Issue Outstanding
2008 CO 5.00% to 6.25% 2029 12,330,000 $560,000 2008 GO 5.00% to 6.25% 2029 3,105,000 135,000 2009 GO Refunding 3.00% to 4.00% 2022 10,400,000 4,385,000 2011 GO Refunding 2.00% to 4.00% 2022 9,730,000 3,805,000 2011 CO 2.00% to 5.00% 2025 3,090,000 2,390,000 2012 GO Refunding 2.00% to 3.13% 2025 5,855,000 5,540,000 2012 CO 2.00% to 4.00% 2032 3,415,000 2,760,000 2012A CO 3.49% to 4.65% 2032 3,075,000 2,520,000 2013 CO 2.00% to 4.00% 2033 5,335,000 4,505,000 2013 GO Refunding 2.00% to 4.00% 2025 4,200,000 3,085,000 2013A GO Refunding 2.00% to 3.00% 2023 2,880,000 1,925,000 2014 GO Refunding 2.00% to 2.50% 2019 6,710,000 1,430,000 2014 CO 2.50% to 4.38% 2034 16,500,000 15,225,000 2014A CO 2.00% to 4.13% 2034 1,255,000 1,155,000 2015 CO 2.00% to 5.00% 2035 15,870,000 14,700,000 2015 GO Refunding 4.00% to 5.00% 2027 11,700,000 9,440,000 2016 GO Refunding 1.35% to 3.71% 2028 3,770,000 3,700,000 2016 CO 2.00% to 5.00% 2036 13,705,000 13,255,000 2016 GO 2.00% to 5.00% 2036 14,885,000 14,825,000 2016A CO 1.25% to 3.90% 2041 2,960,000 2,960,000 2017 CO 3.00% to 5.00% 2037 18,975,000 18,975,000 TOTAL $127,275,000
Annual debt service requirements to maturity for general obligation debt, including interest of $43,881,811, are as follows:
Fiscal Year Principal Interest Total 2018 9,330,000 5,027,447 14,357,447 2019 8,965,000 4,730,851 13,695,851 2020 8,865,000 4,419,169 13,284,169 2021 8,735,000 4,092,356 12,827,356 2022 8,405,000 3,763,343 12,168,343 2023-2027 37,735,000 13,760,812 51,495,812 2028-2032 28,045,000 6,566,511 34,611,511 2033-2037 16,515,000 1,466,917 17,981,917 2038-2041 680,000 54,405 734,405
TOTAL $127,275,000 $43,881,811 $171,156,811
Special Sales Tax Revenue Bonds
The Special Sales Tax Revenue Bonds are special limited obligations of the MPFDC payable from
proceeds of an additional ½ of 1% sales and use tax levied by the City. The bonds are serial obligations payable annually in varying amounts with interest payable semiannually. The proceeds of these bonds are to be used for their legal purposes as prescribed in the statutes of the State of Texas.
In 2017, the City issued $8,295,000 in Revenue Improvements Bonds, Series 2017 for the purpose
of construction of a public recreational facility. The bonds of $8,295,000 less discounts of $51,500 and less issuance costs of $160,411 will be used to construct and design a public recreational ice skating facility.
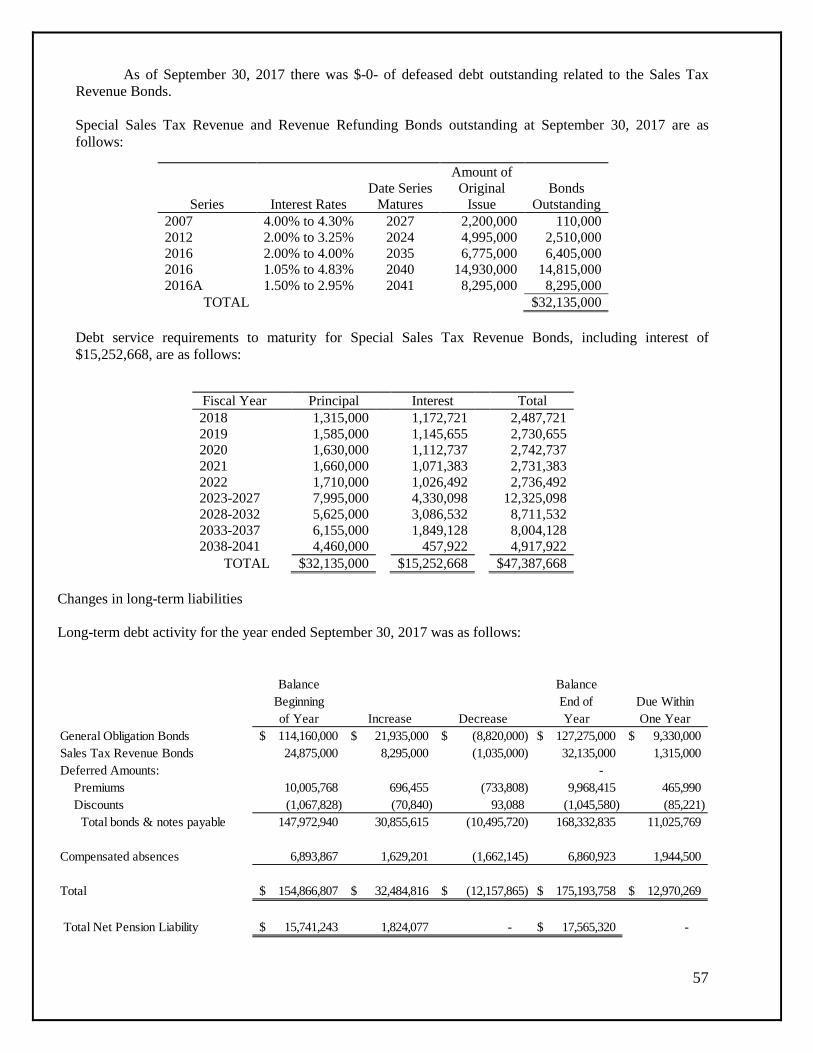
57
As of September 30, 2017 there was $-0- of defeased debt outstanding related to the Sales Tax Revenue Bonds. Special Sales Tax Revenue and Revenue Refunding Bonds outstanding at September 30, 2017 are as follows:
Series Interest Rates Date Series
Matures
Amount of Original
Issue Bonds
Outstanding 2007 4.00% to 4.30% 2027 2,200,000 110,000 2012 2.00% to 3.25% 2024 4,995,000 2,510,000 2016 2.00% to 4.00% 2035 6,775,000 6,405,000 2016 1.05% to 4.83% 2040 14,930,000 14,815,000 2016A 1.50% to 2.95% 2041 8,295,000 8,295,000
TOTAL $32,135,000 Debt service requirements to maturity for Special Sales Tax Revenue Bonds, including interest of $15,252,668, are as follows:
Fiscal Year Principal Interest Total 2018 1,315,000 1,172,721 2,487,721 2019 1,585,000 1,145,655 2,730,655 2020 1,630,000 1,112,737 2,742,737 2021 1,660,000 1,071,383 2,731,383 2022 1,710,000 1,026,492 2,736,492 2023-2027 7,995,000 4,330,098 12,325,098 2028-2032 5,625,000 3,086,532 8,711,532 2033-2037 6,155,000 1,849,128 8,004,128 2038-2041 4,460,000 457,922 4,917,922
TOTAL $32,135,000 $15,252,668 $47,387,668 Changes in long-term liabilities Long-term debt activity for the year ended September 30, 2017 was as follows:
Balance BalanceBeginning End of Due Withinof Year Increase Decrease Year One Year
General Obligation Bonds 114,160,000$ 21,935,000$ (8,820,000)$ 127,275,000$ 9,330,000$ Sales Tax Revenue Bonds 24,875,000 8,295,000 (1,035,000) 32,135,000 1,315,000 Deferred Amounts: - Premiums 10,005,768 696,455 (733,808) 9,968,415 465,990 Discounts (1,067,828) (70,840) 93,088 (1,045,580) (85,221) Total bonds & notes payable 147,972,940 30,855,615 (10,495,720) 168,332,835 11,025,769
Compensated absences 6,893,867 1,629,201 (1,662,145) 6,860,923 1,944,500
Total 154,866,807$ 32,484,816$ (12,157,865)$ 175,193,758$ 12,970,269$
Total Net Pension Liability 15,741,243$ 1,824,077 - 17,565,320$ -

58
For the governmental activities, compensated absences are generally liquidated by the general fund or the respective special sales tax fund. Business-Type Activities -
Water and Sewer Fund
The water and sewer fund revenue bonds are payable from the gross revenues of the water and
sewer system. Gross revenues are to be used first-to-pay operating and maintenance expenses of the system, and second, to maintain revenue bond funds in accordance with the bond covenants. Remaining revenues may then be used for any lawful purpose. The debt matures annually in varying amounts through 2035, and interest is payable semiannually. Waterworks and Sewer System Refunding and Revenue Bonds
In 2011, the City refunded debt at which time the reacquisition price exceeded the net carrying
amount of the old debt by $104,513 and resulted in an economic gain of $53,332. This deferred amount on refunding is being netted against the new debt and amortized over the refunded debt’s life using the straight-line method, since the refunded debt’s life was shorter than the life of the new debt. The deferred amount on refunding was $68,759 at September 30, 2017.
In 2012, the City refunded debt at which time the reacquisition price exceeded the net carrying
amount of the old debt by $195,970 and resulted in an economic gain of $192,727. This deferred amount on refunding is being netted against the new debt and amortized over the refunded debt’s life using the straight-line method, since the refunded debt’s life was shorter than the life of the new debt. The deferred amount on refunding was $102,068 at September 30, 2017.
In 2015, the City issued $9,540,000 in Revenue Refunding Bonds, Series 2015 for the purpose of
refunding $9,875,000 of the City’s outstanding debt. The bonds of $9,540,000 plus premiums of $953,667, less discounts of $49,493 and less issuance costs of $135,100 were used to refund a portion of the City’s outstanding debt.
In 2015, the City refunded debt at which time the reacquisition price exceeded the net carrying
amount of the old debt by $427,370 and resulted in an economic gain of $534,193. This deferred amount on refunding is being netted against the new debt and amortized over the refunded debt’s life using the straight-line method, since the refunded debt’s life was shorter than the life of the new debt. The deferred amount on refunding was $332,399 at September 30, 2017.
In 2016, the City issued $24,510,000 in Revenue Refunding & Improvements Bonds, Series 2016
for the purpose of refunding $18,430,000 of the City’s outstanding debt. The bonds of $24,510,000 plus premiums of $4,057,204, less discounts of $146,376 and less issuance costs of $202,794 were used to refund a portion of the City’s outstanding debt along with funding water and sewer infrastructure costs.
In 2016, the City refunded debt at which time the reacquisition price exceeded the net carrying
amount of the old debt by $2,788,035 and resulted in an economic gain of $3,081,707. This deferred amount on refunding is being netted against the new debt and amortized over the refunded debt’s life using the straight-line method, since the refunded debt’s life was shorter than the life of the new debt. The deferred amount on refunding was $2,543,470 at September 30, 2017.
The total amount of defeased debt outstanding related to Water/Sewer Bonds as of September 30,
2017 was $17,400,000.

59
The total deferred amount on refunding for the water and sewer revenue bonds was $3,046,696 at
September 30, 2017.
Water and sewer fund debt outstanding at September 30, 2017 comprises the following issues:
Date Date Series Amount of Bonds Issued Interest Rates Matures Original Issue Outstanding
2008 4.38% to 6.75% 2029 $26,185,000 $1,110,000 2009 3.00% to 4.50% 2030 2,585,000 1,875,000 2011 2.00% to 5.00% 2030 13,995,000 8,875,000 2012 2.00% to 3.00% 2023 2,320,000 1,300,000 2015 2.00% to 5.00% 2027 9,540,000 5,965,000 2016 2.00% to 5.00% 2035 24,510,000 23,010,000
TOTAL $42,135,000 Debt service requirements to maturity for water and sewer fund debt, including interest of $13,308,462, are as follows:
Fiscal Year Principal Interest Total 2018 4,000,000 1,875,009 5,875,009 2019 3,875,000 1,711,534 5,586,534 2020 3,180,000 1,554,834 4,734,834 2021 3,300,000 1,435,871 4,735,871 2022 3,440,000 1,291,871 4,731,871 2023-2027 15,080,000 4,319,805 19,399,805 2028-2032 7,950,000 1,013,338 8,963,338 2033-2035 1,310,000 106,200 1,416,200
TOTAL $42,135,000 $13,308,462 $55,443,462
Law Enforcement Center
The Authority issued mortgage revenue bonds in 1989 to construct a 48-bed detention facility and administrative offices, for City use, and a 96-bed detention facility for surrounding agencies use (the Law Enforcement Complex). In 1991, the Authority purchased a 3.2-acre tract of land adjacent to the Law Enforcement Complex with proceeds from a property acquisition note, for future expansion. In 1993, additional mortgage revenue bonds were issued for a 96-bed expansion of the Law Enforcement Center, which was completed in January 1995. Refunding Bonds
In 2016, the City issued $595,000 in General Obligation Refunding, Series 2016 for the purpose of refunding $555,000 of the City’s outstanding debt. The bonds of $595,000 less discounts of $3,731 and less issuance costs of $8,654 were used to refund a portion of the City’s outstanding debt.
In 2016, the City refunded debt at which time the reacquisition price exceeded the net carrying
amount of the old debt by $49,261 and resulted in an economic gain of $77,850. This deferred amount on refunding is being netted against the new debt and amortized over the refunded debt’s life using the straight-line method, since the refunded debt’s life was shorter than the life of the new debt. The deferred amount on refunding was $17,456 at September 30, 2017.

60
Law Enforcement Center Fund debt outstanding at September 30, 2017 comprises the following issues:
Date Series Amount of Bonds Date Issued Interest Rates Matures Original Issue Outstanding 2016 GO 1.35% to 3.71% 2028 595,000 585,000
TOTAL $585,000
Debt service requirements to maturity for Law Enforcement Center debt, including interest of $110,388, are as follows:
Fiscal Year Principal Interest Total
2018 45,000 16,533 61,533 2019 50,000 15,686 65,686 2020 45,000 14,685 59,685 2021 50,000 13,538 63,538 2022 50,000 12,210 62,210 2023-2027 280,000 36,530 316,530 2028 65,000 1,206 66,206
TOTAL $585,000 $110,388 $695,388
Drainage Utility Fund
The Drainage Utility Fund revenue bonds are payable from the gross revenues of the drainage utility system. Gross revenues are to be used first to pay operating and maintenance expenses of the system, and second, to maintain revenue bond funds in accordance with the bond covenants. Remaining revenues may then be used for any lawful purpose. The debt matures annually in varying amounts through 2027, and interest is payable semiannually.
In 2012, the City refunded debt at which time the reacquisition price exceeded the net carrying
amount of the old debt by $285,920 and resulted in an economic gain of $333,855. This deferred amount on refunding is being netted against the new debt and amortized over the refunded debt’s life using the straight-line method, since the refunded debt’s life was shorter than the life of the new debt. The deferred amount on refunding was $166,787 at September 30, 2017. Drainage Utility Fund debt outstanding at September 30, 2017 comprises the following issues:
Date Series Amount of Bonds Date Issued Interest Rates Matures Original Issue Outstanding 2007 4.00% to 4.30% 2027 $2,200,000 $1,320,000 2012 2.00% to 3.13% 2024 3,740,000 2,250,000
TOTAL $3,570,000
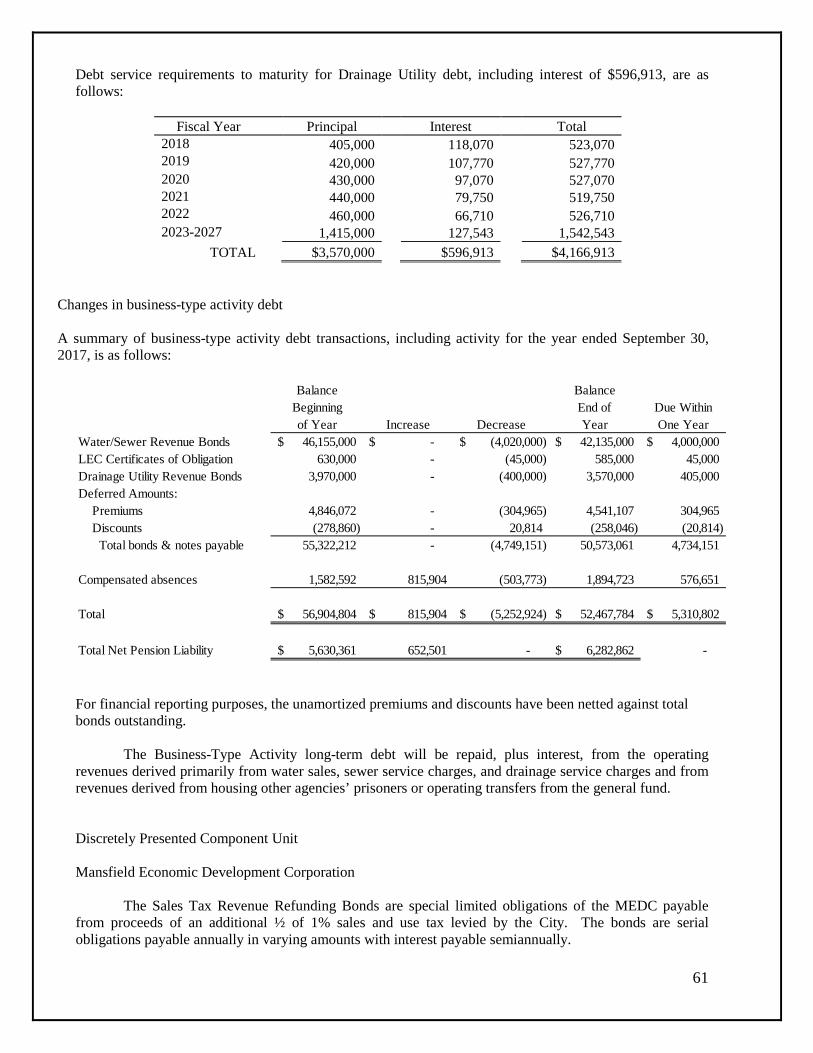
61
Debt service requirements to maturity for Drainage Utility debt, including interest of $596,913, are as follows:
Fiscal Year Principal Interest Total 2018 405,000 118,070 523,070 2019 420,000 107,770 527,770 2020 430,000 97,070 527,070 2021 440,000 79,750 519,750 2022 460,000 66,710 526,710 2023-2027 1,415,000 127,543 1,542,543
TOTAL $3,570,000 $596,913 $4,166,913
Changes in business-type activity debt
A summary of business-type activity debt transactions, including activity for the year ended September 30, 2017, is as follows:
For financial reporting purposes, the unamortized premiums and discounts have been netted against total bonds outstanding.
The Business-Type Activity long-term debt will be repaid, plus interest, from the operating revenues derived primarily from water sales, sewer service charges, and drainage service charges and from revenues derived from housing other agencies’ prisoners or operating transfers from the general fund. Discretely Presented Component Unit Mansfield Economic Development Corporation
The Sales Tax Revenue Refunding Bonds are special limited obligations of the MEDC payable from proceeds of an additional ½ of 1% sales and use tax levied by the City. The bonds are serial obligations payable annually in varying amounts with interest payable semiannually.
Balance BalanceBeginning End of Due Withinof Year Increase Decrease Year One Year
Water/Sewer Revenue Bonds 46,155,000$ -$ (4,020,000)$ 42,135,000$ 4,000,000$ LEC Certificates of Obligation 630,000 - (45,000) 585,000 45,000 Drainage Utility Revenue Bonds 3,970,000 - (400,000) 3,570,000 405,000 Deferred Amounts: Premiums 4,846,072 - (304,965) 4,541,107 304,965 Discounts (278,860) - 20,814 (258,046) (20,814) Total bonds & notes payable 55,322,212 - (4,749,151) 50,573,061 4,734,151
Compensated absences 1,582,592 815,904 (503,773) 1,894,723 576,651
Total 56,904,804$ 815,904$ (5,252,924)$ 52,467,784$ 5,310,802$
Total Net Pension Liability 5,630,361$ 652,501 - 6,282,862$ -
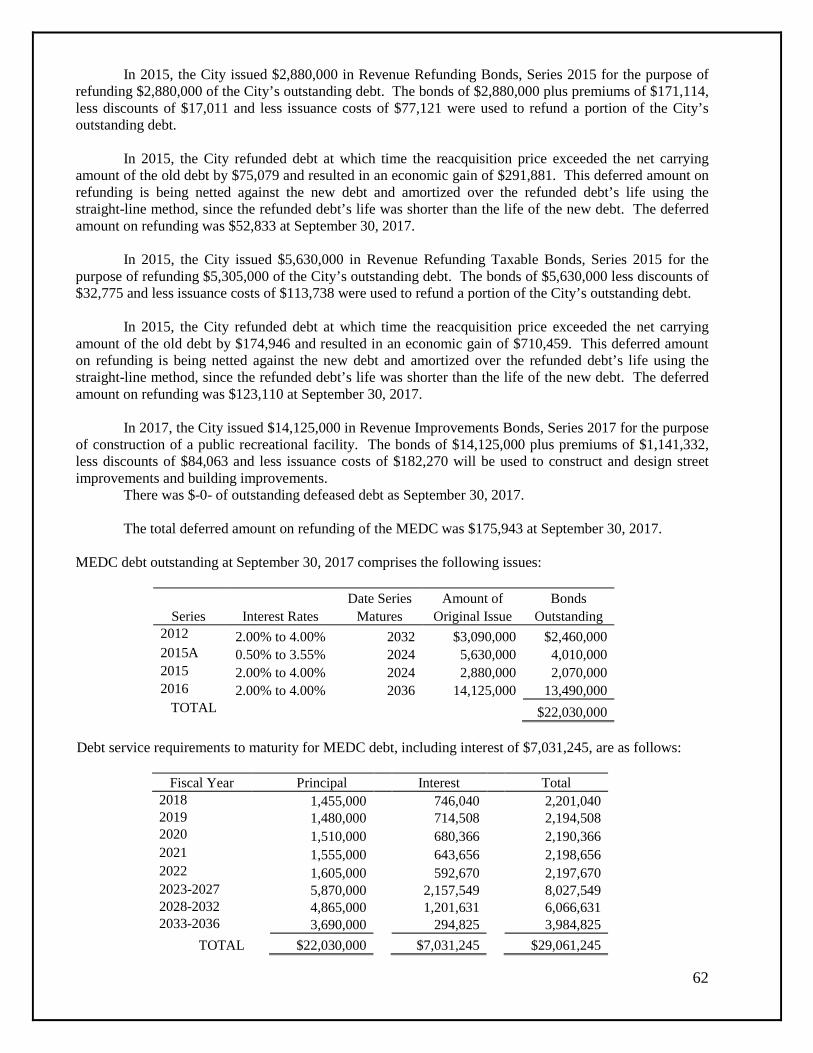
62
In 2015, the City issued $2,880,000 in Revenue Refunding Bonds, Series 2015 for the purpose of refunding $2,880,000 of the City’s outstanding debt. The bonds of $2,880,000 plus premiums of $171,114, less discounts of $17,011 and less issuance costs of $77,121 were used to refund a portion of the City’s outstanding debt.
In 2015, the City refunded debt at which time the reacquisition price exceeded the net carrying
amount of the old debt by $75,079 and resulted in an economic gain of $291,881. This deferred amount on refunding is being netted against the new debt and amortized over the refunded debt’s life using the straight-line method, since the refunded debt’s life was shorter than the life of the new debt. The deferred amount on refunding was $52,833 at September 30, 2017.
In 2015, the City issued $5,630,000 in Revenue Refunding Taxable Bonds, Series 2015 for the
purpose of refunding $5,305,000 of the City’s outstanding debt. The bonds of $5,630,000 less discounts of $32,775 and less issuance costs of $113,738 were used to refund a portion of the City’s outstanding debt.
In 2015, the City refunded debt at which time the reacquisition price exceeded the net carrying
amount of the old debt by $174,946 and resulted in an economic gain of $710,459. This deferred amount on refunding is being netted against the new debt and amortized over the refunded debt’s life using the straight-line method, since the refunded debt’s life was shorter than the life of the new debt. The deferred amount on refunding was $123,110 at September 30, 2017.
In 2017, the City issued $14,125,000 in Revenue Improvements Bonds, Series 2017 for the purpose
of construction of a public recreational facility. The bonds of $14,125,000 plus premiums of $1,141,332, less discounts of $84,063 and less issuance costs of $182,270 will be used to construct and design street improvements and building improvements.
There was $-0- of outstanding defeased debt as September 30, 2017. The total deferred amount on refunding of the MEDC was $175,943 at September 30, 2017.
MEDC debt outstanding at September 30, 2017 comprises the following issues:
Date Series Amount of Bonds Series Interest Rates Matures Original Issue Outstanding
2012 2.00% to 4.00% 2032 $3,090,000 $2,460,000 2015A 0.50% to 3.55% 2024 5,630,000 4,010,000 2015 2.00% to 4.00% 2024 2,880,000 2,070,000 2016 2.00% to 4.00% 2036 14,125,000 13,490,000
TOTAL $22,030,000
Debt service requirements to maturity for MEDC debt, including interest of $7,031,245, are as follows:
Fiscal Year Principal Interest Total 2018 1,455,000 746,040 2,201,040 2019 1,480,000 714,508 2,194,508 2020 1,510,000 680,366 2,190,366 2021 1,555,000 643,656 2,198,656 2022 1,605,000 592,670 2,197,670 2023-2027 5,870,000 2,157,549 8,027,549 2028-2032 4,865,000 1,201,631 6,066,631 2033-2036 3,690,000 294,825 3,984,825
TOTAL $22,030,000 $7,031,245 $29,061,245

63
Changes in MEDC Debt A summary of MEDC debt transactions, including activity for the year ended September 30, 2017, is as follows:
I. Restricted Assets
The restricted assets of the Business-type Activities as of September 30, 2017 included the following legal use restrictions.
Enterprise Fund
Revenue Bond Sinking and
Reserve Fund
Bond Construction
Fund
Inmate Trust
Fund
Total Water and Sewer Fund
$4,545,479 $8,099,834 $ - $12,645,313
Law Enforcement Complex
22,368 10,482 99,064 131,914
Drainage Utility 87,178 - - 87,178 TOTAL $4,655,025 $8,110,316 $99,064 $12,864,405
The ordinance authorizing the issuance of Water and Sewer System revenue bonds requires that the
City establish a sinking fund (Revenue Bond Sinking and Reserve Fund) in an amount not less than the average annual requirement for the payment of principal and interest on all the revenue bonds. At September 30, 2017, the sinking fund balance is sufficient to satisfy such bond ordinance requirements. The bond ordinance also contains provisions, which, among other items, restrict the issuance of additional revenue bonds unless the special funds noted above contain the required amounts and the pledged revenues are equal to or greater than 1.25 times the average annual debt service requirements after giving effect to the proposed additional bonds and any proposed rate increases. In addition, the bond ordinance requires that the annual gross revenues of the Water and Sewer System, less annual operation and maintenance expenses (excluding depreciation and amortization expense), be at least 1.10 times the annual principal and interest requirements of all the outstanding revenue bonds.
The ordinance further requires that the proceeds from the sale of revenue bonds be expended for
certain capital improvements to the Water and Sewer System. The unspent proceeds are maintained as restricted assets until such time as needed to fund the Water and Sewer System construction program.
The ordinance authorizing the issuance of the Certificates of Obligation requires that the City
establish an interest and sinking fund to provide for principal and interest requirements as they become due.
Balance Beginning of
Year Increase DecreaseBalance End
of YearDue Within One
YearMEDC Revenue Bonds $9,460,000 $14,125,000 ($1,555,000) $22,030,000 $1,455,000Deferred Amounts: Premiums 148,193 1,141,332 (58,808) 1,230,717 66,653 Discounts (73,978) (84,063) 10,611 (147,430) (11,189) Total bonds & notes payable 9,534,215 15,182,269 (1,603,197) 23,113,287 1,510,464
Compensated Absences 69,158 30,962 (21,076) 79,044 24,191
Total 9,603,373 15,213,231 (1,624,273) 23,192,331 1,534,655
Total Net Pension Liability $252,689 $27,136 - $279,825

64
J. Retirement Plan Plan Description: The City participates as one of 872 plans in the nontraditional, joint contributory, hybrid defined benefit pension plan administered by the Texas Municipal Retirement System (TMRS). TMRS is an agency created by the State of Texas and administered in accordance with the TMRS Act, Subtitle G, Title 8, Texas Government Code (the TMRS Act) as an agent multiple-employer retirement system for municipal employees in the State of Texas. The TMRS Act places the general administration and management of the System with a six-member Board of Trustees. Although the Governor, with advice and consent of the Senate, appoints the Board, TMRS is not fiscally dependent on the State of Texas. TMRS’s defined benefit pension plan is a tax-qualified plan under Section 401 (a) of the Internal Revenue Code. TMRS issues a publicly available comprehensive annual financial report (CAFR) that can be obtained at www.tmrs.com. All eligible employees of the City are required to participate in TMRS. Benefits Provided: TMRS provides retirement, disability, and death benefits. Benefits provisions are adopted by the governing body of the City, within the options available in the state statutes governing TMRS. At retirement, the benefit is calculated as if the sum of the employee’s contributions, with interest, and the city-financed monetary credits with interest were used to purchase an annuity. Members may choose to receive their retirement benefit in one of seven payments options. Members may also choose to receive a portion of their benefit as a Partial Lump Sum Distribution in an amount equal to 12, 24, or 36 monthly payments, which cannot exceed 75% of the member’s deposits and interest. The plan provisions are adopted by the governing body of the City, within the options available in the state statutes governing TMRS. Plan provisions for the City were as follows:
Plan Year 2015 Plan Year 2016 Employee deposit rate 7.0% 7.0% Matching ratio (city to employee)
2 to 1 2 to 1
Years required for vesting 5 5 Service retirement eligibility (expressed as age/years of service)
60/5, 0/20
60/5, 0/20
Updated service credit 100% repeating, transfers 100% repeating, transfers Annuity Increase (to retirees) 70% of CPI Repeating 70% of CPI Repeating
Employees covered by benefit terms: At the December 31, 2016 valuation and measurement date, the following employees were covered by the benefit terms:

65
Inactive employees or beneficiaries currently receiving benefits 155 Inactive employees entitled to but not yet receiving benefits 147 Active employees 497 Total 799 Contributions: The contribution rates for employees in TMRS is 7% of employee gross earnings, and the city matching percentages is 14.62%, both as adopted by the governing body of the City. Under the state law governing TMRS, the contribution rate for each city is determined annually by the actuary, using the Entry Age Normal (EAN) actuarial cost method. The actuarially determined rate is the estimated amount necessary to finance the cost of the benefits earned by employees during the year, with an additional amount to finance any unfunded accrued liability. Employees for the City of Mansfield, Texas, were required to contribute 7% of their gross earnings during the fiscal year. The contribution rates for the City of Mansfield, Texas were 14.14% and 14.62% in calendar years 2016 and 2017 respectively. The City’s contributions to TMRS as of September 30, 2017 were $5,155,157 and were equal to the required contributions. Net Pension Liability: The City’s Net Pension Liability (NPL) was measure as of December 31, 2016, and the Total Pension Liability (TPL) used to calculate the Net Pension Liability was determined by an actuarial valuation as of that date. Actuarial Assumptions: The Total Pension Liability in the December 31, 2016 actuarial valuation was determined using the following actuarial assumptions: Inflation 2.5% per year Overall payroll growth 3.0% per year Investment Rate of Return 6.75%, net of pension plan investment expense, including inflation Salary increases were based on a service-related table. Mortality rates for active members, retirees, and beneficiaries were based on the gender-distinct RP2000 Combined Healthy Mortality Table with Blue Collar Adjustment, with male rates multiplied by 109% and female rates multiplied by 103%. The rates are projected on a fully generational basis by scale BB to account for future mortality improvements. For disabled annuitants, the gender-distinct RP2000 Combined Healthy Mortality Tables with Blue Collar Adjustment are used with male rates multiplied by 109% and female rates multiplied by 103% with a 3-year set-forward for both males and females. In addition, a 3% minimum mortality rate is applied to reflect the impairment for younger members who become disabled. The rates are projected on a fully generational basis by scale BB to account for future mortality improvements subject to the 3% floor. Actuarial assumptions used in the December 31, 2016, valuation were based on the results of actuarial experience studies. The experience study in TMRS was for the period December 31, 2010
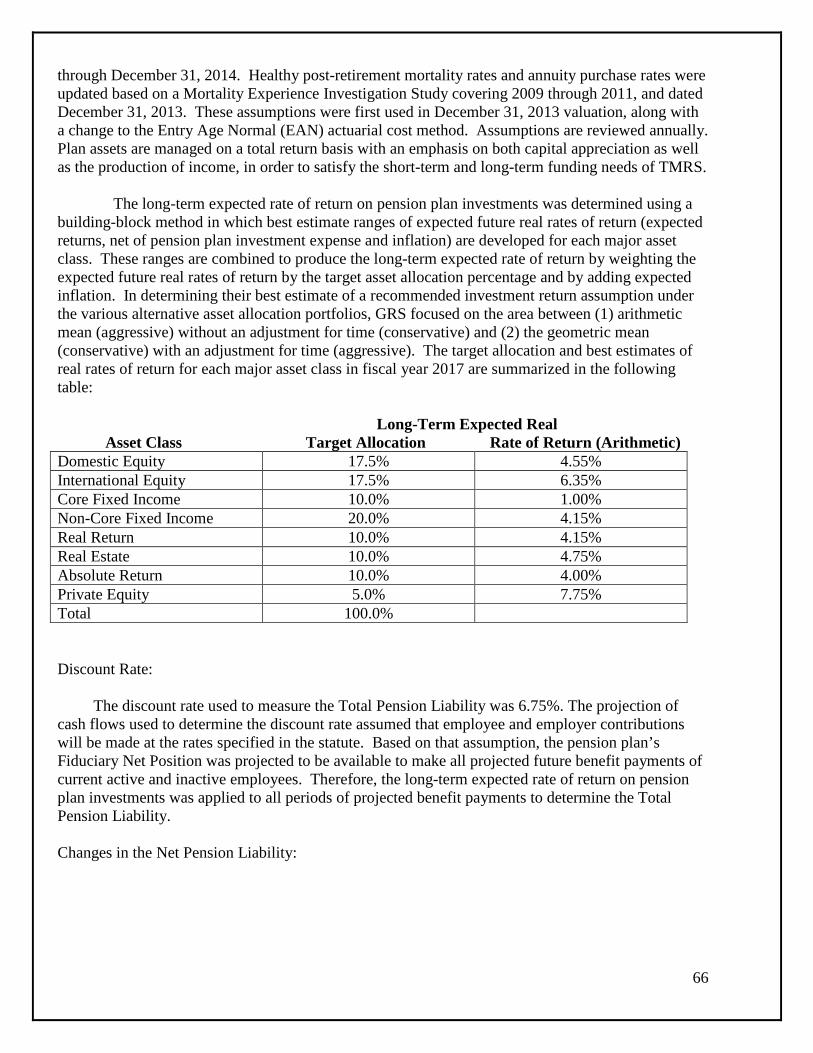
66
through December 31, 2014. Healthy post-retirement mortality rates and annuity purchase rates were updated based on a Mortality Experience Investigation Study covering 2009 through 2011, and dated December 31, 2013. These assumptions were first used in December 31, 2013 valuation, along with a change to the Entry Age Normal (EAN) actuarial cost method. Assumptions are reviewed annually. Plan assets are managed on a total return basis with an emphasis on both capital appreciation as well as the production of income, in order to satisfy the short-term and long-term funding needs of TMRS. The long-term expected rate of return on pension plan investments was determined using a building-block method in which best estimate ranges of expected future real rates of return (expected returns, net of pension plan investment expense and inflation) are developed for each major asset class. These ranges are combined to produce the long-term expected rate of return by weighting the expected future real rates of return by the target asset allocation percentage and by adding expected inflation. In determining their best estimate of a recommended investment return assumption under the various alternative asset allocation portfolios, GRS focused on the area between (1) arithmetic mean (aggressive) without an adjustment for time (conservative) and (2) the geometric mean (conservative) with an adjustment for time (aggressive). The target allocation and best estimates of real rates of return for each major asset class in fiscal year 2017 are summarized in the following table: Long-Term Expected Real
Asset Class Target Allocation Rate of Return (Arithmetic) Domestic Equity 17.5% 4.55% International Equity 17.5% 6.35% Core Fixed Income 10.0% 1.00% Non-Core Fixed Income 20.0% 4.15% Real Return 10.0% 4.15% Real Estate 10.0% 4.75% Absolute Return 10.0% 4.00% Private Equity 5.0% 7.75% Total 100.0% Discount Rate: The discount rate used to measure the Total Pension Liability was 6.75%. The projection of cash flows used to determine the discount rate assumed that employee and employer contributions will be made at the rates specified in the statute. Based on that assumption, the pension plan’s Fiduciary Net Position was projected to be available to make all projected future benefit payments of current active and inactive employees. Therefore, the long-term expected rate of return on pension plan investments was applied to all periods of projected benefit payments to determine the Total Pension Liability. Changes in the Net Pension Liability:
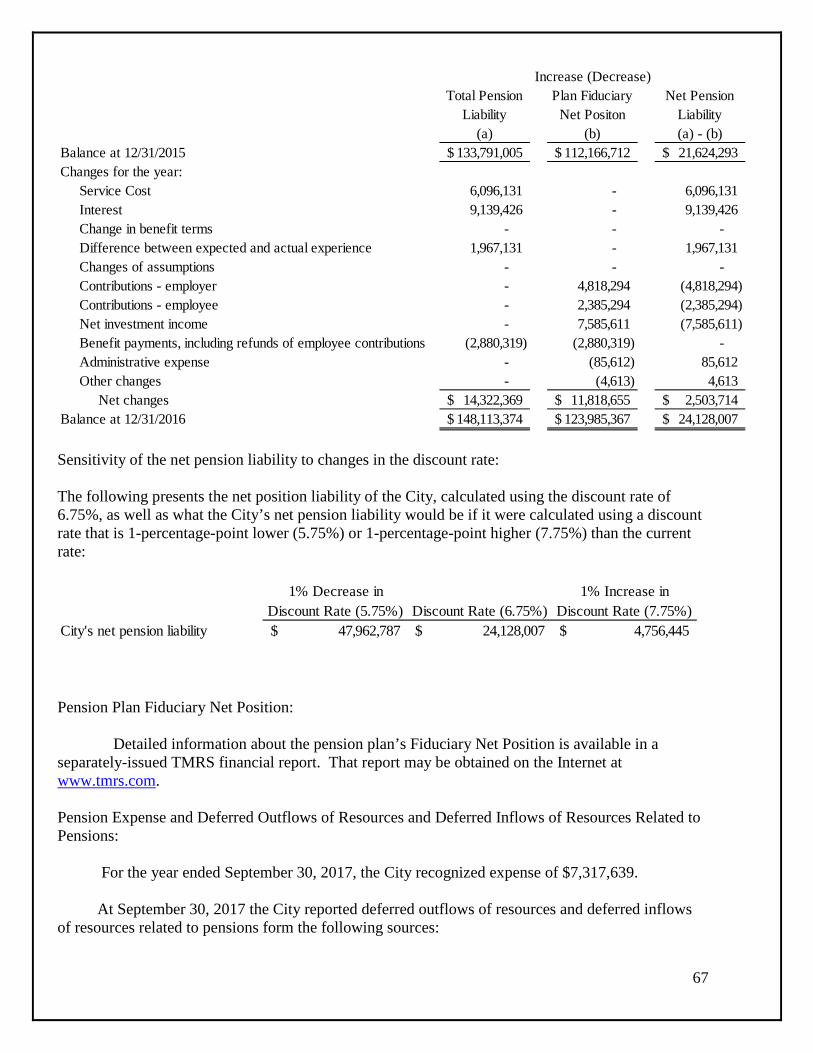
67
Sensitivity of the net pension liability to changes in the discount rate: The following presents the net position liability of the City, calculated using the discount rate of 6.75%, as well as what the City’s net pension liability would be if it were calculated using a discount rate that is 1-percentage-point lower (5.75%) or 1-percentage-point higher (7.75%) than the current rate:
Pension Plan Fiduciary Net Position: Detailed information about the pension plan’s Fiduciary Net Position is available in a separately-issued TMRS financial report. That report may be obtained on the Internet at www.tmrs.com. Pension Expense and Deferred Outflows of Resources and Deferred Inflows of Resources Related to Pensions: For the year ended September 30, 2017, the City recognized expense of $7,317,639. At September 30, 2017 the City reported deferred outflows of resources and deferred inflows of resources related to pensions form the following sources:
Total Pension Liability
Plan Fiduciary Net Positon
Net Pension Liability
(a) (b) (a) - (b)Balance at 12/31/2015 133,791,005$ 112,166,712$ 21,624,293$ Changes for the year: Service Cost 6,096,131 - 6,096,131 Interest 9,139,426 - 9,139,426 Change in benefit terms - - - Difference between expected and actual experience 1,967,131 - 1,967,131 Changes of assumptions - - - Contributions - employer - 4,818,294 (4,818,294) Contributions - employee - 2,385,294 (2,385,294) Net investment income - 7,585,611 (7,585,611) Benefit payments, including refunds of employee contributions (2,880,319) (2,880,319) - Administrative expense - (85,612) 85,612 Other changes - (4,613) 4,613 Net changes 14,322,369$ 11,818,655$ 2,503,714$ Balance at 12/31/2016 148,113,374$ 123,985,367$ 24,128,007$
Increase (Decrease)
1% Decrease in 1% Increase inDiscount Rate (5.75%) Discount Rate (6.75%) Discount Rate (7.75%)
City's net pension liability 47,962,787$ 24,128,007$ 4,756,445$

68
Due to Liabilities:
Recognition Period (or
Amortization yrs)
Total (Inflow) or Outflow of
Resources
2016 Recognized in
current pension expense
Deferred (Inflow)/Outflow in future expense
2014 Difference in expected and actual experience 4.9001 51,522$ 10,515$ 41,007$
actuarial (gains) or losses
2015 Difference in expected and actual experience 5.7300 138,042$ 24,091$ 113,951$
actuarial (gains) or losses
2016 Difference in expected and actual experience 6.7900 1,967,131$ 289,710$ 1,677,421
actuarial (gains) or losses324,316$ 1,832,379$
2015 Difference in assumption changes 5.7300 (570,461) (99,557) (470,904)
actuarial (gains) or losses(99,557)$ (470,904)$
Due to Assets:
2014 Difference in projected and actual earnings on
pension plan investments 3.000 751,367 250,455 500,912 actuarial (gains) or losses
2015 Difference in projected and actual earnings on
pension plan investments 4.000 5,904,249 1,476,062 4,428,187 actuarial (gains) or losses
2016 Difference in projected and actual earnings on 5.000 (14,358) (2,872) (11,486)
actuarial (gains) or losses1,723,645$ 4,917,613$
Total 6,279,088$
Schedule of Outflows and Inflows - Current and Future Expense

69
$3,919,488 reported as deferred outflows of resources related to pensions resulting from contributions subsequent to the measurement date will be recognized as a reduction of the net pension liability for the fiscal year ending September 30, 2017. Other amounts reported as deferred outflows and inflows of resources related to pensions will be recognized in pension expense as follows:
K. Supplemental Death Benefits
The City also participates in the cost sharing multiple-employer defined benefit group-term life
insurance plan operated by the TMRS known as the Supplemental Death Benefits Fund (SDBF). The City elected by ordinance to provide group-term life insurance coverage to both current and retired employees. The City may terminate coverage under and discontinue participation in the SDBF by adopting an ordinance before November 1 of any year to be effective the following January 1.
The death benefit for active employees provides a lump-sum payment approximately equal to the employee’s annual (calculated based on the employee’s actual earnings, for the 12-month period preceding the month of death); retired employees are insured for $7,500; this coverage is an “other postemployment benefit,” or OPEB. Contributions
The City contributes to the SDBF at a contractually required rate as determined by an annual actuarial valuation. The rate is equal to the cost of providing one-year term life insurance. The funding policy for the SDBF program is to assure that adequate resources are available to meet all death benefit payments for the upcoming year; the intent is not to prefund retiree term life insurance during employees’ entire careers.
The City’s contributions to the TMRS SDBF for the fiscal years ended 2017, 2016, and 2015 were $54,588, $49,169, and $43,367, respectively, which equaled the required contributions each year. L. Other Post-Employment Benefits - OPEB Plan Description City employees retiring on TMRS will be provided the opportunity to receive health insurance benefits from the City from the City’s existing health care plan. The City established by ordinance a single-employer defined benefit postemployment healthcare plan that covers retired employees of the City. The
Net deferred outflows
(inflows) of resources
2017 1,948,404$ 2018 1,948,406 2019 1,697,950 2020 220,836 2021 234,621
Thereafter 228,871 Total 6,279,088$
70
City established an irrevocable trust and contracted with an administrator as well as a custodial bank to manage the plan’s assets or the retiree’s medical benefits.
The plan does not issue a stand-alone financial report. For inquiries relating to the plan, please contact: The City of Mansfield, Business Services Division, 1200 East Broad Street, Mansfield, Texas 76063.
Measurement Focus and Basis of Accounting
The City of Mansfield, Texas Retiree Health Insurance Plan’s financial statements are prepared
using the accrual basis of accounting. Plan member contributions are recognized in the period in which the contributions are due. Employer contributions to plan are recognized when due and the employer has made a formal commitment to provide contributions. Benefits and refunds are recognized when due and payable in accordance with the determination of the employer. Benefits
City employees will be provided the opportunity to elect employer-subsidized health programs until the age of 65. Employees and their dependents who retire before the age of 65 with ten years of service and less than 20 years of service are eligible to receive full health insurance coverage as a life time benefit at the same cost of an active employee. Employees and their dependents who retire with 20 years of service are eligible to receive full health insurance coverage as a life time benefit; while their dependents are eligible for full health insurance coverage they must pay the same cost as an active employee for full insurance coverage of their dependents.
At the time of the actuarial valuation, the City had 459 active plan members and 63 retired plan members receiving benefits.
Participants included in the actuarial valuation include retirees and survivors, and active employees who may be eligible to participate in the Plan upon retirement. Expenditures for post-retirement healthcare and other benefits are recognized monthly and funded into the irrevocable trust. The City funds 100% of the ARC, which approximates the annual OPEB cost, and totaled $1,494,800 for the fiscal year ended September 30, 2017. The City also funded 100% of the ARC, which approximated the annual OPEB cost, and totaled $1,614,551 and $1,075,045 for each of the fiscal years ended September 30, 2016 and 2015 respectively.
Eligible retired employees participating in the City’s Retiree Health Insurance Plan pay their
premiums directly to the City. The City paid the ARC, including the employee portions of healthcare premiums directly to the Trust in the amount of $1,494,800 for fiscal year 2017.
Funding
The City makes an annual contribution to the plan approximately equal to the ARC. The City
commissioned an updated actuarial valuation of the plan for October 1, 2015 for fiscal year 2016.
The funded status as of October 1, 2016 (unaudited), the most recent actuarial valuation date, is as follows:
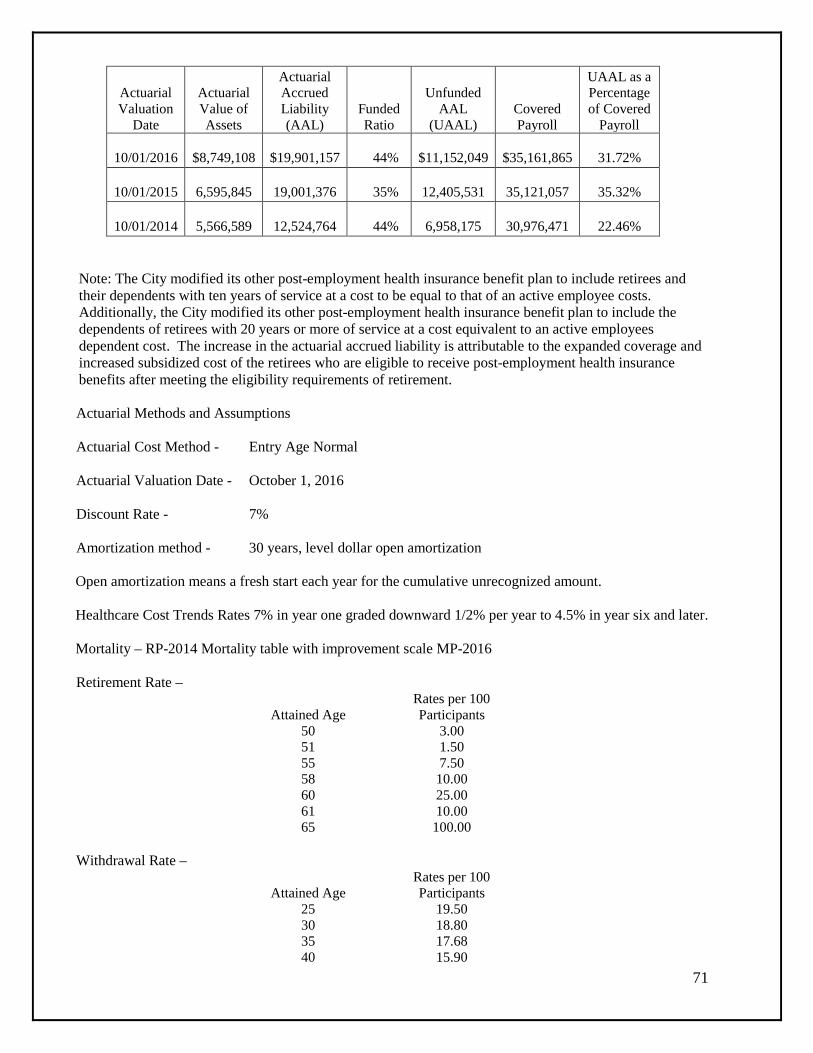
71
Actuarial Valuation
Date
Actuarial Value of Assets
Actuarial Accrued Liability (AAL)
Funded Ratio
Unfunded AAL
(UAAL)
Covered Payroll
UAAL as a Percentage of Covered
Payroll
10/01/2016
$8,749,108
$19,901,157 44%
$11,152,049
$35,161,865
31.72%
10/01/2015
6,595,845
19,001,376
35%
12,405,531
35,121,057
35.32%
10/01/2014
5,566,589
12,524,764
44%
6,958,175
30,976,471
22.46%
Note: The City modified its other post-employment health insurance benefit plan to include retirees and their dependents with ten years of service at a cost to be equal to that of an active employee costs. Additionally, the City modified its other post-employment health insurance benefit plan to include the dependents of retirees with 20 years or more of service at a cost equivalent to an active employees dependent cost. The increase in the actuarial accrued liability is attributable to the expanded coverage and increased subsidized cost of the retirees who are eligible to receive post-employment health insurance benefits after meeting the eligibility requirements of retirement.
Actuarial Methods and Assumptions Actuarial Cost Method - Entry Age Normal Actuarial Valuation Date - October 1, 2016 Discount Rate - 7% Amortization method - 30 years, level dollar open amortization Open amortization means a fresh start each year for the cumulative unrecognized amount. Healthcare Cost Trends Rates 7% in year one graded downward 1/2% per year to 4.5% in year six and later. Mortality – RP-2014 Mortality table with improvement scale MP-2016 Retirement Rate –
Attained Age Rates per 100 Participants
50 3.00 51 1.50 55 7.50 58 10.00 60 25.00 61 10.00 65 100.00
Withdrawal Rate –
Attained Age Rates per 100 Participants
25 19.50 30 18.80 35 17.68 40 15.90
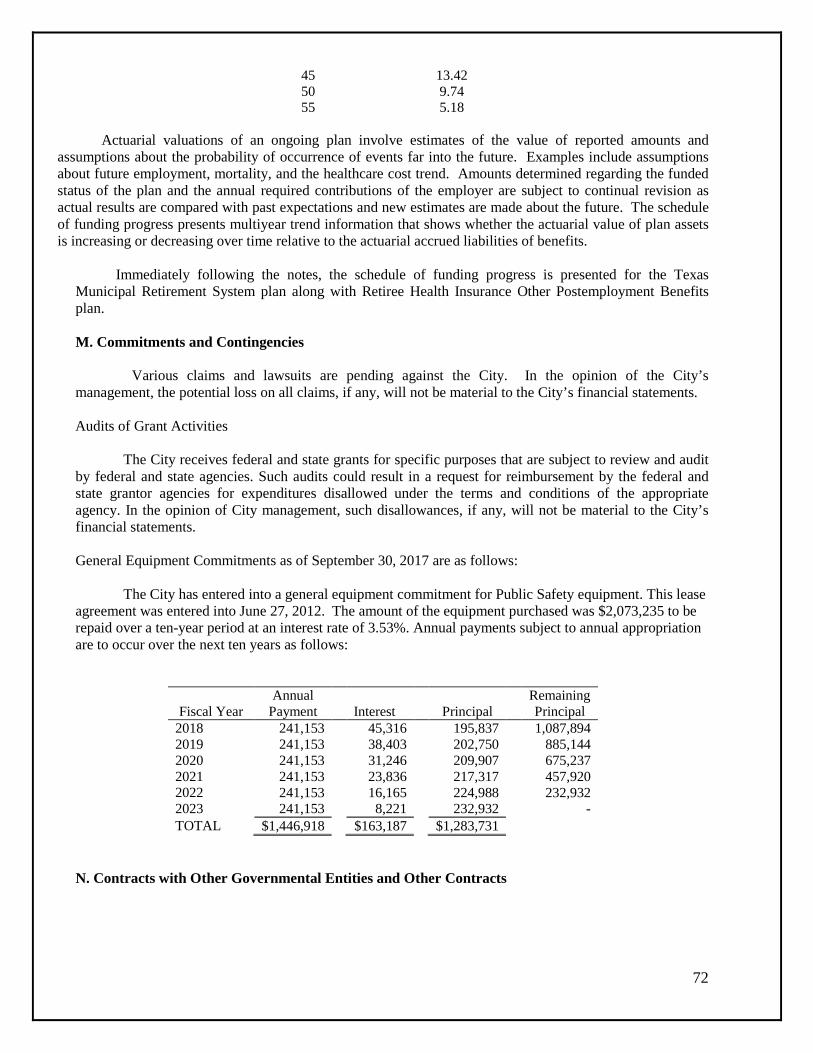
72
45 13.42 50 9.74 55 5.18
Actuarial valuations of an ongoing plan involve estimates of the value of reported amounts and assumptions about the probability of occurrence of events far into the future. Examples include assumptions about future employment, mortality, and the healthcare cost trend. Amounts determined regarding the funded status of the plan and the annual required contributions of the employer are subject to continual revision as actual results are compared with past expectations and new estimates are made about the future. The schedule of funding progress presents multiyear trend information that shows whether the actuarial value of plan assets is increasing or decreasing over time relative to the actuarial accrued liabilities of benefits.
Immediately following the notes, the schedule of funding progress is presented for the Texas Municipal Retirement System plan along with Retiree Health Insurance Other Postemployment Benefits plan.
M. Commitments and Contingencies Various claims and lawsuits are pending against the City. In the opinion of the City’s management, the potential loss on all claims, if any, will not be material to the City’s financial statements. Audits of Grant Activities
The City receives federal and state grants for specific purposes that are subject to review and audit
by federal and state agencies. Such audits could result in a request for reimbursement by the federal and state grantor agencies for expenditures disallowed under the terms and conditions of the appropriate agency. In the opinion of City management, such disallowances, if any, will not be material to the City’s financial statements.
General Equipment Commitments as of September 30, 2017 are as follows:
The City has entered into a general equipment commitment for Public Safety equipment. This lease
agreement was entered into June 27, 2012. The amount of the equipment purchased was $2,073,235 to be repaid over a ten-year period at an interest rate of 3.53%. Annual payments subject to annual appropriation are to occur over the next ten years as follows:
Annual Remaining Fiscal Year Payment Interest Principal Principal
2018 241,153 45,316 195,837 1,087,894 2019 241,153 38,403 202,750 885,144 2020 241,153 31,246 209,907 675,237 2021 241,153 23,836 217,317 457,920 2022 241,153 16,165 224,988 232,932 2023 241,153 8,221 232,932 - TOTAL $1,446,918 $163,187 $1,283,731
N. Contracts with Other Governmental Entities and Other Contracts

73
Water Supply
Raw water is supplied to the City through a contract between the City and the Tarrant Regional Water District (TRWD). The basic contract, which was renegotiated and approved by the TRWD and the City Council on September 10, 1979, provides for a contract period to run for the life of the bonds, which were issued by the TRWD to provide water to the City and thereafter for the life of the TRWD facilities serving the City. Water is provided to the City from the TRWD Cedar Creek Lake and Richland-Tehuacanna Reservoir. Under the contract, the City has a take-or-pay gallon requirement based on the greater of 1.3 million gallons or the average daily consumption for the previous five-year period. The rate to be charged to the City for raw water is based upon the TRWD cost of debt service, operation and maintenance expenses, and any other miscellaneous expenses in connection with its water supply facilities. These costs will be allocated on a proportionate share based upon actual water consumption of the City in relation to the actual use by the City of Fort Worth and the Trinity River Authority (TRA) after crediting the amount received by the TRWD from water sales to the City of Arlington and other customers. The current rate charged for raw water has been calculated to be $1.27676 per 1,000 gallons, with a total cost of $5,082,946 during fiscal year 2017. It is estimated that the raw water supply available to the City under the contract is adequate for the ultimate development of the City.
In addition, the City has a contract with the City of Arlington to purchase treated water up to 1.0
M.G.D. on a demand basis. The City has the option to renegotiate the Arlington water purchase contract on an as-needed basis. Sewer Treatment
On August 23, 1974, the City Council approved a contract with the TRA to become a contracting
party in the TRA’s Central Regional Wastewater System, along with 19 other area cities and the Dallas/Fort Worth International Airport.
The contracting parties have agreed to pay the TRA its net cost of operation and maintenance,
including debt service requirements, on the Central System. Payments made by the respective cities are pursuant to authority granted by Article 1109i, Vernon’s Annotated Texas Civil Statutes, as amended, and Chapter 30, Texas Water Code, as amended, and constitute operating expenses of their waterworks and sewer systems.
The expense of operating TRA’s Central System, including administrative overhead and amounts
necessary to pay debt service, is paid monthly by the contracting parties based on a formula of dividing each contracting party’s estimated contributing flow to the Central System for such year by the total estimated contributing flow by all contracting parties being served at the beginning of each such year, with a year-end adjustment based on actual metered contributing flow to the Central System by all contracting parties. For fiscal year 2017, the City’s cost for sewer treatment under the contract was $5,876,036. Law Enforcement Complex Housing Commitment
On June 25, 1990, the City entered into an Intergovernmental Agreement Contract (IGA) with the United States Marshal’s Service (USMS) to provide for the housing, safekeeping, and subsistence of adult male and female federal prisoners. The City began housing prisoners from the Immigration and Naturalization Service pursuant to the terms and conditions of the USMS contract or IGA. On December 11, 1998, the City and the USMS agreed for the City to house federal prisoners and other related governmental agencies’ prisoners at a cost of $46.60 per day, effective June 1, 1999.
On January 1, 2017, the City entered into an IGA with the USMS to provide for the housing,
safekeeping, and subsistence of adult male and female federal prisoners. The City began housing prisoners from the Immigration and Naturalization Service pursuant to the terms and conditions of the USMS

74
contract or IGA. On January 1, 2017, the City and the USMS agreed for the City to house federal prisoners and other related governmental agencies’ prisoners at a cost of $66.30 per day, effective January 1, 2017.
On November 1, 2001, the City and the City of Fort Worth, Texas, entered into an agreement under
the Interlocal Cooperation Act, Chapter 791 of the Texas Government Code, for the purpose of housing the City of Fort Worth’s prisoners. This contract was renegotiated during fiscal year 2006, and a new agreement was reached between the City and the City of Fort Worth, Texas, commencing on October 1, 2006. The new agreement is an annual agreement that automatically renews for subsequent one-year terms, commencing on October 1 of each year and ending on September 30 of each year for nine (9) years after the Initial Term until September 30, 2016. There are various provisions in the contract defining both the purpose and nature of the duties of the City, and the City of Fort Worth, Texas, in housing the City of Fort Worth, Texas, prisoners. The general terms of the contract agree that the City will collect a monthly fee of $388,969 or $4,667,626 in the first year of the contract. Each subsequent term of the contract, the annual amount will increase 4% per year. There are various provisions in the contract that define additional payments for housing prisoners over a specified cap and a reduction in payments if the population of the prisoners drops below a certain number. These provisions give notice to each party that a material change has occurred in the purpose and management of housing the City of Fort Worth, Texas, prisoners and that adjustments to the terms of the contract should be mutually agreed upon by both parties.
In September 2016, the parties agreed to extend the term of the contract for one year until
September 30, 2017 and agreed to various provisions regarding prisoner administration. The time requirement for notification of non-renewal by the City of Fort Worth has been changed from 90 days to 180 days.
In September 2017, the parties agreed to extend the term of the contract for one year until
September 30, 2018 and agreed to various provisions regarding prisoner administration. The time requirement for notification of non-renewal by the City of Fort Worth has been changed from 90 days to 180 days.
The Contract is subject to termination by either party upon written notice provided 180 days before
any annual renewal date. Upon such notice of intent, neither party is obligated to any further performance or consideration that has not already been rendered. If the City of Fort Worth, Texas, fails to appropriate funds sufficient to fulfill its obligations under this agreement, Fort Worth may terminate this agreement to be effective by whichever effective date is sooner: (1) thirty (30) days following delivery by Fort Worth to the City of written notice of Fort Worth’s intent to terminate or (2) the last date for which funding has been appropriated by Fort Worth’s City Council for Fort Worth to fulfill its obligations under this Agreement.
If any net losses or capital requirements should arise in the future, the City will be required to make
cash advances and/or operating transfers from the general fund to fund these operating and capital requirements. The City cannot reasonably estimate the amounts, if any, of the advances or operating transfers that may be required. Mansfield National Golf Club
In June 1999, the City entered into an agreement with MPFDC and Evergreen Alliance Golf
Limited, L.P., a Delaware limited partnership, to construct an 18-hole golf course. The agreement named the property on which the course was constructed: Mansfield National Golf Club. Mansfield National Golf Club was constructed by Evergreen Alliance Golf Limited, L.P. (Alliance) during FY99 and FY00 on property owned by MPFDC in the City. The Mansfield National Golf Club opened in November 2000. During the course of the construction, Alliance assumed the financial obligation and risk of constructing the course on the MPFDC property. Upon completion of the construction of Mansfield National Golf Club, a long-term lease agreement was entered into by the MPFDC and Alliance to manage and operate the course

75
for a period of 50 years. In the agreement, Alliance agreed to pay the MPFDC a Base Rent for occupying the property during the term of the Lease. The following summarizes the terms of the base rent:
Lease years 01 through and including 10: $ 0.00 per lease year Lease years 11 through and including 20: $ 50,000 per lease year Lease years 21 through and including 30: $100,000 per lease year Lease years 31 through and including 40: $125,000 per lease year Lease years 41 through and including 50: $175,000 per lease year
The value of the improvements made to the property, subject to and reserving the leasehold rights
of Alliance as defined by the agreement, became the vested rights of MPFDC and subsequently the vested rights of the City. The rights of the value of improvements have been used as collateral for financing the cost of constructing the improvements. The improvements or rights of the value of the improvement are not carried or recognized as an asset by the MPFDC. However, upon the dissolution of the lease agreement, the rights of the value of the improvements are to be recognized as an asset by the MPFDC. The MPFDC has the right of first refusal and the authority to approve or disapprove future assignments of the rights made by Alliance. In the event Alliance becomes insolvent, certain remedies are permitted by the agreement and in no circumstance is the MPFDC obligated to or committed to Alliance’s creditors.
The City is accruing a lease receivable of $90,000 per year to recognize future rental income over
the term of the lease on a straight-line basis.
Sports Park – Big League Dreams
During fiscal year 2008, the City completed the construction of a multipurpose recreational sports park known as “Big League Dreams Mansfield Sports Park,” BLDMSP. The City spent $26.4 million on the facility, which includes eight lighted theme baseball/softball fields, one multipurpose facility, open park areas, and administrative offices on 40 acres tract of land.
The City contracted with a Texas Limited Partnership, Big League Dreams Mansfield, L.P., or
BLD, to manage, operate, and maintain the park for 40 years effective upon the completion of the construction of BLDMSP. This agreement is referred to as a maintenance and operation agreement. BLD is an affiliate of Big League Dreams USA, LLC, or BLD USA, a California company, which has affiliates in several states including Texas, Arizona, and California. BLD USA also owns the intellectual rights and has a proprietary interest in the Total Image, Name and Marks, and Logo, BLD USA. The City has contracted with BLD USA to use their intellectual rights for BLDMSP through a license agreement. The term of this license agreement is concurrent to the term of the maintenance and operation agreement.
The terms of the agreement give BLD the right to operate and maintain the BLDMSP for an initial
term of 30 years with the two separate options of extending the contract for 5 years in periods following the original term of 30 years. BLD is to maintain and operate the park from the use of the facility by the public. BLD is able to charge fees and is to pay for the cost of maintaining, insuring, and operating the park. For the right to maintain, insure, and operate the BLDMSP, BLD is to pay the City a minimum operating fee of $100,000 per year with escalation provisions based upon annual gross revenues achievements. The payments are to commence after a waiver period of at least 12 months.
There are provisions for the termination of this agreement in the event of well-defined
circumstances of default by either the City or BLD USA. In the event of an agreed-upon default, the City or BLD has exhaustive rights to remedy or cure the default. There is no right of assignment outside the assignment to an affiliate of either entity.
76
Water Park – Hawaiian Falls
In fiscal year 2008, the City completed the construction and capitalized the costs of a water park. The cost of the park capitalized was $8.9 million.
To construct, operate, and maintain the water park, the City contracted with Mansfield Family
Entertainment, LLC, MFE, commonly referred to as Hawaiian Falls. The term of the agreement is for a period of 40 years with two 5-year renewal options succeeding the term of 40 years. The agreement allows MFE to operate and maintain the park by leasing the water park from City. MFE has the right to charge fees to operate and maintain the park. The City granted a rent holiday or reprieve from annual lease payments for a period of 7 years. However, if the gross receipts generated from the operation of the water park exceed $2,500,000 in any year within the 7-year rent holiday, MFE is to begin paying an annual lease payment of at least 5% of gross revenues thereafter.
By agreement, MFE acknowledges the title of City in and to land constituting the premises and the
real property improvements including appurtenances constructed by either party and agrees never to contest such title.
The parent company of Mansfield Family Entertainment, LLC (MFE), Horizon Family Holdings,
LLC sold 100% of the interest of Horizon Family Holdings to Source Horizon, LLC. This transaction allows for the ground lease with MFE to continue without disruption. Fieldhouse
In fiscal year 2017, the City completed construction of an indoor basketball and volleyball facility.
The facility will have at least 90,000 square feet and will have space for 8 basketball courts or 12 volleyball courts. The cost of the sports facility capitalized was $12.6 million.
To operate and maintain the basketball and volleyball facility, the City contracted with Mansfield
Fieldhouse, LLC, commonly referred to as Fieldhouse. The term of the lease and operating agreement is for a period of 25 years with a first extension period of 10 years and a second extension period of 5 years. Per the lease, Fieldhouse may charge fees in order to maintain and operate the sports facility. Base rent in years 1-5 will be $300,000 per year. Base rent in years 6-25 will be equal to $500,000 per year. Beginning in year 3 of the lease, Fieldhouse will pay 10% of the Gross Revenues in addition to the base rent up to a maximum total payment of $600,000 annually. In years 4-25, Fieldhouse will pay 15% of Gross Revenues in addition to the base rent up to a maximum total rent payment of $600,000 annually. Percentage rents are waived for years 1 & 2 for ramp up of operations.
In the year of the commencement date, the City will annually accrue a lease receivable of $460,000
to recognize future rental income over the term of the lease on a straight-line basis. Stars Center
In September 2016, the City entered into a lease and operating agreement with DSE Hockey
Centers LP to construct, develop, complete and own for public purposes an indoor recreational ice skating rink and sports center. The facility will be approximately 80,000 gross square feet with two ice surfaces.
The lease and operating agreement between the City and DSE Hockey Centers LP is for a 30 year
period. DSE Hockey Center, LP prepaid rent and deposits of $1,500,000 and $600,000 respectively as of September 30, 2016 and will pay an additional deposit of $400,000 upon the occupancy of the facility. This amount will be repaid over the next 20 years. The security deposit is recognized as a liability and the prepaid rent is recognized as a deferred inflow of resources to be repaid over the period of 20 years.

77
The term of the lease is for 30 years and the following summarizes the base rent: Lease years 01 through and including 05: $440,000 per lease year; Lease years 06 through and including 07: $500,000 per lease year; Lease years 08 through and including 13: $600,000 per lease year; Lease years 14: $640,000 per lease year; Lease years 15 through and including 30: $660,000 per lease year. Beginning in the fiscal year of lease commencement, the City will accrue $600,000 per year to
recognize future rental income over the term of the lease on a straight-line basis.
Mansfield Economic Development Corporation Commitments
The Mansfield Economic Development Corporation was established to promote, encourage and
incentivize economic development within the City. Since its inception, the Corporation has promoted industrial and commercial development through incentive agreements that are designed to encourage existing business expansion and new business growth within the City. Since inception, the Corporation has assisted companies in making the City their home by providing economic assistance. In return, those companies have made cumulative capital investments and created jobs within the City.
In continuance of the City’s economic development program, the Corporation has made additional
commitments to incentivize industry over the next several years. These commitments are generally contingent upon the industry’s capital investments and creation of new jobs or other criteria determined by the Corporation. The arrangements vary in amounts and allow for reimbursements for capital costs or expansion costs incurred by the industries. These commitments require stringent performance commitments by the respective industries to qualify for the incentives. To date, the Corporation had made commitments to be administered over the next several years in the amounts of $4.6 million in year 2018, $2.1 million in year 2019, $1.5 million in year 2020, $1.5 million in year 2021, $1.0 million in year 2022 and $0.6 million in year 2023. These commitments and amounts may change from year to year depending upon the performance of the industries, and their ability to meet the performance standards as established by the Corporation. In the event, the Corporation deems the industries performance insufficient, the Corporation can restructure, extend, void or recover the commitments.
Mansfield Tax Increment Financing Reinvestment Zone Number Two Commitments The Mansfield Tax Increment Financing Reinvestment Zone Number Two’s board of directors has committed the TIRZ to reimburse the City for the following expenditures. The expenditures are land acquisition - $962,133, downtown lofts - $2,289,901, parking lot construction - $283,736 and business incentives - $356,855. These funds are anticipated to be paid to the City with future revenue of the TIRZ.
O. Tax Abatements The City of Mansfield entered into 380 agreements with local businesses under the State of Texas Local Government Code 380. Under the Local Government Code, municipalities may establish and provide for the administration of one or more programs, including programs for making loans and grants of public money and providing personnel and services of the municipality, to promote state or local economic development and stimulate business and commercial activity in the municipality. The abatements may be granted to any business located within or promising to relocate to the City of Mansfield, Texas. For the fiscal year ended September 30, 2017, the City of Mansfield, Texas abated property and sales taxes totaling $596,766 under this program, including the following tax abatement agreements:

78
A 100% property tax abatement to a tool manufacturer for building a manufacturing center in the industrial district. The abatement amounted to $536,543.
A 50% property tax abatement for a printing company for expanding a manufacturing center in the industrial district. The abatement amounted to $16,767.
An 80% sales tax abatement to a home builder for materials purchased within the City of Mansfield, Texas. The abatement amounted to $43,299. An 80% sales tax abatement to a home builder for materials purchased within the City of Mansfield, Texas. The abatement amounted to $157. P. Conduit Debt Obligations
In prior years, the City has issued Industrial Revenue Bonds to provide financial assistance to
private sector entities for the acquisition and construction of industrial and commercial facilities deemed to be in the public interest. The bonds are secured by the property financed and are payable solely from payments received on the underlying mortgage loans. Upon repayment of the bonds, ownership of the acquired facilities transfers to the private-sector entity served by the bond issuance. Neither the City, the state, nor any political subdivision thereof is obligated in any manner for repayment of the bonds. Accordingly, the bonds are not reported as liabilities in the accompanying financial statements.
There are no series of Industrial Revenue Bonds outstanding as of the fiscal year-end.
Q. Risk Management
The City is exposed to various risks of loss related to torts; theft of, damage to, and destruction of assets; errors and omissions; injuries to employees; and natural disasters. The City’s general liability and workers’ compensation program is managed through the purchase of a policy through a municipal pool that is separately administered. The City’s health insurance is administered through an outside provider. The City makes specified contributions for employees and their dependents under this plan. Additionally, the City also offers dental, life insurance, and accidental death and dismemberment plans through an independent provider in which the City makes specified contributions for employees only under these plans. There have been no significant reductions in insurance coverage for any of these programs since last year, and settlements have not exceeded insurance coverage for any of the past three years. R. Subsequent Events Bond Issuances
On January 22, 2018, the City issued $2,325,000 in Sales Tax Revenue Bonds, New Series 2018. The purpose of the Sales Tax Revenue Bonds, New Series 2018 is for the design, development, and construction of an administrative facility and the linear park system. The City issued $3,785,000 in Sales Tax Revenue Bonds, Taxable New Series 2018. The purpose of the Sales Tax Revenue Bonds, Taxable New Series 2018 is for the design, development, and construction of public recreational ice skating facility. Also, the City issued $6,200,000 in Sales Tax Revenue Bonds, New Series 2018. The purpose of the Sales Tax Revenue Bonds, New Series 2018 is for the acquisition, design, development, and construction of an industrial business park.

79
On January 22, 2018, the City issued $15,960,000 in Combination Tax and Revenue Certificates of Obligation, Series 2018. The purpose of the Combination Tax and Revenue Certificates of Obligations, Series 2018 are for the design, development, and construction of public infrastructure and acquiring public safety equipment.
S. New Accounting Pronouncements to be implemented after fiscal year 2017
For fiscal year 2017, the City has implemented Statement No. 80 of the financial accounting standards issued by the GASB.
GASB issued Statement No. 74, Financial Reporting for Postemployment Benefit Plans Other Than Pension Plans. The objective of this Statement is to improve the usefulness of information about postemployment benefits other than pensions (other postemployment benefits or OPEB) included in the general purpose external financial reports of state and local governmental OPEB plans for making decisions and assessing accountability. This Statement results from a comprehensive review of the effectiveness of existing standards of accounting and financial reporting for all postemployment benefits (pensions and OPEB) with regard to providing decision-useful information, supporting assessments of accountability and interperiod equity, and creating additional transparency. The requirements of this Statement are effective for financial statements for periods beginning after June 15, 2016. The City is in the process of evaluating the impact of this statement on its financial statements.
In June 2015, the GASB issued Statement No.75, Accounting and Financial Reporting for Postemployment Benefits other than Pensions. The primary objective of this Statement is to improve accounting and financial reporting by state and local governments for postemployment benefits other than pensions (other postemployment benefits or OPEB) This Statement results from a comprehensive review of the effectiveness of existing standards of accounting and financial reporting for all postemployment benefits (pensions and OPEB) with regard to providing decision-useful information, supporting assessments of accountability and interperiod equity, and creating additional transparency. This Statement is effective for financial statements for fiscal years beginning after June 15, 2017. The City is in the process of evaluating the impact of this statement on its financial statements. In March 2016, the GASB issued Statement No. 81, Irrevocable Split-Interest Agreements. The primary objective of this Statement is to improve accounting and financial reporting for irrevocable split-interest agreements by providing recognition and measurement guidance for situations in which a government is a beneficiary of the agreement. This Statement is effective for fiscal years beginning after December 15, 2016. The City is in the process of evaluating the impact of this statement on its financial statements. In March 2016, the GASB issued Statement No. 82, Pension Issues – An Amendment of GASB No. 67, No. 68, and No. 73. The objective of this Statement is to address certain issues that have been raised with respect to Statements No. 67, Financial Reporting for Pension Plans, No. 68, Accounting and Financial Reporting for Pensions, No. 73, Accounting and Financial Reporting for Pensions and Related Assets That are Not within the Scope of GASB Statement 68, and Amendments to Certain Provisions of GASB Statements 67 and 68. Specifically, this Statement addresses issues regarding (1) the presentation of payroll-related measures in required supplementary information, (2) the selection of assumptions and the treatment of deviations from the guidance in an Actuarial Standard of Practice for financial reporting purposes, and (3) the classification of payments made by employers to satisfy employee (plan member) contribution requirements. This Statement is effective for fiscal years beginning after June 15, 2017. The City is in the process of evaluating the impact of this statement on its financial statements.

80

81
CITY OF MANSFIELD, TEXAS
REQUIRED SUPPLEMENTARY INFORMATION - UNAUDITED
SEPTEMBER 30, 2017
Texas Municipal Retirement System
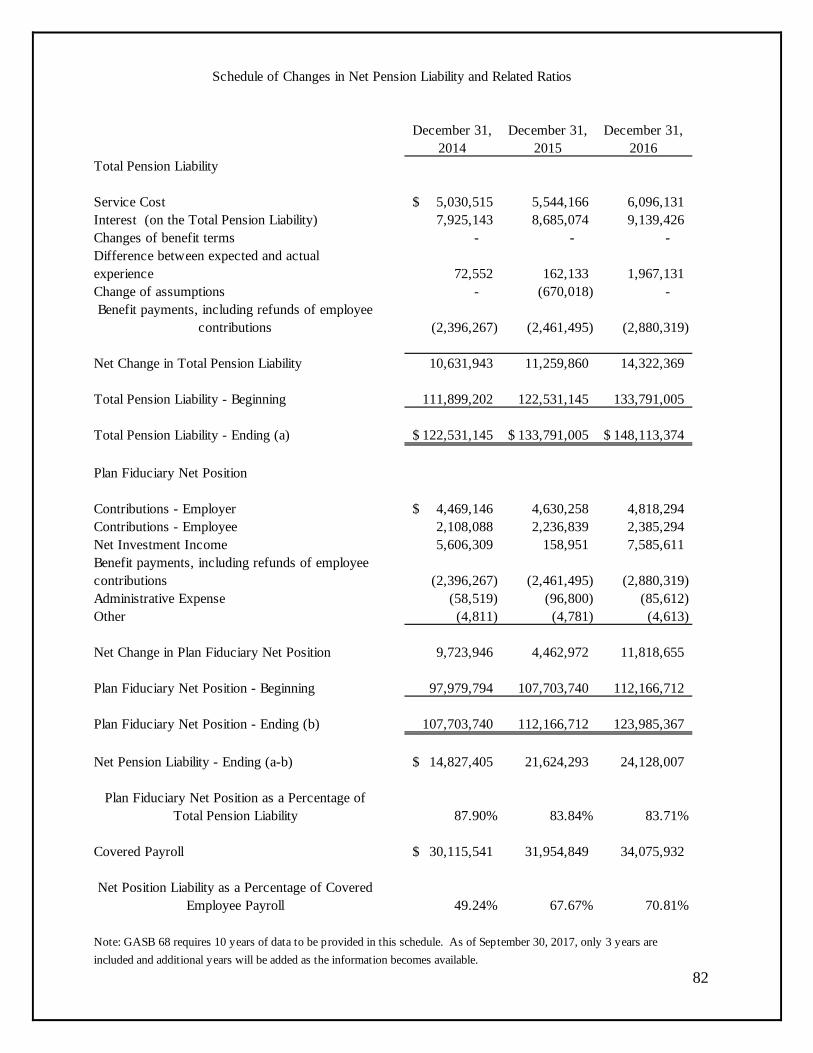
82
December 31, 2014
December 31, 2015
December 31, 2016
Total Pension Liability
Service Cost 5,030,515$ 5,544,166 6,096,131 Interest (on the Total Pension Liability) 7,925,143 8,685,074 9,139,426 Changes of benefit terms - - - Difference between expected and actual experience 72,552 162,133 1,967,131 Change of assumptions - (670,018) - Benefit payments, including refunds of employee
contributions (2,396,267) (2,461,495) (2,880,319)
Net Change in Total Pension Liability 10,631,943 11,259,860 14,322,369
Total Pension Liability - Beginning 111,899,202 122,531,145 133,791,005
Total Pension Liability - Ending (a) 122,531,145$ 133,791,005$ 148,113,374$
Plan Fiduciary Net Position
Contributions - Employer 4,469,146$ 4,630,258 4,818,294 Contributions - Employee 2,108,088 2,236,839 2,385,294 Net Investment Income 5,606,309 158,951 7,585,611 Benefit payments, including refunds of employee contributions (2,396,267) (2,461,495) (2,880,319) Administrative Expense (58,519) (96,800) (85,612) Other (4,811) (4,781) (4,613)
Net Change in Plan Fiduciary Net Position 9,723,946 4,462,972 11,818,655
Plan Fiduciary Net Position - Beginning 97,979,794 107,703,740 112,166,712
Plan Fiduciary Net Position - Ending (b) 107,703,740 112,166,712 123,985,367
Net Pension Liability - Ending (a-b) 14,827,405$ 21,624,293 24,128,007
Plan Fiduciary Net Position as a Percentage of Total Pension Liability 87.90% 83.84% 83.71%
Covered Payroll 30,115,541$ 31,954,849 34,075,932
Net Position Liability as a Percentage of Covered Employee Payroll 49.24% 67.67% 70.81%
Note: GASB 68 requires 10 years of data to be provided in this schedule. As of September 30, 2017, only 3 years areincluded and additional years will be added as the information becomes available.
Schedule of Changes in Net Pension Liability and Related Ratios

83
Notes to Schedule of Contributions
Valuation Date: Notes: Actuarially determined contribution rates are calculated as of
December 31 and become effective in January 13 months later. Methods and Assumptions used to determine Contribution Rates: Actuarial Cost Method Entry: Entry Age Normal Amortization Method: Level Percentage of Payroll, Closed Remaining Amortization Period: 29 years Asset Valuation Method : 10 Year smoothed market; 15% soft corridor Inflation: 2.5%
September 30, 2017 September 30, 2016 September 30, 2015
Actuarially Determined Contribution 5,155,157$ 5,048,183$ 4,595,653$
Contributions in relation to the actuarially determined contribution 5,155,157 5,048,183 4,595,653 Contribution deficiency (excess) - - -
Covered Payroll 35,161,865$ 35,121,057$ 30,976,471$
Contribtions as a Percentage of Covered Employee Payroll 14.66% 14.37% 14.84%
Note: GASB 68 requires 10 years of data to be provided in this schedule. As of September 30, 2017, only 3 years are included and additional years
will be added as the information becomes available.
Schedule of ContributionsLast 10 Years (will ultimately be displayed)
Governmental Activities
Business-type Activities Total Component Unit
Total Deferred Outflows and
Inflows
Deferred Outflows:Deferred pension contributions 2,855,536$ 1,021,472$ 3,877,008$ 42,480$ 3,919,488$ Deferred investment losses 3,567,409 1,291,269 4,858,678 58,935 4,917,613 Deferred actuarial experience 1,334,760 477,572 1,812,332 20,047 1,832,379 Deferred loss on refunding 3,266,180 3,213,483 6,479,663 175,944 6,655,607
11,023,885$ 6,003,796$ 17,027,681$ 297,406$ 17,325,087$
Deferred Inflows:Deferred loss on refunding - (17,456) (17,456) - (17,456) Deferred assumption changes (341,202) (124,183) (465,385) (5,519) (470,904) Deferred rent (1,500,000) - (1,500,000) - (1,500,000)
(1,841,202)$ (141,639)$ (1,982,841)$ (5,519)$ (1,988,360)$
Deferred Outflows and Inflows of Resources
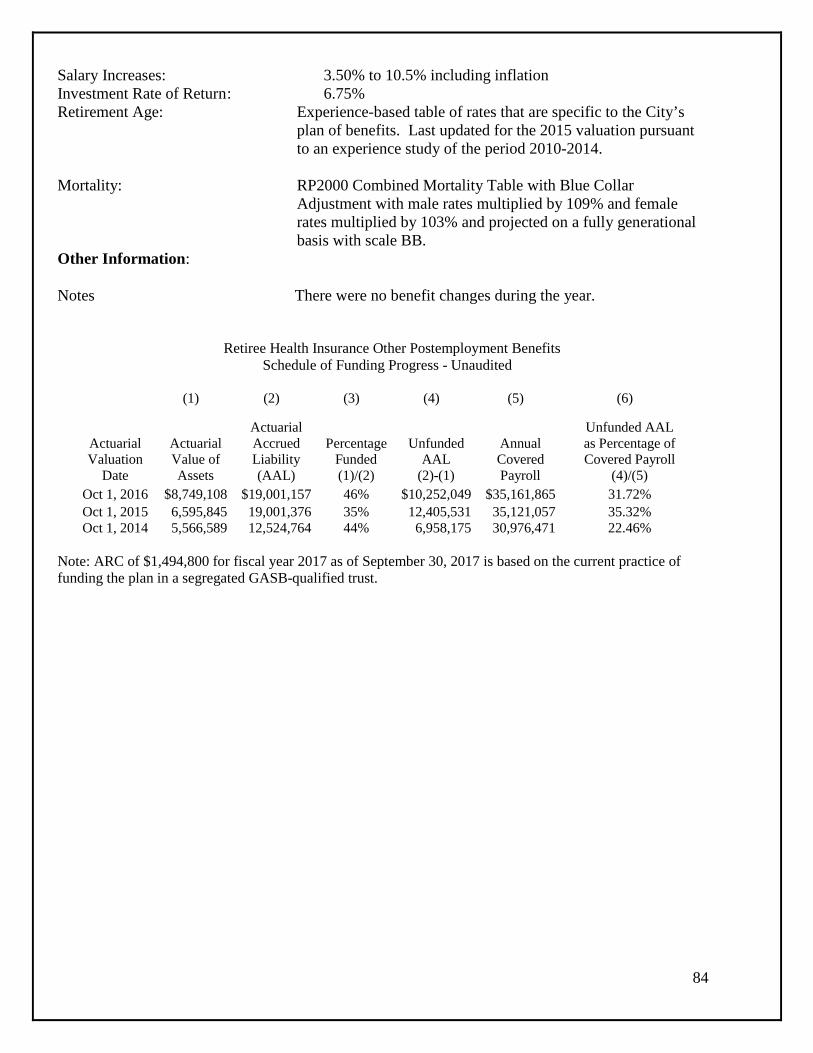
84
Salary Increases: 3.50% to 10.5% including inflation Investment Rate of Return : 6.75% Retirement Age: Experience-based table of rates that are specific to the City’s
plan of benefits. Last updated for the 2015 valuation pursuant to an experience study of the period 2010-2014.
Mortality: RP2000 Combined Mortality Table with Blue Collar
Adjustment with male rates multiplied by 109% and female rates multiplied by 103% and projected on a fully generational basis with scale BB.
Other Information: Notes There were no benefit changes during the year.
Retiree Health Insurance Other Postemployment Benefits Schedule of Funding Progress - Unaudited
(1) (2) (3) (4) (5) (6)
Actuarial Valuation
Date
Actuarial Value of Assets
Actuarial Accrued Liability (AAL)
Percentage Funded (1)/(2)
Unfunded AAL
(2)-(1)
Annual Covered Payroll
Unfunded AAL as Percentage of Covered Payroll
(4)/(5) Oct 1, 2016 $8,749,108 $19,001,157 46% $10,252,049 $35,161,865 31.72% Oct 1, 2015 6,595,845 19,001,376 35% 12,405,531 35,121,057 35.32% Oct 1, 2014 5,566,589 12,524,764 44% 6,958,175 30,976,471 22.46%
Note: ARC of $1,494,800 for fiscal year 2017 as of September 30, 2017 is based on the current practice of funding the plan in a segregated GASB-qualified trust.

85
Variance withFinal Budget -
PositiveOriginal Final Actual Amounts (Negative)
REVENUESTaxes: Property 27,605,908$ 27,605,908$ 26,950,057$ (655,851)$ Sales 10,409,957 10,409,957 10,800,106 390,149 Franchise 3,867,598 3,867,598 3,639,663 (227,935) Mixed drink 180,031 180,031 188,624 8,593 Licenses and permits 1,473,181 1,473,181 1,759,695 286,514 Charges for services 4,157,958 4,157,958 4,764,006 606,048 Fines 2,286,617 2,286,617 1,840,769 (445,848) Interest earnings 8,000 8,000 88,435 80,435 Intergovernmental - - 632,317 632,317 Miscellaneous 1,011,029 1,011,029 950,805 (60,224) Total revenues 51,000,279 51,000,279 51,614,477 614,198
EXPENDITURESCurrent: General Government: 11,807,952 11,807,952 11,952,386 (144,434) Public safety 29,479,132 29,479,132 30,308,335 (829,203) Public works 4,541,657 4,541,657 4,244,277 297,380 Culture and recreation 4,536,781 4,536,781 4,291,402 245,379 Capital outlay: Land - - 409,408 (409,408) Improvements other than buildings - - 120,347 (120,347) Equipment - - 109,487 (109,487) Total expenditures 50,365,522 50,365,522 51,435,642 (1,070,120) Excess of expenditures over revenues 634,757 634,757 178,835 (455,922)
OTHER FINANCING SOURCES (USES)Transfers in 1,208,513 1,208,513 1,562,352 353,839 Transfers out (1,843,270) (1,843,270) (372,496) 1,470,774 Sale of city property - - 30,359 30,359 Total other financing sources and uses (634,757) (634,757) 1,220,215 1,854,972 Net change in fund balances - - 1,399,050 1,399,050 Fund balances - beginning 13,076,981 13,076,981 13,076,981 - Fund balances - ending 13,076,981$ 13,076,981$ 14,476,031$ 1,399,050$
See accompanying notes to required supplementary information.
Budgeted Amounts
Required Supplementary Information - Unaudited
City of Mansfield, TexasGeneral Fund
Schedule of Revenues, Expenditures, and Changes in Fund Balances - Budget and ActualFor the Year Ended September 30, 2017

86
CITY OF MANSFIELD, TEXAS
NOTE TO REQUIRED SUPPLEMENTARY INFORMATION
SEPTEMBER 30, 2017
Stewardship, compliance, and accountability
Budgetary information As set forth in the City Charter, the City Council adopts an annual budget prepared in accordance with GAAP. The City Manager may transfer part or all of any unencumbered appropriation balance among programs within a specific fund; however, any revisions that alter the total expenditures of the fund must be approved by the City Council. The City, for management purposes, adopts budgets for all funds except Special Revenue, Trust and Agency, and Capital Projects, which the use of these funds is legally restricted for a designated purpose. Legal budgets are adopted for the General Fund and the Debt Service Funds; the legal level of control is the fund level.
The City is prohibited from deficit spending as defined by the City’s Charter. The City’s General Fund balance as of September 30, 2017 is $14,476,031. The Capital Projects are funded through the issuance of general obligation debt authorized for a specific purpose. Trust Funds are restricted by legal authorization, which created the trust. Agency Funds are used to account for assets held for other funds, governments, or individuals and are custodial in nature.
All unused appropriations, except appropriations for capital expenditures, lapse at the close of the fiscal year to the extent they have not been expended or encumbered. An appropriation for a capital expenditure shall continue in force until the purpose for which it was made has been accomplished or abandoned; the purpose of any such appropriation shall be deemed abandoned if three (3) years pass without any disbursement from or encumbrance of the appropriation. Revenues in the general fund were more than budget by $614,198 and expenditures were more than budget by $1,070,120, which was offset by other financing sources (uses), which were more than budget by $1,854,972.

87
Supplementary Information
Non-major Governmental Funds
Special Revenue Fund
Mansfield Parks Facility Development Corporation – This fund is used to account for the half-cent sales tax, approved by the voters, for parks land acquisition.
Other Special Revenue Funds
Special Revenue Funds are used to account for specific revenues that are legally restricted to be expended for particular purposes. The following funds are combined into a single column for reporting purposes.
• Grants Fund – This fund is used to account for contributions or gifts of cash or other assets from another government to be used or expended for a specific purpose, activity, or facility.
• COPS Grant Fund – This fund is used to account for the purchase of equipment used to reduce crime and improve public safety.
• Police Fund – This fund is used to account for contributions or drug forfeitures that are restricted to expenditure for police drug enforcement or the operations of the specific activity receiving the donation.
• Mansfield Municipal Court Fund – This fund is used to account for revenues that are restricted to promote child safety awareness in the community and to provide a safe and secure courtroom environment for all court participants.
• Hotel/Motel Tax Fund – This fund is used to account for Hotel/Motel tax revenues that are restricted to expenditure for the promotion of tourism, historical preservation, and the performing arts in the City.
• Tree Mitigation Fund – This fund is used to account for revenues that are restricted to expenditure for the preservation of trees and tree replacement in the City.
• Library Fund – This fund is used to account for contributions or gifts from individuals to be used or expended for Library operations, primarily for the purchase of books.
• Animal Control – This fund is used to account for contributions to be used for special medical needs and spaying/neutering assistance for adoptable animals.
Debt Service Fund
Mansfield Parks Facility Development Corporation Debt Service – This fund is used to account for the principal and interest payments on the MPFDC outstanding bonds.
Capital Projects Funds
Equipment Replacement Fund – This fund is used to account for the acquisition of vehicles, machinery, and equipment for use by City departments.
Parks Construction Fund – This fund is used to account for the construction of new parks within the City.
TIRZ #2 Fund – This fund is used to account for the revitalization of the City’s Historic Downtown.

88
DebtService
Mansfield Other TotalParks Facility Special NonmajorDevelopment Revenue MPFDC TIRZ Equipment Parks GovernmentalCorporation Funds Total Debt Service #2 Replacement Construction Total Funds
ASSETSCash, cash equivalents and investments 7,906,503$ 1,337,871$ 9,244,374$ 424,067$ 66,394$ 115,290$ 2,269,777$ 2,451,461$ 12,119,902$ Accounts receivable, net 745,173 182,007 927,180 - - - - - 927,180 Total assets 8,651,676$ 1,519,878$ 10,171,554$ 424,067$ 66,394$ 115,290$ 2,269,777$ 2,451,461$ 13,047,082$
LIABILITIESAccounts payable 777,413$ 62,433$ 839,846$ -$ -$ -$ 99,143$ 99,143$ 938,989$ Due to other funds - - - - 180,000 - - 180,000 180,000 Accrued liabilities 622,750 2,599 625,349 - - - - - 625,349 Retainage payable - - - - - - 59,077 59,077 59,077 Unearned revenue 1,829,610 - 1,829,610 - - - - - 1,829,610 Total liabilities 3,229,773 65,032 3,294,805 - 180,000 - 158,220 338,220 3,633,025
FUND BALANCES Restricted 2,586,825 23,121 2,609,946 424,067 (113,606) 115,290 2,111,557 2,113,241 5,147,254 Committed 2,835,078 1,250,545 4,085,623 - - - - - 4,085,623 Assigned - 181,180 181,180 - - - - - 181,180 Total fund balances 5,421,903 1,454,846 6,876,749 424,067 (113,606) 115,290 2,111,557 2,113,241 9,414,057
Total liabilities and fund balances 8,651,676$ 1,519,878$ 10,171,554$ 424,067$ 66,394$ 115,290$ 2,269,777$ 2,451,461$ 13,047,082$
Revenue Projects
City of Mansfield, TexasCombining Balance Sheet
Nonmajor Governmental FundsAs of September 30, 2017
Special Capital

89
Debt Service
Mansfie ld O ther TotalParks Facility Special NonmajorDevelopment Revenue MPFDC TIRZ Equipment Parks GovernmentalCorporation Funds Total Debt Service #2 Replacement Construction Total Funds
REVENUETaxes 3,355,694$ 754,665$ 4,110,359$ 2,044,358$ 62,732$ -$ -$ 62,732$ 6,217,449$ Impact fees 411,250 - 411,250 - - - - - 411,250 Gas royalty 215,043 - 215,043 - - - - - 215,043 Charges for services 1,008,433 - 1,008,433 - - - - - 1,008,433 Fines and forfeitures - 131,715 131,715 - - - - - 131,715 Investment earnings 47,238 4,161 51,399 - - 68 - 68 51,467 Intergovernmental 16,061 - 16,061 - - - - - 16,061 Contribution & donations 25,893 18,146 44,039 - - - - - 44,039 Miscellaneous 151,970 1,247 153,217 12,946 - - 2,346 2,346 168,509 Total revenues 5,231,582 909,934 6,141,516 2,057,304 62,732 68 2,346 65,146 8,263,966 EXPENDITURESCurrent: General government - 843,621 843,621 - 180,000 - 180,000 1,023,621 Culture and recreation 3,817,158 - 3,817,158 - - - - - 3,817,158 Public safety - 182,664 182,664 - - 113,444 - 113,444 296,108 Debt service: Principal retirement - - - 1,035,000 - - - - 1,035,000 Interest - - - 1,124,260 - 27 - 27 1,124,287 Fiscal charges 3,800 - 3,800 Bond issuance cost - - - 11,795 - 10,085 - 10,085 21,880 Capital outlay: Land 186,426 - 186,426 - - - - - 186,426 Buildings 159,107 525,189 684,296 - - - 6,224,595 6,224,595 6,908,891 Improvements (not buildings) 84,347 - 84,347 - - - - - 84,347 Equipment 90,568 26,365 116,933 - - 989,773 30,988 1,020,761 1,137,694 Parks 3,723,887 - 3,723,887 - - - - 3,723,887 Total expenditures 8,061,493 1,577,839 9,639,332 2,174,855 180,000 1,113,329 6,255,583 7,548,912 19,363,099 Excess (deficiency) of revenues over (under) expenditures (2,829,911) (667,905) (3,497,816) (117,551) (117,268) (1,113,261) (6,253,237) (7,483,766) (11,099,133) O THER FINANCING SO URCES (USES)Transfers in: Parks Construction 360,740 - 360,740 - - - - - 360,740 MPFDC 900,000 900,000 900,000 General Fund 372,496 - 372,496 - - - - - 372,496 T ransfers out: MPFDC - - - - - - (360,740) (360,740) (360,740) Parks Construction (900,000) - (900,000) - - - - - (900,000) Sale of city property 6,845 1,323 8,168 - - 16,512 - 16,512 24,680 Bonds issued - - - 218,089 - 1,119,038 - 1,119,038 1,337,127 Premiums on bonds issued - - - - - 41,073 - 41,073 41,073 Total other financing sources (159,919) 1,323 (158,596) 218,089 - 1,176,623 539,260 1,715,883 1,775,376 Net change in fund balances (2,989,830) (666,582) (3,656,412) 100,538 (117,268) 63,362 (5,713,977) (5,767,883) (9,323,757) Fund balances beginning 8,411,733 2,121,428 10,533,161 323,529 3,662 51,928 7,825,534 7,881,124 18,737,814 Fund balances ending 5,421,903$ 1,454,846$ 6,876,749$ 424,067$ (113,606)$ 115,290$ 2,111,557$ 2,113,241$ 9,414,057
Revenue Projects
City of Mansfie ld, TexasCombining Statement of Revenues, Expenditures, and Changes in Fund Balances
Nonmajor Governmental FundsFor the Year Ended September 30, 2017
Special Capital

90
Variance withFinal Budget
PositiveOriginal Final Actual Amounts (Negative)
REVENUESProperty taxes 13,349,613$ 13,349,613$ 13,962,963$ 613,350$ Investment earnings - - 2,736 2,736 Miscellaneous - - 17,993 17,993 Total revenues 13,349,613 13,349,613 13,983,692 634,079
EXPENDITURESDebt service: Principal 8,820,000 8,820,000 8,820,000 - Interest 4,529,613 4,529,613 4,993,351 (463,738) Fiscal charges - - 18,328 (18,328) Issuance Costs - - 12,460 (12,460) Total expenditures 13,349,613 13,349,613 13,844,139 (494,526) Excess (deficiency) of revenues over (under) expenditures - - 139,553 139,553
Net changes in fund balance - - 139,553 139,553
Fund balances beginning 483,024 483,024 483,024 - Fund balances ending 483,024$ 483,024$ 622,577$ 139,553$
Budgeted Amounts
City of Mansfield, TexasSchedule of Revenues, Expenditures, and Changes in Fund Balances Budget and Actual
Debt Service FundFor the Year Ended September 30, 2017
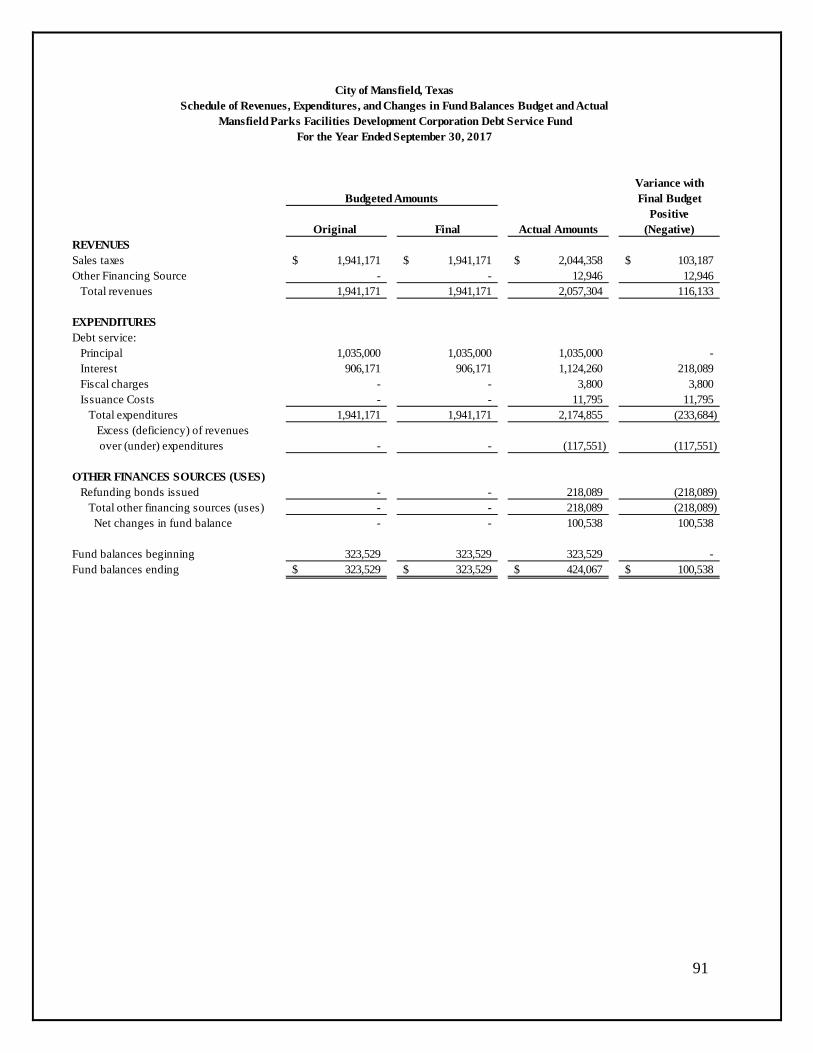
91
Variance withFinal Budget
PositiveOriginal Final Actual Amounts (Negative)
REVENUESSales taxes 1,941,171$ 1,941,171$ 2,044,358$ 103,187$ Other Financing Source - - 12,946 12,946 Total revenues 1,941,171 1,941,171 2,057,304 116,133
EXPENDITURESDebt service: Principal 1,035,000 1,035,000 1,035,000 - Interest 906,171 906,171 1,124,260 218,089 Fiscal charges - - 3,800 3,800 Issuance Costs - - 11,795 11,795 Total expenditures 1,941,171 1,941,171 2,174,855 (233,684) Excess (deficiency) of revenues over (under) expenditures - - (117,551) (117,551)
OTHER FINANCES SOURCES (USES) Refunding bonds issued - - 218,089 (218,089) Total other financing sources (uses) - - 218,089 (218,089) Net changes in fund balance - - 100,538 100,538
Fund balances beginning 323,529 323,529 323,529 - Fund balances ending 323,529$ 323,529$ 424,067$ 100,538$
Budgeted Amounts
City of Mansfield, TexasSchedule of Revenues, Expenditures, and Changes in Fund Balances Budget and Actual
Mansfield Parks Facilities Development Corporation Debt Service FundFor the Year Ended September 30, 2017
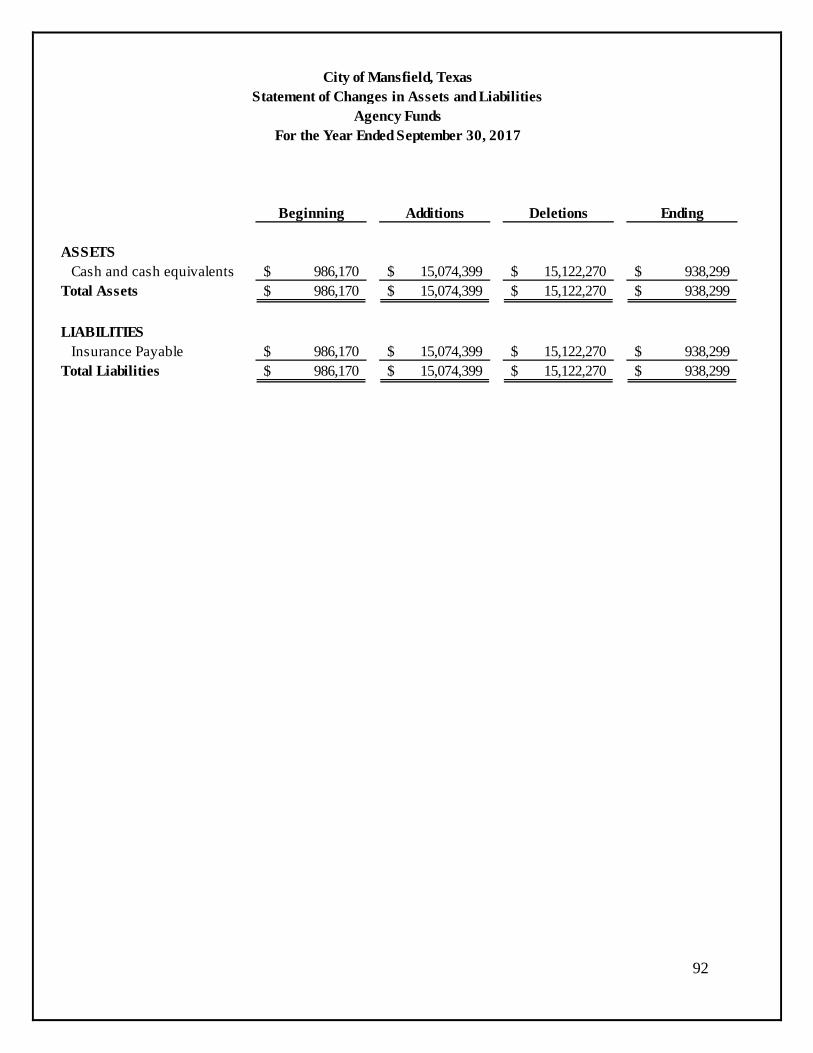
92
Beginning Additions Deletions Ending
ASSETS Cash and cash equivalents 986,170$ 15,074,399$ 15,122,270$ 938,299$ Total Assets 986,170$ 15,074,399$ 15,122,270$ 938,299$
LIABILITIES Insurance Payable 986,170$ 15,074,399$ 15,122,270$ 938,299$ Total Liabilities 986,170$ 15,074,399$ 15,122,270$ 938,299$
City of Mansfield, TexasStatement of Changes in Assets and Liabilities
Agency FundsFor the Year Ended September 30, 2017

93
Governmental funds capital assets: Land 100,908,564$ Buildings 84,738,073 Other Improvements 21,019,625 Vehicles, Machinery, and Equipment 26,326,943 Infrastructure 356,658,071 Construction In Progress 40,040,095 Total Capital Assets 629,691,371$
Investments in governmental funds capital assets by source: General Obligation Bonds 285,644,294$ Intergovernmental Revenues 4,020,240 Current Revenue 16,733,374 Special Revenues 12,306,498 Developer Revenue 6,123,005 Contributions 304,863,960 Total Investment In Capital Assets 629,691,371$
City of Mansfield, TexasCapital Assets Used in the Operation of Governmental Funds
Comparative Schedules By SourceSeptember 30, 2017

94
Improvements Machinery ConstructionOther Than and in
Land Buildings Buildings Equipment Infrastructure Progress Total
General government: Administration 136,565$ 136,565$ City secretary/legal 118,509 118,509 Personnel 55,334 55,334 Finance 9,679 9,679 Accounting/budget/purchasing 22,395 22,395 Tax assessing 12,806 12,806 Information services 1,035,219 1,035,219 Planning and development 147,227 147,227 Engineering 85,331 85,331 Code enforcement 135,672 135,672 Building inspection 50,073 50,073 General government buildings 14,632,111 62,556,394 240,167 404,644 8,000 77,841,316 Total general government 14,632,111 62,556,394 240,167 2,213,454 - 8,000 79,650,126
Public safety: Police 3,549,920 46,159 10,063,892 13,659,971 Fire 887,589 8,851 8,541,530 9,437,970 Municipal court 282,234 227,873 510,107 Animal control 987,426 83,291 149,488 1,220,205 Total public safety 282,234 5,424,935 138,301 18,982,783 - - 24,828,253
Culture and recreation Parks and recreation 3,420,701 16,756,744 20,455,442 1,711,202 17,938,190 60,282,279 Senior citizens 3,000 129,677 132,677 Library 410,001 169,639 888,512 1,468,152 Land maintenance 195,166 195,166 Building maintenance 13,076 145,926 159,002 Total culture and recreation 3,830,702 16,756,744 20,641,157 3,070,483 - 17,938,190 62,237,276
Public works: Streets 82,163,517 2,060,223 356,658,071 22,093,905 462,975,716 Total public works 82,163,517 - - 2,060,223 356,658,071 22,093,905 462,975,716
Total governmental funds capital assets 100,908,564$ 84,738,073$ 21,019,625$ 26,326,943$ 356,658,071$ 40,040,095$ 629,691,371$
City of Mansfield, TexasCapital Assets Used in the Operation of Governmental Funds
Schedule By Function and ActivitySeptember 30, 2017

95
Governmental GovernmentalFunds Capital Funds Capital
Assets, Assets,Function and Activity September 30, 2016 Additions Deductions September 30, 2017
General government Administration 630,260$ 11,188$ 641,448$ City secretary/legal 118,509 118,509 Personnel 55,334 55,334 Finance 9,679 9,679 Accounting/budget/purchasing 22,395 22,395 Tax assessing 12,806 12,806 Information services 1,011,219 24,000 1,035,219 Planning and development 154,227 154,227 Engineering 85,331 85,331 Code enforcement 135,672 135,672 Building inspection 50,073 50,073 General government buildings 28,242,647 1,069,143 29,311,790 Total general government 30,528,152 1,104,331 - 31,632,483
Public safety: Police 13,149,061 586,904 476,057 13,259,908 Fire 16,521,554 448,126 16,969,680 Municipal court 227,873 227,873 Animal control 1,622,588 35,274 1,657,862 Total public safety 31,521,076 1,070,304 476,057 32,115,323
Culture and recreation Parks and recreation 75,383,216 22,612,000 54,423 97,940,793 Senior citizens 132,677 132,677 Library 4,088,665 9,265 4,097,930 Land maintenance 247,527 247,527 Building maintenance 810,454 810,454 Total culture and recreation 80,662,539 22,621,265 54,423 103,229,381
Public works: Streets 444,632,067 18,082,117 462,714,184 Total public works 444,632,067 18,082,117 - 462,714,184
Total governmental funds capital assets 587,343,834$ 42,878,017$ 530,480$ 629,691,371$
City of Mansfield, TexasCapital Assets Used in the Operation of Governmental Funds
Schedule of Changes By Function And ActivityFor the fiscal year ended September 30, 2017

96
MANSFIELD ECONOMIC DEVELOPMENT CORPORATION
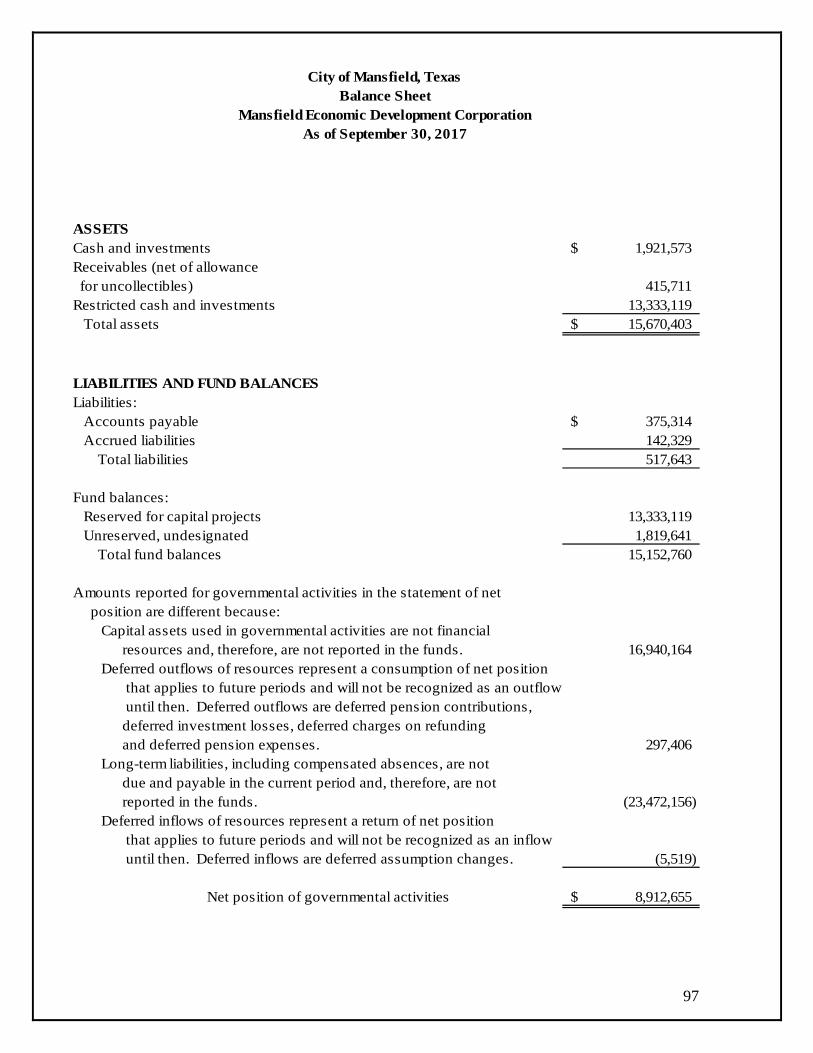
97
ASSETSCash and investments 1,921,573$ Receivables (net of allowance for uncollectibles) 415,711 Restricted cash and investments 13,333,119 Total assets 15,670,403$
LIABILITIES AND FUND BALANCESLiabilities: Accounts payable 375,314$ Accrued liabilities 142,329 Total liabilities 517,643
Fund balances: Reserved for capital projects 13,333,119 Unreserved, undesignated 1,819,641 Total fund balances 15,152,760
Amounts reported for governmental activities in the statement of net position are different because: Capital assets used in governmental activities are not financial resources and, therefore, are not reported in the funds. 16,940,164 Deferred outflows of resources represent a consumption of net position that applies to future periods and will not be recognized as an outflow until then. Deferred outflows are deferred pension contributions, deferred investment losses, deferred charges on refunding and deferred pension expenses. 297,406 Long-term liabilities, including compensated absences, are not due and payable in the current period and, therefore, are not reported in the funds. (23,472,156) Deferred inflows of resources represent a return of net position that applies to future periods and will not be recognized as an inflow until then. Deferred inflows are deferred assumption changes. (5,519)
Net position of governmental activities 8,912,655$
City of Mansfield, TexasBalance Sheet
Mansfield Economic Development CorporationAs of September 30, 2017

98
REVENUESSales taxes 5,400,053$ Interest 53,019 Miscellaneous 74,947 Total revenues 5,528,019
EXPENDITURESCurrent: Administration 975,226 Projects 5,044,040 Debt service: Principal 1,555,000 Interest 643,573 Bond issuance cost 191,770 Capital outlay: Land 5,106,793 Total expenditures 13,516,402 Excess (deficiency) of revenues over (under) expenditures (7,988,383)
OTHER FINANCING SOURCES (USES)Bonds issued 14,125,000 Premium on bonds issued 1,141,332 Discount on bonds issued (84,063) Transfers out (238,450) Total other financing sources (uses) 14,943,819 Net change in fund balance 6,955,436 Fund balance beginning 8,197,324 Fund balance ending 15,152,760$
City of Mansfield, TexasStatement of Revenues, Expenditures, and Changes in Fund Balances
Mansfield Economic Development CorporationSeptember 30, 2017
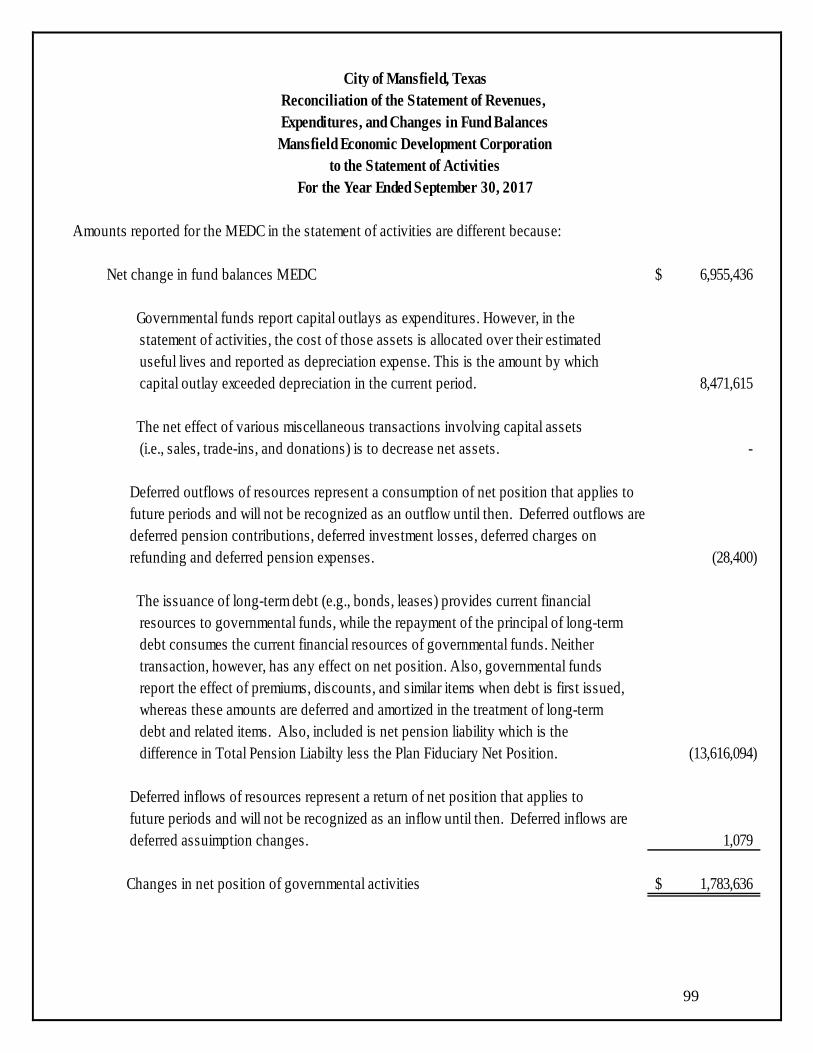
99
Amounts reported for the MEDC in the statement of activities are different because:
Net change in fund balances MEDC 6,955,436$
Governmental funds report capital outlays as expenditures. However, in the statement of activities, the cost of those assets is allocated over their estimated useful lives and reported as depreciation expense. This is the amount by which capital outlay exceeded depreciation in the current period. 8,471,615
The net effect of various miscellaneous transactions involving capital assets (i.e., sales, trade-ins, and donations) is to decrease net assets. -
Deferred outflows of resources represent a consumption of net position that applies tofuture periods and will not be recognized as an outflow until then. Deferred outflows aredeferred pension contributions, deferred investment losses, deferred charges on refunding and deferred pension expenses. (28,400)
The issuance of long-term debt (e.g., bonds, leases) provides current financial resources to governmental funds, while the repayment of the principal of long-term debt consumes the current financial resources of governmental funds. Neither transaction, however, has any effect on net position. Also, governmental funds report the effect of premiums, discounts, and similar items when debt is first issued, whereas these amounts are deferred and amortized in the treatment of long-term debt and related items. Also, included is net pension liability which is the difference in Total Pension Liabilty less the Plan Fiduciary Net Position. (13,616,094)
Deferred inflows of resources represent a return of net position that applies tofuture periods and will not be recognized as an inflow until then. Deferred inflows aredeferred assuimption changes. 1,079
Changes in net position of governmental activities 1,783,636$
For the Year Ended September 30, 2017
City of Mansfield, TexasReconciliation of the Statement of Revenues, Expenditures, and Changes in Fund BalancesMansfield Economic Development Corporation
to the Statement of Activities

100
CITY OF MANSFIELD, TEXAS
STATISTICAL SECTION
SEPTEMBER 30, 2017
The statistical section of the City’s comprehensive annual financial report presents detailed information as a context for understanding what the information presented in the financial statements, note disclosures, and required supplementary information says about the City’s overall financial health. Contents Financial Trends Page 101– 107 These schedules contain trend information to help the reader understand how the government’s financial performance and well-being have changed over time. Revenue Capacity Page 108 – 111 These schedules contain information to help the reader assess the factors affecting the City’s ability to generate its property and sales tax revenues. Capacity Page 112 – 116 These schedules present information to help the reader assess the affordability of the City’s current level of outstanding debt and the City’s ability to issue additional debt in the future. Demographic and Economic Information Page 117 – 118 These schedules offer demographic and economic indicators to help the reader understand the environment within the City’s financial activities take place. Operating Information Page 119 – 121 These schedules contain service and infrastructure data to help the reader understand how the information in the City’s financial report relates to the services that the City provides and the activities it performs.

101
2008 2009 2010 2011 2012 2013 2014 2015 2016 2017Governmental activities: Net investment in capital assets 226,079$ 226,416$ 224,555$ 225,083$ 225,017$ 211,270$ 210,130$ 221,995$ 230,900$ 238,473$ Restricted 1,815 721 1,037 619 490 15,520 29,294 33,782 36,146 32,960 Unrestricted 4,064 6,806 7,269 7,953 9,275 7,967 8,589 1,555 1,906 1,405 Total governmental activities net position 231,958$ 233,943$ 232,861$ 233,655$ 234,782$ 234,757$ 248,013$ 257,332$ 268,952$ 272,838$
Business-type activities: Net investment in capital assets 103,077$ 107,442$ 111,276$ 112,164$ 115,837$ 105,677$ 119,190$ 132,273$ 135,623$ 144,313$ Restricted 3,792 4,280 4,246 4,331 4,320 18,108 12,548 12,817 16,516 12,842 Unrestricted 7,996 9,049 10,625 17,657 20,683 24,992 21,833 13,375 18,249 23,136 Total business-type activities net position 114,865$ 120,771$ 126,147$ 134,152$ 140,840$ 148,777$ 153,571$ 158,465$ 170,388$ 180,291$
Primary government: Net investment in capital assets 329,156$ 333,858$ 335,831$ 337,247$ 340,854$ 316,947$ 329,320$ 354,268$ 366,523$ 382,786$ Restricted 5,607 5,001 5,283 4,950 4,810 33,628 41,842 46,599 52,662 45,802 Unrestricted 12,060 15,855 17,894 25,610 29,958 32,959 30,422 14,930 20,155 24,541 Total primary government net position 346,823$ 354,714$ 359,008$ 367,807$ 375,622$ 383,534$ 401,584$ 415,797$ 439,340$ 453,129$
City of Mansfield, TexasNet Position by Component
Last Ten Fiscal Years(accrual basis of accounting)
(amounts expressed in thousands)

102
2008 2009 2010 2011 2012 2013 2014 2015 2016 2017ExpensesGovernmental activities: General government 9,630$ 6,574$ 6,142$ 6,196$ 6,686$ 8,397$ 10,759$ 11,647$ 11,753$ 14,433$ Public safety 18,513 20,227 20,515 21,539 22,640 24,725 26,458 28,058 30,909 31,997 Public works 12,303 15,054 14,027 14,579 15,115 14,852 13,682 13,765 15,017 15,237 Culture and recreation 6,628 7,898 8,195 7,762 8,488 8,281 8,529 8,268 9,500 10,348 Interest on long-term debt 5,176 5,424 5,318 5,138 4,461 4,317 4,505 4,844 5,345 6,345 Total governmental activities expenses 52,250$ 55,177$ 54,197$ 55,214$ 57,390$ 60,572$ 63,933$ 66,582$ 72,524$ 78,360$ Business-type activities: Water 11,140 12,019 11,567 13,112 14,441 15,838 17,308 17,431 18,394 19,714 Sewer 3,360 3,950 4,216 5,246 6,112 4,913 5,730 6,120 6,915 6,935 Law enforcement center 7,484 8,241 8,018 8,373 8,712 9,836 10,070 10,357 10,882 11,886 Drainage 846 941 870 863 752 1,103 1,371 1,150 1,155 1,210 Total business-type activities expenses 22,830 25,151 24,671 27,594 30,017 31,690 34,479 35,058 37,346 39,745 Total primary government expenses 75,080$ 80,328$ 78,868$ 82,808$ 87,407$ 92,262$ 98,412$ 101,640$ 109,870$ 118,105$
Program revenuesGovernmental activities: Charges for services: General government 4,819$ 4,593$ 3,659$ 4,263$ 4,627$ 4,993$ 4,712$ 5,104$ 5,681$ 5,485$ Public safety 1,317 1,593 1,747 2,325 2,394 2,789 3,278 3,606 3,325 3,547 Public works 1,529 974 708 1,061 1,610 2,216 4,369 3,216 3,051 2,792 Culture and recreation 1,619 939 844 779 1,188 1,552 1,935 2,318 2,030 1,938 Operating grants and contributions 653 432 613 365 442 187 348 557 767 744 Capital grants and contributions 4,066 3,495 771 1,125 539 245 11,962 13,380 8,236 3,358 Total governmental activities program revenues 14,003 12,026 8,342 9,918 10,800 11,982 26,604 28,181 23,090 17,864 Business-type activities: Charges for services: Water 14,060 15,137 14,821 18,144 17,437 19,577 18,365 20,287 22,178 23,611 Sewer 5,045 5,918 6,288 8,250 8,220 8,601 9,267 9,790 10,864 11,533 Law enforcement center 7,261 7,346 6,483 6,697 8,025 9,322 10,114 9,577 10,422 11,450 Drainage 1,075 1,209 1,203 1,352 2,079 1,302 1,310 1,310 2,289 2,494 Operating grants and contributions 126 92 - - - 505 273 452 - - Capital grants and contributions 1,140 1,910 417 549 239 532 1,701 2,221 4,161 1,648 Total business-type activities program revenues 28,707 31,612 29,212 34,992 36,000 39,839 41,030 43,637 49,914 50,736 Total primary government program revenues 42,710$ 43,638$ 37,554$ 44,910$ 46,800$ 51,821$ 67,634$ 71,818$ 73,004$ 68,600$
City of Mansfield, TexasChanges in Net Position of Governmental and Business Type Activities
Last Ten Fiscal Years(accrual basis of accounting)
(amounts expressed in thousands)
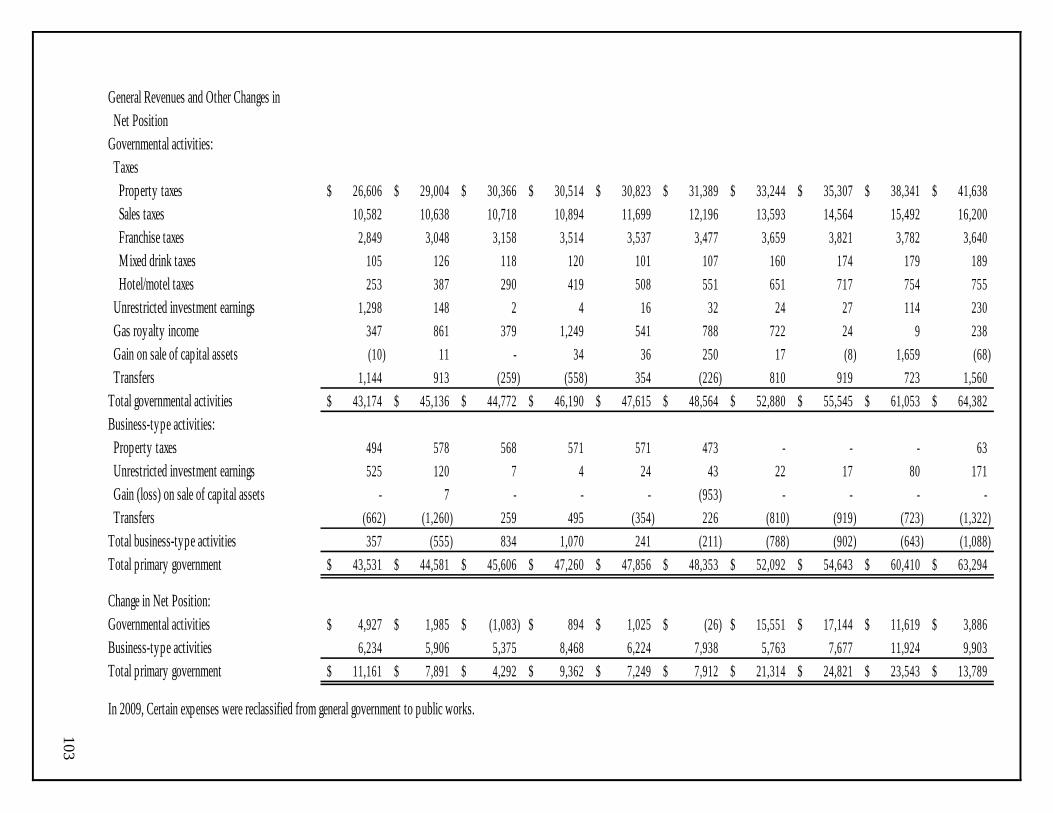
103
General Revenues and Other Changes in Net PositionGovernmental activities: Taxes Property taxes 26,606$ 29,004$ 30,366$ 30,514$ 30,823$ 31,389$ 33,244$ 35,307$ 38,341$ 41,638$ Sales taxes 10,582 10,638 10,718 10,894 11,699 12,196 13,593 14,564 15,492 16,200 Franchise taxes 2,849 3,048 3,158 3,514 3,537 3,477 3,659 3,821 3,782 3,640 Mixed drink taxes 105 126 118 120 101 107 160 174 179 189 Hotel/motel taxes 253 387 290 419 508 551 651 717 754 755 Unrestricted investment earnings 1,298 148 2 4 16 32 24 27 114 230 Gas royalty income 347 861 379 1,249 541 788 722 24 9 238 Gain on sale of capital assets (10) 11 - 34 36 250 17 (8) 1,659 (68) Transfers 1,144 913 (259) (558) 354 (226) 810 919 723 1,560 Total governmental activities 43,174$ 45,136$ 44,772$ 46,190$ 47,615$ 48,564$ 52,880$ 55,545$ 61,053$ 64,382$ Business-type activities: Property taxes 494 578 568 571 571 473 - - - 63 Unrestricted investment earnings 525 120 7 4 24 43 22 17 80 171 Gain (loss) on sale of capital assets - 7 - - - (953) - - - - Transfers (662) (1,260) 259 495 (354) 226 (810) (919) (723) (1,322) Total business-type activities 357 (555) 834 1,070 241 (211) (788) (902) (643) (1,088) Total primary government 43,531$ 44,581$ 45,606$ 47,260$ 47,856$ 48,353$ 52,092$ 54,643$ 60,410$ 63,294$
Change in Net Position:Governmental activities 4,927$ 1,985$ (1,083)$ 894$ 1,025$ (26)$ 15,551$ 17,144$ 11,619$ 3,886$ Business-type activities 6,234 5,906 5,375 8,468 6,224 7,938 5,763 7,677 11,924 9,903 Total primary government 11,161$ 7,891$ 4,292$ 9,362$ 7,249$ 7,912$ 21,314$ 24,821$ 23,543$ 13,789$
In 2009, Certain expenses were reclassified from general government to public works.

104
Fiscal Property Sales Franchise Mixed Drink Hotel/MotelYear Tax Tax Tax Tax Tax Total
2008 26,606 10,582 2,849 105 253 40,395 2009 29,004 10,638 3,048 126 387 43,203 2010 30,366 10,718 3,158 118 290 44,650 2011 30,514 10,894 3,514 120 419 45,461 2012 30,823 11,699 3,537 101 508 46,668 2013 31,389 12,196 3,477 107 551 47,720 2014 33,244 13,593 3,659 160 651 51,307 2015 35,307 14,564 3,821 174 717 54,583 2016 38,341 15,492 3,782 179 754 58,548 2017 41,700 16,200 3,640 189 755 62,484
City of Mansfield, TexasGovernmental Activities Tax Revenue By Source
Last Ten Fiscal Years(accrual basis of accounting)
(amounts expressed in thousands)

105
2008 2009 2010* 2011 2012 2013 2014 2015 2016 2017
General fund: Reserved 49$ 8$ -$ -$ -$ -$ -$ -$ 10$ -$ Unreserved 4,329 7,179 - - - - - - - Nonspendable - - 6 5 34 10 - - - Assigned - - - - 650 - - - - Unassigned - - 7,977 9,027 9,887 10,594 11,657 12,020 13,067 14,476 Total general fund 4,378$ 7,187$ 7,983$ 9,032$ 10,571$ 10,604$ 11,657$ 12,020$ 13,077$ 14,476$
All other governmental funds: Reserved 18,783$ 22,441$ -$ -$ -$ -$ -$ -$ -$ -$ Unreserved, reported in: Special revenue funds 1,857 2,315 - - - - - - - - Nonspendable - - 61 61 61 61 61 61 61 - Restricted - - 15,789 16,789 16,838 15,176 28,068 32,473 28,663 30,914 Committed - - 2,891 3,224 3,273 2,691 3,219 3,709 9,996 4,086 Assigned - - 110 124 43 51 160 165 170 181 Total all other governmental funds 20,640$ 24,756$ 18,851$ 20,198$ 20,215$ 17,979$ 31,508$ 36,408$ 38,890$ 35,181$
* City implemented GASB Statement No. 54 in Fiscal Year 2010
City of Mansfield, TexasFund Balances of Governmental Funds
Last Ten Fiscal Years(modified accrual basis of accounting)
(amounts expressed in thousands)

106
2008 2009 2010 2011 2012 2013 2014 2015 2016 2017
RevenuesTaxes 40,297$ 43,208$ 44,650$ 45,343$ 46,546$ 47,696$ 51,372$ 54,495$ 58,351$ 62,484$ Licenses and permits 1,598 1,118 1,750 2,830 2,264 1,982 1,988 2,037 2,188 1,975 Intergovernmental 517 23 350 220 387 131 302 348 688 648 Charges for services 2,150 2,750 3,075 3,165 3,723 4,594 4,769 5,058 5,178 5,772 Fines 968 1,046 1,261 1,561 1,746 2,645 2,305 2,552 2,106 1,973 Interest 1,298 148 2 4 16 32 24 27 113 230 Contributions and donations 2,153 432 777 57 54 56 6,546 209 79 44 Impact fees 2,226 1,305 971 1,509 1,267 1,777 1,935 2,291 2,164 2,495 Miscellaneous 2,582 2,717 422 327 1,365 1,299 3,728 2,294 2,420 1,487 Total revenues 53,789$ 52,747$ 53,258$ 55,016$ 57,368$ 60,212$ 72,969$ 69,311$ 73,287$ 77,108$
ExpendituresGeneral government 9,061 6,013 5,504 5,519 5,991 7,507 10,461 11,627 11,413 12,976 Public safety 17,672 19,159 19,370 20,513 21,836 23,279 25,417 27,020 29,351 30,605 Public works 2,644 5,559 4,858 4,724 5,161 4,868 3,388 3,603 4,066 4,244 Culture and recreation 5,432 6,118 6,303 6,206 6,941 6,295 6,660 6,375 7,441 8,109 Capital outlay 24,157 13,572 9,552 6,141 10,138 13,738 18,037 21,075 38,211 39,520 Debt Service: Principal 5,770 6,165 6,930 7,200 7,950 7,875 8,680 8,255 15,055 9,855 Interest 5,161 5,343 5,474 5,057 4,581 4,362 4,348 4,553 6,996 6,121 Fiscal charges - - 14 16 600 176 154 708 17 20 Bond issuance cost 414 365 2 288 415 246 256 299 744 440 Total expenditures 70,311 62,294 58,007 55,664 63,613 68,346 77,401 83,515 113,294 111,890
Excess of revenues over (under) expenditures (16,522) (9,547) (4,749) (648) (6,245) (8,134) (4,432) (14,204) (40,007) (34,782)
City of Mansfield, TexasChanges in Fund Balances of Governmental Funds
Last Ten Fiscal Years(modified accrual basis of accounting)
(amounts expressed in thousands)
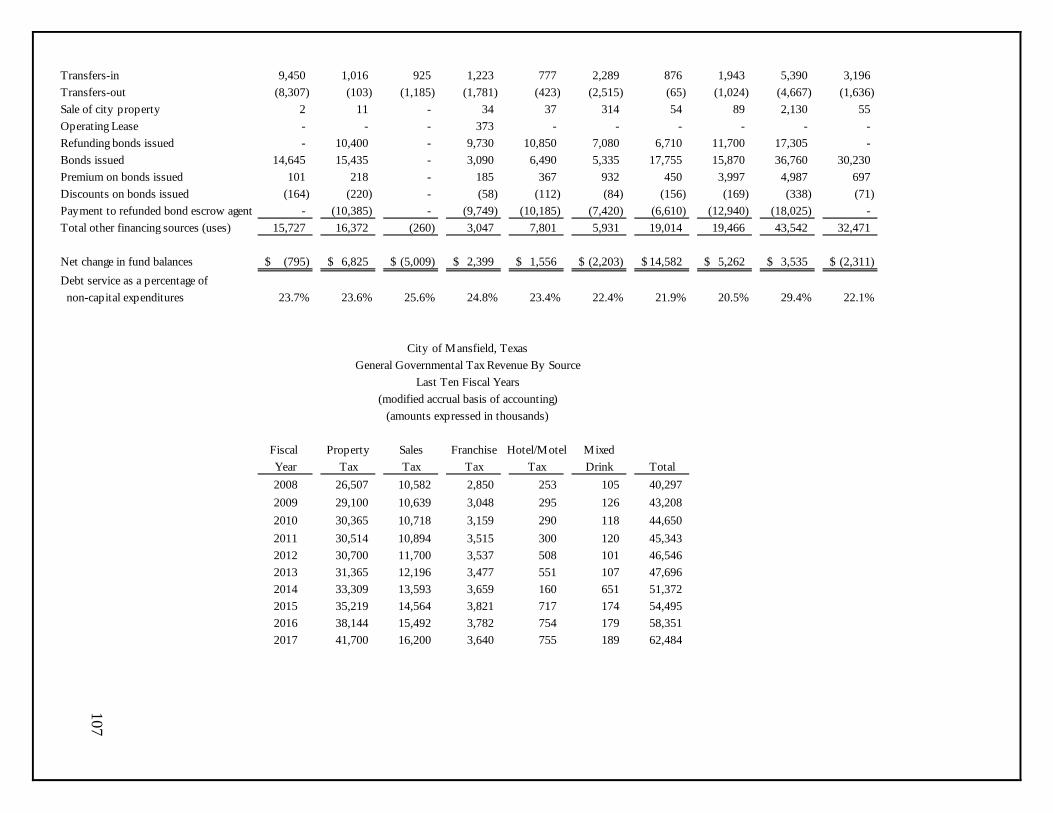
107
Transfers-in 9,450 1,016 925 1,223 777 2,289 876 1,943 5,390 3,196 Transfers-out (8,307) (103) (1,185) (1,781) (423) (2,515) (65) (1,024) (4,667) (1,636) Sale of city property 2 11 - 34 37 314 54 89 2,130 55 Operating Lease - - - 373 - - - - - - Refunding bonds issued - 10,400 - 9,730 10,850 7,080 6,710 11,700 17,305 - Bonds issued 14,645 15,435 - 3,090 6,490 5,335 17,755 15,870 36,760 30,230 Premium on bonds issued 101 218 - 185 367 932 450 3,997 4,987 697 Discounts on bonds issued (164) (220) - (58) (112) (84) (156) (169) (338) (71) Payment to refunded bond escrow agent - (10,385) - (9,749) (10,185) (7,420) (6,610) (12,940) (18,025) - Total other financing sources (uses) 15,727 16,372 (260) 3,047 7,801 5,931 19,014 19,466 43,542 32,471
Net change in fund balances (795)$ 6,825$ (5,009)$ 2,399$ 1,556$ (2,203)$ 14,582$ 5,262$ 3,535$ (2,311)$ Debt service as a percentage of non-capital expenditures 23.7% 23.6% 25.6% 24.8% 23.4% 22.4% 21.9% 20.5% 29.4% 22.1%
Fiscal Property Sales Franchise Hotel/Motel MixedYear Tax Tax Tax Tax Drink Total2008 26,507 10,582 2,850 253 105 40,297 2009 29,100 10,639 3,048 295 126 43,208 2010 30,365 10,718 3,159 290 118 44,650 2011 30,514 10,894 3,515 300 120 45,343 2012 30,700 11,700 3,537 508 101 46,546 2013 31,365 12,196 3,477 551 107 47,696 2014 33,309 13,593 3,659 160 651 51,372 2015 35,219 14,564 3,821 717 174 54,495 2016 38,144 15,492 3,782 754 179 58,351 2017 41,700 16,200 3,640 755 189 62,484
General Governmental Tax Revenue By SourceLast Ten Fiscal Years
(modified accrual basis of accounting)(amounts expressed in thousands)
City of Mansfield, Texas

108
Fiscal TotalYear Less: Total Taxable Direct
Ended Real Personal Tax-Exempt Assessed TaxSeptember 30 Property Property Property Value Rate
2008 3,728,211,159 451,982,835 349,439,672 3,830,754,322 0.69 2009 4,085,602,544 403,228,962 390,079,518 4,098,751,988 0.712010 4,096,767,192 502,804,565 489,765,181 4,109,806,576 0.712011 3,922,110,419 500,107,757 395,212,412 4,027,005,764 0.712012 4,366,636,631 510,514,153 480,454,086 4,396,696,698 0.712013 4,404,361,995 640,695,688 555,442,336 4,489,615,347 0.712014 4,512,982,547 632,347,276 494,913,889 4,650,415,934 0.712015 4,766,391,748 733,418,283 542,289,028 4,957,521,003 0.712016 4,978,279,317 722,052,786 413,405,008 5,286,927,095 0.712017 5,386,325,190 940,503,204 413,190,727 5,913,637,667 0.71
Source: Tarrant Appraisal District, Johnson Appriasal District, and Ellis County Appraisal District
City of Mansfield, TexasAssessed Value and Estimated Actual Value of Taxable Property
Last Ten Fiscal Years(in thousands of dollars)
Estimated Market Value
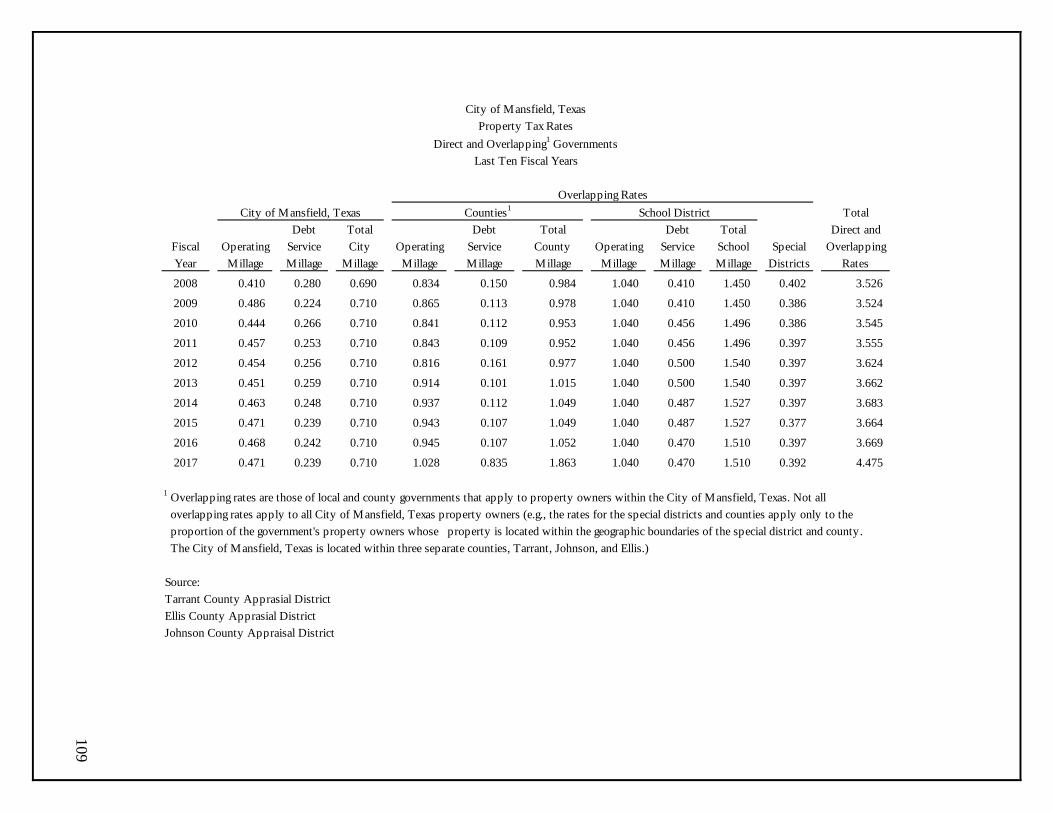
109
TotalDebt Total Debt Total Debt Total Direct and
Fiscal Operating Service City Operating Service County Operating Service School Special OverlappingYear Millage Millage Millage Millage Millage Millage Millage Millage Millage Districts Rates
2008 0.410 0.280 0.690 0.834 0.150 0.984 1.040 0.410 1.450 0.402 3.526
2009 0.486 0.224 0.710 0.865 0.113 0.978 1.040 0.410 1.450 0.386 3.524
2010 0.444 0.266 0.710 0.841 0.112 0.953 1.040 0.456 1.496 0.386 3.545
2011 0.457 0.253 0.710 0.843 0.109 0.952 1.040 0.456 1.496 0.397 3.555
2012 0.454 0.256 0.710 0.816 0.161 0.977 1.040 0.500 1.540 0.397 3.624
2013 0.451 0.259 0.710 0.914 0.101 1.015 1.040 0.500 1.540 0.397 3.662
2014 0.463 0.248 0.710 0.937 0.112 1.049 1.040 0.487 1.527 0.397 3.683
2015 0.471 0.239 0.710 0.943 0.107 1.049 1.040 0.487 1.527 0.377 3.664
2016 0.468 0.242 0.710 0.945 0.107 1.052 1.040 0.470 1.510 0.397 3.669
2017 0.471 0.239 0.710 1.028 0.835 1.863 1.040 0.470 1.510 0.392 4.475
Source: Tarrant County Apprasial District Ellis County Apprasial District Johnson County Appraisal District
1 Overlapping rates are those of local and county governments that apply to property owners within the City of Mansfield, Texas. Not all overlapping rates apply to all City of Mansfield, Texas property owners (e.g., the rates for the special districts and counties apply only to the proportion of the government's property owners whose property is located within the geographic boundaries of the special district and county. The City of Mansfield, Texas is located within three separate counties, Tarrant, Johnson, and Ellis.)
City of Mansfield, TexasProperty Tax Rates
Direct and Overlapping1 GovernmentsLast Ten Fiscal Years
Overlapping RatesCity of Mansfield, Texas Counties1 School District

110
Percentage of Percentage ofTaxable Total Taxable Taxable Total Taxable
Assessed Assessed Assessed Assessed Taxpayer Value Rank Value Value Rank ValueMouser Electronics 308,115,186$ 1 5.21%Advenir @ Mansfield LLC 68,899,035 2 1.17%Mid-America Apartments LP 62,700,000 3 1.06%Mansfield KDC III LP Etal 59,728,936 4 1.01% 26,804,466 2 0.73%Wal-Mart Stores Inc. 41,273,765 5 0.70% 26,300,137 3 0.72%Sir Mansfield Landing LLC 35,280,000 6 0.60%Oncor Electric Delivery Co 32,393,842 7 0.55% 30,076,171 1 0.82%T Villas Di Lucca TX LLC 30,200,000 8 0.51%Apartment Reit Towne Crossing 29,900,000 9 0.51% 21,600,000 6 0.59%CHP Watercrest at Mansfield 25,800,000 10 0.44%Methodist Hospitals - - 25,986,773 4 0.71%Falls at Towne Crossing - - 23,500,000 5 0.64%Pier One Imports of Texas - - 20,740,207 7 0.57%Spyglass of Mansfield Ltd. - - 20,331,105 8 0.55%Range Productions - - 17,812,800 9 0.49%Mansfield Commons Ltd. - - 17,139,509 10 0.47%Total 694,290,764$ 11.76% 230,291,168$ 6.29%
Source: Tarrant Appraisal District
City of Mansfield, TexasPrincipal Property Taxpayers
As of September 30, 2017(amounts expressed in thousands)
2017 2008

111
Fiscal Year Ended Total Tax Levy for Collections for
Total Collections to
DateAccumulated
DeliquentSeptember 30 Fiscal Year Amount Percentage of Levy Prior Years (1) Amount Taxes Percentage of Levy
2008 26,425 25,870 97.9% 435 26,305 35 99.5%2009 29,289 29,100 99.35% 420 29,520 59 100.8%2010 30,541 30,159 98.75% 421 30,580 48 100.1%2011 30,380 30,093 99.06% 452 30,545 61 100.5%2012 31,049 30,709 98.90% 289 30,998 69 99.8%2013 31,578 31,353 99.29% 262 31,615 120 100.1%2014 32,910 32,698 99.36% 260 32,958 85 100.1%2015 34,735 34,642 99.73% 110 34,752 (30) 100.0%2016 37,715 37,348 99.03% 151 37,499 367 99.4%2017 42,579 41,412 97.26% - 41,412 290 97.3%
(1) - Information was not available from Tarrant Appraisal District for collections in subsequent years. Thus, the amount shown is actual delinquent property taxes collected during the fiscal year.
Collected within the Fiscal Year of the Levy
City of Mansfield, TexasProperty Tax Levies and Collections
Last Ten Fiscal Years(amounts expressed in thousands)

112
General Special Water/Sewer Drainage Utility Certificate Total PercentageFiscal Obligation Assessment Revenue Revenue Obligation Primary of Personal PerYear Bonds Bonds Bonds Bonds Bonds Government Income1 Capita
2008 91,825 15,630 30,560 6,470 3,715 148,200 8.70% 2,565
2009 102,235 14,780 54,350 6,195 3,350 180,910 10.62% 3,089
2010 96,195 13,890 54,090 5,910 2,960 173,045 9.96% 2,936
2011 93,210 12,965 56,840 5,615 2,535 171,165 10.03% 2,955
2012 93,200 12,180 56,405 5,465 2,090 169,340 10.00% 2,945
2013 91,070 11,430 52,705 5,105 1,625 161,935 9.67% 2,848
2014 101,030 10,645 48,885 4,735 1,135 166,430 9.94% 2,928
20152 119,774 9,784 45,874 4,377 1,467 181,276 9.88% 2,912
20162 129,788 25,098 51,339 3,985 1,581 211,791 11.55% 3,402
20172 136,095 33,170 46,155 3,970 630 220,020 12.00% 3,535
Note: Details regarding the City's outstanding debt can be found in the notes to the financial statements.1 See the schedule of demographic and economic statistics on page 103 for personal income and population data.2 Amount represents total outstanding debt net of premiums, discounts and adjustments
City of Mansfield, TexasRatios of Outstanding Debt by Type
Last Ten Fiscal Years(amounts expressed in thousands, except per capita amount)
Governmental Activities Business-Type Activities

113
Percentage ofEstimated
General Less: Amounts Actual TaxableFiscal Obligation Available in Debt Value of PerYear Bonds Service Fund Total Property Capita
2008 91,825 2,307 89,518 2.43% 1,567 2009 102,235 1,064 101,171 2.47% 1,742 2010 96,195 1,207 94,988 2.31% 1,611 2011 93,210 902 92,308 2.29% 1,566 2012 93,200 669 92,531 2.10% 1,609 2013 91,070 596 90,474 2.06% 1,574 2014 101,030 856 100,174 2.28% 1,742 20151 119,774 726 119,048 2.24% 1,913 20161 129,788 483 129,305 2.16% 2,044 20171 136,095 623 135,472 2.27% 2,142
Note: Details regarding the City's outstanding debt can be found in the notes to the financial statements.1 Amount represents total outstanding debt net of premiums, discounts and adjustments
City of Mansfield, TexasRatios of General Bonded Debt Outstanding
Last Ten Fiscal Years(amounts expressed in thousands, except per capita amount)
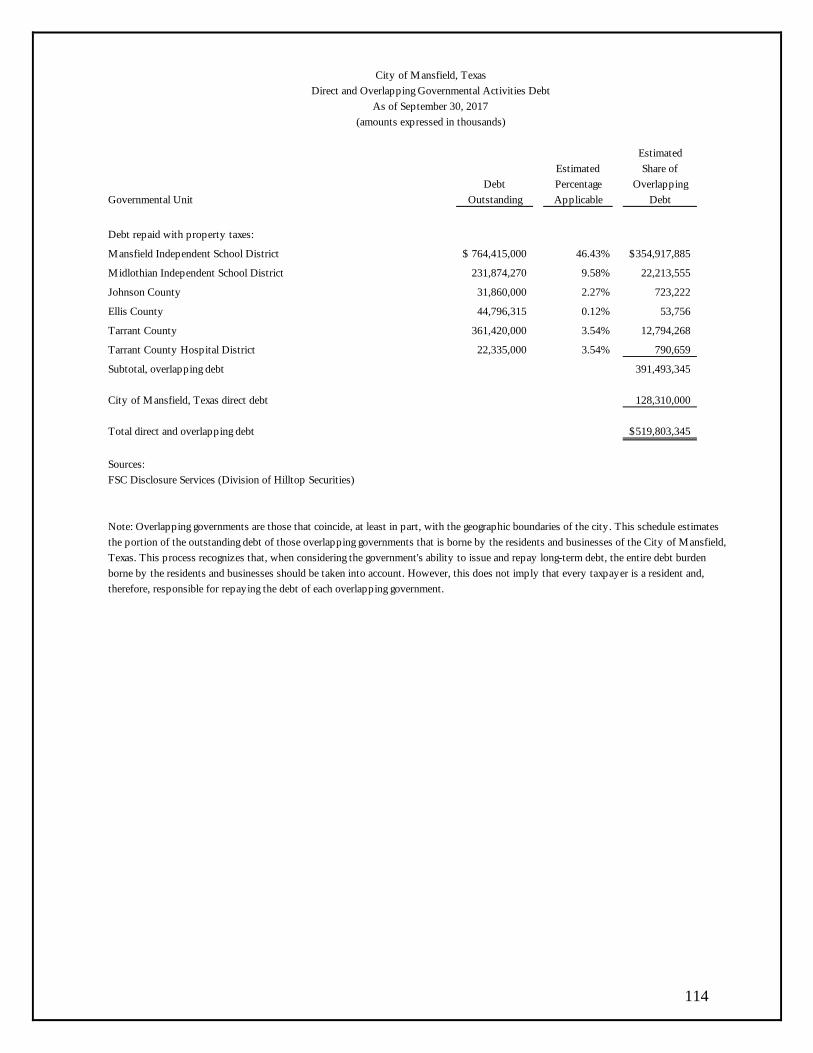
114
EstimatedEstimated Share of
Debt Percentage OverlappingGovernmental Unit Outstanding Applicable Debt
Debt repaid with property taxes:
Mansfield Independent School District 764,415,000$ 46.43% 354,917,885$
Midlothian Independent School District 231,874,270 9.58% 22,213,555
Johnson County 31,860,000 2.27% 723,222
Ellis County 44,796,315 0.12% 53,756
Tarrant County 361,420,000 3.54% 12,794,268
Tarrant County Hospital District 22,335,000 3.54% 790,659
Subtotal, overlapping debt 391,493,345
City of Mansfield, Texas direct debt 128,310,000
Total direct and overlapping debt 519,803,345$
Sources: FSC Disclosure Services (Division of Hilltop Securities)
Note: Overlapping governments are those that coincide, at least in part, with the geographic boundaries of the city. This schedule estimatesthe portion of the outstanding debt of those overlapping governments that is borne by the residents and businesses of the City of Mansfield,Texas. This process recognizes that, when considering the government's ability to issue and repay long-term debt, the entire debt burdenborne by the residents and businesses should be taken into account. However, this does not imply that every taxpayer is a resident and,therefore, responsible for repaying the debt of each overlapping government.
City of Mansfield, TexasDirect and Overlapping Governmental Activities Debt
As of September 30, 2017(amounts expressed in thousands)

115
2008 2009 2010 2011 2012 2013 2014 2015 2016 2017
Annual Debt Limit 61,481,280$ 61,481,280$ 61,647,099$ 60,405,087$ 65,950,450$ 67,344,230$ 69,756,239$ 74,362,815$ 79,303,906$ 88,704,565$
Total net debt payment applicable to limit 11,461,010 12,074,192 12,971,729 12,825,195 13,101,663 12,957,138 13,604,515 12,115,455 12,597,832 13,876,442
Legal debt margin 50,020,270$ 49,407,088$ 48,675,370$ 47,579,892$ 52,848,787$ 54,387,092$ 56,151,724$ 62,247,360$ 66,706,074$ 74,828,123$
Total net debt applicableto the limit as a percentageof debt limit 18.64% 19.64% 21.04% 21.23% 19.87% 19.24% 19.50% 16.29% 15.89% 15.64%
Legal Debt Margin Calculation for Fiscal Year 2017
Assessed ValueDebt limit ($1.50 of assessed value)Annual Debt Payments applicable to limit:
General obligation bondsAnnual legal debt margin
The City Charter of the City of Mansfield, Texas and the statutes of the State of Texas do not prescribe a legal debt limit. However, Article XI, Section 5 of theTexas Constitution, applicable to cities of more than 5,000 population limits the ad valorem tax rate to $2.50 per $100 of assessed valuation. The Attorney General of the State of Texas has further defined the debt limit of applicable cities to be a $1.50 per $100 of assessed valuation.
13,876,442 74,828,123$
City of Mansfield, TexasLegal Debt Margin Information
Last Ten Fiscal Years
5,913,637,667$ 88,704,565

116
Less: Net Less: NetFiscal Charges Operating Available Charges Operating AvailableYear and Other Expenses Revenue Principal Interest Coverage and Other Expenses Revenue Principal Interest Coverage
2008 19,105,084 10,461,808 8,643,276 3,255,000 1,292,141 1.90 1,200,862 462,402 738,460 270,000 281,721 1.342009 21,151,621 11,916,708 9,234,913 2,395,000 2,195,165 2.01 1,317,815 561,370 756,445 275,000 273,753 1.382010 21,158,866 11,543,411 9,615,455 2,845,000 2,680,830 1.74 1,202,606 491,966 710,640 285,000 264,753 1.292011 26,398,502 12,445,314 13,953,188 3,600,000 2,711,369 2.21 1,354,035 484,436 869,599 295,000 254,890 1.582012 25,681,367 14,034,447 11,646,920 3,600,000 2,705,582 1.85 1,260,527 503,105 757,422 385,000 138,398 1.452013 28,220,877 14,288,287 13,932,590 3,700,000 2,611,729 2.21 1,807,772 797,607 1,010,165 360,000 165,670 1.922014 27,654,657 16,744,588 10,910,069 3,820,000 2,493,316 1.73 1,582,812 1,084,682 498,130 370,000 156,670 0.952015 30,093,927 17,096,059 12,997,868 4,095,000 2,183,331 2.07 1,761,901 863,088 898,813 375,000 147,370 1.722016 33,041,557 19,041,197 14,000,360 4,380,000 1,701,278 2.30 2,288,699 864,112 1,424,587 390,000 137,970 2.702017 35,144,144 20,050,464 15,093,680 4,020,000 2,039,234 2.49 2,494,146 922,507 1,571,639 400,000 128,170 2.98
Note: Details regarding the government's outstanding debt can be found in the notes to the financial statements. Charges and other include investment earnings. Operating expenses do not include interest or depreciation.
Debt Service Debt Service
City of Mansfield, TexasPledged-Revenue Coverage
Last Ten Fiscal Years(amounts expressed in thousands)
Water and Sewer Revenue Bonds Drainage Revenue Bonds

117
Personal PerIncome Capita
Fiscal (amounts expressed Personal Median School UnemploymentYear Population1 in thousands) Income2 Age2 Enrollment3 Rate4
2008 53,200 1,576,745 29,638 31.80 29,324 4.4 2009 55,950 1,481,466 26,478 31.80 31,680 7.2 2010 56,368 1,492,534 26,478 31.80 31,226 7.1 2011 56,850 1,505,296 26,478 31.80 32,638 6.5 2012 57,494 1,704,065 29,639 32.06 32,577 6.0 2013 60,374 1,784,305 29,554 32.30 32,732 4.9 2014 62,377 1,990,893 31,917 32.30 32,778 5.1 2015 64,688 2,064,653 31,917 32.30 33,394 5.1 2016 67,628 2,158,489 31,917 35.50 33,809 4.0 2017 68,784 2,456,809 35,718 35.20 33,809 4.5
1Estimated Population - City's Planning Department - The City has revised its population estimates for the previous three yea2Mansfield Economic Development Corporation3Mansfield Independent School District4Texas Workforce Commission
City of Mansfield, TexasDemographic and Economic Statistics
Last Ten Fiscal Years
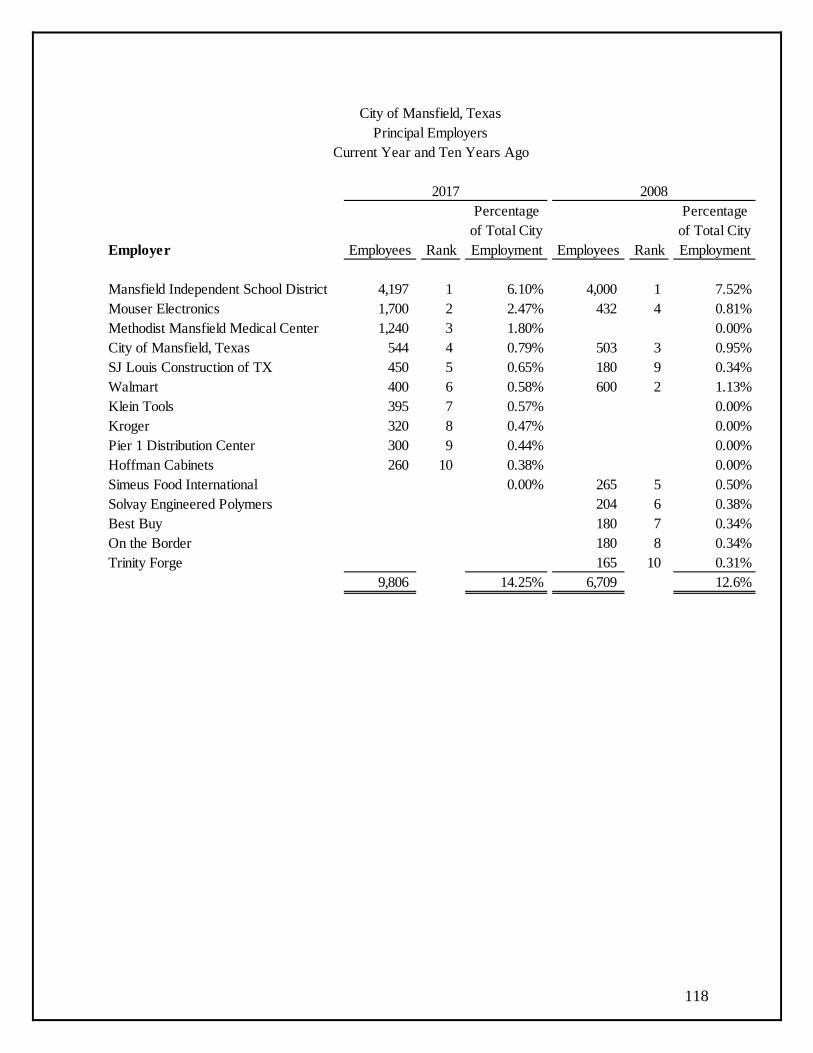
118
Percentage Percentageof Total City of Total City
Employer Employees Rank Employment Employees Rank Employment
Mansfield Independent School District 4,197 1 6.10% 4,000 1 7.52%Mouser Electronics 1,700 2 2.47% 432 4 0.81%Methodist Mansfield Medical Center 1,240 3 1.80% 0.00%City of Mansfield, Texas 544 4 0.79% 503 3 0.95%SJ Louis Construction of TX 450 5 0.65% 180 9 0.34%Walmart 400 6 0.58% 600 2 1.13%Klein Tools 395 7 0.57% 0.00%Kroger 320 8 0.47% 0.00%Pier 1 Distribution Center 300 9 0.44% 0.00%Hoffman Cabinets 260 10 0.38% 0.00%Simeus Food International 0.00% 265 5 0.50%Solvay Engineered Polymers 204 6 0.38%Best Buy 180 7 0.34%On the Border 180 8 0.34%Trinity Forge 165 10 0.31%
9,806 14.25% 6,709 12.6%
City of Mansfield, TexasPrincipal Employers
Current Year and Ten Years Ago
2017 2008

119
2008 2009 2010 2011 2012 2013 2014 2015 2016 2017
FunctionGeneral Government 30 30 30 30 31 31 31 31 30 30 Public Safety: Police 115 114 114 113 115 121 126 129 132 134 Fire 81 81 81 81 83 83 83 83 83 86 Public Works 52 56 56 58 57 57 56 55 58 58 Culture and Recreation 62 56 56 56 55 55 63 65 65 68 Water and Sewer 52 52 52 52 52 52 51 51 51 53 Law Enforcement Center 113 113 113 114 109 109 111 111 111 111 Drainage Utility 3 3 3 3 3 3 3 3 3 4
Total 508 505 505 507 505 511 524 528 533 544
Source: City Budget Office
Last Ten Fiscal Years
City of Mansfield, TexasFull-Time Equivalent City Government Employees by Function

120
2008 2009 2010 2011 2012 2013 2014 2015 2016 2017FunctionPolice: Physical arrests 2,385 2,821 3,050 3,050 2,236 1,646 2,171 2,641 2,107 2,700
Accidents 852 751 825 837 837 909 861 820 936 1,210 Traffic violations 7,886 8,280 7,638 9,579 10,537 10,571 9,926 8,500 9,086 8,019 Fire: Number of calls answered 7,848 7,121 7,103 7,084 7,110 7,911 8,704 8,625 9,538 9,643 Inspections 1,254 1,886 1,998 2,305 2,850 2,008 2,850 3,125 3,100 2,917 Public Works: Street resurfacing (miles) 2.5 2.0 2.1 2.0 2.2 2.2 2.2 2.2 2.0 4.0
Asphalt overlays (square feet) 42,971 42,971 42,971 42,971 42,971 42,971 42,971 42,980 42,000 44,805 Culture and recreation:Sports association participants 14,700 13,800 9,086 7,235 7,445 7,235 7,770 7,950 7,950 7,950 MAC rentals 600 540 660 660 660 540 600 700 650 650 Water: New connections 469 400 300 255 343 419 333 465 485 484 Water main breaks 80 87 39 76 61 66 48 48 40 55 Average daily consumption 9,771 9,937 8,987 11,793 11,944 10,667 9,278 9,657 9,994 9,994 (thousands of gallons)Sewer: Average daily sewage treatment 5,179 5,529 5,717 5,167 5,984 5,450 5,156 5,964 4,818 5,898 (thousands of gallons)Public Safety: Police: Stations 2 2 2 2 2 2 2 2 2 2 Patrol units 54 54 55 52 44 42 42 43 43 44 Fire stations 3 4 4 4 4 4 4 4 4 4
City of Mansfield, TexasOperating Indicators by Function
Last Ten Fiscal Years

121
Public Works: Streets miles maintained 245 245 245 243 242 242 248 248 410 450
Miles of water and sewer lines 539 539 559 534 553 554 538 577 632 585 Calls for service 3,880 4,200 3,885 5,710 4,700 4,700 4,820 4,105 4,500 4,550
Culture and recreation: Parks acreage 738 755 738 760 738 738 830 830 858 883 Parks 12 12 12 13 13 13 14 15 16 16 Tennis courts 1 1 1 1 1 1 1 1 1 5 Community centers 1 1 1 1 1 1 1 1 1 1 Water: Water mains (miles) 268 268 296 287 292 296 292 310 325 330 Fire hydrants* 2,201 2,201 2,207 2,207 2,207 2,207 2,207 1,250 2,439 2,460 Maximum daily capacity 57,000 57,000 57,000 57,000 57,000 57,000 57,000 57,000 57,000 57,000 (thousands of gallons)Sewer: Sanitary sewer mains (miles) 282 286 296 257 261 261 264 267 307 314 Sewer lines repairs 83 54 43 23 23 64 26 25 25 17 Maximum daily treatment capacity 45,000 45,000 45,000 45,000 45,000 45,000 45,000 45,000 45,000 45,000 (thousands of gallons)
Law Enforcement Center: @ Average Daily Inmate Population - - 225 213 192 242 410 365 378 400 Average Daily Meals Served - - 675 639 576 726 1,230 1,095 1,134 1,200
Drainage Utility: # Vegetation Control (acres) - - - - 56 56 56 56 56 56 Ditch & Channel Maintenance (miles) - - - - 11 13 13 13 13 2 Box Culverts Cleaned (feet) - - - - 10,072 10,072 10,072 10,500 10,500 40,715
Source: City Budget Office(-) indicates that the information was not available.*Updated 2008 GIS system.@ - Implemented Fiscal Year 2010 # - Implemented Fiscal Year 2012

122