Embed Size (px)
Citation preview

E N T E R P R I S E F U N D O F T H E STAT E O F M A RY L A N D
COMPREHENSIVE ANNUAL FINANCIAL REPORTF O R T H E Y E A R S E N D E D J U N E 3 0 , 2 0 1 3 a n d 2 0 1 2

MARYLAND LOTTERY AND GAMING CONTROL AGENCY / Enterprise Fund of the State of Maryland
This page inTenTionally leFT blank

MARYLAND LOTTERY AND GAMING CONTROL AGENCY / ENTERpRIsE FuND OF ThE sTATE OF MARYLAND
3
COMPREHENSIVE ANNUAL FINANCIAL REPORT FOR THE YEARS ENDED JUNE 30, 2013 AND 2012PREPARED BY THE ACCOUNTING DEPARTMENT OF THE
MARYLAND LOTTERY AND GAMING CONTROL AGENCY

4 MARYLAND LOTTERY AND GAMING CONTROL AGENCY / Enterprise Fund of the State of Maryland
This page inTenTionally leFT blank

5Comprehensive Annual Financial Report for the Years Ended June 30, 2013 and 2012
TABLE OF CONTENTS Introductory SectIon 9 Letter of transmittal26 certificate of Achievement for excellence in Financial reporting27 Principal officials28 organizational chart
FInAncIAL SectIon31 Independent Auditors’ report33 Management’s discussion and Analysis
Financial Statements:49 — Statements of net Position50 — Statements of revenues, expenses and changes in net Position51 — Statements of cash Flows53 — notes to Financial Statements
Supplementary Information:73 — Schedule of revenues, expenses and changes in net Position —
Budget and Actual74 — notes to Schedule of revenues, expenses and changes in net Position —
Budget and Actual75 — Independent Auditors’ report on Internal controls
StAtIStIcAL SectIon77 Statistical Information Sections
Financial trends:79 — net Position and changes in net Position — Fiscal years 2004 through 201380 — Sales — Fiscal years 2004 through 201385 — u.S. Lotteries Per capita Sales — Fiscal year 201386 — u.S. Lotteries Per capita Sales — Fiscal years 2004 through 201387 — Percentage change in Sales — Fiscal years 2004 through 201388 — u.S. Lotteries Percentage change in Sales — Fiscal year 201389 — expenses and contributions — cumulative for Fiscal years 2004
through 201390 — contributions to the State of Maryland — Inception to date92 — u.S. Lotteries transfers to State — Fiscal year 201293 — Gross terminal revenue distributions — Fiscal years 2011 through 2013100 — table Game revenue distribution — Fiscal year 2013
revenue capacity:101 — retailers, Population and Sales by region109 — Maryland’s Largest Private employers
debt capacity:110 — ratio of outstanding debt by type — Fiscal years 2004 through 2013
demographic and economic Information:111 — demographic and economic Statistics — Fiscal years 2004 through 2013
operating Information:112 — Lottery employees — Fiscal years 2004 through 2013113 — operating Indicators — Fiscal years 2004 through 2013114 — capital Assets, net Information — Fiscal years 2004 through 2013
coMPreHenSIVe AnnuAL FInAncIAL rePort For tHe yeArS ended June 30, 2013 And 2012
MAryLAnd Lottery And GAMInG controL AGency

6 MARYLAND LOTTERY AND GAMING CONTROL AGENCY / Enterprise Fund of the State of Maryland
This page inTenTionally leFT blank

MARYLAND LOTTERY AND GAMING CONTROL AGENCY / ENTERpRIsE FuND OF ThE sTATE OF MARYLAND
7
INTRODUCTORY SECTIONIN FISCAL YEAR 2013, THE MLGCA
CELEBRATED 39 YEARS OF SUPPORTING
MARYLANDERS. THE MLGCA IS THE FOURTH
LARGEST CONTRIBUTOR TO THE STATE
AFTER INDIVIDUAL TAX, CORPORATE TAX,
AND SALES AND USE TAX.

8 MARYLAND LOTTERY AND GAMING CONTROL AGENCY / Enterprise Fund of the State of Maryland
This page inTenTionally leFT blank

9Comprehensive Annual Financial Report for the Years Ended June 30, 2013 and 2012
Maryland Lottery and Gaming Control Agency
Montgomery Park Business Center 1800 Washington Blvd., Suite 330 Baltimore, Maryland 21230
Martin O’Malley, Governor • Stephen Martino, Director
Tel: 410-230-8800TTY users call Maryland Relay
www.mdlottery.com
December 22, 2013
The Honorable Martin O’Malley, Governor Maryland Lottery and Gaming Control Commission
INTRODUCTIONWe are pleased to present to you the Comprehensive Annual Financial Report (CAFR) of the Maryland Lottery and Gaming Control Agency (MLGCA) for the fiscal years ended June 30, 2012 and June 30, 2013. This report has been prepared by the Accounting Department of the MLGCA. Responsibility for both the accuracy of the financial data and the completeness and fairness of presentation, including all disclosures, rests solely with the MLGCA. To the best of our knowledge and belief, the enclosed data is accurate and is reported in a manner designed to present fairly the financial position, results of operations and cash flows of the MLGCA. All disclosures necessary to enable the reader to gain an understanding of the MLGCA’s financial activities have been included.
Presented in this report is information about the MLGCA, an independent agency of the State of Maryland. The MLGCA was established by the Maryland General Assembly through the enactment of Chapter 365 of Laws of Maryland of 1972 and the voters’ approval that same year of a constitutional amendment. The amendment was ratified on November 7, 1972, and operations commenced on January 2, 1973. During the 2007 special session of the Maryland General Assembly, Chapter 4 was enacted relating to the legalization of Video Lottery Terminals (VLTs) in the State subject to the passage of a voters’ constitutional referendum. In 2008, voters approved the installation of up to 15,000 VLTs in the State. On August 14, 2012, Senate Bill 1 – Gaming Expansion – Video Lottery Terminals and Table Games – passed the 2012 Second Special Session of the Maryland General Assembly. This bill contained many provisions concerning gaming operations and certain provisions that were subject to voter referendum. As part of this bill, the Maryland State Lottery Agency was renamed the Maryland Lottery and Gaming Control Agency to reflect its added gaming responsibilities. The provisions that were subject to voter referendum passed during the November 6, 2012 election and allowed for a sixth casino, increased the number of VLTs allowed in the State from 15,000 to 16,500, established table games and allowed for around the clock operations. The MLGCA, in conjunction with a seven-member Commission, serves as the regulator of the gaming program and provides guidance to the lottery operations.

10 MARYLAND LOTTERY AND GAMING CONTROL AGENCY / Enterprise Fund of the State of Maryland
The MLGCA is an enterprise fund of the State and is included in the State’s Comprehensive Annual Financial Report. MLGCA activity is reported as a major enterprise fund type and includes all activity for which the MLGCA is financially accountable.
This letter of transmittal is designed to be read in conjunction with the complementary information offered in the Management’s Discussion and Analysis (MD&A), which can be found immediately following the independent auditors’ report.
The MLGCA is operated as a business enterprise within the framework of State laws and regulations. The mission of the MLGCA is twofold: providing revenue to the State through the sale of traditional lottery products and through the regulation of the gaming program. The MLGCA fulfills this mission by offering the sale of both draw and instant ticket games as described further on pages 15 through 19. Since its inception in 1973, traditional lottery sales have exceeded $37.9 billion and have contributed $13.4 billion in revenue to the State. The majority of the revenue from the traditional lottery is contributed to the State’s General Fund and is used to support various programs and services, such as education, public health and safety, human resources, and the environment. In addition, the MLGCA is required by statute to contribute a defined amount of traditional lottery revenue each year to the Maryland Stadium Authority. Throughout the years, lotteries have evolved and have become more diversified with their offerings to players. Today, 43 states, the District of Columbia and the U.S. Virgin Islands operate lotteries selling both draw games and instant ticket games. During fiscal year 2013, these lotteries generated in excess of $61.6 billion in sales. The Maryland lottery ranked seventh among state lotteries in per capita sales during this time period.
The mission of the gaming program is to regulate the activity with the dual goals of generating revenue for the State of Maryland while maintaining integrity, transparency and fair play. During fiscal year 2013, the MLGCA authorized the opening of the State’s fourth casino and implemented table games at three of its four casinos. Since the inception of the gaming program in fiscal year 2011, video lottery gross terminal revenue generated by the casinos totals in excess of $858.9 million. Table game revenue generated by the three casinos in fiscal year 2013 totaled $48 million. The distribution of gaming revenue is directed by statute and shown on pages 93 and 100 of this report. Today, eight state lotteries have the responsibility of regulating casino operations. During fiscal year 2013, casinos regulated by lotteries generated $2.8 billion in revenue.
THE MARYLAND ECONOMYMaryland’s economy displayed resilience throughout the Great Recession; however, the recovery has been tepid, even more so than for the nation as a whole. Many of the headwinds confronting the national economy bear a disproportionally greater impact for Maryland – particularly those related to tax changes and the federal budget. Real gross-state-product grew 2.4% in 2012 and is expected to slow to 1.5% for 2013 and then back to 2.4% in 2014. The heavy federal government presence within the State served as a barrier against much of the recessionary devastation, though for the near term this asset has become a liability as federal budget sequester has been implemented, the federal government was temporarily shut down, and general federal austerity remains atop the news cycle. That said, the outlook for the private sector is bright as the more forward looking private sector that is directly connected to

11Comprehensive Annual Financial Report for the Years Ended June 30, 2013 and 2012
the federal outlays made principal adjustments back in 2011 and 2012, and those with only secondary relationships (non-federal focused industries) are expanding, albeit at a moderate pace.
Much of the uncertainty surrounding federal budget sequestration remains, though its estimated impact for Maryland has lessened greatly relative to estimates prior to commencement. First, the private sector seems to have taken a defensive position in early 2011 as the Budget Control Act of 2011 was considered by policy makers prior to its passage that August. Maryland’s private sector’s planning actions are evident in the divergence between private sector employment growth for the nation as a whole and Maryland; while growing, the pace of growth has lagged the nation in each of the last three years (see Graph 1 below).
2013
Graph 1 — Private Sector Employment Growth Graph 2 — Federal Goverment Employment Growth
Fiscal Year20122011 2013
Fiscal Year20122011
United States
Maryland
0.0
0.5
1.0
1.5
2.0
2.5
-4
-3
-2
-1
0
1
2
3
4
1.1
1.9
1.5
2.2
1.6
2.0
3.3
-3.9
1.1
-1.5-1.1
-2.3
Source: Bureau of Labor Statistics, Current Employment Statistics
Furthermore, to date, the direct impact for federal employment in Maryland has been muted relative to the national impact (see Graph 2 above). Maryland federal employment in 2011 was boosted by the statutory September 2011 end date of the 2005 Base Realignment and Closure (BRAC) process which brought more than 11,000 direct federal employees to the State. Since 2011, Maryland has continued to fare better than the nation, though just looking at Maryland is somewhat deceptive. The employment statistics cited in the above charts count jobs by location, and since Maryland is a net exporter of workers to Washington, D.C., the district’s statistics are salient; Washington, D.C., has lost almost 8,000 federal jobs since 2011. While Maryland residents certainly share in the district’s federal job losses, it seems that the greater share of the federal impact to this point has been realized by smaller field offices dispersed throughout the country.
Although the estimated impact of sequestration to the State has been less than originally thought, the impact has been significant. The current estimate for the Maryland job losses from sequester totals 25,000, with losses continuing into calendar year 2015. It is important to note that the above job losses do not directly relate to 25,000 separations; they also include positions that would have been created in the absence of sequestration or positions eliminated through attrition. It is also important to note that significant risk remains for this aspect of the forecast. To date, federal agencies have been generally opaque regarding their methods for reaching their reduced budget targets. For example, many have identified reductions to travel expenses, which would generally have little impact to the State, while others have either not filled or eliminated positions; however, the bulk of federal agencies have been silent regarding their cuts. If the extent to which the cuts made through the first

12 MARYLAND LOTTERY AND GAMING CONTROL AGENCY / Enterprise Fund of the State of Maryland
full year of sequestration are not ongoing cuts, or if current contracts are not renewed, the impact could be greater.
While the general uncertainty regarding federal spending and taxation have plagued the recovery together, the taxation aspect is now somewhat resolved, though to the detriment of Maryland disposable income. As the country rolled towards the fiscal cliff in the fourth quarter of 2012, it seemed that the tax cuts passed between 2001 and 2003 would expire, redirecting more than $4.0 billion from Maryland residents to the federal government. Congress was able to ward off the full impact, though taxes did increase for 2013, generally for wealthier individuals. While the impact was significantly reduced relative to the fiscal cliff, the more modest changes did shift several hundred million dollars from Maryland residents to the federal government.
Further impacting consumer spending has been poor wage growth and the expiration of the federal payroll tax holiday. Unsurprisingly, the stubbornly elevated unemployment rate (averaged 6.8% year-to-date through October 2013 versus 3.8% pre-recession average) and policy uncertainty have placed significant downward pressure on wages. The average wage increased just 2.1% in 2012 and is estimated to grow only 0.9% for 2013; 2012 growth equaled inflation and 2013 will likely come in well below, indicating an erosion of purchasing power.
However, asset prices and their impact on spending have served as a stimulus to the besieged consumer market by generating income and inducing the so called “wealth effect.” The wealth effect occurs as consumers’ assets’ values rise to levels at which they feel comfortable making additional discretionary purchases. Much of the wealth destroyed in the depths of the recession has been restored – particularly for those with equity investments. Driven by strong corporate earnings and balance sheets, as well as the federal bond-buying programs (quantitative easing), the stock market indices have fared very well since their recessionary troughs, even reaching new highs this year. The Standard and Poor’s 500 index is up 135% from March 2009, and the broader Wilshire 5000 Total Market Index is up 156% from February 2009; for the year, the S&P 500 and Wilshire 5000 are up 25% and 28% respectively.
Fiscal Year
1971
1973
1975
1977
1979
1981
1983
1985
1987
1989
1991
1993
1995
1997
1999
2001
2003
2005
2007
2009
2011
2013
2015
30-Year Mortgage Fixed Rate
0%
2%
4%
6%
8%
10%
12%
14%
16%
18%
Sources: Freddie Mac; Global Insight
The housing market has continued to improve as well. Through October 2013, as reported by the Maryland Association of Realtors, unit volume and median price are up 14.6% and 5.2%, respectively. A combination of factors including affordability, pent-up demand, and low interest rates are driving the market. For this year, perhaps the most important factor has been historically low interest rates; the average 30-year fixed rate mortgage as reported by the Federal Home Loan Mortgage Corporation (Freddie Mac) reached a historic low of 3.45% in December 2012. Subsequently, rates have increased moderately to 4.19% in October 2013 and remain well below historical norms. The general expectation for interest rates to continue to rise back to more normal levels is inciting much of the current activity and should drive growth for this upcoming spring selling season; the estimated difference between a 4% and 6% interest rate for the average mortgage

13Comprehensive Annual Financial Report for the Years Ended June 30, 2013 and 2012
payment is a $400 per month increase. While rising interest rates will eventually turn to a headwind for the housing market, pent-up household formation is set to fill the void.
The forecast for Maryland remains relatively unchanged from prior year’s expectations, with employment and personal income growth accelerating until 2015/2016 when the recovery takes a firm hold and more regular growth rates ensue. As the employment situation improves, so will wages, both in the aggregate and at the average wage level. Capital gains and retirement income will provide a boost to taxable income for the State as increased asset prices and demographics are expected to symbiotically generate enhanced income realization.
As noted above, job gains will drive the broader recovery. For 2013, job growth as reported for the Current Employment Statistics Survey by the U.S. Bureau of Labor Statistics (BLS) shows year to date growth (through October) of 1.4%. The chart below details how the top 10 industries for State employment prior to the recession have fared since. In the aggregate, Maryland needs 8,200 net new jobs to reach its pre-recession peak level of employment. Health Care & Social Assistance has continued to serve as a steady source of growth and positions while Professional & Technical Services and Federal Government categories have benefited substantially from the previously mentioned BRAC process. Manufacturing has continued a long-term decline trend and Construction & Mining and Retail remain well below the housing bubble induced employment levels. These numbers are subject to revision and our current forecast for 2013 (growth of just 0.9%) implies a somewhat significant downwards revision; data from the Quarterly Census of Employment and Wages, essentially a census for the jobs in the State and the most significant later benchmark for the BLS survey, suggests that the BLS survey has been overstating jobs for this year. Employment is expected to improve in 2014 as the level of policy uncertainty is reduced and the national and world economies gather momentum, and further acceleration is expected into 2015 and 2016.
IndustryShare of Total Employment
Growth Since Peak
Job Change Since Peak
Total 100.0% -0.3% -8,200
Health care & Social Assistance 11.8% +13.3% +41,000
retail trade 11.4% -3.7% -11,000
Local Government 9.6% -0.9% -2,300
Professional & tech Services 8.6% +8.4% +18,800
Accommodations & Food Services 7.6% +4.9% +9,800
construction & Mining 7.1% -20.7% -38,600
Admin & Waste Services 5.9% +2.9% +4,400
Manufacturing 5.0% -20.5% -26,800
Federal Government 4.8% +13.9% +17,500
other Services 4.5% -5.7% -6,800
everything else 23.6% -2.3% -14,200
Note: Maryland peak employment in February 2008 was used for all industries and share of employment.

14 MARYLAND LOTTERY AND GAMING CONTROL AGENCY / Enterprise Fund of the State of Maryland
As in recent forecasts, risks abound, particularly those related to the federal government. The federal budget and debt ceiling come back into play in the first quarter of 2014, opening the door for another shutdown or possibly a recession, and federal sequester remains a somewhat open issue (as discussed earlier). Also, there is risk regarding the Federal Reserve’s expected reduction to its current bond-buying program and the impact it will have on the broader economy as well as the financial markets. Direct upside risks include the positive alteration or removal of sequestration as a component of possible entitlement and/or tax reform and a greater economic impact from the Port of Baltimore’s capture of lucrative trade business resulting from the widening of the Panama Canal which is set to conclude in 2015.

15Comprehensive Annual Financial Report for the Years Ended June 30, 2013 and 2012
MARYLAND LOTTERY PRODUCTSThe MLGCA has introduced a number of different traditional lottery games since its inception and continues to provide players with the opportunity to participate in a variety of draw and instant ticket games. Draw games allow players to pick their numbers or utilize automatic computer-generated plays. Customers receive a ticket and then wait for the drawing to determine if they have won. Instant games are played by scratching a latex covering off a play area to reveal pre-printed combinations. If a winning combination appears, the customer is an instant winner.
Traditional lottery games offered during fiscal year 2013 included the following:
FIScAL yeAr 2013 StAtIStIcS: $245.5 million in net sales
14.0% of total net sales $9.0 million decrease from fiscal year 2012 Pick 3 net sales
PICK 3 was introduced in July 1976 and was the first draw game offered. Players choose three numbers from zero to nine for the chance of winning prizes ranging from $25 to $500. Drawings are held twice daily, seven days a week.
FIScAL yeAr 2013 StAtIStIcS: $267.8 million in net sales
15.2% of total net sales $2.3 million increase from fiscal year 2012 Pick 4 net sales
PICK 4 was introduced in April 1983. Players choose four numbers from zero to nine for the chance of winning prizes ranging from $100 to $5,000. Drawings are held twice daily, seven days a week.
FIScAL yeAr 2013 StAtIStIcS: $485.8 million in net sales
27.7% of total net sales $21.0 million decrease from fiscal year 2012 Instant ticket net sales
INSTANT TICKETS, also known as scratch-offs, were first introduced in 1976. Similar to today’s instant ticket games, the first instant ticket game launched in Maryland provided players with the opportunity to win by scratching a latex play area. From 1976 to 1985, a limited number of instant tickets games were launched; however, by 1986, instant games were launched on a more frequent basis. During fiscal year 2013, the MLGCA launched 54 different instant ticket games.

16 MARYLAND LOTTERY AND GAMING CONTROL AGENCY / Enterprise Fund of the State of Maryland
FIScAL yeAr 2013 StAtIStIcS: $181.2 million in net sales
10.3% of total net sales $22.7 million decrease from fiscal year 2012 Keno net sales
KENO is a draw game that is predominantly played in a social atmosphere, and drawings are held every four minutes. Keno was introduced in January 1993. A computer generates random sets of 20 numbers for each draw. These numbers are then displayed on a monitor. Players select from one to 10 numbers from a field of 80 numbers and win prizes ranging from $2 to $100,000 by matching anywhere from zero numbers to 10 numbers.
FIScAL yeAr 2013 StAtIStIcS: $38.4 million in net sales
2.2% of total net sales $5.3 million decrease from fiscal year 2012 Keno Bonus net sales
KENO BONUS® is a draw game that was introduced statewide in April 1999 and is sold in conjunction with Keno. By matching a Keno wager, players have an opportunity to multiply their winnings by three, four, five or 10. The multiplier is determined by a computer-generated wheel that is spun prior to each drawing. The maximum prize that can be won per game on any one Keno ticket when Keno Bonus is played is $1 million.
FIScAL yeAr 2013 StAtIStIcS: $125.3 million in net sales
7.1% of total net sales $14.5 million decrease from fiscal year 2012 Keno Super Bonus net sales
KENO SUPEr BONUSTM is a draw game that was introduced in June 2009 and is sold in conjunction with Keno. The amount of the Keno Super Bonus wager is twice the amount of the Keno wager. By matching a Keno wager, players have an opportunity to multiply their winnings by two, three, four, five, six, 10, 12 or 20. The multiplier is determined by a computer-generated wheel that is spun prior to each drawing and is part of the Keno Bonus wheel. The maximum prize that can be won on any Keno ticket when Keno Super Bonus is played is $2 million.

17Comprehensive Annual Financial Report for the Years Ended June 30, 2013 and 2012
FIScAL yeAr 2013 StAtIStIcS: $129.4 million in net sales
7.4% of total net sales $12.1 million increase from fiscal year 2012 racetrax® net sales
RACETRAX® is a draw game that launched statewide in August 2006. The game is predominantly played in a social atmosphere, and drawings are held approximately every four and a half minutes. This game is a computer-animated monitor game that offers the thrill of horse racing with advanced 3-D graphic animation that results in the horses and races appearing realistic. Players select from one to 12 horses to win prizes ranging from $1.20 to $31,454.
FIScAL yeAr 2013 StAtIStIcS: $19.4 million in net sales
1.1% of total net sales $2.5 million increase from fiscal year 2012 racetrax® Bonus net sales
rACETrAx® BONUS is a draw game that was launched statewide in August 2009 and is sold in conjunction with Racetrax. By matching a Racetrax wager, players have an opportunity to multiply their winnings by three, four, five or 10. The multiplier is determined by a computer-generated wheel that is spun prior to each drawing. The maximum prize that can be won per game on any Racetrax ticket when Racetrax Bonus is played is $3.15 million.
FIScAL yeAr 2013 StAtIStIcS: $21.1 million in net sales
1.2% of total net sales $788 thousand decrease from fiscal year 2012 Bonus Match 5 net sales
BONUS MATCH 5 is a draw game that was originally introduced in September 1995. The game was discontinued in January 1998 and re-introduced in February 2002. Players select or request the computer to generate five numbers from a field of 39. Players matching all five numbers, in any order, win $50,000. In the event that there are more than 12 $50,000 winners in one drawing, each winner will receive an equal share of the $600,000 prize pool. Players also may win prizes ranging from $2 to $600. Drawings are held seven nights a week.
18 MARYLAND LOTTERY AND GAMING CONTROL AGENCY / Enterprise Fund of the State of Maryland
FIScAL yeAr 2013 StAtIStIcS — MeGA MILLIonS: $66.7 million in net sales
3.8% of total net sales $38.8 million decrease from fiscal year 2012 Mega Millions net sales
FIScAL yeAr 2013 StAtIStIcS — MeGAPLIer: $4.3 million in net sales 0.2% of total net sales
$900 thousand decrease from fiscal year 2012 Megaplier net sales
MEGA MILLIONS® is a multi-state Jackpot draw game. The MLGCA began selling Mega Millions in September 1996. Currently, 45 lotteries sell Mega Millions. Players choose or request the computer to generate a total of six numbers from two different fields. Players pick five numbers from a field of 56 and one Mega Ball number from a field of 46. Players matching all numbers and the Mega Ball win the Jackpot. If there are multiple winners, the Jackpot prize is divided evenly among all the winners. Jackpots start at $12 million and increase each drawing for which there is no Jackpot winner(s). Players also can win prizes ranging from $2 to $250,000. Megaplier® is a special feature of Mega Millions that allows a winner to increase their non-Jackpot winnings by two, three or four times for an extra $1 per play. Drawings are held on Tuesday and Friday evenings.
FIScAL yeAr 2013 StAtIStIcS: $28.8 million in net sales
1.6% of total net sales $1.9 million decrease from fiscal year 2012 Multi-Match net sales
MULTI-MATCH® is a Jackpot draw game that was introduced in February 2006, replacing Lotto, the MLGCA’s original in-state Jackpot game. Players receive three lines of six numbers. Players choose or request the computer to generate the first line of numbers from a field of 43. The computer then generates the remaining two lines of numbers. Players matching all six numbers in a single line, in any order, win the Jackpot, which typically starts at $500,000 and increases after each drawing, if not won. If there are multiple winners, the Jackpot is divided by the number of winners. Players can also win fixed prizes ranging from $2 to $3,000 by matching three or more numbers in a single line or five or more numbers in the combined lines. Multi-Match drawings are held on Monday and Thursday evenings.

19Comprehensive Annual Financial Report for the Years Ended June 30, 2013 and 2012
FIScAL yeAr 2013 StAtIStIcS — PoWerBALL: $126.2 million in net sales
7.2% of total net sales $48.2 million increase from fiscal year 2012 Powerball net sales
FIScAL yeAr 2013 StAtIStIcS — PoWer PLAy: $5.1 million in net sales 0.3% of total net sales
$300 thousand decrease from fiscal year 2012 Power Play net sales
POWErBALL® is a multi-state Jackpot draw game. The MLGCA began selling Powerball/Power Play in January 2010. Currently, 45 lotteries sell Powerball/Power Play. In Powerball, players choose or request the computer to generate a total of six numbers from two different fields. Players pick five numbers from a field of 59 and one Powerball from a field of 39. Players matching all numbers and the Powerball win the Jackpot. If there are multiple winners, the Jackpot prize is divided evenly among all winners. In January 2012, the base price of a Powerball ticket increased from $1 to $2 in all jurisdictions selling the game. At the same time, the starting Jackpot was raised to $40 million, up from $20 million and the odds of winning the jackpot improved from 1 in 196 million to 1 in 176 million. Players also can win prizes ranging from $4 to $1 million. POWEr PLAY® is a special feature of Powerball that allows a winner to increase their original Powerball prize amount. For an extra $1, Powerball players can win $12 to $2 million. Drawings are held on Wednesday and Saturday evenings.
FIScAL yeAr 2013 StAtIStIcS: $11.2 million in net sales
0.6% of total net sales
5 CArD CASH is a draw game that launched statewide in November 2012. Players receive a $2 ticket featuring five randomly selected cards from the standard deck of 52 playing cards. Players can win instantly if their cards show a poker hand of a pair of jacks or better. Players can win from $3 to $100,000. Players have a second chance to win if they match two, three, four or five randomly drawn cards in drawings held seven days a week.

20 MARYLAND LOTTERY AND GAMING CONTROL AGENCY / Enterprise Fund of the State of Maryland
FIScAL yeAr 2013 StAtIStIcS: $560.7 million in gross terminal revenue
6,830 total video lottery terminals as of June 30, 2013 $365.6 million increase from fiscal year 2012 gross terminal revenue
VIDEO LOTTErY TErMINALS were approved during the 2007 special session of the Maryland General Assembly. As of June 30, 2013, four casinos had opened and 6,830 video lottery terminals were in operation.
TABLEGAMESTABLEGAMESTABLEGAMES
FIScAL yeAr 2013 StAtIStIcS: $48.0 million in revenue
154 total table games
TABLE GAMES became operational in fiscal year 2013 after the Maryland General Assembly passed the Gaming Expansion Act, making table games available to the casinos, subject to the passage of the voter referendum. In March 2013, Hollywood Casino – Perryville began operating table games. In April 2013, Maryland Live! Casino debuted table games and in May 2013, Rocky Gap Casino Resort opened with table games. As of June 30, 2013 there were 154 table games in operation.
HIGHLIGHTS OF FISCAL YEAR 2013Fiscal year 2013 proved to be a highly successful year for the MLGCA. The MLGCA generated $1.756 billion in lottery sales and $608.72 million in gaming revenue. Lottery sales and gaming revenue in total for fiscal year 2013 is $374.9 million or 18.8% more than fiscal year 2012.
Aside from the financial success, other significant activities and accomplishments included:
trAdItIonAL Lottery
• My Lottery Rewards, a scratch-off customer loyalty program, began in May 2013. The program rewards players with extra chances to win and provides the opportunity for players to earn points for non-winning scratch-off tickets, which in turn can be accumulated and exchanged for rewards merchandise or entries into drawings.
• A new game, 5 Card Cash, was launched in November 2012. This game is a poker style game and includes both an instant win feature and a nightly drawing. Players can win on both the instant win feature and the nightly drawing. The price of the game is $2, and on the instant win feature, players can win anything from a free ticket up to $10,000. During the nightly drawing, players can win anywhere from $3 to $100,000.
• Working together with our draw games partner, the MLGCA made several changes to the monitor games. First, the MLGCA refreshed the Keno game by developing new graphics

21Comprehensive Annual Financial Report for the Years Ended June 30, 2013 and 2012
screens and adjusting the timing of the draws. Second, new bet types were introduced to the Racetrax game that are representative of wagers made at horseracing tracks.
• In terms of the Jackpot game portfolio, the MLGCA benefited from sales associated with a $590.5 million Powerball Jackpot in May of 2013 — the highest ever Powerball Jackpot.
• Administratively, several major MLGCA contracts were bid during fiscal year 2013. These contracts include instant ticket printing; advertising; media buying and planning; website hosting/digital social media; and marketing research. The advertising contract includes both a media and a creative component.
• Effective January 1, 2013, commissions paid to lottery retailers increased from 5% to 5.5%. As of June 30, 2013, there were a total of 4,422 lottery retailers. During fiscal year 2013, 55,406,316 winning Maryland lottery tickets were claimed, and there were 936 winners of $10,000 or more.
cASInoS
• Fiscal year 2013 was a year of major changes for the MLGCA. As mentioned, in August 2012, Senate Bill 1 – Gaming Expansion – Video Lottery Terminals and Table Games – passed the 2012 Second Special Session of the Maryland General Assembly. While this bill contained several changes, major changes included a name change from the Maryland State Lottery Agency to the Maryland Lottery and Gaming Control Agency and a provision to allow for a sixth casino in Prince George’s County and the implementation of table games at all casinos.
• By the end of FY 2013 two important developments were realized: 1) The Rocky Gap Casino Resort opened in May 2013 with more than 500 employees and became the fourth casino in Maryland; 2) Maryland casinos began to offer table games in addition to slots. The first casino with table games was Hollywood Casino – Perryville, which started with 20 table games in March 2013. Maryland Live! Casino began to offer table games at 122 tables in April 2013, and Rocky Gap opened its doors with 10 table games in May 2013.
• The MLGCA, as staff to the Video Lottery Location Commission, issued a request for proposals for the sixth casino site located in Prince George’s County. Three bids were received, and background investigations were completed on all bidders to qualify them for potential licensure.
reSPonSIBLe GAMInG
• As part of its corporate responsibility and with the introduction of a fourth casino, the MLGCA expanded its Responsible Gambling Program. Under this program the MLGCA operates a voluntary exclusion program that allows individuals to ban themselves from Maryland casinos. To date, 368 individuals have done so. The program was expanded during the fiscal year to add a voluntary exclusion program for the traditional lottery. Additionally, the agency participated with North American consortium of lotteries during the 2012 holiday season to deliver public service announcements to remind players that lottery tickets are not appropriate gifts for anyone under 18 years old.

22 MARYLAND LOTTERY AND GAMING CONTROL AGENCY / Enterprise Fund of the State of Maryland
FINANCIAL INFORMATION
AccountInG SySteMS And PoLIcIeSThe MLGCA operates enterprise activities, which include sales of instant and draw game tickets, the regulation of gaming operations to the general public, and the related supporting functions: personnel, finance, administration, marketing, security, information technology and licensing. No general government functions or operations are managed by the MLGCA or included in this report. The MLGCA, like a private business, utilizes the full accrual basis of accounting in accordance with accounting principles generally accepted in the United States of America. Under the accrual basis of accounting, revenues are recognized when earned, and expenses are recognized at the time the related liabilities are incurred.
BudGetAry SySteMS And controLSBudgetary control for all State agencies is maintained through the Governor’s approval and the enactment of the State’s budget by the General Assembly. Each year, the MLGCA submits its budget to the Governor for approval. The budget includes all costs to operate the traditional lottery and to regulate gaming operations. Excluded from the budget are lottery prizes paid to winners and commissions paid to lottery retailers. Effective October 1, 2013, commissions paid to casino operators were also excluded from the budget. Lottery prizes and commissions are funded from the sale of lottery tickets and are not included as part of the annual budget submitted for approval. Commissions paid to the casino operators are funded from the VLT and table game revenue.
The Governor, in turn, submits the budget for the entire State (including the MLGCA’s budget) to the General Assembly for enactment. The MLGCA’s official budget, as enacted by the General Assembly, is divided among the various divisions within the MLGCA. These divisions are responsible for monitoring expenditures within their division in order to ensure expenditures do not exceed the amount budgeted. Encumbrance accounting is utilized whereby purchase orders, contracts and other commitments are treated as expenditures for budgetary purposes. The MLGCA’s Budget Department is responsible for monitoring the entire budget, including the budgeted funds allocated to the various divisions, in order to ensure that the total expenditures (including encumbrances) do not exceed the approved budget without first obtaining the approval of the Governor and the General Assembly.
deBt AdMInIStrAtIonThe MLGCA’s long-term liabilities are primarily payments owed to Jackpot and lifetime winners and capital lease obligations. The payments due to winners are fully funded by amounts invested primarily in United States Government Agency Obligations (coupon bonds). Some investments also are held in annuity contracts. Capital lease obligations are for lottery gaming equipment and video lottery terminals leased through the State Treasurer’s Office and the VLT manufacturers
InternAL controL enVIronMent Management of the MLGCA is responsible for establishing and maintaining an internal control structure designed to ensure that assets are protected from loss, theft or misuse and to ensure that the accounting system allows compilation of accurate and timely financial information. Because the

23Comprehensive Annual Financial Report for the Years Ended June 30, 2013 and 2012
cost of a control should not exceed the benefits to be derived, the structure is designed to provide reasonable, rather than absolute, assurance that the financial statements are free of any material misstatements.
To enhance controls over accounting procedures, the MLGCA has segregated the following functions: personnel, payroll, purchasing, accounts payable, accounts receivable and general ledger accounting. Data input and processing are separate from system programming with management providing approval and oversight. In addition, an internal auditor reviews all areas of the MLGCA and reports jointly to the Director and to the Commission.
Since the MLGCA manages instant tickets, controls the disbursement of lottery prizes and is responsible for the regulation of the casinos, the following steps have been taken to ensure the operations remain secure and meet the highest ethical standards:
• employing specialized enforcement staff who are present at the casinos on a 24-hours-a-day/ 7-days-a-week basis;
• maintaining secure facilities and limiting access to them; • performing background checks on retailers, vendors, employees and anyone that wants to obtain
a gaming license; • printing lottery tickets with special security features; • performing unannounced inspections at the drawing studio to ensure compliance with
established operating procedures; • processing daily transactional data of all vendor activity by MLGCA personnel using internal
control system programs and reconciling transactions to reports generated by the lottery draw game vendor;
• comparing, on a daily basis, gross terminal revenue recorded on the MLGCA’s central system to gross terminal revenue reported by the casinos’ slot accounting systems and reconciling any differences;
• employing auditors at the casinos to ensure table game revenue is accurately accounted for and the casinos are adhering to the required internal controls; and
• providing a variety of access and other controls in the MLGCA’s computer systems.
The MLGCA has 294 employees, most of whom are located at the MLGCA’s headquarters in Baltimore. The drawing studio is located at the broadcast facility of a television station located in Baltimore, which produces the nightly drawings and Multi-Match drawings. Keno and Racetrax drawings are conducted by random number generators and are maintained and secured at the lottery draw game vendor’s office located in Baltimore. Mega Millions and Powerball drawings are held in Georgia and Florida, respectively.
Future ProJectSFiscal year 2014 will present challenges for the MLGCA as it strives to maintain the amount of State contributions that were achieved in fiscal year 2013.

24 MARYLAND LOTTERY AND GAMING CONTROL AGENCY / Enterprise Fund of the State of Maryland
The opening of the Horseshoe Casino in Baltimore in 2014 will add a fifth Casino to the State of Maryland and comes with the opportunity to increase State gaming contributions.
Provisions of the Gaming Expansion Act will continue to be implemented. A Request for Proposal will be issued and evaluated for the implementation of lottery ticket vending machines at qualified veterans’ organizations. The MLGCA provided staffing to the Video Lottery Location Commission to assist in its evaluation of an award for a sixth State Casino license, located in Prince George’s County. It is expected that one or more casinos will open poker rooms in fiscal year 2014.
On the traditional lottery side, changes to the Mega Millions and Powerball games will be implemented. For Mega Millions the change will involve an adjustment to the game matrix and a higher initial starting Jackpot. For Powerball, the change will be to the Power Play or multiplier feature to the game that allows players the chance to win more if they win a lower tier prize.
The MLGCA will launch several innovative scratch-off products in the year ahead. Among these will be a game that celebrates the Baltimore Ravens Super Bowl XLVII victory, a ticket that highlights a technology prize second chance contest themed promotional partnership with Sony and games that have mobile applications in order to draw in a new player base. Efforts will be made to enhance and grow the My Lottery Rewards program as well.
IndePendent AudItThe MLGCA has contracted with an independent certified public accounting firm to perform an annual audit of the MLGCA. The independent auditors’ opinions on the MLGCA’s financial statements and internal controls are included in the financial section of this report.
certIFIcAte oF AcHIeVeMentThe Government Finance Officers Association (GFOA) awarded a Certificate of Achievement for Excellence in Financial Reporting to the MLGCA for its CAFR for the fiscal year ended June 30, 2012. This marked the ninth consecutive year the MLGCA received this prestigious national award. In order to be awarded a Certificate of Achievement, a governmental unit must publish an easily readable and efficiently organized CAFR. This report must satisfy both generally accepted accounting principles and applicable legal requirements.
A Certificate of Achievement is valid for a period of one year only. The MLGCA believes its current CAFR continues to meet Certificate of Achievement Program requirements and is submitting it to the GFOA to determine eligibility for another certificate.
AcKnoWLedGeMentSThe preparation of this report could not have been accomplished without the efficient and dedicated services of the Accounting Department. A special note of thanks also is given to the MLGCA’s Creative Services Division and current creative services partner for assisting in the layout of this report; Andrew Schaufele, Director of the State’s Bureau of Revenue Estimates, for his assistance in providing information concerning the Maryland economy; and the MLGCA’s independent auditors for providing assistance in developing this report.

25Comprehensive Annual Financial Report for the Years Ended June 30, 2013 and 2012
This Comprehensive Annual Financial Report reflects the MLGCA’s commitment to maintaining its financial statements and record-keeping systems in conformance with the highest standards of accountability.
Respectfully Submitted,
MARYLAND LOTTERY AND GAMING CONTROL AGENCY
Gina M. Smith, CPA Deputy Director and Chief Financial Officer
Stephen L. Martino Director

26 MARYLAND LOTTERY AND GAMING CONTROL AGENCY / Enterprise Fund of the State of Maryland

27Comprehensive Annual Financial Report for the Years Ended June 30, 2013 and 2012
MARYLAND LOTTERY AND GAMING CONTROL AGENCY
PRINCIPAL OFFICIALS AS OF JUNE 30, 2013
MARTINO’MALLEY
Governor
STEPHENMARTINO
Director
WILMAEDELENBOS
Internal Auditor
KIMBERLY D.ROBERTSON-
PANNELLChair
DIANE C . MCGRAWVice-Chair
JAMES J.STAKEM
Commissioner
BERT J.HASH, JR.
Commissioner
E. RANDOLPHMARRINER
Commissioner
JOHN MORTON III
Commissioner
F. VERNONBOOZER
Commissioner

28 MARYLAND LOTTERY AND GAMING CONTROL AGENCY / Enterprise Fund of the State of Maryland
STEPHEN MARTINO
Director
GINA M.SMITH, CPA
Deputy Director &Chief Financial O�cer
ROBERT FONTAINE
Principal CounselO�ce of the
Attorney General
Administration,Finance,
Operations, HRand Procurement
CAPTAIN JOHN
MOONEYAssistant Directorfor Enforcement
JOHNMARTIN
Assistant Directorfor Lottery
CHARLESLABOY
Assistant Directorfor Gaming
JACLYNVINCENTDirector of
Gaming Research & Chief of Sta�
MARYLAND LOTTERY AND GAMING CONTROL AGENCY
ORGANIzATIONAL CHART AS OF JUNE 30, 2013

introductory SEctionIn FIscal Year 2012, the MarYland
state lotterY celebrated 39 Years oF
supportIng MarYlanders. the lotterY
Is the Fourth largest contrIbutor
to the state aFter IndIvIdual tax,
corporate tax, and sales and use tax.
MARYLAND LOTTERY AND GAMING CONTROL AGENCY / ENTERpRIsE FuND OF ThE sTATE OF MARYLAND
29
FINANCIAL SECTIONIN FISCAL YEAR 2013, THE MARYLAND LOTTERY
AND GAMING CONTROL AGENCY CONTRIBUTED
MORE THAN $545.2 MILLION TO THE STATE
OF MARYLAND IN LOTTERY REVENUE. GAMING
ACTIVITIES GENERATED $608.7 MILLION IN REVENUE.

30 MARYLAND LOTTERY AND GAMING CONTROL AGENCY / Enterprise Fund of the State of Maryland
This page inTenTionally leFT blank

31
INDEPENDENT AUDITORS’ REPORT
To the Maryland Lottery and Gaming Control Agency:
rePort on tHe FInAncIAL StAteMentSWe have audited the accompanying financial statements of the Maryland Lottery and Gaming Control Agency (an agency of the State of Maryland), as of and for the years ended June 30, 2013 and 2012, and the related notes to the financial statements, as listed in the table of contents. These financial statements are the responsibility of the Maryland Lottery and Gaming Control Agency’s management. Our responsibility is to express an opinion on the financial statements based on our audits.
MAnAGeMent’S reSPonSIBILIty For tHe FInAncIAL StAteMentS Management is responsible for the preparation and fair presentation of these financial statements in accordance with accounting principles generally accepted in the United States of America; this includes the design, implementation, and maintenance of internal control relevant to the preparation and fair presentation of financial statements that are free from material misstatement, whether due to fraud or error.
AudItorS’ reSPonSIBILIty For tHe FInAncIAL StAteMentSOur responsibility is to express opinions on these financial statements based on our audits. We conducted our audits in accordance with auditing standards generally accepted in the United States of America and the standards applicable to financial audits contained in the Government Auditing Standards issued by the Comptroller General of the United States. Those standards require that we plan and perform the audit to obtain reasonable assurance about whether the financial statements are free of material misstatement.
An audit involves performing procedures to obtain audit evidence about the amounts and disclosures in the financial statements. The procedures selected depend on the auditor’s judgment, including the assessment of the risks of material misstatement of the financial statements, whether due to fraud or error. In making those risk assessments, the auditor considers internal control relevant to the entity’s preparation and fair presentation of the financial statements in order to design audit procedures that are appropriate in the circumstances, but not for the purpose of expressing an opinion on the effectiveness of the entity’s internal control. Accordingly, we express no such opinion. An audit also includes evaluating the appropriateness of accounting policies used and the reasonableness of significant accounting estimates made by management, as well as evaluating the overall presentation of the financial statements.
We believe that the audit evidence we have obtained is sufficient and appropriate to provide a basis for our audit opinions.
32 MARYLAND LOTTERY AND GAMING CONTROL AGENCY / Enterprise Fund of the State of Maryland
oPInIonSAs discussed in Note 1, the financial statements of the Maryland Lottery and Gaming Control Agency are intended to present the financial position and the changes in financial position and cash flows, where applicable, of the Maryland Lottery and Gaming Control Agency. They do not purport to, and do not, present fairly the financial position of the State of Maryland as of June 30, 2013 and 2012, and the changes in its financial position and its cash flows, where applicable, for the years then ended in conformity with accounting principles generally accepted in the United States of America.
In our opinion, the financial statements referred to above present fairly, in all material respects, the financial position of the Maryland Lottery and Gaming Control Agency, as of June 30, 2013 and 2012, and the respective changes in financial position and cash flows, for the years then ended in conformity with accounting principles generally accepted in the United States of America.
otHer MAtterSRequired Supplementary InformationAccounting principles generally accepted in the United States of America require that the management’s discussion and analysis and budgetary comparison information on pages 33 through 48 and 73 through 74, respectively, be presented to supplement the basic financial statements. Such information, although not part of the basic financial statements, is required by the Government Accounting Standards Board, who considers it to be an essential part of financial reporting for placing the basic financial statements in an appropriate operational, economic, or historical context. We have applied certain limited procedures to the required supplementary information in accordance with auditing standards generally accepted in the United States of America, which consisted of inquiries of management about the methods of preparing the information and comparing the information for consistency with management’s responses to our inquiries, the basic financial statements, and other knowledge we obtained during our audits of the basic financial statements. We do not express an opinion or provide any assurance on the information because the limited procedures do not provide us with sufficient evidence to express an opinion or provide any assurance.
otHer rePortInG requIred By GoVernMent AudItInG StAndArdSIn accordance with Government Auditing Standards, we have also issued our report dated September 30, 2013, on our consideration of the Maryland Lottery and Gaming Control Agency’s internal control over financial reporting and on our tests of its compliance with certain provisions of laws, regulations, contracts, and grant agreements and other matters. The purpose of that report is to describe the scope of our testing of internal control over financial reporting and compliance and the results of that testing, and not to provide an opinion on the internal control over financial reporting or on compliance. That report is an integral part of an audit performed in accordance with Government Auditing Standards in considering the Maryland Lottery and Gaming Control Agency’s internal control over financial reporting and compliance.
The introductory section and statistical section are presented for purposes of additional analysis and are not a required part of the basic financial statements. These sections have not been subjected to the auditing procedures applied in the audit of the basic financial statements and, accordingly, we express no opinion on them.
September 30, 2013

33Comprehensive Annual Financial Report for the Years Ended June 30, 2013 and 2012
MARYLAND LOTTERY AND GAMING CONTROL AGENCY
MANAGEMENT’S DISCUSSION AND ANALYSIS
The following Management’s Discussion and Analysis (MD&A) provides an overview of the Maryland Lottery and Gaming Control Agency’s (MLGCA) performance for the fiscal years ended June 30, 2013 and 2012. As you read the MD&A, 2013 refers to the fiscal year ended June 30, 2013, 2012 refers to the fiscal year ended June 30, 2012 and 2011 refers to the fiscal year ended June 30, 2011. The information contained in the MD&A should be read in conjunction with the information contained in the financial statements and notes to the financial statements, which begins on page 49.
FINANCIAL HIGHLIGHTS• Net lottery sales were $1.756 billion in 2013, a decrease of $38.8 million or -2.16% as compared
to 2012, which increased $80.5 million or 4.70% as compared to 2011.• Cost of sales increased by $135.4 million or 10.62% in 2013 as compared to 2012 which increased
$109.5 million or 9.04% as compared to 2011. The major reason for the increase was an increase in commissions paid to casino operators. In 2013, there were three casinos with a full year of operations and a fourth casino which opened in May 2013 compared to two casinos with a full year of operation in 2012 and a third casino opening in June 2012. In addition, table games were launched in the second half of 2013. Casino operators receive a share of revenue generated from both the VLTs (Video Lottery Terminals) and the table games. The overall increase was slightly offset by a decrease in lottery prizes due to players. The majority of the increase in 2012 from 2011 was the result of an increase in commissions paid to casino operators and an increase in lottery prizes due to players.
• Operating expenses increased by $58.3 million or 103.43% in 2013 compared to 2012 which decreased $32.5 million or 36.55% as compared to 2011. The increase in operating expenses in both 2013 and 2012 is attributed to the costs incurred to regulate the casinos.
• Transfers to the State of Maryland and the Stadium Authority from lottery proceeds in 2013 were $545.2 million, a decrease of $11 million or -1.98% as compared to 2012, which increased $36.9 million or 7.10% as compared to 2011.
• Gross video lottery terminal revenue was $560.7 million in 2013, an increase of $365.6 million or 187.39% as compared to 2012, which increased $92 million or 89.17% as compared to 2011.
• Table games debuted in the second half of 2013. Table game revenue generated in 2013 totaled $48 million.
• Transfers to various State agencies from video lottery terminal and table game revenue in 2013 totaled $376.5 million, an increase of $247.6 million or 192.16% as compared to 2012, which increased $61.66 million or 91.72% as compared to 2011.
OVERVIEW OF THE FINANCIAL STATEMENTSThe Maryland Lottery and Gaming Control Agency is an independent agency of the State that was created to generate revenue through the operation of a lottery. On November 4, 2008, a constitutional amendment was approved by voters which set up broad parameters for the operations of VLTs and

34 MARYLAND LOTTERY AND GAMING CONTROL AGENCY / Enterprise Fund of the State of Maryland
MARYLAND LOTTERY AND GAMING CONTROL AGENCY
MANAGEMENT’S DISCUSSION AND ANALYSIS
the establishment of five VLT Facility locations (referred to as casinos) in the State. During the 2012 Second Special Session of the Maryland General Assembly, legislation passed, subject to voter referendum, that allowed, among other things, the implementation of table games as well as a sixth casino. During the November 2012 election, voters approved both table games and the sixth casino. The MLGCA is responsible for regulating the operations of the casinos. As of June 30, 2013, there were four casinos operational in the state with 6,830 VLTs and 154 table games.
The MLGCA is accounted for as a proprietary-type enterprise fund using the accrual basis of accounting, similar to a private business entity.
Financial Statements
The financial statements included in this report are: the statements of net position; statements of revenues, expenses, and changes in net position; and statements of cash flows. The statements of net position present the assets and liabilities of the MLGCA with the difference between the two being reported as net position. The statements of revenues, expenses, and changes in net position report the revenues and expenses of the MLGCA and are used to measure the success of its operations for a given period of time as it relates to contributions to the State of Maryland and other government agencies. The statements of cash flows reconcile the changes in cash and cash equivalents with the activities of the MLGCA for the periods presented. The activities are classified as operating, noncapital financing, capital and related financing, and investing.
notes to the Financial Statements
The notes to the financial statements provide additional information that is essential to the full understanding of the data provided in the financial statements. The notes to the financial statements can be found on pages 53 to 72 of this report.
FINANCIAL ANALYSIS Table 1 is a summarized version of the statements of net position as of June 30, 2013, 2012 and 2011. The table reflects the MLGCA’s overall change in financial resources and claims on those resources. The majority of the assets consist of cash held by the State Treasury, investments, accounts receivable and cash and cash equivalents – gaming. The MLGCA’s investments and the majority of accounts receivable, as well as the majority of cash held by the State Treasury, are used to pay lottery winners or are transferred as income to the State of Maryland. The remaining portion of cash held by the State Treasury is gaming revenue that is to be transferred to other State agencies. The majority of the cash and cash equivalents – gaming are the operator license fees that were received from applicants applying for casino licenses. Significant liabilities represent prize awards payables, annuities payable, amounts due to the State of Maryland, amounts due to other government agencies, escrow payables related to gaming and capital lease obligations.
35Comprehensive Annual Financial Report for the Years Ended June 30, 2013 and 2012
MARYLAND LOTTERY AND GAMING CONTROL AGENCY
MANAGEMENT’S DISCUSSION AND ANALYSIS
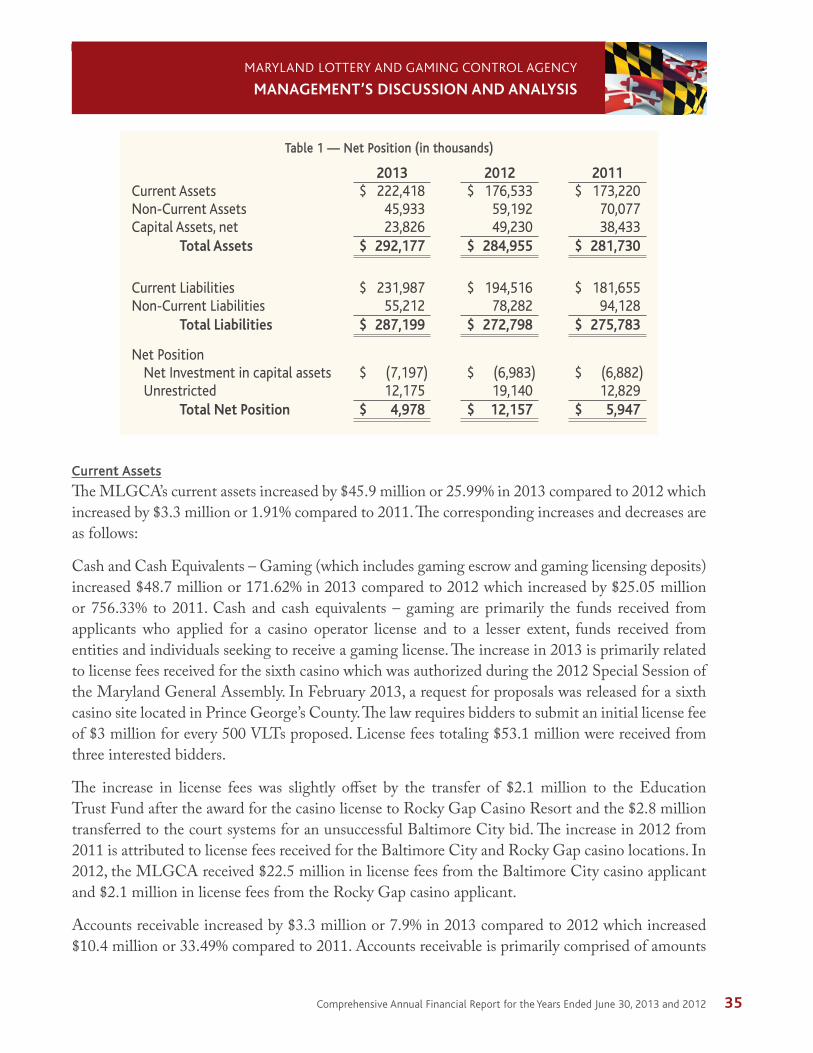
table 1 — net Position (in thousands)
2013 2012 2011current Assets $ 222,418 $ 176,533 $ 173,220non-current Assets 45,933 59,192 70,077capital Assets, net 23,826 49,230 38,433
Total Assets $ 292,177 $ 284,955 $ 281,730
current Liabilities $ 231,987 $ 194,516 $ 181,655non-current Liabilities 55,212 78,282 94,128
Total Liabilities $ 287,199 $ 272,798 $ 275,783
net Positionnet Investment in capital assets $ (7,197) $ (6,983) $ (6,882)unrestricted 12,175 19,140 12,829
Total Net Position $ 4,978 $ 12,157 $ 5,947
current Assets
The MLGCA’s current assets increased by $45.9 million or 25.99% in 2013 compared to 2012 which increased by $3.3 million or 1.91% compared to 2011. The corresponding increases and decreases are as follows:
Cash and Cash Equivalents – Gaming (which includes gaming escrow and gaming licensing deposits) increased $48.7 million or 171.62% in 2013 compared to 2012 which increased by $25.05 million or 756.33% to 2011. Cash and cash equivalents – gaming are primarily the funds received from applicants who applied for a casino operator license and to a lesser extent, funds received from entities and individuals seeking to receive a gaming license. The increase in 2013 is primarily related to license fees received for the sixth casino which was authorized during the 2012 Special Session of the Maryland General Assembly. In February 2013, a request for proposals was released for a sixth casino site located in Prince George’s County. The law requires bidders to submit an initial license fee of $3 million for every 500 VLTs proposed. License fees totaling $53.1 million were received from three interested bidders.
The increase in license fees was slightly offset by the transfer of $2.1 million to the Education Trust Fund after the award for the casino license to Rocky Gap Casino Resort and the $2.8 million transferred to the court systems for an unsuccessful Baltimore City bid. The increase in 2012 from 2011 is attributed to license fees received for the Baltimore City and Rocky Gap casino locations. In 2012, the MLGCA received $22.5 million in license fees from the Baltimore City casino applicant and $2.1 million in license fees from the Rocky Gap casino applicant.
Accounts receivable increased by $3.3 million or 7.9% in 2013 compared to 2012 which increased $10.4 million or 33.49% compared to 2011. Accounts receivable is primarily comprised of amounts

36 MARYLAND LOTTERY AND GAMING CONTROL AGENCY / Enterprise Fund of the State of Maryland
MARYLAND LOTTERY AND GAMING CONTROL AGENCY
MANAGEMENT’S DISCUSSION AND ANALYSIS
current Assets (continued)
due from lottery retailers from the sale of lottery tickets and gross terminal revenue due from the casino operators. Accounts receivable from lottery retailers increased $780,000 or 2.16% in 2013 compared to 2012 which increased $5.6 million or 18.24% as compared to 2011. On a weekly basis, amounts due from retailers are collected electronically from the retailers’ bank accounts. On June 30, 2013, seven days of sales activity were waiting to be collected compared to six days at June 30, 2012 and four days at June 30, 2011.
Accounts receivable from casino operators increased by $2.5 million or 46.28% in 2013 compared to 2012 which increased $4.8 million or 851.11% compared to 2011. On a daily basis, the gross terminal revenue generated by the casinos is wired to the MLGCA. The increase in 2013 was due to four casinos generating revenue on June 30, 2013 compared to three casinos generating revenue on June 30, 2012. Furthermore, seven days of table game revenue was waiting to be transferred at the end of June 2013. The increase in 2012 from 2011 was the result of three casinos generating gross terminal revenue on June 30, 2012 compared to only two casinos on June 30, 2011. In addition, the two casinos in 2011 were much smaller in size.
The increase in current assets was offset by a decrease in cash held with the State Treasury and a decrease in the current portion of investments for annuity payments.
Cash held with the State Treasury decreased by $1.7 million or 1.93% in 2013 compared to 2012 which decreased by $28.9 million or 25.0% compared to 2011. Cash held with the State Treasury primarily represents cash received from lottery agents from the sale of lottery tickets, cash received from casinos for the revenue generated by gaming operations, income waiting to be transferred to the State from the lottery and gaming proceeds, unpaid prizes and unclaimed prizes. Changes in these balances have a corresponding effect on the MLGCA’s cash position. The decrease from 2013 to 2012 is the result of lottery revenue being less in June 2013 than in June 2012. In addition, a law change that took effect on October 2012 allowed casino operators to retain their commissions for operating the casinos. Prior to this change, MLGCA would collect the commissions and transfer them back to the casino operators at the end of each month. The decrease between 2012 and 2011 was due to there being only one month worth of lottery revenue waiting to be transferred at the end of 2012 in comparison to two months at the end of 2011. The decrease was slightly offset by an increased amount of VLT revenue waiting to be transferred. June’s 2012 VLT revenue was higher than June 2011 due to the opening of the third casino.
The current portion of investments for annuity payments decreased by $3.6 million or 21.47% from 2012 which decreased by $4.3 million or 20.20% compared to 2011. The continued decreases during these years resulted from fewer Jackpot winners electing to receive their prize in the form of an annuity compared to the number of annuities that expired.

37Comprehensive Annual Financial Report for the Years Ended June 30, 2013 and 2012
MARYLAND LOTTERY AND GAMING CONTROL AGENCY
MANAGEMENT’S DISCUSSION AND ANALYSIS
non-current Assets
The Lottery’s non-current assets consist of investments for annuity payments, net of current portion and capital assets, net of depreciation and amortization. Non-current assets decreased by $38.7 million or 35.66% in 2013 compared to 2012 which decreased slightly by $88,000 or .08% compared to 2011.
Capital assets, net of depreciation and amortization, decreased by $25.4 million or 51.60% in 2013 compared to 2012 which increased by $10.8 million or 28.09% compared to 2011. The decrease in 2013 is attributed to a full year’s worth of depreciation and amortization for certain VLTs that are treated as capital leases. Under the law, the lottery is required to own or lease the VLTs that are in the casinos. Owned VLTs are capitalized at cost and depreciated over a five-year period. Certain VLTs are leased and are treated as capital leases. These VLTs have a guaranteed lease period ranging from 12 to 18 months and are capitalized at the lower of their fair value or present value of minimum lease payments and are amortized over their guaranteed lease period. The increase in 2012 is attributed primarily to capitalizing the VLTs that met the criteria for capital leases. This increase was offset by a full year’s worth of depreciation and amortization for the VLTs that were purchased for the two casinos that opened in 2011 as well as one month’s amortization for certain VLTs that were leased beginning in June 2012. Details of capital assets, additions and depreciation are included in Note 4 to the financial statements, on page 65.
The Lottery’s investments for annuity payments, net of current portion, decreased by $13.3 million or 22.40% in 2013 as compared to 2012 which decreased by $10.9 million or 15.53% as compared to 2011. These continued decreases resulted from fewer Jackpot winners electing to receive their prize in the form of an annuity compared to the number of annuities that have expired.
current Liabilities
Current liabilities increased by $37.5 million or 19.26% in 2013 compared to 2012 which increased by $12.8 million or 7.08% compared to 2011. The majority of the increase from 2012 to 2013 is attributed to Gaming Escrow Payable and Transfers due Other Government Agencies – VLT.
Gaming Escrow Payable increased by $48 million or 173.65% in 2013 compared to 2012 which increased by $24.6 million or 811.71% compared to 2011. The increase in 2013 was the result of the receipt of casino application fees totaling $53.1 million from three bidders for the sixth casino location in Prince George’s County. The increase was slightly offset by a transfer of $2.1 million to the Education Trust Fund after the award for the Rocky Gap Casino Resort was made and the return of $3 million to an unsuccessful bidder for the Baltimore City casino location. The increase in 2012 from 2011 is attributed to application fees received for the Baltimore City and Rocky Gap casino locations.
Transfers due to other government agencies increased by $9.8 million or 34.83% in 2013 compared to 2012 which increased $20.0 million or 244.28% compared to 2011. This amount represents the June VLT revenue waiting to be transferred to other government agencies. The increase in 2013 is

38 MARYLAND LOTTERY AND GAMING CONTROL AGENCY / Enterprise Fund of the State of Maryland
MARYLAND LOTTERY AND GAMING CONTROL AGENCY
MANAGEMENT’S DISCUSSION AND ANALYSIS
current Liabilities (continued)
attributed to a full month of operation for Maryland Live! Casino (versus a partial month in 2012), the additional casino, Rocky Gap Casino Resort, and the implementation of table games. The increase in 2012 compared to 2011 was attributed to three casinos opened in 2012 compared to two casinos in 2011.
The increases in current liabilities in 2013 were offset primarily by decreases in Transfer due to the State of Maryland General Fund, the current portion of annuity prizes payable and the current portion of capital lease obligations.
Transfer due to the State of Maryland General Fund decreased by $6.8 million in 2013 or 15.68% compared to 2012 which decreased by $38.2 million or 46.94% compared to 2011. The decrease from 2013 to 2012 is attributed to lower revenue in June 2013 than in June 2012. The decrease from 2012 to 2011 is attributed to one month of lottery revenue waiting to be transferred at the end of 2012 in comparison to two months at the end of 2011.
The current portion of annuity prizes payable decreased by $3.2 million or 18.87% in 2013 compared to 2012 which decreased $4.3 million or 20.19% from 2011. The continued decreases in the current portion of annuity prizes payable resulted from fewer Jackpot winners electing to receive their prize in the form of an annuity compared to the number of annuities that have expired.
Current portion of capital lease obligations decreased by $11.8 million or 45.54% in 2013 compared to 2012 which increased by $16 million or 161.59% in 2012 compared to 2011. The decrease in 2013 is attributed to the full year of lease payments of certain VLTs that met the criteria for capital leases. The increase in 2012 was attributed to the lease of certain VLTs that were leased for the casino that opened in June 2012. These machines have a guaranteed lease period ranging from 12 to 18 months and meet the criteria for a capital lease. Machine manufacturers are paid on a monthly basis.
non-current Liabilities
Non-current liabilities decreased by $23.1 million or 29.47% in 2013 compared to 2012 which decreased by $15.8 million or 16.83% compared to 2011. The decreases are primarily attributed to decreases in annuity prizes payable and capital lease obligations, net of current portion.
Annuity prizes payable decreased by $9.5 million or 20.23% in 2013 compared to 2012 which decreased by $11.7 million or 19.99% as compared to 2011. The primary reason for these decreases is fewer Jackpot winners electing to receive their prize in the form of an annuity compared to the number of annuities that expired. A similar decrease in non-current investments for annuity payments is discussed above. Additional information on the MLGCA’s non-current liabilities may be found in Notes 5, 6, and 7 to the financial statements, beginning on page 66.
Capital lease obligations, net of current portion decreased by $13.4 million or 44.19% in 2013 compared to 2012 which decreased $4.7 million or 13.37% compared to 2011. The decreases in both years are attributed primarily to the capital leases recognized for the VLTs leased at the casino

39Comprehensive Annual Financial Report for the Years Ended June 30, 2013 and 2012
MARYLAND LOTTERY AND GAMING CONTROL AGENCY
MANAGEMENT’S DISCUSSION AND ANALYSIS
non-current Liabilities (continued)
that opened in June 2012. These VLTs have a specified lease period of 12 to 18 months making the majority of the payment due current as opposed to non-current.
net Position
Net position decreased by $7.2 million or 59.05% in 2013 compared to 2012 which increased by $6.2 million or 104.41% compared to 2011. Because the MLGCA is required by law to transfer its entire budgetary basis net income to the State of Maryland and its gaming revenue to state government agencies, changes in net position do not reflect the results of the MLGCA’s operating activities. Rather, changes in net position reflect differences between budgetary basis net income and net income in accordance with accounting principles generally accepted in the United States of America and the unclaimed prize fund.
The decrease in net position from 2013 to 2012 is attributed to the decrease in unrestricted assets which consists of unrealized gains or losses on investments, outstanding encumbrances and the unclaimed prize fund. The majority of this decrease is attributed to the loss on investments. The increase in net position in 2012 from 2011 is attributed primarily to the gain on investments.

40 MARYLAND LOTTERY AND GAMING CONTROL AGENCY / Enterprise Fund of the State of Maryland
MARYLAND LOTTERY AND GAMING CONTROL AGENCY
MANAGEMENT’S DISCUSSION AND ANALYSIS
results of operations
Table 2 is a summarized version of the statements of revenues, expenses, and changes in net position for the years ended June 30, 2013, 2012 and 2011.
Table 2 — Revenues, Expenses, and Changes in Net Position (in thousands)
2013 2012 2011Sales
draw games $ 1,270,280 $ 1,288,089 $ 1,220,854Instant games 485,839 506,804 493,548
Total sales 1,756,119 1,794,893 1,714,402
Gaming revenue — Gross terminal revenue 560,679 195,093 103,133Gaming revenue — table Games 48,038 – –Gaming revenue — State Grant 73,691 28,959 9,605Gaming revenue — Facility Applicants 2,704 1,791 1,342Gaming revenue — terminal Assessment 2,964 1,709 –
Total Revenue 2,444,195 2,022,445 1,828,482
cost of sales 1,409,998 1,274,624 1,202,399
Gross profit 1,034,197 747,821 663,348
operating expenses 114,663 56,365 51,576
Income from operations 919,534 691,457 574,507
non-operating expensesunrealized gain (loss) on investments (4,232) 811 (3,785)Interest expense (720) (911) (120)Interest income - – 7Payments to State of Maryland General Fund and Stadium Authority
(545,225)
(556,265)
(519,394)
Payments to other Government Funds — Gaming (376,536) (128,881) (67,225)
Total non-operating expenses (926,713) (685,246) (590,517)
Change in Net Position (7,179) 6,210 (16,010)
total net Position — beginning of year 12,157 5,947 21,957
Total Net Position — end of year $ 4,978 $ 12,157 $ 5,947

41Comprehensive Annual Financial Report for the Years Ended June 30, 2013 and 2012
MARYLAND LOTTERY AND GAMING CONTROL AGENCY
MANAGEMENT’S DISCUSSION AND ANALYSIS
Sales
Net sales were $1.756 billion, a decrease of $38.8 million or 2.16% as compared to 2012, which increased $80.5 million or 4.69% as compared to 2011.
Lottery sales are categorized as draw or instant games. Draw games are further categorized as Numbers, Monitor or Matrix games.
Draw games sales decreased $17.8 million or 1.38% in 2013 as compared to 2012, which increased by $67.23 million or 5.51% as compared to 2011. In 2013, sales decreases occurred in both Number games and Monitor games while Matrix games increased. In 2012, growth occurred in all draw game categories with the most significant growth occurring in the Matrix game category. In 2011, the growth in draw games sales was attributable to the Monitor and Numbers games which was offset by a slight decline in Matrix games as shown in Table 3.
table 3 — net Sales of draw Games (in thousands)
2013 2012 2011
numbers $ 513,323 $ 520,135 $ 515,463
Monitor 493,570 521,673 496,731
Matrix 263,387 246,280 208,660
Total $ 1,270,280 $ 1,288,089 $ 1,220,854
Sales for the Numbers games, which are Pick 3 and Pick 4, decreased by $6.8 million or 1.31% in 2013 as compared to 2012, which increased by $4.7 million or .91% as compared to 2011. Pick 4 sales increased in both 2013 and 2012 by $2.3 million or .85% and $10.9 million or 4.28%, respectively whereas Pick 3 sales decreased in both 2013 and 2012 by $9.0 million or 3.56% and $6.2 million or 2.39%, respectively. The increase in Pick 4 sales and the continued decrease in Pick 3 sales can be attributed to the top prize offered in these games. The top prize for Pick 3 is $500, whereas the top prize for Pick 4 is $5,000. It is further believed that the continued decrease in Pick 3 may be the result of the continued growth in Racetrax® sales. Racetrax® offers a trifecta bet that plays like Pick 3 but has better odds of winning.
Sales for the Monitor games, which include Keno, Keno Bonus, Keno Super Bonus, Racetrax®, and Racetrax® Bonus decreased by $28.1 million or 5.39% in 2013 as compared to 2012 which increased by $24.9 million in 2012 or 5.02% as compared to 2011. Keno games decreased by $42.6 million or 11% in 2013 as compared to 2012, which increased by $6.8 million or 1.80% as compared to 2011. It is believed that the decrease in the Keno games may be attributed to the opening of the Maryland Live! Casino in June 2012.
The decrease in the Keno games was offset by the continued increase in the Racetrax® games. Racetrax® games increased by $14.5 million or 10.8% in 2013 as compared to 2012, which increased

42 MARYLAND LOTTERY AND GAMING CONTROL AGENCY / Enterprise Fund of the State of Maryland
MARYLAND LOTTERY AND GAMING CONTROL AGENCY
MANAGEMENT’S DISCUSSION AND ANALYSIS
Sales (continued)
by $18.1 million or 15.58% as compared to 2011. This game continues to grow as it is fast action and offers a trifecta which is attractive to numbers players.
Sales for Matrix games, which includes Powerball and Power Play, Mega Millions and Megaplier, Bonus Match 5, Multi-Match, and 5 Card Cash increased by $17.1 million or 6.95% in 2013 compared to 2012, which increased by $37.6 million or 18.03% as compared to 2011.
Of all the Matrix games, Powerball, combined with Power Play, was the only game that showed growth over 2012. Powerball and Power Play sales increased by $48.5 million or 58.52% in 2013 compared to 2012, which increased $25.1 million or 43.58% compared to 2011. The growth in 2013 can be attributed to the Jackpot rolling in excess of $100 million six times. Two of these times, the Jackpot reached $550 million and $600 million, respectively. The majority of the growth in 2012 over 2011 can be attributed to the game changes. In January 2012, the cost of the Powerball game went from $1 to $2. As a result of the price increase, the starting Jackpot went from $20 million to $40 million, the odds of winning the Jackpot changed to 1:175 million from 1:195 million and the prize for matching the five white balls increased from $200,000 to $1 million.
Sales of Mega Millions, combined with Megaplier, decreased by $39.8 million or 35.93% in 2013 compared to 2012, which increased by $9.2 million or 9.09% in 2012. The decrease in 2013 is attributed to the lack of high Jackpots in comparison to Powerball. During 2013, the Mega Millions Jackpot only rolled in excess of $100 million two times with the highest Jackpot reaching only $190 million. The increase in 2012 over 2011 is attributed to the Jackpot rolling a total of 18 times between January 27, 2012, and March 30, 2012, to set a world record Jackpot of $656 million.
Bonus Match 5 sales decreased by $788,000 or 3.61% in 2013 compared to 2012, which increased by $478,000 or 2.23% compared to 2011. Multi-Match sales decreased by $2 million or 6.36% in 2013 compared to 2012, which increased by $2.8 million or 9.88% compared to 2011. The increases/decreases in Multi-Match between the years are attributed to Jackpot amounts. Multi-Match Jackpots in 2013 were lower than in 2012, which were higher than in 2011.
In November 2012, a new game, 5 Card Cash was launched. 5 Card Cash is two draw games in one. It is based on a standard poker game using a 52 card playing deck and has both an instant win feature as well as a nightly drawing. For $2, the player receives five randomly selected cards. If the cards show a poker hand of jacks or better, the player wins instantly. In addition, there is a nightly drawing where five cards are drawn and players win by matching 2, 3, 4 or 5 of the cards in the same suit and rank. Sales for this game in 2013 totaled $11.2 million.
Instant games are the second category of lottery game offered to the public. Instant game sales decreased by $21 million or 4.14% in 2013 as compared to 2012, which increased by $13.3 million or 2.69% as compared to 2011 as shown in Table 4. It is believed that the decrease in instant game sales can be attributed to the Federal sequestration and the opening of the casinos. Since Maryland has such a large number of government workers, it is believed that the Federal sequestration significantly

43Comprehensive Annual Financial Report for the Years Ended June 30, 2013 and 2012
MARYLAND LOTTERY AND GAMING CONTROL AGENCY
MANAGEMENT’S DISCUSSION AND ANALYSIS
Sales (continued)
affected the discretionary income of instant ticket players. It is also believed that the opening of all of the casinos has affected instant ticket sales as the casinos offer instant gratification and provide a greater entertainment value. The increase in instant ticket sales in 2012 can be attributed to a change in the MLGCA’s strategy for instant ticket launches. During 2012, the MLGCA increased the print run of the instant tickets and concentrated on producing more $5 price point tickets. The majority of the growth in 2012 occurred in the $5 price point tickets.
table 4 — net Sales of Instant Games by Price Point (in thousands)
2013 2012 2011$1 $ 28,406 $ 31,879 $ 38,541$2 47,443 46,444 51,880$3 40,532 44,889 44,970$5 191,378 209,574 191,775$10 115,902 109,107 100,725$20 62,178 64,911 65,657Total $ 485,839 $ 506,804 $ 493,548
The following graph depicts the MLGCA’s on-line and instant sales for 2013, 2012, and 2011. Keno, Keno Bonus and Keno Super Bonus sales (labeled as Keno for the chart below) have been combined as have Racetrax® and Racetrax® Bonus sales (labeled as Racetrax for the chart below), Mega Millions and Megaplier (labeled as Mega Millions for the chart below), and Powerball and Power Play (labeled as Powerball for the chart below).
Sales — Fiscal years 2013, 2012 and 2011
Sale
s (in
mill
ions
)
0
100
200
300
400
500
600
2011
2012
2013
Pick 3 Pick 4 MegaMillions®
Multi-Match®Powerball® BonusMatch 5
Keno Racetrax® Instant5 Card Cash

44 MARYLAND LOTTERY AND GAMING CONTROL AGENCY / Enterprise Fund of the State of Maryland
MARYLAND LOTTERY AND GAMING CONTROL AGENCY
MANAGEMENT’S DISCUSSION AND ANALYSIS
Gaming revenue — Gross Video Lottery terminal revenue, table Game revenue, State Grant, Facility Applicants Fees and Gaming Assessment
Gaming Revenue – Gross Terminal Revenue (GTR) represents the revenue generated by the VLTs net of total payouts. Gross Terminal Revenue in 2013 totaled $560.7 million, an increase of $365.6 million or 187.3% over 2012, which increased $92.0 million or 89.17% over 2011. The increase in 2013 is attributed to a full year of operation for the Maryland Live! Casino and, to a lesser extent, the opening of the Rocky Gap Casino Resort on May 22, 2013. The overall increase in 2013 was slightly offset by a decrease in revenue at the Hollywood Casino – Perryville. The decrease in 2013 at the Hollywood Casino – Perryville can also be attributed to the opening of the Maryland Live! Casino which offers more VLTs and is located in the Baltimore Metropolitan area. The increase from 2011 to 2012 is attributed to a full year of operation for both the Hollywood Casino – Perryville and the Casino at Ocean Downs and the opening of the Maryland Live! Casino in June 2012. The following table shows VLT statistics for the casinos.
table 5 — Gross terminal revenue Statistics
Casinos Date Opened
Number of Machines as of June 30, 2013
2013 GTR (in millions)
2012 GTR (in millions)
2011 GTR (in millions)
Hollywood casino —Perryville
September 27, 2010 1,158 $ 76.0 $ 118.1 $ 82.7
casino at ocean downs January 4, 2011 800 50.5 48.0 20.4
Maryland Live! casino June 6, 2012 4,314 431.4 29.0 –
rocky Gap casino resort May 22, 2013 558 2.8 – –
Total 6,830 $ 560.7 $ 195.1 $ 103.1
Table Game Revenue — During the 2012 Second Special Session of the Maryland General Assembly, legislation was passed, subject to voter referendum, that authorized table games at the casinos. During the November 2012 election, voters ratified the legislation and table games debuted in March 2013. Table game revenue generated in 2013 totaled $48 million. The following table shows table game statistics for the casinos.
table 6 — table Game revenue Statistics
CasinosDate Tables
Debuted
Number of Tables as of
June 30, 2013
Table Games Revenue 2013 (in millions)
Hollywood casino — Perryville March 6, 2013 22 $ 6.0
Maryland Live! casino April 11, 2013 122 41.6
rocky Gap casino resort May 22, 2013 10 0.4
casino at ocean downs – – –
Total 154 $ 48.0

45Comprehensive Annual Financial Report for the Years Ended June 30, 2013 and 2012
MARYLAND LOTTERY AND GAMING CONTROL AGENCY
MANAGEMENT’S DISCUSSION AND ANALYSIS
Gaming revenue — Gross Video Lottery terminal revenue, table Game revenue, State Grant, Facility Applicants Fees and Gaming Assessment (continued)
For the gaming operations, the Gross Terminal Revenue is required to be transferred to specified Government agencies to be used for certain purposes or is retained by the casinos and the MLGCA to assist in covering the costs of the operations. The MLGCA retains 2% of the Gross Terminal Revenue to help fund the gaming operations. All casinos, with the exception of the Rocky Gap Casino Resort, retain 33% of the Gross Terminal Revenue. Rocky Gap Casino Resort retains 50% of the Gross Terminal Revenue. For Table Game revenue, 20% of the revenue is required to be transferred to the Education Trust Fund and the remaining 80% is retained by the casino operators. The table below shows the overall disbursements and allocations.
table 7 — 2011 through 2013 Gaming revenue disbursements/Allocations
Fund2013
Disbursements2012
Disbursements2011
DisbursementsMaryland education trust Fund $ 284.5 $ 94.6 $ 49.9casino operators 223.9 64.4 34.0Horse Purse dedication 39.1 13.7 7.2Local Impact Grants 30.8 10.7 5.7race tracks Facility renewal Accounts 10.8 4.9 2.6Maryland Lottery and Gaming control Agency 11.2 3.9 2.1Small, Minority and Women-owned Business 8.4 2.9 1.6Total $ 608.7 $ 195.1 $ 103.1
Gaming Revenue – State Grant represents funds received from the State of Maryland to help pay for the costs of the gaming operations. Gaming Revenue State Grant increased by $44.7 million or 154.46% in 2013 compared to 2012, which increased $19.35 million or 201.50% compared to 2011. The increase in both 2013 and 2012 is due to the increased funding needed to pay for the maintenance, purchase and leasing of the VLTs. In 2013, a full year’s worth of funding was needed to pay for the machines at Maryland Live! Casino in comparison to one month’s worth of funding in 2012. The increase in 2012 from 2011 was the result of a full year’s worth of funding for both Hollywood Casino – Perryville and The Casino at Ocean Downs, whereas in 2011 only a partial year’s worth of funding was needed for both casinos.
Facility Applicant Fees represents money received to perform background investigations on applicants who have applied for a gaming license. Facility Applicant Fees increased by $912,000 or 50.95% in 2013 compared to 2012 which increased by $450,000 or 33.5% in 2012 compared to 2011. The increase in 2013 is attributed to the debut of table games at three of the casinos which required the hiring of additional casino staff, the opening of the Rocky Gap Casino Resort in May 2013 and the turnover experienced at all of the casinos. The increase in 2012 from 2011 was attributed to the opening of Maryland Live! Casino.

46 MARYLAND LOTTERY AND GAMING CONTROL AGENCY / Enterprise Fund of the State of Maryland
MARYLAND LOTTERY AND GAMING CONTROL AGENCY
MANAGEMENT’S DISCUSSION AND ANALYSIS
Gaming revenue — Gross Video Lottery terminal revenue, table Game revenue, State Grant, Facility Applicants Fees and Gaming Assessment (continued)
Gaming Assessments represents assessments made to casino operators based on the maximum number of VLTs on the floor during the fiscal year and the number of table games on the floor as of the end of the fiscal year. In accordance with the law, casino operators are assessed a yearly fee of $425 per VLT and $500 per table. These funds are collected by the MLGCA and subsequently remitted to the Department of Health and Mental Hygiene’s Problem Gambling Fund. Gaming Assessments increased by $1.3 million or 73.46% in 2013 compared to 2012. The increase in 2013 is due to more VLTs in service in 2013 and the implementation of table games.
cost of Sales
Cost of sales consists of lottery prize expense, lottery retailer commissions, casino operator commissions, costs paid to vendors to operate and maintain the lottery system and the gaming system, and costs paid for the printing and delivery of instant games. In 2013, the MLGCA reclassified commissions paid to casino operators from operational expenses to cost of sales. As such, costs of sales have been restated for 2012 and 2011 to reflect this change.
Cost of sales increased by $135.4 million or 10.62% in 2013 compared to 2012 which increased $72.2 million or 6.01% compared to 2011. The increase in 2013 is primarily attributed to the increase in casino operator commissions. Commission paid to casino operators increased by $159.5 million or 247.82% in 2013 compared to 2012 which increased by $30.3 million or 89.17% compared to 2011. The increase in 2013 in casino operator commissions is primarily attributed to a full year of operation of the Maryland Live! Casino versus less than a full month of operation in 2012. To a lesser extent, the 2013 increase is the result of the opening of the Rocky Gap Casino Resort in May 2013 and the implementation of table games. The increase in 2012 from 2011 is the result of a full year of operation for both Hollywood Casino – Perryville and the Casino at Ocean Downs as well as a partial month of operation for the Maryland Live! Casino.
Commissions paid to lottery retailers increased by $1.5 million or 1.25% in 2013 compared to 2012 which increased $4.6 million or 4.06% compared to 2011. Typically, increases and decreases in commission are a function of sales as retailers receive a percentage of all tickets sold and cashed at their location. Although sales decreased in 2013, commission paid to retailers increased as a result of a change in the commission fees earned. In January 2013, sales commission earned by retailers increased from 5% to 5 ½%. The increase in 2012 from 2011 is attributed to the overall increase in sales from 2011 to 2012.
The increase in cost of sales is partially offset by a decrease in prize expense in 2013. Prize expense decreased by $27.2 million or 2.55% in 2013 compared to 2012 which increased by $36.6 million or 3.56% from 2011. There is a direct correlation between prize expense and sales. As such, the decrease in 2013 is the direct result of the decrease in sales, whereas the increase in 2012 is the direct result of an increase in sales.

47Comprehensive Annual Financial Report for the Years Ended June 30, 2013 and 2012
MARYLAND LOTTERY AND GAMING CONTROL AGENCY
MANAGEMENT’S DISCUSSION AND ANALYSIS
operating expenses
Operating expenses increased by $58.3 million or 103.43% in 2013 compared to 2012 which decreased $4.8 million or 9.29% compared to 2011. In 2013, the MLGCA reclassified casino operator commissions from operating expenses to costs of sales. As such the statements have been restated to reflect this change.
Fluctuations in operating expenses are primarily due to changes in the MLGCA’s budgetary appropriation or the timing of liquidating prior year encumbrances. While lottery operating expenses and encumbrances have remained relatively stable for the past several years, the operating expenses of the gaming program increased significantly in 2013, 2012 and 2011. Administrative Expenses – Gaming increased by $63.8 million or 268.29% in 2013 compared to 2012 which increased by $14.1 million or 146.30% compared to 2011. The increase in 2013 is attributed primarily to a full year of lease payments on the VLTs at the Maryland Live! Casino versus a partial month payment in 2012. The increase in 2012 from 2011 is the result of a full year of payments made for the maintenance, lease and purchase of the VLTs at the Hollywood Casino – Perryville and the Casino at Ocean Downs versus a partial year of payments in 2011.
Depreciation and amortization also contributed to the increase in the total operating expenses. Depreciation and amortization increased by $14.6 million or 134.85% in 2013 compared to 2012 which increased $3.6 million or 49.06% compared to 2011. The increase in 2013 is primarily attributed to a full year’s worth of amortization for certain leased VLTs compared to a partial month of amortization in 2012. These VLTs had a minimum lease period of either 12 or 18 months. The increase in 2012 from 2011 is attributed to a full year’s worth of depreciation for the VLTs purchased in 2011 and one month’s worth of amortization for certain VLTs leased at the casino that opened in June 2012.
non-operating expenses
Non-operating expenses increased by $241.5 million or 35.24% in 2013 compared to 2012 which increased $94.7 million or 16.04% compared to 2011. Non-operating expenses primarily consist of unrealized gains and losses on investments held to fund obligations to annuitants and payments to the State of Maryland General Fund, the Stadium Authority and Other Government Agencies.
The MLGCA expects to realize the face value of its investments, since it intends to hold these investments until maturity. Therefore, any interim unrealized gains or losses on investments will reverse. The change in fair value of the investments held by the MLGCA is discussed in more detail beginning on page 63.
The MLGCA is required by State law to transfer its budgetary basis net income to the State of Maryland (General Fund and Stadium Authority) from its lottery operations. Furthermore, it is required to transfer revenue from its gaming operations to various government agencies. Accordingly, the MLGCA’s success can be measured by the income it transfers.
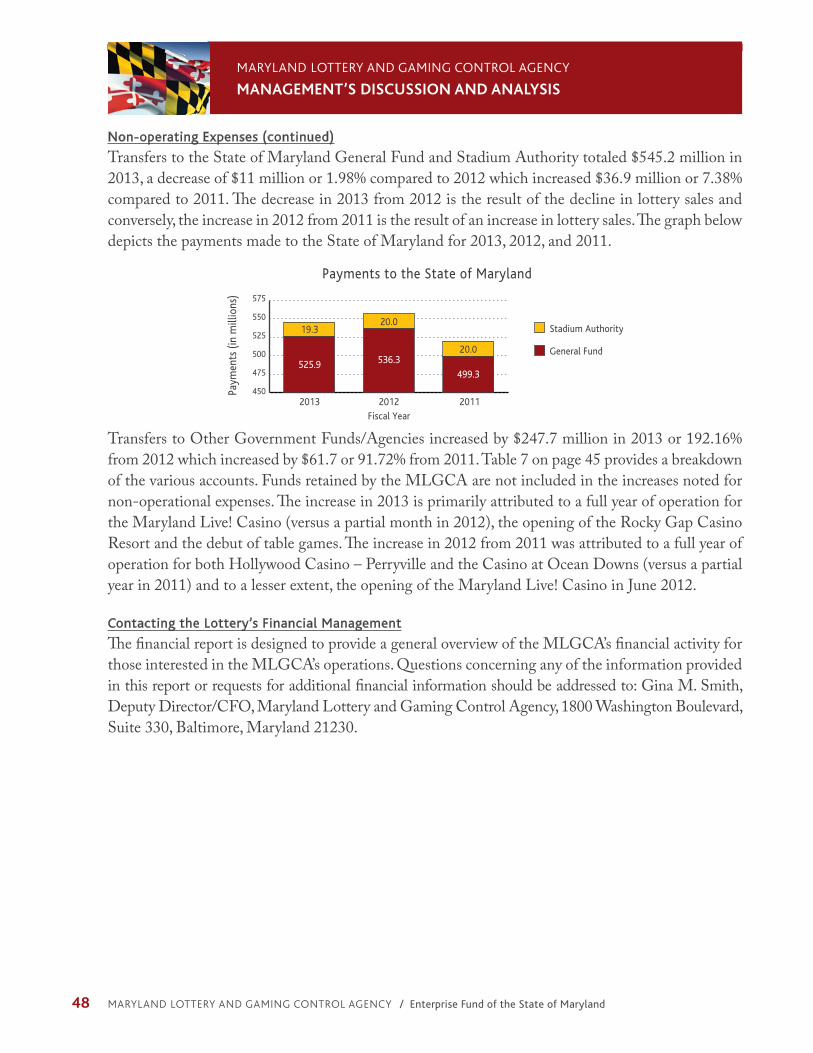
48 MARYLAND LOTTERY AND GAMING CONTROL AGENCY / Enterprise Fund of the State of Maryland
MARYLAND LOTTERY AND GAMING CONTROL AGENCY
MANAGEMENT’S DISCUSSION AND ANALYSIS
non-operating expenses (continued)
Transfers to the State of Maryland General Fund and Stadium Authority totaled $545.2 million in 2013, a decrease of $11 million or 1.98% compared to 2012 which increased $36.9 million or 7.38% compared to 2011. The decrease in 2013 from 2012 is the result of the decline in lottery sales and conversely, the increase in 2012 from 2011 is the result of an increase in lottery sales. The graph below depicts the payments made to the State of Maryland for 2013, 2012, and 2011.
2011
Paym
ents
(in
mill
ions
)
General Fund
Fiscal Year20122013
Stadium Authority
450
475
500
525
550
575
20.0
499.3
20.0
536.3
19.3
525.9
Payments to the State of Maryland
Transfers to Other Government Funds/Agencies increased by $247.7 million in 2013 or 192.16% from 2012 which increased by $61.7 or 91.72% from 2011. Table 7 on page 45 provides a breakdown of the various accounts. Funds retained by the MLGCA are not included in the increases noted for non-operational expenses. The increase in 2013 is primarily attributed to a full year of operation for the Maryland Live! Casino (versus a partial month in 2012), the opening of the Rocky Gap Casino Resort and the debut of table games. The increase in 2012 from 2011 was attributed to a full year of operation for both Hollywood Casino – Perryville and the Casino at Ocean Downs (versus a partial year in 2011) and to a lesser extent, the opening of the Maryland Live! Casino in June 2012.
contacting the Lottery’s Financial Management
The financial report is designed to provide a general overview of the MLGCA’s financial activity for those interested in the MLGCA’s operations. Questions concerning any of the information provided in this report or requests for additional financial information should be addressed to: Gina M. Smith, Deputy Director/CFO, Maryland Lottery and Gaming Control Agency, 1800 Washington Boulevard, Suite 330, Baltimore, Maryland 21230.

49Comprehensive Annual Financial Report for the Years Ended June 30, 2013 and 2012
MARYLAND LOTTERY AND GAMING CONTROL AGENCY
STATEMENTS OF NET POSITION
As of June 302013 2012
Assets:current assets:
cash and cash equivalents $ 2,267,343 $ 3,024,180cash and cash equivalents — Gaming 75,616,457 27,633,026cash and cash equivalents — restricted — Gaming Licensing deposits 1,324,050 605,632cash and cash equivalents — Agent 103,550 125,703cash held with State treasury 84,922,096 86,593,206Accounts receivable — Lottery 36,834,692 36,054,797Accounts receivable — Gaming 7,916,886 5,412,100Prepaid commissions 43,599 35,106
current portion of investments for annuity payments 13,388,987 17,049,540total current assets 222,417,660 176,533,290
non-current assets:capital assets, net of accumulated depreciation and amortization 23,826,160 49,229,808Investments for annuity payments, net of current portion 45,933,461 59,192,221
total non-current assets 69,759,621 108,422,029total assets $ 292,177,281 $ 284,955,319
Liabilities and net Assets:current liabilities:
current portion of annuity prizes payable $ 13,388,987 $ 16,453,027 current portion of employee related payables 1,789,144 1,473,326 current portion of capital lease obligation 14,110,640 25,909,450 transfer due to State of Maryland General Fund 36,447,376 43,226,579 transfer due to other Government Agencies — Gaming 38,052,948 28,222,797 Prize awards payable 41,094,928 42,818,322 Accounts payable and accrued expenses 2,884,080 3,150,247 Accounts payable and accrued expenses — Gaming 4,155,859 1,589,418 Gaming Licensing deposits 1,152,763 396,259 Gaming escrow Payable 75,616,457 27,633,026 Agent escrow Payable 103,550 125,703 unearned revenue 2,362,764 2,684,438 taxes and other liabilities 827,337 833,184
total current liabilities 231,986,833 194,515,776
non-current liabilities:Annuity prizes payable, net of current portion 37,783,258 47,406,876 employee related payables, net of current portion 516,299 571,773 capital lease obligation, net of current portion 16,912,542 30,303,350
total non-current liabilities 55,212,099 78,281,999 total liabilities $ 287,198,932 $ 272,797,775
net Position:net investment in capital Assets $ (7,197,022) $ (6,982,992)unrestricted 12,175,371 19,140,536
total net position 4,978,349 12,157,544 total liabilities and net position $ 292,177,281 $ 284,955,319
The accompanying notes are an integral part of these financial statements.

50 MARYLAND LOTTERY AND GAMING CONTROL AGENCY / Enterprise Fund of the State of Maryland
MARYLAND LOTTERY AND GAMING CONTROL AGENCY
STATEMENTS OF REVENUES, ExPENSES AND CHANGES IN NET POSITION
Years ended June 30
2013 2012Sales:
draw games $ 1,270,280,595 $ 1,288,088,749 Instant games 485,838,672 506,803,706
total Sales 1,756,119,267 1,794,892,455 Gaming revenue — Gross terminal revenue 560,679,031 195,093,073 Gaming revenue — State Grant 73,690,820 28,959,177 Gaming revenue — table Games 48,037,794 - Gaming revenue — Facility Applicants 2,703,989 1,791,260 Gaming revenue — Machine Assessments 2,964,174 1,708,825
total revenue 2,444,195,075 2,022,444,790
cost of sales:Prize expense 1,038,475,788 1,065,653,665 retailer commissions 119,788,227 118,305,427 casino commissions 223,930,473 64,380,714 Gaming vendor and data processing fees 21,368,102 20,077,153Instant ticket printing and delivery 6,435,341 6,206,543
total cost of Sales 1,409,997,931 1,274,623,502
Gross Profit 1,034,197,144 747,821,288
operating expenses:Salaries, wages and benefits 16,929,270 15,662,232 Advertising and promotions 13,297,155 12,592,589 depreciation and amortization 25,403,648 10,817,070 other general and administrative expenses 59,032,711 17,293,017
total operating expenses 114,662,784 56,364,908
Income from operations 919,534,360 691,456,380
non-operating revenues (expenses):Investment revenue (loss) (640,822) 5,438,482Amortization of discount for annuity prize liabilities (3,590,833) (4,627,389)Interest expense (719,832) (911,404)Payments to State of Maryland General Fund (525,960,121) (536,264,804)Payments to State of Maryland Stadium Authority (19,265,000) (20,000,000)Payments to other Governmental Funds/Agencies — Gaming (376,536,947) (128,881,213)
total non-operating expenses (926,713,555) (685,246,328)
change in net Position (7,179,195) 6,210,052
total net Assets — Beginning of year 12,157,544 5,947,492total net Assets — end of year $ 4,978,349 $ 12,157,544
The accompanying notes are an integral part of these financial statements.

51Comprehensive Annual Financial Report for the Years Ended June 30, 2013 and 2012
MARYLAND LOTTERY AND GAMING CONTROL AGENCY
STATEMENTS OF CASH FLOWS
Years ended June 302013 2012
cash flows from operating activities:receipts from customers $ 2,489,218,420 $ 2,037,011,327Payments to suppliers (96,022,934) (61,320,753)Payments to employees (20,928,539) (12,382,245)Payments to agents (341,242,754) (184,179,986)Prize payments/awards to players (1,039,420,519) (1,067,073,409)
net cash and cash equivalents provided by operating activities
991,603,674 712,054,934
cash flows from noncapital financing activities:transfers to the State of Maryland General Fund
and Stadium Authority (552,005,563) (594,497,091)transfers to other Government Funds/Agencies — Gaming (366,276,348) (108,856,144)transfers from VLt Special Fund to General Fund (376,061) 361,890Prize payments/awards (17,062,994) (21,379,996)
net cash and cash equivalents used in noncapital financing activities
(935,720,966) (724,371,341)
cash flows from capital and related financing activities:Payments of capital lease obligations (25,189,618) (10,286,806)Interest payments (719,832) (796,621)
net cash and cash equivalents used in capital and related financing activities
(25,909,450) (11,083,427)
cash flows from investing activities:coupon bonds purchased (784,505) (742,734)Proceeds from matured annuities and bonds 17,062,996 21,379,996
net cash and cash equivalents provided by investing activities
16,278,491 20,637,262
net increase (decrease) in cash and cash equivalents 46,251,749 (2,762,572)
cash and cash equivalents, beginning of year 117,981,747 120,744,319cash and cash equivalents, end of year $ 164,233,496 $ 117,981,747
noncash investing and financing activities:Acquisition of equipment through capital lease $ - $ 21,613,167change in fair value of investments $ (4,231,655) $ 811,093

52 MARYLAND LOTTERY AND GAMING CONTROL AGENCY / Enterprise Fund of the State of Maryland
MARYLAND LOTTERY AND GAMING CONTROL AGENCY
STATEMENTS TO CASH FLOWS (CONTINUED)
Years ended June 30
2013 2012reconciliation of operating income to net cash and
cash equivalents provided by operating activities:
operating income $ $919,534,360 $ 691,456,380
Adjustments to reconcile operating income to net cash and cash equivalents provided by operating activities:
depreciation and amortization 25,403,648 10,817,070deferred prize payments 784,505 742,734due to dHMH Problem Gambling Program - (1,708,825)
effect of changes in operating assets and liabilities:Accounts receivable (3,284,681) (10,403,994)Prepaid commissions (8,493) 13,577Accounts payable and accrued expenses 50,964,996 23,258,832employee related payables 260,344 243,228taxes and other liabilities (5,847) 461,344Prize awards payable (1,723,394) (2,629,135)unearned revenue (321,764) (196,277)
net cash and cash equivalents provided by operating activities
$ 991,603,674 $ 712,054,934
The accompanying notes are an integral part of these financial statements.

53Comprehensive Annual Financial Report for the Years Ended June 30, 2013 and 2012
MARYLAND LOTTERY AND GAMING CONTROL AGENCY
NOTES TO FINANCIAL STATEMENTS
1. SUMMARY OF SIGNIFICANT ACCOUNTING POLICIES
LeGISLAtIVe enActMentThe Maryland Lottery and Gaming Control Agency (MLGCA) was established by the Maryland General Assembly enactment of Chapter 365 of Laws of Maryland of 1972, and the voters’ approval that same year of a constitutional amendment to allow the lottery. The amendment was ratified on November 7, 1972, and the MLGCA commenced operations on January 2, 1973.
The mandate of the law was to establish a State-operated lottery, under the immediate supervision of a Director and the guidance of a Commission, for the purpose of producing revenue for the State. The Governor, with the advice and consent of the Senate of Maryland, appoints the Director and the Commission members.
During the 2007 special session of the Maryland General Assembly, Chapter 4 was enacted relating to the legalization of video lottery terminals (VLTs) in the State subject to the passage of a voters’ constitutional referendum. In 2008, voters approved the installation of up to 15,000 VLTs at five privately owned casinos at specified locations throughout the State.
On August 14, 2012, Senate Bill 1 – Gaming Expansion – Video Lottery Terminals and Table Games passed the 2012 Second Special Session of the Maryland General Assembly. This bill contained many provisions concerning gaming operations and certain provisions that were subject to voter referendum. The provisions which were subject to voter referendum passed during the November 6, 2012 election and allowed for a sixth casino at a site in Prince George’s County, increased the maximum number of video lottery terminals allowed in the State from 15,000 to 16,500, established table games and allowed for 24-7 operations.
The MLGCA, in conjunction with its Commission, serves as the regulator of the gaming program and is responsible for regulating the casinos, licensing the casino operators and all other entities and individuals requiring a gaming license, the purchase or lease of all VLTs and the collection and disbursement of VLT gross terminal revenue and table game revenue in accordance with the law.
The MLGCA is a part of the primary government of the State of Maryland and is reported as a proprietary fund and business-type activity within the State of Maryland’s financial statements. The State of Maryland prepares a comprehensive annual financial report (CAFR). The MLGCA is an enterprise fund of the State of Maryland and is included in the basic financial statements of the CAFR of the State of Maryland.
BASIS oF AccountInG And PreSentAtIonThe MLGCA is accounted for as a proprietary special purpose government fund engaged in business-type activities. In accordance with Governmental Accounting Standards Board (GASB) Statement No. 34, Basic Financial Statements and Management’s Discussion and Analysis for State and Local Governments, and with accounting principles generally accepted in the United States of America,

54 MARYLAND LOTTERY AND GAMING CONTROL AGENCY / Enterprise Fund of the State of Maryland
MARYLAND LOTTERY AND GAMING CONTROL AGENCY
NOTES TO FINANCIAL STATEMENTS
1. SUMMARY OF SIGNIFICANT ACCOUNTING POLICIES (CONTINUED)the financial statements are prepared on the accrual basis of accounting which requires recognition of revenue when earned and expenses when incurred. As permitted by GASB No. 62, Codification of Accounting and Financial Reporting Guidance Contained in Pre-November 30, 1989 FASB and AICPA Pronouncements, the MLGCA has elected to not adopt Financial Accounting Standard Board (FASB) statements and interpretations issued after November 30, 1989, unless the GASB specifically adopts such FASB statements or interpretations.
uSe oF eStIMAteSThe preparation of financial statements in conformity with accounting principles generally accepted in the United States of America requires management to make estimates and assumptions that affect the reported amounts in the financial statements and accompanying notes. Actual results may differ from those estimates.
Lottery GAMeS — reVenue recoGnItIon And PrIze oBLIGAtIonSRevenue from lottery games originates from two product lines: draw games and instant games. The MLGCA develops multiple game themes and prize structures to comply with its enabling legislation and customer demand. Independent and corporate retailers comprised principally of grocery and convenience stores, package goods stores, and restaurants serve as the primary distribution channel for draw and instant lottery sales. Retailers also cash winning tickets up to certain dollar amounts. Prior to January 1, 2013, retailers earned a 5% sales commission. Effective January 1, 2013, the sales commission increased to 5 ½%. For the years ended June 30, 2013 and 2012, retailers received a cashing commission of 3% of prizes redeemed in their establishment.
Licensed lottery agents sell draw game lottery tickets to the public through the use of computerized terminals. Draw games are categorized as: Numbers (Pick 3 and Pick 4), Matrix (Multi-Match, Mega Millions/Megaplier, Powerball/Power Play, Bonus Match 5 and 5 Card Cash) and Monitors (Keno, Keno Bonus®, Keno Super Bonus, Racetrax® and Racetrax® Bonus). Draw revenue is recognized in the month in which the related drawings are held. Revenue from the sale of tickets and commissions paid for future drawings is deferred until the drawings are held and is reported as unearned revenue on the accompanying statements of net position. Revenue from instant games is recognized when the retailer activates the book of tickets.
Prize obligations for draw games are determined and recognized after each drawing is held. For all draw games, winners are paid a certain amount depending upon the number of winners and the order of the winning numbers drawn. The Multi-Match, Mega Millions and Powerball Jackpots are calculated as a percentage of total game revenue. If there is not a Jackpot winner, the prize pool is carried forward until there is a winner. The remaining Multi-Match, Mega Millions and Powerball prize levels are based on a predetermined set amount. Prize obligations are recognized monthly for instant games based on the books activated by retailers and the related prize expense based on the specific game’s prize structure.

55Comprehensive Annual Financial Report for the Years Ended June 30, 2013 and 2012
MARYLAND LOTTERY AND GAMING CONTROL AGENCY
NOTES TO FINANCIAL STATEMENTS
1. SUMMARY OF SIGNIFICANT ACCOUNTING POLICIES (CONTINUED)
GAMInG oPerAtIonS (VLts And tABLe GAMeS) — reVenue recoGnItIon And PrIze oBLIGAtIonSAs of the end of fiscal year 2013, four casinos were in operation with a total of 6,830 VLTs. VLTs are a self-activated video version of lottery games which allow for a player to place bets for the chance to be awarded credits which can either be redeemed for cash or be replayed as additional bets. The prize structures of these video lottery games are designed to award prizes, or credits, at a stipulated rate of total bets played, and prize expenses are netted against total video credits played. The MLGCA recognizes VLT revenue as “gross terminal revenue” equivalent to all wagers, net of related prizes.
In accordance with the law, three of the casino operators receive 33% of the gross terminal revenue to operate their casinos, while the fourth casino operator receives 50% of the gross terminal revenue. Prior to October 1, 2012, the enabling legislation required, the MLGCA to collect 100% of the gross terminal revenue and then return the casino operator’s share. Effective, October 1, 2012, the enabling legislation allowed the casino operators to retain their share of the gross terminal revenue. During fiscal year 2012, the casino operators share was classified as an operating expense. For fiscal year 2013, the casino operators share is classified as cost of sales and accordingly, the fiscal year 2012 casino operators share has been reclassified. The MLGCA retains 2% of the gross terminal revenue to help fund the operations of the VLT program. The enabling legislation requires the MLGCA to disburse the remainder of the gross terminal revenue to other government agencies, which in turn are responsible for making further distributions.
On March 6, 2013, table games opened at one of the casinos. By the end of fiscal year 2013, there were 154 table games in operation at three of the casinos. Table games include blackjack, roulette, craps and various poker games. Table game revenue is equivalent to all wagers, net of related prizes. Casino operators receive 80% of the table game revenue to operate their casino. These costs are recorded as cost of sales. The remaining 20% is remitted to the MLGCA who in turn transfers it to the Education Trust Fund in accordance with the enabling legislation.
To further help fund the operations of the gaming program, the State provided grants to the MLGCA during fiscal years 2013 and 2012 in the amount of $73,690,820 and $28,959,177, respectively.
Administrative expenses for the gaming program are recognized as they are incurred. The majority of the expenses incurred for the VLT program are for the purchase and lease of the VLTs. VLTs that were purchased by the MLGCA were financed through the State Treasurer’s Office and are treated as a capital lease for financial statement purposes. The leased VLTs are comprised of VLTs that have no minimum lease period or VLTs that have a minimum lease period of 12 or 18 months. For the VLTs that do not have a minimum lease period, the MLGCA treats these payments as an administrative expense and recognizes the expense when incurred. For the VLTs that have a minimum lease period, the majority of them meet the criteria for capital leases and are treated as such for financial statement purposes.

56 MARYLAND LOTTERY AND GAMING CONTROL AGENCY / Enterprise Fund of the State of Maryland
MARYLAND LOTTERY AND GAMING CONTROL AGENCY
NOTES TO FINANCIAL STATEMENTS
1. SUMMARY OF SIGNIFICANT ACCOUNTING POLICIES (CONTINUED)
oPerAtInG And non-oPerAtInG reVenueS And exPenSeSOperating revenues and expenses for proprietary funds such as the MLGCA are revenues and expenses that result from providing services and producing and delivering goods and/or services. Operating revenues for the MLGCA are derived from providing various types of lottery games, VLT games and table games. Operating expenses for lottery games include the costs to operate the various games, pay prize winners, and administrative expenses. Operating expenses for gaming operations include the costs to operate the various games and administrative expenses. All revenues and expenses not meeting this definition are reported as non-operating revenues and expenses.
cASH And cASH equIVALentS Cash and cash equivalents include cash deposited with financial institutions, deposits with the Maryland State Treasury, and overnight investments in repurchase agreements.
cASH And cASH equIVALentS — GAMInG eScroWCash and Cash Equivalents — Gaming Escrow consists of funds deposited in escrow with a financial institution and the related interest earned. The monies deposited are primarily application fees received from casino operator license applicants that are held in separate escrow sub accounts until the application review process is complete and the license is either awarded or denied. If the license is awarded, the monies being held are transferred to the Education Trust Fund of the State of Maryland. If the license is denied, the monies received are returned to the applicant. During fiscal year 2013, the MLGCA received $53,100,000 in application fees from three bidders interested in bidding on the sixth casino location in Prince George’s County. During fiscal year 2013, the MLGCA transferred $2,100,000 to the Education Trust Fund after the award for the Rocky Gap Casino Resort and transferred $2,798,798 to the court systems for an unsuccessful bidder in Baltimore City.
Secondarily, the account is used to facilitate the receipt of other license fees that are received from applicants wanting to obtain a gaming license from the MLGCA. The total amount of the fees received varies based on the type of license to be issued. Such amounts are temporarily deposited into a separate Gaming Escrow sub account and are subsequently withdrawn and deposited into the Gaming Special Fund account that is held by the State Treasurer. Amounts remaining in the escrow accounts are generally small at month end.
cASH And cASH equIVALentS — reStrIcted — GAMInG LIcenSInG dePoSItSCash and Cash Equivalents — Restricted — Gaming Licensing Deposits account is used to record the receipt of license related fees and investigation deposits that are received from applicants wanting to obtain a gaming license. Under the law, the MLGCA is charged with issuing the following licenses: manufacturer, contractor, vendor, principal employee, gaming employee and non-gaming employee.

57Comprehensive Annual Financial Report for the Years Ended June 30, 2013 and 2012
MARYLAND LOTTERY AND GAMING CONTROL AGENCY
NOTES TO FINANCIAL STATEMENTS
1. SUMMARY OF SIGNIFICANT ACCOUNTING POLICIES (CONTINUED)For gaming and non-gaming license applicants, the MLGCA receives the following fees: application, license and fingerprint to help cover the costs of licensing these applicants. All of these types of fees are recorded as revenue after the specific applicant and type of fee received is determined. At the end of each month, these fees are transferred to the Gaming Special Fund account.
For principal employee applicants, in addition to the aforementioned fees, the MLGCA also receives a background investigation deposit which is used to pay the investigation costs for the principal employee applicant. These deposit amounts remain in Cash and Cash Equivalents – Restricted – Gaming Licensing Deposits and are recorded as a licensing deposit liability until the investigation is completed. To the extent that the investigation deposit is greater than the costs incurred for the investigation, the monies are refunded to the applicant. To the extent that the investigation deposit is less than the costs incurred for the investigation, the applicant is billed for the deficit. After the investigation is completed, the deposit is recorded as revenue and is transferred to the Gaming Special Fund account.
cASH And cASH equIVALentS — AGentCash and Cash Equivalents — Agent consists of funds deposited in escrow with a financial institution and the related interest earned. Monies deposited into the escrow accounts were received from select agents who deposited monies with the MLGCA in lieu of obtaining a bond.
AccountS receIVABLe — LotteryAccounts receivable represents the amounts due from lottery retailers from the sale of lottery tickets. The MLGCA utilizes the allowance method to provide for doubtful accounts based on management’s evaluation of the collectability of accounts receivable. The MLGCA determines accounts receivable to be delinquent when greater than 10 days past due. Receivables are written off when it is determined that amounts are uncollectible. As of June 30, 2013 and 2012, management believes all Accounts Receivable – Lottery are collectible, and, as such, no allowance for doubtful accounts has been recorded.
AccountS receIVABLe — GAMInGAccounts Receivable — Gaming applicants represent outstanding amounts due that have been billed to applicants for completed background investigations and amounts due from VLT manufacturers for liquidated damages.
In addition, this amount includes the amount of gross terminal revenue and table game revenue due from the casino operators. Gross terminal revenue is collected on a daily basis. Also included in the June 2013 balance is the amount due from the casino operators for the $425 VLT assessment and the $500 table game assessment that is due to the Problem Gaming Fund. Management believes that all Accounts Receivable – Gaming are collectible, and as such, no allowance for doubtful accounts has been recorded.

58 MARYLAND LOTTERY AND GAMING CONTROL AGENCY / Enterprise Fund of the State of Maryland
MARYLAND LOTTERY AND GAMING CONTROL AGENCY
NOTES TO FINANCIAL STATEMENTS
1. SUMMARY OF SIGNIFICANT ACCOUNTING POLICIES (CONTINUED)
cAPItAL ASSetS The MLGCA has adopted a policy of capitalizing assets with individual amounts exceeding $25,000 and all leased assets. These assets are comprised principally of technology equipment necessary to administer lottery games and VLTs. The purchased assets are recorded at cost and depreciation is computed using the straight-line method over three-to-five year useful lives. Assets acquired through capital leases are initially recorded at the lower of fair value at the date of the lease or the net present value of the minimum lease payments. Assets acquired under capital leases are amortized over the lesser of the lease term or the estimated useful life of the leased asset.
InVeStMentS For AnnuIty PAyMentSInvestments consist of United States Government Treasury Bonds and annuity contracts. The investments in United States Government Treasury Bonds are purchased in the name of the MLGCA and stated at fair value based on quoted market prices of similar instruments. Investments in annuity contracts are purchased in the name of the MLGCA and stated at present value, which approximates fair value.
coMPenSAted ABSenceSThe MLGCA accrues compensated absences in accordance with GASB No. 16, Accounting for Compensated Absences. All full-time permanent MLGCA employees accrue annual leave at variable rates based on the number of years employed by the State of Maryland. The maximum annual leave an employee can earn per calendar year is 25 days. At the end of each calendar year, an employee’s accrued annual leave may not exceed 75 days. Accrued annual leave is included in the employee related payables in the accompanying statements of net position. All full-time permanent MLGCA employees also accrue sick pay benefits. However, the MLGCA does not record a liability for accrued sick pay benefits as neither the State of Maryland nor the MLGCA has a policy to pay unused sick leave when employees terminate from State service.
PAyMentS to tHe StAte oF MAryLAndThe law requires the MLGCA to transfer its lottery revenue in excess of funds allocated to prize awards, operating expenses, and the Maryland Stadium Authority to the State of Maryland General Fund. The income from operations of the Mega Millions game is transferred to the Maryland Stadium Authority up to an annual cap set by the authorized appropriation. These payments are recorded as a non-operating expense in the accompanying statements of revenues, expenses, and changes in net position.
The law further requires the MLGCA to transfer its gaming revenue to various governmental agencies. In addition to the required transfers, the MLGCA retains 2% of the gross terminal revenue to help fund the costs of operations, three of the casinos receive 33% of the gross terminal revenue and one of the casinos receives 50% of the gross terminal revenue to help fund the costs of their operations, and all casinos receive 80% of the table game revenue to help fund the costs of their operations.

59Comprehensive Annual Financial Report for the Years Ended June 30, 2013 and 2012
MARYLAND LOTTERY AND GAMING CONTROL AGENCY
NOTES TO FINANCIAL STATEMENTS
1. SUMMARY OF SIGNIFICANT ACCOUNTING POLICIES (CONTINUED)On a monthly basis, the MLGCA transfers these funds as follows:
• A transfer of 5.5% of the gross terminal revenue is made to the State’s Racing Commission into an account for local impact grants.
• A transfer of 7% of the gross terminal revenue, not to exceed a total of $100 million annually, is made to the State’s Racing Commission into the Purse Dedication Account.
• Prior to October 1, 2012, a transfer of 2.5% of the gross terminal revenue, not to exceed a total of $40 million annually, was made to the State’s Racing Commission into the Racetrack Facility Renewal Account. Effective October 1, 2012, this percentage was reduced to 1.5%.
• A transfer of 1.5% of the gross terminal revenue is transferred to the State’s Board of Public Works into the Small, Minority, and Women-Owned Businesses Account.
• A transfer is made to the State’s Department of Education into the Education Trust Fund. The transfer amount for the gross terminal revenue varied during fiscal year 2013 as this fund receives the remainder of the gross terminal revenue after all other transfers have been made. The decrease in the contribution to the Racetrack Facility Renewal Account increased the overall amount transferred to the Education Trust Fund, while the 50% retained by the one casino versus the 33% retained by the other casinos decreased the amount transferred. For fiscal year 2013, the Education Trust Fund received 46.7% of the gross terminal revenue. In addition to a percentage of gross terminal revenue, the Education Trust Fund received 20% of the table game revenue.
These transfers are recorded as non-operating expenses in the accompanying statements of revenues, expenses and change in net position.
A summary of the total game revenue and the distributions for the years ended June 30, 2013 and 2012, respectively follows:
Distribution
Fiscal Year 2013 Amount
Fiscal Year 2012 Amount
education trust Fund $ 284,521,586 $ 94,620,140
Local Impact Grants 30,760,321 10,730,119
Purse dedication 39,121,491 13,656,515
racetracks Facility renewal 10,780,196 4,877,327
Small, Minority and Women owned Businesses 8,389,179 2,926,396
Maryland Lottery and Gaming control Agency 11,213,581 3,901,862
casino operators 223,930,473 64,380,714
Total $ 608,716,827 $ 195,093,073

60 MARYLAND LOTTERY AND GAMING CONTROL AGENCY / Enterprise Fund of the State of Maryland
MARYLAND LOTTERY AND GAMING CONTROL AGENCY
NOTES TO FINANCIAL STATEMENTS
1. SUMMARY OF SIGNIFICANT ACCOUNTING POLICIES (CONTINUED)
reStrIcted ASSetSState law restricts the MLGCA’s assets in their entirety. The MLGCA’s assets are not reported as restricted on the statements of net assets since the restriction created by State law is as broad as the MLGCA’s operations.
net PoSItIonNet position is presented as either unrestricted or net investment in capital assets. Net investment in capital assets represents the difference between capital assets net of accumulated depreciation and amortization and the related capital lease obligations. Unrestricted net assets represent the net assets available for future operations including outstanding encumbrances as of year-end and unrealized gains or losses on investments. Market gains or losses represent temporary fluctuations and are not recognized in the calculation of the amount due to the Maryland Stadium Authority, State of Maryland General Fund or payments to Other Governmental Agencies.
neW AccountInG PronounceMentSThe MLGCA has implemented GASB Statement No. 61, The Financial Reporting Entity: Omnibus-and amendment of GASB Statements No. 14 and No. 34, GASB Statement No. 62, Codification of Accounting and Financial Reporting Guidance Contained in Pre-November 30, 1989 FASB and AICPA Pronouncements, GASB Statement No. 63, Financial Reporting of Deferred Outflows of Resources, Deferred Inflows of Resources and Net Position and GASB Statement No. 64, Derivative Instruments: Application of Hedge Accounting Termination Provisions – an amendment of GASB Statement No. 53 for the fiscal year ended June 30, 2013. None of these statements had a material impact of the MLGCA’s financial position; however, GASB Statement No. 63 did require the renaming of net assets to net position.
GASB has issued Statement No. 65, Items Previously Reported as Assets and Liabilities and GASB Statement No. 66, Technical Corrections-2012-an amendment of GASB Statements No. 10 and No. 62 effective for periods beginning after December 15, 2012. GASB has also issued Statement No. 67 Financial Reporting for Pension Plans – an amendment of GASB Statement No. 25 and GASB Statement No. 70 Accounting and Financial Reporting for Nonexchange Financial Guarantees effective for reporting periods beginning after June 15, 2013. GASB Statement No. 69, Government Combinations and Disposals of Government Operations, has been issued for reporting periods effective after December 15, 2013 and GASB Statement No. 68, Accounting and Financial Reporting for Pensions – an amendment of GASB Statement No. 27 has been issued for reporting periods effective after June 15, 2014. The MLGCA is in the process of assessing the impact of these statements and will implement them as of the effective dates.
recLASSIFIcAtIon Certain amounts presented in the 2012 financial statements have been reclassified to conform to the 2013 presentation.

61Comprehensive Annual Financial Report for the Years Ended June 30, 2013 and 2012
MARYLAND LOTTERY AND GAMING CONTROL AGENCY
NOTES TO FINANCIAL STATEMENTS
2. CASH AND CASH EqUIVALENTSAs of June 30, 2013 and June 30, 2012, the carrying amounts of deposits with financial institutions were $79,311,400 and $31,388,541, respectively. The corresponding bank balances were $78,774,408 and $30,863,211 as of June 30, 2013 and June 30, 2012, respectively.
As of June 30, 2013 and June 30, 2012, the amount on deposit with the Maryland State Treasury was $84,922,096 and $86,593,206, respectively. The corresponding Maryland State Treasury balances were $12,688,352 and 16,859,587, respectively. The State Treasury has statutory responsibility for the daily cash management activities of the State’s agencies, departments, boards, and commissions. The deposits with the State Treasury are part of the State of Maryland’s internal investment pool and are not separately identifiable as to specific types of securities. The Treasury maintains these and other Maryland State agency funds on a pooled basis in accordance with State statute. The MLGCA does not obtain interest on funds deposited with the State Treasury. As of June 30, 2013 and 2012, the MLGCA’s deposits with the State Treasury were less than 2% of the total deposits with the State Treasury.
Custodial credit risk — Custodial credit risk is the risk that in the event of a bank failure, the MLGCA’s deposits will not be returned to it. The MLGCA’s deposit policy requires that it comply with the State law that governs the State Treasury deposits. Specifically, unexpended or surplus money may be deposited in a financial institution in the State, if the deposit is interest bearing; the financial institution provides collateral that has a market value that exceeds the amount by which a deposit exceeds the deposit insurance; and the custodian holds the collateral.
Federal depository insurance covers a portion of the MLGCA’s deposits with a financial institution, and the remaining balance is collateralized with securities that are held by the State of Maryland’s agent in the State’s name. These deposits are invested in overnight repurchase agreements. As of June 30, 2013 and 2012, the collateral for the repurchase agreements were Federal National Mortgage Association (FNMA) Mortgage-Backed Securities which are not rated; however, the amount of collateral meets or exceeds the deposit insurance.
Interest rate risk — The State Treasury investment policy states that to the extent possible, it will attempt to match its investments with anticipated cash flow requirements. Unless matched to a specific cash flow, the State Treasury will not directly invest in securities maturing more than five years from the date of purchase.
Credit risk — State law requires that the State Treasury investments in repurchase agreements be collateralized by United States Treasury and Agency Obligations. In addition, investments may be made directly in United States Agency Obligations. State law also requires that money market mutual funds receive the highest possible rating from at least one nationally recognized statistical rating organization.
62 MARYLAND LOTTERY AND GAMING CONTROL AGENCY / Enterprise Fund of the State of Maryland
MARYLAND LOTTERY AND GAMING CONTROL AGENCY
NOTES TO FINANCIAL STATEMENTS
2. CASH AND CASH EqUIVALENTS (CONTINUED)Concentration of credit risk — The State Treasury’s investment policy limits the amount of repurchase agreements to be invested with a particular institution to 30% of the portfolio. There is no other limit on the amount that may be invested in any one issuer. More than 5% of government funds investments are in the FNMA and the Federal Home Loan Mortgage Corporation. As of June 30, 2013, these investments are 38.99% and 35.02% of the State of Maryland’s internal investment pool total investments, respectively. As of June 30, 2012, these investments were 40.54% and 46.35% of the State of Maryland’s internal investment pool total investments, respectively.
3. INVESTMENTS
unIted StAteS GoVernMent treASury BondSIt is the MLGCA’s policy to fund Jackpot and lifetime prize awards through the purchase of United States Government Treasury Bonds. Furthermore, it is the policy of the MLGCA to hold these investments to maturity. The investment maturities approximate the annuity prizes payable installment due dates.
The MLGCA has purchased long-term investments to fund Jackpot and lifetime prize awards. The majority of these investments are United States Government Treasury Bonds, which carry a yield to maturity of approximately .173% to 8.4%. As of June 30, 2013 and June 30, 2012, the MLGCA’s United States Government Treasury Bonds totaled $59,094,730 and $75,972,649 respectively. The investments in United States Government Treasury Bonds are carried at fair value based on quoted market prices on the accompanying statements of net position and the related unrealized gains (losses) and interest income are recorded as investment revenue (loss) on the accompanying statements of revenues, expenses, and changes in net position.
Through the State securities lending program, authorized under section 2-603 of the State’s Finance and Procurement Article of the Annotated Code of Maryland, the State Treasurer’s Office lends United States Government securities to broker-dealers and other entities (borrowers). As of June 30, 2013 and June 30, 2012, MLGCA United States Government Treasury Bonds totaling $33,908,243 and $59,688,802, respectively, were lent as part of this program. The State Treasurer’s Office controls the program and authorizes all transactions. The State’s (and MLGCA’s) custodial bank manages the securities lending program by contracting with a lending agent who receives cash as collateral. The lending agent may use or invest cash collateral in accordance with the reinvestment guidelines approved by the State Treasurer’s Office. Additionally, under the terms of the lending agreement, the

63Comprehensive Annual Financial Report for the Years Ended June 30, 2013 and 2012
MARYLAND LOTTERY AND GAMING CONTROL AGENCY
NOTES TO FINANCIAL STATEMENTS
3. INVESTMENTS (CONTINUED)lending agent indemnifies the State against any credit loss arising from investment of the collateral. The collateral will be returned for the same securities by the next business day if the aggregate value of the collateral falls to less than 100% of the market value of the securities lent against the collateral. Cash collateral is initially pledged at greater than the market value of the securities.
At year-end, the State has no credit risk exposure to borrowers because the amounts the State owes the borrowers exceed the amounts the borrowers owe the State. As of June 30, 2013 and 2012, the related collateral for the MLGCA securities lent totaled $34,651,503 and $60,940,096, respectively, resulting in 102.2% as of June 30, 2013 and 2012, collateralization of the fair value of the MLGCA securities lent. The benefit of collateral received or income earned is not passed onto the MLGCA and therefore not reflected in the MLGCA’s financial statements.
Either the State or the borrower may terminate the lending agreements on demand. Lending agreements are usually short in duration. The duration of the lending agreements is matched with the term to maturity of the investment of the cash collateral by investing only in repurchase agreements. Such matching existed at year-end. The State’s custodial bank is obligated to indemnify the State against liability for any suits, actions, or claim of any character arising from or relating to the performance of the bank under the contract, except for liability caused by acts or omissions of the State. The State did not experience any losses on their securities lending transactions for the years ended June 30, 2013 and 2012.
AnnuIty contrActSCertain investments are held in annuity contracts that return guaranteed interest ranging from 7.6% to 12.1%. As of June 30, 2013 and June 30, 2012, the annuity contracts totaled $227,718 and $269,112, respectively. The annuity contracts were purchased in 1976 to satisfy the MLGCA’s obligation for certain lifetime prizes. The value of the annuity contracts and related annuity prizes payable were adjusted in fiscal year 2005 based on revised actuarial life expectancy tables.
Interest rate risk is the risk that an investment’s fair value decreases as market interest rates increase. Typically, this risk is higher in debt securities with longer maturities. The MLGCA is not subject to interest rate risk because it is the MLGCA’s policy to hold the investments until maturity, unless an annuitant through a court order forces the sale of an investment to settle the MLGCA’s obligation to the annuitant at which time the annuitant would be paid the proceeds received from the sale of the investments.
For an investment, custodial risk is the risk that in the event of the failure of the counterparty, the MLGCA will not be able to recover the value of its investments or collateral securities that are in the possession of an outside party. The MLGCA is not subject to custodial risk because the United States Government Treasury Bonds are held in the MLGCA’s name by its custodian and annuity contracts are not evidenced by securities that exist in physical or book entry form.

64 MARYLAND LOTTERY AND GAMING CONTROL AGENCY / Enterprise Fund of the State of Maryland
MARYLAND LOTTERY AND GAMING CONTROL AGENCY
NOTES TO FINANCIAL STATEMENTS
3. INVESTMENTS (CONTINUED)As of June 30, 2013, the MLGCA had the following investments:
Investment Maturities (In Years)
Investment type Fair Value
credit quality rating
% of Investments
Less than 1 1–5 6–10 11–20 21–30
Investments in prize annuities:
united States treasury Bonds $59,094,730 1 99.6% $13,783,996 $25,054,101 14,259,691 $5,996,942 $ -
Annuity contracts 227,718 2 .4% 50,970 140,320 19,729 16,699 -
total Investments $59,322,448 100.0% $13,834,966 $25,194,421 $14,279,420 $6,013,641 $ -
1 Credit quality ratings not required for U.S. government and agency securities that are explicitly guaranteed by the U.S. government.2 Annuity contracts not rated.
As of June 30, 2012, the MLGCA had the following investments:
Investment Maturities (In Years)
Investment type Fair Value
credit quality rating
% of Investments
Less than 1 1–5 6–10 11–20 21–30
Investments in prize annuities:
united States treasury Bonds $75,972,649 1 99.6% $16,998,433 $35,627,323 $15,153,372 $8,193,521 $ -
Annuity contracts 269,112 2 .4% 51,107 164,187 35,079 18,739 -
total Investments $76,241,761 100.0% $17,049,540 $35,791,510 $15,188,451 $8,212,260 $ -
1 Credit quality ratings not required for U.S. government and agency securities that are explicitly guaranteed by the U.S. government.2 Annuity contracts not rated.

65Comprehensive Annual Financial Report for the Years Ended June 30, 2013 and 2012
MARYLAND LOTTERY AND GAMING CONTROL AGENCY
NOTES TO FINANCIAL STATEMENTS
4. CAPITAL ASSETS
A summary of capital asset activity for the years ended June 30, 2013 and 2012 is as follows:
2012 Increases Decreases 2013
capital Assets
Machinery and equipment $ 70,126,934 $ – $ – $ 70,126,934
Leasehold Improvements 613,240 – – 613,240
total capital Assets 70,740,174 – – 70,740,174
Less Accumulated depreciation and Amortization
Machinery and equipment 20,922,675 25,378,097 – 46,300,772
Leasehold Improvements 587,691 25,551 – 613,242
total Accumulated depreciation 21,510,366 25,403,648 – 46,914,014and Amortization
net capital Assets $ 49,229,808 $ 25,403,648 $ – $ 23,826,160
2011 Increases Decreases 2012
capital Assets
Machinery and equipment $ 48,513,767 $ 21,613,167 $ – $ 70,126,934
Leasehold Improvements 613,240 – – 613,240
total capital Assets 49,127,007 21,613,167 – 70,740,174
Less Accumulated depreciation and Amortization
Machinery and equipment 10,166,930 10,755,745 – 20,922,675
Leasehold Improvements 526,366 61,325 – 587,691
total Accumulated depreciation 10,693,296 10,817,070 – 21,510,366and Amortization
net capital Assets $ 38,433,711 $ 10,796,097 $ – $ 49,229,808

66 MARYLAND LOTTERY AND GAMING CONTROL AGENCY / Enterprise Fund of the State of Maryland
MARYLAND LOTTERY AND GAMING CONTROL AGENCY
NOTES TO FINANCIAL STATEMENTS
5. ANNUITY PRIzE OBLIGATIONS
The MLGCA carries long-term annuity prize obligations at present value. Presented below is a summary of long-term annuity prize payment requirements for annuities payable to maturity:
Fiscal Year Principal Interest Total
2014 $ 13,388,987 $ 455,009 $ 13,843,996
2015 9,795,318 961,678 10,756,996
2016 6,298,025 1,044,134 7,342,159
2017 3,683,065 802,927 4,485,992
2018 2,366,658 659,334 3,025,992
2019-2023 11,000,182 5,718,327 16,718,509
2024-2028 4,161,852 3,670,128 7,831,980
2029-2031 478,158 448,667 926,825
total $ 51,172,245 $ 13,760,204 $ 64,932,449
This debt represents annual payments owed to Jackpot and lifetime winners. Annuity prizes are paid over a period of time ranging from 20 to 25 years depending on the time period in which the prize was won. The MLGCA has purchased United States Government Treasury Bonds or annuity contracts that fully fund these obligations.
Long-term liability activity of annuity prize payments for the years ended June 30, 2013 and 2012 was as follows:
Fiscal Year Ending
Beginning Balance Additions Reductions
Ending Balance
Due Within One Year
June 30, 2013 $ 63,859,903 $ 4,375,338 $ 17,062,996 $ 51,172,245 $ 13,388,987
June 30, 2012 $ 79,869,776 $ 5,370,123 $ 21,379,996 $ 63,859,903 $ 16,453,027

67Comprehensive Annual Financial Report for the Years Ended June 30, 2013 and 2012
MARYLAND LOTTERY AND GAMING CONTROL AGENCY
NOTES TO FINANCIAL STATEMENTS
6. EMPLOYEE RELATED PAYABLES
Changes in long-term employee related payables were as follows for the years ended June 30, 2013 and 2012. The employee related payables due within one year are included in the current portion of the employee related payables on the accompanying statements of net position, which also includes salaries payable in the amount of $942,289 and $749,766 as of June 30, 2013 and 2012, respectively.
2013
Compensated Absences
Workers’ Compensation Combined
Beginning Balance $ 1,143,333 $ 152,000 $ 1,295,333
Additions 825,097 25,056 850,153
reductions (746,276) (36,056) (782,332)
ending Balance $ 1,222,154 $ 141,000 $ 1,363,154
Amount due Within one year $ 825,000 $ 21,855 $ 846,855
non-current Portion 397,154 119,145 516,299
$ 1,222,154 $ 141,000 $ 1,363,154
2012
Compensated Absences
Workers’ Compensation Combined
Beginning Balance $ 1,071,930 $ 185,921 $ 1,257,851
Additions 798,075 (28,374) 769,701
reductions (726,672) (5,547) (732,219)
ending Balance $ 1,143,333 $ 152,000 $ 1,295,333
Amount due Within one year $ 700,000 $ 23,560 $ 723,560
non-current Portion 443,333 128,440 571,773
$ 1,143,333 $ 152,000 $ 1,295,333
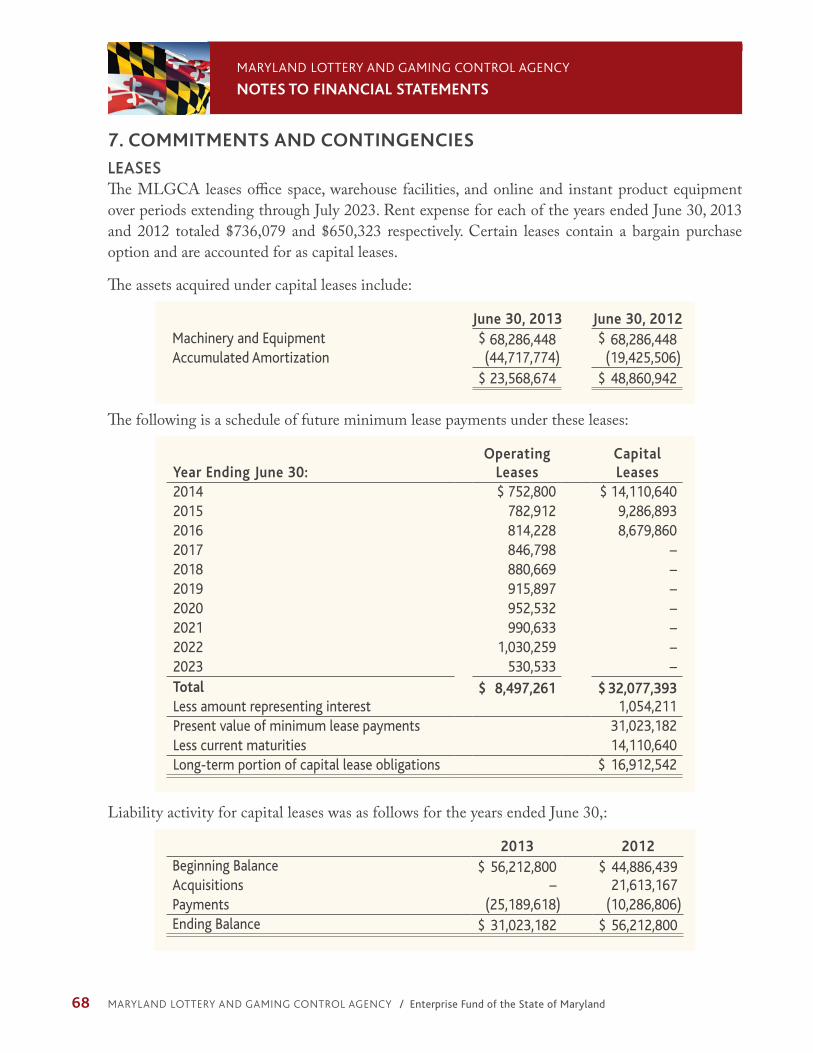
68 MARYLAND LOTTERY AND GAMING CONTROL AGENCY / Enterprise Fund of the State of Maryland
MARYLAND LOTTERY AND GAMING CONTROL AGENCY
NOTES TO FINANCIAL STATEMENTS
7. COMMITMENTS AND CONTINGENCIES
LeASeSThe MLGCA leases office space, warehouse facilities, and online and instant product equipment over periods extending through July 2023. Rent expense for each of the years ended June 30, 2013 and 2012 totaled $736,079 and $650,323 respectively. Certain leases contain a bargain purchase option and are accounted for as capital leases.
The assets acquired under capital leases include:
June 30, 2013 June 30, 2012Machinery and equipment $ 68,286,448 $ 68,286,448Accumulated Amortization (44,717,774) (19,425,506)
$ 23,568,674 $ 48,860,942
The following is a schedule of future minimum lease payments under these leases:
Year Ending June 30: Operating
Leases Capital Leases
2014 $ 752,800 $ 14,110,6402015 782,912 9,286,8932016 814,228 8,679,8602017 846,798 –2018 880,669 –2019 915,897 –2020 952,532 –2021 990,633 –2022 1,030,259 –2023 530,533 –Total $ 8,497,261 $ 32,077,393Less amount representing interest 1,054,211Present value of minimum lease payments 31,023,182Less current maturities 14,110,640 Long-term portion of capital lease obligations $ 16,912,542
Liability activity for capital leases was as follows for the years ended June 30,:
2013 2012Beginning Balance $ 56,212,800 $ 44,886,439 Acquisitions – 21,613,167Payments (25,189,618) (10,286,806)ending Balance $ 31,023,182 $ 56,212,800

69Comprehensive Annual Financial Report for the Years Ended June 30, 2013 and 2012
MARYLAND LOTTERY AND GAMING CONTROL AGENCY
NOTES TO FINANCIAL STATEMENTS
7. COMMITMENTS AND CONTINGENCIES (CONTINUED)
contrActSAs of June 30, 2013, the MLGCA has entered into various contracts totaling approximately $400,002,248 for services to be rendered. These services relate principally to the operation of, and advertising for, lottery games and the operation of the gaming program.
8. PARTICIPATION IN MULTI-STATE GAMES — MEGA MILLIONS® AND POWERBALL®
The MLGCA is a member of the multi-state game Mega Millions. Mega Millions is a lottery game conducted as a cooperative venture by 13 states: Georgia, Illinois, Massachusetts, Michigan, New Jersey, New York, Ohio, Texas, Virginia, Washington, California, Florida and Maryland. Effective January 31, 2010, 23 Powerball lotteries began selling the Mega Millions game. Currently, 45 jurisdictions sell the Mega Millions game. Also on January 31, 2010, the MLGCA began selling the Powerball game. Powerball is a lottery game currently sold by 45 lotteries. The Mega Millions states have agreed to a common set of game rules for both Mega Millions and Powerball and share in a common prize pool for each game. The prize pools are shared on a percent of sales basis. Game accounting is conducted after each semi-weekly drawing. Settlements between the states occur after each Jackpot win and annually for all other prizes, unless a state’s non-Jackpot prize settlement amount exceeds $1,500,000, at which time the states conduct a mid-year settlement. Settlements occur annually for unclaimed non-Jackpot prizes and after the claiming periods have expired for unclaimed Jackpot prizes.
9. RETIREMENT BENEFITSThe MLGCA and its employees contribute to the State Retirement and Pension System (the System). The System is a cost sharing multiple-employer public employee retirement system established by the State to provide pension benefits for State employees. The MLGCA’s only obligation to the System is its required annual contribution. The System is administered by a Board of Trustees in accordance with State Personnel and the Pension Article of the Annotated Code of Maryland. The System prepares a separately audited CAFR, which can be obtained from the State Retirement and Pension System of Maryland, 120 East Baltimore Street, Baltimore, Maryland 21202.
PLAn deScrIPtIonSMLGCA employees are members of the Employees’ Retirement and Pension Systems (two of several systems managed by the System’s Board of Trustees). The Employees’ Retirement System (the Retirement Plan) includes those employees hired prior to January 1, 1980 who have not elected to transfer to the Employees’ Pension System (the Pension Plan). Conversely, members of the Pension Plan include those employees hired after January 1, 1980 and prior employees who have elected to transfer from the Retirement Plan. Changes were made to the Pension Plan that impact both existing members and new hires on or after July 1, 2011 differently. These changes are described in more detail below.

70 MARYLAND LOTTERY AND GAMING CONTROL AGENCY / Enterprise Fund of the State of Maryland
MARYLAND LOTTERY AND GAMING CONTROL AGENCY
NOTES TO FINANCIAL STATEMENTS
9. RETIREMENT BENEFITS (CONTINUED)The Retirement Plan provides retirement, death, and disability benefits to its members. Members of the Retirement Plan are generally eligible for full retirement benefits upon the earlier of attaining age 60 or accumulating 30 years of eligible service regardless of age. The annual retirement allowance equals 1/55 (1.8%) of the member’s highest three-year average final salary (AFS) multiplied by the number of years of accumulated creditable service. A member may retire with reduced benefits after completing 25 years of eligible service. Benefits are reduced by 0.5% per month for each month remaining until the retiree either attains age 60 or would have accumulated 30 years of eligible service, whichever is less. The maximum reduction for a member is 30%. Any member who terminates employment before attaining retirement age but after accumulating five years of eligible service is eligible for a vested retirement allowance.
The Pension Plan provides retirement, death and disability benefits to its members. Certain aspects of eligibility and benefit calculations are different for employees hired on or after July 1, 2011. Those differences are explained below.
Members of the Pension Plan who were active participants prior to July 1, 2011 are generally eligible for full retirement benefits upon the earlier of attaining age 62, with specified years of eligibility service, or accumulating 30 years of eligibility service regardless of age. Generally, the annual pension allowance for a member equals 1/55 (1.8%) of the member’s AFS, multiplied by the number of years of creditable service. A member may retire with reduced benefits upon attaining age 55 with at least 15 years of eligible service. Any member who terminates employment before attaining retirement age but after accumulating five years of eligible service is eligible for a vested retirement allowance.
Employees hired on or after July 1, 2011 (“New Hires”) are generally eligible for full retirement benefits based upon the “Rule of 90” which states that the sum of the employee’s age plus eligible service must equal 90 or the employee must be age 65 with 10 years of service. The annual pension allowance for New Hires equals 1.5% of the member’s AFS, multiplied by the number of years of creditable service. AFS for New Hires is calculated using the highest 5 consecutive years. A New Hire may retire with reduced benefits upon attaining age 60 with at least 15 years of eligible service. A New Hire who terminates employment before attaining retirement age but after accumulating ten years of eligible service is eligible for a vested retirement allowance.
FundInG PoLIcyActive members and the employers of the members are required to contribute to the Employees’ Retirement and Pension Systems. The MLGCA’s required contribution is established by annual actuarial valuations using the entry age normal cost method with projection and other actuarial assumptions adopted by the Board of Trustees. For service earned after July 1, 2011, members of the Employees’ Retirement System and the Employee’s Pension System are required to contribute 7% of earnable compensation.

71Comprehensive Annual Financial Report for the Years Ended June 30, 2013 and 2012
MARYLAND LOTTERY AND GAMING CONTROL AGENCY
NOTES TO FINANCIAL STATEMENTS
9. RETIREMENT BENEFITS (CONTINUED)The MLGCA contributions, which equal 100% of the required contributions, for the three years ended June 30, 2013, 2012, and 2011 are as follows:
2013 2012 2011MLGcA contribution $ 1,509,065 $ 1,222,917 $ 1,139,690Percentage of payroll 9.04% 7.91% 7.88%
10. OTHER POST-EMPLOYMENT BENEFITS
Members of the State Retirement and Pension Systems and their dependents are provided postemployment health care benefits through the State Employee and Retiree Health and Welfare Benefits Program (Plan). The Plan is a single-employer defined benefit health care plan established by the State Personnel and Pensions Article, Section 2-501 through 2-516 of the Annotated Code of Maryland. The Plan is self-insured to provide medical, hospitalization, prescription drug and dental insurance benefits to eligible state employees, retirees, and their dependents. A separate valuation is not performed for the MLGCA. The MLGCA’s only obligation to the Plan is its required annual contribution.
Effective June 1, 2004, the State established the Postretirement Health Benefits Trust Fund (OPEB Trust) to receive appropriated funds and contributions to assist the Plan in financing the State’s post-employment health insurance subsidy. The OPEB Trust is established in accordance with the State Personnel and Pensions Article, Section 34-101 of the Annotated Code of Maryland and is administered by the Board of Trustees for the State Retirement and Pension System. The Board of Trustees prepares a financial report for the OPEB Trust, which can be obtained from the State Retirement and Pension System of Maryland, 120 E. Baltimore Street, Suite 1600, Baltimore, Maryland 21202.
PLAn deScrIPtIonMLGCA employees are members of the Plan. Members, generally, may enroll and participate in the health benefit options if the retiree ended State service with at least 10 years of creditable service and within five years before the age at which a vested retirement allowance normally would begin or if the retiree ended State service with at least 16 years of creditable service.
FundInG PoLIcyBeginning in fiscal year 2008, State law requires the State’s Department of Budget and Management to transfer any subsidy received as a result of the Federal Medicare Prescription Drug Improvement and Modernization Act of 2003 or similar subsidy to the OPEB Trust to prefund OPEB benefits. To further prefund benefits, during fiscal year 2008, the State transferred funds from the State Reserve Fund Dedicated Purpose Account. Additionally, the State is required by

72 MARYLAND LOTTERY AND GAMING CONTROL AGENCY / Enterprise Fund of the State of Maryland
MARYLAND LOTTERY AND GAMING CONTROL AGENCY
NOTES TO FINANCIAL STATEMENTS
10. OTHER POST-EMPLOYMENT BENEFITS (CONTINUED)
law to provide funding each year for the Plan for the State’s share of the pay-as-you-go amount necessary to provide current benefits to active and retired employees and their dependents. Funds may also be separately appropriated in the State’s budget for transfer to the OPEB Trust.
Based on current practice, the State subsidizes approximately 50% to 85% of covered medical, dental, prescription, and hospitalization costs, depending on the type of insurance plan. The State assesses a surcharge for postemployment health care benefits, which is based on health care insurance charges for current employees. Costs for post retirement benefits are for State of Maryland retirees. The State does not distinguish employees by employer/State agency. Instead, the State allocates the postemployment health care costs to all participating employers. The cost of these benefits is expensed when paid. For the years ended June 30, 2013 and June 30, 2012, the State did not allocate postemployment health care costs to participating employers and as a result no contribution was made by the MLGCA.
11. RISk MANAGEMENTThe MLGCA is exposed to various risks associated with the theft, damage, or destruction of assets, torts, and game liability. To manage the related risks, the MLGCA participates in the State’s insurance program, which provides general liability, personal and casualty, and workers’ compensation insurance. The program requires all agencies to submit premiums based upon proportionate payroll costs and/or claim history. This insurance covers related losses up to a maximum of $1,000,000 per event. Settlements have not exceeded coverage for any of the past three fiscal years. The activity related to accrued workers’ compensation costs is included in the schedule exhibited in Note 6.
To minimize risks associated with lottery game liabilities, the MLGCA has established aggregate payout limits for each game type. This approach discontinues sales of the daily numbers games once the potential liability limit is reached for a specific player selection. A maximum payout limit is established for those games with a first-tier prize, which requires multiple first-tier winners to split the related prize.
Risk is minimized for gaming operations as the law requires a VLT to have an average payout of 87% or more but cannot exceed 100%. A casino’s gaming floor is to be configured to collectively achieve, at all times, an average payout of 90% but not exceed 95%. For table games, any overall loss for the day is absorbed by the casinos.

73Comprehensive Annual Financial Report for the Years Ended June 30, 2013 and 2012
MARYLAND LOTTERY AND GAMING CONTROL AGENCY
SCHEDULE OF REVENUES, ExPENSES AND CHANGES IN NET POSITION — BUDGET AND ACTUAL
For the Year ended June 30, 2013
Original Budget
Final Amended Budget
Actual Amounts
Variance with Budget over
(under)revenues:
cash revenue receipts from all Sources $ 1,826,853,699 $ 1,888,121,590 $ 2,489,218,420 $601,096,830
expenditures and encumbrances:Gaming Vendor and Information
technology Fees 17,678,635 18,201,135 18,116,182 (84,953)
Instant ticket Printing and delivery 6,430,923 6,430,923 6,435,341 4,418 Salaries, Wages and Benefits 16,764,428 18,495,173 17,166,867 (1,328,306)Advertising and Promotions 12,344,990 12,344,990 12,379,162 34,172 other General and Administrative expenses 4,982,488 4,982,488 5,029,310 46,822 VLt Special Fund 184,745,750 184,763,505 58,664,559 (126,098,946)VLt General Fund 69,095,408 69,447,032 69,263,791 (183,241)reversions — VLt Special Fund - (126,098,946) - 126,098,946 reversions — VLt General Fund - (1,308,330) - 1,308,330 reversions — Lottery - (202,757) - 202,757
total expenditures and encumbrances 312,042,622 187,055,213 187,055,213 –
excess of revenues over (under) expenditures 1,514,811,077 1,701,066,378 2,302,163,208 601,096,830
other Sources (uses) of financial resources:transfers in (out):
State of Maryland Stadium Authority (19,265,000) (19,265,000) (19,265,000) - State of Maryland General Fund (507,464,000) (507,464,000) (525,960,121) (18,496,121)other Government Agencies/Funds — VLt - - (376,536,948) (376,536,948)
excess of revenues over expenditures and other sources of financial resources
$ 988,082,077 $ 1,174,337,378 $ 1,380,401,139 $ 206,063,761
change in net Positions $ (7,179,195)
non-budgetary expenditures:Prize expense $ 1,038,475,788 commissions 298,971,711 depreciation 25,403,648 Bad debt 82,002
Accounting principle differences:Accounts receivable (3,284,679)unearned revenue (321,672)Increase in Fair Value of Investments 640,822 Amortization of discount Prize Liabilities 3,590,833 compensated absences 78,821 Workers’ compensation (11,000)capital lease payments and related interest (25,909,449)cash received for VLt/agents 49,863,508
excess of revenues over expenses $ 1,380,401,139

74 MARYLAND LOTTERY AND GAMING CONTROL AGENCY / Enterprise Fund of the State of Maryland
MARYLAND LOTTERY AND GAMING CONTROL AGENCY
NOTES TO SCHEDULE OF REVENUES, ExPENSES AND CHANGES IN NET POSITION — BUDGET AND ACTUAL
1. BUDGETING AND BUDGETARY CONTROL
The Maryland Constitution requires the Governor to submit to the General Assembly an annual balanced budget for the following fiscal year. Each year the MLGCA prepares its annual budget and submits it to the Governor. The Governor then presents the State’s annual budget (including the MLGCA’s) to the General Assembly in accordance with Constitutional requirements. The General Assembly is required to then enact a balanced budget.
The MLGCA’s official budget, as adopted by the Legislature, is based upon accounting for certain transactions on the basis of cash receipts and disbursements. Encumbrance accounting, under which purchase orders, contracts, and other commitments for expenditures are recorded as expenditures when the purchase commitment is made, is employed for budgetary purposes. Unliquidated encumbrances are canceled at year-end if it is determined the funds will not be utilized in the future. Unencumbered appropriations lapse at the end of the fiscal year for which they were appropriated. The major differences between the budget basis and the Accounting Principles Generally Accepted in the United States of America (GAAP) basis of accounting are:
• Lottery player prize payments are not budgeted;• Lottery retailer commissions are not budgeted;• Beginning October 1, 2012, casino operator commissions were no longer budgeted;• Revenues are recorded when received in cash (budget) as opposed to when earned (GAAP);• Expenses (including deferred prizes) are recorded when paid or encumbered (budget) as opposed
to when the liability is incurred (GAAP);• The budget basis excludes depreciation and amortization.
The MLGCA maintains budgetary control by not permitting the total expenditures to exceed appropriations without executive and legislative branch approval.

75
INDEPENDENT AUDITORS’ REPORT ON INTERNAL CONTROL OVER FINANCIAL REPORTING AND ON COMPLIANCE AND OTHER MATTERS BASED ON AN AUDIT OF FINANCIAL STATEMENTS PERFORMED IN ACCORDANCE WITH GOVERNMENT AUDITING STANDARDS To the Maryland Lottery and Gaming Control Agency:
We have audited, in accordance with the auditing standards generally accepted in the United States of America and the standards applicable to financial audits contained in Government Auditing Standards issued by the Comptroller General of the United States, the financial statements of the business-type activities of the Maryland Lottery and Gaming Control Agency (an agency of the State of Maryland) (MLGCA), as of and for the year ended June 30, 2013, and the related notes to the financial statements, which collectively comprise the Maryland Lottery and Gaming Control Agency’s basic financial statements, and have issued our report thereon dated September 30, 2013.
InternAL controL oVer FInAncIAL rePortInGIn planning and performing our audit, we considered the Maryland Lottery and Gaming Control Agency’s internal control over financial reporting (internal control) to determine the audit procedures that are appropriate in the circumstances for the purpose of expressing our opinion on the financial statements, but not for the purpose of expressing an opinion on the effectiveness of the Maryland Lottery and Gaming Control Agency’s internal control. Accordingly, we do not express an opinion on the effectiveness of the Maryland Lottery and Gaming Control Agency’s internal control over financial reporting.
A deficiency in internal control exists when the design or operation of a control does not allow management or employees, in the normal course of performing their assigned functions, to prevent, or detect and correct misstatements on a timely basis. A material weakness is a deficiency, or a combination of deficiencies, in internal control such that there is a reasonable possibility that a material misstatement of the entity’s financial statements will not be prevented, or detected and corrected on a timely basis. A significant deficiency is a deficiency, or a combination of deficiencies, in internal control that is less severe than a material weakness, yet important enough to merit attention by those charges with governance.

76 MARYLAND LOTTERY AND GAMING CONTROL AGENCY / Enterprise Fund of the State of Maryland
Our consideration of internal control was for the limited purpose described in the first paragraph of this section and was not designed to identify all deficiencies in internal control that might be material weaknesses, or, significant deficiencies. Given these limitations, during our audit we did not identify any deficiencies in internal control that we consider to be material weaknesses. However material weaknesses may exist that have not been identified.
coMPLIAnce And otHer MAtterSAs part of obtaining reasonable assurance about whether the Maryland Lottery and Gaming Control Agency’s financial statements are free of material misstatement, we performed tests of its compliance with certain provisions of laws, regulations, contracts, and grant agreements, noncompliance with which could have a direct and material effect on the determination of financial statement amounts. However, providing an opinion on compliance with those provisions was not an objective of our audit, and accordingly, we do not express such an opinion. The results of our tests disclosed no instances of noncompliance or other matters that are required to be reported under Government Auditing Standards. We noted certain matters that we reported to management of the Maryland Lottery and Gaming Control Agency, in a separate letter dated September 30, 2013.
PurPoSe oF tHIS rePortThe purpose of this report is solely to describe the scope of our testing of internal control and compliance and the results of that testing, and not to provide an opinion on the effectiveness of the entity’s internal control or on compliance. This report is an integral part of an audit performed in accordance with Government Auditing Standards in considering the entity’s internal control and compliance. Accordingly, this communication is not suitable for any other purpose.
September 30, 2013

introductory SEctionIn FIscal Year 2012, the MarYland
state lotterY celebrated 39 Years oF
supportIng MarYlanders. the lotterY
Is the Fourth largest contrIbutor
to the state aFter IndIvIdual tax,
corporate tax, and sales and use tax.
MARYLAND LOTTERY AND GAMING CONTROL AGENCY / ENTERpRIsE FuND OF ThE sTATE OF MARYLAND
77
STATISTICAL SECTIONSINCE ITS INCEPTION IN 1973, THE MARYLAND
LOTTERY ALONE HAS CONTRIBUTED $13.4 BILLION
TO THE STATE, WHICH IS USED TO SUPPORT
IMPORTANT PROGRAMS, INCLUDING EDUCATION,
PUBLIC HEALTH, PUBLIC SAFETY AND ENVIRONMENT.
SINCE ITS INCEPTION IN 2011, CASINOS HAVE
GENERATED $906.9 MILLION IN REVENUE.

78 MARYLAND LOTTERY AND GAMING CONTROL AGENCY / Enterprise Fund of the State of Maryland
MARYLAND LOTTERY AND GAMING CONTROL AGENCY
STATISTICAL INFORMATION SECTIONS
This section of the MLGCA’s Comprehensive Annual Financial Report presents detailed information as a supplement to the information presented in the financial statements and note disclosures to assist readers in assessing the overall financial health of the Agency.
CONTENTS
FInAncIAL trendS 79These schedules contain trend information to help readers understand how the MLGCA’s financial performance and position have changed over time. The information presented includes changes in net position, sales and contribution/transfer data for both the lottery and gaming operations, as well as the lottery industry as a whole.
reVenue cAPAcIty 101These schedules contain information to help readers assess the MLGCA’s most significant revenue sources. The lottery’s statewide retailer network determines the market exposure for the lottery’s games. The casinos determine the market exposure for VLTs and table games.
deBt cAPAcIty 110This schedule presents information to help readers assess the debt burden and the ability to issue additional debt in the future.
deMoGrAPHIc And econoMIc InForMAtIon 111These schedules offer demographic and economic indicators to help readers understand the environment within which the MLGCA operates.
oPerAtInG InForMAtIon 112These schedules contain information about the MLGCA’s organization and efficiency.
Sources: Unless otherwise noted, the information in these schedules is derived from the comprehensive annual financial reports or the audited financial statements for the relevant year.

79Comprehensive Annual Financial Report for the Years Ended June 30, 2013 and 2012
MA
RYLA
ND
LO
TTER
Y A
ND
GA
MIN
G C
ON
TRO
L A
GEN
CY
NET
PO
SIT
ION
AN
D C
HA
NG
ES IN
NET
PO
SIT
ION
– F
ISC
AL
YEA
RS
20
04
TH
RO
UG
H 2
01
3
net
Po
SIt
Ion
By
co
MPo
nen
t –
FIS
cA
L y
eAr
S 2
00
4 t
Hr
ou
GH
20
13
FISc
AL y
eAr
2004
2005
2006
2007
2008
2009
2010
2011
2012
2013
Inve
sted
in c
apita
l ass
ets,
net o
f rel
ated
deb
t$
376,
882
$ 43
6,22
9$
292,
874
$ 34
1,31
4$
189,
292
$ 29
,504
$ (7
91,4
34)
$ (6
,881
,872
)$
(6,9
82,9
92)
$ (7
,197
,022
)u
nres
tric
ted
43,8
45,5
3444
,909
,438
26,7
19,3
8113
,830
,745
28,7
39,7
1127
,343
,816
22,
748,
793
12,
829,
364
19,1
40,5
3612
,175
,371
Tota
l net
pos
itio
n$
44,2
22,4
16$
45,3
45,6
67$
27,0
12,2
55$
14,1
72,0
59$
28,9
29,0
03$
27,3
73,3
20$
21,9
57,3
59
$ 5,
947,
492
$ 12
,157
,544
$ 4,
978,
349
cH
An
Ge
In n
et P
oSI
tIo
n –
FIS
cA
L y
eAr
S 2
00
4 t
Hr
ou
GH
20
13
oPe
rAtI
nG
reV
enu
eS:
num
bers
gam
es$
499,
968,
605
$ 52
1,55
5,49
7$
534,
578,
721
$ 53
1,99
2,42
4$
509,
185,
489
$ 52
5,52
2,01
7$
513,
618,
529
$ 51
5,46
3,16
3$
520,
134,
881
$ 51
3,32
3,30
9M
onito
r gam
es38
9,79
6,25
741
7,45
8,50
543
6,52
7,80
646
2,55
1,36
546
0,79
5,52
148
3,17
7,81
7 4
91,9
99,7
34
496,
730,
733
521,
672,
673
493,
569,
979
Mat
rix g
ames
147,
728,
145
155,
750,
154
174,
467,
430
151,
186,
911
184,
017,
335
182,
317,
198
210
,101
,223
20
8,66
0,36
024
6,28
1,19
526
3,38
7,30
7In
stan
t gam
es35
5,01
6,75
539
0,96
8,69
441
5,33
1,82
742
5,08
5,36
551
3,85
9,58
350
7,05
7,02
4 4
90,8
53,0
89
493,
548,
322
506,
803,
706
485,
838,
672
raffl
e ga
mes
––
–6,
495,
000
5,18
0,80
0–
–
–
–
–
oth
er g
ames
2,89
8,69
6–
––
––
–
–
–
–
Tota
l net
sal
es 1
,395
,408
,458
1
,485
,732
,850
1
,560
,905
,784
1
,577
,311
,065
1
,673
,038
,728
1
,698
,074
,056
1
,706
,572
,575
1,
714,
402,
578
1,79
4,89
2,45
51,
756,
119,
267
Gam
ing
reve
nue
— G
ross
term
inal
rev
enue
––
––
– –
–10
3,13
2,79
319
5,09
3,07
356
0,67
9,03
1G
amin
g re
venu
e —
Sta
te G
rant
––
––
– 1
85,7
24
1,1
20,5
66
9,60
5,15
228
,959
,177
73,6
90,8
20G
amin
g re
venu
e —
tabl
e G
ames
––
––
––
––
–
48,0
37,7
94G
amin
g re
venu
e —
Fac
ility
App
lican
ts–
––
––
896
,234
3
,591
,922
1,
341,
779
1,79
1,26
02,
703,
989
Gam
ing
Mac
hine
Ass
essm
ent
––
––
––
––
1,70
8,82
52,
964,
174
Tota
l ope
rati
ng re
venu
es1,
395,
408,
458
1,48
5,73
2,85
01,
560,
905,
784
1,57
7,31
1,06
51,
673,
038,
728
1,69
9,15
6,01
4 1
,711
,285
,063
1,
828,
482,
302
2,02
2,44
4,79
02,
444,
195,
075
coSt
oF
SALe
S:
Priz
e ex
pens
e78
6,80
1,57
685
6,23
1,70
090
4,07
7,71
392
7,00
9,79
495
6,88
7,05
11,
025,
901,
163
1,0
34,1
57,1
26
1,02
9,04
0,61
61,
065,
653,
665
1,03
8,47
5,78
8re
taile
r com
mis
sion
s91
,298
,325
97,5
92,3
4610
2,70
4,70
511
2,18
7,83
111
7,82
4,36
712
1,88
8,10
7 1
13,1
30,6
86
113,
687,
526
118,
305,
427
119,
788,
227
casi
no c
omm
issi
ons
––
––
––
–34
,033
,822
64,3
80,7
1422
3,93
0,47
3G
amin
g ve
ndor
and
dat
a pr
oces
sing
fees
14,5
76,7
2015
,243
,781
15,6
38,7
7814
,778
,613
15,6
15,3
8415
,975
,142
16,
201,
910
19,3
60,9
7420
,077
,153
21,3
68,1
02In
stan
t tic
ket p
rintin
g an
d de
liver
y6,
810,
615
4,93
8,58
56,
199,
964
5,26
1,38
76,
910,
073
6,62
1,14
4 6
,784
,297
6,
275,
995
6,20
6,54
36,
435,
341
Tota
l cos
t of
sal
es89
9,48
7,23
697
4,00
6,41
21,
028,
621,
160
1,05
9,23
7,62
51,
097,
236,
875
1,17
0,38
5,55
6 1
,170
,274
,019
1,
202,
398,
933
1,27
4,62
3,50
21,
409,
997,
931
oPe
rAtI
nG
exP
enSe
S:
Sala
ries,
wag
es a
nd b
enefi
ts10
,275
,844
10,5
83,5
8511
,402
,287
12,3
55,2
1212
,224
,124
12,9
81,4
9913
,044
,796
14,4
98,1
0815
,662
,232
16,9
29,2
70Ad
vert
isin
g an
d pr
omot
ions
14,0
13,3
9914
,889
,419
15,8
59,3
0818
,332
,963
19,8
05,0
3919
,036
,583
13,
767,
713
13,8
11,9
3912
,592
,589
13,2
97,1
55o
ther
gen
eral
and
adm
inis
trat
ive
expe
nses
4,26
1,38
34,
205,
133
4,80
7,62
73,
447,
049
3,66
3,42
44,
101,
836
6,85
9,04
416
,008
,540
17,2
93,0
1759
,032
,711
dep
reci
atio
n an
d am
ortiz
atio
n1,
623,
609
1,50
0,13
556
0,25
765
7,43
162
7,94
764
9,44
1 1
,308
,073
7,
256,
951
10,8
17,0
7025
,403
,648
Tota
l ope
rati
ng e
xpen
ses
30,1
74,2
3531
,178
,272
32,6
29,4
7934
,792
,655
36,3
20,5
3436
,769
,359
34,
979,
626
51,5
75,5
9856
,364
,908
114,
662,
784
no
n-o
PerA
tIn
G r
eVen
ueS
(exP
enSe
S):
unr
ealiz
ed g
ains
(los
ses)
on
inve
stm
ents
(25,
411,
268)
(2,2
36,6
89)
(16,
973,
874)
(1,9
66,2
56)
4,70
9,62
8(3
34,0
42)
(782
,726
) (3
,785
,475
) 8
11,0
93 (4
,231
,655
)cu
mul
ativ
e ef
fect
of c
hang
e in
acc
ount
ing
prin
cipl
es (1
)58
,351
,461
––
––
––
–
–
–
In
tere
st in
com
e (e
xpen
se)
(118
,156
)(8
9,86
3)(4
4,06
6)(3
5,45
2)(3
0,44
9)(1
6,48
0) (5
6,02
1) (1
13,1
67)
(911
,404
) (7
19,8
32)
Paym
ents
to S
tate
of M
aryl
and
(458
,373
,006
)(4
77,0
98,3
63)
(500
,970
,617
)(4
94,1
19,2
73)
(529
,403
,554
)(4
93,2
06,2
60)
(510
,608
,632
)(5
19,3
93,8
53)
(556
,264
,804
)(5
45,2
25,1
21)
Paym
ents
to o
ther
Gov
ernm
ent F
unds
/Age
ncie
s —
VLt
––
––
––
–(6
7,22
5,14
3)(1
28,8
81,2
13)
(376
,536
,947
)To
tal n
on-o
pera
ting
reve
nues
(exp
ense
s)(4
25,5
50,9
69)
(479
,424
,915
)(5
17,9
88,5
57)
(496
,120
,981
)(5
24,7
24,3
75)
(493
,556
,782
) (5
11,4
47,3
79)
(590
,517
,638
)(6
85,2
46,3
28)
(926
,713
,555
)
cHAn
GeS
In n
et P
oSI
tIo
n:
40,1
96,0
181,
123,
251
(18,
333,
412)
(12,
840,
196)
14,7
56,9
44(1
,555
,683
) (5
,415
,961
) (1
6,00
9,86
7) 6
,210
,052
(7,1
79,1
95)
totA
L n
et P
oSI
tIo
n, B
eGIn
nIn
G o
F yeA
r:4,
026,
398
44,2
22,4
1645
,345
,667
27,0
12,2
5514
,172
,059
28,9
29,0
03 2
7,37
3,32
021
,957
,359
5,94
7,49
212
,157
,544
totA
L n
et P
oSI
tIo
n, e
nd
oF y
eAr:
$ 44
,222
,416
$ 45
,345
,667
$ 27
,012
,255
$ 14
,172
,059
$ 28
,929
,003
$ 27
,373
,320
$ 21
,957
,359
$ 5,
947,
492
$ 12
,157
,544
$ 4,
978,
349
(1) t
he M
LGc
A c
hang
ed it
s tr
eatm
ent
of c
osts
ass
ocia
ted
wit
h pr
inti
ng in
stan
t ti
cket
s in
fisc
al y
ear 2
004.
Pre
viou
sly,
the
se c
osts
wer
e ex
pens
ed a
s in
curr
ed. I
n fis
cal y
ear 2
005,
the
MLG
cA
cha
nged
its
met
hod
of a
ccou
ntin
g fo
r inv
estm
ents
hel
d to
fund
ann
uity
pr
izes
pay
able
. the
se in
vest
men
ts a
re re
port
ed a
t th
eir f
air v
alue
as
perm
itte
d by
GA
SB S
tate
men
t n
o. 3
1, “A
ccou
ntin
g an
d Fi
nanc
ial r
epor
ting
for c
erta
in In
vest
men
ts a
nd fo
r ext
erna
l Inv
estm
ent
Pool
s.”
the
cum
ulat
ive
effe
ct o
f the
app
licab
le a
djus
tmen
ts a
re
refle
cted
in t
he p
rece
ding
fisc
al y
ear.

80 MARYLAND LOTTERY AND GAMING CONTROL AGENCY / Enterprise Fund of the State of Maryland
MA
RYLA
ND
LO
TTER
Y A
ND
GA
MIN
G C
ON
TRO
L A
GEN
CY
SALE
S –
FISC
AL
YEA
RS
20
04
TH
RO
UG
H 2
01
3
SALe
S By
cA
teG
ory
An
d G
AM
eFI
ScAL
yeA
r20
0420
0520
0620
0720
0820
0920
1020
1120
1220
13
nu
MB
erS:
Pick
3$
290,
754,
971
$ 29
6,10
2,94
6$
298,
075,
249
$ 29
1,91
7,22
9$
274,
291,
763
$ 27
6,34
7,70
5 $
266,
948,
839
$ 26
0,81
5,33
3$
254,
590,
816
$ 24
5,52
3,09
0
Pick
420
9,21
3,63
422
5,45
2,55
123
6,50
3,47
224
0,07
5,19
523
4,89
3,72
624
9,17
4,31
2 2
46,6
69,6
90
254,
647,
830
265,
544,
065
267,
800,
219
Num
bers
Tot
al49
9,96
8,60
552
1,55
5,49
753
4,57
8,72
153
1,99
2,42
450
9,18
5,48
952
5,52
2,01
7 5
13,6
18,5
29
515
,463
,163
52
0,13
4,88
151
3,32
3,30
9
Mo
nIt
or
:
Keno
268,
308,
259
279,
934,
456
287,
249,
705
268,
132,
183
248,
684,
056
247,
910,
424
206
,957
,090
20
2,58
9,64
620
3,85
3,84
618
1,16
6,74
7
Keno
Bon
us®
121,
487,
998
136,
579,
121
149,
009,
769
144,
546,
887
137,
893,
276
134,
381,
213
48,
713,
189
45,1
86,1
2743
,746
,000
38,3
73,0
84
Keno
Sup
er B
onus
tM–
––
––
11,9
10,9
33 1
36,1
29,0
31
132,
789,
271
139,
808,
393
125,
262,
206
race
trax
®–
944,
928
268,
332
49,8
44,9
3772
,876
,083
88,5
11,3
60 9
0,82
6,72
5 10
2,47
1,43
611
7,32
9,30
612
9,39
1,04
2
race
trax
® B
onus
––
––
––
9,3
73,6
99
13,6
94,2
5316
,935
,128
19,3
76,9
00
Mar
ylan
d H
old
’em
––
–27
,358
1,34
2,10
646
3,88
7 –
–
–
–
Mon
itor
Tot
al38
9,79
6,25
741
7,45
8,50
543
6,52
7,80
646
2,55
1,36
546
0,79
5,52
148
3,17
7,81
7 4
91,9
99,7
34
496,
730,
733
521,
672,
673
493,
569,
979
MA
trIx
:
Meg
a M
illio
ns®
90,3
12,2
2899
,737
,552
116,
249,
659
98,1
91,1
5312
9,40
2,13
412
5,96
0,40
0 1
25,2
62,5
63
98,
654,
558
105,
655,
325
66,7
34,3
74
Meg
aplie
r®–
––
––
– –
2,9
59,1
79
5,19
1,64
74,
285,
050
Lott
o36
,179
,993
34,0
96,3
3719
,975
,438
––
– –
–
–
–
Mul
ti-M
atch
®–
–15
,816
,995
30,1
16,0
5831
,200
,692
32,8
96,7
76 3
5,22
6,81
0 2
7,94
9,72
9 30
,709
,705
28,7
55,9
09
Bonu
s M
atch
521
,235
,924
21,9
16,2
6522
,425
,338
22,8
79,7
0023
,414
,509
23,4
60,0
22 2
0,76
1,95
6 2
1,38
9,57
2 21
,867
,458
21,0
78,7
55
Pow
erba
ll®–
––
––
– 2
6,51
2,01
6 5
2,73
4,54
6 78
,014
,723
126,
245,
964
Pow
er P
lay®
––
––
––
2,3
37,8
78
4,9
72,7
76
4,84
2,33
75,
097,
998
5 c
ard
cas
h–
––
––
––
–
–
11
,189
,257
Mat
rix
Tota
l1
47,7
28,1
4515
5,7
50,1
5417
4,46
7,43
015
1,18
6,91
118
4,01
7,33
518
2,31
7,19
8 2
10,1
01,2
23
208
,660
,360
24
6,28
1,1
95
26
3,3
87
,30
7
InSt
An
t:35
5,01
6,75
539
0,96
8,69
441
5,33
1,82
742
5,08
5,36
551
3,85
9,58
350
7,05
7,02
449
0,85
3,08
9 4
93,5
48,3
22
506,
803,
706
485,
838,
672
rA
FFLe
:–
––
6,49
5,00
05,
180,
800
– –
– –
–
otH
er:
2,89
8,69
6–
––
––
– –
– –
TOTA
L SA
LES:
$ 1,
395,
408,
458
$ 1,
485,
732,
850
$ 1,
560,
905,
784
$ 1,
577,
311,
065
$ 1,
673,
038,
728
$ 1,
698,
074,
056
$ 1,
706,
572,
575
$ 1,
714,
402,
578
$ 1,
794,
892,
455
$ 1,
756,
119,
267
Pro
du
ct
MIx
By
cAt
eGo
ryFI
ScAL
yeA
r20
0420
0520
0620
0720
0820
0920
1020
1120
1220
13
num
bers
Gam
es35
.83%
35.1
0%34
.25%
33.7
3%30
.44%
30.9
5%30
.10%
30.0
7%28
.98%
29.2
3%
Mon
itor
Gam
es27
.93%
28.1
0%27
.96%
29.3
3%27
.54%
28.4
5%28
.83%
28.9
7%29
.06%
28.1
1%
Mat
rix
Gam
es10
.59%
10.4
8%11
.18%
9.58
%11
.00%
10.7
4%12
.31%
12.1
7%13
.72%
15.0
0%
Inst
ant
Gam
es25
.44%
26.3
2%26
.61%
26.9
5%30
.71%
29.8
6%28
.76%
28.7
9%28
.24%
27.6
7%
raffl
e G
ames
–%–%
–%0.
41%
0.31
%–%
–%–%
–%–%
oth
er G
ames
0.21
%–%
–%–%
–%–%
–%–%
–%–%

81Comprehensive Annual Financial Report for the Years Ended June 30, 2013 and 2012
MARYLAND LOTTERY AND GAMING CONTROL AGENCY
SALES – FISCAL YEARS 2004 THROUGH 2013 (CONTINUED)
NUMBERS GAMES
Sale
s (in
mill
ions
)
0
100
200
300
400
500
600
Fiscal Year Fiscal Year
Fiscal Year
2004 2005 2006 2007 2008 2009 2011 20122010
2004 2005 2006 2007 2008 2009 2011 20122010
2004 2005 2006 2007 2008 2009 2011 20122010
2004 2005 2006 2007 2008 2009 2011 20122010
2004 2005 2006 2007 2008 2009 2011 2012
2013
2013
2013
2013
20132010
Pick 3 Pick 4
Raffle Other
MONITOR GAMES
Sale
s (in
mill
ions
)
0
100
200
300
400
500
600
Keno Keno Bonus®
Racetrax® Racetrax® Bonus Maryland Hold ’Em
Keno Super BonusTM
Fiscal Year
INSTANT GAMES
Sale
s (in
mill
ions
)
0
100
200
300
400
500
600
OTHER GAMES
Sale
s (in
mill
ions
)
0
1
2
3
4
5
6
7
Fiscal Year
MATRIX GAMESSa
les
(in m
illio
ns)
0
50
100
150
200
250
300
Mega Millions® Megaplier® Lotto
Bonus Match 5 Powerball®
Power Play® 5 Card Cash
Multi-Match®

82 MARYLAND LOTTERY AND GAMING CONTROL AGENCY / Enterprise Fund of the State of Maryland
MARYLAND LOTTERY AND GAMING CONTROL AGENCY
SALES – FISCAL YEARS 2004 THROUGH 2013 (CONTINUED)
PICK 3
Sale
s (in
mill
ions
)
0
50
100
150
200
250
300
2004 2005 2006 2007 2008 2009 2010 2011 2012
2012
2012
2012
2012
Fiscal Year
P ICK 4
Sale
s (in
mill
ions
)
0
50
100
150
200
250
300
Fiscal Year
2004 2005 2006 2007 2008 2009 2010 2011
KENO
Sale
s (in
mill
ions
)
0
50
100
150
200
250
300
Fiscal Year
KENO BONUS ®
Sale
s (in
mill
ions
)
0
30
60
90
120
150
Fiscal Year
MEGAPLIER ®
Sale
s (in
mill
ions
)
0
1
2
3
4
5
6
Fiscal Year
2004 2005 2006 2007 2008 2009 2010 2011
BONUS MATCH 5
Sale
s (in
mill
ions
)
0
5
10
15
20
25
Fiscal Year
2004 2005 2006 2007 2008 2009 2010 2011
MEGA MILLIONS ®
Sale
s (in
mill
ions
)
0
30
60
90
120
150
Fiscal Year
MULTI-MATCH ®
Sale
s (in
mill
ions
)
05
10152025303540
Fiscal Year2004 2005 2006 2007 2008 2009 2010 2011
MARYLAND HOLD’EM ®
Sale
s (in
mill
ions
)
0.0
0.5
1.0
1.5
2.0
2.5
3.0
Fiscal Year2004 2005 2006 2007 2008 2009 2010 2011 2012
2004 2005 2006 2007 2008 2009 2010 2011 2012
2012
2012
2012
2013
2013
2013
2013
2013 2013
2013
2013
2013
2013
2004 2005 2006 2007 2008 2009 2010 2011
2004 2005 2006 2007 2008 2009 2010 2011
2004 2005 2006 2007 2008 2009 2010 2011
KENO SUPER BONUS TM
Sale
s (in
mill
ions
)
Fiscal Year
0
30
60
90
120
150

83Comprehensive Annual Financial Report for the Years Ended June 30, 2013 and 2012
MARYLAND LOTTERY AND GAMING CONTROL AGENCY
SALES – FISCAL YEARS 2004 THROUGH 2013 (CONTINUED)
INSTANT
Sale
s (in
mill
ions
)
0
100
200
300
400
500
600
Fiscal Year
RAFFLE & OTHER GAMES
Sale
s (in
mill
ions
)
01234567
Fiscal Year
POWERBALL ®
Sale
s (in
mill
ions
)
0
30
60
90
120
150
Fiscal Year
POWER PLAY ®
Sale
s (in
mill
ions
)
01234567
Fiscal Year
RACETRAX ®
Sale
s (in
mill
ions
)
0
30
60
90
120
150
Fiscal Year
RACETRAX ® BONUS
Sale
s (in
mill
ions
)
0
5
10
15
20
Fiscal Year
LOTTO
Sale
s (in
mill
ions
)
05
10152025303540
Fiscal Year
2004 2005 2006 2007 2008 2009 2010 2011 2012
2012
2012
2012
2004 2005 2006 2007 2008 2009 2010 2011
2004 2005 2006 2007 2008 2009 2010 2011
2004 2005 2006 2007 2008 2009 2010 2011
2004 2005 2006 2007 2008 2009 2010 2011 2012
2012
2012
2012
2004 2005 2006 2007 2008 2009 2010 2011
2004 2005 2006 2007 2008 2009 2010 2011
2004 2005 2006 2007 2008 2009 2010 2011
2013
2013
2013
2013
2013
2013
2013
2013
5 CARD CASH
Sale
s (in
mill
ions
)
0
2
4
6
8
10
12
Fiscal Year

84 MARYLAND LOTTERY AND GAMING CONTROL AGENCY / Enterprise Fund of the State of Maryland
MARYLAND LOTTERY AND GAMING CONTROL AGENCY
SALES – FISCAL YEARS 2004 THROUGH 2013 (CONTINUED)
Sale
s (in
mill
ions
)
0
100
200
300
400
500
600
700
800
900
1,000
1,100
1,200
1,300
1,400
1,500
1,600
1,700
1,800
2004 20132005 2006Fiscal Year
2007 2008 2009 2010 2011 2012
Pick 3 Pick 4
Maryland Hold ’Em
Powerball® Power Play® Megaplier®
Lotto
Raffle
Multi-Match®
5 Card Cash
Keno Super BonusTM
Instant
Racetrax®
Racetrax® BonusOther Games
Keno
Mega Millions®
Keno Bonus®
Bonus Match 5

85Comprehensive Annual Financial Report for the Years Ended June 30, 2013 and 2012
MARYLAND LOTTERY AND GAMING CONTROL AGENCY
U.S. LOTTERIES PER CAPITA SALES – FISCAL YEAR 2013
Rank State Population (M) Total Sales ($M) Per Capita*1 Massachusetts 6.6 $ 4,807.5 $ 723 2 Georgia 9.9 3,912.2 3943 Washington, d.c. 0.6 243.8 3864 new york 19.6 7,108.9 3635 new Jersey 8.9 2,821.4 3186 connecticut 3.6 1,122.7 3137 MARYLAND 5.9 1,756.1 2988 Pennsylvania 12.8 3,699.4 2909 Florida 19.3 5,013.0 260
10 South carolina 4.7 1,199.2 25411 Michigan 9.9 2,471.0 25012 rhode Island 1.1 253.4 24113 ohio 11.5 2,694.9 23314 Illinois 12.9 2,841.3 22115 new Hampshire 1.3 278.7 21116 Virginia 8.2 1,689.2 20617 Kentucky 4.4 846.7 19318 Missouri 6.0 1,141.2 19019 north carolina 9.8 1,689.8 17320 Maine 1.3 227.8 17121 texas 26.1 4,356.0 16722 Vermont 0.6 102.1 16323 delaware 0.9 146.3 15924 Arkansas 2.9 439.5 14925 Indiana 6.5 934.0 14326 Idaho 1.6 197.6 12427 california 38.0 4,445.9 11728 Iowa 3.1 339.3 11029 colorado 5.2 566.3 10930 Arizona 6.6 692.9 10631 West Virginia 1.9 195.6 10532 Minnesota 5.4 560.4 10433 Wisconsin 5.7 565.8 9934 Louisiana 4.6 447.4 9735 Kansas 2.9 255.8 8936 nebraska 1.9 160.9 8737 oregon 3.9 330.5 8538 Washington 6.9 569.6 8339 South dakota 0.8 57.2 6940 new Mexico 2.1 141.8 6841 Montana 1.0 57.0 5742 oklahoma 3.8 200.2 5243 north dakota 0.7 27.8 40
Total 291.4 $ 61,608.1 $ 211
Source: La Fleur’s Magazine, September/October 2013 Edition * Subject to rounding.

86 MARYLAND LOTTERY AND GAMING CONTROL AGENCY / Enterprise Fund of the State of Maryland
MARYLAND LOTTERY AND GAMING CONTROL AGENCY
U.S. LOTTERIES PER CAPITA SALES – FISCAL YEARS 2004 THROUGH 2013
Per C
apita
Sal
es (i
n do
llars
)
173180
188 189 190 188
2004 2005
Fiscal Year
2006 2007 2008 20102009 2011 2012 2013
Maryland U.S. Lotteries (average)
130
140
150
160
170
180
190
200
210
220
230
240
250
260
270
280
290
300
310
254
265
279 281
298301
187
299
184
206
299
308
211
298
Sources: La Fleur’s Magazine, September/October 2013 Edition

87Comprehensive Annual Financial Report for the Years Ended June 30, 2013 and 2012
MARYLAND LOTTERY AND GAMING CONTROL AGENCY
PERCENTAGE CHANGE IN SALES – FISCAL YEARS 2004 THROUGH 2013
Fiscal Year 2004 2005 2006 2007 2008 2009 2010 2011 2012 2013
numbers Games -0.08% 4.32% 2.50% -0.48% -4.29% 3.21% -2.27% 0.36% 0.91% -1.31%
Monitor Games 3.28% 7.10% 4.57% 5.96% -0.38% 4.86% 1.83% 0.96% 5.02% -5.39%
Matrix Games 15.61% 5.43% 12.02% -13.34% 21.72% -0.92% 15.24% 0.69% 18.03% 6.95%
Instant Games 12.11% 10.13% 6.23% 2.35% 20.88% -1.32% -3.20% 0.55% 2.69% -4.14%
raffle & other Games 100.00% -100.00% –% 100.00% -20.23% -100.00% –% –% –% –%
Total Sales 5.53% 6.47% 5.06% 1.05% 6.07% 1.50% 0.50% 0.46% 4.70% -2.16%
NUMBERS GAMES
% C
hang
e in
Sal
es
-5-4-3-2-1012345
Fiscal Year Fiscal Year
Fiscal Year Fiscal Year
Fiscal Year Fiscal Year
MONITOR GAMES
% C
hang
e in
Sal
es
-6-5-4-3-2-1012345678
2004 2005 2006 2007 2008 2009 2010 2011 2004 2005 2006 2007 2008 2009 2010 2011
2004 2005 2006 2007 2008 2009 2010 2011 2004 2005 2006 2007 2008 2009 2010 2011
2004 2005 2006 2007 2008 2009 2010 2011 2004 2005 2006 2007 2008 2009 2010 2011
2012 2012
2012 2012
2012 2012
2013 2013
2013 2013
2013 2013
MATRIX GAMES
% C
hang
e in
Sal
es
-15
-10
-5
0
5
10
15
20
25
INSTANT GAMES
% C
hang
e in
Sal
es
-5
0
5
10
15
20
25
RAFFLE & OTHER GAMES
% C
hang
e in
Sal
es
-100-80-60-40-20
020406080
100
TOTAL SALES
% C
hang
e in
Sal
es
-3-2-1012345678

88 MARYLAND LOTTERY AND GAMING CONTROL AGENCY / Enterprise Fund of the State of Maryland
MARYLAND LOTTERY AND GAMING CONTROL AGENCY
U.S. LOTTERIES PERCENTAGE CHANGE IN SALES – FISCAL YEAR 2013
Rank State Total Sales ($M) % Change1 Florida $ 5,013.0 13%2 Idaho 197.6 12%3 new Hampshire 278.7 10%4 Indiana 934.0 9%5 Iowa 339.3 9%6 Montana 57.0 8%7 Minnesota 560.4 8%8 South dakota 57.2 8%9 delaware 146.3 8%
10 nebraska 160.9 7%11 Arizona 692.9 7%12 north dakota 27.8 7%13 Washington 569.6 6%14 Pennsylvania 3,699.4 6%15 Illinois 2,841.3 6%16 new Mexico 141.8 6%17 north carolina 1,689.8 6%18 South carolina 1,199.2 6%19 Virginia 1,689.2 5%20 Louisiana 447.4 4%21 texas 4,356.0 4%22 colorado 566.3 4%23 connecticut 1,122.7 4%24 Missouri 1,141.2 4%25 Wisconsin 565.8 3%26 Kentucky 846.7 3%27 Michigan 2,471.0 2%28 oregon 330.5 2%29 new Jersey 2,821.4 2%30 Georgia 3,912.2 2%31 california 4,445.9 2%32 rhode Island 253.4 2%33 new york 7,108.9 1%34 Vermont 102.1 1%35 Kansas 255.8 1%36 Massachusetts 4,807.5 1%37 oklahoma 200.2 0%38 Maine 227.8 0%39 Washington, d.c. 243.8 -1%40 ohio 2,694.9 -1%41 MARYLAND 1,756.1 -2%42 West Virginia 195.6 -3%43 Arkansas 439.5 -7%
Total $ 61,608.1
Source: La Fleur’s Magazine, September/October 2013 EditionU.S. lotteries ranked % chg. FY13 total (in US$) Excludes VLT revenue.Tennessee Lottery was not included.

89Comprehensive Annual Financial Report for the Years Ended June 30, 2013 and 2012
Prizes
Retailer Commissions
Administration
Contributions to the Maryland General Fund
Contributions to the Maryland Stadium Authority
Contributionsto the Maryland
General Fund30%
Administration3%
Prizes59%
RetailerCommissions
7%
Contributions to theMaryland Stadium Authority
1%
MARYLAND LOTTERY AND GAMING CONTROL AGENCY
ExPENSES AND CONTRIBUTIONS – CUMULATIVE FOR FISCAL YEARS 2004 THROUGH 2013

90 MARYLAND LOTTERY AND GAMING CONTROL AGENCY / Enterprise Fund of the State of Maryland
Fiscal Year
The State of Maryland General Fund
The Maryland Stadium Authority
Subdivisions of Maryland
Total Contributions
1975* $ 10,025,000 $ – $ – $ 10,025,000 1976 15,374,000 – – 15,374,000 1977 83,928,000 – – 83,928,000 1978 116,182,000 – – 116,182,000 1979 131,271,000 – – 131,271,000 1980 156,768,000 – – 156,768,000 1981 185,224,000 – – 185,224,000 1982 199,080,000 – – 199,080,000 1983 206,236,000 – – 206,236,000 1984 199,194,000 – 19,095,000 218,289,000 1985 250,123,000 – 12,158,000 262,281,000 1986 323,423,000 – – 323,423,000 1987 332,366,000 – – 332,366,000 1988 335,928,000 16,750,000 – 352,678,000 1989 319,605,000 16,221,000 – 335,826,000 1990 311,254,000 24,040,000 – 335,294,000 1991 315,247,000 24,004,000 – 339,251,000 1992 323,814,000 19,752,000 – 343,566,000 1993 301,563,000 21,612,000 – 323,175,000 1994 353,308,000 26,743,000 – 380,051,000 1995 366,577,000 19,077,000 – 385,654,000 1996 369,161,000 20,749,000 – 389,910,000 1997 359,835,000 32,818,000 – 392,653,000 1998 368,501,000 31,625,000 – 400,126,000 1999 362,145,000 31,076,000 – 393,221,000 2000 377,763,000 23,250,000 – 401,013,000 2001 385,045,000 22,000,000 – 407,045,000 2002 416,274,000 27,230,000 – 443,504,000 2003 422,948,000 21,949,000 – 444,897,000 2004 436,373,000 22,000,000 – 458,373,000 2005 455,863,000 21,235,000 – 477,098,000 2006 480,471,000 20,500,000 – 500,971,000 2007 473,119,000 21,000,000 – 494,119,000 2008 507,904,000 21,500,000 – 529,404,000 2009 473,206,260 20,000,000 – 493,206,260 2010 491,008,632 19,600,000 – 510,608,632 2011 499,393,853 20,000,000 – 519,393,8532012 536,264,804 20,000,000 – 556,264,8042013 525,960,121 19,265,000 – 545,225,121
Total $12,777,725,670 $ 583,996,000 $ 31,253,000 $ 13,392,974,670
TOTAL LIFETIME CONTRIBUTIONS $ 13,392,974,670
*Revenues generated from the inception of the MLGCA were not transferred to the State of Maryland until fiscal year 1975.
MARYLAND LOTTERY AND GAMING CONTROL AGENCY
CONTRIBUTIONS TO THE STATE OF MARYLAND – INCEPTION TO DATE

91Comprehensive Annual Financial Report for the Years Ended June 30, 2013 and 2012
TOTAL LIFETIME CONTRIBUTIONS: $13,392,974,670
Tran
sfer
s (in
mill
ions
)
0
50
100
150
200
250
300
350
400
450
500
550
2013201220112010200920082007200620052004200320022001200019991998199719961995199419931992199119901989198819871986198519841983198219811980197919781977197619751974
General Fund Stadium Authority Subdivisions of Maryland
Fiscal Year
MARYLAND LOTTERY AND GAMING CONTROL AGENCY
CONTRIBUTIONS TO THE STATE OF MARYLAND – INCEPTION TO DATE (CONTINUED)

92 MARYLAND LOTTERY AND GAMING CONTROL AGENCY / Enterprise Fund of the State of Maryland
Rank State Transfer Amount ($M)Transfers to State
as % of Sales1 Louisiana $ 156.91 37%2 oklahoma 70.49 35%3 new Jersey 950.08 34%4 Michigan 786.92 33%5 MARYLAND 556.26 31%6 new Mexico 41.33 31%7 Pennsylvania 1,060.89 30%8 california 1,300.24 30%9 Florida 1,321.60 30%
10 north dakota 7.62 29%11 Kansas 71.00 29%12 north carolina 460.47 29%13 connecticut 311.90 29%14 Virginia 464.09 29%15 Kentucky 216.44 28%16 texas 1,155.52 28%17 Wisconsin 149.95 27%18 tennessee 323.44 27%19 Washington, d.c. 66.40 27%20 South carolina 300.08 26%21 Illinois 705.08 26%22 new Hampshire 66.77 26%23 Washington 138.04 26%24 Arizona 164.72 25%25 Iowa 78.73 25%26 Georgia 901.33 25%27 Missouri 273.60 25%28 Montana 13.06 25%29 Indiana 205.25 24%30 nebraska 36.08 24%31 Minnesota 123.81 24%32 Maine 54.33 24%33 Idaho 41.60 24%34 colorado 123.25 23%35 Vermont 22.33 22%36 Massachusetts 983.79 21%37 Arkansas 97.71 21%38 delaware 329.90 –39 new york 2,877.99 –40 ohio 771.03 –41 oregon 525.11 –42 rhode Island 377.71 –43 South dakota 103.70 –44 West Virginia 693.84 –
Total **$ 19,480.39Source: La Fleur’s 2013 World Lottery Almanac (21st Edition)* Data for fiscal year 2013 is not available at this time.** Subject to rounding.– Percentage of transfers to the state as a percentage of lottery sales is not available because lottery
transfers and transfers associated with Video Lottery Terminals (i.e., slot machines) are commingled.
MARYLAND LOTTERY AND GAMING CONTROL AGENCY
U.S. LOTTERIES TRANSFERS TO STATE – FISCAL YEAR 2012*

93Comprehensive Annual Financial Report for the Years Ended June 30, 2013 and 2012
Fiscal Year 2013Hollywood Casino — Perryville
Casino at Ocean Downs
Maryland Live! Casino
Rocky Gap Casino Resort Total
education trust Fund $ 37,296,321 $ 24,718,054 $ 211,723,265 $ 1,176,388 $ 274,914,028casino 25,087,932 16,644,463 142,367,378 1,400,462 185,500,235Purse dedication 5,321,683 3,530,644 30,199,141 70,023 39,121,491Local Impact Grants 4,181,322 2,774,077 23,727,897 77,025 30,760,321race tracks Facility
renewal Account 1,475,939 1,005,207 8,299,050 – 10,780,196MLGcA 1,520,481 1,008,755 8,628,327 56,018 11,213,581Small, Minority, Woman
Business 1,140,360 756,566 6,471,246 21,007 8,389,179Total $ 76,024,038 $ 50,437,766 $ 431,416,304 $ 2,800,923 $ 560,679,031
Fiscal Year 2012Hollywood Casino — Perryville
Casino at Ocean Downs
Maryland Live! Casino
Rocky Gap Casino Resort Total
education trust Fund $ 57,275,940 $ 23,286,167 $ 14,058,033 $ – $ 94,620,140casino 38,971,258 15,844,197 9,565,259 – 64,380,714Purse dedication 8,266,631 3,360,890 2,028,994 – 13,656,515Local Impact Grants 6,495,210 2,640,699 1,594,210 – 10,730,119race tracks Facility
renewal Account 2,952,368 1,200,318 724,641 – 4,877,327MLGcA 2,361,894 960,255 579,713 – 3,901,862Small, Minority, Woman
Business 1,771,421 720,190 434,785 – 2,926,396Total $ 118,094,722 $ 48,012,716 $ 28,985,635 $ – $ 195,093,073
Fiscal Year 2011Hollywood Casino — Perryville
Casino at Ocean Downs
Maryland Live! Casino
Rocky Gap Casino Resort Total
education trust Fund $ 40,108,178 $ 9,911,227 $ – $ – $ 50,0194,05casino 27,290,101 6,743,721 – – 34,033,822Purse dedication 5,788,809 1,430,486 – – 7,219,296Local Impact Grants 4,548,350 1,123,954 – – 5,672,304race tracks Facility
renewal Account 2,067,432 510,888 – – 2,578,320MLGcA 1,653,975 408,710 – – 2,062,686Small, Minority, Woman
Business 1,240,459 306,533 – – 1,546,992Total $ 82,697,304 $ 20,435,520 $ – $ – $ 103,132,824
* Fiscal year 2011 was the first year for gross terminal revenue.
MARYLAND LOTTERY AND GAMING CONTROL AGENCY
GROSS TERMINAL REVENUE DISTRIBUTIONS – FISCAL YEARS 2011 THROUGH 2013*
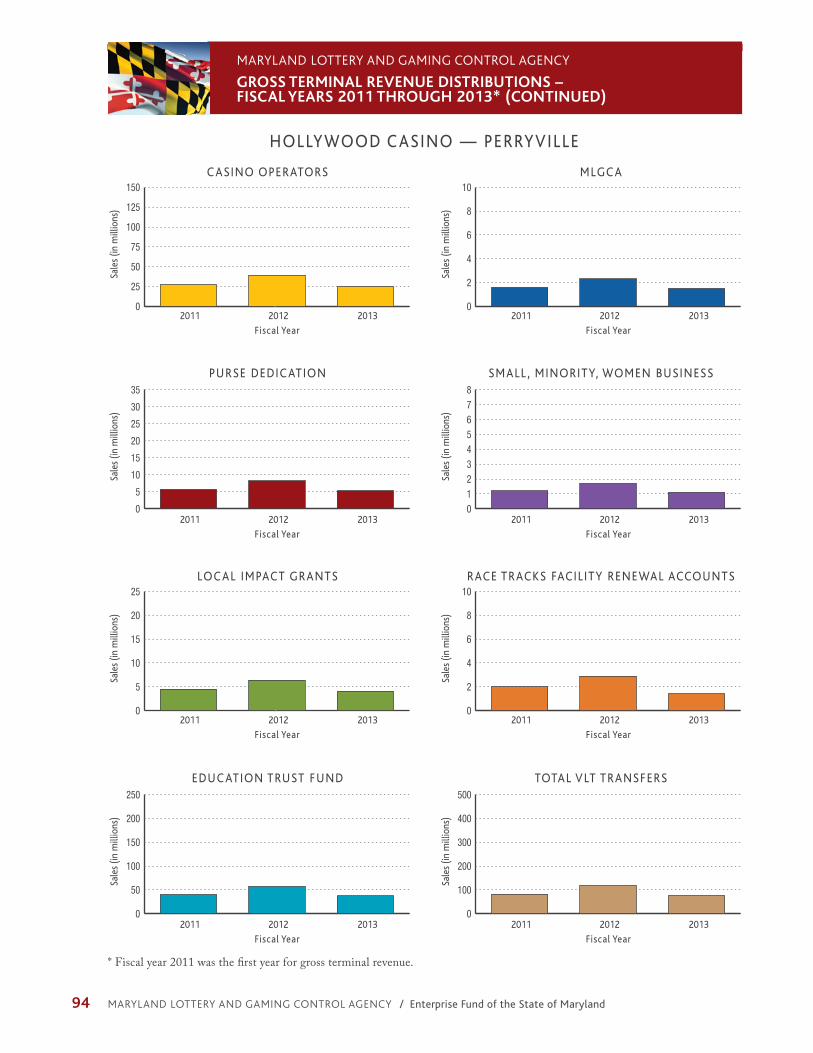
94 MARYLAND LOTTERY AND GAMING CONTROL AGENCY / Enterprise Fund of the State of Maryland
MARYLAND LOTTERY AND GAMING CONTROL AGENCY
GROSS TERMINAL REVENUE DISTRIBUTIONS – FISCAL YEARS 2011 THROUGH 2013* (CONTINUED)
0
2
4
6
8
10
Fiscal Year
2011 2012 2013
MLGCA
Sale
s (in
mill
ions
)
PURSE DEDICATION
Sale
s (in
mill
ions
)
0
5
10
15
20
25
30
35
Fiscal Year
2011 2012 2013012345678
Fiscal Year
2011 2012 2013
SMALL , MINORITY, WOMEN BUSINESS
Sale
s (in
mill
ions
)
CASINO OPERATORS
HOLLYWOOD CASINO — PERRYVILLE
Sale
s (in
mill
ions
)
0
25
50
75
100
125
150
Fiscal Year
2011 2012 2013
0
2
4
6
8
10
Fiscal Year
2011 2012 2013
RACE TRACKS FACIL ITY RENEWAL ACCOUNTS
Sale
s (in
mill
ions
)
EDUCATION TRUST FUND
Sale
s (in
mill
ions
)
0
50
100
150
200
250
Fiscal Year
2011 2012 20130
100
200
300
400
500
Fiscal Year
2011 2012 2013
TOTAL VLT TRANSFERS
Sale
s (in
mill
ions
)
LOCAL IMPACT GRANTS
Sale
s (in
mill
ions
)
0
5
10
15
20
25
Fiscal Year
2011 2012 2013
* Fiscal year 2011 was the first year for gross terminal revenue.

95Comprehensive Annual Financial Report for the Years Ended June 30, 2013 and 2012
MARYLAND LOTTERY AND GAMING CONTROL AGENCY
GROSS TERMINAL REVENUE DISTRIBUTIONS – FISCAL YEARS 2011 THROUGH 2013* (CONTINUED)
0
2
4
6
8
10
Fiscal Year
2011 2012 2013
MLGCA
Sale
s (in
mill
ions
)
PURSE DEDICATION
Sale
s (in
mill
ions
)
0
5
10
15
20
25
30
35
Fiscal Year
2011 2012 2013012345678
Fiscal Year
2011 2012 2013
SMALL , MINORITY, WOMEN BUSINESS
Sale
s (in
mill
ions
)
CASINO OPERATORS
Sale
s (in
mill
ions
)
0
25
50
75
100
125
150
Fiscal Year
2011 2012 2013
0
2
4
6
8
10
Fiscal Year
2011 2012 2013
RACE TRACKS FACIL ITY RENEWAL ACCOUNTS
Sale
s (in
mill
ions
)
EDUCATION TRUST FUND
Sale
s (in
mill
ions
)
0
50
100
150
200
250
Fiscal Year
2011 2012 20130
100
200
300
400
500
Fiscal Year
2011 2012 2013
TOTAL VLT TRANSFERS
Sale
s (in
mill
ions
)
LOCAL IMPACT GRANTS
Sale
s (in
mill
ions
)
0
5
10
15
20
25
Fiscal Year
2011 2012 2013
CASINO AT OCEAN DOWNS
* Fiscal year 2011 was the first year for gross terminal revenue.

96 MARYLAND LOTTERY AND GAMING CONTROL AGENCY / Enterprise Fund of the State of Maryland
MARYLAND LOTTERY AND GAMING CONTROL AGENCY
GROSS TERMINAL REVENUE DISTRIBUTIONS – FISCAL YEARS 2011 THROUGH 2013* (CONTINUED)
0
2
4
6
8
10
Fiscal Year
2011 2012 2013
MLGCA
Sale
s (in
mill
ions
)
PURSE DEDICATION
Sale
s (in
mill
ions
)
0
5
10
15
20
25
30
35
Fiscal Year
2011 2012 2013012345678
Fiscal Year
2011 2012 2013
SMALL , MINORITY, WOMEN BUSINESS
Sale
s (in
mill
ions
)
CASINO OPERATORS
Sale
s (in
mill
ions
)
0
25
50
75
100
125
150
Fiscal Year
2011 2012 2013
0
2
4
6
8
10
Fiscal Year
2011 2012 2013
RACE TRACKS FACIL ITY RENEWAL ACCOUNTS
Sale
s (in
mill
ions
)
EDUCATION TRUST FUND
Sale
s (in
mill
ions
)
0
50
100
150
200
250
Fiscal Year
2011 2012 20130
100
200
300
400
500
Fiscal Year
2011 2012 2013
TOTAL VLT TRANSFERS
Sale
s (in
mill
ions
)
LOCAL IMPACT GRANTS
Sale
s (in
mill
ions
)
0
5
10
15
20
25
Fiscal Year
2011 2012 2013
MARYLAND LIVE! CASINO
* Maryland Live! Casino began operation in June 2012.

97Comprehensive Annual Financial Report for the Years Ended June 30, 2013 and 2012
MARYLAND LOTTERY AND GAMING CONTROL AGENCY
GROSS TERMINAL REVENUE DISTRIBUTIONS – FISCAL YEARS 2011 THROUGH 2013* (CONTINUED)
0
2
4
6
8
10
Fiscal Year
2011 2012 2013
MLGCA
Sale
s (in
mill
ions
)
PURSE DEDICATION
Sale
s (in
mill
ions
)
0
5
10
15
20
25
30
35
Fiscal Year
2011 2012 2013012345678
Fiscal Year
2011 2012 2013
SMALL , MINORITY, WOMEN BUSINESS
Sale
s (in
mill
ions
)
CASINO OPERATORS
Sale
s (in
mill
ions
)
0
25
50
75
100
125
150
Fiscal Year
2011 2012 2013
0
2
4
6
8
10
Fiscal Year
2011 2012 2013
RACE TRACKS FACIL ITY RENEWAL ACCOUNTS
Sale
s (in
mill
ions
)
EDUCATION TRUST FUND
Sale
s (in
mill
ions
)
0
50
100
150
200
250
Fiscal Year
2011 2012 20130
100
200
300
400
500
Fiscal Year
2011 2012 2013
TOTAL VLT TRANSFERS
Sale
s (in
mill
ions
)
LOCAL IMPACT GRANTS
Sale
s (in
mill
ions
)
0
5
10
15
20
25
Fiscal Year
2011 2012 2013
ROCKY GAP CASINO RESORT
* Rocky Gap Casino Resort began operation in May 2013.

98 MARYLAND LOTTERY AND GAMING CONTROL AGENCY / Enterprise Fund of the State of Maryland
MARYLAND LOTTERY AND GAMING CONTROL AGENCY
GROSS TERMINAL REVENUE DISTRIBUTIONS – FISCAL YEARS 2011 THROUGH 2013* (CONTINUED)
0
2
4
6
8
10
12
Fiscal Year
2011 2012 2013
MLGCA
Sale
s (in
mill
ions
)
PURSE DEDICATION
Sale
s (in
mill
ions
)
05
10152025303540
Fiscal Year
2011 2012 20130
2
4
6
8
10
Fiscal Year
2011 2012 2013
SMALL , MINORITY, WOMEN BUSINESS
Sale
s (in
mill
ions
)
CASINO OPERATORS
Sale
s (in
mill
ions
)
0
50
100
150
200
Fiscal Year
2011 2012 2013
0
2
4
6
8
10
12
Fiscal Year
2011 2012 2013
RACE TRACKS FACIL ITY RENEWAL ACCOUNTS
Sale
s (in
mill
ions
)
EDUCATION TRUST FUND
Sale
s (in
mill
ions
)
0
50
100
150
200
250
300
Fiscal Year
2011 2012 20130
100
200
300
400
500
600
Fiscal Year
2011 2012 2013
TOTAL VLT TRANSFERS
Sale
s (in
mill
ions
)
LOCAL IMPACT GRANTS
Sale
s (in
mill
ions
)
0
5
10
15
20
25
30
35
Fiscal Year
2011 2012 2013
ALL CASINOS COMBINED
* Fiscal year 2011 was the first year for gross terminal revenue.

99Comprehensive Annual Financial Report for the Years Ended June 30, 2013 and 2012
MARYLAND LOTTERY AND GAMING CONTROL AGENCY
GROSS TERMINAL REVENUE DISTRIBUTION – FISCAL YEAR 2013 (CONTINUED)
Maryland EducationTrust Fund
46.7%
Race TracksFacility Renewal
Accounts1.8%
Maryland Lottery and Gaming
Control Agency1.8%
Small, Minority andWoman-Owned
Business1.4%
Horse PurseDedication
6.4%
Local Impact Grants5.1%
Casino Operators36.8%
Maryland Education Trust Fund
Local Impact Grants
Small, Minority and Woman-Owned Business
Race Tracks Facility Renewal Accounts
Horse Purse Dedication
Maryland Lottery and Gaming Control AgencyCasino Operators

100 MARYLAND LOTTERY AND GAMING CONTROL AGENCY / Enterprise Fund of the State of Maryland
Fiscal Year 2013
Hollywood Casino — Perryville
Maryland Live! Casino
Rocky Gap Casino Resort Total
education trust Fund $ 1,191,443 $ 8,323,862 $ 92,254 $ 9,607,559
casino 4,765,772 33,295,447 369,016 38,430,235
Total $ 5,957,215 $ 41,619,309 $ 461,270 $ 48,037,794
TABLE GAME REVENUE DISTRIBUTION
Sale
s (in
mill
ions
)
0
5
10
15
20
25
30
35
40
Education Trust Fund Casino
Hollywood Casino – Perryville
Maryland Live! Casino Rocky Gap Casino Resort Total
* Fiscal year 2013 was the first year for table game revenue.– As of June 30, 2013, the Casino at Ocean Downs had not implemented table games.
MARYLAND LOTTERY AND GAMING CONTROL AGENCY
TABLE GAME REVENUE DISTRIBUTION – FISCAL YEAR 2013*

101Comprehensive Annual Financial Report for the Years Ended June 30, 2013 and 2012
MARYLAND LOTTERY AND GAMING CONTROL AGENCY
RETAILERS, POPULATION AND SALES BY REGION
Fiscal Year 2013
Allegany County
Anne Arundel County
Baltimore County
Calvert County
Caroline County
Carroll County
Cecil County
Charles County
# of retailers 59 433 706 65 29 131 88 136
% of total retailers 1.32% 9.67% 15.77% 1.45% 0.65% 2.93% 1.97% 3.04%
Population 74,489 544,818 812,401 89,264 32,954 167,313 101,628 149,242
% of total Population
1.28% 9.33% 13.91% 1.53% 1.67% 8.48% 1.74% 2.56%
% of Sales 0.60% 9.74% 16.05% 1.45% 0.42% 2.03% 1.17% 3.46%
Dorchester County
Frederick County
Garrett County
Harford County
Howard County
kent County
Montgomery County
Prince George's County
# of retailers 28 155 31 175 160 16 411 580
% of total retailers 0.63% 3.46% 0.69% 3.91% 3.57% 0.36% 9.18% 12.96%
Population 32,703 237,309 30,097 246,651 293,879 20,265 991,645 874,045
% of total Population
0.56% 4.06% 0.52% 4.22% 5.03% 0.35% 16.98% 14.97%
% of Sales 0.48% 2.32% 0.19% 3.48% 2.85% 0.26% 10.22% 21.07%
queen Anne's County
St. Mary's County
Somerset County
Talbot County
Washington County
Wicomico County
Worcester County
Baltimore City
# of retailers 54 97 19 34 118 79 110 763
% of total retailers 1.21% 2.17% 0.42% 0.76% 2.64% 1.76% 2.46% 17.04%
Population 48,400 107,681 26,370 37,974 148,817 99,965 51,446 620,216
% of total Population
0.83% 1.84% 0.45% 0.65% 2.55% 1.71% 0.88% 10.62%
% of Sales 0.67% 2.14% 0.35% 0.49% 1.62% 1.15% 1.23% 16.58%
Note: Information is accumulated and retained in this format only for fiscal years 2006–2013. Prospectively, the data will be accumulated and, ultimately, the schedule will contain information for a ten-year period.

102 MARYLAND LOTTERY AND GAMING CONTROL AGENCY / Enterprise Fund of the State of Maryland
MARYLAND LOTTERY AND GAMING CONTROL AGENCY
RETAILERS, POPULATION AND SALES BY REGION (CONTINUED)
Fiscal Year 2012
Allegany County
Anne Arundel County
Baltimore County
Calvert County
Caroline County
Carroll County
Cecil County
Charles County
# of retailers 64 462 749 72 32 142 96 143
% of total retailers 1.36% 9.8% 15.9% 1.53% 0.68% 3.02% 2.04% 3.03%
Population 75,087 537,656 805,029 88,737 33,066 167,134 101,108 146,551
% of total Population
1.30% 9.31% 13.94% 1.54% 1.69% 8.55% 1.75% 2.54%
% of Sales 0.61% 10.16% 15.99% 1.39% 0.38% 1.98% 1.14% 3.39%
Dorchester County
Frederick County
Garrett County
Harford County
Howard County
kent County
Montgomery County
Prince George's County
# of retailers 34 168 30 191 178 16 429 611
% of total retailers 0.72% 3.57% 0.64% 4.05% 3.78% 0.34% 9.10% 12.97%
Population 32,618 233,385 30,097 244,826 287,085 20,197 971,777 863,420
% of total Population
0.56% 4.04% 0.52% 4.24% 4.97% 0.35% 16.83% 14.95%
% of Sales 0.50% 2.23% 0.19% 3.52% 2.94% 0.23% 10.15% 20.86%
queen Anne's County
St. Mary's County
Somerset County
Talbot County
Washington County
Wicomico County
Worcester County
Baltimore City
# of retailers 52 100 22 34 123 79 108 777
% of total retailers 1.10% 2.12% 0.47% 0.72% 2.61% 1.68% 2.29% 16.49%
Population 47,798 105,151 26,470 37,782 147,430 98,733 51,454 620,961
% of total Population
0.83% 1.82% 0.46% 0.65% 2.55% 1.71% 0.89% 10.76%
% of Sales 0.68% 2.14% 0.35% 0.49% 1.56% 1.16% 1.22% 16.74%
Note: Information is accumulated and retained in this format only for fiscal years 2006–2013. Prospectively, the data will be accumulated and, ultimately, the schedule will contain information for a ten-year period.

103Comprehensive Annual Financial Report for the Years Ended June 30, 2013 and 2012
MARYLAND LOTTERY AND GAMING CONTROL AGENCY
RETAILERS, POPULATION AND SALES BY REGION (CONTINUED)
Fiscal Year 2011
Allegany County
Anne Arundel County
Baltimore County
Calvert County
Caroline County
Carroll County
Cecil County
Charles County
# of retailers 55 411 682 70 29 129 87 127
% of total retailers 1.30% 9.73% 16.14% 1.66% 0.69% 3.05% 2.06% 3.01%
Population 75,087 537,656 805,029 88,737 33,066 167,134 101,108 146,551
% of total Population
1.30% 9.31% 13.94% 1.54% 1.69% 8.55% 1.75% 2.54%
% of Sales 0.66% 10.27% 16.23% 1.42% 0.39% 2.01% 1.15% 3.36%
Dorchester County
Frederick County
Garrett County
Harford County
Howard County
kent County
Montgomery County
Prince George's County
# of retailers 32 146 27 169 151 14 390 560
% of total retailers 0.76% 3.45% 0.64% 4.00% 3.57% 0.33% 9.23% 13.25%
Population 32,618 233,385 30,097 244,826 287,085 20,197 971,777 863,420
% of total Population
0.56% 4.04% 0.52% 4.24% 4.97% 0.35% 16.83% 14.95%
% of Sales 0.50% 2.12% 0.20% 3.40% 2.79% 0.25% 9.88% 20.59%
queen Anne's County
St. Mary's County
Somerset County
Talbot County
Washington County
Wicomico County
Worcester County
Baltimore City
# of retailers 49 91 18 30 116 74 100 669
% of total retailers 1.16% 2.15% 0.43% 0.71% 2.74% 1.75% 2.37% 15.83%
Population 47,798 105,151 26,470 37,782 147,430 98,733 51,454 620,961
% of total Population
0.83% 1.82% 0.46% 0.65% 2.55% 1.71% 0.89% 10.76%
% of Sales 0.68% 2.06% 0.34% 0.48% 1.51% 1.28% 1.37% 17.05%
Note: Information is accumulated and retained in this format only for fiscal years 2006–2013. Prospectively, the data will be accumulated and, ultimately, the schedule will contain information for a ten-year period.

104 MARYLAND LOTTERY AND GAMING CONTROL AGENCY / Enterprise Fund of the State of Maryland
MARYLAND LOTTERY AND GAMING CONTROL AGENCY
RETAILERS, POPULATION AND SALES BY REGION (CONTINUED)
Fiscal Year 2010
Allegany County
Anne Arundel County
Baltimore County
Calvert County
Caroline County
Carroll County
Cecil County
Charles County
# of retailers 57 454 711 73 29 141 94 142
% of total retailers 1.24% 9.90% 15.51% 1.59% 0.63% 3.08% 2.05% 3.10%
Population 72,532 521,209 789,814 89,212 33,367 170,089 100,796 142,226
% of total Population
1.27% 9.14% 13.86% 1.56% 0.59% 2.98% 1.77% 2.49%
% of Sales 0.63% 10.20% 16.34% 1.37% 0.42% 2.01% 1.25% 3.21%
Dorchester County
Frederick County
Garrett County
Harford County
Howard County
kent County
Montgomery County
Prince George's County
# of retailers 34 159 28 179 165 16 429 599
% of total retailers 0.74% 3.47% 0.61% 3.90% 3.60% 0.35% 9.36% 13.07%
Population 32,043 227,980 29,555 242,514 281,884 20,247 971,600 834,560
% of total Population
0.56% 4.00% 0.52% 4.26% 4.95% 0.36% 17.05% 14.64%
% of Sales 0.50% 2.11% 0.19% 3.54% 2.74% 0.25% 9.74% 20.10%
queen Anne's County
St. Mary's County
Somerset County
Talbot County
Washington County
Wicomico County
Worcester County
Baltimore City
# of retailers 53 103 21 33 121 78 112 753
% of total retailers 1.16% 2.25% 0.46% 0.72% 2.64% 1.70% 2.44% 16.43%
Population 47,958 102,999 25,959 36,262 145,910 94,222 49,122 637,418
% of total Population
0.84% 1.81% 0.46% 0.64% 2.56% 1.65% 0.86% 11.18%
% of Sales 0.66% 2.10% 0.37% 0.50% 1.51% 1.19% 1.45% 17.62%
Note: Information is accumulated and retained in this format only for fiscal years 2006–2013. Prospectively, the data will be accumulated and, ultimately, the schedule will contain information for a ten-year period.

105Comprehensive Annual Financial Report for the Years Ended June 30, 2013 and 2012
MARYLAND LOTTERY AND GAMING CONTROL AGENCY
RETAILERS, POPULATION AND SALES BY REGION (CONTINUED)
Fiscal Year 2009
Allegany County
Anne Arundel County
Baltimore County
Calvert County
Caroline County
Carroll County
Cecil County
Charles County
# of retailers 57 440 715 73 30 133 93 142
% of total retailers 1.26% 9.72% 15.79% 1.61% 0.66% 2.94% 2.05% 3.14%
Population 72,661 510,824 786,547 87,539 32,240 168,195 98,358 139,008
% of total Population
1.33% 9.32% 14.35% 1.60% 0.59% 3.07% 1.79% 2.54%
% of Sales 0.59% 10.20% 16.07% 1.40% 0.44% 1.97% 1.17% 3.20%
Dorchester County
Frederick County
Garrett County
Harford County
Howard County
kent County
Montgomery County
Prince George's County
# of retailers 38 154 26 175 159 16 421 590
% of total retailers 0.84% 3.40% 0.57% 3.87% 3.51% 0.35% 9.30% 13.03%
Population 31,468 222,034 29,649 238,960 270,651 19,197 873,341 801,515
% of total Population
0.57% 4.05% 0.54% 4.36% 4.94% 0.35% 15.93% 14.62%
% of Sales 0.47% 1.97% 0.18% 3.41% 2.55% 0.25% 9.64% 20.48%
queen Anne's County
St. Mary's County
Somerset County
Talbot County
Washington County
Wicomico County
Worcester County
Baltimore City
# of retailers 50 102 20 36 124 81 103 749
% of total retailers 1.10% 2.25% 0.44% 0.80% 2.74% 1.79% 2.28% 16.55%
Population 40,563 86,211 24,747 33,812 131,923 84,644 46,543 651,154
% of total Population
1.10% 2.25% 0.44% 0.80% 2.74% 1.79% 2.28% 16.55%
% of Sales 0.61% 2.19% 0.37% 0.50% 1.45% 1.22% 1.43% 18.22%
Note: Information is accumulated and retained in this format only for fiscal years 2006–2013. Prospectively, the data will be accumulated and, ultimately, the schedule will contain information for a ten-year period.

106 MARYLAND LOTTERY AND GAMING CONTROL AGENCY / Enterprise Fund of the State of Maryland
MARYLAND LOTTERY AND GAMING CONTROL AGENCY
RETAILERS, POPULATION AND SALES BY REGION (CONTINUED)
Fiscal Year 2008
Allegany County
Anne Arundel County
Baltimore County
Calvert County
Caroline County
Carroll County
Cecil County
Charles County
# of retailers 53 378 600 59 27 116 83 116
% of total retailers 1.4% 9.7% 15.4% 1.5% 0.7% 3.0% 2.1% 3.0%
Population 72,594 512,154 788,994 88,223 32,910 169,220 99,695 140,444
% of total Population
1.3% 9.1% 14.0% 1.6% 0.6% 3.0% 1.8% 2.5%
% of Sales 0.6% 10.4% 15.8% 1.4% 0.5% 2.0% 1.1% 3.3%
Dorchester County
Frederick County
Garrett County
Harford County
Howard County
kent County
Montgomery County
Prince George's County
# of retailers 32 133 23 157 127 16 357 528
% of total retailers 0.8% 3.4% 0.6% 4.0% 3.3% 0.4% 9.2% 13.5%
Population 31,846 224,705 29,627 239,993 273,669 19,987 930,813 828,770
% of total Population
0.6% 4.0% 0.5% 4.3% 4.9% 0.4% 16.6% 14.8%
% of Sales 0.5% 2.1% 0.2% 3.4% 2.4% 0.3% 9.6% 20.3%
queen Anne's County
St. Mary's County
Somerset County
Talbot County
Washington County
Wicomico County
Worcester County
Baltimore City
# of retailers 43 94 17 31 111 69 89 639
% of total retailers 1.1% 2.4% 0.4% 0.8% 2.8% 1.8% 2.3% 16.4%
Population 46,571 100,378 26,016 36,193 145,113 93,600 49,374 637,455
% of total Population
0.8% 1.8% 0.5% 0.6% 2.6% 1.7% 0.9% 11.3%
% of Sales 0.6% 2.2% 0.4% 0.5% 1.6% 1.3% 1.6% 18.1%
Note: Information is accumulated and retained in this format only for fiscal years 2006–2013. Prospectively, the data will be accumulated and, ultimately, the schedule will contain information for a ten-year period.

107Comprehensive Annual Financial Report for the Years Ended June 30, 2013 and 2012
MARYLAND LOTTERY AND GAMING CONTROL AGENCY
RETAILERS, POPULATION AND SALES BY REGION (CONTINUED)
Fiscal Year 2007
Allegany County
Anne Arundel County
Baltimore County
Calvert County
Caroline County
Carroll County
Cecil County
Charles County
# of retailers 52 360 586 52 26 114 81 114
% of total retailers 1.3% 9.2% 15.0% 1.3% 0.7% 2.9% 2.1% 2.9%
Population 72,831 509,300 787,384 88,804 32,617 170,260 99,506 140,416
% of total Population
1.3% 9.1% 14.0% 1.6% 0.6% 3.0% 1.8% 2.5%
% of Sales 0.7% 10.5% 15.4% 1.4% 0.5% 1.9% 1.0% 3.5%
Dorchester County
Frederick County
Garrett County
Harford County
Howard County
kent County
Montgomery County
Prince George's County
# of retailers 32 131 22 154 127 16 340 516
% of total retailers 0.8% 3.4% 0.6% 4.0% 3.3% 0.4% 8.7% 13.2%
Population 31,631 222,938 29,859 241,402 272,452 19,983 932,131 841,315
% of total Population
0.6% 4.0% 0.5% 4.3% 4.8% 0.4% 16.6% 15.0%
% of Sales 0.5% 2.1% 0.2% 3.4% 2.3% 0.3% 9.1% 20.4%
queen Anne's County
St. Mary's County
Somerset County
Talbot County
Washington County
Wicomico County
Worcester County
Baltimore City
# of retailers 38 87 19 29 104 70 83 614
% of total retailers 1.0% 2.2% 0.5% 0.7% 2.7% 1.8% 2.1% 15.8%
Population 46,241 98,854 25,774 36,062 143,748 91,987 48,866 631,366
% of total Population
0.8% 1.8% 0.5% 0.6% 2.6% 1.6% 0.9% 11.2%
% of Sales 0.6% 2.4% 0.4% 0.5% 1.6% 1.3% 1.7% 18.6%
Note: Information is accumulated and retained in this format only for fiscal years 2006–2013. Prospectively, the data will be accumulated and, ultimately, the schedule will contain information for a ten-year period.

108 MARYLAND LOTTERY AND GAMING CONTROL AGENCY / Enterprise Fund of the State of Maryland
MARYLAND LOTTERY AND GAMING CONTROL AGENCY
RETAILERS, POPULATION AND SALES BY REGION (CONTINUED)
Fiscal Year 2006
Allegany County
Anne Arundel County
Baltimore County
Calvert County
Caroline County
Carroll County
Cecil County
Charles County
# of retailers 50 355 571 51 25 106 77 108
% of total retailers 1.40% 9.60% 15.50% 1.40% 0.70% 2.90% 2.10% 2.90%
Population 73,245 509,397 783,405 87,622 31,805 168,397 97,474 138,106
% of total Population
1.30% 9.10% 14.00% 1.60% 0.60% 3.00% 1.70% 2.50%
% of Sales 0.70% 10.40% 15.30% 1.50% 0.40% 1.90% 1.10% 3.30%
Dorchester County
Frederick County
Garrett County
Harford County
Howard County
kent County
Montgomery County
Prince George's County
# of retailers 28 133 21 156 122 15 343 507
% of total retailers 0.80% 3.60% 0.60% 4.20% 3.30% 0.40% 9.30% 13.80%
Population 31,351 220,409 29,863 238,850 269,174 19,908 927,405 842,764
% of total Population
0.60% 3.90% 0.50% 4.30% 4.80% 0.40% 16.50% 15.00%
% of Sales 0.50% 2.20% 0.20% 3.40% 2.30% 0.30% 9.30% 20.40%
queen Anne's County
St. Mary's County
Somerset County
Talbot County
Washington County
Wicomico County
Worcester County
Baltimore City
# of retailers 37 79 18 28 102 71 81 600
% of total retailers 1.00% 2.10% 0.50% 0.80% 2.80% 1.90% 2.20% 16.30%
Population 45,469 96,868 25,666 35,630 141,563 90,252 48,599 636,377
% of total Population
0.80% 1.70% 0.50% 0.60% 2.50% 1.60% 0.90% 11.30%
% of Sales 0.60% 2.20% 0.40% 0.50% 1.70% 1.20% 1.70% 18.60%
Note: Information is accumulated and retained in this format only for fiscal years 2006–2013. Prospectively, the data will be accumulated and, ultimately, the schedule will contain information for a ten-year period.

109Comprehensive Annual Financial Report for the Years Ended June 30, 2013 and 2012
MARYLAND LOTTERY AND GAMING CONTROL AGENCY
MARYLAND’S LARGEST PRIVATE EMPLOYERS
2013 2012 and 2011Employer (listed alphabetically) Employer (listed alphabetically)
Giant Food StoresHelix Health System, Inc.Home depotJohns Hopkins HospitalJohns Hopkins universitynorthrop Grumman corporationSafewaytargetuniversity of Maryland Medical SystemsWalMart Associates
Giant Food StoresHelix Health System, Inc.Home depotJohns Hopkins HospitalJohns Hopkins universitynorthrop Grumman corporationSafewaytargetuniversity of Maryland Medical SystemsWal-Mart/Sam’s club
2010 and 2009 2008 and 2007Employer (listed alphabetically) Employer (listed alphabetically)
Adventist Health careGiant Food StoresHelix Health System, Inc.Johns Hopkins HospitalJohns Hopkins universitynorthrop Grumman corporationSafewaytargetuniversity of Maryland Medical SystemsWal-Mart/Sam’s club
Giant of Maryland, LLcHelix Health System, Inc.Home depot uSA, Inc.Johns Hopkins HospitalJohns Hopkins universityMacy’snorthrop Grumman corporationSafeway, Inc.target corporationuniversity of Maryland Medical Systemsunited Parcel ServiceWal-Mart
2006 and 2005 2004Employer (listed alphabetically) Employer (listed alphabetically)
Giant of Maryland, LLcHelix Health System, Inc.Home depot uSA, Inc.Johns Hopkins HospitalJohns Hopkins universitynorthrop Grumman corporationSafeway, Inc.targetunited Parcel ServiceWal-Mart
Giant of Maryland, LLcHelix Health System, Inc.Home depot uSA, Inc.Johns Hopkins HospitalJohns Hopkins universitynorthrop Grumman corporationSafeway, Inc.united Parcel ServiceVerizon Maryland, Inc.Wal-Mart
Source: Department of Labor, Licensing and Regulation; Division of Workforce Development and Adult Learning. Information reported on a calendar basis. The number of employees is not available.

110 MARYLAND LOTTERY AND GAMING CONTROL AGENCY / Enterprise Fund of the State of Maryland
MARYLAND LOTTERY AND GAMING CONTROL AGENCY
RATIO OF OUTSTANDING DEBT BY TYPE – FISCAL YEARS 2004 THROUGH 2013
Fiscal Year Capital Leases Percentage of
Annual Lottery Sales
2004 $ 3,131,566 0.22%
2005 1,672,615 0.10%
2006 1,255,713 0.08%
2007 1,123,995 0.07%
2008 648,070 0.04%
2009 5,748,257 0.34%
2010 5,261,122 0.31%
2011 4,094,609 0.24%
2012 2,933,939 0.16%
2013 1,780,253 0.10%
Fiscal YearVLT
Capital Leases
Percentage of Gross Terminal
Revenue
2004 $ – –%
2005 – –%
2006 – –%
2007 – –%
2008 – –%
2009 – –%
2010 – –%
2011 40,791,831 39.60%
2012 53,278,861 27.30%
2013 29,242,927 5.22%
Fiscal year 2011 was the first year for VLT Capital Leases and annual gross terminal revenue.
In the future, the MLGCA is only authorized to issue additional debt associated with the acquisition of capital assets.

111Comprehensive Annual Financial Report for the Years Ended June 30, 2013 and 2012
MARYLAND LOTTERY AND GAMING CONTROL AGENCY
DEMOGRAPHIC AND ECONOMIC STATISTICS – FISCAL YEARS 2004 THROUGH 2013
Fiscal Year
Statewide Population(1)
Statewide Personal Income(2) (expressed in thousands)
Statewide Per Capita Personal Income
Unemployment Rate(3)
2004 5,508,909 $ 205,652,120 $ 37,331 4.30%
2005 5,558,058 218,137,769 39,248 4.20%
2006 5,600,388 235,195,668 41,996 3.80%
2007 5,615,727 247,525,909 44,077 3.90%
2008 5,618,344 262,071,799 46,646 3.70%
2009 5,633,597 270,923,822 48,091 5.90%
2010 5,699,478 275,143,448 48,275 7.40%
2011 5,773,552 283,919,505 49,070 7.00%
2012 5,828,289 295,235,516 50,656 6.80%
2013 5,884,563 316,681,620 53,816 6.80%
Sources:(1) U.S. Department of Commerce, Bureau of Census — “ Annual Population Estimates by State”(2) U.S. Department of Commerce, Bureau of Economic Analysis. Data provided is for prior ending
calendar year.(3) State Department of Labor, Licensing and Regulation – Average rate for 2013
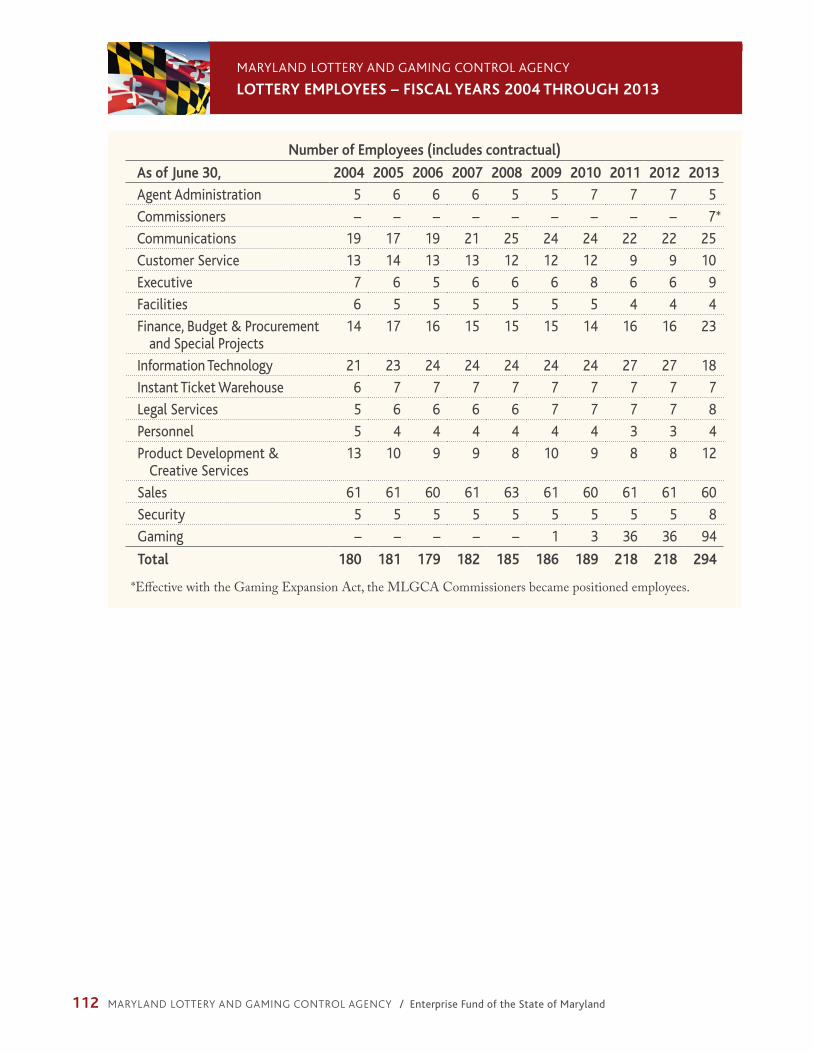
112 MARYLAND LOTTERY AND GAMING CONTROL AGENCY / Enterprise Fund of the State of Maryland
MARYLAND LOTTERY AND GAMING CONTROL AGENCY
LOTTERY EMPLOYEES – FISCAL YEARS 2004 THROUGH 2013
Number of Employees (includes contractual)
As of June 30, 2004 2005 2006 2007 2008 2009 2010 2011 2012 2013
Agent Administration 5 6 6 6 5 5 7 7 7 5
commissioners – – – – – – – – – 7*
communications 19 17 19 21 25 24 24 22 22 25
customer Service 13 14 13 13 12 12 12 9 9 10
executive 7 6 5 6 6 6 8 6 6 9
Facilities 6 5 5 5 5 5 5 4 4 4
Finance, Budget & Procurement and Special Projects
14 17 16 15 15 15 14 16 16 23
Information technology 21 23 24 24 24 24 24 27 27 18
Instant ticket Warehouse 6 7 7 7 7 7 7 7 7 7
Legal Services 5 6 6 6 6 7 7 7 7 8
Personnel 5 4 4 4 4 4 4 3 3 4
Product development & creative Services
13 10 9 9 8 10 9 8 8 12
Sales 61 61 60 61 63 61 60 61 61 60
Security 5 5 5 5 5 5 5 5 5 8
Gaming – – – – – 1 3 36 36 94
Total 180 181 179 182 185 186 189 218 218 294
*Effective with the Gaming Expansion Act, the MLGCA Commissioners became positioned employees.

113Comprehensive Annual Financial Report for the Years Ended June 30, 2013 and 2012
MARYLAND LOTTERY AND GAMING CONTROL AGENCY
OPERATING INDICATORS – FISCAL YEARS 2004 THROUGH 2013
Percentage of Lottery Administrative Expenses to Sales
Fiscal Year SalesAdministrative
Expenses
Percentage of Administrative
Expenses to Sales
2004 $ 1,395,408,458 $ 51,561,570 3.70%
2005 1,485,732,850 51,360,638 3.46%
2006 1,560,905,784 54,468,221 3.49%
2007 1,577,311,065 54,832,655 3.48%
2008 1,673,038,728 58,845,991 3.52%
2009 1,698,074,056 59,365,645 3.50%
2010 1,706,572,575 57,965,833 3.40%
2011 1,714,402,578 53,221,207 3.10%
2012 1,794,892,455 53,856,627 3.00%
2013 1,756,119,267 54,699,834 3.10%
Administrative expenses includes operating expenses, gaming vendor and data processing fees, and instant ticket printing and delivery.

114 MARYLAND LOTTERY AND GAMING CONTROL AGENCY / Enterprise Fund of the State of Maryland
MARYLAND LOTTERY AND GAMING CONTROL AGENCY
CAPITAL ASSETS, NET INFORMATION – FISCAL YEARS 2004 THROUGH 2013
Lottery Equipment
Data Processing Equipment
Office Equipment
Leasehold Improvements VLTs
Total Capital Assets
2004 $ 2,735,984 $ 77,120 $ 179,200 $ 516,144 $ – $ 3,508,448
2005 1,378,351 117,872 157,802 454,819 – 2,108,844
2006 974,544 81,970 98,578 393,495 – 1,548,587
2007 574,116 281,518 277,504 332,171 – 1,465,309
2008 173,689 202,273 190,553 270,847 – 837,362
2009 5,310,349 132,433 125,456 209,523 – 5,777,761
2010 4,192,381 65,926 63,182 148,199 – 4,469,688
2011 3,074,412 9,418 4,860 86,875 35,258,146 38,433,711
2012 1,956,444 – – 25,551 47,247,813 49,229,808
2013 838,476 – – – 22,987,684 23,826,160

Comprehensive Annual Financial Report for the Years Ended June 30, 2013 and 2012
This page inTenTionally leFT blank

1800 Washington Blvd., Suite 330 Baltimore, Maryland 21230
Tel: 410-230-8800mdlottery.com