Embed Size (px)
Citation preview

214 Center Grove Road, Randolph, New Jersey 07869
Comprehensive Annual Financial Report
Fiscal Year Ended June 30, 2015
A Component Unit of the County of Morris

Prepared by The Accounting Department
Karen VanDerhoof, Vice President for Business and Finance
Jessica Wander, Director of Accounting
Comprehensive Annual Financial Report
Fiscal Year Ended June 30, 2015
A Component Unit of the County of Morris


Introductory Section
Page(s)President's Letter 1-2Transmittal Letter 3-7Principal Officials 8Organization Chart 9Certificate of Achievement for Excellence in Financial Reporting 10
Financial Section
Independent Auditors' Report 11-13Required Supplemental Information:
Management's Discussion and Analysis 14-21Basic Financial Statements:
Statement of Net Position 22Statement of Revenues, Expenses, and Changes in Net Position 23Statement of Cash Flows 24Notes to Financial Statements 25-50
Required Supplemental Information:Schedule of Proportionate Share of Net Pension Liability 51Schedule of College Contributions 52Notes to Required Supplementary Information 53-54
Statistical Section
Statistical Section Overview 55Financial Trend Information:
Net Position by Component 56Comparative Changes in Net Position 57Revenues by Source 58-59Expenses by Identifiable Activity 60Schedule of Other Changes in Net Position 61
Revenue Capacity:Average Annual Fall Tuition and Fees at Comparable New Jersey Community Colleges 62
County College of MorrisComprehensive Annual Financial Report
Fiscal Year Ended June 30, 2015Table of Contents

Debt Capacity:Debt Capacity per Student 63
Demographic and Economic Information:General Demographical Information and Ten Largest employers in Morris County 64Enrollment Statistics 65Employee Statistics 66Individual Building Net Assignable Square Footage 67
Supplemental Management Statistics:Ratio Analysis 68-69Operating Revenues and Comparative Statistics 70-71Operating Expenditures and Comparative Statistics 72-76
Compliance Section
Supplemental Management Information:Iolta Grant Schedules 77-78
Supplemental Financial Information:
Control Over Financial Reporting Based on an Audit ofFinancial Statements Performed in Accordance withGovernment Auditing Standards 79-80
Independent Auditors' Report on Compliance withRequirements That Could Have a Direct and Material Effect on Each Major Program and Internal ControlOver Compliance in Accordance with OMB Circular A-133and New Jersey's OMB Circular NJOMB 04-04 81-82
Schedule of Expenditures of Federal Financial Awards 83Schedule of Expenditures of State Financial Awards 84Notes to the Schedules of Expenditures of Federal and State Awards 85Schedule of Findings and Questioned Costs 86-87Summary Schedule of Prior Audit Findings 88
County College of MorrisComprehensive Annual Financial Report
Fiscal Year Ended June 30, 2015Table of Contents
Independent Auditors' Report on Compliance and Internal

Introductory Section


This page is intentionally left blank.
2


County College of Morris Principal Officials
Year Ended June 30, 2015
8
BOARD OF TRUSTEES Trustee Position Term Expiration Stanley T. Omland Chair 10/31/2015 Jeffrey M. Advokat, Esq. Vice Chair 10/31/2016 Dr. Joseph L. Ricca, Jr. Treasurer 10/31/2015 Paul R. Licitra Secretary 10/31/2016 Laurie Bogaard, Esq. Trustee 10/31/2017 Barbara L. Hadzima Trustee 10/31/2016 Dr. Rosalie S. Lamonte Trustee Appt. by State Statute J. Richard Rajoppi Trustee 10/31/2016 William Schievella Trustee 10/31/2017 Michael A. Van Allen Trustee 10/31/2017 Dr. Joseph S Weisberg Trustee 10/31/2015
OFFICERS OF THE COLLEGE
Dr. Edward J. Yaw, President Dr. Dwight L. Smith, Vice President of Academic Affairs Karen R. VanDerhoof, Vice President for Business and Finance Dr. Bette M. Simmons, Vice President of Student Development and Enrollment Management Joseph Vitale, Executive Director for College Advancement and Planning and President of the
CCM Foundation Roger Flahive, Executive Director of Information Systems (CIO) Thomas Burk, Director of Human Resources and Labor Relations
OFFICIALS ISSUING REPORT
Karen R. VanDerhoof, CPA, Vice President for Business and Finance Jessica Wander, Director of Accounting
DIVISION ISSUING REPORT Business and Finance
DEPARTMENT ISSUING REPORT Accounting

9


Financial Section


14
Management’s Discussion and Analysis Unaudited This section of the County College of Morris’ Comprehensive Annual Financial Report (CAFR) presents management’s discussion and analysis of the College’s financial activity, exclusive of the College’s discretely presented component unit, for the fiscal years ended June 30, 2015 and 2014. Since this discussion and analysis focuses on current activities, resulting changes and currently known facts, please read it in conjunction with the transmittal letter, the College’s basic financial statements and the footnotes. Using This Annual Report The financial statements focus on the College as a whole and are designed to emulate corporate presentation models whereby all College activities are consolidated into one total. The financial statements are prepared using the accrual basis of accounting which recognizes revenues when earned and expenses when incurred. The entity-wide statements are comprised of the following:
• The Statement of Net Position presents all of the College’s assets, deferred inflows and outflows, and liabilities, with the difference reported as net position. The assets and liabilities are reported in order of relative liquidity while net position is categorized as Net Investment in Capital Assets, Restricted, or Unrestricted. Over time, increases or decreases in net position are an indicator of the improvement or erosion of the College’s financial health.
• The Statement of Revenues, Expenses, and Changes in Net Position presents
revenues and expenses incurred during the year. Revenues and expenses are reported as either operating or non-operating, with operating revenue consisting of tuition, student financial aid, auxiliary services, and contracts and grants. State and county appropriations, investment activities, as well as federal Pell grants, are reported as non-operating and denote the dependency the College has on their support.
• The Statement of Cash Flows presents information on cash flows from operating
activities, non-capital financing activities, capital financing activities, and investing activities. It provides the net increase or decrease in cash between the beginning and end of the fiscal year and assists in evaluating the College’s ability to meet financial obligations as they become due.
The CAFR is presented in four sections: introductory, financial, statistical, and compliance. The introductory section includes the president’s letter, the transmittal letter, the College’s principal officers, an organizational chart and the Certificate of Achievement for Excellence in Financial Reporting. The financial section includes the report of the independent auditors, management’s discussion and analysis, the basic financial statements, notes to the financial statements and required supplemental information. The statistical section includes unaudited financial information. The compliance section includes supplemental financial information.

15
Financial Highlights The following is a graphical illustration of net position as of June 30, 2015 and 2014:
Fiscal Year 2015 Compared to 2014
Net position increased by $9.3 million. Unrestricted net position decreased by $24.5 million as a result of recording a net pension liability of $25.6 million due to the mandatory adoption of GASB 68, Accounting and Financial Reporting for Pensions which was offset slightly by results of operations. The deficit unrestricted net position should not be deemed that the College is in financial hardship. It reflects a change in reporting practices. The net increase in capital assets equated to $8.8 million (see footnote number 5 in the notes to financial statements). The College Foundation’s non-expendable net position decreased by $1.5 million due to a change in board policy allowing for expenditure of investment appreciation. It should be noted that included in unrestricted net position is $9.5 million of board designated funds for capital projects identified in the College’s facilities master plan. These funds were transferred from Current Unrestricted to the Plant Fund for specific projects including investments in computer technology to support the College’s technology plan, emphasis on improving classrooms to be more conducive to student learning, faculty office renovations, enhancing video surveillance coverage and other renovation projects. Also included in unrestricted net position is a board appropriated $2.5 million reserve for plant renewal and adaptation. New Jersey statute recommends a reserve not to exceed 3% of the replacement value of its buildings in order to preserve the value of the physical plant and to have sufficient funds available to adapt the plant to the changing mission of the institution.
NET POSITION
Non-expendable4% 5%
Unrestricted-2% 22%
Restricted1% 1%
Net Investment in Capital
Assets97% 72%
2015 2014

16
Revenues and Expenses The following is a graphical illustration of revenues by source for the year ending June 30, 2015:
The following is a graphical illustration of operating expenses by function for the year ending June 30, 2015:
$7,000,44010%
$11,600,000 17%
$28,723,880 43%
$378,912 1%
$3,734,678 5%
$16,067,822 24%
Revenues By Source
State Support County Support Tuition and Fees
Investment Income Auxiliary Services Other
$28,725,970 42%
$5,518,924 8%
$964,492 1%
$5,091,497 8%
$9,532,624 14%
$7,034,013 10%
$3,616,011 5%
$4,427,110 7%
$3,281,216 5%
Expenses By Function
Instruction Academic Support Public Service
Student Services Institutional Support Operation of Plant
Depreciation Student Aid Auxiliary Services

17
Below is a summary of operating results presented in thousands for the years ended June 30, 2015 and 2014:
2015-20142015 2014 Variance Percent
OPERATING REVENUESStudent tuition and fees 28,724$ 28,534$ 190$ 1%Federal grants and contracts 1,493 1,032 461 45%State and local grants and contracts 5,673 4,337 1,336 31%Auxiliary services 3,735 3,901 (166) -4%Gifts 201 149 52 35%Other 793 818 (25) -3%
Total operating revenues 40,619 38,771 1,848 5%
NON-OPERATING REVENUESFederal grants and contracts 7,914 7,846 68 1%
State appropriation 7,000 6,988 12 0% County appropriation 11,600 11,600 - 0% Investment income 379 837 (458) -55% Other (7) 53 (60) -113%
Total non-operating revenues 26,886 27,324 (438) -2%
TOTAL REVENUES 67,505 66,095 1,410 2%
OPERATING EXPENSESInstruction 28,726 28,552 174 1%Academic support 5,519 5,240 279 5%Public service 964 679 285 42%Student affairs 5,091 4,913 178 4%Institutional support 9,533 9,055 478 5%Operation and maintenance of plant 7,034 6,806 228 3%Depreciation 3,616 2,870 746 26%Student aid 4,427 4,479 (52) -1%Auxiliary services 3,281 3,469 (188) -5%
Total operating expenses 68,191 66,063 2,128 3%
TOTAL EXPENSES 68,191 66,063 2,128 3%
Excess (deficiency) before capital contributions and additions to permanent endowments (686) 32 (718) -2244%
OTHER REVENUES Capital contributions 10,011 12,639 (2,628) -21% Additions to permanent endowments 8 154 (146) -95%
Total other revenues 10,019 12,793 (2,774) -22%
INCREASE IN NET POSITION 9,333 12,825 (3,492)$ -27%
NET POSITION - BEGINNING OF YEAR 89,366
NET POSITION - BEGINNING OF YEAR (Restated) 75,199
NET POSITION - END OF YEAR 84,532$ 102,191$

18
Fiscal Year 2015 Compared to 2014 Operating revenues increased by 5% in 2015. Tuition and fees were increased by 5.8% with a $3 per credit tuition increase and a $5 college fee increase to help offset declining enrollment. Headcount enrollment decreased by 4.2%, however credit hour enrollment decreased by 5% since more students were part-time. Revenues from state and local grants and contracts increased by $1.3 million or 31%, while revenues from federal grants and contracts increased by $461 thousand or 45%. Non-operating revenues decreased by 2%. The County of Morris appropriation to the College remained constant. The College’s appropriation from the State of New Jersey increased by $12 thousand and investment income decreased by $458 thousand as a result of declining market values. Operating expenses increased by 3% or $2.13 million over the prior year. Depreciation increased by $746 thousand or 26% due to our continual investment in capital assets. Salary increases averaged 2% and health benefit costs increased 8%. All other expenses remained relatively constant.
11%
18%43%
1%
6% 21%
10%
17%43%
1%5%
24%
Revenue by Source
State Support County Support Tuition and Fees Investment Income Auxiliary Services Other
19
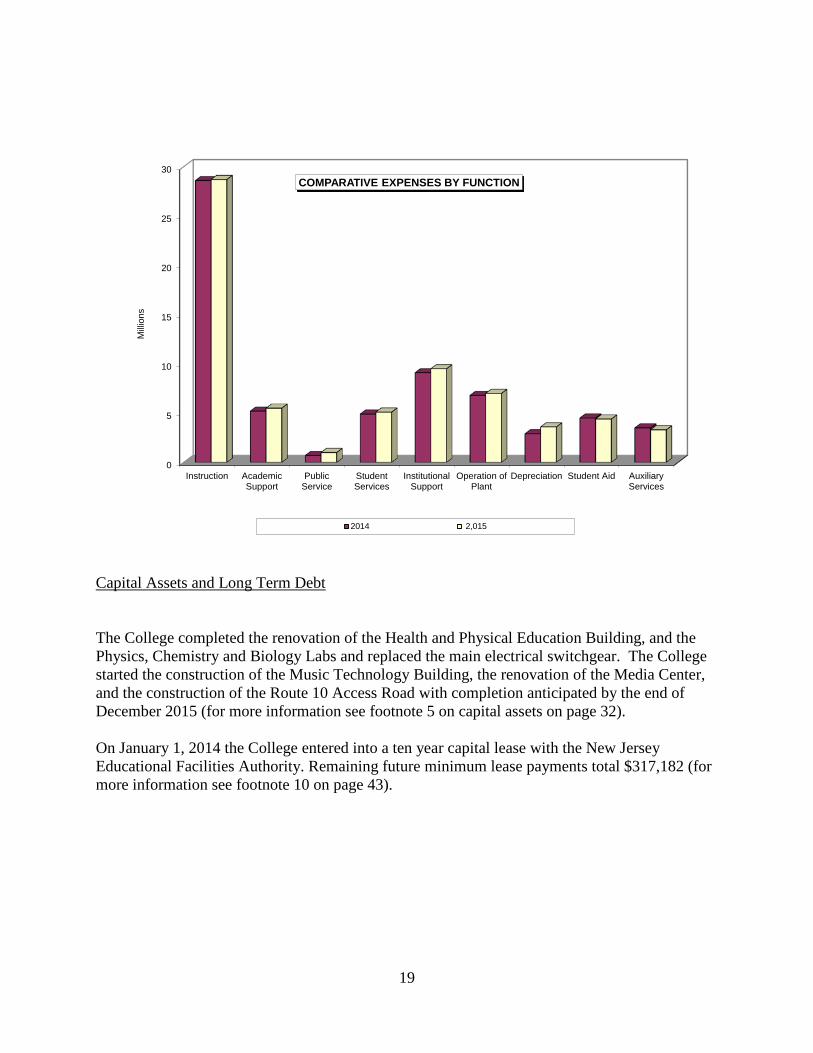
Capital Assets and Long Term Debt The College completed the renovation of the Health and Physical Education Building, and the Physics, Chemistry and Biology Labs and replaced the main electrical switchgear. The College started the construction of the Music Technology Building, the renovation of the Media Center, and the construction of the Route 10 Access Road with completion anticipated by the end of December 2015 (for more information see footnote 5 on capital assets on page 32). On January 1, 2014 the College entered into a ten year capital lease with the New Jersey Educational Facilities Authority. Remaining future minimum lease payments total $317,182 (for more information see footnote 10 on page 43).
0
5
10
15
20
25
30
Instruction AcademicSupport
PublicService
StudentServices
InstitutionalSupport
Operation ofPlant
Depreciation Student Aid AuxiliaryServices
Milli
ons
COMPARATIVE EXPENSES BY FUNCTION
2014 2,015

20
Economic Factors That Affect the Future The economic position of County College of Morris is closely tied to that of the State of New Jersey and County of Morris. The county support to the College remained unchanged in fiscal year 2015 and all indications are that there will not be any reduction in support for fiscal years 2016 and 2017. The State of New Jersey’s budget also contains level funding for the community colleges for fiscal year 2016. Higher education is a labor intensive industry. Negotiated salary increases were under 2.5% for 2015 for full time employees with settled contracts. Staffing turnover continues to reduce the wage base. Legislation has enabled benefits cost sharing in an effort to curtail the impact of the rising costs of healthcare. The College experienced an 8% increase in health benefit costs effective January 2015. The impact of flat support and declining enrollment necessitated an increase in tuition and fees of 5.8% beginning summer 2015. An additional increase is also anticipated for 2016. Due to declining enrollment the College also implemented a reduction in force effective July 1, 2015 which will reduce the operating expenditure budget by $1.7 million. Enrollment is projected to remain relatively flat for the next few years. The Morris County high school senior population is projected to decline by 13% from 2015 to 2026. This statistic among others has prompted the College to engage a marketing consultant and develop a strategic enrollment plan in an effort to increase enrollment. Non-traditional student markets will be targeted based on the statistic that 40% of Morris County adults do not have advanced degrees. New programs of study will also be explored. These efforts are not expected to have an immediate impact, therefore cost containment efforts will continue. Modest tuition and fees increases will also be necessary to afford the College the operating resources necessary to maintain the current quality and level of programs offered. The College received $3.2 million in funding from the State of New Jersey Chapter 12 program for fiscal year 2015 and will receive an additional $3 million in fiscal year 2016. The Chapter 12 program is a revolving bond fund which requires each county to bond the cost of approved construction projects for their respective community college with the state funding 50% of the debt service and the county funding the remaining 50%. These funds in addition to higher education general obligation bonds floated by the State of New Jersey have enabled the College to improve and expand its buildings and procure instructional equipment. The Equipment Leasing Fund bonds will be reissued upon repayment which will provide a funding stream for replacement and additional instructional equipment. The College will be entering its 50th year of operations in 2018. Planning for a 50th anniversary capital campaign is currently underway. The hope of a successful campaign will benefit student scholarships, enhance instructional laboratories, create student outdoor space and expand the physical plant to meet the demands of programs currently at capacity.

This page is intentionally left blank.
21

COUNTY COLLEGE OF MORRISSTATEMENT OF NET POSITION
AS OF JUNE 30, 2015
College
Picatinny Innovation
Technology Center
ASSETSCurrent Assets
Cash and cash equivalents 18,383,399$ 401,344$ Student accounts receivable (less allowance of $1,381,181 ) 179,576 - Other receivables, net 5,322,943 9,626 Inventory 591,077 - Other assets 456,278 -
Total Current Assets 24,933,273 410,970
Non-current AssetsCash and cash equivalents 103,907 - Investments 15,668,719 - Deposit with Trustee 514,323 - Capital assets (net)
Sites (land) and construction in progress 7,493,041 - Depreciable land improvements, infrastructure, buildings, building improvements, equipment, furniture and fixtures, and software 74,774,150 1,718 Total Non-current Assets 98,554,140 1,718
TOTAL ASSETS 123,487,413 412,688
DEFERRED OUTFLOWS OF RESOURCESRelated to Pensions 804,074
LIABILITIESCurrent Liabilities
Accounts payable - vendors 2,174,883 892 Accrued expenses 5,164,045 2,551 Unearned revenue 2,210,458 233 Compensated Absences Payable 218,998 - Capital Lease Payable 26,842 -
Total Current Liabilities 9,795,226 3,676
Non-current LiabilitiesCompensated Absences Payable 1,888,872 - Capital Lease Payable 229,415 - Net Pension Liability 25,570,494 Deposits 8,516
Total Non-current Liabilities 27,688,781 8,516
TOTAL LIABILITIES 37,484,007 12,192
DEFERRED INFLOWS OF RESOURCESRelated to Pensions 2,276,088
NET POSITIONNet Invesment in capital assets 82,010,934 1,718
Restricted net position:
Expendable for:
Reserve for external restrictions 1,232,694 16,000
Non-expendable net position 3,065,107 - Unrestricted net position (Deficit) (1,777,343) 382,777
TOTAL NET POSITION 84,531,392$ 400,495$
See accompanying Notes to Financial Statements
22

COUNTY COLLEGE OF MORRISSTATEMENT OF REVENUES, EXPENSES AND CHANGES IN NET POSITION
FOR THE FISCAL YEAR ENDING JUNE 30, 2015
College
Picatinny Innovation Technology
CenterOPERATING REVENUES
Student tuition and fees (net of scholarship allowances of $5,774,987) 28,723,880$ 10,320$ Federal grants and contracts 1,493,434 - State and local grants and contracts 5,673,000 - Auxiliary services 3,734,678 - Gifts 200,683 - Other 793,588 264,434
Total Operating Revenues 40,619,263 274,754
OPERATING EXPENSESInstruction 28,725,970 - Academic support 5,518,924 - Public service 964,492 292,134 Student affairs 5,091,497 - Institutional support 9,532,624 - Operation and maintenance of plant 7,034,013 - Depreciation 3,616,011 3,435 Student aid 4,427,110 - Auxiliary services 3,281,216 -
Total Operating Expenses 68,191,857 295,569
Operating Income (Loss) (27,572,594) (20,815)
NON-OPERATING REVENUES (EXPENSES)Federal Grants 7,914,512 - State appropriation 7,000,440 - County appropriation 11,600,000 - Investment income 378,912 1,533 Other (7,395) -
Net Non-operating Revenues 26,886,469 1,533
Income (Loss) Before Other Revenues (Expenses) (686,125) (19,282)
OTHER REVENUESCapital contributions 10,010,786 - Additions to permanent endowments 8,230 -
Total Other Revenues 10,019,016 -
INCREASE (DECREASE) IN NET POSITION 9,332,891 (19,282) NET POSITION - BEGINNING OF YEAR 419,777 NET POSITION - BEGINNING OF YEAR (Restated) 75,198,501 - NET POSITION - END OF YEAR 84,531,392$ 400,495$
See accompanying Notes to Financial Statements
23

COUNTY COLLEGE OF MORRISSTATEMENT OF CASH FLOWS
FOR THE FISCAL YEAR ENDING JUNE 30, 2015
24
2015College
CASH FLOWS FROM OPERATING ACTIVITIESTuition and fees 24,925,182$ Gifts 200,683 Grants and contracts 4,404,063 Payments to suppliers (34,119,527) Payments to employees (23,043,529) Auxiliary enterprise charges 2,420,336 Other 682,237
Net Cash (Used) by Operating Activities (24,530,555)
CASH FLOWS FROM NON-CAPITAL FINANCING ACTIVITIESFederal support 7,914,512 State support 7,000,440 County support 12,168,257 Agency Transactions 22,173 Endowment Receipts 8,230
Net Cash Provided by Non-Capital Financing Activities 27,113,612
CASH FLOWS FROM CAPITAL AND RELATED FINANCING ACTIVITIESCapital appropriations 9,636,197 Proceeds from sale of capital assets - Purchase of capital assets (12,408,077) Payment of Principal on long-term debt (39,626)
Net Cash (Used) by Capital and Related Financing Activities (2,811,506)
CASH FLOWS FROM INVESTING ACTIVITIESProceeds from sales and maturities of investments 7,064,835 Investment income 236,874 Purchase of investments (7,073,546)
Net Cash Provided (Used) by Investing Activities 228,163
NET INCREASE (DECREASE) IN CASH AND CASH EQUIVALENTS (287)
CASH AND CASH EQUIVALENTS, BEGINNING OF YEAR 18,487,594 CASH AND CASH EQUIVALENTS, END OF YEAR 18,487,307$
RECONCILIATION OF OPERATING (LOSS) TO NET CASH (USED) BY OPERATING ACTIVITIES:
Operating Loss (27,572,594)$ ADJUSTMENT TO RECONCILE OPERATING LOSS TO NET CASH USED BY OPERATING ACTIVITIES:
Depreciation 3,616,011 Changes in assets and liabilities:
Student accounts receivable (56,688) Other receivable (401,105) Inventory 20,538 Other assets 59,305 Accounts payable (148,502) Accrued expenses 27,210 Unearned revenue (74,729)
NET CASH (USED) BY OPERATING ACTIVITIES (24,530,555)$
See accompanying Notes to Financial Statements

COUNTY COLLEGE OF MORRIS NOTES TO FINANCIAL STATEMENTS
JUNE 30, 2015
25
Note 1: Summary of Significant Accounting Policies
Basis of Accounting
The County College of Morris and its component units’ (the “College”) financial statements are based on all applicable Governmental Accounting Standards Board (GASB) pronouncements. The following is a summary of the more significant policies.
The College makes a distinction between operating and non-operating revenues and expenses. Operating activities reported on the Statement of Revenues, Expenses and Changes in Net Position generally result from exchange transactions such as payments received for providing services and payments made for services or goods received. Nearly all of the College’s expenses are from exchange transactions. Transactions not meeting this definition are reported as non-operating activities, including investment income. Certain significant revenue streams relied upon for operations are recorded as non-operating revenues, which include state and county appropriations. Restricted resources are independently tracked at the discretion of the College and expended within the guidelines of donor restrictions, if any.
Reporting Entity
Governmental Accounting Standards Board publication Codification of Governmental Accounting and Financial Reporting Standards, Section 2100, "Defining the Financial Reporting Entity", establishes standards to determine whether a governmental component unit should be included in the financial reporting entity. At least one on the following criteria must be met for inclusion: (1) the component unit’s governing body is substantively the same governing body of the primary government and there is either a financial benefit or burden relationship between the primary government and component unit or management of the primary government has operational responsibility for the component unit; (2) the component unit provides service entirely, or almost entirely, to the primary government or almost exclusively benefits the primary government even though it does not provide benefits directly to it; or (3) the component unit’s outstanding debt is expected to be repaid entirely or almost entirely by the resources of the primary government. Accordingly, the County College of Morris is a component unit of the County of Morris.
The County College of Morris Foundation (the Foundation) is a legally separate, tax-exempt entity that was established exclusively to carry out charitable, educational functions that benefit the College, its students, faculty and staff. The College has operational responsibility for the Foundation, all financial resources of the Foundation are held for the direct benefit of the College or its constituents and the College has the ability to access these significant resources. As a result, the Foundation is considered a component unit of the College and is blended into the financial statements accordingly.
The Picatinny Innovation Technology Center (PITC) is a legally separate entity formed in Fiscal Year 1996 in a cooperative effort between the County College of Morris and the Department of Army's Armament Research, Development and Engineering Center (ARDEC) with funding from the County of Morris Board of Chosen Freeholders, the New Jersey Commission on Science and Technology and the Federal Laboratory Consortium. Although the Board of Directors is substantively different from the College, the members are appointed by the County College of Morris Trustees.

COUNTY COLLEGE OF MORRIS NOTES TO FINANCIAL STATEMENTS
JUNE 30, 2015
26
Note 1: Summary of Significant Accounting Policies (Cont’d) In addition, the College requires PITC to follow its policies and procedures. The College receives PITC’s net position if the entity ceases to exist. PITC is a non-profit corporation organized for the advancement of education and research through the transfer of technologies. It is a technology-oriented business incubator offering partnerships with startup companies, small businesses and product development teams from large corporations. No services are rendered to the College. PITC is considered a component unit of the College and is reported utilizing a discrete presentation. The financial statements may be obtained by writing to PITC, c/o County College of Morris, 214 Center Grove Road, Randolph, NJ 07869, Attention: Director of Accounting.
Measurement Focus
The financial statements of the County College of Morris have been prepared using the economic resources measurement focus and the accrual basis of accounting, and conform to accounting principles generally accepted in the United States of America as applicable to colleges and universities. For financial reporting purposes, the College utilizes the business-type activities model. Under the terms of grant and other agreements, the College may fund certain programs by a combination of specific cost-reimbursement grants, categorical block grants, other restricted funds and general revenue. Therefore, when program expenses are incurred, both restricted and unrestricted net position may be available to finance the program. It is the College’s policy to first apply cost-reimbursement grant and other restricted resources to such programs, followed by general revenue. Fund Accounting
In order to ensure observance of limitations and restrictions placed on the use of the resources available to the College, accounts are maintained in accordance with the principles of "fund accounting". This is the procedure by which resources for various purposes are classified for accounting and internal reporting purposes into funds that are in accordance with activities or objectives specified. Separate accounts are maintained for each fund; however, in the accompanying financial statements, funds have been combined in order to comply with the requirements of eliminating internal revenue and expense charges and to meet the financial reporting requirements under accounting principles generally accepted in the United States of America as promulgated by GASB.
Within each fund group, fund balances restricted by outside sources are so indicated and are distinguished from Unrestricted Funds allocated to specific purposes by action of the governing board. Restricted Funds may only be utilized in accordance with the purposes established by the donor or grantor of such funds, and are in contrast with Unrestricted Funds over which the governing board retains full control to use in achieving any of its institutional purposes. The College uses encumbrance accounting for internal accounting and reporting. Under encumbrance accounting, purchase orders, contracts and other commitments for the expenditure of resources are recorded to reserve a portion of the applicable appropriation.

COUNTY COLLEGE OF MORRIS NOTES TO FINANCIAL STATEMENTS
JUNE 30, 2015
27
Note 1: Summary of Significant Accounting Policies (Cont’d) Deferred Outflows and Deferred Inflows of Resources The Statement of Net Position reports separate sections for deferred outflows of resources and deferred inflows of resources. Deferred outflow of resources, reported after Total Assets, represents a reduction of net position that applies to a future period(s) and will be recognized as an outflow of resources (expense) at that time. Deferred inflows of resources, reported after Total Liabilities, represents an acquisition of net position that applies to a future period(s) and will be recognized as an inflow of resources (revenue) at that time. Transactions are classified as deferred outflows of resources and deferred inflows of resources only when specifically prescribed by GASB standards. The College is required to report the following as deferred outflows of resources and deferred inflows of resources. Defined Benefit Pension Plans – The difference between expected (actuarial) and actual experience, changes in actuarial assumptions, net difference between projected (actuarial) and actual earnings on pension plan investments, changes in the College’s proportion of expenses and liabilities to the pension as a whole, differences between the College’s pension contribution and its proportionate share of contributions, and the College’s pension contributions subsequent to the pension valuation measurement date. Pensions For purposes of measuring the net pension liability, deferred outflows of resources and deferred inflows of resources related to pensions, and pension expense, information about the fiduciary net position of the Public Employees’ Retirement System (“PERS”) and additions to/deductions from PERS’s fiduciary net position have been determined on the same basis as they are reported by the plans. For this purpose, benefit payments (including refunds of employee contributions) are recognized when due and payable in accordance with the benefit terms. Investments are reported at fair value. Net Position Net position represents the difference between assets, deferred inflows and outflows, and liabilities. Net investment in capital assets, consists of capital assets, net of accumulated depreciation, reduced by the outstanding balance of any borrowing used for the acquisition, construction, or improvement of those assets. Net position is reported as restricted when there are limitations imposed on their use either through the enabling legislation adopted by the College or through external restrictions imposed by grantors, or laws and regulations of other governments. Management Estimates
The preparation of financial statements in conformity with GAAP requires management to make estimates and assumptions that affect the reported amounts of revenue and expenses during the reporting period. Actual results could differ from those estimates.

COUNTY COLLEGE OF MORRIS NOTES TO FINANCIAL STATEMENTS
JUNE 30, 2015
28
Note 1: Summary of Significant Accounting Policies (Cont’d)
Compensated Absences The College accounts for compensated absences (e.g., unused vacation, sick leave) as directed by GASB. A liability for compensated absences attributable to services already rendered and not contingent on a specific event that is outside the control of the employer and employee is accrued as employees earn the rights to the benefits. College employees are granted varying amounts of vacation and sick leave in accordance with the College’s personnel policy or appropriate labor contract. Upon termination, employees are paid for accrued vacation. The College’s policy permits employees to accumulate unused sick leave and carry forward the full amount to subsequent years. Upon retirement, employees shall be paid by the College for the unused sick leave in accordance with the College’s personnel policy or appropriate labor contract. In the Statement of Net Position, the liabilities whose average maturities are greater than one year should be reported in two components –the amount due within one year and the amount due after one year. Inventory
Inventories offered for sale are valued at average cost. Income Taxes The College, as an instrumentality of the State of New Jersey and therefore a governmental entity, is a tax-exempt organization and not subject to either federal or state income taxes. The Foundation and PITC are both exempt from taxation pursuant to Internal Revenue Code Section 501(c) (3). The Foundation and PTIC follow the accounting standard for uncertain tax positions, which had no effect on either entity. Federal and state tax returns for both entities for the years ended June 30 2012 through 2014 are open for review by Federal and State authorities. Allowance for Uncollectible Accounts
The student receivables are stated net of an allowance for estimated uncollectible amounts. The method used for estimating the allowance is based on analysis of aging receivables and historical data. Reclassifications
Certain prior year amounts have been reclassified to conform to the current year presentation.

COUNTY COLLEGE OF MORRIS NOTES TO FINANCIAL STATEMENTS
JUNE 30, 2015
29
Note 2: Cash, Cash Equivalents, and Investments Cash and cash equivalents include petty cash, change funds, amounts in deposits, and short-term investments with maturities of three months or less.
Investments are presented in the financial statements in the aggregate at fair value based on quoted market prices. The College's and PITC’S investments for the year ended June 30, 2015 consisted of certificates of deposits with maturity dates of greater than ninety days, common stock, and investments with the Common Fund, a non-profit organization which provides investment management services exclusively for Private and Public Colleges and Universities, as well as Independent Schools. GASB requires disclosure of the level of custodial credit risk assumed by the College in its cash, cash equivalents and investments, if those items are uninsured or unregistered. Deposits are exposed to custodial credit risk if they are not covered by depository insurance and the deposits are uncollateralized, collateralized with securities held by the pledging financial institution or collateralized with securities held by the pledging financial institution’s trust department or agent but not in the depositor-government’s name. Custodial credit risk is the risk that in the event of a bank failure, the College’s deposits may not be returned.
Interest Rate Risk In accordance with its cash management plan, the College ensures that any deposit or investment matures within the time period that approximates the prospective need for the funds, deposited or invested, so that there is not a risk to the market value of such deposits or investments. Credit Risk The College limits its investments to those authorized in its cash management plan which are those permitted under state statute as detailed on the following page. New Jersey statutes permit the deposit of public funds in institutions located in New Jersey, which are insured by the Federal Deposit Insurance Corporation (FDIC) or by any other agencies of the United States that insure deposits or the State of New Jersey Cash Management Fund. New Jersey statutes require public depositories to maintain collateral for deposits of public funds that exceed insurance limits as follows:
The market value of the collateral must equal 5% of the average daily balance of public funds; an in addition
If the public funds deposited exceed 75% of the capital funds of the depository, the depository must provide collateral having a market value equal to 100% of the amount exceeding 75%. All collateral must be deposited with the Federal Reserve Bank, the Federal Home Loan Bank Board or a banking institution that is a member of the Federal Reserve System and has capital funds of not less than $25,000,000.

COUNTY COLLEGE OF MORRIS NOTES TO FINANCIAL STATEMENTS
JUNE 30, 2015
30
Note 2: Cash, Cash Equivalents, and Investments (Cont’d) Cash and Cash Equivalents Cash and cash equivalents of the College as of June 30 consisted of the following:
2015College
Cash on Hand 14,624$ Checking Accounts 4,063,029 Cash Management Accounts 11,541 Money Market Accounts 14,398,112
18,487,306$
The carrying amount of the College's cash and cash equivalents at cost at June 30, 2015 was $18,487,306 and the bank balance was $19,359,234. The College had $11,541 deposited with the Cash Management Fund which is uninsured and unregistered.
Investments The College’s policy is to follow New Jersey State Statute which permits the College to purchase the following types of securities:
1. Bonds or other obligations of the United States of America or obligations guaranteed
by the United States of America; 2. Government money market mutual funds; 3. Any obligation that a federal agency or a federal instrumentality has issued in
accordance with an act of Congress, which security has a maturity date not greater than 397 days from the date of purchase, provided that such obligation bears a fixed rate of interest not dependent on any index or other external factor;
4. Bonds or other obligations, having a maturity date not more than 397 days from the date of purchase, approved by the Division of Investment of the Department of the Treasury for investment by local units;
5. Local government investment pools; 6. Deposits with the State of New Jersey Cash Management Fund; or 7. Agreements for the repurchase of fully collateralized securities if: a. the underlying securities are permitted investments pursuant to items 1 and 3 above; b. the custody of collateral is transferred to a third party; c. the maturity of the agreement is not more than 30 days; d. the underlying securities are purchased through a public depository as defined in statute; and e. a master repurchase agreement providing for the custody and security of collateral is executed.

COUNTY COLLEGE OF MORRIS NOTES TO FINANCIAL STATEMENTS
JUNE 30, 2015
31
Note 2: Cash, Cash Equivalents, and Investments (Cont’d)
The Foundation is a 501(c) (3) entity and a component unit of the College. The Foundation may invest in commercial paper, repurchase agreements, treasury bills, certificates of deposit, money market funds, component debt securities, common stocks, preferred stocks, convertible securities and obligations of the U.S. Government. The credit quality rating for the Common Fund high equity bond investment is AA+.
Investments as of June 30 consisted of the following:
2015
Certificates of deposit 11,135,000$ Common Fund multi-strategy equity fund 3,190,824 Common Fund multi-strategy bond fund 1,124,690 Lakeland Bancorp, Inc. stock 218,205
15,668,719$
As of June 30, the actual changes in the fair market value of the Foundation’s investments consisted of the following:
2015Fair value, end of year 4,533,719$ Less: Cost of investments purchased 73,546 Less: Fair value, beginning of year 4,343,924 Increase in fair value of Investments 116,249$
Note 3: Other Receivables
As of June 30 other receivables consisted of the following:
College PTICCounty of Morris 835,585$ -$ Federal Awards Receivable 554,860 - Divisions of Pensions 381,070 - State Awards Receivable 2,288,935 - Other 1,262,493 9,626
5,322,943$ 9,626$
2015

COUNTY COLLEGE OF MORRIS NOTES TO FINANCIAL STATEMENTS
JUNE 30, 2015
32
Note 4: Other Assets
Other assets consist primarily of prepaid expenses. Prepaid expenses represent that portion of items paid or accrued which will be charged to operations over time. Prepaid expenses consist primarily of unexpired insurance coverage and payroll charges.
Note 5: Capital Assets
Capital assets include property, plant equipment, and infrastructure assets, such as roads and sidewalks. Capital assets are defined by the College as assets with an initial unit cost of $2,500 or more. Such assets are recorded at historical cost or estimated historical cost if purchased or constructed. The costs of normal maintenance and repairs that do not add to the value of the assets or materially extend assets’ lives are not capitalized. Major outlays for capital assets and improvements are capitalized as projects are constructed. The County of Morris is responsible for the issuance of bonds and notes for the College's capital expenditures which are financed by bond ordinances. The County is also responsible for the payment of interest on issued debt and the retirement of such obligations. Accordingly, the debt is reported in the financial statements of the County of Morris. Donated capital assets are recorded based on estimated fair market value at the time received. Capital assets have been reviewed for impairment. Property, plant and equipment of the College are depreciated using the straight-line method over the following useful lives:
Assets Years
Buildings & Improvements 45 Computer Equipment 3 Construction Tractors 10 Culinary Equipment 10 Drainage Systems 50 Exterior Electrical Distribution System 45 Exterior Lightning 20 Furniture and Fixtures 10 Greenhouses 15 Lab Equipment 7 Land Improvements 20 Landscaping 20 Maintenance Equipment 7 Media Equipment 6 Medical Equipment 6 Musical Instruments 10 Office Equipment 5 Other Instructional Equipment 7 Passenger Cars/Vans/Trucks, Mowers, Golf Carts 5 Photography Equipment 6 Printing Equipment 11 Roads 30 Sidewalks and Exterior Stairways 30 Signage 20 Software 3 Telecommunications Equipment 3

COUNTY COLLEGE OF MORRIS NOTES TO FINANCIAL STATEMENTS
JUNE 30, 2015
33
Note 5: Capital Assets (Cont’d)
The following tables present the changes in capital assets for the fiscal year ended June 30, 2015:
COUNTY COLLEGE OF MORRISJune 30, 2014
Balance Additions DisposalsJune 30, 2015
Balance
Capital Assets Not Being Depreciated:Land 1,984,401$ -$ -$ 1,984,401$ Construction in progress 1,861,289 10,106,184 6,458,833 5,508,640 Total Capital Assets Not Being Depreciated 3,845,690 10,106,184 6,458,833 7,493,041
Capital Assets Being Depreciated:Land improvements 2,746,070 23,211 - 2,769,282 Infrastructure 8,683,723 397,019 - 9,080,743 Buildings and improvements 74,787,171 4,954,696 2,583,000 77,158,867 Equipment and furniture & fixtures 16,851,658 3,315,201 689,728 19,477,130 Software 1,288,024 91,696 - 1,379,720 Total Capital Assets Being Depreciated 104,356,647 8,781,823 3,272,728 109,865,742
Total Capital Assets 108,202,337 18,888,007 9,731,561 117,358,783
Accumulated Depreciation:Land improvements 810,747 136,477 - 947,224 Infrastructure 2,074,605 318,793 - 2,393,398 Buildings and improvements 21,154,695 1,674,116 2,563,865 20,264,947 Equipment and furniture & fixtures 9,797,686 1,408,098 681,049 10,524,734 Software 1,137,554 79,993 - 1,217,546
Total Accumulated Depreciation 34,975,286 3,617,477 3,244,914 35,347,849
Capital Assets Net Accumulated Depreciation 73,227,051$ 15,270,530$ 6,486,647$ 82,010,934$

COUNTY COLLEGE OF MORRIS NOTES TO FINANCIAL STATEMENTS
JUNE 30, 2015
34
Note 5: Capital Assets (Cont’d)
PITC
June 30, 2014
Balance Additions Disposals
June 30, 2015
Balance
Capital Assets Being Depreciated:Equipment and furniture & fixtures 17,789$ -$ -$ 17,789$ Total Capital Assets Being Depreciated 17,789 - - 17,789
Total Capital Assets 17,789 - - 17,789
Accumulated Depreciation:Equipment and furniture & fixtures 12,637 3,435 - 16,071
Total Accumulated Depreciation 12,637 3,435 - 16,071
Capital Assets Net Accumulated Depreciation 5,152$ (3,435)$ -$ 1,718$
Construction in progress The College has active construction projects as of June 30, 2015. The following tables present the balance of construction in progress activities for the fiscal year ended:
Balance Year-End
Commitments Music Technology Addition 4,584,108 $ 7,465,121 $
Access Road to Route 10 642,391 1,245,947 Sewer Connection 21,832 600 Switch Gear Replacement 18,900 499,936 HVAC/675 27,433 356,095 Fire Alarm 7,703 17,973 LRC Media Center 206,273 1,209,147
5,508,640 $ 10,794,819
2015

COUNTY COLLEGE OF MORRIS NOTES TO FINANCIAL STATEMENTS
JUNE 30, 2015
35
Note 6: Accrued Expenses
As of June 30, accrued expenses consisted of the following:
Note 7: Pension Plans
A substantial number of the College’s employees participate in one of the two pension plans administered and/or regulated by the New Jersey Division of Pensions and Benefits: (1) the Public Employees’ Retirement System; or (2) the New Jersey Alternate Benefit Program. In addition, several College employees participate in the Defined Contribution Retirement Program administered by Prudential Financial for the New Jersey Division of Pensions and Benefits. Each plan has a Board of Trustees that is primarily responsible for its administration. The Division issues a publicly available financial report that includes financial statements and required supplementary information. That report may be obtained by writing to: State of New Jersey Division of Pensions and Benefits P.O. Box 295 Trenton, New Jersey 08625-0295 http://www.state.nj.us/treasury/pensions General Information About the Pension Plans Plan Descriptions Public Employees’ Retirement System – The Public Employees’ Retirement System (“PERS) is a cost-sharing multiple-employer defined benefit pension plan which was established as of January 1, 1995. Substantially all full-time employees of the College, provided the employee is not required to be a member of another state-administered retirement system or other state pensions fund or local jurisdiction’s pension fund, are covered under PERS.
Payroll, Taxes and Agencies 3,522,768 $ Vacations and Compensated Absences 1,479,877 Other 161,400 2,551 $
5,164,045 $ 2,551 $
College PITC 2015
COUNTY COLLEGE OF MORRIS NOTES TO FINANCIAL STATEMENTS
JUNE 30, 2015
36
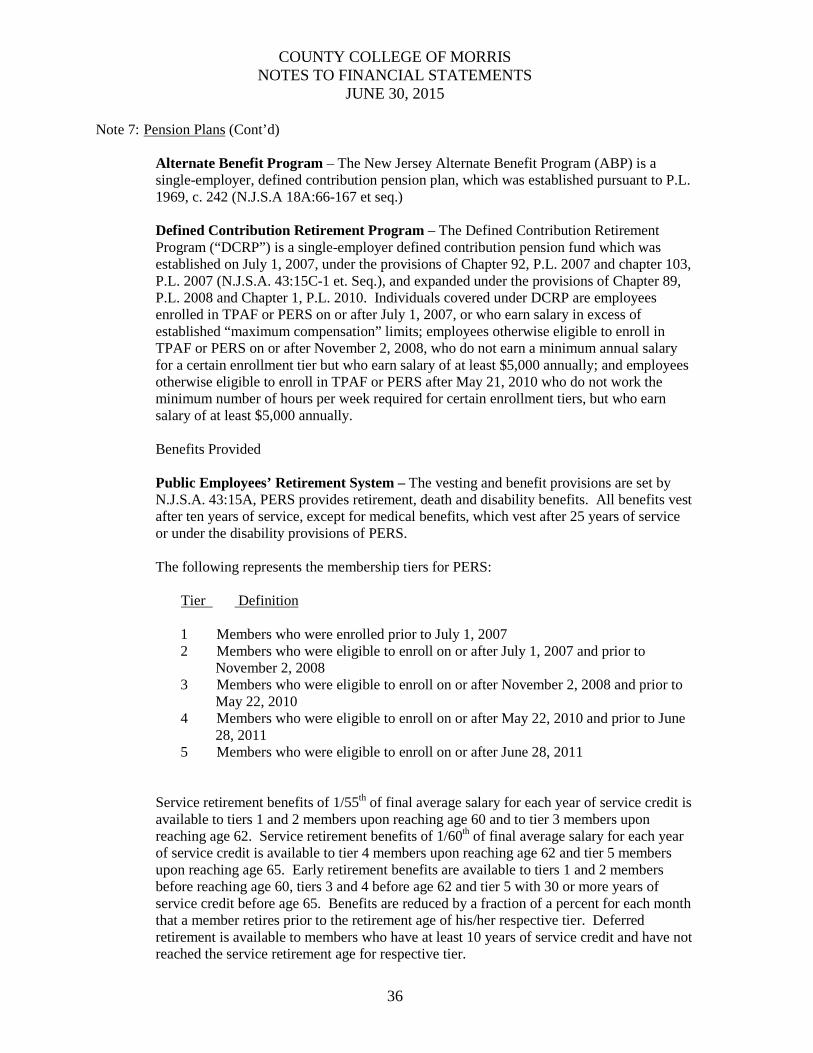
Note 7: Pension Plans (Cont’d) Alternate Benefit Program – The New Jersey Alternate Benefit Program (ABP) is a single-employer, defined contribution pension plan, which was established pursuant to P.L. 1969, c. 242 (N.J.S.A 18A:66-167 et seq.) Defined Contribution Retirement Program – The Defined Contribution Retirement Program (“DCRP”) is a single-employer defined contribution pension fund which was established on July 1, 2007, under the provisions of Chapter 92, P.L. 2007 and chapter 103, P.L. 2007 (N.J.S.A. 43:15C-1 et. Seq.), and expanded under the provisions of Chapter 89, P.L. 2008 and Chapter 1, P.L. 2010. Individuals covered under DCRP are employees enrolled in TPAF or PERS on or after July 1, 2007, or who earn salary in excess of established “maximum compensation” limits; employees otherwise eligible to enroll in TPAF or PERS on or after November 2, 2008, who do not earn a minimum annual salary for a certain enrollment tier but who earn salary of at least $5,000 annually; and employees otherwise eligible to enroll in TPAF or PERS after May 21, 2010 who do not work the minimum number of hours per week required for certain enrollment tiers, but who earn salary of at least $5,000 annually. Benefits Provided Public Employees’ Retirement System – The vesting and benefit provisions are set by N.J.S.A. 43:15A, PERS provides retirement, death and disability benefits. All benefits vest after ten years of service, except for medical benefits, which vest after 25 years of service or under the disability provisions of PERS.
The following represents the membership tiers for PERS:
Tier Definition
1 Members who were enrolled prior to July 1, 2007 2 Members who were eligible to enroll on or after July 1, 2007 and prior to
November 2, 2008 3 Members who were eligible to enroll on or after November 2, 2008 and prior to
May 22, 2010 4 Members who were eligible to enroll on or after May 22, 2010 and prior to June
28, 2011 5 Members who were eligible to enroll on or after June 28, 2011
Service retirement benefits of 1/55th of final average salary for each year of service credit is available to tiers 1 and 2 members upon reaching age 60 and to tier 3 members upon reaching age 62. Service retirement benefits of 1/60th of final average salary for each year of service credit is available to tier 4 members upon reaching age 62 and tier 5 members upon reaching age 65. Early retirement benefits are available to tiers 1 and 2 members before reaching age 60, tiers 3 and 4 before age 62 and tier 5 with 30 or more years of service credit before age 65. Benefits are reduced by a fraction of a percent for each month that a member retires prior to the retirement age of his/her respective tier. Deferred retirement is available to members who have at least 10 years of service credit and have not reached the service retirement age for respective tier.

COUNTY COLLEGE OF MORRIS NOTES TO FINANCIAL STATEMENTS
JUNE 30, 2015
37
Note 7: Pension Plans (Cont’d) Alternate Benefit Program – The ABP provides retirement, death and disability, and medical benefits to qualified members. Defined Contribution Retirement Program – Eligible members are provided with defined contribution retirement plan intended to qualify for favorable Federal income tax treatment under IRC Section 101(a), a noncontributory group life insurance plan and a noncontributory group disability benefit plan. A participant’s interest in that portion of his or her defined contribution retirement plan account attributable to employee contributions shall immediately become and shall at all times remain fully vested and nonforfeitable. A participant’s interest in that portion of his or her defined contribution retirement plan account attributable to employer contributions shall be vested and nonforfeitable on the date the participant commences the second year of employment or upon his or her attainment of age 65, while employed by an employer, whichever occurs first.
Contributions
Public Employees’ Retirement System – The contribution policy is set by N.J.S.A. 43:15A and requires contributions by active members and contributing employers. Members contribute at a uniform rate. Pursuant to the provisions of Chapter 78, P.L. 2011, the active member contribution rate increased from 5.5% of annual compensation to 6.5% plus an additional 1% phased-in over 7 years beginning in July 2012. The member contribution rate was 6.92% in fiscal year 2015. The phase-in of the additional incremental member contribution rate takes place in July of each subsequent State fiscal year. Employers’ contribution amounts are based on an actuarially determined rate. The annual employer contributions include funding for basic retirement allowances and noncontributory death benefits.
The College’s contractually required contribution rate for the fiscal year ended June 30, 2015 was 12.26% of annual College payroll, actuarially determined as an amount that, when combined with employee contributions, is expected to finance the costs of benefits earned by employees during the year, with an additional amount to finance any unfunded accrued liability. Contributions to the pension plan from the College were $1,125,901 for the fiscal year ended June 30, 2015.
Alternate Benefit Program – The contributions requirements of plan members are determined by State statute. In accordance with N.J.S.A. 18A:66-173, required contributions, calculated on the employee’s base pay, are 5% for plan members, and 8% for employers. Plan members may make additional voluntary contributions subject to section 403(b) of the internal revenue code. Under N.J.S.A 18A:66-174, most employer contributions are made by the State of New Jersey on-behalf of the College. The College is responsible for the employer contributions for non-academic employees. Plan members direct the investment of contributions to insurance companies and mutual fund companies selected by the New Jersey Division of Pensions’ Pension Provider Selector Board. These companies administer plan funds based on alternate benefit contracts with the New Jersey Division of Pensions.
COUNTY COLLEGE OF MORRIS NOTES TO FINANCIAL STATEMENTS
JUNE 30, 2015
38
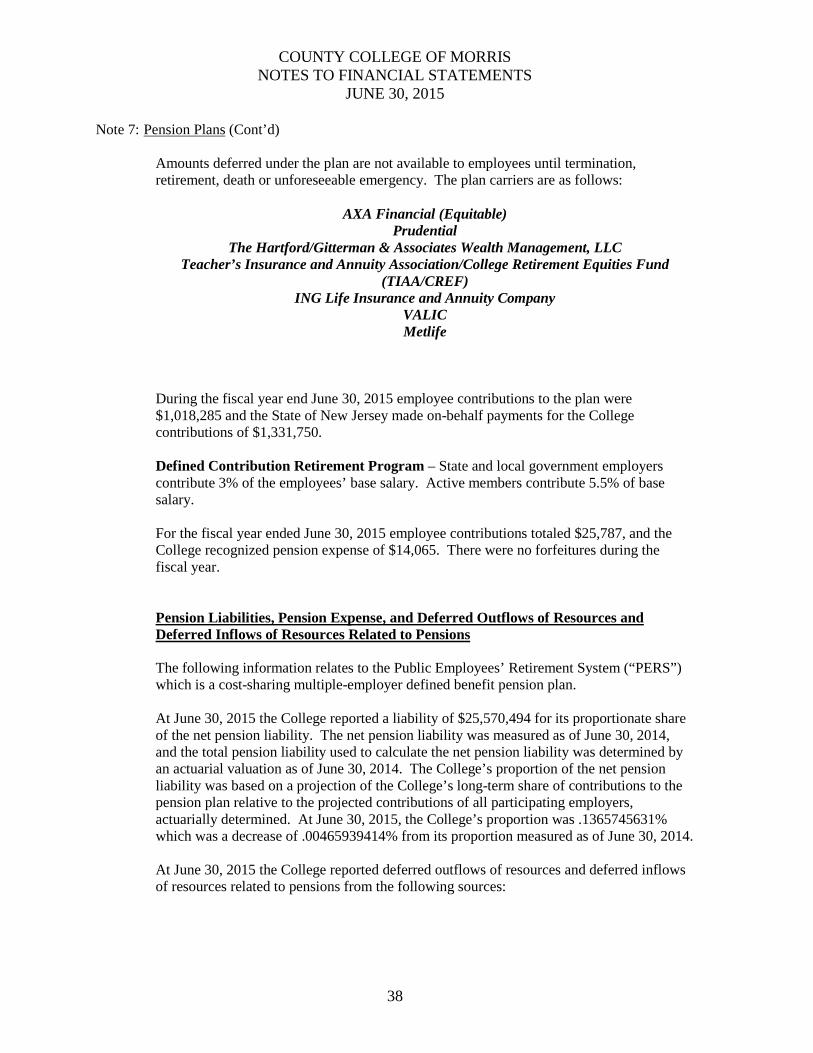
Note 7: Pension Plans (Cont’d) Amounts deferred under the plan are not available to employees until termination, retirement, death or unforeseeable emergency. The plan carriers are as follows:
AXA Financial (Equitable)
Prudential The Hartford/Gitterman & Associates Wealth Management, LLC
Teacher’s Insurance and Annuity Association/College Retirement Equities Fund (TIAA/CREF)
ING Life Insurance and Annuity Company VALIC Metlife
During the fiscal year end June 30, 2015 employee contributions to the plan were $1,018,285 and the State of New Jersey made on-behalf payments for the College contributions of $1,331,750. Defined Contribution Retirement Program – State and local government employers contribute 3% of the employees’ base salary. Active members contribute 5.5% of base salary. For the fiscal year ended June 30, 2015 employee contributions totaled $25,787, and the College recognized pension expense of $14,065. There were no forfeitures during the fiscal year. Pension Liabilities, Pension Expense, and Deferred Outflows of Resources and Deferred Inflows of Resources Related to Pensions The following information relates to the Public Employees’ Retirement System (“PERS”) which is a cost-sharing multiple-employer defined benefit pension plan.
At June 30, 2015 the College reported a liability of $25,570,494 for its proportionate share of the net pension liability. The net pension liability was measured as of June 30, 2014, and the total pension liability used to calculate the net pension liability was determined by an actuarial valuation as of June 30, 2014. The College’s proportion of the net pension liability was based on a projection of the College’s long-term share of contributions to the pension plan relative to the projected contributions of all participating employers, actuarially determined. At June 30, 2015, the College’s proportion was .1365745631% which was a decrease of .00465939414% from its proportion measured as of June 30, 2014. At June 30, 2015 the College reported deferred outflows of resources and deferred inflows of resources related to pensions from the following sources:

COUNTY COLLEGE OF MORRIS NOTES TO FINANCIAL STATEMENTS
JUNE 30, 2015
39
Note 7: Pension Plans (Cont’d)
Deferred Deferred Outflow Inflow
Of Resources Of ResourcesDifferences Between Expected and Actual Experience -$ -$
Changes of Assumptions 804,074 -
Net Difference Between Projected and Actual Earnings on Pension Plan Investments 1,523,862
Changes in Proportion and Differences Between College Contributions and Proportionate Share of Contributions 752,226
College Contributions Subsequent to the measurement Date -
804,074$ 2,276,088$
$2,276,088 reported as deferred outflows of resources related to pensions resulting from College contributions subsequent to the measurement date will be recognized as a reduction of the net pension liability in the fiscal year ending June 30, 2016. Other amounts reported as deferred outflows of resources and deferred inflows of resources related to pensions will be recognized in pension expense as follows:
COUNTY COLLEGE OF MORRIS NOTES TO FINANCIAL STATEMENTS
JUNE 30, 2015
40
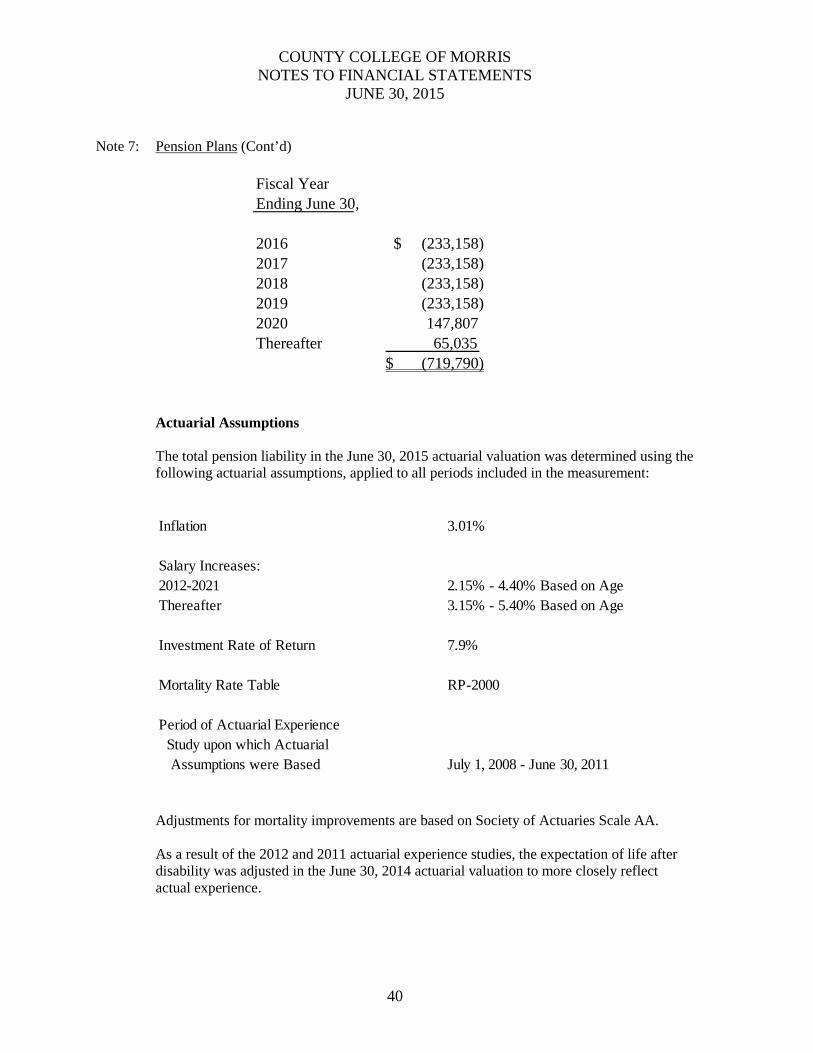
Note 7: Pension Plans (Cont’d)
Actuarial Assumptions The total pension liability in the June 30, 2015 actuarial valuation was determined using the following actuarial assumptions, applied to all periods included in the measurement:
Inflation 3.01%
Salary Increases:2012-2021 2.15% - 4.40% Based on AgeThereafter 3.15% - 5.40% Based on Age
Investment Rate of Return 7.9%
Mortality Rate Table RP-2000
Period of Actuarial Experience Study upon which Actuarial Assumptions were Based July 1, 2008 - June 30, 2011
Adjustments for mortality improvements are based on Society of Actuaries Scale AA. As a result of the 2012 and 2011 actuarial experience studies, the expectation of life after disability was adjusted in the June 30, 2014 actuarial valuation to more closely reflect actual experience.
Fiscal Year Ending June 30,
2016 (233,158) $ 2017 (233,158) 2018 (233,158) 2019 (233,158) 2020 147,807 Thereafter 65,035
$ (719,790)

COUNTY COLLEGE OF MORRIS NOTES TO FINANCIAL STATEMENTS
JUNE 30, 2015
41
Note 7: Pension Plans (Cont’d)
The long-term expected rate of return on pension plan investments was determined using a building-block method in which best-estimate ranges of expected future real rate of return (expected returns, net of pension plans investment expense and inflation) are developed for each major asset class. These ranges are combined to produce the long-term expected rate of return by weighting the expected future real rates of return by the target asset allocation percentage and by adding expected inflation. Best estimates of arithmetic real rates of return for each major asset class included in the pension plans’ target asset allocation as of June 30, 2014 (see the discussion of the pension plans’ investment policy) are summarized in the following table:
Long-TermTarget Expected Real
Asset Class Allocation Rate of Return
Cash 6.00% 0.80%Core Bonds 1.00% 2.49%Intermediate-Term Bonds 11.20% 2.26%Mortgages 2.50% 2.17%High Yield Bonds 5.50% 4.82%Inflation-Indexed Bonds 2.50% 3.51%Broad US Equities 25.90% 8.22%Developed Foreign Equities 12.70% 8.12%Emerging Market Equities 6.50% 9.91%Private Equity 8.25% 13.02%Hedge Funds/Absolute Return 12.25% 4.92%Real Estate (Property) 3.20% 5.80%Commodities 2.50% 5.35%
100.00%
Discount Rate The discount rate used to measure the total pension liabilities of the plan was 5.39%. The projection of cash flows used to determine the discount rate assumed that employee contributions will be made at the current contribution rate, contributions from employers will be made at contractually required rates (actuarially determined), and contributions from the State will be made at current statutorily required rates. Based on those assumptions, the pension plans’ fiduciary net position was projected to be available to make all projected future benefit payments of current active and inactive employees through 2033. Therefore, the long-term expected rate of return on pension plan investments was applied to projected benefit payments through 2033 to determine the total pension liability.

COUNTY COLLEGE OF MORRIS NOTES TO FINANCIAL STATEMENTS
JUNE 30, 2015
42
Note 7: Pension Plans (Cont’d) The following table represents the crossover period for the plan: Period of Projected Benefit Payments for Which the Following Rates were Applied: Long-term Expected Rate of Return Through June 30, 2033 Municipal Bond Rate From July 1, 2033 and Thereafter
Sensitivity of College’s Proportionate Share of Net Pension Liability to Changes in the Discount Rate The following presents the College’s proportionate share of the net pension liability calculated using a discount rate of 5.39%, as well as what the College’s proportionate share of the net pension liability would be if it were calculated using a discount rate that is 1% lower or 1% higher than the current rates used:
1% Current 1%Decrease Discount Rate Increase(4.39%) (5.39%) (6.39%)
College's Proportionate Share of the Net Pension Liability 34,872,728$ 25,570,494$ 20,029,804$
Pension Plan Fiduciary Net Position Detailed information about each pension plan’s fiduciary net position is available in the separately issued New Jersey Division of Pension and Benefits financial report. Information on where to obtain the report is indicated above.
Note 8: Retirement Program
The faculty, as well as certain administrative and professional employees of New Jersey Public Colleges and Universities may enroll in optional retirement plans. This is in lieu of participation in the pension plans detailed in Note 7. The optional retirement plans offered through TIAA-CREF, ING, Met-Life, AIG-Valic, The Hartford and AXA Equitable are defined contribution plans. Accordingly, benefits depend solely on amounts contributed to the plan plus investment earnings. Plan contributions are based on annual salary. Employees contribute 5% of salary and the State of New Jersey contributes 8% of salary, for a total contribution of 13%. The employer (8%) and employee (5%) contributions are sent to a delayed vesting contract immediately upon hire. The participants have personal contracts with the above companies and personally own the annuities. Total contributions from the State of New Jersey for

COUNTY COLLEGE OF MORRIS NOTES TO FINANCIAL STATEMENTS
JUNE 30, 2015
43
Note 8: Retirement Program (Cont’d)
the year ended June 30, 2015 were $1,323,892 and total expenses under the plan were $292,046. State of New Jersey contributions are recognized as revenue and expenses in the appropriate periods.
Note 9: Unearned Revenue
Unearned revenue consists of the unearned portion of tuition and fees for courses offered during the summer and fall.
Note 10: Long-term Liabilities
The College’s long term liabilities consist of employee pension and unused sick leave that is paid upon retirement. PITC’s long term liability consists of tenant security deposits. The following table presents the changes in long term liabilities for the fiscal year ended June 30, 2015:
It is estimated that of the $2,183,084 sick leave liability, $1,981,657 is long term and $201,427 is short term which may become due within one year based upon employee retirements.
Capital Lease On January 1, 2014 the College entered into a ten year lease agreement with the New Jersey Educational Facilities Authority. The Authority will issue up to $47,418,350 of revenue bonds to finance the purchase of higher education equipment for lease to various public and private institutions of higher education within the State of New Jersey. The College’s share of the issue will be for equipment up to $1,274,387. The State of New Jersey will pay 75% of the annual debt service on the bonds, subject to annual appropriations. The College began paying 25% of the annual debt service on May 1, 2015.
Restated June 30, 2014 June 30, 2015
Balance Additions Reduction Balance Compensated Absences 2,183,084 $ 198,002 $ 273,216 $ 2,107,870 $ Deposits 8,951 1,195 1,630 8,516 Pension Liability 26,992,615 - 1,422,121 25,570,494
29,184,650 $ 199,197 $ 1,696,967 $ 27,686,880 $

COUNTY COLLEGE OF MORRIS NOTES TO FINANCIAL STATEMENTS
JUNE 30, 2015
44
Note 10: Long-term Liabilities (Cont’d)
Note 11: Interfund Receivables and Payables
The following details interfund balances at June 30, 2015.
Interfund InterfundFund Receivables Payables
Current Unrestricted Fund 1,567,809$ 32,477$ Current Restricted Fund 5,766 398,275 Foundation Fund 859 2,498 Plant Fund - 1,141,184
1,574,434$ 1,574,434$
2015
June 30, 2015 interfund balances reported are the result of reciprocal interfund activity. The majority of the 2015 interfund receivable balance in the Current Unrestricted Fund is June invoices processed on behalf of the Current Restricted Fund, Plant Fund, Foundation and Student Activities plus accrued payroll costs for June.
Year Ending Amount June 30, 2016 39,655 $ June 30, 2017 39,656 $ June 30, 2018 39,658 $ June 30, 2019 39,656 $ June 30, 2020 39,648 $ June 30, 2021 39,629 $ June 30, 2022 39,631 $ June 30, 2023 39,648 $
Total future minimum lease payment 317,182 $ Less amount representing interest 60,925 $ Present value of net minimum lease payments 256,257 $

COUNTY COLLEGE OF MORRIS NOTES TO FINANCIAL STATEMENTS
JUNE 30, 2015
45
Note 12: Interfund Transfers
The following interfund transfers were made during the year ended June 30, 2015
Note 13: Restricted Expendable Net Position
Restricted net position includes resources that the College is legally or contractually obligated to spend in accordance with restrictions imposed by external third parties. When both restricted and unrestricted resources are available for use, it is the College’s policy to use restricted resources first, then unrestricted resources when they are needed. The restricted expendable net position at June 30, 2015 is comprised of the following categories:
College PITCScholarships 728,061$ -$ Unemployment Benefit Reserve 309,326 - Public Relations 94,989 16,000 Academics 94,613 - Athletics 5,705 -
1,232,694$ 16,000$
2015
Note 14: Restricted Non-Expendable Net Position
The Foundation has been the recipient of endowments. Current college policy does not allow spending of unrealized gains on investments. New Jersey State Law is silent on the ability to spend that net appreciation. Realized income generated from each endowment may be spent pursuant to donors’ intent. The current spending policy allows for 80% of earned income to be spent on scholarships and the remaining 20% reinvested into the endowment principal.
Mandatory Transfers: Operating to Restricted for Required Matching Funds 83,727 Foundation to Restricted for Program Expenditures 74,911 Foundation to Plant for Capital Projects 370,531 Non-mandatory Transfers: Operating to Plant for Self-funded Capital Projects 2,923,328 Foundation to Restricted for Program Expenditures Bookstore to Plant for Self-funded Capital Projects 403,325
13,789

COUNTY COLLEGE OF MORRIS NOTES TO FINANCIAL STATEMENTS
JUNE 30, 2015
46
Note 14: Restricted Non-Expendable Net Position (Cont’d)
Note 15: Economic Dependency
The College receives a substantial amount of its support from federal, state and county governments. A significant reduction in the level of support, if this were to occur, may have an effect on the College’s programs and activities.
Note 16: Unrestricted Net Position
The total Unrestricted Net Position at June 30, 2015 was ($1,777,343), as a result of the implementation of GASB 68. This does not reflect that the College is in financial hardship and is a permitted practice under Generally Accepted Accounting Principles.
Prior to the implementation of GASB 68, the following amounts had been designated for the various future capital projects. The following have been appropriated by the Board of Trustees as of June 30, 2015.
FundAdministrative Computing 39,035$ Technology Reserve 1,624,273 Academic Furnishings 2,220,624 Furnishings and Equipment 573,520 Building Renovations 3,879,710 Video Surveillance 526,717 Planetarium Renovations 24,387 Route 10 Access 361,633 LRC Media Center 298,206
9,548,105$
Pre-GASB 68 - Net Position 23,793,151 $ GASB 68 - Pension Liability (25,570,494) Post-GASB 68 - Net Position $ (1,777,343)
2015 Unrestricted Endowment 272,892 $ Endowment Income Restricted for Scholarships 2,792,215 Unrealized Gains on Investments -
3,065,107 $

COUNTY COLLEGE OF MORRIS NOTES TO FINANCIAL STATEMENTS
JUNE 30, 2015
47
Note 17: Post-Employment Benefits
Chapter 384 of Public Laws 1987 and Chapter 6 of Public Laws 1990 required TPAF and PERS, respectively, to fund post-retirement medical benefits for those State employees who retire after accumulating 25 years of credited service or on a disability retirement. P.L. 2007, c.103 amended the law to eliminate the funding of post-retirement medical benefits through the TPAF and PERS. It created separate funds outside of the pension plans for the funding and payment of post-retirement medical benefits for retired State employees and retired educational employees. The cost of these benefits is funded through contributions by the State in accordance with Chapter 62, P.L. 1994. Funding of post-retirement medical premiums changed from a pre-funding basis to a pay-as-you-go basis beginning in fiscal year 1994. The State is also responsible for the cost attributable to Chapter 126, P.L. 1992, which provides health benefits to members of PERS and the Alternate Benefit Program who retired from a Board of Education or County College with 25 years of service. The State paid $21.4 million toward Chapter 126 benefits for eligible retired community college members in Fiscal Year 2015. It is estimated that $1,125,368 was made on behalf of the County College of Morris in fiscal year 2015. State of New Jersey contributions are recognized as revenues and expenses in the appropriate periods.
Note 18: Related Party Transactions
During the year ended June 30, 2015 the College recognized $16,180,041 of financial support and grants from the County of Morris for current operations and various capital projects. The College has billed the County for personnel, printing and miscellaneous other services in the amount of $189,809 in 2015.
Note 19: Risk Management
The County College of Morris is currently a member of the Morris County Insurance Fund (the Pool). The Pool provides its members with property, liability, motor vehicle, and other miscellaneous coverages. The Pool is a risk-sharing public entity pool that is both an insured and self-administered group, established for the purpose of providing low cost insurance coverage for their members in order to keep local property taxes at a minimum. As a member of the Pool, the College could be subject to supplemental assessments in the event of deficiencies. If the assets of the Pool were to be exhausted, members would become responsible for their respective shares of the Pool's liabilities. The Pool can declare and distribute dividends to members upon approval of the State of New Jersey Department of Banking and Insurance. These distributions are divided amongst the members in the same ratio as their individual assessment relates to the total assessment of the membership body. In accordance with Statement No. 10 of the Governmental Accounting Standards Board, these distributions are used to reduce the amount recorded for membership expense in the year in which the distribution was declared.

COUNTY COLLEGE OF MORRIS NOTES TO FINANCIAL STATEMENTS
JUNE 30, 2015
48
Note 19: Risk Management (Cont’d)
Selected, summarized financial information for the Pool as of December 31, 2014 is as follows:
Morris County Insurance Fund
Total Assets $10,296,435 Net Position 4,723,569 Total Operating Revenue 3,061,986 Total Operating Expenses 3,081,987 Non-Operating Revenue 22,181 Change in Net Position 2,180 Distributions to Participating Members -0-
Financial statements for the Pool are available at the Morris County Treasurer’s Office. Susan Allard, Secretary to the Morris County Insurance Fund Commission Morris County Freeholders’ Office Court Street, P.O. Box 900 Administration and Records Building Morristown, New Jersey 07963-0900
New Jersey Unemployment Compensation Insurance: The College self funds its New Jersey unemployment compensation insurance claims. The balance at June 30, 2015 was $309,326.
Note 20: New Accounting Standards Adopted
In June 2012 GASB issued Statement No. 68, Accounting and Financial Reporting for Pensions – An Amendment of GASB Statement No. 27, GASB Statement No.71, Pension Transition for Contributions Made Subsequent to the Measurement Date – an amendment of GASB Statement No. 68, are effective for fiscal years beginning after June 15, 2014. The primary objective of GASB Statement No. 68 is to improve accounting and financial reporting by state and local governments for pensions. It also improves information provided by other entities. Additionally, this statement establishes standards for measuring and recognizing pension liabilities of the College in the financial statements and details the information to be included in the footnote disclosures and required supplementary information on pensions. Successful implementation of these standards will require the provision of certain key financial and non-financial information from the New Jersey Division of Pensions.

COUNTY COLLEGE OF MORRIS NOTES TO FINANCIAL STATEMENTS
JUNE 30, 2015
49
Note 20: New Accounting Standards Adopted (Cont’d)
For the fiscal year ended June 30, 2015, the College adopted GASB 68, Accounting and Financial Reporting for Pensions – an amendment of GASB Statement No. 27, and GASB 71, Pension Transition for Contributions Made Subsequent to the Measurement Date – an amendment of GASB Statement No. 68. As a result of adopting such Statements, the College was required to measure and recognize liabilities, deferred outflows of resources, deferred inflows of resources, and expense/expenditures related to their defined benefit pensions. The cumulative effect of adopting GASB Statements No. 68 and No. 71 totaled $26,992,615, and was recognized as a restatement of the College’s June 30, 2014 net position on the statement of revenues, expenses, and changes in Net position.
Note 21: Contingent Liabilities
At June 30, 2015 the College had commitments of approximately $7.5 million for the Music Technology addition, $1.2 million for the renovation of the LRC Media Center, $500 thousand for the creation of the access road to Route 10 and Building 675 sewer connection, $356 thousand for HVAC replacement for the building, and $500 thousand for the replacement of the College’s switchgear. These projects are funded via County approved Chapter 12 bonds and State Higher Education Bonds. The majority of these commitments are expected to occur in 2015. The $10.8 million has been approved by the board. The College is periodically involved in claims and lawsuits incidental to its operations. In the opinion of the administration and legal counsel, the ultimate resolution of these matters will not have a material adverse effect on the financial position or operations of the College. The College participates in federal and state assisted grant programs. These programs are subject to program compliance audits by the grantors or their representatives. The College is potentially liable for expenditures which may be disallowed pursuant to the terms of these grant programs. Management of the College is not aware of any material items of noncompliance which would result in the disallowance of grant program expenditures.
Note 22: Prior Period Adjustments
As indicated in Note 20 to the financial statements, in fiscal year 2015, the College adopted
GASB Statement 68, Accounting and Financial Reporting for Pensions – an amendment of GASB Statement No. 27. As a result of implementing this new GASB statement, it was necessary to adjust unrestricted net position for the College’s proportionate share of the Public Employees’ Retirement System ( PERS) net pension liability. The cumulative effect on the financial statements as reported for June 30, 2014 is as follows:
Long-Term Liabilities: As Reported Prior Period Restated June 30, 2014 Adjustment June 30, 2014
Compensated Absences Payable 1,981,657 1,981,657 Capital Lease Payable 256,257 256,257 Net Pension Liability 0 26,992,615 26,992,615
2,237,914 26,992,615 29,230,529
COUNTY COLLEGE OF MORRIS NOTES TO FINANCIAL STATEMENTS
JUNE 30, 2015
50
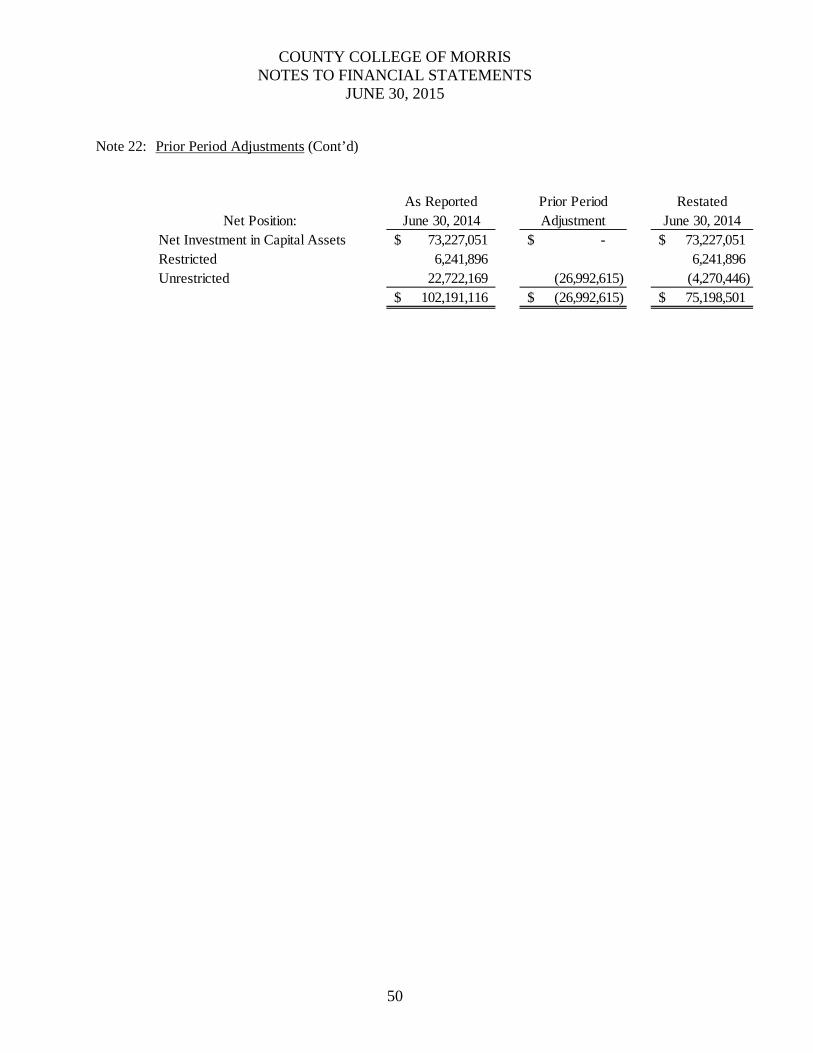
Note 22: Prior Period Adjustments (Cont’d)
As Reported Prior Period RestatedNet Position: June 30, 2014 Adjustment June 30, 2014
Net Investment in Capital Assets 73,227,051$ -$ 73,227,051$ Restricted 6,241,896 6,241,896 Unrestricted 22,722,169 (26,992,615) (4,270,446)
102,191,116$ (26,992,615)$ 75,198,501$

Schedules of Required Supplementary InformationSchedules of the County College of Morris Proportionate Share of the Net Pension Liability Required Supplementary Information
PERSFor the Fiscal Year Ending June 30, 2015
Unaudited
College's portion of the net pension lability (asset) 0.14%
College's proportionate share of the net pension liability (asset) 25,570,494$
College's covered-employee payroll 9,185,519$
College's proportionate share of the net pension liability (asset)as a percentage of its covered -employee payroll 278.38%
Plan fiduciary net positions as a percentage of the total 52.08%pension liability
* The amounts presented for each fiscal year were determined as of the calendar year-end that occurred within the fiscal year
51

Schedule of County College of Morris ContributionsPERS
For the Fiscal Year Ending June 30, 2015Unaudited
Contractually required contribution 1,125,901$
Contributions in relation to the contractuallyrequired contribution (1,125,901)
Contribution deficiency (excess) -$
College's covered-employee payroll9,185,519$
Contributions as a percentage of covered-employee payroll 12.26%
52
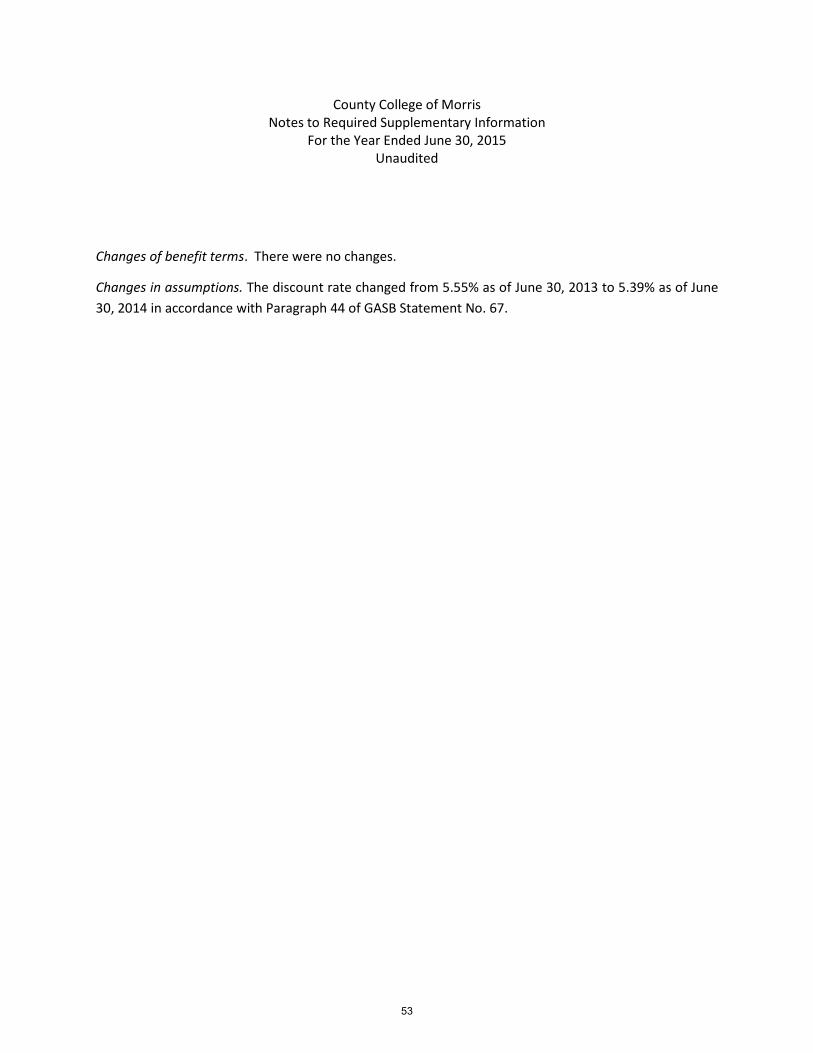
County College of Morris Notes to Required Supplementary Information
For the Year Ended June 30, 2015 Unaudited
Changes of benefit terms. There were no changes.
Changes in assumptions. The discount rate changed from 5.55% as of June 30, 2013 to 5.39% as of June 30, 2014 in accordance with Paragraph 44 of GASB Statement No. 67.
53

This page is intentionally left blank.
54

Statistical Section


STATISTICAL SECTION OVERVIEW This part of the College’s Comprehensive Annual Financial Report presents detailed information as a context for understanding what the information in the financial statements, note disclosures and required supplementary information says about the College’s overall financial health. Contents Pages Financial Trend Information
These schedules contain trend information to help the reader understand how the College's financial performance and well-being have changed over time. 56 - 61
Revenue Capacity
This schedule contains information to help the reader assess the factors affecting the College's ability to generate its tuition revenue. 62
Debt Capacity
This schedule presents information to help the reader assess the affordability of the College's current level of outstanding debt and the College's ability to participate in additional capital leases in the future. 63
Demographic and Economic Information These schedules offer demographic and economic indicators to help the
reader understand the environment within which the College's financial activities take place and to help make comparisons over time and with other governments. 64 - 67
Supplemental Management Statistics
These schedules contain information about the College's operations and resources to help the reader understand how the College's financial information relates to the services the College provides and the activities it performs. 68 - 76
Sources: Unless otherwise noted, the information in these schedules is derived from the College’s Comprehensive Annual Financial Report for the relevant year.
55

ITEMNet Invesment in capital assets 36,621,918$ 37,394,509$ 41,109,690$ 42,025,411$ 45,479,344$ 50,455,841$ 54,348,416$ 59,776,549$ 73,504,405$ 82,010,934$ Restricted - expendable 1,243,689 1,478,370 1,674,974 1,839,307 1,244,369 1,331,271 1,437,909 1,565,613 1,629,441 1,232,694 Restricted - nonexpendable 1,362,371 1,723,107 1,999,077 1,780,449 2,206,604 2,690,972 3,275,266 3,866,569 4,612,455 3,065,107 Unrestricted 15,557,759 16,793,139 19,867,703 22,496,294 25,234,089 27,129,470 25,463,514 24,157,871 22,444,815 (1,777,343) TOTAL 54,785,737$ 57,389,125$ 64,651,444$ 68,141,461$ 74,164,406$ 81,607,554$ 84,525,105$ 89,366,602$ 102,191,116$ 84,531,392$
ITEMNet Invesment in capital assets 66.85% 65.16% 63.59% 61.67% 61.33% 61.83% 64.30% 66.89% 71.94% 97.01%Restricted - expendable 2.27% 2.58% 2.59% 2.70% 1.68% 1.63% 1.70% 1.75% 1.59% 1.46%Restricted - nonexpendable 2.49% 3.00% 3.09% 2.61% 2.98% 3.30% 3.87% 4.33% 4.51% 3.63%Unrestricted 28.40% 29.26% 30.73% 33.01% 34.02% 33.24% 30.13% 27.03% 21.96% -2.10%TOTAL 100.00% 100.00% 100.00% 100.00% 100.01% 100.00% 100.00% 100.00% 100.00% 100.00%
COUNTY COLLEGE OF MORRISNET POSITION BY COMPONENT AS A PERCENTAGE OF TOTAL
2004-2005 ACTUAL
2005-2006 ACTUAL
2006-2007 ACTUAL
2010-2011 ACTUAL
2012-2013 ACTUAL
2011-2012 ACTUAL
2013-2014 ACTUAL
UNAUDITED
NET POSITION BY COMPONENT
UNAUDITED
COUNTY COLLEGE OF MORRIS
2014-2015 ACTUAL
2005-2006 ACTUAL
2006-2007 ACTUAL
2007-2008 ACTUAL
2008-2009 ACTUAL
2009-2010 ACTUAL
2008-2009 ACTUAL
2007-2008 ACTUAL
2009-2010 ACTUAL
2013-2014 ACTUAL
2010-2011 ACTUAL
2011-2012 ACTUAL
2012-2013 ACTUAL
$(10,000,000)
$-
$10,000,000
$20,000,000
$30,000,000
$40,000,000
$50,000,000
$60,000,000
$70,000,000
$80,000,000
$90,000,000
1
COMPARATIVE NET POSITION BY COMPONENT
Net Invesment in capital assets Restricted - expendable Restricted - nonexpendable Unrestricted
56

2006 2007 2008 2009 2010 2011 2012 2013 2014 2015OPERATING REVENUES
Student tuition and fees 23,387,894$ 24,191,572$ 26,142,448$ 27,353,697$ 28,362,806$ 29,538,633$ 29,139,718$ 28,571,503$ 28,534,478$ 28,723,880$ Federal grants and contracts 2,753,238 2,703,736 3,152,854 3,907,190 6,208,259 8,095,540 892,864 990,876 1,031,787 1,493,434 State and local grants and contracts 2,164,523 2,145,327 2,225,093 2,412,391 4,068,998 3,549,470 3,919,307 3,841,101 4,336,529 5,673,000 Auxiliary services 4,399,122 4,581,752 4,854,218 5,096,282 5,052,757 4,525,748 4,395,999 4,415,347 3,901,360 3,734,678 Gifts 188,303 508,986 744,737 747,913 242,067 236,045 234,878 191,564 149,007 200,683 Other 398,840 533,730 446,110 603,718 576,705 542,841 1,056,501 871,087 817,746 793,588
Total Operating Revenues 33,291,920 34,665,103 37,565,460 40,121,191 44,511,592 46,488,277 39,639,267 38,881,478 38,770,907 40,619,263
OPERATING EXPENSESInstruction 23,055,531 23,702,678 24,286,870 24,723,076 26,676,746 26,813,545 27,754,303 27,242,885 28,551,764 28,725,970 Academic support 4,999,897 4,894,720 4,929,343 4,508,195 4,972,697 4,997,055 4,982,803 5,127,489 5,240,013 5,518,924 Public service 707,865 457,669 521,859 490,820 455,530 425,880 769,331 490,054 679,374 964,492 Student affairs 4,300,294 4,257,566 4,444,686 4,606,417 4,766,686 4,686,953 4,851,349 4,919,041 4,912,797 5,091,497 Institutional support 7,252,611 7,615,342 7,989,560 8,306,252 9,063,787 9,120,531 9,032,593 8,896,426 9,054,905 9,532,624 Operation and maintenance of plant 6,691,658 6,426,002 7,781,851 7,212,949 7,466,885 7,653,190 6,736,810 6,747,997 6,805,930 7,034,013 Depreciation 2,014,423 2,114,710 2,145,360 2,235,676 2,156,806 2,423,556 2,446,303 2,756,788 2,870,478 3,616,011 Student aid 2,175,960 2,210,096 2,493,620 3,121,463 4,112,450 4,770,249 4,720,336 4,673,698 4,479,009 4,427,110 Auxiliary services 3,849,510 3,972,134 4,314,188 4,621,363 4,576,215 4,115,163 4,028,155 3,863,858 3,469,650 3,281,216
Total Operating Expenses 55,047,749 55,650,917 58,907,337 59,826,211 64,247,802 65,006,122 65,321,983 64,718,236 66,063,920 68,191,857
Operating Income (Loss) (21,755,829) (20,985,814) (21,341,877) (19,705,020) (19,736,210) (18,517,845) (25,682,716) (25,836,758) (27,293,013) (27,572,594)
NON-OPERATING REVENUES (EXPENSES)Federal Grants 413,418 - 7,409,732 7,627,319 7,845,653 7,914,512 State appropriation 9,313,319 8,458,882 8,988,553 8,035,807 7,028,771 7,169,137 6,844,765 6,899,143 6,988,477 7,000,440 County appropriation 12,414,295 12,816,518 13,018,055 12,757,356 12,175,898 11,600,000 11,600,000 11,600,000 11,600,000 11,600,000 Investment income 1,194,517 1,681,922 1,194,124 470,647 593,134 617,649 248,200 618,603 837,026 378,912 Interest on capital assets and related debt (9,319) (6,348) (3,223) - - - - - - - Other (3,982) (19,870) 4,830 76,213 164,513 31,481 92,341 405,448 53,207 (7,395)
Net Non-operating Revenues 22,908,830 22,931,104 23,202,339 21,340,023 20,375,734 19,418,267 26,195,038 27,150,513 27,324,363 26,886,469
Income (Loss) Before Other Revenues (Expenses) 1,153,001 1,945,290 1,860,462 1,635,003 639,524 900,422 512,322 1,313,755 31,350 (686,125)
OTHER REVENUESCapital contributions 371,804 504,344 5,033,010 1,731,340 5,157,169 6,422,889 1,851,245 3,386,621 12,639,154 10,010,786 Additions to permanent endowments 99,068 153,754 368,847 123,674 226,252 119,837 553,984 141,121 154,010 8,230
Total Other Revenues 470,872 658,098 5,401,857 1,855,014 5,383,421 6,542,726 2,405,229 3,527,742 12,793,164 10,019,016
INCREASE (DECREASE) IN NET POSITION 1,623,873 2,603,388 7,262,319 3,490,017 6,022,945 7,443,148 2,917,551 4,841,497 12,824,514 9,332,891
NET POSITION - BEGINNING OF YEAR 53,161,864 54,785,737 57,389,125 64,651,444 68,141,461 74,164,406 81,607,554 84,525,105 89,366,602 * 75,198,501
NET POSITION - END OF YEAR 54,785,737$ 57,389,125$ 64,651,444$ 68,141,461$ 74,164,406$ 81,607,554$ 84,525,105$ 89,366,602$ 102,191,116$ 84,531,392$
* Net position restated for prior period adjustment
UNAUDITEDCOUNTY COLLEGE OF MORRIS
COMPARATIVE CHANGES IN NET POSITION
57

ITEMStudent tuition and fees 23,387,894$ 24,191,572$ 26,142,448$ 27,353,697$ 28,362,806$ 29,538,633$ 29,139,718$ 28,571,503$ 28,534,478$ 28,723,880$ Federal grants and contracts 2,753,238 2,703,736 3,152,854 3,907,190 6,208,259 8,095,540 892,864 990,876 1,031,787 1,493,434 State and local grants and contracts 2,164,523 2,145,327 2,225,093 2,412,391 4,068,998 3,549,470 3,919,307 3,841,101 4,336,529 4,539,538 Auxiliary services 4,399,122 4,581,752 4,854,218 5,096,282 5,052,757 4,525,748 4,395,999 4,415,347 3,901,360 3,734,678 Gifts 188,303 508,986 744,737 747,913 242,067 236,045 234,878 191,564 149,007 200,683 Other 398,840 533,730 446,110 603,718 576,705 542,843 1,056,501 871,087 817,746 793,588
Total Operating Revenue 33,291,920 34,665,103 37,565,460 40,121,191 44,511,592 46,488,279 39,639,267 38,881,478 38,770,907 39,485,801 Federal grants 413,418 7,409,732 7,627,319 7,845,653 7,914,512 State appropriation 9,313,319 8,458,882 8,988,553 8,035,807 7,028,771 7,169,137 6,844,765 6,899,143 6,988,477 7,000,440 County appropriation 12,414,295 12,816,518 13,018,055 12,757,356 12,175,898 11,600,000 11,600,000 11,600,000 11,600,000 11,600,000 Investment income 1,194,517 1,681,922 1,194,124 470,647 593,134 617,649 248,200 618,603 837,026 378,912 Other 4,830 76,213 164,513 31,481 92,341 405,448 53,207 (7,395)
Total Non-Operating Revenues 22,922,131 22,957,322 23,205,562 21,340,023 19,962,316 19,831,685 26,195,038 27,150,513 27,324,363 26,886,469
TOTAL REVENUES BEFORE OTHER CHANGES IN NET POSITION 56,214,051$ 57,622,425$ 60,771,022$ 61,461,214$ 64,473,908$ 66,319,964$ 65,834,305$ 66,031,991$ 66,095,270$ 66,372,270$
ITEMStudent tuition and fees 41.61% 41.99% 43.01% 44.50% 43.98% 44.54% 44.24% 43.26% 43.17% 43.27%Federal grants and contracts 4.90% 4.69% 5.20% 6.36% 9.63% 12.21% 1.36% 1.50% 1.56% 2.25%State and local grants and contracts 3.85% 3.72% 3.66% 3.93% 6.31% 5.35% 5.95% 5.82% 6.56% 6.84%Auxiliary services 7.83% 7.95% 7.99% 8.29% 7.84% 6.82% 6.68% 6.69% 5.90% 5.63%Gifts 0.33% 0.88% 1.23% 1.22% 0.38% 0.36% 0.36% 0.29% 0.23% 0.30%Other 0.71% 0.93% 0.73% 0.98% 0.89% 0.82% 1.60% 1.32% 1.24% 1.20%
Total Operating Revenue 59.23% 60.16% 61.82% 65.28% 69.03% 70.10% 60.19% 58.88% 58.66% 59.49%Federal grants 0.00% 0.00% 0.00% 0.00% 0.00% 0.62% 11.27% 11.55% 11.87% 11.92%State appropriation 16.57% 14.68% 14.79% 13.07% 10.90% 10.81% 10.40% 10.45% 10.57% 10.55%County appropriation 22.08% 22.24% 21.42% 20.76% 18.89% 17.49% 17.62% 17.57% 17.55% 17.48%Investment income 2.12% 2.92% 1.96% 0.77% 0.92% 0.93% 0.38% 0.94% 1.27% 0.57%Other 0.00% 0.00% 0.01% 0.12% 0.26% 0.05% 0.14% 0.61% 0.08% -0.01%
Total Non-Operating Revenues 40.77% 39.84% 38.18% 34.72% 30.97% 29.90% 39.81% 41.12% 41.34% 40.51%
TOTAL REVENUES BEFORE OTHER CHANGES IN NET POSITION 100.00% 100.00% 100.00% 100.00% 100.00% 100.00% 100.00% 100.00% 100.00% 100.00%
UNAUDITED
SCHEDULE OF REVENUE BY SOURCE
UNAUDITED
2005-2006 ACTUAL
2012-2013 ACTUAL
COUNTY COLLEGE OF MORRIS
2008-2009 ACTUAL
2007-2008 ACTUAL
2010-2011 ACTUAL
2007-2008 ACTUAL
2014-2015 ACTUAL
2005-2006 ACTUAL
2006-2007 ACTUAL
2010-2011 ACTUAL
2009-2010 ACTUAL
2011-2012 ACTUAL
2013-2014 ACTUAL
2008-2009 ACTUAL
SCHEDULE OF REVENUE BY SOURCE AS A PERCENTAGE OF TOTAL
2009-2010 ACTUAL
COUNTY COLLEGE OF MORRIS
2006-2007 ACTUAL
2014-2015 ACTUAL
2012-2013 ACTUAL
2011-2012 ACTUAL
2013-2014 ACTUAL
58

($2,000,000)
$0
$2,000,000
$4,000,000
$6,000,000
$8,000,000
$10,000,000
$12,000,000
$14,000,000
State appropriation County appropriation Investment income Other
COMPARATIVE NONOPERATING REVENUES
2002 2003 2004 2005 2006 2007 2008 2009
`
$-
$2,000,000
$4,000,000
$6,000,000
$8,000,000
$10,000,000
$12,000,000
$14,000,000
$16,000,000
$18,000,000
$20,000,000
$22,000,000
$24,000,000
$26,000,000
$28,000,000
$30,000,000
$32,000,000
Student Tuition andfees
Federal grants andcontracts
State and local grantsand contracts
Auxiliary services Gifts Other
COMPARATIVE OPERATING REVENUES BY SOURCE
($2,000,000)
$0
$2,000,000
$4,000,000
$6,000,000
$8,000,000
$10,000,000
$12,000,000
$14,000,000
Federal grants State appropriation County appropriation Investment income Other
COMPARATIVE NONOPERATING REVENUES
2006 2007 2008 2009 2010 2011 2012 2013 2014 2015
`
59

ITEMInstruction 23,055,531$ 23,702,678$ 24,286,870$ 24,723,076$ 26,676,746$ 26,813,545$ 27,754,303$ 27,242,885$ 28,551,764$ 28,347,297$ Academic support 4,999,897 4,894,720 4,929,343 4,508,195 4,972,697 4,997,055 4,982,803 5,127,489 5,240,013 5,376,921 Public service 707,865 457,669 521,859 490,820 455,530 425,880 769,331 490,054 679,374 964,492 Student affairs 4,300,294 4,257,566 4,444,686 4,606,417 4,766,686 4,686,953 4,851,349 4,919,041 4,912,797 4,949,494 Institutional support 7,252,611 7,615,342 7,989,560 8,306,252 9,063,787 9,120,531 9,032,593 8,896,426 9,054,905 9,272,286 Operation and maintenance of plant 6,691,658 6,426,002 7,781,851 7,212,949 7,466,885 7,653,190 6,736,810 6,747,997 6,805,930 6,797,342 Depreciation 2,014,423 2,114,710 2,145,360 2,235,676 2,156,806 2,423,556 2,446,303 2,756,788 2,870,478 3,616,011 Student aid 2,175,960 2,210,096 2,493,620 3,121,463 4,112,450 4,770,249 4,720,336 4,673,698 4,479,009 4,427,110 Auxiliary services 3,849,510 3,972,134 4,314,188 4,621,363 4,576,215 4,115,163 4,028,155 3,863,858 3,469,650 3,257,549
Total Operating Expenses 55,047,749 55,650,917 58,907,337 59,826,211 64,247,802 65,006,122 65,321,983 64,718,236 66,063,920 67,008,502 Interest on capital assets and related debt 12,145 9,319 6,348 3,223 - - - - - Other 3,982 19,870 -
Total Non-Operating Expenses 12,145 13,301 26,218 3,223 - - - - -
TOTAL EXPENSES 55,059,894$ 55,664,218$ 58,933,555$ 59,829,434$ 64,247,802$ 65,006,122$ 65,321,983$ 64,718,236$ 66,063,920$ 67,008,502$
ITEMInstruction 41.88% 42.58% 41.22% 41.31% 41.52% 41.24% 42.48% 42.09% 43.21% 42.30%Academic support 9.08% 8.79% 8.36% 7.54% 7.74% 7.69% 7.63% 7.92% 7.93% 8.02%Public service 1.29% 0.82% 0.89% 0.82% 0.71% 0.66% 1.18% 0.76% 1.03% 1.44%Student affairs 7.81% 7.65% 7.54% 7.70% 7.42% 7.21% 7.43% 7.60% 7.44% 7.39%Institutional support 13.17% 13.68% 13.56% 13.88% 14.11% 14.03% 13.83% 13.75% 13.71% 13.84%Operation and maintenance of plant 12.15% 11.54% 13.20% 12.06% 11.62% 11.77% 10.31% 10.43% 10.30% 10.14%Depreciation 3.66% 3.80% 3.64% 3.74% 3.36% 3.73% 3.74% 4.26% 4.35% 5.40%Student aid 3.95% 3.97% 4.23% 5.22% 6.40% 7.34% 7.23% 7.22% 6.78% 6.61%Auxiliary services 6.99% 7.14% 7.32% 7.72% 7.12% 6.33% 6.17% 5.97% 5.25% 4.86%
Total Operating Expenses 99.98% 99.97% 99.96% 99.99% 100.00% 100.00% 100.00% 100.00% 100.00% 100.00%Interest on capital assets and related debt 0.02% 0.02% 0.01% 0.01% 0.00% 0.00% 0.00% 0.00% 0.00% 0.00%Other 0.00% 0.01% 0.03% 0.00% 0.00% 0.00% 0.00% 0.00% 0.00% 0.00%
Total Non-Operating Expenses 0.02% 0.03% 0.04% 0.01% 0.00% 0.00% 0.00% 0.00% 0.00% 0.00%TOTAL EXPENSES 100.00% 100.00% 100.00% 100.00% 100.00% 100.00% 100.00% 100.00% 100.00% 100.00%
UNAUDITED
SCHEDULE OF EXPENSES BY IDENTIFIABLE ACTIVITYCOUNTY COLLEGE OF MORRIS
2012-2013 ACTUAL
2012-2013 ACTUAL
2008-2009 ACTUAL
2005-2006 ACTUAL
2010-2011 ACTUAL
2006-2007 ACTUAL
2006-2007 ACTUAL
2008-2009 ACTUAL
2009-2010 ACTUAL
2007-2008 ACTUAL
COUNTY COLLEGE OF MORRISUNAUDITED
2007-2008 ACTUAL
2014-2015 ACTUAL
2005-2006 ACTUAL
SCHEDULE OF EXPENSES BY IDENTIFIABLE ACTIVITY AS A PERCENTAGE OF TOTAL EXPENSES
2014-2015 ACTUAL
2013-2014 ACTUAL
2013-2014 ACTUAL
2011-2012 ACTUAL
2011-2012 ACTUAL
2009-2010 ACTUAL
2010-2011 ACTUAL
$-
$5,000,000
$10,000,000
$15,000,000
$20,000,000
$25,000,000
$30,000,000
Instruction Academic support Public service Student affairs Institutional support Operation andmaintenance of plant
Depreciation Student aid Auxiliary services
COMPARATIVE OPERATING EXPENSES
2006 2007 2008 2009 2010 2011 2012 2013 2014 2015
60

ITEM
Income (Loss) before other changes in net position 1,153,001$ 1,945,290$ 1,860,462$ 1,635,003$ 639,524$ 900,422$ 512,322$ 1,313,755$ 31,350$ (686,125)$
Capital contributions 371,804 504,344 5,033,010 1,731,340 5,157,169 6,422,889 1,851,245 3,386,621 12,639,154 10,010,786
Additions to permanent endowments 99,068 153,754 368,847 123,674 226,252 119,837 553,984 141,121 154,010 8,230
Net increase in net position 1,623,873$ 2,603,388$ 7,262,319$ 3,490,017$ 6,022,945$ 7,443,148$ 2,917,551$ 4,841,497$ 12,824,514$ 9,332,891$
UNAUDITED
SCHEDULE OF OTHER CHANGES IN NET POSITION
2005-2006 ACTUAL
2006-2007 ACTUAL
2007-2008 ACTUAL
2008-2009 ACTUAL
2012-2013 ACTUAL
2011-2012 ACTUAL
2013-2014 ACTUAL
2014-2015 ACTUAL
2009-2010 ACTUAL
COUNTY COLLEGE OF MORRIS
2010-2011 ACTUAL
61
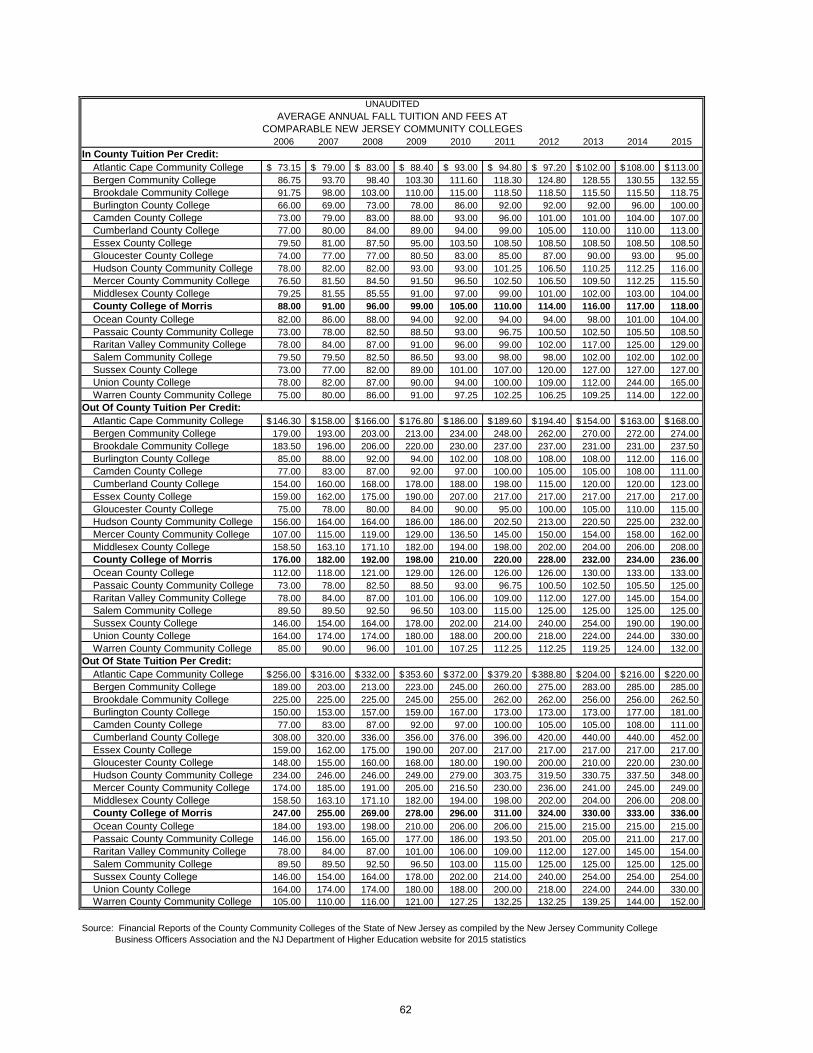
2006 2007 2008 2009 2010 2011 2012 2013 2014 2015In County Tuition Per Credit:
Atlantic Cape Community College 73.15$ 79.00$ 83.00$ 88.40$ 93.00$ 94.80$ 97.20$ 102.00$ 108.00$ 113.00$ Bergen Community College 86.75 93.70 98.40 103.30 111.60 118.30 124.80 128.55 130.55 132.55 Brookdale Community College 91.75 98.00 103.00 110.00 115.00 118.50 118.50 115.50 115.50 118.75 Burlington County College 66.00 69.00 73.00 78.00 86.00 92.00 92.00 92.00 96.00 100.00 Camden County College 73.00 79.00 83.00 88.00 93.00 96.00 101.00 101.00 104.00 107.00 Cumberland County College 77.00 80.00 84.00 89.00 94.00 99.00 105.00 110.00 110.00 113.00 Essex County College 79.50 81.00 87.50 95.00 103.50 108.50 108.50 108.50 108.50 108.50 Gloucester County College 74.00 77.00 77.00 80.50 83.00 85.00 87.00 90.00 93.00 95.00 Hudson County Community College 78.00 82.00 82.00 93.00 93.00 101.25 106.50 110.25 112.25 116.00 Mercer County Community College 76.50 81.50 84.50 91.50 96.50 102.50 106.50 109.50 112.25 115.50 Middlesex County College 79.25 81.55 85.55 91.00 97.00 99.00 101.00 102.00 103.00 104.00 County College of Morris 88.00 91.00 96.00 99.00 105.00 110.00 114.00 116.00 117.00 118.00 Ocean County College 82.00 86.00 88.00 94.00 92.00 94.00 94.00 98.00 101.00 104.00 Passaic County Community College 73.00 78.00 82.50 88.50 93.00 96.75 100.50 102.50 105.50 108.50 Raritan Valley Community College 78.00 84.00 87.00 91.00 96.00 99.00 102.00 117.00 125.00 129.00 Salem Community College 79.50 79.50 82.50 86.50 93.00 98.00 98.00 102.00 102.00 102.00 Sussex County College 73.00 77.00 82.00 89.00 101.00 107.00 120.00 127.00 127.00 127.00 Union County College 78.00 82.00 87.00 90.00 94.00 100.00 109.00 112.00 244.00 165.00 Warren County Community College 75.00 80.00 86.00 91.00 97.25 102.25 106.25 109.25 114.00 122.00
Out Of County Tuition Per Credit:Atlantic Cape Community College 146.30$ 158.00$ 166.00$ 176.80$ 186.00$ 189.60$ 194.40$ 154.00$ 163.00$ 168.00$ Bergen Community College 179.00 193.00 203.00 213.00 234.00 248.00 262.00 270.00 272.00 274.00 Brookdale Community College 183.50 196.00 206.00 220.00 230.00 237.00 237.00 231.00 231.00 237.50 Burlington County College 85.00 88.00 92.00 94.00 102.00 108.00 108.00 108.00 112.00 116.00 Camden County College 77.00 83.00 87.00 92.00 97.00 100.00 105.00 105.00 108.00 111.00 Cumberland County College 154.00 160.00 168.00 178.00 188.00 198.00 115.00 120.00 120.00 123.00 Essex County College 159.00 162.00 175.00 190.00 207.00 217.00 217.00 217.00 217.00 217.00 Gloucester County College 75.00 78.00 80.00 84.00 90.00 95.00 100.00 105.00 110.00 115.00 Hudson County Community College 156.00 164.00 164.00 186.00 186.00 202.50 213.00 220.50 225.00 232.00 Mercer County Community College 107.00 115.00 119.00 129.00 136.50 145.00 150.00 154.00 158.00 162.00 Middlesex County College 158.50 163.10 171.10 182.00 194.00 198.00 202.00 204.00 206.00 208.00 County College of Morris 176.00 182.00 192.00 198.00 210.00 220.00 228.00 232.00 234.00 236.00 Ocean County College 112.00 118.00 121.00 129.00 126.00 126.00 126.00 130.00 133.00 133.00 Passaic County Community College 73.00 78.00 82.50 88.50 93.00 96.75 100.50 102.50 105.50 125.00 Raritan Valley Community College 78.00 84.00 87.00 101.00 106.00 109.00 112.00 127.00 145.00 154.00 Salem Community College 89.50 89.50 92.50 96.50 103.00 115.00 125.00 125.00 125.00 125.00 Sussex County College 146.00 154.00 164.00 178.00 202.00 214.00 240.00 254.00 190.00 190.00 Union County College 164.00 174.00 174.00 180.00 188.00 200.00 218.00 224.00 244.00 330.00 Warren County Community College 85.00 90.00 96.00 101.00 107.25 112.25 112.25 119.25 124.00 132.00
Out Of State Tuition Per Credit:Atlantic Cape Community College 256.00$ 316.00$ 332.00$ 353.60$ 372.00$ 379.20$ 388.80$ 204.00$ 216.00$ 220.00$ Bergen Community College 189.00 203.00 213.00 223.00 245.00 260.00 275.00 283.00 285.00 285.00 Brookdale Community College 225.00 225.00 225.00 245.00 255.00 262.00 262.00 256.00 256.00 262.50 Burlington County College 150.00 153.00 157.00 159.00 167.00 173.00 173.00 173.00 177.00 181.00 Camden County College 77.00 83.00 87.00 92.00 97.00 100.00 105.00 105.00 108.00 111.00 Cumberland County College 308.00 320.00 336.00 356.00 376.00 396.00 420.00 440.00 440.00 452.00 Essex County College 159.00 162.00 175.00 190.00 207.00 217.00 217.00 217.00 217.00 217.00 Gloucester County College 148.00 155.00 160.00 168.00 180.00 190.00 200.00 210.00 220.00 230.00 Hudson County Community College 234.00 246.00 246.00 249.00 279.00 303.75 319.50 330.75 337.50 348.00 Mercer County Community College 174.00 185.00 191.00 205.00 216.50 230.00 236.00 241.00 245.00 249.00 Middlesex County College 158.50 163.10 171.10 182.00 194.00 198.00 202.00 204.00 206.00 208.00 County College of Morris 247.00 255.00 269.00 278.00 296.00 311.00 324.00 330.00 333.00 336.00 Ocean County College 184.00 193.00 198.00 210.00 206.00 206.00 215.00 215.00 215.00 215.00 Passaic County Community College 146.00 156.00 165.00 177.00 186.00 193.50 201.00 205.00 211.00 217.00 Raritan Valley Community College 78.00 84.00 87.00 101.00 106.00 109.00 112.00 127.00 145.00 154.00 Salem Community College 89.50 89.50 92.50 96.50 103.00 115.00 125.00 125.00 125.00 125.00 Sussex County College 146.00 154.00 164.00 178.00 202.00 214.00 240.00 254.00 254.00 254.00 Union County College 164.00 174.00 174.00 180.00 188.00 200.00 218.00 224.00 244.00 330.00 Warren County Community College 105.00 110.00 116.00 121.00 127.25 132.25 132.25 139.25 144.00 152.00
Source: Financial Reports of the County Community Colleges of the State of New Jersey as compiled by the New Jersey Community College Business Officers Association and the NJ Department of Higher Education website for 2015 statistics
AVERAGE ANNUAL FALL TUITION AND FEES ATCOMPARABLE NEW JERSEY COMMUNITY COLLEGES
UNAUDITED
62

2006 2007 2008 2009 2010 2011 2012 2013 2014 2015Capital lease obligation:
Capital lease payable 124,977$ 64,057$ -$ -$ -$ -$ -$ -$ 277,354$ 256,257$ Future interest payments 6,327$ 1,601$ -$ -$ -$ -$ -$ -$ 79,454$ 60,925$
Total students 8,180 8,074 8,330 8,441 8,738 8,705 8,554 8,679 8,447 8,096
Capital lease obligation per student:Capital lease payable 15.28$ 7.93$ -$ -$ -$ -$ -$ -$ 32.83$ 31.65$ Future interest payments 0.77$ 0.20$ -$ -$ -$ -$ -$ -$ 9.41$ 7.53$
DEBT CAPACITY PER STUDENT
UNAUDITEDCOUNTY COLLEGE OF MORRIS
63
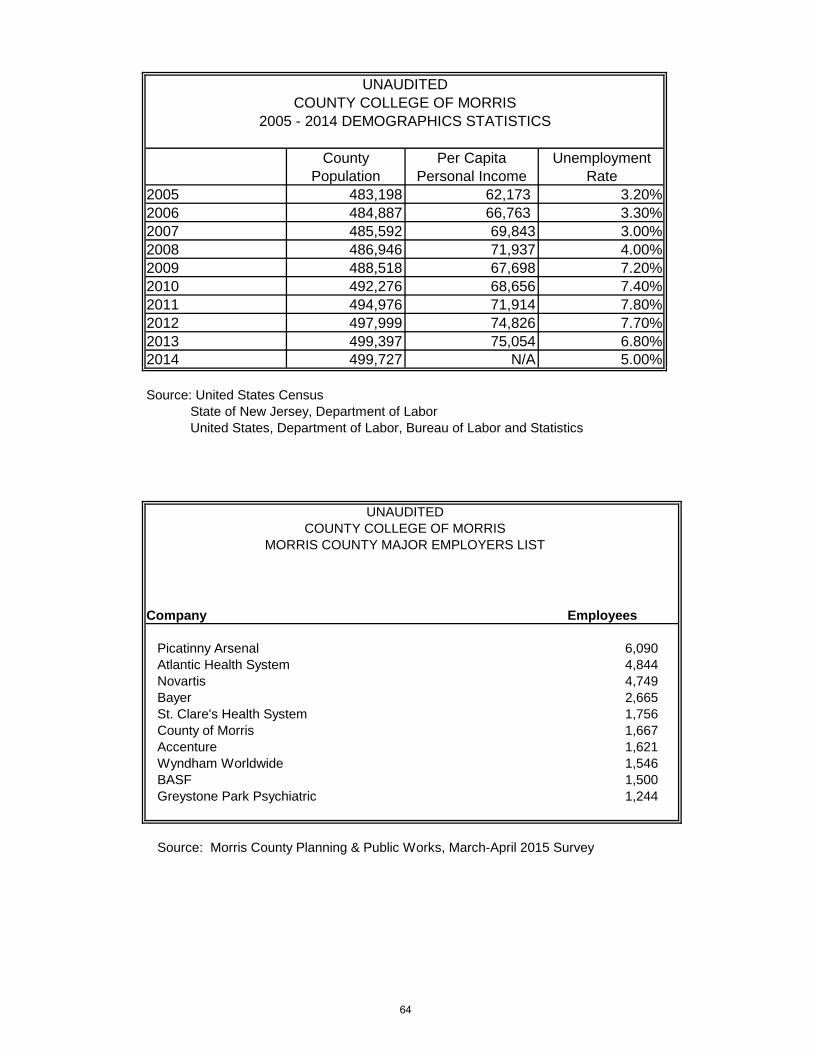
County Population
Per Capita Personal Income
Unemployment Rate
2005 483,198 62,173 3.20%2006 484,887 66,763 3.30%2007 485,592 69,843 3.00%2008 486,946 71,937 4.00%2009 488,518 67,698 7.20%2010 492,276 68,656 7.40%2011 494,976 71,914 7.80%2012 497,999 74,826 7.70%2013 499,397 75,054 6.80%2014 499,727 N/A 5.00%
Source: United States Census State of New Jersey, Department of Labor United States, Department of Labor, Bureau of Labor and Statistics
Company Employees
Picatinny Arsenal 6,090 Atlantic Health System 4,844 Novartis 4,749 Bayer 2,665 St. Clare's Health System 1,756 County of Morris 1,667 Accenture 1,621 Wyndham Worldwide 1,546 BASF 1,500 Greystone Park Psychiatric 1,244
Source: Morris County Planning & Public Works, March-April 2015 Survey
COUNTY COLLEGE OF MORRISMORRIS COUNTY MAJOR EMPLOYERS LIST
UNAUDITED
UNAUDITEDCOUNTY COLLEGE OF MORRIS
2005 - 2014 DEMOGRAPHICS STATISTICS
64
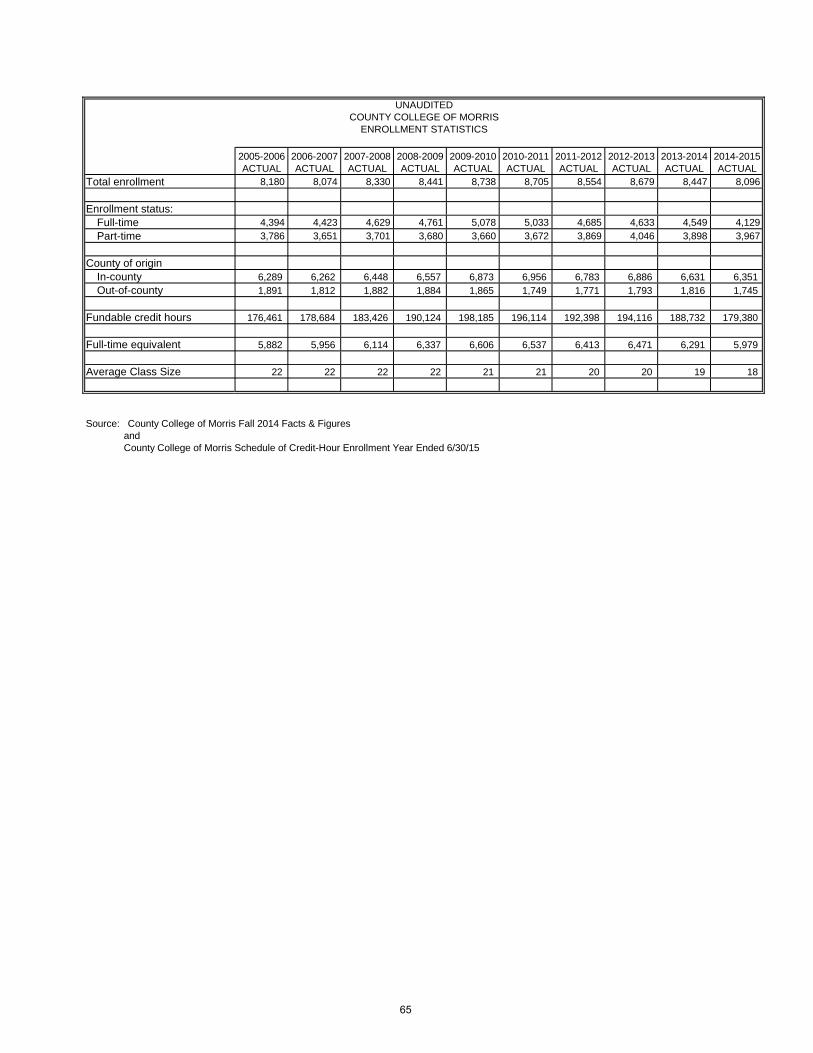
Total enrollment 8,180 8,074 8,330 8,441 8,738 8,705 8,554 8,679 8,447 8,096
Enrollment status:Full-time 4,394 4,423 4,629 4,761 5,078 5,033 4,685 4,633 4,549 4,129 Part-time 3,786 3,651 3,701 3,680 3,660 3,672 3,869 4,046 3,898 3,967
County of originIn-county 6,289 6,262 6,448 6,557 6,873 6,956 6,783 6,886 6,631 6,351 Out-of-county 1,891 1,812 1,882 1,884 1,865 1,749 1,771 1,793 1,816 1,745
Fundable credit hours 176,461 178,684 183,426 190,124 198,185 196,114 192,398 194,116 188,732 179,380
Full-time equivalent 5,882 5,956 6,114 6,337 6,606 6,537 6,413 6,471 6,291 5,979
Average Class Size 22 22 22 22 21 21 20 20 19 18
Source: County College of Morris Fall 2014 Facts & Figures and County College of Morris Schedule of Credit-Hour Enrollment Year Ended 6/30/15
2005-2006 ACTUAL
2009-2010 ACTUAL
2011-2012 ACTUAL
2013-2014 ACTUAL
2007-2008 ACTUAL
2014-2015 ACTUAL
UNAUDITEDCOUNTY COLLEGE OF MORRIS
ENROLLMENT STATISTICS
2006-2007 ACTUAL
2008-2009 ACTUAL
2012-2013 ACTUAL
2010-2011 ACTUAL
65

Faculty:Full-time 164 170 167 163 163 149 155 158 154 151Part-time 342 347 309 375 365 354 341 432 355 363
Professional and Staff:Full-time 290 285 279 284 274 285 283 281 280 267 Part-time 62 63 62 64 58 58 57 55 64 54
Total employeesFull-time 454 455 446 447 437 434 438 439 434 418 Part-time 404 410 371 439 423 412 398 487 419 417
Total Students 8,180 8,074 8,330 8,441 8,738 8,705 8,554 8,679 8,447 8,096
Students per full-time faculty 50 47 50 52 54 58 55 55 55 54 Students per part-time faculty 24 23 27 23 24 25 25 20 24 22
Source: County College of Morris' Department of Human Resources. and County College of Morris Fall 2014 Facts & Figures
COUNTY COLLEGE OF MORRISUNAUDITED
FACULTY, STAFF AND ADMINISTRATOR STATISTICS
2006 ACTUAL
2007 ACTUAL
2012 ACTUAL
2010 ACTUAL
2013 ACTUAL
2008 ACTUAL
2009 ACTUAL
2015 ACTUAL
2014 ACTUAL
2011 ACTUAL
0
100
200
300
400
500
600
700
2006 2007 2008 2009 2010 2011 2012 2013 2014 2015
FACULTY ALLOCATION
Full-time Part-time
66
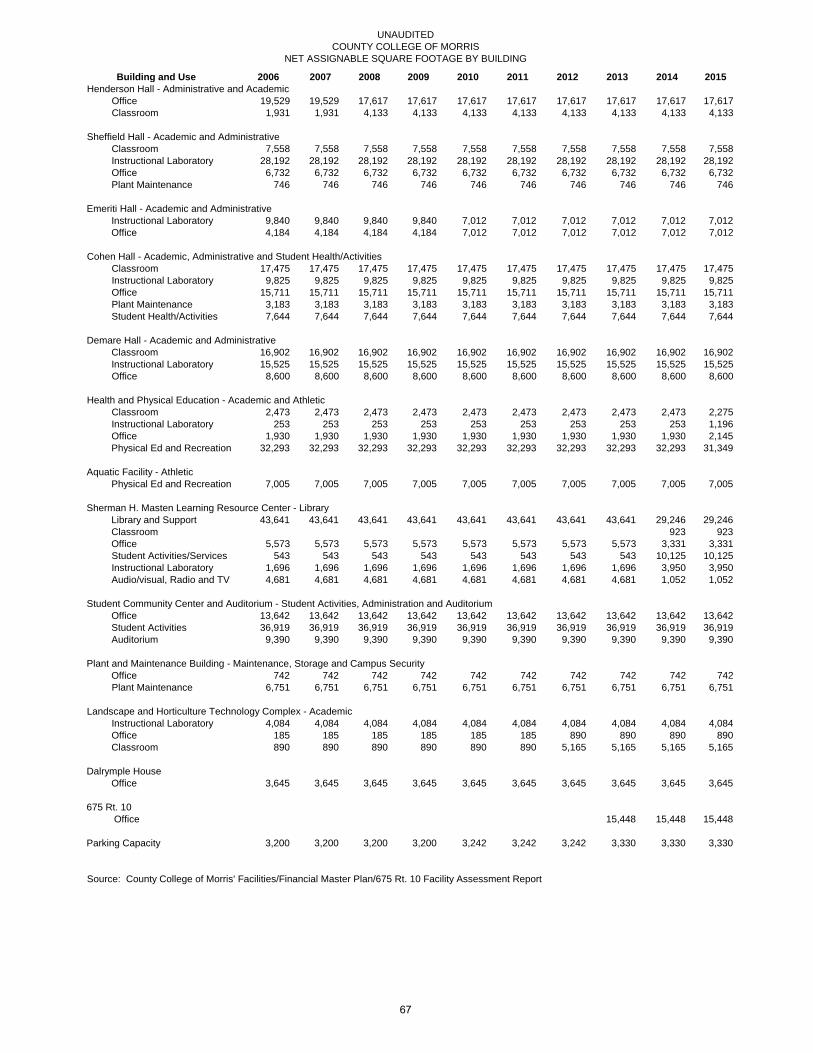
UNAUDITEDCOUNTY COLLEGE OF MORRIS
NET ASSIGNABLE SQUARE FOOTAGE BY BUILDING
2006 2007 2008 2009 2010 2011 2012 2013 2014 2015Henderson Hall - Administrative and Academic
Office 19,529 19,529 17,617 17,617 17,617 17,617 17,617 17,617 17,617 17,617 Classroom 1,931 1,931 4,133 4,133 4,133 4,133 4,133 4,133 4,133 4,133
Sheffield Hall - Academic and AdministrativeClassroom 7,558 7,558 7,558 7,558 7,558 7,558 7,558 7,558 7,558 7,558 Instructional Laboratory 28,192 28,192 28,192 28,192 28,192 28,192 28,192 28,192 28,192 28,192 Office 6,732 6,732 6,732 6,732 6,732 6,732 6,732 6,732 6,732 6,732 Plant Maintenance 746 746 746 746 746 746 746 746 746 746
Emeriti Hall - Academic and AdministrativeInstructional Laboratory 9,840 9,840 9,840 9,840 7,012 7,012 7,012 7,012 7,012 7,012 Office 4,184 4,184 4,184 4,184 7,012 7,012 7,012 7,012 7,012 7,012
Cohen Hall - Academic, Administrative and Student Health/ActivitiesClassroom 17,475 17,475 17,475 17,475 17,475 17,475 17,475 17,475 17,475 17,475 Instructional Laboratory 9,825 9,825 9,825 9,825 9,825 9,825 9,825 9,825 9,825 9,825 Office 15,711 15,711 15,711 15,711 15,711 15,711 15,711 15,711 15,711 15,711 Plant Maintenance 3,183 3,183 3,183 3,183 3,183 3,183 3,183 3,183 3,183 3,183 Student Health/Activities 7,644 7,644 7,644 7,644 7,644 7,644 7,644 7,644 7,644 7,644
Demare Hall - Academic and AdministrativeClassroom 16,902 16,902 16,902 16,902 16,902 16,902 16,902 16,902 16,902 16,902 Instructional Laboratory 15,525 15,525 15,525 15,525 15,525 15,525 15,525 15,525 15,525 15,525 Office 8,600 8,600 8,600 8,600 8,600 8,600 8,600 8,600 8,600 8,600
Health and Physical Education - Academic and AthleticClassroom 2,473 2,473 2,473 2,473 2,473 2,473 2,473 2,473 2,473 2,275 Instructional Laboratory 253 253 253 253 253 253 253 253 253 1,196 Office 1,930 1,930 1,930 1,930 1,930 1,930 1,930 1,930 1,930 2,145 Physical Ed and Recreation 32,293 32,293 32,293 32,293 32,293 32,293 32,293 32,293 32,293 31,349
Aquatic Facility - AthleticPhysical Ed and Recreation 7,005 7,005 7,005 7,005 7,005 7,005 7,005 7,005 7,005 7,005
Sherman H. Masten Learning Resource Center - LibraryLibrary and Support 43,641 43,641 43,641 43,641 43,641 43,641 43,641 43,641 29,246 29,246 Classroom 923 923 Office 5,573 5,573 5,573 5,573 5,573 5,573 5,573 5,573 3,331 3,331 Student Activities/Services 543 543 543 543 543 543 543 543 10,125 10,125 Instructional Laboratory 1,696 1,696 1,696 1,696 1,696 1,696 1,696 1,696 3,950 3,950 Audio/visual, Radio and TV 4,681 4,681 4,681 4,681 4,681 4,681 4,681 4,681 1,052 1,052
Student Community Center and Auditorium - Student Activities, Administration and AuditoriumOffice 13,642 13,642 13,642 13,642 13,642 13,642 13,642 13,642 13,642 13,642 Student Activities 36,919 36,919 36,919 36,919 36,919 36,919 36,919 36,919 36,919 36,919 Auditorium 9,390 9,390 9,390 9,390 9,390 9,390 9,390 9,390 9,390 9,390
Plant and Maintenance Building - Maintenance, Storage and Campus SecurityOffice 742 742 742 742 742 742 742 742 742 742 Plant Maintenance 6,751 6,751 6,751 6,751 6,751 6,751 6,751 6,751 6,751 6,751
Landscape and Horticulture Technology Complex - AcademicInstructional Laboratory 4,084 4,084 4,084 4,084 4,084 4,084 4,084 4,084 4,084 4,084 Office 185 185 185 185 185 185 890 890 890 890 Classroom 890 890 890 890 890 890 5,165 5,165 5,165 5,165
Dalrymple HouseOffice 3,645 3,645 3,645 3,645 3,645 3,645 3,645 3,645 3,645 3,645
675 Rt. 10 Office 15,448 15,448 15,448
Parking Capacity 3,200 3,200 3,200 3,200 3,242 3,242 3,242 3,330 3,330 3,330
Source: County College of Morris' Facilities/Financial Master Plan/675 Rt. 10 Facility Assessment Report
Building and Use
67

Unaudited - Ratio Analysis Ratio analysis can communicate the financial strengths and weaknesses of a college. An article published in the April 2003 NACUBO’s Business Officer, “How to Assess and Enhance Financial Health,” by Lawrence R. Hudack, Larry L. Orsini, and Brenda M. Snow, identifies the Primary Reserve Ratio, the Net Income Ratio, the Return on Net Positon Ratio and the Viability Ratio as four core ratios. These four core ratios are combined and weighted to develop a composite financial index for a given year. Because the College has minimal long term debt, the viability ratio is excluded from the composite financial index. The composite financial index is a tool to help readers determine the overall financial health of an institution as compared to other institutions. The following ratio analysis excludes the pension liability impact of GASB 68. Below is a chart representing the County College of Morris’ Financial Health as of 2015.
Fiscal Year 2015 Industry Standard
Core Ratio
Relevant Value
Strength Factor *
Weight Factor Score
Primary Reserve Ratio 40.00% 34.89% 13.30% 2.62 54% 1.41Net Income Ratio 4.00% -1.02% 0.70% -1.46 15% -0.22Return on Net Position 7.00% 11.04% 2.00% 5.52 31% 1.71
2.9
* Strength Factor = Core RatioRelevant Value
Composite Financial Index
Ratios are averaged over a period of five years in order to evaluate the ongoing stability of an institution. Below is a chart representing the County College of Morris’ Financial Health as a five year average.
`Five Year Average as of 2015
Industry Standard
Core Ratio
Relevant Value
Strength Factor *
Weight Factor Score
Primary Reserve Ratio 40.00% 37.38% 13.30% 2.81 54% 1.52 Net Income Ratio 4.00% 0.63% 0.70% 0.90 15% 0.14 Return on Net Position 7.00% 8.32% 2.00% 4.16 31% 1.29
2.95
* Strength Factor = Core RatioRelevant Value
Composite Financial Index
The Primary Reserve Ratio focuses on expendable net position, which is quickly available to an institution, as compared to total expenses. It is recommended that an institution maintain a ratio greater than 40% to ensure financial stability. As of June 30, 2015 the County College of Morris was under the recommendation with a ratio of 34.89%. This means the College can cover 4.2 of the recommended 5 months of expenses that a 40% ratio would ensure. The five year average Primary Reserve Ratio is 37.38%. The Net Income Ratio indicates the degree of surplus or deficit that a college generates as compared to total unrestricted operating income. Industry standard recommends this ratio be maintained between 2% and 4% to ensure adequate growth in reserves. However, as stated in the article, “it is important that surpluses are not obtained at the cost of mission-critical spending”. County College of Morris had a net loss of $686,125 before capital contributions and additions to endowments. As a result, the College had a negative net income ratio of -1.02% for fiscal year 2015. This is a decrease from fiscal year 2014, which was .05% and below the five year average of .63%. The average of .63% indicates that overall the College has not utilized reserves to operate. However, as the College’s facilities expand and county and state funding remains flat reserves may need to be utilized to offset operational expenses.
68

The Return on Net Position Ratio measures the total economic return, or real rate of return, on net position. Once this return is calculated, it is compared to the current rate of inflation to obtain a true rate of return. An institution should maintain a return on net position ratio of 4% to 5% during a time of 2% inflation to ensure the assets. The current rate of inflation is .1%. The five year average return on net position ratio is 8.32% compared to the average rate of inflation which is 1.86%. The College had an overall increase in net position due to capital contributions and additions to permanent endowments; therefore the return on net position is that of a financially strong institution. The Viability Ratio measures the availability of expendable net position to cover long-term debt at the time of the balance sheet. Industry standard recommends a 100% viability ratio. Historically, the County College of Morris has minimal long-term debt and in 2015 long- term debt of only $229,415. Since the College has minimal long-term debt the viability ratio indicates a strong future. To allow for vital comparisons with other institutions, it is recommended that this ratio not be utilized in calculating the composite financial index for an institution that has little or no long-term debt. Once the ratios are calculated, they are converted to strength factors ranging from 1 to 10. Within this scale, a strength factor of 3 would represent an institution with moderate financial strength, 1 would indicate financial weakness and 10 would point out financial superiority. The strength factors are then weighed based upon importance to determine the overall composite financial index for an institution. To calculate the strength factor, the College’s core ratios are divided by the industry’s relevant value, which is based upon industry standards. County College of Morris’ composite financial index for 2015 of 2.9, a decrease of .44 from 2014, is the result of a decrease in net income. The five year average of 2.95 indicates an institution with moderate financial health, but stresses our reliance on state and county support. Further analyses of the strength factors related to the four ratios indicate the attributes in which the College is below the expected norm. The failure to completely cover the internal diamond with its four coordinates indicates areas for improvement.
0
3
6
9
12
Primary Reserve Ratio
Net Income Ratio
Viab ility Ratio
Return on Net Position
GRAPHIC FINANCIAL PROFILEStrength Factors for Fiscal Year 2015
0
3
6
9
12
Primary Reserve Ratio
Net Income Ratio
Viability Ratio
Return on Net Position
GRAPHIC FINANCIAL PROFILEFive-Year Average Strength Factors
For Fiscal Years 2011 to 2015
In summary, the charts indicate overall improvement of the financial strength of the institution due to the increase in reserves and the minimal amount of debt. The decrease in Net Income Ratio is a direct result of decreases in county and state operating aid and investment income. Continued improvement may be obtained from increased revenue streams as well as savings recognized by operating efficiencies in order for the College to refrain from utilizing reserves.
69

SOURCEFederal Support 413,418$ State Support 9,313,319$ 8,458,882$ 8,988,553$ 8,035,807$ 7,028,771 7,169,137 6,844,765$ 6,899,143$ 6,988,477$ 7,000,440$ County Support 12,414,295 12,816,518 13,018,055 12,757,356 12,175,898 11,600,000 11,600,000 11,600,000 11,600,000 11,600,000 Tuition & Fees 20,203,663 21,039,472 23,115,529 24,569,453 27,132,148 29,156,809 28,825,751 28,747,647 28,966,245 29,506,917 Chargeback/Self-Paid 4,590,769 4,711,365 5,070,834 5,121,222 5,142,148 5,149,561 5,041,015 5,131,547 5,319,328 5,049,247 Investment Income 1,031,201 1,331,178 1,173,255 757,439 348,660 181,737 172,894 157,332 155,848 169,391 Other Income 524,750 659,062 484,271 509,627 716,391 530,701 1,059,047 980,195 976,186 928,125 TOTAL 48,077,997$ 49,016,477$ 51,850,497$ 51,750,904$ 52,957,434$ 53,787,945$ 53,543,472$ 53,515,864$ 54,006,084$ 54,254,120$
ITEMFederal Support 0.78%State Support 19.38% 17.25% 17.34% 15.52% 13.27% 13.32% 12.79% 12.89% 12.93% 12.90%County Support 25.82% 26.15% 25.11% 24.65% 22.99% 21.57% 21.66% 21.68% 21.48% 21.38%Tuition & Fees 42.02% 42.93% 44.58% 47.49% 51.24% 54.21% 53.84% 53.72% 53.64% 54.39%Chargeback/Self-Paid 9.55% 9.61% 9.78% 9.90% 9.71% 9.57% 9.41% 9.59% 9.85% 9.31%Investment Income 2.14% 2.72% 2.26% 1.46% 0.66% 0.34% 0.32% 0.29% 0.29% 0.31%Other Income 1.09% 1.34% 0.93% 0.98% 1.35% 0.99% 1.98% 1.83% 1.81% 1.71%TOTAL 100.00% 100.00% 100.00% 100.00% 100.00% 100.00% 100.00% 100.00% 100.00% 100.00%
COUNTY COLLEGE OF MORRISUNAUDITED
REVENUES BY SOURCE
2009-2010 ACTUAL
REVENUES BY SOURCE AS A PERCENTAGE OF TOTALOPERATING FUND
2007-2008 ACTUAL
2008-2009 ACTUAL
2005-2006 ACTUAL
OPERATING FUND
2012-2013 ACTUAL
2005-2006 ACTUAL
2009-2010 ACTUAL
COUNTY COLLEGE OF MORRIS
2011-2012 ACTUAL
2014-2015 ACTUAL
2014-2015 ACTUAL
2010-2011 ACTUAL
2013-2014 ACTUAL
2006-2007 ACTUAL
2008-2009 ACTUAL
2010-2011 ACTUAL
2013-2014 ACTUAL
2011-2012 ACTUAL
UNAUDITED
2006-2007 ACTUAL
2007-2008 ACTUAL
2012-2013 ACTUAL
70

UNAUDITEDCOUNTY COLLEGE OF MORRIS
-
5,000,000
10,000,000
15,000,000
20,000,000
25,000,000
30,000,000
35,000,000
2006 2007 2008 2009 2010 2011 2012 2013 2014 2015
COMPARATIVE OPERATING REVENUES BY SOURCE
County Support Tuition & Fees Chargeback/Self-Paid Investment Income Other Income
71
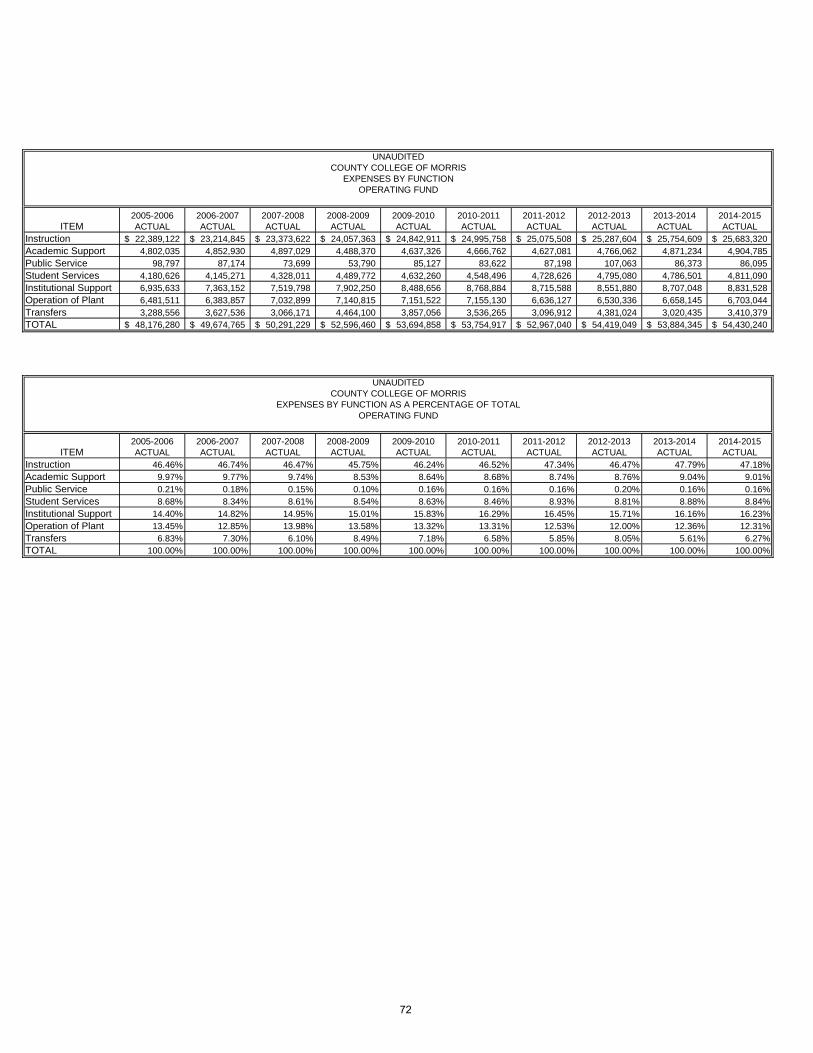
ITEMInstruction 22,389,122$ 23,214,845$ 23,373,622$ 24,057,363$ 24,842,911$ 24,995,758$ 25,075,508$ 25,287,604$ 25,754,609$ 25,683,320$ Academic Support 4,802,035 4,852,930 4,897,029 4,488,370 4,637,326 4,666,762 4,627,081 4,766,062 4,871,234 4,904,785 Public Service 98,797 87,174 73,699 53,790 85,127 83,622 87,198 107,063 86,373 86,095 Student Services 4,180,626 4,145,271 4,328,011 4,489,772 4,632,260 4,548,496 4,728,626 4,795,080 4,786,501 4,811,090 Institutional Support 6,935,633 7,363,152 7,519,798 7,902,250 8,488,656 8,768,884 8,715,588 8,551,880 8,707,048 8,831,528 Operation of Plant 6,481,511 6,383,857 7,032,899 7,140,815 7,151,522 7,155,130 6,636,127 6,530,336 6,658,145 6,703,044 Transfers 3,288,556 3,627,536 3,066,171 4,464,100 3,857,056 3,536,265 3,096,912 4,381,024 3,020,435 3,410,379 TOTAL 48,176,280$ 49,674,765$ 50,291,229$ 52,596,460$ 53,694,858$ 53,754,917$ 52,967,040$ 54,419,049$ 53,884,345$ 54,430,240$
ITEMInstruction 46.46% 46.74% 46.47% 45.75% 46.24% 46.52% 47.34% 46.47% 47.79% 47.18%Academic Support 9.97% 9.77% 9.74% 8.53% 8.64% 8.68% 8.74% 8.76% 9.04% 9.01%Public Service 0.21% 0.18% 0.15% 0.10% 0.16% 0.16% 0.16% 0.20% 0.16% 0.16%Student Services 8.68% 8.34% 8.61% 8.54% 8.63% 8.46% 8.93% 8.81% 8.88% 8.84%Institutional Support 14.40% 14.82% 14.95% 15.01% 15.83% 16.29% 16.45% 15.71% 16.16% 16.23%Operation of Plant 13.45% 12.85% 13.98% 13.58% 13.32% 13.31% 12.53% 12.00% 12.36% 12.31%Transfers 6.83% 7.30% 6.10% 8.49% 7.18% 6.58% 5.85% 8.05% 5.61% 6.27%TOTAL 100.00% 100.00% 100.00% 100.00% 100.00% 100.00% 100.00% 100.00% 100.00% 100.00%
2010-2011 ACTUAL
2006-2007 ACTUAL
2005-2006 ACTUAL
2008-2009 ACTUAL
2006-2007 ACTUAL
2005-2006 ACTUAL
2009-2010 ACTUAL
2007-2008 ACTUAL
UNAUDITED
2013-2014 ACTUAL
2013-2014 ACTUAL
EXPENSES BY FUNCTION AS A PERCENTAGE OF TOTAL
2011-2012 ACTUAL
2010-2011 ACTUAL
2014-2015 ACTUAL
UNAUDITED
2012-2013 ACTUAL
2014-2015 ACTUAL
EXPENSES BY FUNCTION
OPERATING FUND
2009-2010 ACTUAL
COUNTY COLLEGE OF MORRIS
COUNTY COLLEGE OF MORRIS
2011-2012 ACTUAL
OPERATING FUND
2012-2013 ACTUAL
2007-2008 ACTUAL
2008-2009 ACTUAL
72

UNAUDITEDCOUNTY COLLEGE OF MORRIS
$-
$5,000,000
$10,000,000
$15,000,000
$20,000,000
$25,000,000
$30,000,000
Instruction AcademicSupport
Public Service Student Services InstitutionalSupport
Operation ofPlant
Transfers
COMPARATIVE EXPENSES BY FUNCTION
2005-2006 2006-2007 2007-2008 2008-2009 2009-2010 2010-2011 2011-2012 2012-2013 2013-2014 2014-2015
73

Salaries and Wages 29,687,099$ 30,448,863$ 30,918,033$ 32,085,657$ 33,131,756$ 32,919,610$ 33,161,279$ 34,168,821$ 33,812,114$ 33,952,023$ Transfers 3,288,556 3,596,300 3,066,171 4,464,100 3,857,056 3,536,265 3,096,913 4,381,024 2,720,435 3,007,054 Fringe Benefits 7,372,390 8,062,228 8,164,824 7,848,541 8,781,560 9,185,415 9,225,848 9,781,874 10,173,497 10,163,002 Contractual Services 6,575,218 6,510,687 6,989,317 7,031,773 6,781,683 6,988,127 6,252,057 5,991,535 5,722,441 5,805,736 Minor Capital 88,451 23,763 37,345 41,351 38,937 31,665 43,594 40,523 33,938 27,985 Materials and Supplies 1,165,166 1,032,924 1,115,539 1,125,038 1,103,866 1,093,834 1,187,384 1,167,174 1,121,923 1,030,048 TOTAL 48,176,880$ 49,674,765$ 50,291,229$ 52,596,460$ 53,694,858$ 53,754,916$ 52,967,076$ 55,530,950$ 53,584,348$ 53,985,848$
ITEMSalaries and Wages 61.62% 61.30% 61.48% 61.00% 61.71% 61.24% 62.61% 61.53% 63.10% 62.89%Transfers 6.83% 7.24% 6.10% 8.49% 7.18% 6.58% 5.85% 7.89% 5.08% 5.57%Fringe Benefits 15.30% 16.23% 16.24% 14.92% 16.35% 17.09% 17.42% 17.62% 18.99% 18.83%Contractual Services 13.65% 13.11% 13.90% 13.37% 12.63% 13.00% 11.80% 10.79% 10.68% 10.75%Minor Capital 0.18% 0.05% 0.07% 0.08% 0.07% 0.06% 0.08% 0.07% 0.06% 0.05%Materials and Supplies 2.42% 2.08% 2.22% 2.14% 2.06% 2.03% 2.24% 2.10% 2.09% 1.91%TOTAL 100.00% 100.00% 100.00% 100.00% 100.00% 100.00% 100.00% 100.00% 100.00% 100.00%
2005-2006 ACTUAL
2011-2012 ACTUAL
2010-2011 ACTUAL
2009-2010 ACTUAL
2014-2015 ACTUAL
2012-2013 ACTUAL
2012-2013 ACTUAL
2009-2010 ACTUAL
2007-2008 ACTUAL
COUNTY COLLEGE OF MORRIS
2013-2014 ACTUAL
OPERATING FUND
2008-2009 ACTUAL
2010-2011 ACTUAL
2014-2015 ACTUAL
2011-2012 ACTUAL
EXPENSES BY OBJECT CODE AS A PERCENTAGE OF TOTAL
2013-2014 ACTUAL
2008-2009 ACTUAL
2005-2006 ACTUAL
UNAUDITED
EXPENSES BY OBJECT CODEOPERATING FUND
UNAUDITED
2007-2008 ACTUAL
2006-2007 ACTUAL
COUNTY COLLEGE OF MORRIS
2006-2007 ACTUAL
74

UNAUDITEDCOUNTY COLLEGE OF MORRIS
$-
$5,000,000
$10,000,000
$15,000,000
$20,000,000
$25,000,000
$30,000,000
$35,000,000
$40,000,000
Salaries andWages
Transfers Fringe Benefits ContractualServices
Minor Capital Materials andSupplies
COMPARATIVE EXPENSES BY OBJECT CODE
2005-2006 2006-2007 2007-2008 2008-2009 2009-2010 2010-2011 2011-2012 2012-2013 2013-2014 2014-2015
75

This Page is intentionally left blank.
76
Compliance Section


The following supplemental information is provided for management information purposes:
COUNTY COLLEGE OF MORRISIOLTA GRANT
(CALENDAR YEAR GRANT ENDING DECEMBER 31, 2015)
BALANCE SHEETJUNE 30, 2015
Assets:Cash 1,650$
Liabilities and Fund Balance:Accounts Payable -
Total Liabilities -
Fund Balance 1,650
Total Liabilities and Fund Balance 1,650$
SCHEDULE OF REVENUES, EXPENDITURES AND CHANGES IN FUND BALANCE
BUDGET AND ACTUALFISCAL YEAR ENDED JUNE 30, 2015
Variance(Unaudited) Favorable
Budget Actual (Unfavorable)
Revenues:County College of Morris Grant 3,300$ 3,300$ -$
Expenditures:Other Staff 3,300 1,650 1,650 FICA - - - Postage - - - Printing/Reproduction - - -
Total expenditures 3,300 1,650 1,650
Excess (deficiency) ofrevenues over expenditures -$ 1,650 1,650$
Fund Balance June 30, 2014 -
Fund Balance June 30, 2015 1,650$
77

COUNTY COLLEGE OF MORRISIOLTA GRANT
(CALENDAR YEAR GRANT ENDING DECEMBER 31, 2014)
BALANCE SHEETJUNE 30, 2015
Assets:Cash -$
Liabilities and Fund Balance:Accounts Payable -
Total Liabilities -
Fund Balance -
Total Liabilities and Fund Balance -$
SCHEDULE OF REVENUES, EXPENDITURES AND CHANGES IN FUND BALANCE
BUDGET AND ACTUALFISCAL YEAR ENDED JUNE 30, 2015
Actual Actual(Unaudited) Expended Expended Variance
Original Prior Fiscal Current Fiscal FavorableBudget Year Year Total (Unfavorable)
Revenues:County College of Morris Grant 3,300$ 3,300$ -$ 3,300$ -$
Expenditures:Other Staff 3,300 - 3,300 3,300 - FICA - - - - - Postage - - - - - Printing/Reproduction - - - - -
Total expenditures 3,300 - 3,300 3,300 -
Excess (deficiency) ofrevenues over expenditures 3,300$ (3,300) -$ -$
Fund Balance June 30, 2014 3,300
Fund Balance June 30, 2015 -$
78


CO
UN
TY C
OLL
EG
E O
F M
OR
RIS
SC
HE
DU
LE O
F E
XPE
ND
ITU
RE
S O
F FE
DE
RA
L FI
NA
NC
IAL
AW
AR
DS
YEA
R E
ND
ED
JU
NE
30,
201
5R
ecei
vabl
e/A
war
d A
mou
nt
Am
ount
Gra
ntTo
tal
(Pay
able
)/N
ame
of
Gra
nt ID
G
rant
Aut
hori-
Rec
eive
dR
ec'd
to
Exp
endi
ture
sG
rant
(Fun
d B
alan
ce)
Gra
ntC
FDA
#N
umbe
rP
erio
dza
tions
14-1
5D
ate
14-1
5E
xpen
ditu
res
6/30
/201
5
U.S
. Dep
artm
ent o
f Edu
catio
n:
Stu
dent
Fin
anci
al A
ssis
tanc
e P
rogr
am C
lust
er:
Dire
ct A
id:
PE
LL84
.063
E-P
063P
1429
949/
1/14
-8/3
1/15
7,78
8,36
0$
7,
658,
860
$
7,
658,
860
$
7,
780,
545
$
7,
780,
545
$
12
1,68
5$
PE
LL84
.063
E-P
063P
1329
949/
1/13
-8/3
1/14
7,76
1,81
8
15
2,47
8
7,
761,
818
13
3,96
7
7,
761,
818
-
SE
OG
84.0
07E
-P00
7A14
2547
9/1/
14-8
/31/
1516
4,31
9
164,
319
164,
319
164,
319
164,
319
-
CW
S84
.033
E-P
033A
1425
477/
1/14
-6/3
0/15
166,
920
14
6,39
7
14
6,39
7
15
5,18
3
15
5,18
3
8,
786
CW
S84
.033
E-P
033A
1325
477/
1/13
-6/3
0/14
138,
178
14
,904
138,
178
13,6
93
138,
178
-
DIR
EC
T LO
AN
S
84.2
68P
-268
K15
2994
9/1/
14-8
/31/
156,
978,
219
6,22
5,12
0
6,22
5,12
0
6,27
6,77
3
6,27
6,77
3
51,6
53
DIR
EC
T LO
AN
S
84.2
68P
-268
K14
2994
9/1/
13-8
/31/
145,
893,
689
125,
230
5,89
3,68
9
108,
076
5,89
3,68
9
-
Sub
tota
l Stu
dent
Fin
anci
al A
ssis
tanc
e P
rogr
am C
lust
er28
,891
,503
14
,487
,308
27,9
88,3
81
14
,632
,556
28,1
70,5
05
18
2,12
4
Pas
s Th
roug
h Fu
nds:
NJ
Dep
t. of
Edu
catio
nP
erki
ns V
oc. E
d.84
.048
PS
FS71
5515
7/1/
14-6
/30/
1538
8,84
6
267,
972
267,
972
388,
084
388,
084
120,
112
NJ
Dep
t. of
Edu
catio
nP
erki
ns V
oc. E
d.84
.048
PS
FS71
5514
7/1/
13-6
/30/
1431
9,01
4
27,8
84
31
7,61
1
-
31
7,61
1
-
NJ
Cou
ncil
of C
omm
unity
Col
lege
sC
olle
ge A
cces
s C
halle
nge
Gra
nt C
olle
ge R
eadi
ness
Now
Pro
ject
84.3
78S
ubgr
ant 3
78A
1/1/
14-8
/8/1
430
,114
(20,
187)
3,90
4
(22)
3,
904
-
737,
974
27
5,66
9
58
9,48
7
38
8,06
2
70
9,59
9
12
0,11
2
Tota
l U.S
. Dep
artm
ent o
f Edu
catio
n29
,629
,477
14
,762
,977
28,5
77,8
68
15
,020
,618
28,8
80,1
04
30
2,23
6
Nat
iona
l Sci
ence
Fou
ndat
ion:
Nat
iona
l Sci
ence
Fou
ndat
ion
Noy
ce T
each
er S
chol
arsh
ip P
rogr
am47
.076
DU
E-1
3399
56-C
CM
9/1/
13-8
/31/
1635
,143
-
-
9,52
5
9,66
7
9,66
7
Nat
iona
l Sci
ence
Fou
ndat
ion
Adv
ance
d Te
ch E
duca
tion
Pro
gram
47.0
76D
UE
-140
0494
7/1/
14-6
/30/
1619
9,99
9
43,4
95
43
,495
89,1
65
89,1
65
45,6
70
U.S
. Dep
artm
ent o
f Hea
lth a
nd H
uman
Ser
vice
s:
US
Dep
artm
ent o
f Hea
lth
NN
JHP
C93
.093
90FX
0001
059/
30/1
4-9/
29/1
541
0,61
4
159,
388
159,
388
252,
847
252,
847
93,4
59
an
d H
uman
Ser
vice
s
US
Dep
artm
ent o
f Hea
lth
NN
JHP
C93
.093
90FX
0001
049/
30/1
3-9/
29/1
449
1,05
6
394,
578
447,
284
199,
231
447,
284
-
an
d H
uman
Ser
vice
s
US
Dep
artm
ent o
f Hea
lth
HP
OG
Impa
ct S
tudy
93.0
93H
HS
P23
2009
5624
WC
10/1
/13-
9/29
/15
201,
688
14
4,16
2
14
4,16
2
11
6,03
7
14
6,83
6
2,
674
an
d H
uman
Ser
vice
s
U.S
. Dep
artm
ent o
f Lab
or:
US
Dep
artm
ent o
f Lab
orTA
AC
CC
T G
rant
- Ye
ar 1
17
.282
TC-2
6459
-14-
60-A
-34
10/1
/14-
9/30
/15
224,
836
18
,205
18,2
05
69
,507
69
,507
51
,302
US
Dep
artm
ent o
f Lab
orN
JIT
STE
M G
rant
- Ye
ar 3
17.2
68N
P99
5801
1/1/
15-3
/31/
1655
,122
3,82
4
3,82
4
28,3
64
28,3
64
24,5
40
US
Dep
artm
ent o
f Lab
orN
JIT
STE
M G
rant
- Ye
ar 2
17.2
68N
P99
5801
1/1/
14-1
2/31
/14
55,5
83
11
,511
16,1
98
6,
084
16
,198
-
U.S
. Dep
artm
ent o
f Hom
elan
d S
ecur
ity:
Offi
ce o
f Hom
elan
d S
ecur
ityU
SA
I Gra
nt F
FY14
97.0
67E
MW
-201
4-S
S-
9/1/
14-8
/31/
1615
7,00
0
90,1
14
90
,114
115,
425
115,
425
25,3
11
an
d P
repa
redn
ess
0009
9-S
01
Offi
ce o
f Hom
elan
d S
ecur
ityU
SA
I Gra
nt F
FY13
97.0
08E
MW
-201
3-S
S-
9/1/
13-8
/31/
1515
7,00
0
145,
185
157,
000
-
157,
000
-
an
d P
repa
redn
ess
0003
2-S
01
Nat
iona
l End
owm
ent f
or th
e H
uman
ities
:
Nat
iona
l End
owm
ent f
or
AA
C&
U B
ridgi
ng C
ultu
res
Gra
nt45
.162
NE
H S
ubaw
ard
7/1/
12-1
2/31
/15
7,50
0
-
7,50
0
1,92
6
7,06
4
(436
)
the
Hum
aniti
es
Tota
l Fed
eral
Aw
ards
31,6
25,0
18$
15,7
73,4
39$
29
,665
,038
$
15,9
08,7
29$
30
,219
,461
$
554,
423
$ N
/A -
Not
App
licab
le
TH
E A
CC
OM
PA
NYI
NG
NO
TE IS
AN
INTE
GR
AL
PA
RT
OF
THIS
SC
HE
DU
LE O
F E
XPE
ND
ITU
RE
S O
F FE
DE
RA
L A
ND
STA
TE F
INA
NC
IAL
AW
AR
DS
Nam
e of
Fed
eral
Age
ncy
or
Dep
artm
ent/C
lust
er T
itle
83

THE
AC
CO
MP
AN
YIN
G N
OTE
IS A
N IN
TEG
RA
L P
AR
T O
F TH
IS S
CH
ED
ULE
OF
EXP
EN
DIT
UR
ES
OF
FED
ER
AL
AN
D S
TATE
FIN
AN
CIA
L A
WA
RD
S
CO
UN
TY C
OLL
EG
E O
F M
OR
RIS
SC
HE
DU
LE O
F E
XP
EN
DIT
UR
ES
OF
STA
TE F
INA
NC
IAL
AW
AR
DS
YEA
R E
ND
ED
JU
NE
30,
201
5
Rec
eiva
ble
Aw
ard
Am
ount
A
mou
ntG
rant
Tota
l(P
ayab
le)/
Nam
e of
G
rant
ID
Gra
ntA
utho
ri-R
ecei
ved
Rec
'd to
E
xpen
ditu
res
Gra
nt(F
und
Bal
ance
)
Gra
ntN
umbe
rP
erio
dza
tions
14-1
5D
ate
14-1
5E
xpen
ditu
res
6/30
/201
5
Dep
t. of
Stu
dent
Ass
ista
nce:
Dire
ct A
id:
TAG
2124
7/1/
14-6
/30/
151,
587,
475
$
1,58
6,66
3$
1,
586,
663
$
1,58
6,66
3$
1,
586,
663
$
-$
EO
F A
rticl
e III
21
246/
1/14
-6/3
0/15
61,6
89
61
,689
61
,689
61
,689
61
,689
-
EO
F A
rticl
e IV
21
246/
1/14
-6/3
0/15
114,
305
11
1,29
7
111,
297
11
1,29
7
111,
297
-
EO
F A
rticl
e III
Sum
mer
201
521
246/
1/15
-6/3
0/16
13,5
04
-
-
6,
093
6,09
3
6,
093
EO
F A
rticl
e III
Sum
mer
201
421
246/
1/14
-6/3
0/15
13,2
72
13
,272
13
,272
7,
965
13,2
72
-
NJ
Bes
t21
247/
1/14
-6/3
0/15
17,2
50
17
,250
17
,250
17
,250
17
,250
-
NJ
Sta
rs P
rogr
am 2
015
2124
7/1/
14-6
/30/
1512
5,18
5
125,
185
12
5,18
5
125,
185
12
5,18
5
-
Wor
ld T
rade
Cen
ter S
chol
arsh
ip21
247/
1/14
-6/3
0/15
2,50
0
2,
500
2,50
0
2,
500
2,50
0
NJ
Cla
ss L
oans
N/A
7/1/
14-6
/30/
1543
,402
43,4
02
43,4
02
43,4
02
43,4
02
-
1,97
8,58
2
1,
961,
258
1,96
1,25
8
1,
962,
044
1,96
7,35
1
6,
093
Dep
t. of
Chi
ldre
n an
d Fa
milie
s:
Dire
ct A
id:
Divi
sion
on
Wom
en15
CLP
W7/
1/14
-6/3
0/15
130,
475
12
8,90
6
128,
906
13
0,47
5
130,
475
1,
569
Divi
sion
on
Wom
en14
CLP
W7/
1/13
-6/3
0/14
130,
475
8,
399
128,
001
-
12
8,00
1
-
260,
950
13
7,30
5
256,
907
13
0,47
5
258,
476
1,
569
Dire
ct A
id:
Sta
te S
uppo
rt O
pera
tiona
l Cos
tsN
/A7/
1/14
-6/3
0/15
7,00
0,44
0
7,
000,
440
7,00
0,44
0
7,
000,
440
7,00
0,44
0
-
7,
000,
440
7,00
0,44
0
7,
000,
440
7,00
0,44
0
7,
000,
440
-
Dep
artm
ent o
f the
Tre
asur
y:
Dire
ct A
id:
Alte
rnat
e B
enef
it R
eim
burs
emen
tsN
/A7/
1/14
-6/3
0/15
1,33
8,04
5
95
6,97
5
956,
975
1,
338,
045
1,33
8,04
5
38
1,07
0
Alte
rnat
e B
enef
it R
eim
burs
emen
tsN
/A7/
1/13
-6/3
0/14
1,32
6,74
1
36
6,91
6
1,32
6,74
1
-
1,
326,
741
-
.
2,66
4,78
6
1,
323,
891
2,28
3,71
6
1,
338,
045
2,66
4,78
6
38
1,07
0
Pas
s Th
roug
h Fu
nds:
Arts
Cou
ncil o
f Mor
ris A
rea
Teen
Arts
N/A
1/1/
14-1
2/31
/15
2,20
0
1,
100
1,10
0
2,
200
2,20
0
1,
100
Arts
Cou
ncil o
f Mor
ris A
rea
Teen
Arts
N/A
1/1/
13-1
2/31
/14
1,70
0
85
0
1,70
0
-
1,
700
-
3,90
0
1,
950
2,80
0
2,
200
3,90
0
1,
100
Tota
l Sta
te A
war
ds11
,908
,658
$
10
,424
,844
$
11
,505
,121
$
10
,433
,204
$
11
,894
,953
$
38
9,83
2$
N/A
- N
ot a
pplic
able
Nam
e of
Sta
te
Age
ncy
or
Dep
artm
ent
84
COUNTY COLLEGE OF MORRIS NOTE TO SCHEDULES OF EXPENDITURES OF FEDERAL AND STATE AWARDS
FOR THE FISCAL YEAR ENDING JUNE 30, 2015
NOTE 1 SIGNIFICANT ACCOUNTING POLICIES
Basis of Presentation The accompanying Schedules of expenditures of Federal and state awards includes the federal and state grant activity of the County College of Morris under programs of the federal and state governments for the fiscal year ended June 30, 2015. The information in these schedules are presented in accordance with the Federal Office of Management and Budget (OMB), Audits of State and Local Governments and Non-Profit Organizations and New Jersey’s OMB Circulars 04-04 and 15-08, Single Audit Policy for Recipients of Federal Grants and State Aid. Because the schedules present only a selected portion of the operations of the College, they are not intended to and do not present the financial position, changes in net position or cash flows of the College.
NOTE 2 SUMMARY OF SIGNIFICANT ACCOUNTING POLICIES
Expenditures reported on the accompanying schedules of expenditures of federal and state awards are reported on the accrual basis of accounting.
85