Embed Size (px)
Citation preview

Compound
Inequalities
Section 3-6

Goals
Goal
• To solve and graph
inequalities containing the
word and.
• To solve and graph
inequalities containing the
word or.
Vocabulary
• Compound Inequality
• Interval Notation
Definition
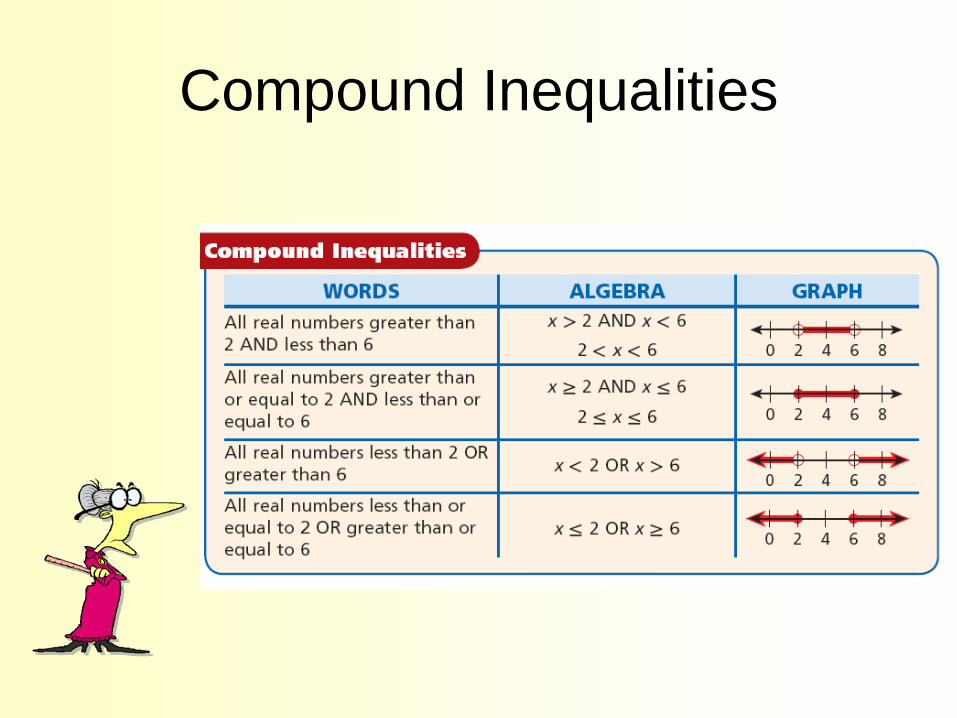
• The inequalities you have seen so far are simple
inequalities. When two simple inequalities are combined
into one statement by the words AND or OR, the result is
called a compound inequality.
• Compound Inequality – the result of combining two
inequalities. The words and and or are used to describe
how the two parts are related.
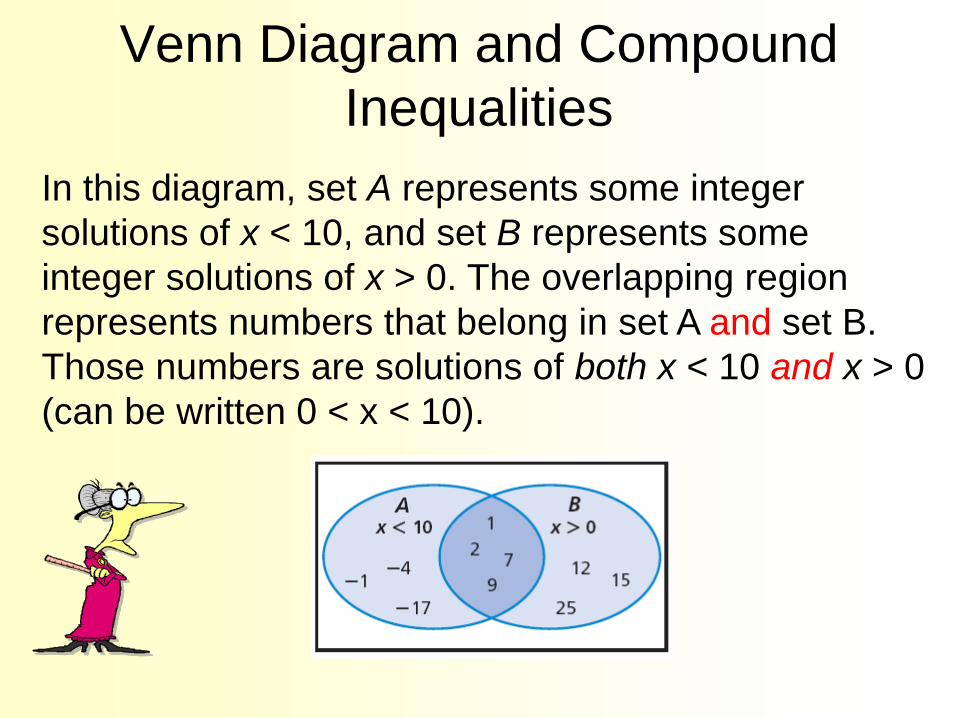
In this diagram, set A represents some integer
solutions of x < 10, and set B represents some
integer solutions of x > 0. The overlapping region
represents numbers that belong in set A and set B.
Those numbers are solutions of both x < 10 and x > 0
(can be written 0 < x < 10).
Venn Diagram and Compound
Inequalities

You can graph the solutions of a compound inequality
involving AND by using the idea of an overlapping
region. The overlapping region is called the intersection
and shows the numbers that are solutions of both
inequalities.
Number Line and Compound
Inequalities
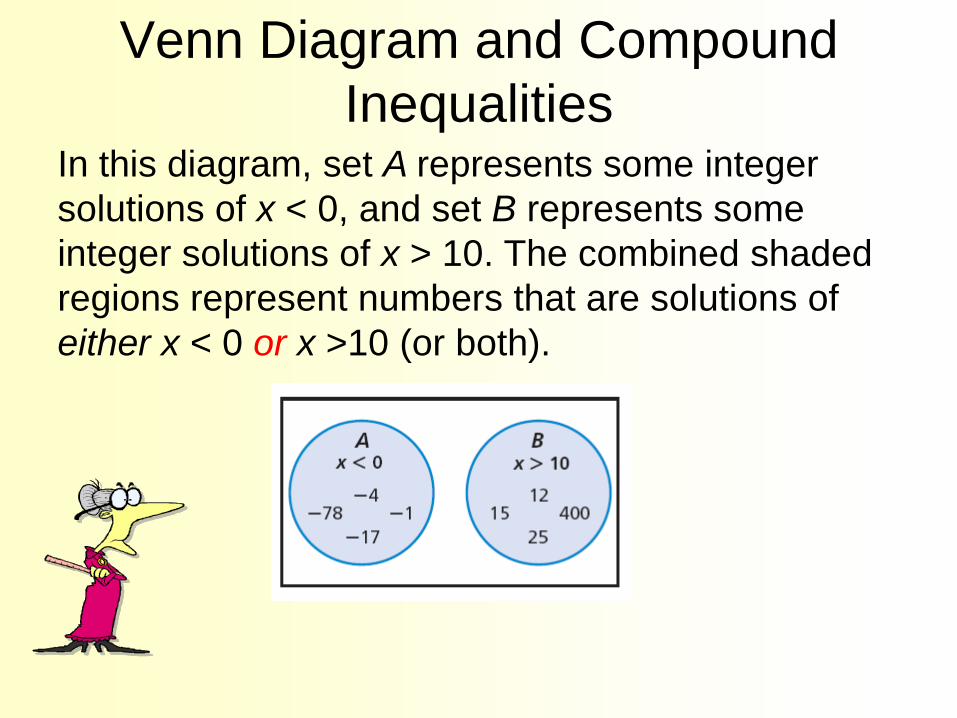
In this diagram, set A represents some integer
solutions of x < 0, and set B represents some
integer solutions of x > 10. The combined shaded
regions represent numbers that are solutions of
either x < 0 or x >10 (or both).
Venn Diagram and Compound
Inequalities

You can graph the solutions of a compound
inequality involving OR by using the idea of
combining regions. The combined regions are
called the union and show the numbers that are
solutions of either inequality.
>
Number Line and Compound
Inequalities
Compound Inequalities
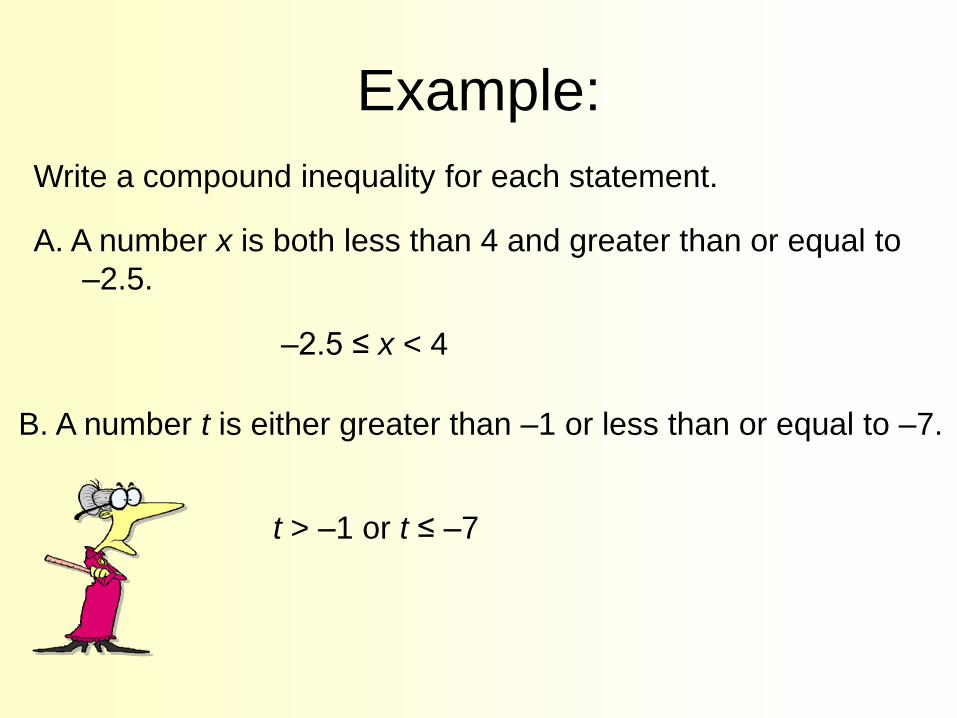
Write a compound inequality for each statement.
A. A number x is both less than 4 and greater than or equal to
–2.5.
–2.5 ≤ x < 4
B. A number t is either greater than –1 or less than or equal to –7.
t > –1 or t ≤ –7
Example:
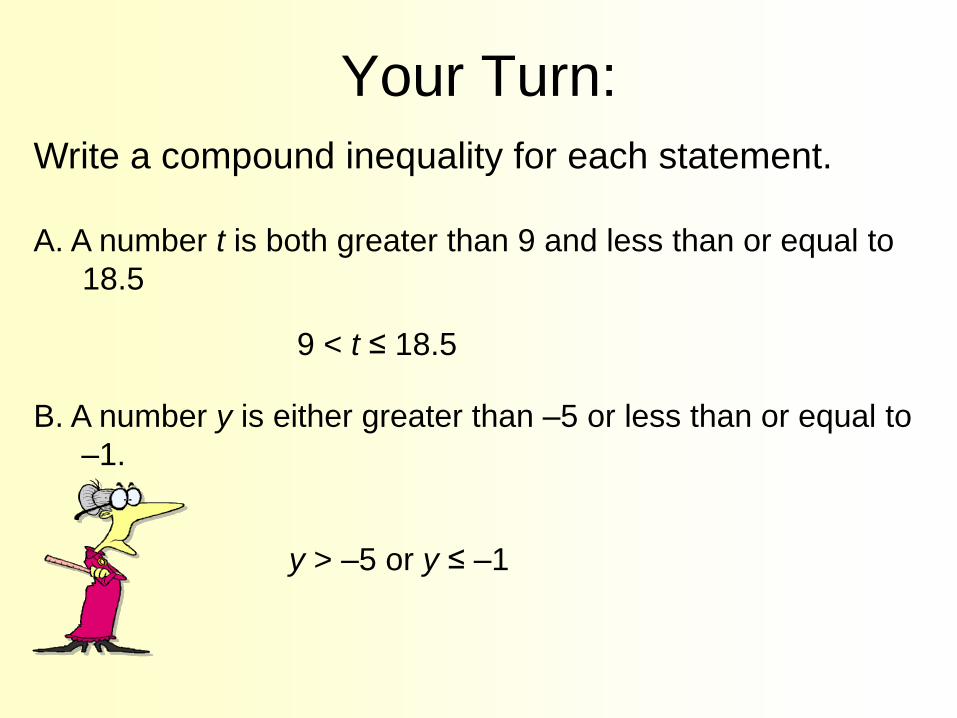
Write a compound inequality for each statement.
A. A number t is both greater than 9 and less than or equal to
18.5
9 < t ≤ 18.5
B. A number y is either greater than –5 or less than or equal to
–1.
y > –5 or y ≤ –1
Your Turn:

The “and” compound inequality y < –2 and
y < 4 can be written as –2 < y < 4.
The “or” compound inequality y < 1 or y > 9
must be written with the word “or.”
Writing Math
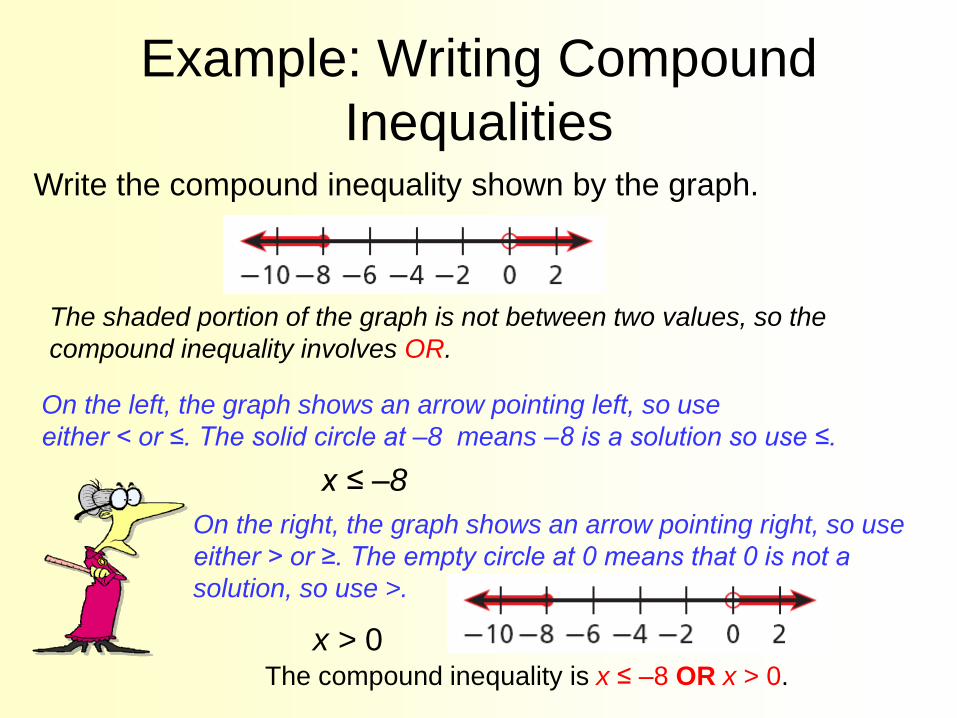
The shaded portion of the graph is not between two values, so the
compound inequality involves OR.
On the left, the graph shows an arrow pointing left, so use
either < or ≤. The solid circle at –8 means –8 is a solution so use ≤.
x ≤ –8
On the right, the graph shows an arrow pointing right, so use
either > or ≥. The empty circle at 0 means that 0 is not a
solution, so use >.
x > 0
Write the compound inequality shown by the graph.
Example: Writing Compound
Inequalities
The compound inequality is x ≤ –8 OR x > 0.

The shaded portion of the graph is between the values –2 and 5, so the
compound inequality involves AND.
The shaded values are on the right of –2, so use > or ≥. The empty circle
at –2 means –2 is not a solution, so use >.
m > –2 The shaded values are to the left of 5, so use < or ≤. The
empty circle at 5 means that 5 is not a solution so use <.
m < 5
Write the compound inequality shown by the graph.
Example: Writing Compound
Inequalities
The compound inequality is m > –2 AND m < 5 (or –2 < m < 5).

The shaded portion of the graph is between the values –9 and –2, so
the compound inequality involves AND.
The shaded values are on the right of –9, so use > or . The empty circle
at –9 means –9 is not a solution, so use >.
x > –9
The shaded values are to the left of –2, so use < or ≤. The
empty circle at –2 means that –2 is not a solution so use <.
x < –2
Write the compound inequality shown by the graph.
Your Turn:
The compound inequality is –9 < x AND x < –2 (or –9 < x < –2).
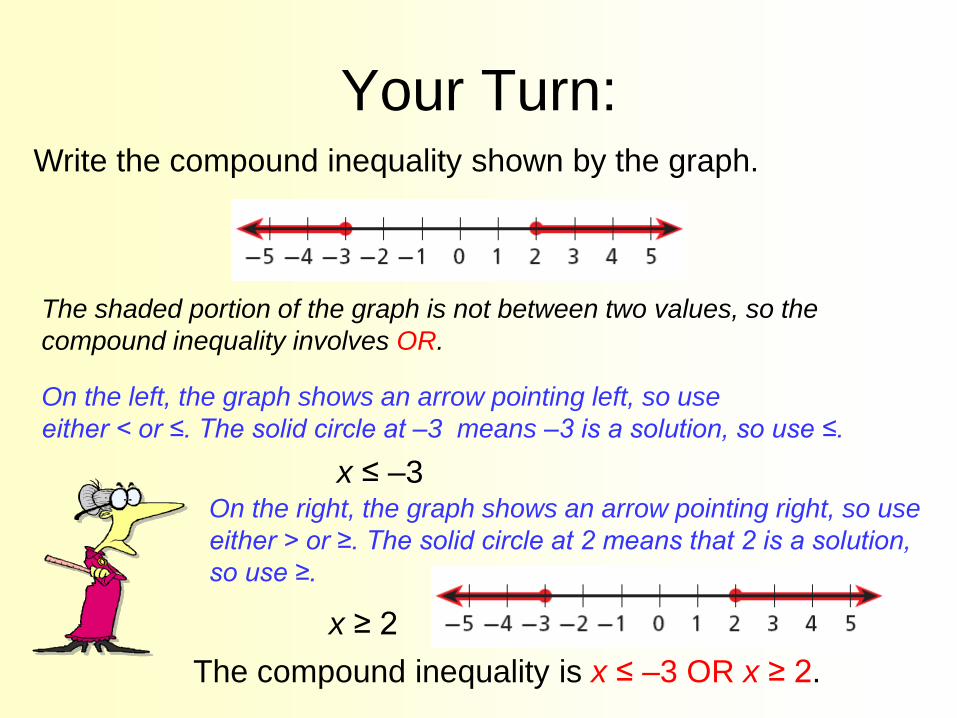
The shaded portion of the graph is not between two values, so the
compound inequality involves OR.
On the left, the graph shows an arrow pointing left, so use
either < or ≤. The solid circle at –3 means –3 is a solution, so use ≤.
x ≤ –3 On the right, the graph shows an arrow pointing right, so use
either > or ≥. The solid circle at 2 means that 2 is a solution,
so use ≥.
x ≥ 2
Write the compound inequality shown by the graph.
Your Turn:
The compound inequality is x ≤ –3 OR x ≥ 2.

The pH level of a popular shampoo is between 6.0 and 6.5
inclusive. Write a compound inequality to show the pH levels
of this shampoo. Graph the solutions.
Let p be the pH level of the shampoo.
6.0 is less than or
equal to
pH level is less than or
equal to
6.5
6.0 ≤ p ≤ 6.5
6.0 ≤ p ≤ 6.5
6.1 6.2 6.3 6.0 6.4 6.5
Example: Application
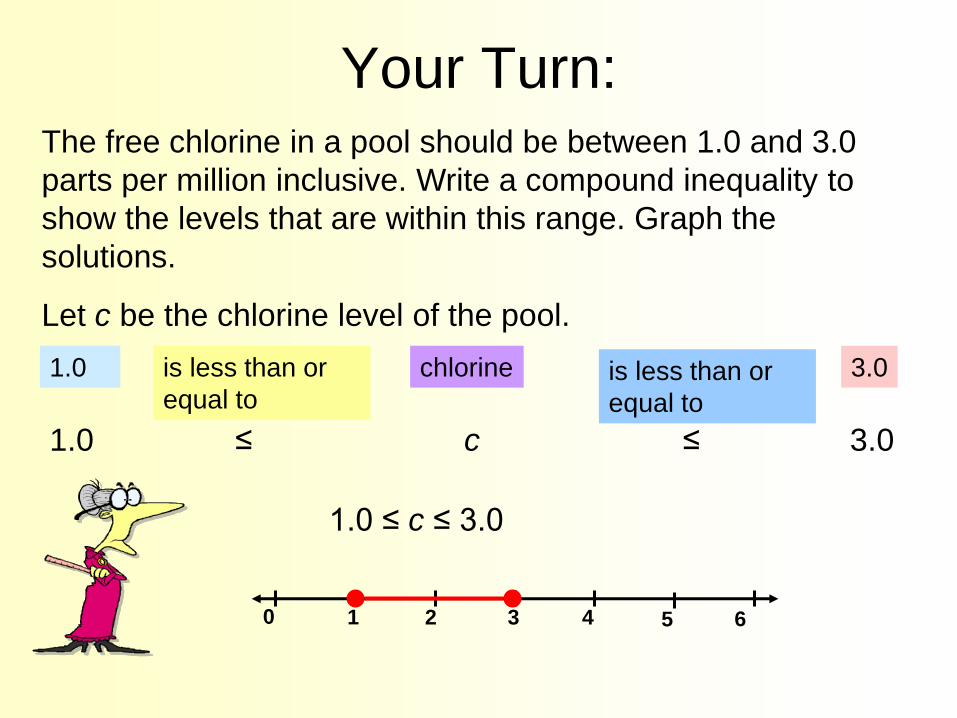
The free chlorine in a pool should be between 1.0 and 3.0
parts per million inclusive. Write a compound inequality to
show the levels that are within this range. Graph the
solutions.
Let c be the chlorine level of the pool.
1.0 is less than or
equal to
chlorine is less than or
equal to
3.0
1.0 ≤ c ≤ 3.0
1.0 ≤ c ≤ 3.0
0 2 3 4 1 5 6
Your Turn:
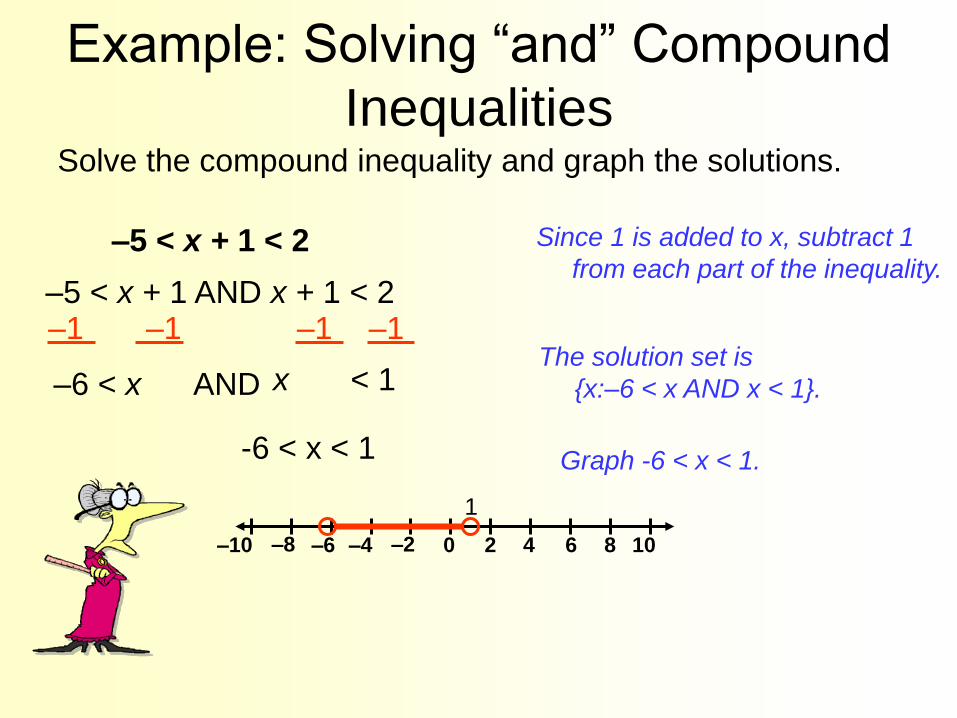
Solve the compound inequality and graph the solutions.
–5 < x + 1 < 2
–10 –8 –6 –4 –2 0 2 4 6 8 10
Since 1 is added to x, subtract 1
from each part of the inequality.
Graph -6 < x < 1.
–5 < x + 1 AND x + 1 < 2 –1 –1 –1 –1
–6 < x x < 1 AND The solution set is
{x:–6 < x AND x < 1}.
Example: Solving “and” Compound
Inequalities
-6 < x < 1
1
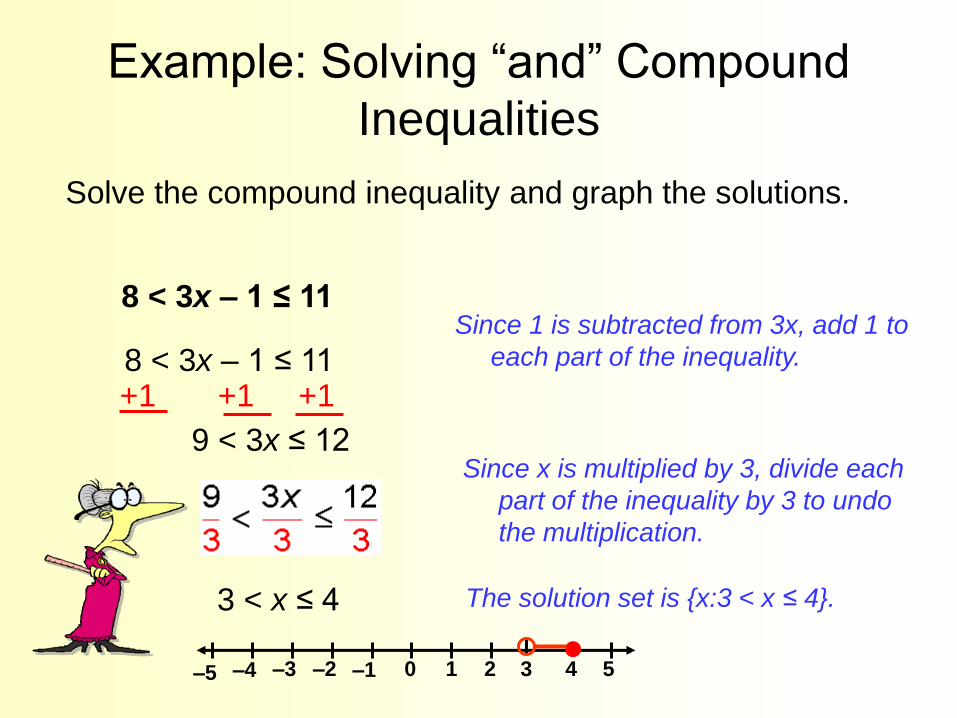
Solve the compound inequality and graph the solutions.
8 < 3x – 1 ≤ 11
8 < 3x – 1 ≤ 11 +1 +1 +1
9 < 3x ≤ 12
3 < x ≤ 4
Since 1 is subtracted from 3x, add 1 to
each part of the inequality.
Since x is multiplied by 3, divide each
part of the inequality by 3 to undo
the multiplication.
The solution set is {x:3 < x ≤ 4}.
Example: Solving “and” Compound
Inequalities
–5 –4 –3 –2 –1 0 1 2 3 4 5
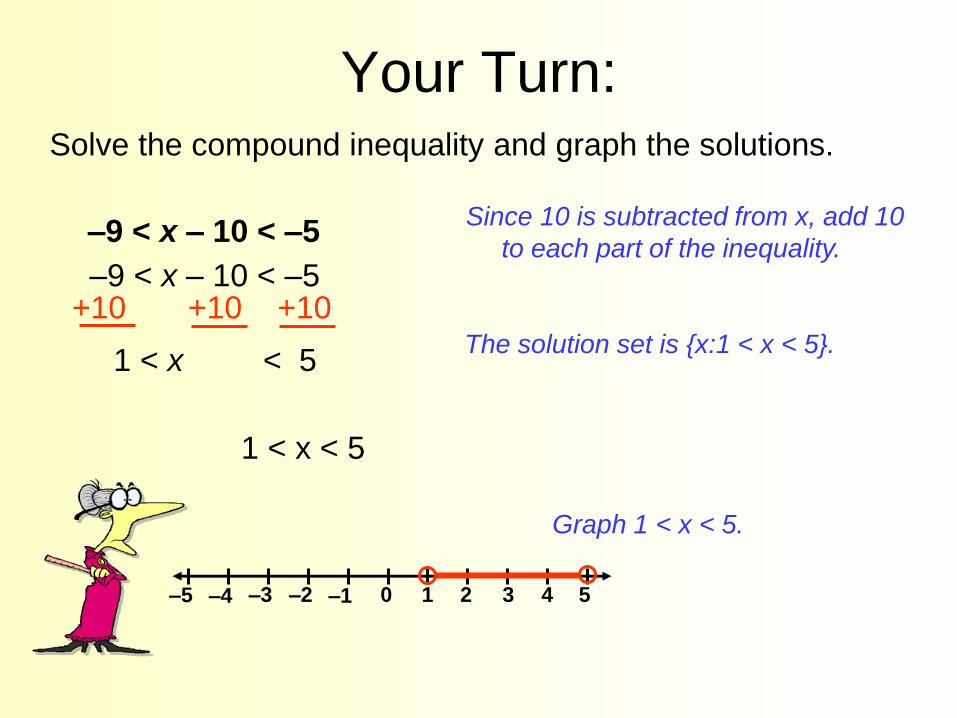
Solve the compound inequality and graph the solutions.
–9 < x – 10 < –5
+10 +10 +10 –9 < x – 10 < –5
1 < x < 5
Since 10 is subtracted from x, add 10
to each part of the inequality.
–5 –4 –3 –2 –1 0 1 2 3 4 5
The solution set is {x:1 < x < 5}.
Graph 1 < x < 5.
Your Turn:
1 < x < 5
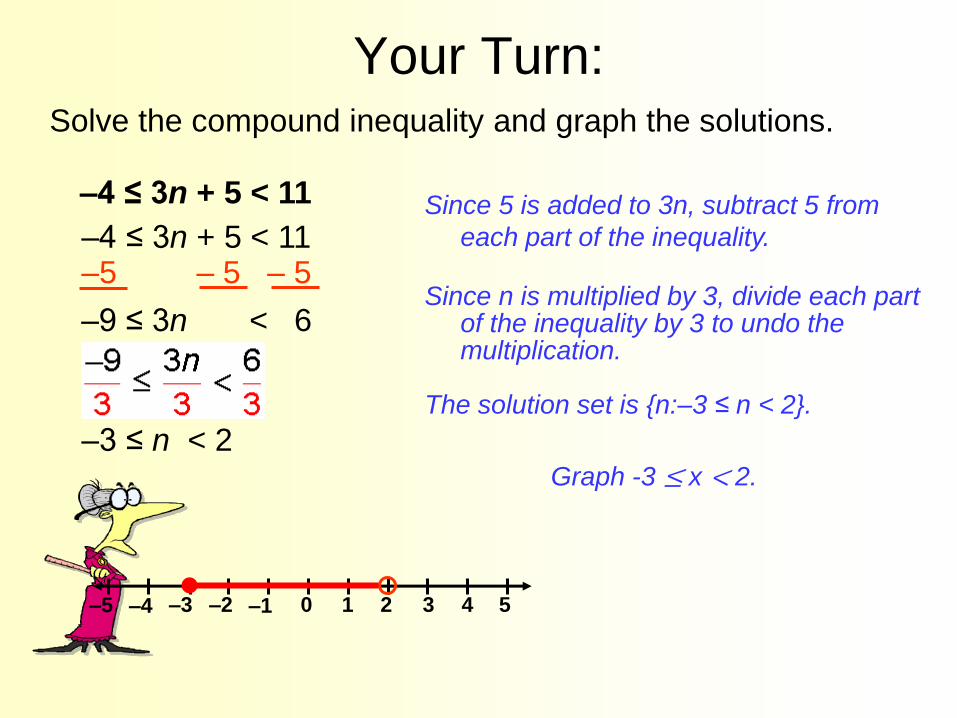
Solve the compound inequality and graph the solutions.
–4 ≤ 3n + 5 < 11
–4 ≤ 3n + 5 < 11 –5 – 5 – 5
–9 ≤ 3n < 6
–3 ≤ n < 2
–5 –4 –3 –2 –1 0 1 2 3 4 5
Since 5 is added to 3n, subtract 5 from
each part of the inequality.
Since n is multiplied by 3, divide each part of the inequality by 3 to undo the multiplication.
Graph -3 ≤ x < 2.
The solution set is {n:–3 ≤ n < 2}.
Your Turn:

Solve the compound inequality and graph the solutions.
8 + t ≥ 7 OR 8 + t < 2
8 + t ≥ 7 OR 8 + t < 2 –8 –8 –8 −8
t ≥ –1 OR t < –6
Solve each simple
inequality.
Graph t < -6 or t ≥ -1.
–10 –8 –6 –4 –2 0 2 4 6 8 10
The solution set is
{t: t ≥ –1 OR t < –6}.
Example: Solving “or” Compound
Inequalities
t < -6 or t ≥ -1
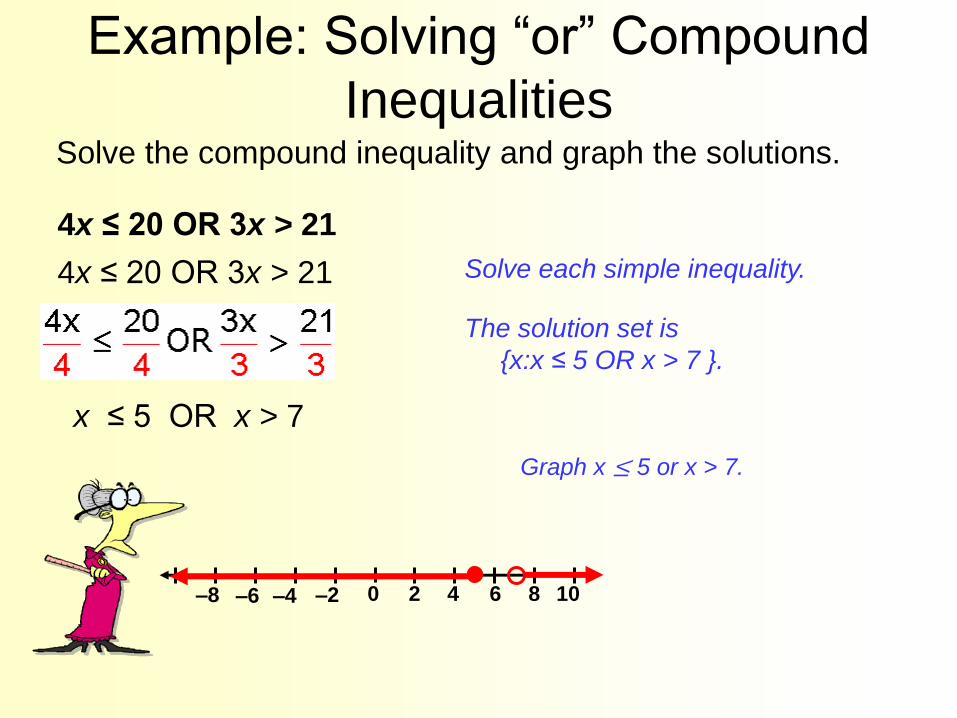
Solve the compound inequality and graph the solutions.
4x ≤ 20 OR 3x > 21
4x ≤ 20 OR 3x > 21
x ≤ 5 OR x > 7
Solve each simple inequality.
Graph x ≤ 5 or x > 7.
0 2 4 6 8 10 –8 –6 –4 –2
The solution set is
{x:x ≤ 5 OR x > 7 }.
Example: Solving “or” Compound
Inequalities

Solve the compound inequality and graph the solutions.
2 +r < 12 OR r + 5 > 19
2 +r < 12 OR r + 5 > 19 –2 –2 –5 –5
r < 10 OR r > 14
–4 –2 0 2 4 6 8 10 12 14 16
Solve each simple inequality.
The solution set is
{r:r < 10 OR r > 14}.
Graph the union by combining the
regions.
Your Turn:
r < 10 or r > 14
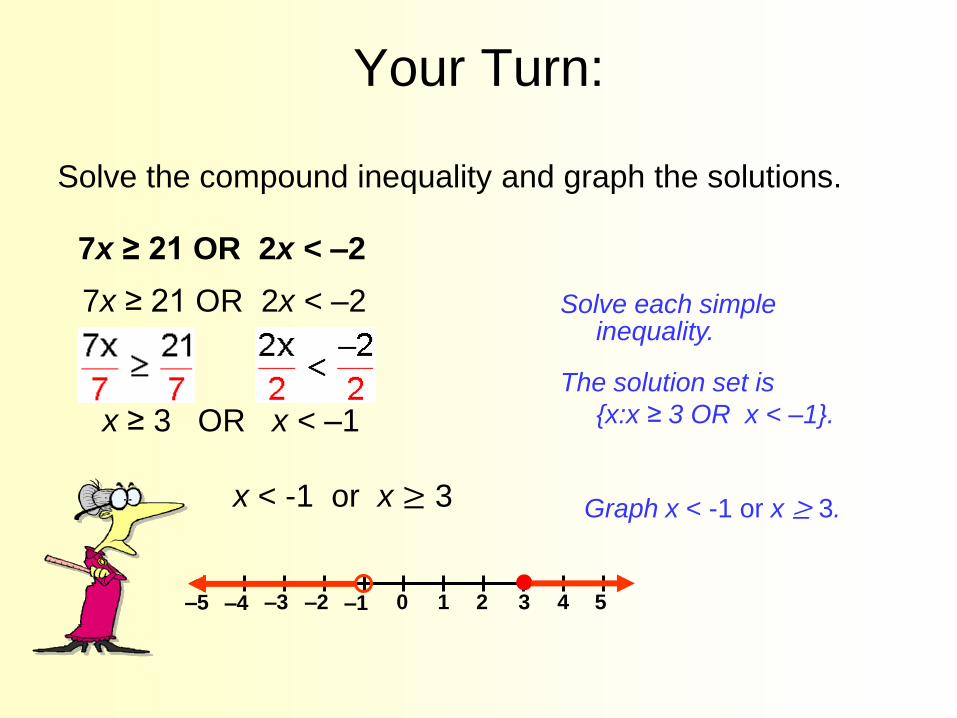
Solve the compound inequality and graph the solutions.
7x ≥ 21 OR 2x < –2
7x ≥ 21 OR 2x < –2
x ≥ 3 OR x < –1
Solve each simple inequality.
Graph x < -1 or x ≥ 3.
–5 –4 –3 –2 –1 0 1 2 3 4 5
The solution set is
{x:x ≥ 3 OR x < –1}.
Your Turn:
x < -1 or x ≥ 3

Interval Notation
• Interval Notation: Describes an interval
on the number line.
• Interval Notation includes the use of three
special symbols:
• ( )
• [ ]
• ∞

Interval Notation
Parentheses ( ) are used when a < or >
symbol indicates that the interval’s
endpoint is NOT included.

Interval Notation
Brackets [ ] are used when a ≥ or ≤ symbol
indicates that the interval’s
endpoint IS included.
Infinity ∞ is used when the interval continues
forever in a positive direction
and −∞ is used when the interval
continues forever in a negative
direction.

What is the graph of [-4, 6)? How do you write [-4, 6) as an inequality?
SOLUTION
This inequality is also written as -4 < x < 6.
-5 -4 -3 -2 -1 0 1 2 3 4 5 6 7

Interval Notation
What is the graph of x < -1 or x > 2? How do you write this in interval notation?
SOLUTION
In interval notation, this is written as (−∞, −1] or (2, ∞).
-5 -4 -3 -2 -1 0 1 2 3 4 5 6 7
Joke Time
• What is Beethoven doing in his grave?
• De-composing
• What do you call an arrogant household
bug?
• A cocky roach.
• What's orange and sounds like a
parrot?
• A carrot!