Embed Size (px)
Citation preview
materials
Article
Compositional Dependence of Pore Structure,Strengthand Freezing-Thawing Resistance ofMetakaolin-Based Geopolymers
Dongming Yan, Lingjun Xie, Xiaoqian Qian, Shaoqin Ruan and Qiang Zeng *
College of Civil Engineering and Architecture, Zhejiang University, Hangzhou 310058, China;[email protected] (D.Y.); [email protected] (L.X.); [email protected] (X.Q.); [email protected] (S.R.)* Correspondence: [email protected]
Received: 14 June 2020; Accepted: 29 June 2020; Published: 3 July 2020�����������������
Abstract: The understanding of the composition dependent properties and freezing-thawing (F-T)resistance of geopolymer materials is vital to their applications in cold regions. In this study,metakaolin-based geopolymer (MKG) mortars were fabricated by controlling the Si/Al ratio andthe Na/Al ratio. The pore structure and strength were measured by mercury intrusion porosimetryand compression tests, respectively, which both showed obvious correlations with the materialcomposition. Mass loss, strength loss, visual rate, and microscopic observation were adopted toassess the changes of the material properties and microstructure caused by F-T loads. The resultsshowed that the strength-porosity relationship roughly followed a linear plot. Increases of the Si/Alratio increased the capillary pore volume, but decreased the gel pore volume and the F-T resistance.Increases of the Na/Al ratio decreased the gel pore, but roughly enhanced the F-T resistance. TheMKG mortar at the Na/Al ratio of 1.26 showed the lowest total pore volume and the best F-Tresistance. The mechanisms of our experimental observations were that the abundantly distributedair voids connected by the capillary pores facilitated the relaxation of hydraulic pressures inducedby the freezing of the pore liquid. The findings of this work help better clarify the compositionaldependence of the pore structure, strength, and freezing-thawing resistance of MKG materials andprovide fundamental bases for their engineering applications in cold regions.
Keywords: geopolymer; alkaline activator material; pore structure; freezing-thawing
1. Introduction
The great amount of CO2 emissions from the production of ordinary Portland cement (OPC),around 0.8 kg CO2 per kg OPC [1], provides significant engineering, social-economic, and ecologicincentives to replace OPC with green cementitious materials with low CO2 emissions. Geopolymer,a type of inorganic alumino-silicate polymer synthesized from predominantly silicon (Si) andaluminum (Al) materials of geologically active minerals, may be a preferable binding material thatcan glue aggregates to fabricate concrete [2,3]. Most importantly, the CO2 emissions for producingone ton of geopolymer are only 20% of those for OPC [3]. The economical and environmental benefitswould be further raised when geopolymers are synthesized with solid wastes with high value addedapplications [4–9]. The cementing or geopolymerization process of geopolymer precursors withalkaline activators can rapidly proceed to form a three-dimensional polymeric structure with complexAl-O-Si bonds and to generate continual material skeletons that enable high strengths [10]. With thoseadvantages, geopolymer-based materials possess a series of excellent performances with promisingpotentials in engineering applications, including high mechanical strength, great fire resistance,enhanced leaching resistance, and improved contaminate stabilization [11–15].
Materials 2020, 13, 2973; doi:10.3390/ma13132973 www.mdpi.com/journal/materials

Materials 2020, 13, 2973 2 of 16
The engineering performances of geopolymer materials are highly dependent on the materialcomposition, synthesizing method, and curing scheme [10,11,16–19]. Among these factors, the materialcomposition may play the most important role, because it decisively impacts the material structures,mechanical properties, and durability performances. For example, the Si/Al ratio and the Na(K)/Alratio are generally elaborately designed to promote the mechanical properties of geopolymer materials.Rowles and Connor [11] found that metakaolin-based geopolymers (MKG) at the Si/Al ratios of 2–2.5and Na/Al ratios of 1–1.5 showed optimized strengths. Using extensive experimental tests and statisticanalyses, Lahoti et al. [17] reported that the Si/Al ratios between 1.5 and 2.2 and the Na/Al ratiosbetween 0.8 and 1.5 enabled the fabrication of high strength MKG mortars over 60 MPa. Compositiondesigns not only impact the material strength, but also alter the pore structure of MKG materials.For example, Duxon et al. [20] tested the pore size distribution (PSD) of MKG materials at differentSi/Al ratios and found that the rise of the Si/Al ratio would narrow the pore sizes at the nanoscale.Nevertheless, these pore structure alterations may lead to different responses of geopolymer materialsto freezing-thawing (F-T) cycles, which has not been clarified in previous studies.
The durability of geopolymer materials against F-T loads faces great challenges whengeopolymer-based structures are in cold regions especially for hydraulic engineering applications,such as dams, aqueducts, and docks. One important challenge is that the pore structure of geopolymermaterials varies with the material composition [20]. Therefore, the ordinary tests on the mechanicalperformances of geopolymer materials subject to F-T loads are far from approaching the real F-Tdegradation in the materials [21–23].
As an important durability index, F-T resistance has been widely tested in ordinary structurematerials such as concrete, mortar, and masonry [24–26]. For all types of porous materials, theF-T damage mechanisms are similar. Generally, F-T damages occur when the pore pressures builtfrom the transition of pore water to ice exceed the material strength [27–31]. Generally, the freezingpore pressures consist of the hydraulic pressures caused by the water-ice density differences andthe crystallization pressures induced by the free energy differences [32,33]. The pore confinementwill greatly influence the freezing process of water [28,34,35], which, consequently, impacts the frostdamages of porous materials. Therefore, it is difficult to explore the F-T resistances of porous materialswith different pore structures.
In the present work, we aimed to deepen the understandings of correlations between the porestructure and F-T resistance of MKG materials. MKG mortars with different pore structures weresynthesized by controlling the Si/Al ratio and the Na/Al ratio. The pore structure of the MKG mortarswas measured by mercury intrusion porosimetry (MIP), and its correlations to the compressivestrengths were evaluated. The F-T performances of the MKG mortars were assessed and linked to thepore structure. The results of this study shed much light on the compositional dependence of the porestructure, strength, and freezing-thawing resistance of MKG materials.
2. Experiments
2.1. Materials and Specimen Preparation
A commercial metakaolin powder (Metamax, Basf Co. LTD., Shanghai, China) was used as thealumino-silicate source of the geopolymer materials. Using laser particle size analysis (LS-230, Coulter),the mean particle size was measured as 5.91 µm, and the 90%-passed particle size was 13.59 µm. Theparticle size distribution of the metakaolin powder is shown in Figure 1a. The packing density ofthe metakaolin powder was 0.422 g/mL. The chemical composition of the metakaolin powder wasmeasured by X-ray fluorescence (XRF) spectrometer analysis (SHIMADU XRF-1800, Shimadzu GlobalLaboratory Consumables Co., Ltd. Shanghai, China). SiO2 and Al2O3 occupied 57.47 wt.% and 39.81wt.% of the total oxides, respectively (Table 1). The XRD patterns of the metakaolin are shown inFigure 1b. Only amorphous halo and anatase are observed in the figure, suggesting that the metakaolincontained the amorphous SiO2 and Al2O3 with highly reactive potentials.

Materials 2020, 13, 2973 3 of 16
Figure 1. Particle size distribution (a) and XRD patterns (b) of the metakaolin powder.
Table 1. Chemical components of the metakaolin powder.
Composition SiO2 Al2O3 TiO2 Fe2O3 Na2O K2O CaO
Mass content (%) 57.47 39.81 1.79 0.43 0.27 0.21 0.04
The alkaline activator used in this work was prepared by liquid sodium silicate (SiO2 = 27.35%,Na2O = 8.42%, and H2O = 64.23%) and pellet sodium hydroxide (Na2O = 77.4%, H2O = 22.5%, andimpurity = 0.1%). Fine sands with a fineness modulus of 1.75 and a density of 2510 kg/m3 wereadopted as the fine aggregates for preparing the MKG mortars.
In order to investigate the possible influences of material composition (Si/Al ratio and Na/Alratio) on the pore structure and mechanical properties of MKG materials, two mortar groups weredesigned. For the first group (MKG-1 to MKG-3), the Si/Al ratios varied from 2.01 to 2.62 with theNa/Al ratio fixed at 1.01. For the second group (MKG-3 to MKG-5), the Si/Al ratio was fixed at2.62, while the Na/Al ratio increased from 1.01 to 1.36. The mix proportions and nomenclature areshown in Table 2. In all mixes, a water-to-binder (w/b) ratio of 0.62 and a sand-to-binder (s/b) ratioof 3 were used, so that the influences of w/b and s/b could be eliminated. The alkaline activatorswere first synthesized according to the stoichiometric balances required by the different Si/Al andNa/Al ratios. After settling down for 12 h, the activator solutions were readily prepared for thegeopolymer synthesis.
Table 2. Mix proportions of the metakaolin-based geopolymer (MKG) concretes.
Mix ID Metakaolin Water Glass NaOH Water Si/Al Na/Al
MKG-1 1016 640 193 410 2.01 1.01MKG-2 936 993 138 197 2.32 1.01MKG-3 868 1290 84 17 2.62 1.01MKG-4 842 1251 136 31 2.62 1.26MKG-5 832 1233 156 38 2.62 1.36
When preparing the fresh MKG mortars, a readily settled alkali activator solution was firstpoured into a Hobart mixer bowl, followed by the precisely weighed metakaolin powder and water. Alow-speed stirring for 3 min was conducted to obtain the MKG paste slurries. After that, sands wereadded into the paste slurries with another 3 min stirring to homogenize the MKG mortar. The mortarslurries were then cast into cuboid molds with dimensions of 40 × 40 × 160 mm3. High-frequencyvibrations were conducted on the fully filled molds to further remove the air bubbles entrapped in themortars. The specimens, together with the molds, were covered with plastic film to avoid any loss ofwater that may cause microstructure alterations. They later experienced a standard curing (20 ± 1 ◦C

Materials 2020, 13, 2973 4 of 16
and 90% relative humidity) for 2 d to increase the strengths. After demolding, all the mortar specimenswere stored in a curing chamber to 28 d.
2.2. Testing Methods
2.2.1. Strength
Compressive strengths were tested in a TYE-300D (Jianyi experiment instrument Co. LTD., WuXi,Jiangsu, China) automatic mechanical testing machine with a loading speed of 2.4 kN/s. Six specimensof each mix were tested and averaged to guarantee the data reliability and productivity.
2.2.2. Freezing-Thawing
F-T durability is important when MKG materials are applied in hydraulic engineering structuresin cold regions. F-T tests were performed using a CDR-5 rapid freeze-thaw machine according to theTest Code for Hydraulic Concrete [36]. Before the F-T tests, all the specimens were immersed in tapwater for 4 days to enhance the water saturation degrees. The mass of those water-filled specimenswas weighed by a highly accurate balance and termed as the initial mass m0. Later, the specimenswere loaded in water-filled vessels with the water surface 20 mm higher than the top surfaces of thespecimens. Those vessels that contained the MKG specimens and water were then removed into theF-T testing machine. The temperature was controlled between −17 and 8 ◦C. A freezing (thawing)course took 1.5–2.5 h (1–1.5 h) to decrease (raise) the temperature. One complete F-T course cost2.5–4 h.
After 50 F-T cycles, the specimens were removed from the freezing chamber, and the excesssurface water was cleaned by absorbent papers. The mass of the surface saturated specimens wasmeasured and termed as mFT . The relative mass loss ∆m was evaluated as:
∆m =m0 − mFT
m0(1)
When the specimens were completely damaged after the F-T loads, neither the strength nor themass was measured.
2.2.3. Pore Structure
The central part of each MKG mortar was crushed into small MKG particles (around 10 mm indiameter) for MIP tests. Owing to the reproductive data and broad pore ranges of MIP [37], onlyone MIP test for each mortar was conducted. MIP tests were carried out using an Autopore IV 9510(Micromeritics Instrument Corp., Norcross, GA, USA). The applied intrusion pressures were set from1.4 kPa to 207 MPa with the equilibrium time of 10 s for each pressure step. Mercury fronts invadepores or cavities when the exerted forces are high enough to overcome the barriers induced by thesurface forces on the pore curvatures. By accurately recording the mercury intrusion (extrusion)volume (or mass) at each pressurization step, the pore structure of a porous material can be assessed.Generally, the Washburn equation [38] is used to link the applied pressures (P) to the pore sizes D,i.e., D = −4γ cos θ/P, where γ is the surface tension of mercury and θ is the contact angle betweenmercury and the pore wall. Note that the Washburn equation requires the gradually sized andconnected pore system in cylindrical geometry. By taking the commonly used physical parametersof mercury, i.e., the contact angle of 130◦ and the surface tension of 485 N/m [39], the minimum andmaximum accessible pore sizes, according to the Washburn equation, were estimated as 6 nm and 360µm, corresponding to the maximum and minimum applied pressures, respectively.
2.2.4. Micro Morphology
Scanning electron microscopy (SEM) in back-scattered electron (BSE) mode was tested in anequipment of Quanta FEG 650 (Thermo Fisher Scientific, Beijing, China) to observe the microstructure
Materials 2020, 13, 2973 5 of 16
alterations of the MKG mortars induced by F-T cycles. BSE images can more clearly distinguishthe pore phase (including the cracks) from the solid skeletons, because they have different electronback-scattering coefficients. The MKG mortar particles before and after F-T loads were oven-dried at40 ◦C for 24 h and impregnated with a quick-hardening epoxy resin. Later, the solidified resin-coveredsamples were ground and polished by various grades of sand papers and diamond suspensions. Aftera short carbon coating, the smooth and flat samples were loaded in a sample platform for the SEM/BSEtests. The voltage of 30 kV and spot size of 5.0 nm were used to acquire the BSE images.
3. Materials’ Properties and Pore Structure
3.1. Pore Structure
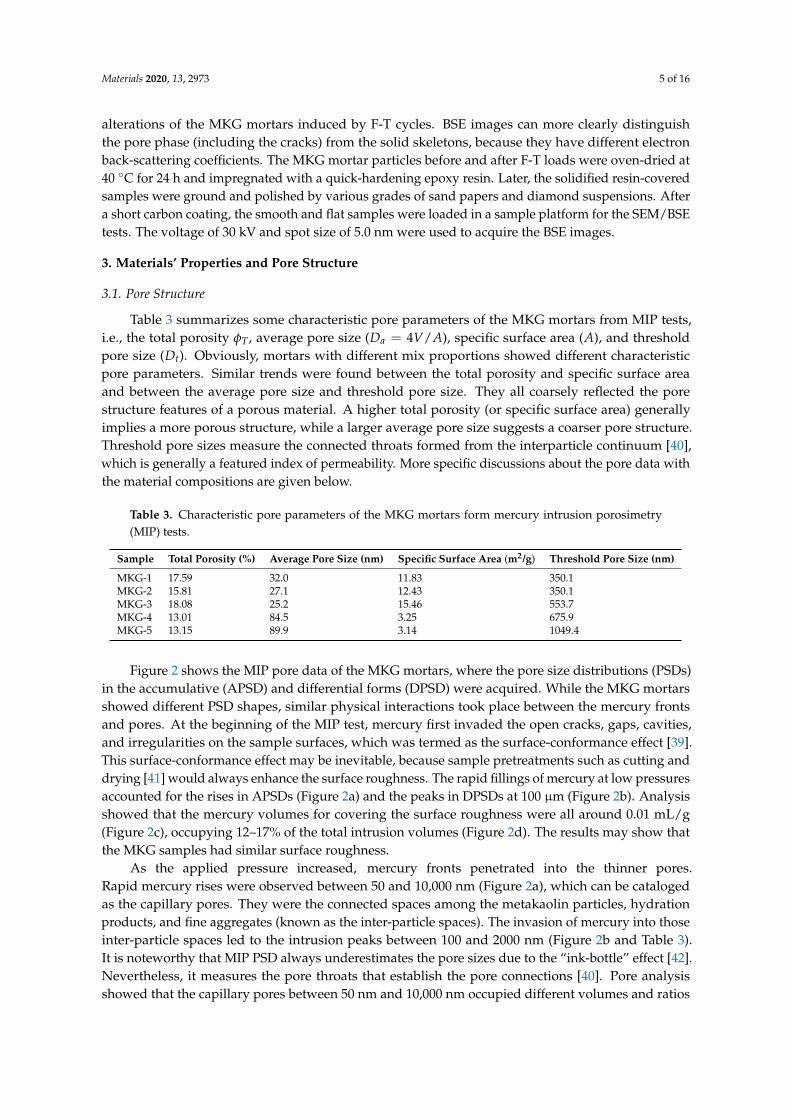
Table 3 summarizes some characteristic pore parameters of the MKG mortars from MIP tests,i.e., the total porosity φT , average pore size (Da = 4V/A), specific surface area (A), and thresholdpore size (Dt). Obviously, mortars with different mix proportions showed different characteristicpore parameters. Similar trends were found between the total porosity and specific surface areaand between the average pore size and threshold pore size. They all coarsely reflected the porestructure features of a porous material. A higher total porosity (or specific surface area) generallyimplies a more porous structure, while a larger average pore size suggests a coarser pore structure.Threshold pore sizes measure the connected throats formed from the interparticle continuum [40],which is generally a featured index of permeability. More specific discussions about the pore data withthe material compositions are given below.
Table 3. Characteristic pore parameters of the MKG mortars form mercury intrusion porosimetry(MIP) tests.
Sample Total Porosity (%) Average Pore Size (nm) Specific Surface Area (m2/g) Threshold Pore Size (nm)
MKG-1 17.59 32.0 11.83 350.1MKG-2 15.81 27.1 12.43 350.1MKG-3 18.08 25.2 15.46 553.7MKG-4 13.01 84.5 3.25 675.9MKG-5 13.15 89.9 3.14 1049.4
Figure 2 shows the MIP pore data of the MKG mortars, where the pore size distributions (PSDs)in the accumulative (APSD) and differential forms (DPSD) were acquired. While the MKG mortarsshowed different PSD shapes, similar physical interactions took place between the mercury frontsand pores. At the beginning of the MIP test, mercury first invaded the open cracks, gaps, cavities,and irregularities on the sample surfaces, which was termed as the surface-conformance effect [39].This surface-conformance effect may be inevitable, because sample pretreatments such as cutting anddrying [41] would always enhance the surface roughness. The rapid fillings of mercury at low pressuresaccounted for the rises in APSDs (Figure 2a) and the peaks in DPSDs at 100 µm (Figure 2b). Analysisshowed that the mercury volumes for covering the surface roughness were all around 0.01 mL/g(Figure 2c), occupying 12–17% of the total intrusion volumes (Figure 2d). The results may show thatthe MKG samples had similar surface roughness.
As the applied pressure increased, mercury fronts penetrated into the thinner pores.Rapid mercury rises were observed between 50 and 10,000 nm (Figure 2a), which can be catalogedas the capillary pores. They were the connected spaces among the metakaolin particles, hydrationproducts, and fine aggregates (known as the inter-particle spaces). The invasion of mercury into thoseinter-particle spaces led to the intrusion peaks between 100 and 2000 nm (Figure 2b and Table 3).It is noteworthy that MIP PSD always underestimates the pore sizes due to the “ink-bottle” effect [42].Nevertheless, it measures the pore throats that establish the pore connections [40]. Pore analysisshowed that the capillary pores between 50 nm and 10,000 nm occupied different volumes and ratios

Materials 2020, 13, 2973 6 of 16
for different MKG mortars (Figure 2c,d). Specifically, more than 70 percent of the pores in the MKG-4and MKG-5 samples were capillary pores (Figure 2d).
Under higher pressures, mercury could invade the pores below 50 nm (gel pores). Great PSDdifferences between the MKG mortars were found without uniform trends (Figure 2a,b). The MKG-1sample had coarser PSDs and higher gel pore volumes than MKG-2 and MKG-3, while the MKG-5 andMKG-5 samples showed limited distributions and volumes of the gel pores (Figure 2c,d).
1 0 0 1 0 1 1 0 2 1 0 3 1 0 4 1 0 50 . 0 0
0 . 0 2
0 . 0 4
0 . 0 6
0 . 0 8
0 . 1 0
Accu
mulat
ive po
re vo
lume (
mL/g)
P o r e d i a m e t e r ( n m )
M K G - 1 M K G - 2 M K G - 3 M K G - 4 M K G - 5
(a) APSD of the MKG samples before F-T loads
1 0 0 1 0 1 1 0 2 1 0 3 1 0 4 1 0 5 1 0 60 . 0 0
0 . 0 2
0 . 0 4
0 . 0 6
0 . 0 8
0 . 1 0
0 . 1 2
Pore
volum
e dv/d
log(D
) (mL/g
)
P o r e d i a m e t e r ( n m )
M K G - 1 M K G - 2 M K G - 3 M K G - 4 M K G - 5
(b) DPSD of the MKG samples before F-T loads
M K G - 1 M K G - 2 M K G - 3 M K G - 4 M K G - 50 . 0 0
0 . 0 2
0 . 0 4
0 . 0 6
0 . 0 8
0 . 1 0
Pore
volum
e (mL
/g)
< 5 0 n m 5 0 - 1 0 , 0 0 0 n m > 1 0 , 0 0 0 n m
(c) Pore volumes in different sizes
1 2 % 1 7 % 1 2 % 1 5 % 1 3 %
3 4 %4 4 % 5 1 %
7 2 % 7 4 %
5 4 %3 9 % 3 7 %
1 3 % 1 3 %
M K G - 1 M K G - 2 M K G - 3 M K G - 4 M K G - 50
2 0
4 0
6 0
8 0
1 0 0 < 5 0 n m 5 0 - 1 0 , 0 0 0 n m > 1 0 , 0 0 0 n m
Pore
perce
ntage
(%)
(d) Pore ratios in different sizes
Figure 2. Pore structure of the MKG mortars before freezing-thawing (F-T) loads: (a) accumulativepore size distribution (APSD) spectra; (b) differential PSD (DPSD) spectra; (c) pore volumes in differentsizes; and (d) pore ratios in different sizes.
3.2. Strength
Figure 3 shows the statistical compressive strengths of the MKG mortars. Clearly, all the mortarsshowed relatively high strengths (>57 MPa), suggesting that the mixes used in this work couldfabricate geopolymer materials with good mechanical properties. Similar strength data were reportedelsewhere [11,17].
Most granular-compacted materials (like concrete and geopolymer materials) accumulatestrengths by increasing the compactness of solids or decreasing the volume of pores. Therefore,total porosity can be an indicator to predict material strength. Figure 4 shows the plots of compressivestrength against total porosity. Roughly, the compressive strength decreased linearly with the totalporosity, which can be expressed as:
σ = σ0 (1 − αφ) (2)

Materials 2020, 13, 2973 7 of 16
where σ and σ0 are the compressive strengths at current porosity φ and zero porosity, respectively; α
is the coefficient. Equation (2) is also known as the Hasselmann equation for the strength-porosityrelationship of porous materials [43].
M K G - 1 M K G - 2 M K G - 3 M K G - 4 M K G - 50
1 02 03 04 05 06 07 08 09 0
Mean
stren
gth (M
Pa)
Figure 3. Statistical strengths of the MKG mortars.
Fitting of the compressive strength data with Equation (2) yielded σ0 = 99.74 MPa, α = 0.022.The obtained σ0 was much larger than that of alkali-activated slag mortars [44], but close to that ofgeopolymer mortars prepared by slag, fly ash, and palm oil fuel ash [18]. The coefficient α was muchlower than that reported in the literature [18,44]. The results implied the high strength of the solidmatrix and the limited influence of total porosity.
1 3 1 4 1 5 1 6 1 7 1 84 5
5 0
5 5
6 0
6 5
7 0
7 5
8 0
8 5
Stren
gth (M
Pa)
T o t a l p o r o s i t y
y = 9 9 . 7 4 - 2 . 2 1 x , R 2 = 0 . 6 9
Figure 4. Relationships between strength and porosity.
3.3. Roles of the Materials’ Composition
In order to better understand the effects of the Si/Al ratio and the Na/Al ratio on the strength andpore structure of the MKG mortars, specific analyses were performed on each factor. Figure 5 showsthe compressive strengths and pore volumes in terms of the Si/Al ratio and the Na/Al ratio. Themix with the Si/Al ratio at 2.32 showed the highest compressive strength (σ = 66.04 MPa), while themixes with the other Si/Al ratios showed slightly lower compressive strengths (Figure 5a). Meanwhile,increasing the Si/Al ratio promoted the capillary pore volume, but decreased the gel pore volume(Figure 5c).
When the Si/Al ratio was fixed at 2.62, the changes of the Na/Al ratio caused monotonous changesof both compressive strengths and pore volumes. For example, as the Na/Al ratio increased from 1.01to 1.36, the compressive strength increased from 57.63 MPa to 74.28 MPa with the promotion extents of
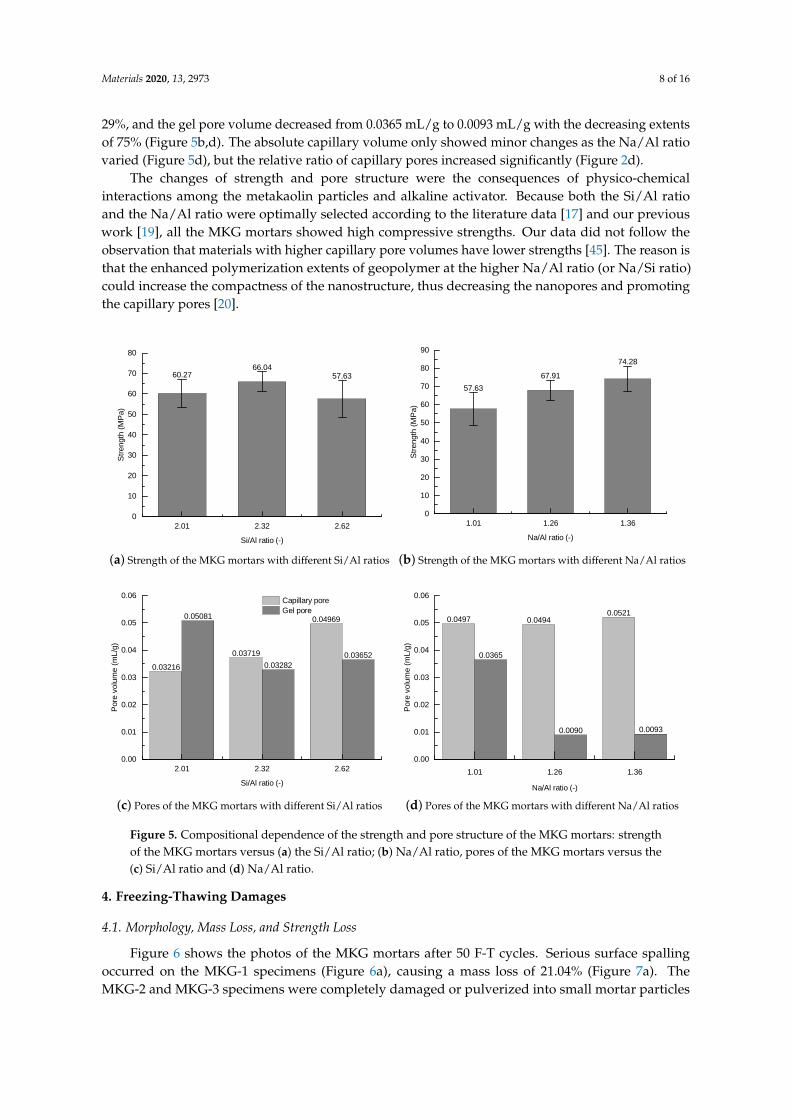
Materials 2020, 13, 2973 8 of 16
29%, and the gel pore volume decreased from 0.0365 mL/g to 0.0093 mL/g with the decreasing extentsof 75% (Figure 5b,d). The absolute capillary volume only showed minor changes as the Na/Al ratiovaried (Figure 5d), but the relative ratio of capillary pores increased significantly (Figure 2d).
The changes of strength and pore structure were the consequences of physico-chemicalinteractions among the metakaolin particles and alkaline activator. Because both the Si/Al ratioand the Na/Al ratio were optimally selected according to the literature data [17] and our previouswork [19], all the MKG mortars showed high compressive strengths. Our data did not follow theobservation that materials with higher capillary pore volumes have lower strengths [45]. The reason isthat the enhanced polymerization extents of geopolymer at the higher Na/Al ratio (or Na/Si ratio)could increase the compactness of the nanostructure, thus decreasing the nanopores and promotingthe capillary pores [20].
6 0 . 2 7 6 6 . 0 45 7 . 6 3
2 . 0 1 2 . 3 2 2 . 6 20
1 0
2 0
3 0
4 0
5 0
6 0
7 0
8 0
Stren
gth (M
Pa)
S i / A l r a t i o ( - )
(a) Strength of the MKG mortars with different Si/Al ratios
5 7 . 6 36 7 . 9 1
7 4 . 2 8
1 . 0 1 1 . 2 6 1 . 3 60
1 02 03 04 05 06 07 08 09 0
Stren
gth (M
Pa)
N a / A l r a t i o ( - )
(b) Strength of the MKG mortars with different Na/Al ratios
0 . 0 3 2 1 60 . 0 3 7 1 9
0 . 0 4 9 6 90 . 0 5 0 8 1
0 . 0 3 2 8 20 . 0 3 6 5 2
2 . 0 1 2 . 3 2 2 . 6 20 . 0 0
0 . 0 1
0 . 0 2
0 . 0 3
0 . 0 4
0 . 0 5
0 . 0 6 C a p i l l a r y p o r e G e l p o r e
Pore
volum
e (mL
/g)
S i / A l r a t i o ( - )
(c) Pores of the MKG mortars with different Si/Al ratios
0 . 0 4 9 7 0 . 0 4 9 4 0 . 0 5 2 1
0 . 0 3 6 5
0 . 0 0 9 0 0 . 0 0 9 3
1 . 0 1 1 . 2 6 1 . 3 60 . 0 0
0 . 0 1
0 . 0 2
0 . 0 3
0 . 0 4
0 . 0 5
0 . 0 6
Pore
volum
e (mL
/g)
N a / A l r a t i o ( - )(d) Pores of the MKG mortars with different Na/Al ratios
Figure 5. Compositional dependence of the strength and pore structure of the MKG mortars: strengthof the MKG mortars versus (a) the Si/Al ratio; (b) Na/Al ratio, pores of the MKG mortars versus the(c) Si/Al ratio and (d) Na/Al ratio.
4. Freezing-Thawing Damages
4.1. Morphology, Mass Loss, and Strength Loss
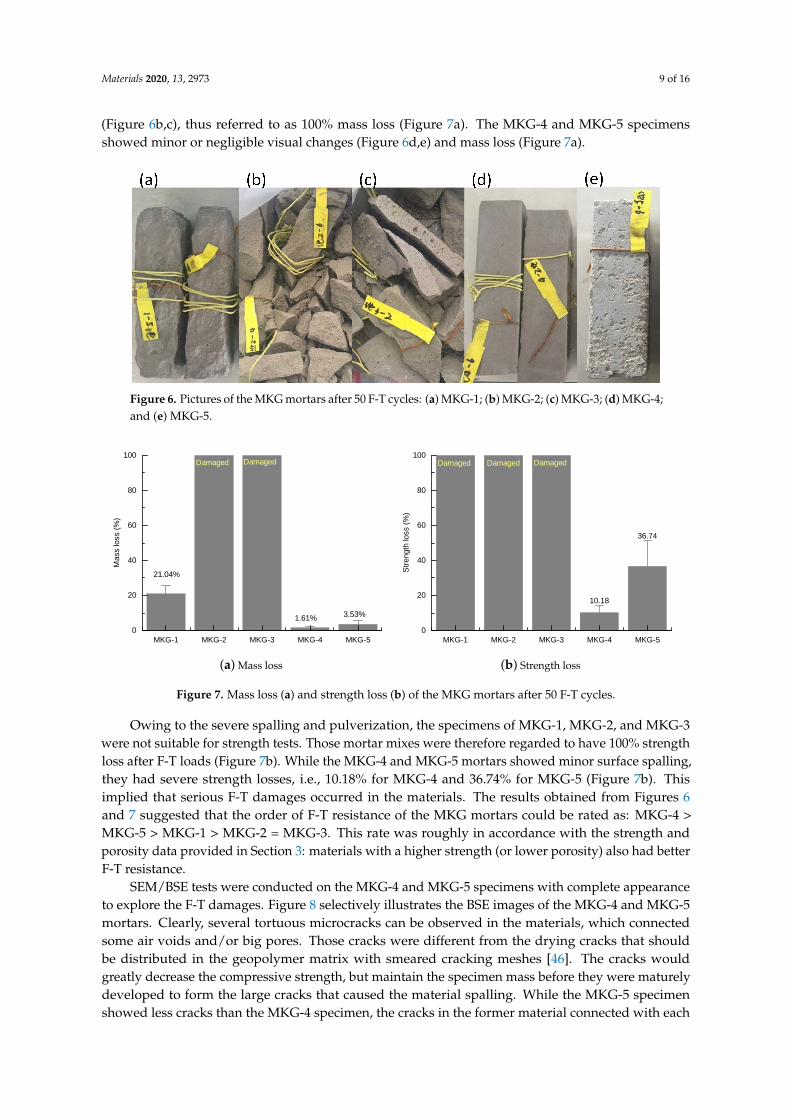
Figure 6 shows the photos of the MKG mortars after 50 F-T cycles. Serious surface spallingoccurred on the MKG-1 specimens (Figure 6a), causing a mass loss of 21.04% (Figure 7a). TheMKG-2 and MKG-3 specimens were completely damaged or pulverized into small mortar particles
Materials 2020, 13, 2973 9 of 16
(Figure 6b,c), thus referred to as 100% mass loss (Figure 7a). The MKG-4 and MKG-5 specimensshowed minor or negligible visual changes (Figure 6d,e) and mass loss (Figure 7a).
Figure 6. Pictures of the MKG mortars after 50 F-T cycles: (a) MKG-1; (b) MKG-2; (c) MKG-3; (d) MKG-4;and (e) MKG-5.
M K G - 1 M K G - 2 M K G - 3 M K G - 4 M K G - 50
2 0
4 0
6 0
8 0
1 0 0
3 . 5 3 %1 . 6 1 %
D a m a g e d
Mass
loss
(%)
D a m a g e d
2 1 . 0 4 %
(a) Mass loss
1 0 0 . 0 0 1 0 0 . 0 0 1 0 0 . 0 0
1 0 . 1 8
3 6 . 7 4
M K G - 1 M K G - 2 M K G - 3 M K G - 4 M K G - 50
2 0
4 0
6 0
8 0
1 0 0 D a m a g e dD a m a g e dD a m a g e d
Stren
gth lo
ss (%
)
(b) Strength loss
Figure 7. Mass loss (a) and strength loss (b) of the MKG mortars after 50 F-T cycles.
Owing to the severe spalling and pulverization, the specimens of MKG-1, MKG-2, and MKG-3were not suitable for strength tests. Those mortar mixes were therefore regarded to have 100% strengthloss after F-T loads (Figure 7b). While the MKG-4 and MKG-5 mortars showed minor surface spalling,they had severe strength losses, i.e., 10.18% for MKG-4 and 36.74% for MKG-5 (Figure 7b). Thisimplied that serious F-T damages occurred in the materials. The results obtained from Figures 6and 7 suggested that the order of F-T resistance of the MKG mortars could be rated as: MKG-4 >MKG-5 > MKG-1 > MKG-2 = MKG-3. This rate was roughly in accordance with the strength andporosity data provided in Section 3: materials with a higher strength (or lower porosity) also had betterF-T resistance.
SEM/BSE tests were conducted on the MKG-4 and MKG-5 specimens with complete appearanceto explore the F-T damages. Figure 8 selectively illustrates the BSE images of the MKG-4 and MKG-5mortars. Clearly, several tortuous microcracks can be observed in the materials, which connectedsome air voids and/or big pores. Those cracks were different from the drying cracks that shouldbe distributed in the geopolymer matrix with smeared cracking meshes [46]. The cracks wouldgreatly decrease the compressive strength, but maintain the specimen mass before they were maturelydeveloped to form the large cracks that caused the material spalling. While the MKG-5 specimenshowed less cracks than the MKG-4 specimen, the cracks in the former material connected with each

Materials 2020, 13, 2973 10 of 16
other, forming percolated cracks. This explained why the MKG-5 mortar showed severer mass andstrength losses (Figure 7).
Figure 8. Typical SEM/BSE pictures of (a) MKG-4 and (b) MKG-5 specimens after F-T loads.
4.2. Pore Structure Alterations
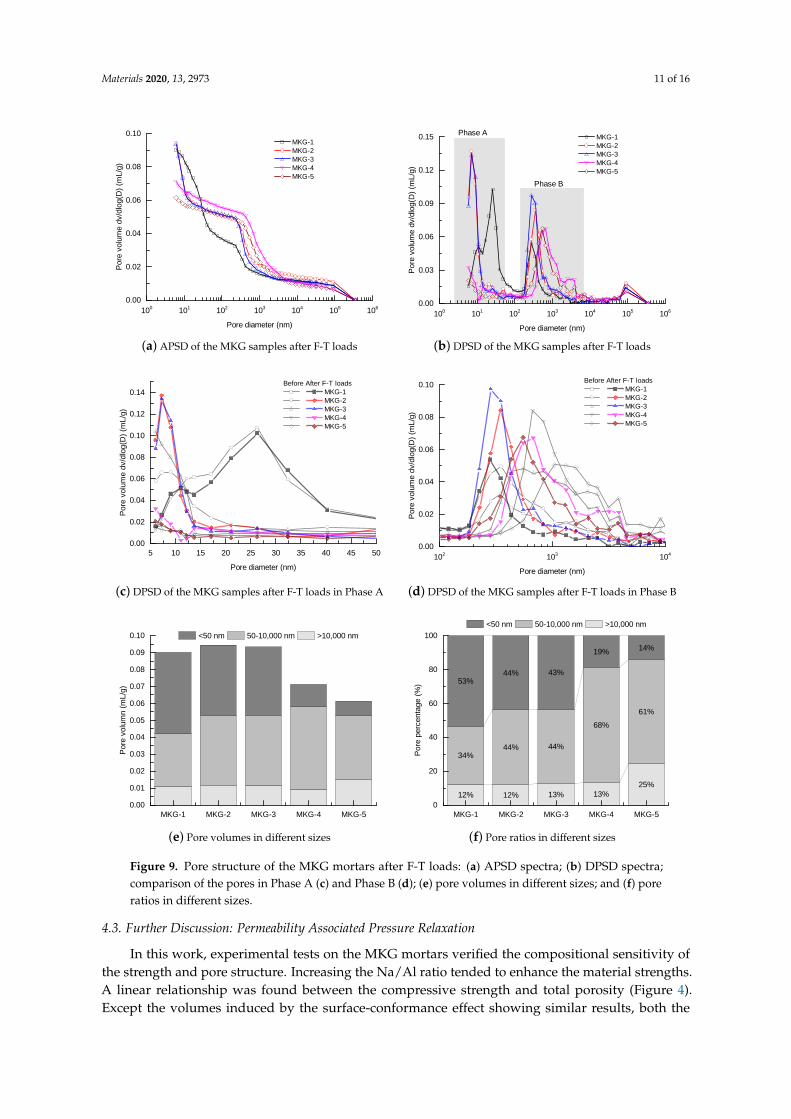
The pore structure alterations of the MKG mortars after F-T loads were assessed by MIP tests.Figure 9 shows the PSD spectra and pore segmentation of the MKG mortars after F-T loads. At a firstglance, both the APSD and DPSD spectra showed similar curves to those before F-T loads. This wasreasonable, because F-T loads would not change the spatial compactness of the material system. Forexample, the first mercury rise in APSD and the peak in DPSD remained unchanged after F-T loads formost mixes, except that a slight rise in this part occurred for the MKG-5 mortar (Figure 9e). The F-Tcracking enhanced the surface roughness, which, consequently, raised the surface-conformance effect(Figure 9f).
Careful examinations on two phases of the DPSD spectra were performed, which helpedcharacterize the pore structure alterations caused by F-T loads. Phases A and B represent the gelpores below 50 nm and the capillary pores between 100 and 10,000 nm, respectively (Figure 9b).Comparative plots of the two phases between the mortars before and after F-T loads are drawn inFigure 9c,d. Surprisingly, the gel pores of all mortar mixes were raised (Figure 9c). For instance,the MKG-2 and MKG-3 mixes that appeared to have the severest F-T damages (Figure 6) showed theheaviest rises of the gel pores, and the gel pore ratios increased from 39% and 37% (Figure 2d) up to44% and 43% (Figure 9f), respectively. Meanwhile, the capillary pores were narrowed (Figure 9d), andthe pore volumes were decreased (Figure 9e). Those were contrary to the pore structure degradationreported elsewhere [23]. The anomalous gel and capillary pores’ alterations did not directly reflectthe material degradation caused by F-T loads, but might indicate the pore refinement induced by thecontinual polymerization of the materials immersed in water. A literature survey indicated that thefirst few F-T cycles may enhance the geopolymerization process, which helps refine the pore structureand even increase the strength [47–49]. The products of geopolymerization filled the coarse pores,which thus decreased the capillary pore fractions of MKG-4 and MKG-5 shown in Figure 9f.
Materials 2020, 13, 2973 11 of 16
1 0 0 1 0 1 1 0 2 1 0 3 1 0 4 1 0 5 1 0 60 . 0 0
0 . 0 2
0 . 0 4
0 . 0 6
0 . 0 8
0 . 1 0Po
re vo
lume d
v/dlog
(D) (m
L/g)
P o r e d i a m e t e r ( n m )
M K G - 1 M K G - 2 M K G - 3 M K G - 4 M K G - 5
(a) APSD of the MKG samples after F-T loads
1 0 0 1 0 1 1 0 2 1 0 3 1 0 4 1 0 5 1 0 60 . 0 0
0 . 0 3
0 . 0 6
0 . 0 9
0 . 1 2
0 . 1 5
P h a s e B
Pore
volum
e dv/d
log(D
) (mL/g
)
P o r e d i a m e t e r ( n m )
M K G - 1 M K G - 2 M K G - 3 M K G - 4 M K G - 5
P h a s e A
(b) DPSD of the MKG samples after F-T loads
5 1 0 1 5 2 0 2 5 3 0 3 5 4 0 4 5 5 00 . 0 0
0 . 0 2
0 . 0 4
0 . 0 6
0 . 0 8
0 . 1 0
0 . 1 2
0 . 1 4
Pore
volum
e dv/d
log(D
) (mL/g
)
P o r e d i a m e t e r ( n m )
B e f o r e A f t e r F - T l o a d s M K G - 1 M K G - 2 M K G - 3 M K G - 4 M K G - 5
(c) DPSD of the MKG samples after F-T loads in Phase A
1 0 2 1 0 3 1 0 40 . 0 0
0 . 0 2
0 . 0 4
0 . 0 6
0 . 0 8
0 . 1 0
Pore
volum
e dv/d
log(D
) (mL/g
)
P o r e d i a m e t e r ( n m )
B e f o r e A f t e r F - T l o a d s M K G - 1 M K G - 2 M K G - 3 M K G - 4 M K G - 5
(d) DPSD of the MKG samples after F-T loads in Phase B
M K G - 1 M K G - 2 M K G - 3 M K G - 4 M K G - 50 . 0 00 . 0 10 . 0 20 . 0 30 . 0 40 . 0 50 . 0 60 . 0 70 . 0 80 . 0 90 . 1 0 < 5 0 n m 5 0 - 1 0 , 0 0 0 n m > 1 0 , 0 0 0 n m
Pore
volum
n (mL
/g)
(e) Pore volumes in different sizes
1 2 % 1 2 % 1 3 % 1 3 %2 5 %
3 4 %4 4 % 4 4 %
6 8 %6 1 %
5 3 %4 4 % 4 3 %
1 9 % 1 4 %
M K G - 1 M K G - 2 M K G - 3 M K G - 4 M K G - 50
2 0
4 0
6 0
8 0
1 0 0
Pore
perce
ntage
(%)
< 5 0 n m 5 0 - 1 0 , 0 0 0 n m > 1 0 , 0 0 0 n m
(f) Pore ratios in different sizes
Figure 9. Pore structure of the MKG mortars after F-T loads: (a) APSD spectra; (b) DPSD spectra;comparison of the pores in Phase A (c) and Phase B (d); (e) pore volumes in different sizes; and (f) poreratios in different sizes.
4.3. Further Discussion: Permeability Associated Pressure Relaxation
In this work, experimental tests on the MKG mortars verified the compositional sensitivity ofthe strength and pore structure. Increasing the Na/Al ratio tended to enhance the material strengths.A linear relationship was found between the compressive strength and total porosity (Figure 4).Except the volumes induced by the surface-conformance effect showing similar results, both the
Materials 2020, 13, 2973 12 of 16
capillary pores and gel pores were highly dependent on the Si/Al ratio and the Na/Al ratio (Figure 5).While our experimental data testified that the geopolymer material with a higher strength also showeda better F-T resistance, we also observed the anomalies of the pore structure alterations after F-T loads(Figure 9). These data also raised a question: Why does an MKG material with a coarser pore structureshow better F-T resistance? To address this question, we should understand the roles different poresplayed during freezing.
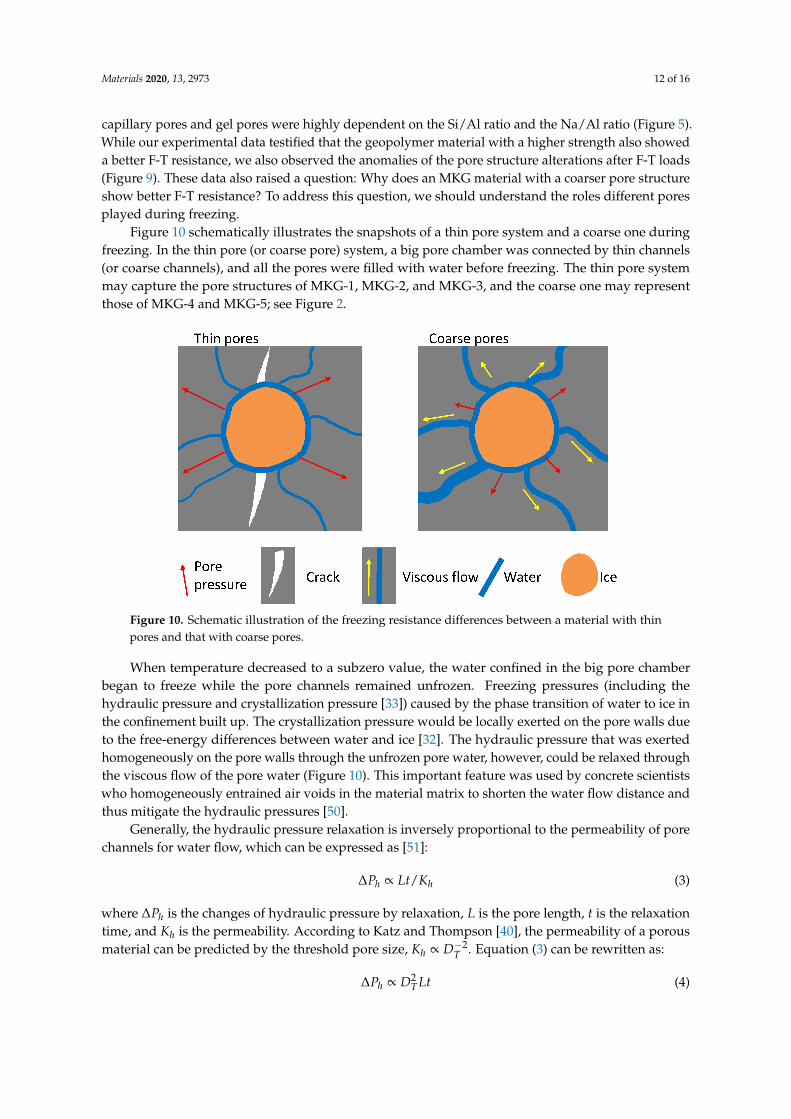
Figure 10 schematically illustrates the snapshots of a thin pore system and a coarse one duringfreezing. In the thin pore (or coarse pore) system, a big pore chamber was connected by thin channels(or coarse channels), and all the pores were filled with water before freezing. The thin pore systemmay capture the pore structures of MKG-1, MKG-2, and MKG-3, and the coarse one may representthose of MKG-4 and MKG-5; see Figure 2.
Figure 10. Schematic illustration of the freezing resistance differences between a material with thinpores and that with coarse pores.
When temperature decreased to a subzero value, the water confined in the big pore chamberbegan to freeze while the pore channels remained unfrozen. Freezing pressures (including thehydraulic pressure and crystallization pressure [33]) caused by the phase transition of water to ice inthe confinement built up. The crystallization pressure would be locally exerted on the pore walls dueto the free-energy differences between water and ice [32]. The hydraulic pressure that was exertedhomogeneously on the pore walls through the unfrozen pore water, however, could be relaxed throughthe viscous flow of the pore water (Figure 10). This important feature was used by concrete scientistswho homogeneously entrained air voids in the material matrix to shorten the water flow distance andthus mitigate the hydraulic pressures [50].
Generally, the hydraulic pressure relaxation is inversely proportional to the permeability of porechannels for water flow, which can be expressed as [51]:
∆Ph ∝ Lt/Kh (3)
where ∆Ph is the changes of hydraulic pressure by relaxation, L is the pore length, t is the relaxationtime, and Kh is the permeability. According to Katz and Thompson [40], the permeability of a porousmaterial can be predicted by the threshold pore size, Kh ∝ D−2
T . Equation (3) can be rewritten as:
∆Ph ∝ D2T Lt (4)
Materials 2020, 13, 2973 13 of 16
or the pore pressure relaxation time t can be expressed as:
t ∝ ∆Ph/LD2T (5)
From Equations (4) and (5), it is easy to understand that less pore pressure relaxation can occur inthe thin-pore system with the same relaxation time, or more time is required to relax the same porepressures. Let us take the pore structure data of MKG-2 and MKG-5 as examples, and assume thatthe ice formation in the big pores accumulated the hydraulic pressures up to 10 MPa, while the porelength L was the same. The MKG-2 mortar required (1049.4/350.1)2 ≈ 9 times longer than MKG-5to relax the hydraulic pressure at 10 MPa according to Equation (5). This may explain why the MKGmaterials with the coarser pore structures showed better F-T resistances.
As the last comment, we should understand that the experimental data provided in this workdid not imply that a material with a coarser pore structure would have better durability. Indeed,to promote the F-T resistance, the homogeneous entertainment of air voids in the material matrixmay be the most effective routine. As shown in Figure 8, the MKG mortars with high F-T resistances(i.e., MKG-4 and MKG-5) contained air voids to accommodate the expelled water and mitigate thehydraulic pressures built by ice formation in the pores. Furthermore, the coarser pores would greatlydecrease the material permeability, which in turn would decrease the resistance against the transportof harmful ions in the materials. Further rigorous pore structure design is required to optimize theproperties of MKG materials before engineering applications.
5. Conclusions
• The MKG mortars with different Si/Al ratios and Na/Al ratios showed different MIP porestructures. Except the first mercury rises, which were identical to the surface fillings of themercury under low pressures showing negligible volume changes, both the capillary pores andgel pores were greatly impacted by the Si/Al ratio and the Na/Al ratio. Increasing both the Si/Alratio and the Na/Al ratio decreased the gel pores, but promoted the capillary pores.
• All the MKG mortars showed relatively high strengths. The strength decreased with increasing thetotal porosity, which roughly followed a linear plot.
• The MKG mortars showed different F-T resistances: MKG-4 > MKG-5 > MKG-1 > MKG-2 = MKG-3.The MKG mortars (MKG-1, MKG-2, and MKG-3) at Na/Al ratios lower than 1.26 all showed seriousF-T damages. Increasing the Na/Al ratio promoted the F-T resistance. F-T loads also caused obviouscracking of MKG-4 and MKG-5.
• MIP tests showed that the pore structures were refined after F-T loads, which was probably causedby the continual curing of the materials. Materials with finer pore structures showed worse F-Tresistances owing to the slower pore pressure relaxation rates.
Author Contributions: All authors contributed equally to this work. All authors read and agreed to the publishedversion of the manuscript.
Funding: This research was funded by National Key R&D Program of China (grant number: 2018YFB0605700),National Natural Science Foundation of China (grant number: 51878602), and international cooperative researchproject from National Natural Science Foundation of China (grant number: 51950410579).
Acknowledgments: The authors acknowledged Yu Peng, Hamed Fazil and Shikun Chen for thoughtfuldiscussions and technique helps.
Conflicts of Interest: The authors declare no conflict of interest.
References
1. Monteiro, P.J.; Miller, S.A.; Horvath, A. Towards sustainable concrete. Nat. Mater. 2017, 16, 698. [CrossRef]2. Duxson, P.; Fernandez-Jimenez, A.; Provis, J.L.; Lukey, G.C.; Palomo, A.; van Deventer, J.S.J. Geopolymer
technology: The current state of the art. J. Mater. Sci. 2007, 42, 2917–2933. [CrossRef]
Materials 2020, 13, 2973 14 of 16
3. Duxson, P.; Provis, J.L.; Lukey, G.C.; van Deventer, J.S.J. The role of inorganic polymer technology in thedevelopment of ‘green concrete’. Cem. Concr. Res. 2007, 37, 1590–1597. [CrossRef]
4. Kastiukas, G.; Ruan, S.; Liang, S.; Zhou, X. Development of precast geopolymer concrete via oven andmicrowave radiation curing with an environmental assessment. J. Clean. Prod. 2020, 255, 120290. [CrossRef]
5. Panda, B.; Ruan, S.; Unluer, C.; Tan, M. nvestigation of the properties of alkali-activated slag mixes involvingthe use of nanoclay and nucleation seeds for 3D printing. Compos. Part B-Eng. 2020, 186, 107826. [CrossRef]
6. Panda, B.; Ruan, S.; Unluer, C.; Tan, M. Improving the 3D printability of high volume fly ash mixtures viathe use of nano attapulgite clay. Compos. Part B-Eng. 2019, 165, 75–83. [CrossRef]
7. Assi, L.N.; Carter, K.; Deaver, E.; Ziehl, P. Review of availability of source materials for geopolymer/sustainable concrete. J. Clean. Prod. 2020, 263, 121477. [CrossRef]
8. El-Gamal, S.M.A.; Selim, F.A. Utilization of some industrial wastes for eco-friendly cement production.Sustain. Mater. Technol. 2017, 12, 9–17. [CrossRef]
9. Bassani, M.; Tefa, L.; Coppola, B.; Palmero, P. Alkali-activation of aggregate fines from construction anddemolition waste: Valorisation in view of road pavement subbase applications. J. Clean. Prod. 2019, 234, 71–84.[CrossRef]
10. Provis, J.L. Geopolymers and other alkali activated materials: Why, how, and what? Mater. Struct. 2014, 47, 11–25.[CrossRef]
11. Rowles, M.; Connor, B.O. Chemical optimization of compressive strength of aluminosilicate geopolymersynthesized by sodium activation of metakaolinite. J. Mater. Chem. 2003 13, 1161–1165. [CrossRef]
12. Kohout, J.; Koutnik, P. Effect of Filler Type on the Thermo-Mechanical Properties of Metakaolinite-BasedGeopolymer Composites. Materials 2020, 13, 2395. [CrossRef] [PubMed]
13. Peng, X.; Shuai, Q.; Li, H.; Ding, Q.; Gu, Y.; Cheng, C.; Xu, Z. Fabrication and fireproofing performance ofthe coal fly ash-metakaolin-based geopolymer foams. Materials 2020, 13, 1750. [CrossRef] [PubMed]
14. Cui, Y.; Gao, K.; Zhang, P. Experimental and statistical study on mechanical characteristics of geopolymerconcrete. Materials 2020, 13, 1651. [CrossRef] [PubMed]
15. Roviello, G.; Chianese, E.; Ferone, C.; Ricciotti, L.; Roviello, V.; Cioffi, R.; Tarallo, O. Hybrid geopolymericfoams for the removal of metallic ions from aqueous waste solutions. Materials 2019, 12, 4091. [CrossRef]
16. White, C.E.; Page, K.; Henson, N.J.; Provis, J.L. In situ synchrotron X-ray pair distribution function analysisof the early stages of gel formation in metakaolin-based geopolymers. Appl. Clay Sci. 2013, 73, 17–25.[CrossRef]
17. Lahoti, M.; Narang, P.; Tan, K.H.; Yang, E. Mix design factors and strength prediction of metakaolin- basedgeopolymer. Ceram. Int. 2017, 43, 11433–11441. [CrossRef]
18. Kubba, Z.; Huseien, G.F.; Sam, A.R.M.; Shah, K.W.; Asaad, M.A.; Ismail, M.; Tahir, M.M.; Mirza, J. Impact ofcuring temperatures and alkaline activators on compressive strength and porosity of ternary blendedgeopolymer mortars. Case Stud. Constr. Mater. 2018, 9, e00205. [CrossRef]
19. Yan, D.; Chen, S.; Zeng, Q.; Xu, S.; Li, H. Correlating the elastic properties of metakaolin-based geopolymerwith its composition. Mater. Des. 2016, 95, 306–318. [CrossRef]
20. Duxson, P.; Provis, J.L.; Lukey, G.C.; Mallicoat, S.W.; Kriven, W.M. Understanding the relationship betweengeopolymer composition, microstructure and mechanical properties. Colloids Surf. A 2005, 269, 47–58. [CrossRef]
21. Sun, P.J.; Wu, H.C. Chemical and freeze-thaw resistance of fly ash-based inorganic mortars. Fuel 2013,111, 740–745. [CrossRef]
22. Topcu. I.B.; Toprak, M.U.; Uygunoglu, T. Durability and microstructure characteristics of alkali activatedcoal bottom ash geopolymer cement. J. Clean. Prod. 2014, 111, 211–217.
23. Zhao, R.; Yuan, Y.; Cheng, Z.; Wen, T.; Li, J.; Li, F.; Ma, Z.J. Freeze-thaw resistance of Class F fly ash-basedgeopolymer concrete. Constr. Build. Mater. 2019, 222, 474–483. [CrossRef]
24. Bocca, P.; Grazzini, A. Mechanical properties and freeze-thaw durability of strengthening mortars. J. Mater.Civ. Eng. 2013, 25, 274–280. [CrossRef]
25. Carpinteri, A.; Grazzini, A.; Lacidogna, G.; Manuello, A. Durability evaluation of reinforced masonry byfatigue tests and acoustic emission technique. Struct. Control Health Monit. 2014, 21, 950–961. [CrossRef]
26. Saez del Bosque, I.F.; Van den Heede, P.; De Belie, N.; Sanchez de Rojas, M.I.; Medina, C. Freeze-thawresistance of concrete containing mixed aggregate and construction and demolition waste-additioned cementin water and de-icing salts. Constr. Build. Mater. 2020, 259, 119772. [CrossRef]

Materials 2020, 13, 2973 15 of 16
27. Huang, S.; Ye, Y.; Cui, X.; Cheng, A.; Liu, G. Theoretical and experimental study of the frost heavingcharacteristics of the saturated sandstone under low temperature. Cold Reg. Sci. Technol. 2020, 74, 103036.[CrossRef]
28. Zeng, Q.; Fen-Chong, T.; Li, K. Freezing behavior of cement pastes saturated with NaCl solution. Constr.Build. Mater. 2014, 59, 99–110. [CrossRef]
29. Zeng, Q.; Fen-Chong, T.; Dangla, P.; Li, K. A study of freezing behavior of cementitious materials byporomechanical approach. Int. J. Solids Struct. 2011, 48, 3267–3273. [CrossRef]
30. Zeng, Q.; Li, K.; Fen-Chong, T. Elastic behavior of saturated porous materials under undrained freezing.Acta Mech. Sin. 2013, 29, 827–835. [CrossRef]
31. Zeng, Q.; Li, K.; Fen-Chong, T. Heterogeneous nucleation of ice from supercooled NaCl solution confined inporous cement paste. J. Cryst. Growth 2015, 409, 1–9. [CrossRef]
32. Scherer, G.W. Crystallization in pores. Cem. Concr. Res. 1999, 29, 1347–1358. [CrossRef]33. Zeng, Q.; Li, K. Quasi-Liquid Layer on Ice and Its Effect on the Confined Freezing of Porous Materials.
Crystals 2019, 9, 250. [CrossRef]34. Engemann, S.; Reichert, H.; Dosch, H.; Bilgram, J.; Honkimaki, V.; Snigirev, A. Interfacial melting of ice in
contact with SiO2. Phys. Rev. Lett. 2004, 92, 205701. [CrossRef] [PubMed]35. Jahnert, S.; Vaca Chavez, F.; Schaumann, G.E.; Schreiber, A.; Schonhoff, M.; Findenegg, G.H. Melting and
freezing of water in cylindrical silica nanopores. Phys. Chem. Chem. Phys. 2008, 10, 6039–6051. [CrossRef][PubMed]
36. Test Code for Hydraulic Concrete; DL/T 5150-2017; The Electric Power Ministry of the People’s Republic ofChina: Beijing, China, 2017.
37. Leóny León, C.A. New perspectives in mercury porosimetry. Adv. Colloid Interface Sci. 1998, 76–77, 341–72.[CrossRef]
38. Washburn, E.W. Note on a method of determining the distribution of pore sizes in a porous material.Proc. Natl. Acad. Sci. USA 1921, 7, 115–116. [CrossRef] [PubMed]
39. Zeng, Q.; Wang, X.; Yang, P.; Wang, J.; Zhou, C. Tracing mercury entrapment in porous cement paste aftermercury intrusion test by X-ray computed tomography and implications for pore structure characterization.Mater. Charact. 2019, 151, 203–215. [CrossRef]
40. Katz, A.J.; Thompson, A.H. Quantitative prediction of permeability in porous rock. Phys. Rev. B 1986,34, 8179. [CrossRef]
41. Zhang, Z.; Scherer, G.W., Evaluation of drying methods by nitrogen adsorption. Cem. Concr. Res. 2019, 120, 13–26.[CrossRef]
42. Diamond, S. Mercury porosimetry: An inappropriate method for the measurement of pore size distributionsin cement-based materials. Cem. Concr. Res. 2000, 30, 1517–1525. [CrossRef]
43. Hasselman, D.P.H.; Fulrath, R.M. Effect of small fraction of spherical porosity on elastic moduli of glass.J. Am. Ceram Soc. 1963, 47, 52–53. [CrossRef]
44. Shi, C. Strength, pore structure and permeability of alkali-activated slag mortars. Cem. Concr. Res. 1996, 26,1789–1799. [CrossRef]
45. Akono, A.T.; Koric, S.; Kriven, W.M. Influence of pore structure on the strength behavior of particle-and fiber-reinforced metakaolin-based geopolymer composites. Cem. Concr. Compos. 2019, 104, 103361.[CrossRef]
46. Balczar, I.; Korim, T.; Dobradi, A. Correlation of strength to apparent porosity of geopolymers—Understandingthrough variations of setting time. Constr. Build. Mater. 2015, 93, 983–988. [CrossRef]
47. Aygormeza, Y.; Canpolat, O.; Al-mashhadani, M.M. Assessment of geopolymer composites durability at oneyear age. J. Build. Eng. 2020, 32, 101453. [CrossRef]
48. Aygormeza, Y.; Canpolat, O.; Al-mashhadani, M.M.; Uysal M. Elevated temperature, freezing-thawingand wetting-drying effects on polypropylene fiber reinforced metakaolin based geopolymer composites.Constr. Build. Mater. 2020, 235, 117502. [CrossRef]
49. Zhao, M.; Zhang, G.; Htet, K.W.; Kwon, M.; Liu, C.; Xu, Y.; Tao, M. Freeze-thaw durability of red mudslurry-class F fly ash-based geopolymer: Effect of curing conditions. Constr. Build. Mater. 2019, 215, 381–390.[CrossRef]

Materials 2020, 13, 2973 16 of 16
50. Sun, Z.H.; Scherer, G.W. Effect of air voids on salt scaling and internal freezing. Cem. Concr. Res. 2010,40, 260–270. [CrossRef]
51. Zhang, D.; Weinbaum, S.; Cowin, S.C. Estimates of the peak pressures in bone pore water. J. Biomech. Eng.1998, 120, 697–703. [CrossRef]
c© 2020 by the authors. Licensee MDPI, Basel, Switzerland. This article is an open accessarticle distributed under the terms and conditions of the Creative Commons Attribution(CC BY) license (http://creativecommons.org/licenses/by/4.0/).