Embed Size (px)
Citation preview

Composite Zirconium Phosphate/PTFE Polymer
Membranes for Application in Direct Hydrocarbon
Fuel Cells
Amani Al-Othman
Thesis submitted to the Faculty of Graduate and Postdoctoral Studies in partial
fulfillment of the requirements for the PhD degree in Chemical and Biological
Engineering
Department of Chemical and Biological Engineering
Faculty of Engineering
University of Ottawa
© Amani Al-Othman, Ottawa, Canada 2012

i
Statement of Contributions of Collaborators and/or Co-Authors
I hereby declare that the work presented here is my own effort and I am the sole
author of this thesis. I am the one who performed all the experiments and the data analyses
under the scientific supervision of Dr. Marten Ternan and Dr. André Tremblay. I have
acknowledged other sources of information and assistance in analyses where applicable.
The editorial and scientific reviews, as well as the comments were provided by my research
project supervisors Dr. Marten Ternan and Dr. André Tremblay.
ii
ABSTRACT
Higher temperature ( 200°C) operation for proton exchange membrane (PEM) fuel
cells would have several advantages including enhanced electrochemical kinetics, useful
heat recovery, and improved catalyst tolerance for contaminants. Conventional
perfluorosulfonic acid membranes (PFSA), such as Nafion show a dramatic decrease in
proton conductivity at temperatures above 80C. For this reason, there has been an
increasing effort toward the development of stable, higher temperature membranes with
acceptable proton conductivity. This work is directed toward the development of Nafion
free membranes for direct hydrocarbon PEM fuel cells containing zirconium phosphate as
the proton conductor component. Hence, composite membranes composed of zirconium-
phosphate (ZrP), a solid proton conductor, which was precipitated within the voids of a
porous polytetraflouroethylene (PTFE) support were synthesized.
Amorphous-like zirconium phosphate (ZrP) powder was synthesized in this work.
ZrP was prepared by precipitation at room temperature via reaction of ZrOCl2 with H3PO4
aqueous solutions. The proton conduction properties of ZrP powder were studied under the
processing conditions found in direct hydrocarbon fuel cell. Our experimental results
showed that the ZrP powder processed at 200°C possess a proton conductivity that is greater
by one order of magnitude than the oven-dried samples at 70°C. Thereby, it was possible to
avoid the normal decrease in conductivity with increasing temperature by having sufficient
water in the vapor phase.
This thesis reports the first synthesis of composite ZrP/PTFE/Glycerol (GLY)
membranes. Glycerol (GLY) was introduced into the pores of PTFE with the ZrP proton
conductive material using the successive wetting/drying technique. These membranes had
reasonable values of proton conductivities (0.045 S cm-1
), approaching that of Nafion (0.1 S
cm-1
) at room temperature. Samples of these composite membranes were processed at the
inlet conditions of a propane fuel cell, at 200°C. Experimental results showed that the
proton conductivity remained almost unchanged.

iii
This thesis also describes and reports the first synthesis of sulphur “S” or silicon, Si–
modified zirconium phosphate (ZrP), porous polytetrafluoethylene (PTFE) and, glycerol
(GLY) composite membranes. It was aimed at the substitution of a minor amount of
phosphorus “P” in the ZrP by (S or Si) in the ZrP to modify the proton conduction
properties. The modification was performed by adding a certain amount of silicic acid or
sulphuric acid into phosphoric acid then proceeding with the precipitation in situ. A high
proton conductivity, of 0.073 S cm-1
,i.e. 73% of that of Nafion, was observed for the Si–
ZrP/PTFE/GLY composite membrane.

iv
RÉSUMÉ
L’opération à haute température (~ 200°C) de piles à combustible avec membrane
échangeuse de protons (PEM) possède plusieurs avantages incluant une amélioration de la
cinétique électrochimique, la récupération de chaleur utile et une tolérance accrue des
catalyseurs vis à vis les contaminants. Les membranes à acide perfluorosulfonique (PFSA)
conventionnelles, tel que le Nafion, démontrent une réduction significative de leur
conductivité protonique lorsqu’elles sont soumises à des températures supérieures à 80 °C.
Pour cette raison, il y a un effort grandissant au développement de membranes plus stables à
haute température et avec une conductivité protonique acceptable. Le présent travail consiste
au développement de membrane sans Nafion pour pile à combustible PEM à hydrocarbure
direct contenant des phosphates de zircon en tant que conducteur protonique. Des
membranes composites à base de phosphates de zircon (ZrP), un conducteur solide,
précipités dans les pores d’une matrice de polytétrafluoroéthylène (PTFE) ont été
synthétisées.
Pour ce travail, une poudre amorphe de phosphate de zirconium (ZrP) a été
synthétisée en précipitant à température ambiante le produit de la réaction entre le ZrOCl2 et
H3PO4 en solution aqueuse. La conductivité protonique des poudres de ZrP a été étudiée aux
mêmes conditions d’opération qu’une pile à combustible à hydrocarbure direct. Les résultats
expérimentaux démontrent que la conductivité protonique du ZrP à 200°C est supérieure à
celle des échantillons séchés au four à 70°C par un ordre de grandeur. Il est ainsi possible
d’éviter la décroissance usuelle de la conductivité lors d’une augmentation de température
en assurant une quantité de vapeur d’eau suffisante.
Cette thèse démontre les premières synthèses de membranes composites à base de
ZrP, de PTFE et de glycérol (GLY). Le glycérol (GLY) a été introduit dans les pores de la
matrice de PTFE avec le matériel conducteur de proton (ZrP) en utilisant une technique de
mouillage/séchage successifs. Ces membranes ont démontré une conductivité protonique
raisonnable et similaire à celle du Nafion à température ambiante (0.1 S cm-1
). La
conductivité protonique s’éleve à 0.045 S cm-1
. Des échantillons de ces membranes
composites ont été testés aux conditions d’opération d’une pile à combustible à base de

v
propane à 200 °C. Les résultats expérimentaux ont démontré que leur conductivité
protonique est restée pratiquement inchangée.
Enfin, cette thèse décrit aussi les premières synthèses de membranes composites de
phosphate de zircon (ZrP), de polytétrafluoroéthylène (PTFE) et de glycérol (GLY)
modifiées avec du souffre ou du silicium. L’objectif était de remplacer une fraction du
phosphore dans le ZrP par du souffre ou du silicium afin de modifier la conductivité
protonique des membranes composites. La modification a été effectuée en mélangeant une
petite quantité d’acide silicique ou sulfurique à l’acide phosphorique suivie d’une
précipitation in-situ. Une haute conductivité protonique, 0.073 S cm-1
, c’est à dire 73% de
celle du Nafion, a été démontrée pour la membrane composite de Si-ZrP/PTFE/GLY.

vi
“Glory to You (O Lord), knowledge we have none, except what You have taught us. Verily,
it is You are, the all-knower and the all-wise”
Quraan, 2:32.

vii
ACKNOWLEDGMENTS
To begin with, I would like to express my sincere gratitude to my thesis supervisors Dr.
Marten Ternan and Dr. André Tremblay for their guidance and endless support during my
work on this research project. Their positive feedback, enthusiasm, innovative ideas and
constructive criticism had a remarkable influence on me during the past five years of my
life.
I would like to thank my mentor and my friend, Dr. Chris Gardner, for the time he spent in
teaching me how to use the various electrochemical devices in the laboratory and, for
sharing me with some of his broad experience in the field of fuel cells research. I also wish
to thank Dr. Wendy Pell, Dr. Sadok Latief and Dr. Hamid Khakdaman for the useful
discussions and feedback.
I would like to express my gratitude to the technical staff in the department of chemical and
biological engineering: Louis Tremblay, Gerard Nina, and, Franco Ziroldo for the enormous
effort provided in building the experimental setup, the prompt assistance whenever I needed
throughout my experimental coursework and for being such good friends.
I wish to thank my friends in the department of chemical engineering for the constructive
discussions, good company and the friendly environment created, that made the research
process much more enjoyable to me. Special thanks to my dear friend Joanne for her
impeccable sense of humor. Many thanks to Patrick Plouffe, for the time and effort he put
in translating the abstract of this thesis into French.
I want to say thank you very much to my dear husband, Muhammad, for his endless support,
patience and love in the past 10 years, and to my children Omar Alfarooq and Farah for
lighting up my life. I also wish to thank my sisters and my brothers for their love, support
and their sense of humor. Very warm thanks to my childhood friends, Neda, and Noor who
were always with me, during my frustrating and wonderful times.

viii
I would like to take this opportunity to express my heartfelt gratitude and appreciation to all
those who have touched and contributed to my life in the past years.
Last and foremost, I wish to thank my parents for their nonstop love and support as a child
and as a grown-up woman to become what I am now. I wish to thank them for their never-
ending encouragement during this journey of learning, and to you father and mother, I
dedicate this thesis.

ix
TABLE OF CONTENTS
Statement of Contributions of Collaborators and/or Co-Authors ............................................. i
ABSTRACT ............................................................................................................................ ii
RÉSUMÉ ................................................................................................................................ iv
ACKNOWLEDGMENTS ..................................................................................................... vii
LIST OF FIGURES .............................................................................................................. xiii
LIST OF TABLES ............................................................................................................... xvii
LIST OF UNITS, CHEMICAL FORMULAS AND ABBREVIATIONS ........................ xviii
Chapter 1- Introduction ............................................................................................................ 2
1. 1 Research objectives ...................................................................................................... 4
1.2. Thesis structure and organization ................................................................................. 7
1.3. References ..................................................................................................................... 7
Chapter 2- Polymer electrolyte membrane fuel cells (PEM) and direct hydrocarbon fuel cells
................................................................................................................................................. 9
2.1 Fuel cell performance .................................................................................................. 11
2.2 High temperature membranes ...................................................................................... 12
2.2.1 Motivation for higher temperature operation of PEM fuel cells .......................... 12
2.3 Approaches to higher temperature membranes ........................................................... 13
2.4 Zirconium hydrogen phosphate Zr(HPO4)2 (ZrP) and ZrP- PTFE composite
membranes ......................................................................................................................... 14
2.5 References .................................................................................................................... 16
Chapter 3- Zirconium phosphate as the proton conducting material in direct hydrocarbon
PEM fuel cells operating above the boiling point of water ................................................... 21
ABSTRACT ...................................................................................................................... 21

x
3.1. Introduction ................................................................................................................. 21
3.2. Experimental ............................................................................................................... 23
3.2.1 Preparation and characterization of zirconium phosphate powder (ZrP) ............. 23
3.2.2 Conductivity measurements (electrochemical impedance spectroscopy EIS) ..... 24
3.2.3 Samples characterization ...................................................................................... 26
3.3. Results and Discussion ............................................................................................... 26
3.3.1 Conductivity measurement ................................................................................... 26
3.3.2 Thermo-gravimetric analysis ................................................................................ 30
3.3.3 X-Ray diffraction results ...................................................................................... 31
3.3.4 Analysis of the TGA data ..................................................................................... 32
3.3.5 Quantitative water content of ZrP ......................................................................... 35
3.4. Conclusions................................................................................................................. 37
3.5. Acknowledgments ...................................................................................................... 37
3.6. References ................................................................................................................... 38
Chapter 4-The effect of glycerol on the conductivity of Nafion-free ZrP/PTFE composite
membrane electrolytes for direct hydrocarbon fuel cells ...................................................... 41
ABSTRACT ...................................................................................................................... 41
4.1. Introduction ................................................................................................................. 41
4.2. Experimental ............................................................................................................... 44
4.2.1. Synthesis of a ZrP – PTFE composite membrane ............................................... 44
4.2.2. Synthesis of a glycerol / PTFE membrane .......................................................... 46
4.2.3. Investigation of the composite membranes proton conductivity ......................... 46
4.2.4. Characterization techniques: scanning electron microscopy (SEM) and energy
dispersive X-ray spectroscopy ....................................................................................... 47
4.3. Experimental results ................................................................................................... 47
4.3.1 Membrane morphology studies ............................................................................ 47

xi
4.3.2. Effect of glycerol on conductivity in films of PTFE ........................................... 54
4.4. Conclusions................................................................................................................. 62
4.5 Acknowledgments ....................................................................................................... 63
4.6 References .................................................................................................................... 63
Chapter 5- A modified silicic acid (Si) and sulphuric acid (S) –ZrP/PTFE/Glycerol
composite membrane for high temperature direct hydrocarbon fuel cells ............................ 67
ABSTRACT ...................................................................................................................... 67
5.1 Introduction ............................................................................................................. 67
5.2. Experimental ............................................................................................................... 70
5.2.1. Synthesis of S - ZrP /PTFE/Glycerol and Si-ZrP/PTFE/Glycerol composite
membranes ..................................................................................................................... 70
5.2.2. Characterization of the S- ZrP /PTFE/Glycerol and Si- ZrP/PTFE/Glycerol
composite membranes ................................................................................................... 71
5.3. Experimental results ................................................................................................... 72
5.3.1 SEM observations and morphology studies of composite membranes ................ 72
5.3.2. Proton conductivity of the Si–ZrP /PTFE/GLY and S –ZrP /PTFE/GLY
composite membranes ................................................................................................... 77
5.3.3. FT-IR spectroscopy study .................................................................................... 84
5.3.4. X-Ray diffraction (XRD) studies ......................................................................... 86
5.4 Discussion of results .................................................................................................... 89
5. 5 Conclusions................................................................................................................. 90
5.6 Acknowledgments ....................................................................................................... 91
5.7 References .................................................................................................................... 92
Chapter 6 - General discussion .............................................................................................. 96
6.1 Investigation of Zr(HPO4)2.H2O (ZrP) ........................................................................ 97
6.2 Synthesis of ZrP/PTFE/GLY composite membranes .................................................. 98

xii
6.3 Substitution of a minority component for phosphorus .............................................. 100
6.4. References ................................................................................................................. 102
CONCLUSIONS ................................................................................................................. 104
CONTRIBUTIONS TO ORIGINAL KNOWLEDGE ........................................................ 107
RECOMMENDATIONS FOR FUTURE WORK .............................................................. 110
APPENDIX A ...................................................................................................................... 111
A-1 Direct hydrocarbon oxidation process flow sheet, fuel cell and, fuel cell test station.
......................................................................................................................................... 112
A-2 Groove depth calculations ........................................................................................ 116
A-3: DHFC test station–start up procedure ..................................................................... 119
APPENDIX B ...................................................................................................................... 134
Appendix B: Review of the techniques previously used to prepare ZrP/PTFE composites-
morphology studies .......................................................................................................... 135

xiii
LIST OF FIGURES
Chapter One
Fig. 1. Schematic diagram of a PEM fuel cell ……………………………….......3
Chapter Three
Fig. 1. H2O partial pressure experiment equipment .............................................................. 24
Fig. 2. Impedance spectroscopy cell. ..................................................................................... 25
Fig. 3. Nyquist plot for ZrP samples (ZrP powder dried at 70 ◦C in laboratory air; ZrP
powder dried at 200 ◦C in laboratory air; and ZrP powder dried first at 70 ◦C in laboratory
air and then processed at 200 ◦C in a tube furnace with continuous H2O injection at
anH2O/N2 molar ratio of 6, the stoichiometric ratio in the direct propane fuel cell reaction).
............................................................................................................................................... 27
Fig. 4. TGA data for the ZrP sample that was previously dried at 70 ◦C and was subjected to
water injection at 200 ◦C. [Heat flow values (Wg
−1) were divided by −1000 to match the
scale of the other two plots: (a) dW/dt (mg min−1
) and (b) weight (mg).] ............................ 30
Fig. 5. XRD pattern for ZrP samples dried in laboratory air at 70, 110 and 200 ◦C
respectively plus a ZrP sample that was calcined at 1100 ◦C for 1 h..................................... 32
Fig. 6. The agreement between the TGA experimental data (solid diamonds) and the values
calculated using Eq. (4). ........................................................................................................ 34
Fig. 7. TGA data fitting for ZrP samples dried at 70, 110 and 200 ◦C in the oven plus ZrP at
200 ◦C with H2O injection (200
◦C–wet). .............................................................................. 35

xiv
Chapter Four
Fig . 1. Membrane synthesis set-up. .............................................................................................. 45
Fig . 2. Scanning electron microscopy (SEM) images for; (a) top view of the Sterlitech
PTFE (Teflon) film as received and (b) top view of a ZrP-PTFE composite membrane
prepared without the use of glycerol. ............................................................................................ 48
Fig . 3. Scanning electron microscopy (SEM) images for: Top view of a ZrP – PTFE
membrane prepared with a GLY/ZrP mass ratio of 0.4, having magnifications of (a) 1900
and (b) 5000. .................................................................................................................................. 49
Fig . 4. SEM image for a cross sectional view of ZrP – PTFE membrane prepared with a
GLY/ZrP mass ratio of 0.4 at different magnifications. ................................................................ 50
Fig . 5. SEM image for; (a) cross sectional view of ZrP – PTFE membrane prepared with a
GLY/ZrP mass ratio of 0.4 and (b) same image but using the composition analysis (COMPO
feature) in SEM. ............................................................................................................................. 51
Fig . 6. A top view SEM image of a ZrP – PTFE composite membrane prepared with a
GLY/ZrP mass ratio of 0.8. (a) two distinct regions in the same range, an upper region of
ZrP particles and a lower region of empty pores, (b) and (f) ZrP particles at greater
magnifications, (e) a large agglomerate of ZrP on top of the ZrP particles, (c) and (d) empty
pores at greater magnifications showing the presence of a fluid-like material (glycerol)
adhering to the strands of PTFE. ................................................................................................... 53
Fig . 7. Electrochemical impedance spectroscopy pattern for a porous Sterlitech PTFE films
containing specified GLY/ PTFE mass ratios. .............................................................................. 55
Fig . 8. Electrochemical impedance spectroscopy pattern for a ZrP –PTFE composite
membrane that did not contain glycerol. ....................................................................................... 57

xv
Fig . 9. Electrochemical impedance spectroscopy pattern for a ZrP –PTFE composite
membrane having a Glycerol / ZrP mass ratio of 0.4. ................................................................... 58
Fig . 10. Electrochemical impedance spectroscopy pattern for a ZrP –PTFE composite
membrane having a Glycerol / ZrP mass ratio of 0.8. ................................................................... 58
Fig . 11. Change of proton conductivity (σ) S cm-1
with glycerol /ZrP mass ratio in the
composite membrane. .................................................................................................................... 59
Chapter Five
Fig . 1. SEM images for composite membranes, all at a GLY/ZrP mass ratio of 0.4. (a) an
unmodified ZrP/PTFE/GLY membrane, (b) Si- ZrP/PTFE/GLY membrane with an Si/P
mass ratio of 0.004 and (c) a S-ZrP/PTFE/GLY membrane at a S/P mass ratio of 0.004. ............ 73
Fig . 2. SEM images for a ZrP/PTFE/GLY composite membranes, all at a GLY/ZrP mass
ratio of 0.2., variable Si/P mass ratios, (a) ZrP/PTFE/GLY membrane (Si/P=0.0), (b) Si-
ZrP/PTFE/GLY membrane Si/P = 0.004 (silicic acid is completely dissolved in phosphoric
acid) ,(c) Si–ZrP/PTFE/GLY at Si/P = 0.01 some silicic acid is in suspension in phosphoric
acid, (d) and (e) are for Si–ZrP/PTFE/GLY at an Si/P = 0.02, some silicic acid is in
suspension in phosphoric acid ....................................................................................................... 75
Fig . 3. SEM images for an Si– ZrP/PTFE/GLY composite membrane, at a GLY/ZrP mass
ratio of 0.2. and an Si/P mass ratio of 0.01 (some silicic acid is in suspension in the
phosphoric acid) (a) and (b) are top view images. (c) and (d) are cross-sectional view
images obtained by freeze-fracture. Edges of the membrane are indicated by the arrows in
image (c). ....................................................................................................................................... 76

xvi
Fig . 4. Electrochemical impedance spectroscopy pattern for an unmodified ZrP/PTFE/GLY
membrane and an Si–ZrP/PTFE/GLY composite membrane, both at a GLY/ZrP mass ratio
of 0.2, and Si/P mass ratio of 0.004 in the phosphoric acid–silicic acid (solution). ...................... 78
Fig . 5. Electrochemical impedance spectroscopy pattern for an unmodified ZrP/PTFE/GLY
membrane and a S–ZrP/PTFE/GLY composite membrane, both at a GLY/ZrP mass ratio of
0.4, and S/P mass ratio of 0.004 in the phosphoric acid–silicic acid solution. .............................. 79
Fig . 6. A comparison between the three types of membranes, the ZrP/PTFE/GLY, the Si-
ZrP/PTFE/GLY and the S-ZrP/PTFE/GLY in terms of proton conductivity. All were
prepared at a GLY/ZrP mass ratio of 0.4 and Si/P, or S/P mass ratio of 0.004 in the acid
solution. ......................................................................................................................................... 80
Fig . 7. Change of proton conductivity (σ) S cm-1
versus glycerol GLY) /ZrP mass ratio.
Open circles present the unmodified ZrP/PTFE/GLY composite membranes. Triangles:
represent the Si-ZrP/PTFE/GLY composite membranes, Si/P mass ratio = 0.004 (silicic acid
was completely soluble). Solid symbols represent the 200 ºC wet test result of proton
conductivity (σ) S cm-1
. Diamond symbols represent the Si-ZrP/PTFE/GLY composite
membrane, Si/P mass ratio = 0.01 (some silicic acid was in the form of suspended particles). ... 82
Fig . 8. Change of proton conductivity (σ) with the Si/P mass ratio for the Si-
ZrP/PTFE/GLY membrane at constant GLY/ZrP mass ratio of 0.2. (Si/P mass ratios larger
than 0.004 contained insoluble portion of silicic acid in H3PO4 as indicated by the dashed
line). ............................................................................................................................................... 84
Fig . 9. FT-IR spectra of composite membranes, ZrP/PTFE/GLY, Si-ZrP/PTFE/GLY and S-
ZrP/PTFE/GLY , all at GLY/ZrP mass ratio of 0.4, Si/P and S/P mass ratios of 0.004. .............. 86

xvii
Fig . 10. XRD pattern for ZrP/PTFE/GLY and Si-ZrP/PTFE/GLY composite membranes at
variable GLY/ZrP and Si/P mass ratios as labeled. ....................................................................... 87
Fig . 11. XRD pattern for ZrP/PTFE/GLY and Si-ZrP/PTFE/GLY composite membranes at
GLY/ZrP=0.2 and Si/P mass ratios as labeled, compared with the XRD pattern for a ZrP
powder oven dried at 70 C. .......................................................................................................... 88
LIST OF TABLES
Chapter Three
Table1: Experimental conductivity values as a function of processing conditions………...28
Table 2: Conductivity values reported in the literature [S cm-1
] ………………..…………………..29
Table 3: Experimental conductivity values as a function of the material’s processing conditions...33
Chapter Four
Table 1: Resistances of PTFE films containing glycerol………………………………… 55
Table 2: Summary of conductivity results………………………………………………….61
xviii
LIST OF UNITS, CHEMICAL FORMULAS AND ABBREVIATIONS
A Ampere
R Resistance (Ohm)
S cm-1
Siemens per centimeter
σ Proton conductivity ( S cm-1
)
………………………………..
DPFC Direct propane fuel cells
GLY Glycerol
H3PO4 Phosphoric acid
H2SO4 Sulphuric acid
PEMFC Polymer electrolyte fuel cells
PTFE Polytetrafluoroethylene
SiO2.H2O Silicic acid
Zr(HPO4)2 ZrP or Zirconium phosphate
ZrOCl2.8H2O Zirconium oxychloride octahydrate
…………………………………
EIS Electrochemical impedance spectroscopy
FTIR Fourier transform infrared spectroscopy
SEM Scanning electron microscopy
TGA Thermo–gravimetric analysis
XRD X-Ray diffraction

1
CHAPTER ONE - INTRODUCTION

2
Chapter 1- Introduction
Fuel cells were first described in 1839 by an English judge and a physicist, William
Grove [1]. They are electro-chemical devices that convert the chemical energy stored in a
fuel into electrical energy. Fuel cells are considered to be one of the promising technologies
for efficient power generation. Although several types of fuel cells have been developed
over the past 170 years of research, polymer electrolyte membrane fuel cells (PEMFC’s) are
currently receiving the most interest. Fuel cells are similar to the battery in that they
produce electrical energy. They are unlike batteries in that, the reactants are continuously
supplied and products are continuously removed. The most common types of fuels being
used in PEM fuel cells are either methanol or hydrogen (derived from hydrocarbons). The
fuels can be supplied continuously at the anode, whereas the oxidant (such as oxygen in air)
can be continuously supplied at the cathode.
PEM fuel cells consist of two compartments, anodic and cathodic, separated by a proton
exchange membrane. A schematic diagram of a PEM fuel cell is shown in Fig.1. The fuel
(e.g. hydrogen) is fed to the anode, where it is oxidized to generate protons and electrons.
Electrons flow in an external circuit to the cathode, resulting in direct electrical current.
Protons diffuse through the proton exchange membrane to reach the cathode. The
membrane is a proton conducting material. It only allows the passage of protons from the
anode to the cathode. The combination of, diffusion of protons to the cathode and, the
electron flow completes the electric circuit. The oxidant (air or pure oxygen) is fed to the
cathode. Oxygen is reduced by the electrons flowing externally from the anode, to form O2-
.
Then, O2-
combines with protons to form water.
Nafion is, by far, the most widely used membrane in PEMFC. Nafion was initially
developed by Dupont in the 1960’s [2]. This membrane performs quite well below 90 C
and under fully hydrated conditions, thus, PEMFC are usually operated at temperatures
below 90 °C with pressures between 1 and 5 bar. Nafion consists of a fluorinated backbone
and a sulfonated polyether chain. Hence, Nafion’s good chemical and mechanical stability
properties are due to the perfluorinated main chain [3]. The proton conductivity of this
membrane is strongly dependent on the water content that is needed to solvate the proton of

3
the sulfonic acid groups. Dehydration of Nafion membranes limits the operation of a PEM
fuel cell to temperatures below 100 C at ambient pressure.
Fig. 1. Schematic Diagram of a PEM Fuel Cell.
High temperature operation is preferred in PEM fuel cells for several reasons. The
reaction kinetics and the catalytic activity for both electrodes are enhanced at higher
temperatures. High temperature operation also reduces the poisoning effect of the expensive
catalyst (platinum) by fuel impurities such as carbon monoxide (CO), permitting a wider
range of fuels to be used in addition to pure hydrogen. Extensive research efforts have been
made to develop new membrane materials that can operate well at elevated temperatures and
low hydration levels. For a membrane to be good for high temperature operation, it should
have the characteristics of reasonable and/or high proton conductivity (preferably > 0.1
S/cm), good thermal and chemical stability and a low cost.
Hydrocarbons are desirable fuels for PEM fuel cells despite the fact that most PEM
fuel cells currently operate using hydrogen or methanol. Hydrocarbons have several
advantages including: higher energy storage density, global availability and, ease of
transportation. The well established infrastructure made it possible to use hydrocarbons
4
(propane for rural areas and methane for urban areas) as fuel. Hydrocarbon fuel cells have
been proposed for the application in rural locations where electricity is needed in modest
quantities to meet residential demands. Liquefied petroleum gas (LPG or propane) is
distributed via trucks to rural locations in North America and natural gas is distributed by
pipelines in urban locations. If hydrocarbons are directly fed to the anode of the fuel cell,
then the capital cost of using a PEM fuel cell will be lowered by 30% due to the elimination
of the fuel processor unit used to make hydrogen or methanol. Although the advantages of
hydrocarbons are substantial, they do have one major disadvantage. Reaction rates (fuel cell
current densities) are extremely small. This work is an attempt to improve reaction rates by
high temperature operation. As a result, the development of high temperature membranes is
the subject of this thesis.
Despite all the breakthroughs achieved in the field of PEM fuel cells research, their
penetration into the market is still limited. PEM fuel cells that operate on hydrogen or
methanol are very expensive and this originates from the contribution of different
components, mainly the cost of the membrane and the cost of the catalyst (a precious metal,
platinum). Consequently, there is an immense effort on the development of both membranes
and catalysts. These efforts have so far, achieved moderate success. In particular,
improvements were achieved by: 1) the reduction of the precious metal catalyst (Pt) loading
and, 2) by the development of alternative materials for Nafion.
1. 1 Research objectives
The principal objective of this research project was to study, develop and
synthesize a Nafion–free high temperature composite membrane composed of porous
polytetrafluoroethylene (PTFE) support and zirconium phosphate (ZrP), a solid
proton conductor.
A fuel cell membrane should possess the mechanical integrity in addition to the
reasonable proton conductivity. A composite membrane was synthesized, made of
zirconium phosphate (ZrP), the proton conducting material, incorporated within the porous

5
polytetrafluoroethylene (PTFE) support material by an in-situ precipitation reaction. Thus,
the composite membrane had the dual characteristics of (1) ZrP as a proton conductor and
(2) the thermal stability of PTFE up 260 C as a support. This type of high temperature
membrane was synthesized and evaluated for its proton conduction properties at conditions
representative of a direct hydrocarbon PEM fuel cell, operating at temperatures ~ 200 C. A
process flow sheet for the electro-oxidation of propane was prepared and a complete fuel
cell test station was built for the purpose of preparing and testing membrane electrode
assemblies (MEA’s). Testing and diagnosis have been performed and a detailed description
of the process flow sheet and fuel cell test station development are provided in appendix A
of this thesis.
A sub–objective of this research project was to study and evaluate the proton
conducting properties of zirconium phosphate as a possible high temperature
electrolyte material for PEM fuel cells.
Experiments were performed to prepare ZrP powder via the precipitation reaction of
zirconium oxychloride and phosphoric acid at room temperature. The ZrP powder was then
dried / processed at different conditions. The ZrP samples were then analyzed and studied
using various techniques such as X-Ray diffraction (XRD), Thermogravimetric Analysis
(TGA) and evaluated for their proton conducting properties using a four probe
electrochemical impedance spectroscopy (EIS) technique.
Another sub–objective of this research project was to synthesize the composite
ZrP/PTFE membrane and improve its proton conductivity.
Once the characteristics of ZrP as a proton conducting material were studied and
evaluated, experiments were performed to synthesize the ZrP/PTFE composite membrane.
Nafion-free ZrP/PTFE/GLY composite membranes were synthesized and investigated as
proton conductors for the first time in this research project. The proton conductor powder,
ZrP, needed the support from a mechanically integrated membrane. Porous PTFE provided

6
the mechanical support. Therefore, ZrP was precipitated in such a way that completely
filled the pores of PTFE. Thus, completing the path for protons to hop and reach the
cathode. The early experimental attempts performed to synthesize the composite membrane
along with the preliminary experimental results are shown in Appendix B of this thesis.
Zirconium oxychloride and glycerol (GLY) were introduced into the pores of PTFE
first, followed by the addition of phosphoric acid to perform the precipitation reaction, and,
forming ZrP in-situ. After the ZrP/PTFE/GLY composite membranes were synthesized,
they were evaluated using several techniques such as XRD, EIS, Fourier Transform Infrared
spectroscopy (FTIR) and Scanning Electron Microscopy (SEM). Most importantly,
composite membranes were evaluated for proton conductivity and for the coverage of PTFE
by the ZrP material.
A third sub–objective of this research project was to form S and Si–modified
ZrP/PTFE/GLY membranes. Then, the proton conducting properties of these modified
composite membranes were evaluated.
Modified sulphur “S” or silicon “Si”, Si–ZrP/PTFE/GLY composite membranes
were synthesized and investigated for the first time in this thesis. Composite membranes
were modified using silicic acid or sulphuric acid that was added to phosphoric acid prior to
the in-situ precipitation reaction. The S or Si-ZrP/PTFE/GLY composite membranes were
synthesized and evaluated using several techniques such as XRD, EIS, Fourier Transform
Infrared spectroscopy (FTIR) and Scanning Electron Microscopy (SEM). Most importantly,
composite membranes were evaluated for their proton conductivity and the coverage of
PTFE by the ZrP material.

7
1.2. Thesis structure and organization
This thesis is composed of eight chapters. The current one is the thesis introduction.
Chapter two presents the background to this research project. Chapters three and four are
independent scientific articles that were published in a refereed scientific journal. Therefore,
each one of them can be read independently. Chapter five is to be submitted as a scientific
article in a refereed scientific journal. Therefore, throughout these chapters, the common
ideas, experimental procedures and the project core problem has been reiterated where
applicable. Chapter six contains a general discussion that summarizes the ideas and
integrates the results of chapters three, four and, five. The contributions, conclusions, and
recommendations that resulted from the entire thesis are presented in chapters seven and
eight. The development of a direct hydrocarbon fuel cell test station and the preliminary
experimental investigations on the synthesis of the composite membrane are shown in
Appendix A and B of this thesis.
1.3. References
1. G. Hoogers, “Fuel cell technology handbook” , CRC press LLC, USA 2003, p. 2-
37.
2. P. Costamagna, S. Srinivasan, J. Power Sources, 102, 2001, p.242.
3. S. Banerjee, D. E. Curtin, J. Flour. Chem., 125, 2004, p.1211.

8
CHAPTER TWO – LITERATURE REVIEW

9
Chapter 2- Polymer electrolyte membrane fuel cells (PEM) and direct
hydrocarbon fuel cells
Fuel cells are classified by their electrolyte material. Hence, they are divided into
the following categories: alkaline, phosphoric acid, solid oxide, molten carbonate, and
proton exchange membrane or polymer electrolyte membrane (PEM) fuel cells. PEM fuel
cells show good performance as power generators for both stationary and transportation
applications. Their all-solid construction (solid electrolyte) makes them perfect for many
applications.
PEM fuel cells can be further categorized based on the fuel that is used, hydrogen
fuel cells, direct methanol fuel cells, or hydrocarbon fuel cells. Both hydrogen and methanol
fuels provide excellent fuel cell performance. The performance of hydrocarbons was
investigated in the 1960’s. Although their performance is poor, direct hydrocarbon fuel cells
have a theoretically higher efficiency, potentially lower initial cost and lower maintenance
cost. These characteristics are motivations for more research.
The direct oxidation of hydrocarbons was addressed in several studies during the
1960’s and early 1970’s [1-4]. The direct anodic oxidation of the hydrocarbon fuel can
occur without the need for a fuel processor unit which accounts for one third of the fuel cell
capital cost. In particular, the direct oxidation of hydrocarbon fuels in the presence of
aqueous electrolytes and at temperatures less than 200 °C [5] was studied. More
experiments were conducted to study the anodic oxidation of saturated hydrocarbon fuel
cells using strong acids [6]. These studies concluded that no economical construction could
be achieved due to the hydrocarbons limited anodic performance and the use of aqueous
electrolytes.
The investigations using solid polymer electrolytes also began in 1960’s. Niedrach
for instance [7] investigated the oxidation behavior of hydrocarbons, such as propane and
methane using a solid acid electrolyte based on reinforced sulfonated phenol formaldehyde
resin. Neidrach used black platinum (Pt) or palladium (Pd) electrodes. The results

10
compared the performances of the two catalysts Pt and Pd, and Pt showed better
performance at an oxidation current density of (less than 2 mA/cm2) at 0.2 V.
Recently, a few computational fluid dynamics (CFD) studies were reported in
literature to model the direct hydrocarbon fuel cell performance. Psofogiannakis et.al. [8]
showed in a CFD model of a direct propane fuel cell that the over potential at the anode
catalyst was the largest resistance. Khakdaman et.al [9] developed a two–dimensional CFD
model for a direct propane fuel cell anode. The modeling results showed an improved
anodic over–potential (one third less resistance obtained) at 150 ºC with zirconium
phosphate (ZrP) as an electrolyte and platinum (Pt) as a catalyst. Khakdaman et.al [10] have
also developed a two–dimensional CFD model to describe the performance of a complete
direct propane fuel cell. The model prediction results showed that the performance of a
direct propane fuel cell with a ZrP-PTFE composite membrane, at 150 ºC, was comparable
to that obtained with Nafion and aqueous phosphoric acid electrolytes.
The electro-oxidation reactions taking place in a direct hydrocarbon fuel cell are
described below, using propane as an example. Propane (C3H8) reacts at the anode as
follows [9]:
C3H8 + 6 H2O = 3 CO2 + 20 H+ + 20 e
–1 (1)
It can be seen that six moles of water are consumed per one mole of propane reacted.
Oxygen or air enters the cathode, and the following reaction takes place:
5 O2 + 20 H+
+ 20 e–1
= 10 H2O (2)
The overall reaction is: C3H8 + 5 O2 = 3 CO2 + 4 H2O (3)
The experimental performance of a direct hydrocarbon fuel cell was addressed in
several studies. Savadogo et. el., [11] for example, studied the low temperature performance
of a direct propane fuel cell (DPFC) using different membranes including Nafion 117,
H2SO4 doped PBI, STA (silicotungstic acid), and modified Nafion 117. The study
compared the performance of these membranes to an H2/O2 fuel cell with a Nafion 117
membrane. Savadogo’s results showed that DPFC produced small current densities, and,

11
compared to the H2/O2 fuel cell, DPFC with Nafion 117 showed the poorest performance.
Savadogo et. al. [12], also studied the electro-oxidation of acetals for the purpose of
hydrocarbon fuel cell applications using different electrodes. The results showed that the
highest rate of reaction (current density) was obtained with the platinum based electrodes.
Studies on hydrocarbon oxidation behavior reported the problems associated with
using hydrocarbon fuels in PEM fuel cells at temperatures less than 120 C. These problems
included their poor electro-catalytic activity, the poisoning effect due to the adsorption of
carbon monoxide (CO) on the precious metal (Pt) catalyst, and, the high degree of
hydrocarbons cross over through the Nafion membrane [12]. It is therefore expected that
high temperature operation (200C) should be beneficial for the hydrocarbon fuel cell
performance in several ways. It will improve the reaction rate (current density) of the
electro-catalytic process, and suppress the carbon monoxide, CO, adsorption on the catalyst.
Furthermore, liquid phase water will be eliminated, thus, more rapid diffusion of reactants
should be achieved.
2.1 Fuel cell performance
The performance of a PEM fuel cell can be evaluated by obtaining a polarization
curve [13]. In this curve the cell potential (V) is plotted versus the cell current density
(A/cm2). The polarization curve shows the current densities at which polarizations (losses)
cause a drop in potential. The actual cell potential decreases from its equilibrium potential
due to physical and chemical phenomena taking place inside the fuel cell. These phenomena
cause a loss of performance and can be attributed to, 1) kinetic losses (region of activation
polarization), 2) ohmic losses (region of ohmic polarization) and, 3) mass transport losses
(concentration polarization).
The activation polarization is the result of the electrode surface processes including
adsorption, surface diffusion, reaction and, desorption. The ohmic polarization is caused by
the resistance to the flow of electrons in the cell components including the flow in the
graphite plates and external wires as well as the flow of protons in the electrolyte. The
largest ohmic polarization is caused by the resistance of proton transport in the membrane.

12
The concentration polarization is attributed to the reactants diffusion into, and product
diffusion from the anode and the cathode. This resistance can be very large at high current
densities when liquid water floods the pore structure of the cathode.
2.2 High temperature membranes
The membrane in a fuel cell serves many purposes. It is the electrolyte material
that provides the ionic (proton conduction) between the anode and the cathode. The
membrane is also the selective conductor for protons and an insulator for electrons. The
fuel cell membrane acts as a separator between the anode fuel and the cathode oxidant to
prevent their cross over and mixing thus, preventing any resulting combustion reaction.
Nafion and perfluorosulfonic acid (PFSA) proton exchange membranes have been
widely used due to their excellent proton conductivity and electrochemical stability. They
were developed in the late 1960s by Walther Grot of DuPont [14]. Nafion membranes are
durable under fully hydrated conditions and at temperatures 80 º C. However, their
conductivity and stability dramatically decrease at higher temperatures and the high
temperature operation of PEM fuel cells is a desired target.
2.2.1 Motivation for higher temperature operation of PEM fuel cells
High temperature operation allows the generation and the recovery of useful heat and
reduces the problems associated with liquid water accumulation at the cathode. The
reduction of liquid phase water assists in increasing the exposed surface area of the catalyst
allowing more molecules to diffuse into the reaction sites. It also diminishes corrosion rates.
Higher temperature operation also improves cell tolerance for impurities such as carbon
monoxide (CO), which permits the use of a wider range of fuels. Small amounts of CO as
low as 10 ppm can poison the catalyst [15]. It was previously shown that the CO coverage
on the catalyst surface can be reduced by increasing the temperature [16]. A study
performed using platinum based catalysts showed that these catalysts can tolerate up to 1000
ppm CO at 130°C [17].

13
All the previous reasons are incentives for working at higher temperatures. Nafion
and similar PEM’s are unlikely to fulfill this target because proton conduction in these
membranes is dependent on their hydration levels. Nafion loses its conductivity due to
water loss (dehydration). For example, Nafion conductivity decreases from 0.066 to
0.00014 S/cm at 30°C when the relative humidity (RH) decreases from 100% to 34% [15].
Furthermore, the low glass transition temperature of Nafion (110 °C) is problematic because
above this point the polymer loses its mechanical stability and degradation ultimately occurs
[18].
2.3 Approaches to higher temperature membranes
Several approaches have been followed to develop membranes that permit the
operation at higher temperatures. These approaches can be summarized in three major
categories: (1) the development of PFSA membranes in which hygroscopic oxides and solid
proton conductors are incorporated; (2) the development of sulfonated polyaromatic
polymers and composite membranes, such as polyetheretherketone (PEEK) [15], and (3) the
development of acid base polymer membranes such as sulphuric and phosphoric acid doped
polybenzimidazole (PBI). The following review articles on the recent developments of high
temperature membranes are available in literature [15, 19-22].
As for the first approach, considerable efforts have been made to modify the existing
PFSA membranes. Weng et. al. [23] investigated a membrane, in which phosphoric acid
was incorporated in Nafion. A conductivity of 0.05 S/cm at 150 °C was reported. The
incorporation of oxides such as SiO2, TiO2 and tungsten oxide (WO3), in Nafion was also
studied [24]. The results showed higher water uptake properties with slightly better
performance in contrast to Nafion at 110 °C. Composite membranes were also prepared by
the incorporation of solid inorganic proton conductors [25] such as zirconium phosphates,
and heteropolyacids. Zirconium phosphates (ZrP) in particular are the topic of this thesis.
The synthesis of Nafion-zirconium phosphate composite membranes was addressed in
several studies [26-31].

14
The second approach toward the development of high temperature membranes is the
sulfonation of thermally resistant polymers such as polysulfones, fluoropolymers, and
polyetheretherketone. The sulfonation of certain polymers such as polystyrenes was
investigated in the 1960’s [25]. However, it was shown that this type of polymer suffers
from a short life time because the tertiary C–H bonds are sensitive to oxidation. The
sulfonation of polysulfones (PSF) or polyethersulfone (PES), polyetheretherketone (PEEK),
polybenzimidazoles (PBI), polyimides (PI), polyphenylenes (PP), and polyphenylene oxide
(PPO) was also investigated in the presence of inorganic components [15]. Although
reasonable and promising proton conductivities were obtained, the sulfonated organic
compounds still require more study and evaluation for their applications in higher
temperature operation.
The third approach involves maintaining reasonable proton conductivity at elevated
temperatures by replacing water with another proton transport assisting solvent. This
solvent is characterized by having a high boiling point such as phosphoric acid and
imidazoles. One example is the preparation of poly (2, 5-benizimidazole) (PBI) membranes.
The thermal stability of the PBI membranes doped with phosphoric acid at different
temperatures was studied [32]. Samms et al. [32] indicated that that these membranes
possess promising conductivity at 200 C. Despite the promising conductivities reported
for the PBI membranes, the poor mechanical properties and the adsorption of phosphate ion
on the catalyst are still the major drawbacks.
2.4 Zirconium hydrogen phosphate Zr(HPO4)2 (ZrP) and ZrP- PTFE composite
membranes
The interest in zirconium hydrogen phosphate Zr(HPO4)2 (abbreviated as ZrP)
compound goes back to the 1950’s when its behavior as a cation exchanger was discovered
[33-35]. Inorganic ion exchangers were expected to be more stable at high temperatures and
were investigated for their ion exchange properties. The ion exchange properties were
explained by their layered structure, hence, the presence of passageways that provide a
sufficiently free volume to allow un-hydrated cations to exchange [36]. Work on the
electrical conductance of ZrP was reported in by Alberti et al. [37, 38]. It was shown that
15
the conductance of ZrP decreased as the degree of crystallanity increased. The fraction of
the surface protons is small but their mobility is greater than the internal ones, and they
cause high proton conductivity. Hence, there has been an increasing interest not only in the
preparation of these inorganic proton conductors but also in their use in sensors, water
electrolysis units and other electrochemical devices, e.g. fuel cells. The reported
conductivity of amorphous ZrP in water at 80 C approached 0.01 S/cm [39]. This has
triggered several studies to evaluate the proton conductivity of ZrP after its incorporation
within non conductive materials such as polymers [40].
A chemical procedure for the precipitation of inorganic fillers, (selected from the
oxides and phosphates of the group consisting of Sn, Sb, Mo, W, Ti and Zr) was proposed
[41]. The resultant membranes were expected to posses the proton conductivity of the
inorganic material and the mechanical strength of the polymer. Following the procedure of
Grot [41], composite membranes were prepared by the precipitation of zirconium phosphate
in situ, within Nafion and porous supports such as polytetrafluoroethylene (PTFE)
membranes. Yong et. al. [42] prepared composite membranes by mixing a PTFE emulsion
and ZrP powder then drying, followed by pressing. Grot [41], described a process for the
incorporation of ZrP into a Nafion membrane by the in situ precipitation of ZrP using
phosphoric acid. Membranes were also prepared by the impregnation of Nafion films in a
solution of zirconyl chloride and phosphoric acid [43]. ZrP was deposited into polyethylene
oxides (PEO), PBI, Nafion, sulfonated polysulfone (SPSF), and sulfonated
polyetheretherketone (SPEEK) [25]. For example, the sulfonated polyetheretherketone
(SPEEK) – zirconium hydrogen phosphate (ZrP) composite membranes were prepared by
Tripathi et al. [44]. ZrP precipitated in polytetramethylene oxide PTMO [45] was
investigated in a PEM fuel cell at a temperature up to 130 C. Zirconium phosphate (ZrP)
was also deposited in polybenzimedizole (PBI) membranes [46]. Liu et. al. [47] used porous
polytetrafluoroethylene (PTFE) membranes as support material for the preparation of
Nafion/PTFE composite membranes by the impregnation of PTFE with Nafion solution.
Nafion–Teflon–Zr(HPO4)2 (NTZP) composite membranes were also prepared for the
purpose of operation at high temperatures [48]. The inorganic/organic composite
membranes appear to be promising for the high temperature operation in fuel cells. These
composite membranes are characterized by, 1) their reasonable proton conductivities due to

16
their water retention properties and, 2) their ability to reduce the undesired fuel cross over as
a result of the pore- filling technique.
2.5 References
1. E.J. Cairns, Adv. Eletrochem. Electrochem. Eng., 8, (1971), p. 337.
2. W.T. Grubb, C.J. Michalske, Nature, 201, (1964), p.287.
3. E.J. Cairns, Nature, 210, (1966), p.161.
4. W. T. Grubb, L. W. Niedrach, J. Electrochem. Soc., 110, Issue 10, (1963), p. 1086.
5. Hydrocarbon Fuel Cell technology, Fuel Chem. Am. Chem. Soc. Symp., 150th
National meeting, edited by S. Baker, Atlantic city, 1965, P. 429.
6. L.W. Neidrach , J. Electrochem. Soc. 113, (1966), p. 645.
7. L.W. Niedrach , J. Electrochem. Soc. 109, (1962), p. 1092.
8. G. Psofogiannakis , Y. Bourgault , B.E. Conway ,M. Ternan , J. Appl. Electrochem.,
36 (2006), p.115.
9. H. Khakdaman, Y. Bourgault, M. Ternan, Ind. Eng. Chem. Res.,49, (2010), 49, p.
1079.
10. H. Khakdaman, Y. Bourgault, M. Ternan, J. Power Sources, 196 , (2011), p.3186.
11. O. Savadogo, F.J. Varela , J. New Mat. Electrochem. Sys., 4, (2001), p. 93.

17
12. O. Savadogo, X. Yang, J. Appl. Electrochem., 33 , (2001), p. 787
13. Fuel Cell Handbook (7th Edition), U.S. Department of Energy Office of Fossil
Energy National Energy Technology Laboratory, 2004,
(http://www.brennstoffzellen.rwth-aachen.de/Links/FCHandbook7.pdf).
14. D.J. Harper, “Fuel Cell Projects for Evil Genius”, McGraw Hill, 2008, P.81.
15. J.L. Zhang ,Z. Xie ,J. Zhang , Y. Tang , C. Song , T. Navessin , Z. Shi, D. Song , H.
Wang, D. Wilkinson , Z. Liu , S. Holdcroft , J. Power Sources 160, (2006), p.872.
16. C. Yang , p. Costamagna , S. Srinivasan, J. Benziger , A. Bocarsly, J. Power Sources,
103 (2001), p.1.
17. G. Xiao , Q.F. Li, A. Hans, N.J. Bjerrum , J. Electrochem. Soc. 142, (1995),p. 2890.
18. C. Yang , S. Srinivasan , A. Bocarsly , S. Tulyani , J.B. Benziger , J. Membrane
Sci., 237,(2004), p.145.
19. O. Savadogo, J. Power Sources, 127, (2004), p.135.
20. V. Neburchilov, J. Martin, H. Wang , J. Zhang, Journal of Power Sources 169
,(2007) p. 221.
21. S.M. Javaid Zaidi, Mat. Sci. Forum, 657, (2010), p.88.
22. S. Bose, T. Kuila, T. Xuan H. Nguyen, N. Hoon Kim, K. Lau,, J.H. Lee, Progress in
Polym. Sci., 36, (2011), p. 813.

18
23. D. Weng. ,J.S. Wainright , U. Landau, R Savinell , J. Electrochem. Soc., 143,
(1996),p. 1260.
24. Z.G. Shao , Solid State Ionics, 177, (2006),p.779.
25. Q. Li , R. He , J. Jensen , N.J. Bjerrum , Chem. Mater., 15, (2003), p. 4896
26. F. Bauer, M. Willert-Porada, J. Membr. Sci., 233 , (2004), p.141.
27. H. C. Kuan, C. S. Wu, C.Y. Chen, , Z.Z. Yu, A. Dasari, Y.W. Mai, Electrochem.
Solid State Lett. , 9, (2006), p. A76.
28. E. Chalkov, M. V. Fedkin, S. Komarneni, S. N. Lvov, J. Electrochem. Soc., 154,
(2997), p. B288.
29. D. Truffier-Boutry, A. De Geyer, L. Guetaz, O. Diat, G. Gebel, Macromolecules,
40, ( 2007), p. 8259.
30. C. Yang, S. Srinivasan, A. S. Arico, P. Cretı, V. Baglio, V. Antonucci,,
Electrochem. Solid-State Lett., 4, (2001), p. A31.
31. G. Alberti, M. Casciola, A. Donnadio, R. Narducci, M. Pica, M. Sganappa,
Desalination 199, (2006), p.280.
32. S.R. Samms , S. Wasmus , R.F. Savinell, J. Electrochem. Soc. 143,(1996), p. 1225.
33. C.B. Amphelett , L.A. McDonald., M.J. Redman , J. lnorg. Nucl. Chem. 6, (1958),
p.220.
34. A. Clearfield, J.A. Stynes, J. Inorg. Nucl. Chem., 26, (1964), p. 117.
35. R. P. Hamlen , J. Electrochem. Soc., 109, (1962), p.746.

19
36. A. Clearfield , Ann. Rev. Mater. Sci. ,14 (1984), p. 205.
37. G. Alberti ,E. Torracca , J. lnorg. Nucl. Chem. 30, (1968),p.1093.
38. G. Alberti , M. Casciola,U. Costantino , G. Levi, G. Ricciardi , J. Inorg, Nucl.
Chem., 40, (1978), p. 533
39. K. Peinemann , S.p. Nunes Eds, “Membranes for Energy Conversion”, Vol. 2, P. 97.
40. M. Casciola, D. Capitani, A. Donnadio, V. Frittella, M. Pica, Fuel Cells, 9, (2009),
p.381.
41. W.G. Grot , G. Rajendran, US Patent 5,919,583, 1999.
42. P.I. Yong , K. Jae-Dong , M. Nagai , J. Mat. Sci. Letters, 19, (2000), p.1735.
43. P. Costamagna , C. Yang, A. Bocarsly , S. Srinivasan , Electrochimica Acta ,47,
(2002),p.1023
44. P. Tripathi , V.K. Shahi , J. Colloid Interface Sci., 316, (2007),p. 612.
45. J.K. Kim , T. Mori , J. Honma , J. Electrochem. Soc., 153, (2006), A508.
46. R. He , Q. Li , G. Xiao , N.J. Bjerrum , J. Membr. Sci., 226, (2003) p. 169.
47. F.Q. Liu, B.L. Yi, D.M. Xing, J.R. Yu, H.M. Zhang, J. Membr. Sci. 212, (2003) p.
213.
48. R. Jiang , H.R. Kunz , J. Fenton., Electrochim. Acta 51, (2006),p.5596.

20
CHAPTER THREE
Zirconium phosphate as the proton conducting material in direct
hydrocarbon PEM fuel cells operating above the boiling point of water
Amani Al-Othmana,b
, André Y. Tremblaya, Wendy Pell
b, Sadok Letaief,
b, Tara J.
Burchellc , Brant A. Peppley
d, and Marten Ternan
e
(a) Chemical and Biological Engineering,
(b) Catalysis Centre for Research and Innovation,
(c) Department of Physics, University of Ottawa, 161 Louis Pasteur, Ottawa, ON, K1N 6N5, Canada.
(d) Chemical Engineering, Queens University, Dupuis Hall, Kingston, ON, K7L 3N6, Canada.
(e) EnPross Inc., 147 Banning Road, Ottawa, ON, K2L 1C5, Canada
In: Journal of Power Sources 195 (2010) 2520–2525.

21
Chapter 3- Zirconium phosphate as the proton conducting material in
direct hydrocarbon PEM fuel cells operating above the boiling point of
water
ABSTRACT
Zirconium phosphate (ZrP) was investigated as a possible proton conductor material in
direct hydrocarbon polymer electrolyte membrane (PEM) fuel cells that operate at greater
temperatures than conventional PEM fuel cells. Amorphous zirconium phosphate was
synthesized in this work by precipitation at room temperature via reaction of ZrOCl2 with
H3PO4 aqueous solutions. The conductivity of the synthesized ZrP materials was 7.04 10 -5
S cm-1
for ZrP oven dried in laboratory air at 70 °C and 3.57 10 -4
S cm-1
for ZrP powder
dried first at 70 °C in laboratory air and then processed at 200 °C with continuous H2O
injection at an H2O/N2 molar ratio of 6. This work showed that by maintaining appropriate
water content in the vapour phase at processing conditions, it was possible to alter the
composition of zirconium phosphate to a sufficiently hydrated state, and thereby avoid the
normal decrease in conductivity with increasing temperature.
3.1. Introduction
Work in our laboratory is being directed toward the development of direct
hydrocarbon fuel cells having an electrolyte membrane containing zirconium phosphate
as its proton conductor component. Hydrogen is the fuel used in most fuel cells.
Methanol is the second most common fuel. The reason that hydrocarbons are normally
not fed directly to the anode of a fuel cell is that fuel cell performance with hydrocarbon
fuels is much worse than with hydrogen or methanol.
Increasing the fuel cell operating temperature is expected to improve the reaction
kinetics and therefore, improve hydrocarbon fuel cell performance. Nafion, the polymer
electrolyte membrane (PEM) used in many hydrogen fuel cells, becomes dehydrated as
the temperature increases and is not suitable at temperatures greater than 85C. In

22
contrast, composite electrolytes composed of zirconium phosphate, Nafion, and
polytetrafluoroethylene (PTFE) have been used in hydrogen fuel cells at temperatures up
to 120C [1]. Although functional, the performance does decrease as the temperature
rises above 80C. The target temperature for this work is 200C.
For a direct propane fuel cell, the overall reaction at the anode is:
C3H8 + 6 H2O = 3 CO2 + 20 H+ + 20 e
– (1)
Therefore, for a steady-state reaction, the feedstock must contain 6 moles of water for
every mole of propane. In contrast, when hydrogen is the fuel there is no stoichiometric
requirement to include water in the feedstock. Although the hydrogen feedstock to a
hydrogen fuel cell is often humidified, the saturated water vapour pressure at the anode of
hydrogen fuel cells is small compared to the stoichiometric quantity in Eq (1), above.
Zirconium hydrogen phosphate Zr(HPO4)2 (abbreviated as ZrP), is a solid protonic
conductor. ZrP has a layered structure that allows the intercalation of guest molecules. It
has cationic exchange properties, proton-conducting properties, and is a highly hydroscopic
insoluble solid. The interest in this compound goes back to the 1950’s since its behavior as
a cation exchanger [2-4] was discovered. The cationic exchange behavior was explained by
the layered structure and the presence of passageways that provide a sufficiently free volume
to allow un-hydrated cations to exchange [5].
Work on the conductance properties of ZrP was reported by Alberti et al. [6,7]. It
was shown that the conductance of ZrP decreased with an increase in the degree of
crystallinity. The fraction of the surface protons is small but their mobility is greater than
the internal ones. Their combination results in a large proton conductivity. Alberti et al.[7]
found that the mobility of surface ions in -ZrP are 104 times higher than interlayer ions.
Therefore, high proton conductivity is the result of the high proton mobility on the surface
of ZrP.
There has been an increasing interest, not only in the preparation of inorganic proton
conductors, such as zirconium phosphate, but also in their use for the operation in sensors,
water electrolysis units and electrochemical devices such as fuel cells. The conductivity of
amorphous ZrP in water at 80 C approaches 0.01 S cm-1
[8]. This has triggered several

23
studies in literature to evaluate the proton conductivity of ZrP after its incorporation within
non-conductive materials such as polymers [9]. Examples are composite membranes
prepared by the precipitation of zirconium phosphate in-situ, in polytetraflouroethylene
(PTFE) [10], in Nafion [1,10], and in the composites prepared by Park et al. [11] by mixing
the PTFE emulsion and the ZrP powder followed by drying and pressing.
The objective of this work is to investigate ZrP as an electrolyte material for
hydrocarbon fuel cells: specifically, to 1) investigate the degree of ZrP hydration at high
temperatures and to 2) investigate the effect of hydration on conductivity.
3.2. Experimental
3.2.1 Preparation and characterization of zirconium phosphate powder (ZrP)
Zirconium phosphate powder (ZrP) was prepared by the reaction of aqueous
solutions of zirconium oxychloride (ZrOCl2) and phosphoric acid (H3PO4). A 100 mL (0.5
M) solution of ZrOCl2 was prepared using ZrOCl2.8H2O purchased from Aldrich. The ZrP
powder was precipitated at room temperature upon the addition of 1 M of H3PO4 in three
stages. The precipitation reaction proceeded according to the following equation:
ZrOCl2 + 2 H3PO4 Zr(HPO4)2 + 2 HCl + H2O (2)
The gel, formed by the reaction, was then filtered and washed 5 times with de-
ionized water. The samples obtained were heated to different temperatures. These samples
were subjected to various characterization methods.
The various ZrP samples were subjected to one of two different sets of
environmental conditions. The first set of environmental conditions involved heat treatment
in laboratory air for 24 hours, as follows: a) ZrP powder oven dried at 70°C in laboratory
air, i.e. at a relative humidity of 20 %); b) ZrP powder oven dried at 110°C in laboratory air;
c) ZrP powder oven dried first at 70°C and then at 200 °C both in laboratory air. The second
set of environmental conditions was a combination of heat treatment and elevated water
vapour pressure, specifically: d) ZrP powder dried first at 70 °C in laboratory air and then
processed at 200 °C in a tube furnace, for 3 hours with continuous H2O injection at an

24
H2O/N2 molar ratio of 6, the stoichiometric ratio in the direct propane fuel cell reaction, as
shown in Fig. 1. After this processing, each sample was placed in a closed bag made of non-
porous PTFE and sent for analysis.
Fig. 1. H2O partial pressure experiment equipment
3.2.2 Conductivity measurements (electrochemical impedance spectroscopy EIS)
The Electrochemical Impedance of ZrP electrolyte was measured using a common
electrochemical cell that is shown in Fig. 2. 304 stainless-steel was used to construct the
cell electrodes. The design of the cell was taken from Wang et al. [12]. It was a one end
closed cell, cylindrical in shape with a diameter of 7.08 mm and a length of 25.91 mm. A
304 stainless steel bolt (24 threads per inch, or pitch = 1.058 mm per thread) could be
screwed into one end of the ceramic cylinder. The other end of the ceramic cylinder was
also threaded and was connected to a 304 stainless steel base. A typical pellet would have a
diameter of 7 mm and a thickness of 0.7 mm.

25
Fig. 2. Impedance spectroscopy cell.
The resultant ZrP samples were crushed to form a fine powder. The powder was
placed in the cell and compressed until a constant torque was obtained. The resulting pellet
was used for the conductivity measurements. The torque applied to the cell was measured
with a torque wrench and had a value of 40 lbF in (4.5 N m). The load, F, used to compress
the powder was calculated from the torque, T, using an empirical engineering formula, F =
0.2 *D *T, where D is the nominal bolt diameter and 0.2 is the “nut” factor. The pressure, P
= F/A, where A is the cross-sectional area of the flat end of the bolt was determined to be
300 kPa.
The four probe EIS (Electrochemical Impedance Spectroscopy) measurements were
made using a Parstat 2273 electrochemical measurement system running electrochemical
Power Suite software over a frequency range of 1 – 100 kHz with an applied voltage of +/-
10 mV. For each sample tested, a value for the electrolyte resistance was derived from the
impedance experiments. Nyquist plots were obtained from impedance data. A typical

26
Nyquist plot obtained during this work was composed of a small portion of a semicircle at
high frequencies followed by a Warburg tail that approaches a straight line, at low
frequencies. The data at the very highest frequencies in Fig. 3 show a short line that is
almost vertical. It is one end of the semi-circle. Data obtained with less compacted ZrP
material, not shown in this work, formed a complete semi-circle. The straight line in the
Nyquist plot can be extrapolated to its intersection with the x-axis to obtain a value of
resistance. The conductivity () in S cm-1
was then calculated [12] according to the
equation:
= d / RA (3)
where d and A are the thickness and the area for the sample respectively. Values of the
electrolyte resistances, R, were obtained from Nyquist plots.
3.2.3 Samples characterization
The samples were analysed by XRD (X-ray diffraction) using Philips PW 1830
generator machine and TGA (Thermo Gravimetric Analysis) using a 2960 SDT analyser
from TA instruments. Thermal analysis was performed under N2 and at a heating rate of 15
°C min-1
and 1 °C min-1
.
3.3. Results and Discussion
3.3.1 Conductivity measurement
The ZrP powders were analyzed using Electrochemical Impedance Spectroscopy
(EIS) after being dried at various temperatures. The samples tested were 1) ZrP powder
dried at 70°C in laboratory air 2) ZrP powder dried at 200 °C in laboratory air 3) ZrP
powder dried first at 70 °C in laboratory air and then processed at 200 °C in a tube furnace
with continuous H2O injection at an H2O/N2 molar ratio of 6, which is the stoichiometric
ratio in the direct propane fuel cell reaction. The objective was to evaluate their
conductivities. The conductivity results, measured at room temperature, are presented as
Nyquist plots in Fig. 3. The frequencies are shown as a separate line in Fig. 3. In general,

27
the conductivity plots are composed of a Warburg line at frequencies less than 100 kHz and
a partial semi-circle (not visible in Fig. 3) at frequencies greater than 100 kHz [12]. The
electrolyte resistance was then determined by extrapolating the Warburg portion of the plot
to the x-axis. The intercept at the x-axis is the real part of the ZrP impedance.
Fig. 3. Nyquist plot for ZrP samples (ZrP powder dried at 70 ◦C in laboratory air; ZrP
powder dried at 200 ◦C in laboratory air; and ZrP powder dried first at 70 ◦C in laboratory
air and then processed at 200 ◦C in a tube furnace with continuous H2O injection at
anH2O/N2 molar ratio of 6, the stoichiometric ratio in the direct propane fuel cell reaction).
The Nyquist plots, in Fig. 3, provided values of ohmic resistances that were 2400
Ohms after 70C final air drying temperature, 3500 Ohms after 200C final air drying
temperature and 375 Ohms after 200C final processing temperature with a H2O/N2 molar
ratio of 6. These resistance values along with the thickness and the area of the sample were

28
used in Eq. (3) to calculate the conductivity,, in S cm -1
. The results are shown in Table 1.
It can be seen that the conductivity decreased from 7.04 10 -5
to 5.79 10 -5
S cm-1
with
the increase in the final drying temperature (in laboratory air) from 70 to 200 °C. This is
typical behavior. As the temperature increases, water evaporates and condensation of the
hydroxyl groups in ZrP occurs. Loss of protons as a result causes the conductivity to
decrease considerably [13]. The above results are also in agreement with previous
conclusions that the transport of ions in ZrP is protonic via the Grothuss mechanism [14] as
the conductivity decreases with the loss of protons. More importantly our experimental data
in Table 1 show that by maintaining the ZrP material in an atmosphere that is predominantly
water, the proton conductivity (3.57 10–4
S cm-1
) is almost an order of magnitude greater
than when it is in a relatively dry atmosphere (5.79 10–5
S cm-1
).
Table1: Experimental conductivity values as a function of processing conditions
_____________________________________________________________________
Processing Conditions Proton Conductivity [S cm-1
]
_____________________________________________________________________
70C Air Drying 7.04 10–5
200C Air Drying 5.79 10–5
200C Processing at an H2O/N2
molar ratio of 6 3.57 10–4
_______________________________________________________________
ZrP proton conductivities have been reported in previous studies. For instance, the
proton conductivities of the crystalline phase -ZrP, Zr(HPO4)2.H2O, were 9.4, 3.7 and 3
10 - 5
S cm-1
[5,15]. These results are consistent with the conclusion that the conductivity
decreases with the degree of crystallinity. Patel et al. [13] and Thakkar et al. [16] have

29
reported that amorphous ZrP pellets had protonic conductivity values of 4.210 – 6
to 1.910
– 6 S cm
-1 over the temperature range of 30 to 120 °C respectively. Casciola et al. [17] have
also reported a value of 3.2 10 – 6
S cm-1
at 30°C for ZrP conductivity. These values have
been summarized in Table 2 where it can be seen that the conductivity of ZrP decreases with
temperature.
Table 2: Conductivity values reported in the literature [S cm-1
]
___________________________________________________________________
Material Literature values of Reference
Conductivity [S cm-1
]
___________________________________________________________________
Zr(HPO4)2.H2O 9.4 10–5
5
increasing 3.7 10–5
5
crystallinity 3 10–5
5, 15
amorphous ZrP at 30C 3.2 10–6
17
amorphous ZrP at 30C 4.2 10–6
13
amorphous ZrP at 120C 1.9 10–6
13, 16
____________________________________________________________
Our experimental results showed that a conductivity of 3.57 10 -4
S cm–1
was
obtained with water injection. This water-injection technique was successful in maintaining
a reasonable conductivity value. In comparison, 1.9 10 – 6
S cm–1
was reported at 120°C
under dry conditions [13]. Our own relatively dry value at 200C, in Table 1, was 5.79
10–5
S cm–1
. The conductivity result measured in a predominantly water atmosphere, results
from two factors acting against each other: 1) water injection which provides the necessary
hydration to ensure proton conductivity and 2) the condensation of hydroxyl groups that

30
occur at temperatures 180°C and causes a loss of proton groups [18]. The experimental
results in Table 1 suggest that the first factor had the most influence.
3.3.2 Thermo-gravimetric analysis
In this work, the thermal stability of amorphous ZrP was investigated by performing
thermo-gravimetric analyses (TGA) for the same samples described above. The TGA
analyses were performed at a heating rate of 15 °C min–1
in a N2 atmosphere. The TGA
results for the sample that produced the best impedance analysis performance (200°C – wet)
are shown in Fig. 4.
Fig. 4. TGA data for the ZrP sample that was previously dried at 70 ◦C and was
subjected to water injection at 200 ◦C. [Heat flow values (Wg
−1) were divided by −1000
to match the scale of the other two plots: (a) dW/dt (mg min−1
) and (b) weight (mg).]

31
The TGA analysis showed a weight loss of 2.14 mg in the temperature range (25 –
210 °C) with a maximum in the rates of weight loss at 65 and an inflection point at 141°C.
The weight loss (1.15 mg) in the temperature range (210 – 1100 °C) had a maximum in the
rate of weight loss at 304 °C. The thermal behaviour of ZrP as ion exchangers has been the
subject of several previous studies. The studies concluded that: 1) the TGA results are a
function of heating rate, preparation method and properties of the starting materials, 2) there
is a condensation reaction that takes place between P–OH groups and leads to a mixture of
phosphate – pyrophosphate phases [19].
3.3.3 X-Ray diffraction results
A ZrP sample was examined by X-ray diffraction (XRD) after calcinations at 1100
°C for 1 hour. The spectrum is shown in the lower part of Fig. 5. The spectrum was
identified as the crystalline structure of zirconium pyrophosphate (ZrP2O7). One interesting
observation in Fig. 4 was the occurrence of a sharp exothermic peak in the heat flow at 1015
°C indicating a phase change. This is explained by the transformation of layered
pyrophosphate to cubic pyrophosphate that occurs at this temperature range [19-22]. Since
there was no accompanying change in weight, the change in heat flow was not caused by a
loss of material. These results indicate that heating to a sufficient temperature ultimately
converts hydrated zirconium phosphate to zirconium pyrophosphate.
The XRD patterns for the hydrated ZrP samples that were air-dried at various
temperatures are also shown in Fig. 5. Although they do not have nice crystalline patterns,
like the zirconium pyrophosphate, they do have some less intensive peaks indicating that
they are not completely amorphous and that they do have some structure. These patterns are
characteristic of the ZrP formed from the precipitation reaction of ZrOCl2 and H3PO4
solutions at room temperature [3,13].

32
Fig. 5. XRD pattern for ZrP samples dried in laboratory air at 70, 110 and 200 ◦C
respectively plus a ZrP sample that was calcined at 1100 ◦C for 1 h.
3.3.4 Analysis of the TGA data
The combination of the XRD data in Fig. 5 showing that zirconium pyrophosphate is
formed above 1015C, and the TGA data in Fig. 4 showing that the weight at temperatures
above 1015C is approaching a constant value, suggests a basis for analyzing the TGA data.
Specifically, it suggests that all samples when heated sufficiently will approach a constant
weight in the form of zirconium pyrophosphate. Therefore the TGA weight data above
500C were fitted to the following empirical equation:
y = A + B / exp [(T – 500) / C] (4)

33
where T = Temperature (C), y is the weight of the ZrP pellet (mg), A = weight of the ZrP
sample at T = , in (mg), B = y (T500) – y (T) in (mg), and C is an arbitrary parameter. The
values of the parameters are shown in Table 3.
Table 3: Experimental conductivity values as a function of the material’s processing conditions
_____________________________________________________________________
Processing Conditions A B C
_____________________________________________________________________
70C Air Drying 83.34 3.72 367.98
200C Air Drying 77.09 2.39 367.97
200C Processing at an H2O/N2 77.19 4.09 594.62
molar ratio of 6
_____________________________________________________________________
Fitting using Eq. 4, resulted in an excellent agreement between the calculated line
and the TGA experimental data (shown as diamonds in Fig. 6). The insert in Fig. 6 shows
both the diamond experimental data points and the calculated straight line. The data points
are so close together in the main plot in Fig. 6 that it is impossible to distinguish between the
trajectory of diamond data points and the line calculated from Eq. 4. Eq. 4 was used to
calculate the weight of zirconium pyrophosphate that would be produced from all ZrP
samples when their temperatures approached T = .

34
Fig. 6. The agreement between the TGA experimental data (solid diamonds) and the values
calculated using Eq. (4).
ZrP2O7 is formed according to the following series of reactions, each of which eliminates a
water molecule:
ZrPO4(H2PO4)xH2O (x > 2) ZrPO4(H2PO4)2H2O
Zr(HPO4)2H2O Zr(HPO4)2 ZrP2O7 (5)
When all the water of hydration that is bound to the ZrP chemical structure has been
removed, then only anhydrous zirconium hydrogen phosphate [Zr(HPO4)2] remains. It is
subsequently converted to zirconium pyrophosphate in the final reaction.
78
79
80
81
82
83
84
85
500 600 700 800 900 1000 1100
TEMPERATURE (oC)
WE
IGH
T L
OS
S %
.
EXPERIMENTAL
CALCULATED
80.3
80.5
80.7
80.9
81.1
81.3
81.5
547 548 549 550 551
TEMPERATURE (oC)
WE
IGH
T L
OS
S %
.
Experimental
Calculated

35
3.3.5 Quantitative water content of ZrP
With the knowledge of the zirconium pyrophosphate (ZrP2O7) weight and by
ascribing the TGA weight loss to water, the ratio (mols H2O / mol ZrP2O7) at any
temperature was calculated. The results are shown in Fig. 7 as moles of H2O per mole of
ZrP2O7.
Fig. 7. TGA data fitting for ZrP samples dried at 70, 110 and 200 ◦C in the oven plus ZrP at
200 ◦C with H2O injection (200
◦C–wet).
The states of hydration in the various zirconium phosphate compounds can be
identified in terms of the H2O / ZrP2O7 molar ratio shown in Fig. 7. A value of “0” H2O /
ZrP2O7 ratio in Fig. 7 represents ZrP2O7. A value of “1” in Fig. 7 represents Zr(HPO4)2. A
0
0.5
1
1.5
2
2.5
3
3.5
4
4.5
0 100 200 300 400 500 600 700 800 900 1000 1100
TEMPERATURE (oC)
MO
L H
2O
/ M
OL
ZrP
2O
7
.
200 oC (Wet)
200 oC
(Dry)
110 oC
70 o C

36
value of “2” in Fig. 7 represents Zr(HPO4)2H2O. A value of “3” in Fig. 7 represents
ZrPO4(H2PO4)2H2O.
Any value greater than 3 represents ZrPO4(H2PO4)xH2O where x > 2. That is the
formula that is used to represent the starting material, prior to drying at any temperature.
Results similar to those in Fig. 7 were obtained in previous studies such as Constantino et al.
[19] and Patel et al. [21]. The sample dried in laboratory air at 70C had a value slightly
less than “3” indicating that the statistically average extent of hydration was slightly less
than that of zirconium phosphate. The sample dried in laboratory air at 110C had a value
of approximately “2.5” indicating that its statistically average extent of hydration was
between that of zirconium phosphate and zirconium phosphate. Based on the above
observations, it was expected that the sample dried in laboratory air at 200 C would have a
value less than “2.5”. It was found to be greater than “2.5”. This sample may have picked
the additional moisture by being exposed to the atmosphere for an extended period of time
prior to its thermogravimetric measurement. This is consistent with the results obtained by
Amphlett [20] who reported that it was possible to reconvert pyrophosphates back into
phosphates upon immersion in aqueous solutions at 300 °C. Finally the sample processed at
a H2O / N2 molar ratio of 6 was expected to have a greater value than the others since it was
processed in an environment with large water content.
The water content of all the samples in Fig. 7 decreased as the temperature
increased. At all temperatures, the solid sample processed at 200 °C with a H2O / N2 molar
ratio of 6 had a greater water content than any of all the other solid samples. This
observation indicates that the presence of a water rich vapour phase produced a zirconium
phosphate solid that was hydrated to a greater extent than the zirconium phosphate solids
that were prepared in laboratory air. The two samples dried at 200C, one in the presence of
a water rich vapour and the other in laboratory, air provide a direct comparison showing that
the water rich vapour caused the solid to be hydrated to a greater extent.
Finally the sample processed with an H2O/N2 molar ratio of 6 at 200C had both the
greatest conductivity and the largest hydrated water content compared to all other samples.

37
This is consistent with the concept that: by maintaining an appropriate water content in the
vapour phase at processing conditions, it was possible to maintain the zirconium phosphate
in a sufficiently hydrated state, so that the conductivity values could also be maintained.
3.4. Conclusions
Two conclusions can be made related to the operation of zirconium phosphate fuel
cell membranes at elevated temperatures (200C). (1) The decrease in proton conductivity
that has sometimes been attributed to a loss in water content is consistent with our
measurements of conductivity and water content that are reported here in relatively dry
laboratory air from 70 – 200C. (2) Furthermore, it was shown that an adjustment of the
vapour phase water content during processing (so that the gas phase in contact with the
zirconium phosphate membrane contained an H2O / N2 molar ratio of 6, the stoichiometric
feed ratio in a direct propane fuel cell), enhanced the hydrated water content of the
zirconium phosphate material compared to when it was in the presence of a relatively dry
atmosphere. In addition, our experiments showed that the conductivity of this 200C
material having the enhanced hydrate water content was even greater than that of material
that had only been at 70C in a relatively dry atmosphere. This finding indicates that it
should be possible to operate direct hydrocarbon fuel cells at elevated temperatures, without
encountering degradation in the proton conductivity of the membrane and thereby take
advantage of more rapid kinetics and greater current densities.
3.5. Acknowledgments
The authors gratefully acknowledge the financial support from the Canadian federal
government’s Natural Sciences and Engineering Research Council and from the Ontario
provincial government’s Ministry of Research and Innovation (Ontario Fuel Cell Research
and Innovation Network).

38
3.6. References
1. Y. Si, R. Jiang, J.C. Lin, H.R. Kunz, J.M. Fenton, J. Electrochem. Soc. 151 (2004)
A1820.
2. C.B. Amphelett, L.A. McDonald, M.J. Redman, J. lnorg. Nucl. Chem. 6 (1958) 220.
3. A. Clearfield, J.A. Stynes, J. Inorg. Nucl. Chem. 26 (1964) 117.
4. R.P. Hamlen, J. Electrochem. Soc. 109 (1962) 746.
5. A. Clearfield, Ann. Rev. Mater. Sci. 14 (1984) 205.
6. G. Alberti, E. Torracca, J. lnorg. Nucl. Chem. 30 (1968) 1093.
7. G. Alberti, M. Casciola, U. Costantino, G. Levi, G. Ricciardi, J. Inorg, Nucl. Chem. 40
(1978) 533.
8. K. Peinemann, S.P. Nunes, (Eds.) Membranes for Energy Conversion, Vol. 2, p.97.
9. O. Savadogo, J. Power Sources 127 (2004)135.
10. W.G. Grot, G. Rajendran, US Patent 5,919,583, 1999.
11. Y.I. Park, K. Jae-Dong, M. Nagai, J. Mat. Sci. Letters 19 (2000)1735.
12. Y.J. Wang, Y. Pan, L. Chen, Mat. Chem. and Physics 92 (2005) 354.

39
13. H. Patel, U. Chudasama, J. Chem. Sci. 119 (2007) 35.
14. A. Clearfield, Chem. Rev. 88 (1988)125.
15. Y.I. Park, J.D. Kim. M. Nagai, Mat. Res. Soc. Symp. Proc. 600 (2000) 305.
16. R. Thakkar, H. Patel, U. Chudasama, Bull. Mater. Sci. 30 (2007) 205.
17. M. Casciola, D. Bianchi, Solid State Ionics 17 (1985) 287.
18. G. Alberti, A. Conte, E. Torracca, J. Inorg. Nucl. Chem. 28 (1966) 225.
19. U. Constantino, A.L. Ginestra, Thermochimica Acta 58 (1982) 179.
20. C.B. Amphlett, Inorganic Ion Exchangers, Elsevier; London; (1964) 107.
21. H.K. Patel, R.S. Joshi, U. Chudasama, Indian J. Chem. 47 A (2008) 348.
22. U. Constantino, R. Vivani, V. Zima, E. Cernoskova, J. Solid State Chem. 132 (1997)
17.
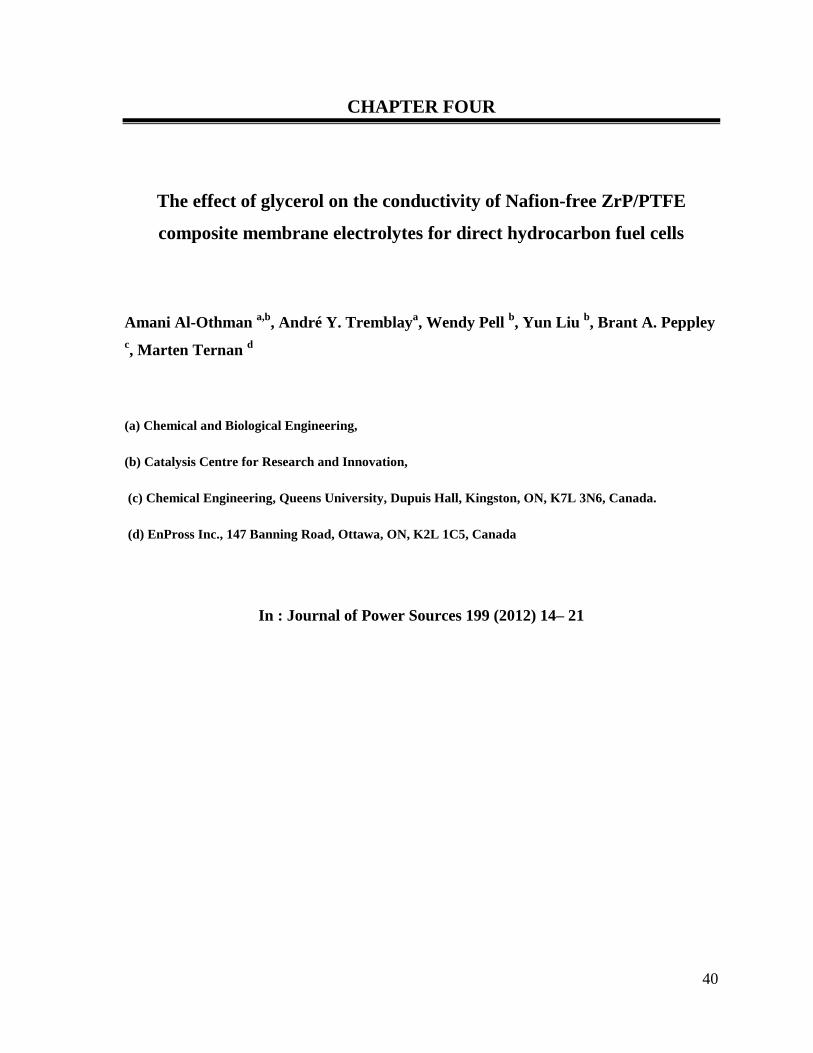
40
CHAPTER FOUR
The effect of glycerol on the conductivity of Nafion-free ZrP/PTFE
composite membrane electrolytes for direct hydrocarbon fuel cells
Amani Al-Othman a,b
, André Y. Tremblaya, Wendy Pell
b, Yun Liu
b, Brant A. Peppley
c, Marten Ternan
d
(a) Chemical and Biological Engineering,
(b) Catalysis Centre for Research and Innovation,
(c) Chemical Engineering, Queens University, Dupuis Hall, Kingston, ON, K7L 3N6, Canada.
(d) EnPross Inc., 147 Banning Road, Ottawa, ON, K2L 1C5, Canada
In : Journal of Power Sources 199 (2012) 14– 21

41
Chapter 4-The effect of glycerol on the conductivity of Nafion-free
ZrP/PTFE composite membrane electrolytes for direct hydrocarbon fuel
cells
ABSTRACT
Composite membranes composed of zirconium phosphate (ZrP, a proton conductor), and
porous polytetrafluoethylene (PTFE, a mechanical support for ZrP), have been studied as
electrolytes for direct hydrocarbon fuel cells that might operate at temperatures approaching
200°C. The previous literature describes membranes formed by compressing PTFE particles
and ZrP particles (conductivity = 10–3
S cm–1
). The results reported here show that adding
glycerol (GLY) to a reaction mixture of ZrOCl2•8H2O and H3PO4 to form ZrP in-situ within
the pores of PTFE, produced a membrane (conductivity = 0.02 – 0.045 S cm–1
) that
approached the performance of Nafion (conductivity = 0.1 S cm–1
). The conductivity
remained unchanged when one of the membranes (conductivity = 0.02 S cm-1
) was
processed at the inlet conditions to a direct propane fuel cell (200°C and steam mole fraction
yH2O = 0.86). The composite membrane, prepared with glycerol, contained ZrP spheres (100
– 500 nm) that were smaller than the PTFE pore diameters (1000 – 2000 nm). The
enhanced conductivity may have been caused by a combination of proton transport on the
exterior surfaces of the ZrP solid spheres, proton hopping through the bulk of the ZrP, and
proton hopping via the OH groups in glycerol.
4.1. Introduction
High temperature operation ( 200°C) is desired in polymer electrolyte membrane
(PEM) fuel cells for several reasons. It enhances reaction kinetics, improves the cell
tolerance for impurities, permits the use of fuels that produce carbon monoxide, and,
increases the temperature at which heat is generated, thereby allowing the recovery of useful
heat.
Current PEM fuel cell technology relies on perfluorosulfonic acid (PFSA) polymer
membranes (e.g. Nafion) as the proton conductive material. Nafion is the leading and the

42
most successful electrolyte used in PEM fuel cells. Dupont developed it in the 1960’s. It
consists of a linear perfluorinated backbone with perfluoro side chains containing sulfonic
acid groups [1].
Nafion membranes perform quite well below 90 C under fully hydrated conditions.
They also possess good chemical and mechanical stability due to the perfluorinated main
chain. However, proton conductivity of this membrane is strongly dependent on its water
content. Water is required to solvate the proton of the sulfonic acid groups. The substantial
decrease in Nafion’s proton conductivity at low hydration levels is one of the motivations
toward the development of new membrane materials. For example, Nafion conductivity
decreases from 0.066 to 0.00014 S/cm at 30°C when the relative humidity (RH) decreases
from 100% to 34% [2]. This is why the high temperature operation of a PEM fuel cell with
Nafion is limited to temperatures below 100 C at ambient pressure. Also, Nafion starts to
lose its mechanical stability above its glass transition temperature of 110 C [3]. This is
problematic because above this temperature, degradation eventually occurs. A membrane
suitable for high temperature operation should have reasonable and/or high proton
conductivity, good thermal and chemical stability, and low cost.
The development of high temperature membranes can be categorized into three
major groups: (1) the modification of the current Nafion or PFSA membranes by the
addition of hydroscopic oxides and solid proton conductors such as zirconium hydrogen
phosphate Zr(HPO4)2•H2O, (ZrP); (2) the development of sulfonated polyaromatic polymers
and composite membranes, such as polyetheretherketone (PEEK) [2], and (3) the
development of acid base polymer membranes such as sulphuric and phosphoric acid doped
polybenzimidazole (PBI).
Considerable effort has been made to modify the existing PFSA membranes (e.g.
Nafion) by the incorporation zirconium hydrogen phosphate Zr(HPO4)2•H2O. ZrP was one
of the inorganic compounds suggested by Grot [4]. Grot proposed that inorganic fillers,
such as, the oxides and phosphates of Sn, Sb, Mo, W, Ti and Zr metals be precipitated in
membranes.

43
Zirconium hydrogen phosphate, Zr(HPO4)2•H2O, belongs to the class of solid
protonic conductors that has a layered structure allowing the intercalation of guest
molecules. It is a highly hydroscopic insoluble solid and the interest in this compound goes
back to the 1950’s when it was discovered to have cation exchange properties [5 –7].
Examples of composite membranes with ZrP incorporated into Nafion have been reported
by: Savadogo et al. [8] who casted a membrane using a Nafion® solution that contained
zirconium (Zr+4
) ions, Houa et al., [9] who incorporated zirconium phosphates into Nafion
115, Bauer et. al. [10] who incorporated zirconium phosphates into Nafion 1135 and 117,
and Casciola et. al. [11], who prepared Nafion 117 – zirconium phosphate membranes.
Composite membranes using ZrP and polytetrafluoroethlyne (PTFE) have been also
reported. Park et al. [12] prepared a composite membrane by mixing the particles of a PTFE
emulsion with a ZrP crystalline powder, then drying, followed by pressing. The addition of
zirconium phosphate in Park’s work caused the proton conductivity to increase to 2.2 10 -3
S cm-1
compared to 10-13
S cm-1
for PTFE alone. Liu et al. [13] impregnated a porous
polytetrafluoroethylene (PTFE) with Nafion solution to prepare Nafion/PTFE composite
membranes. Jiang et al. [14] prepared Nafion–Teflon®–Zr(HPO4)2 (NTZP) composite
membranes via a direct impregnation method.
Research in our laboratory is directed toward the use of ZrP without using Nafion,
since our target temperature is 200°C. Our earlier work on ZrP powders [15] investigated
the effect of hydration on the proton conductivity of ZrP. It showed that the water to
hydrocarbon stoichiometric ratio required for direct propane fuel cells caused a substantial
enhancement in ZrP proton conductivity compared to the conductivity at dry conditions. In
this work ZrP particles were precipitated during an in-situ reaction of ZrOCl2.8H2O with
H3PO4 inside the pores of a porous PTFE membrane. The resulting composite membrane
has, (1) proton conducting properties, (2) thermal stability limited by PTFE (260C) and, (3)
mechanical support for the ZrP particles, provided by the PTFE. It was anticipated that this
composite ZrP-PTFE membrane would be particularly suitable for direct hydrocarbon fuel
cells. In this work, the effect of glycerol addition on the morphology and conductivity of the
composite membrane was investigated. We were unable to find any previous experimental

44
work specifically describing the effect of glycerol on proton conductivity in fuel cell
membranes.
4.2. Experimental
4.2.1. Synthesis of a ZrP – PTFE composite membrane
There were several component materials used to make the composite membrane.
The porous film was unlaminated Sterlitech PTFE (with a nominal thickness of 50 μm and a
nominal pore size of 0.22 μm). ZrOCl2•8H2O from Sigma Aldrich was the source of the
zirconium for ZrP. 85% o-phosphoric acid from Fischer Scientific was the source of
phosphorous for ZrP. Ethanol (Anhydrous ethyl alcohol from Commerical Alcohols Inc.),
glycerol (certified ACS, assay 99.7% from Fisher Scientific) and iso-propanol (HPLC grade,
assay 99.8% from EMD Chemicals Inc.) were obtained.
The first step of the procedure was to prepare a suspension containing the
ZrOCl2•8H2O salt having a liquid phase that would wet the surface of the porous PTFE film.
Although ZrOCl2•8H2O dissolved readily in water, the interfacial tension between water and
PTFE prevented the water from spreading on the surface of the PTFE. In contrast, both
isopropanol and ethanol have lower surface tension than water, hence they wetted the PTFE
surface. These alcohols were observed to penetrate through the PTFE film. In addition, fine
particles of ZrOCl2•8H2O could be suspended in alcohol.
Suspensions were prepared using several methods. Two different liquid phase
compositions were used: (a) 50 mL ethanol and 350 mL iso-propanol, and (b) 2 mL of
water plus 50 mL of ethanol and 150 mL of iso-propanol. The water dissolved much of the
ZrOCl2•8H2O. The proportion of water in the liquid was sufficiently small that the liquid
mixture would wet the PTFE. As a result the total volume of the suspensions prepared with
water was substantially diminished compared to the suspensions prepared without water.
For some of the suspensions a small amount of glycerol (GLY) was added in order to vary
the GLY/ZrP mass ratio. The suspension was placed on a stirring hot plate and vigorously
mixed using a magnetic stirrer. The quantity of ZrOCl2•8H2O in the suspension was
sufficient for the void volume of pores in the PTFE film to be filled with ZrP,

45
Zr(HPO4)2•H2O. That stoichiometric amount of ZrOCl2.8H2O was determined from the
chemical reaction [16] in Equation 1.
ZrOCl2•8H2O + 2 H3PO4 → Zr(HPO4)2•H2O + 2 HCl + 8 H2O (1)
The suspension was introduced into the pores of the PTFE film as follows: A piece
of porous PTFE was weighed, then placed between two Teflon™ hoops (concentric
Teflon™ rings). The hoops were attached to a mixer shaft and rotated. As shown in Fig.1,
the stirred alcoholic suspension of ZrOCl2.8H2O was heated to 70°C, pumped at a rate of 3
mL/min and, dripped onto the top side of the PTFE porous film so that it was well
distributed. Periodically, dripping was stopped to allow the alcohol in the suspension to
evaporate while the membrane continued to rotate. Once the membrane appeared to be dry,
dripping began again. This procedure was repeated until the total amount of the alcoholic
suspension had been used.
Fig . 1. Membrane synthesis set-up.
The membranes containing ZrOCl2.8H2O were then immersed in H3PO4 for 72
hours. This caused the reaction in Eq. 1 to occur. Subsequently the membrane was rinsed
gently with de-ionized water and isopropanol (ratio of 50:50 by volume) twice and oven

46
dried for 24 hours at 120 C. The boiling point of glycerol is 290 °C [17]. Therefore, the
majority of the glycerol was not expected to evaporate under the 120 °C maximum
temperature membrane drying conditions.
A sample of the membrane prepared as described above was cut, weighed, and then
further processed in a tube furnace (wet test) at 200 °C for 1.5 hours with continuous H2O
injection under Argon (Ar) at an H2O/Ar molar ratio of 6, yH2O = 0.86. This condition was
chosen because it is the stoichiometric ratio in the direct propane fuel cell reaction where
H2O is a reactant. After processing, the membrane sample was re-weighed and placed in a
sealed non-porous Teflon bag and then examined by electrochemical impedance
spectroscopy (EIS).
4.2.2. Synthesis of a glycerol / PTFE membrane
The membranes that were composed only of PTFE and glycerol, without
ZrOCl2.8H2O, were prepared as follows. The Sterlitech PTFE unlaminated film was cut and
weighed. A specified amount of glycerol was added drop-wise while the weight was
recorded on a digital balance scale. The film was then folded and cold pressed at 96.7 psig
using a Carver press, model 3856.
4.2.3. Investigation of the composite membranes proton conductivity
Electrochemical impedance spectroscopy (EIS) measurements were made on the
various membranes. A four probe measurement method was performed using a Parstat 2273
instrument and PowerSuite 2.58, 2003 electrochemical software, over a frequency range of 1
– 100 kHz. The resulting impedance data were used to make Nyquist plots. The value of
the real electrolyte resistance, R, was obtained from the intersection of the line on the
Nyquist plot with the x-axis. After measuring the membrane thickness, d, and area, A, the
proton conductivity, was obtained from Eq. 2 [18]:
= d / (R×A) (2)

47
4.2.4. Characterization techniques: scanning electron microscopy (SEM) and energy
dispersive X-ray spectroscopy
Scanning Electron Microscopy (SEM) was performed using a JEOL JSM-7500F
Field Emission Scanning Microscope. Prior to examination of membrane cross-sections, the
membranes were immersed in liquid nitrogen and freeze–fractured. The freeze-fractured
samples were further studied using the COMPO (composition analysis) feature in SEM. i.e.
the use of back scattered electrons in order to detect the contrast between areas of different
compositions (atomic numbers) at the membrane cross section. Energy-dispersive X-ray
spectroscopy (EDS) was used to identify the elemental composition of some samples.
4.3. Experimental results
4.3.1 Membrane morphology studies
The composite membranes prepared in this study have two solid phase components,
zirconium phosphate (ZrP) and a porous polytetrafluoethylene (PTFE) film, plus in some
cases a liquid phase component, glycerol (GLY). Previously we investigated ZrP powder
without the PTFE film [15]. A scanning electron micrograph (SEM) of the PTFE film used
in the composite membranes is shown in Fig. 2(a) in its as received condition. The spaces
between the strands of PTFE form pores that appear to be oblong in shape with a typical
narrow dimension near 1 μm and a typical long dimension near 2 μm. These dimensions are
somewhat different than the 0.22 μm pore size provided by the manufacturer. The 0.22 μm
pore size is the absolute pore size value that was determined by the manufacturer using the
bubble point test with isopropanol.
The SEM image in Fig. 2(b) shows a ZrP composite membrane after the PTFE pores
had been filled with ZrP using a preparation method that did not use glycerol. The surface is
composed of flakes of zirconium phosphate material (ZrP) that cover the PTFE surface. A

48
typical flake size is greater than 1 μm. Conductivity, in the order of 10-5
S cm-1
was reported
for this membrane.
(a) (b)
.
The top view of a ZrP– PTFE composite membrane prepared using a GLY/ZrP mass
ratio, MRGLY/ZrP, of 0.4 is shown in Fig. 3. Fig. 3(a) and 3(b) are for the same film but at
different magnifications, 1900 for (a) and 5000 in (b). The comparison between Fig. 2 and
3 reveals a difference in morphology. The presence of glycerol has changed the ZrP particles
morphology from the flakes larger than 1 μm in Fig. 2(b) into nearly spherical particles in
the range of 100 nm to 500 nm that have formed aggregates in some regions. In addition, it
is apparent that the spherical particles in Fig. 3(b) are definitely smaller than the pore
dimensions in Fig. 2(a).
One possible explanation for the spherical shape of the particles is that the glycerol
molecules, HOCH2-CHOH-CH2OH, might have occupied positions near the ZrOCl2.8H2O
solid. Specifically the OH groups might have been adjacent to the ZrOCl2.8H2O solid and
1 µm 1 µm
Fig . 2. Scanning electron microscopy (SEM) images for; (a) top view of the Sterlitech
PTFE (Teflon) film as received and (b) top view of a ZrP-PTFE composite membrane
prepared without the use of glycerol.

49
the CH or CH2 groups might have been adjacent to the PTFE. Such positioning would be
consistent with the values of solubility parameters that can be used to assess the
compatibility of materials. One common use of solubility parameters is to describe
miscibility of two liquid phase components (like dissolves like). In this case PTFE has a
solubility parameter of 14 MPa1/2
. Examples of solubility parameters of alkanes are pentane
= 14.4 MPa1/2
and hexane = 14.9 MPa1/2
. The solubility parameters for the CH and CH2
groups (alkane structures) in glycerol might be similar to the solubility parameter for PTFE.
Similarly ZrOCl2•8H2O has many OH groups that would be compatible with the OH groups
in glycerol. Specifically, the solubility parameter for water is 47.8 MPa1/2
and the value for
glycerol (OH groups plus CH groups) is 36.2 MPa1/2
. These numbers suggest that glycerol
would be a suitable molecule to be located at the interface between a hydrophobic region,
PTFE, and a hydrophilic region Zr(HPO4)2•H2O. Nafion, one of the best fuel cell
membranes, also has hydrophobic and hydrophilic regions.
Furthermore, the small spherical shape of the ZrP particles/aggregates seen in the
SEM images might have resulted from the presence of glycerol that has a high surface
tension, combined with successive wetting and drying cycles inside the confined PTFE
hydrophobic pores.
(a) (b)
10 µm 1 µm
Fig . 3. Scanning electron microscopy (SEM) images for: Top view of a ZrP – PTFE
membrane prepared with a GLY/ZrP mass ratio of 0.4, having magnifications of (a) 1900
and (b) 5000.

50
A cross-sectional view of the same ZrP-PTFE composite membrane shown in Fig. 3
(top view) is shown after freeze-fracturing in Fig. 4 at two magnifications. At the higher
magnification several features of the composite membrane morphology can be seen:
individual ZrP particles, agglomerates of ZrP particles, some strands of the PTFE polymer,
and some void spaces. The void spaces are undesirable since if they were connected, they
would provide a path for species to cross over the membrane from one electrode to the other.
The SEM image of the membrane cross-section in Fig. 4 at the higher magnification
confirms the individual particle size range of 100 to 500 nm.
A cross sectional view after freeze-fracturing of a different composite membrane,
having a GLY/ZrP mass ratio, MRGLY/ZrP, of 0.4 is shown in Fig. 5a. The composition of the
cross-section was measured by the COMPO feature in SEM which reveals a contrast based
on the atomic number of each component, i.e., ZrP appears in a whiter shade. The results
are shown in Fig. 5(b). At this scale of observation it appears that the ZrP particles were
deposited almost uniformly across the thickness of the composite membrane, indicating that
the pores were filled with ZrP.
10 µm 1 µm
Fig . 4. SEM image for a cross sectional view of ZrP – PTFE membrane prepared with a
GLY/ZrP mass ratio of 0.4 at different magnifications.
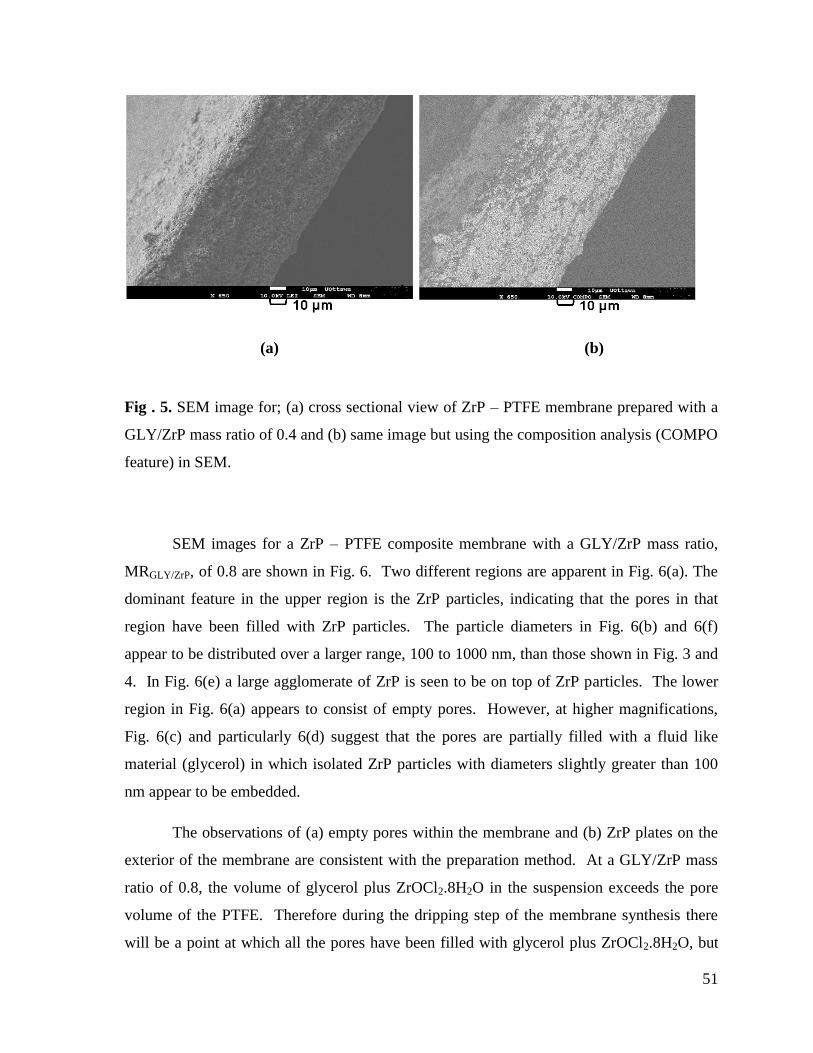
51
(a) (b)
Fig . 5. SEM image for; (a) cross sectional view of ZrP – PTFE membrane prepared with a
GLY/ZrP mass ratio of 0.4 and (b) same image but using the composition analysis (COMPO
feature) in SEM.
SEM images for a ZrP – PTFE composite membrane with a GLY/ZrP mass ratio,
MRGLY/ZrP, of 0.8 are shown in Fig. 6. Two different regions are apparent in Fig. 6(a). The
dominant feature in the upper region is the ZrP particles, indicating that the pores in that
region have been filled with ZrP particles. The particle diameters in Fig. 6(b) and 6(f)
appear to be distributed over a larger range, 100 to 1000 nm, than those shown in Fig. 3 and
4. In Fig. 6(e) a large agglomerate of ZrP is seen to be on top of ZrP particles. The lower
region in Fig. 6(a) appears to consist of empty pores. However, at higher magnifications,
Fig. 6(c) and particularly 6(d) suggest that the pores are partially filled with a fluid like
material (glycerol) in which isolated ZrP particles with diameters slightly greater than 100
nm appear to be embedded.
The observations of (a) empty pores within the membrane and (b) ZrP plates on the
exterior of the membrane are consistent with the preparation method. At a GLY/ZrP mass
ratio of 0.8, the volume of glycerol plus ZrOCl2.8H2O in the suspension exceeds the pore
volume of the PTFE. Therefore during the dripping step of the membrane synthesis there
will be a point at which all the pores have been filled with glycerol plus ZrOCl2.8H2O, but

52
not all of the ZrOCl2.8H2O necessary to fill the pores (Fig. 6(c)) will have been dripped onto
the PTFE. As the dripping step continues the additional glycerol and at least some of the
additional ZrOCl2.8H2O, [and as a result eventually some of the ZrP] will be located on the
exterior of the PTFE, Fig. 6(f). The presence of glycerol inside the pores without the
corresponding quantity of ZrOCl2.8H2O would support the suggestion that there would be
some pores that do not contain ZrP. In addition the deposition of glycerol plus
ZrOCl2.8H2O on the membrane exterior after all the pores had been filled with glycerol
would suggest that ZrP deposits (flakes) would be formed on the membrane exterior.
EDS measurements (not shown here) were performed on the agglomerated region
that appeared in in Fig. 6(e). The results for the agglomerate were compared with other
EDS analyses for ZrOCl2.8H2O and for ZrP powder. The composition of the agglomerated
region resembled that of ZrP with a minor shift in some peaks, plus large oxygen peaks.
High oxygen content was attributed to the presence of glycerol. This suggested that the
agglomerated region in Fig. 6(e) is ZrP material associated with glycerol.

53
1 µm
1 µm
1 µm 1 µm
(a) (b)
(c) (d)
10 µm 1 µm (e) (f)
Fig . 6. A top view SEM image of a ZrP – PTFE composite membrane prepared with a
GLY/ZrP mass ratio of 0.8. (a) two distinct regions in the same range, an upper region of
ZrP particles and a lower region of empty pores, (b) and (f) ZrP particles at greater
magnifications, (e) a large agglomerate of ZrP on top of the ZrP particles, (c) and (d)
empty pores at greater magnifications showing the presence of a fluid-like material
(glycerol) adhering to the strands of PTFE.

54
4.3.2. Effect of glycerol on conductivity in films of PTFE
The conductivity of the porous PTFE film (Sterlitech unlaminated film) used in these
composite membranes was measured by EIS as received with no additives. An erratic or
irregular pattern was apparent. Such a pattern might be expected for a material that does not
posses proton conducting properties. Conductivities for PTFE as low as 10-13
S cm-1
have
been reported in literature [12].
Different amounts of glycerol were added to a set of porous Sterlitech PTFE films.
Their impedance plots are shown in Fig. 7 as a function of the GLY/ PTFE mass ratio
(MR)GLY/PTFE . The presence of glycerol caused the PTFE film to change from being an
insulator material to being a conductor. Specifically, the resistance of the PTFE film
decreased as its glycerol content increased. Overall, glycerol in the PTFE film caused the
conductivity to increase by several orders of magnitude, from 10-13
S cm–1
to 10-4
S cm–1
. In
the Nyquist plot, the imaginary component of the impedance is a linear function of the real
component of the impedance. That linear relationship is typically associated with proton
conduction being related to a diffusion phenomenon that results from a gradient in the
concentration.

55
Fig . 7. Electrochemical impedance spectroscopy pattern for a porous Sterlitech PTFE films
containing specified GLY/ PTFE mass ratios.
The resistances obtained in Fig. 7 are shown in Table 1. The conductivities were
calculated from the resistances using Eq. 2, and are also shown in Table 1. It is seen that
there is a linear relationship between the GLY/PTFE ratio and the conductivity.
Table 1: Resistances of PTFE films containing glycerol.
Mass Ratio [GLY/ PTFE]
MRGLY/PTFE
Resistance [ Ohms] Conductivity [S cm–1
]
0.04 3600 6.49*10-6
0.08 660 3.50*10-5
0.17 150 1.56*10-4
1
100
10000
1000000
0
4000
8000
12000
16000
20000
24000
28000
0 2500 5000 7500 10000 12500 15000 17500 20000
FR
EQ
UE
NC
Y [
Hz]
.
Z IM
AH
[Oh
m]
.
Z REAL [Ohm]
R=3600 OhmGlycerol (g)/ PTFE (g) =0.04
R=660 Ohm
Glycerol (g)/ PTFE(g)=0.08
R=150 Ohm
Glycerol (g)/PTFE(g)=0.17

56
EIS measurements were also made on the composite membranes that had been
prepared by filling the pores of the PTFE film with solid particles of zirconium phosphate.
A Nyquist plot obtained by EIS for a ZrP–PTFE composite membrane that did not contain
any glycerol is shown in Fig. 8. The semi-circular shape on the left-hand (high frequency)
side of the Nyquist plot in Fig. 8 is typically associated with a combination of (a) a double
layer and (b) charge transfer reaction kinetics, resulting from a gradient in the electrical
potential. The linear portion at the low frequency end of Fig. 8 is typically associated with
diffusion resulting from a concentration gradient. It is similar in shape to those reported in
the literature for crystalline ZrP [19] but different than some of our previous results for
amorphous ZrP [15]. Its resistance (R= 1000) and conductivity (1.7 10-5
S cm–1
) were of
the same order of magnitude as the values for PTFE films that contained glycerol. That
observation suggests that the addition of ZrP to PTFE has an influence on the magnitude of
the conductivity that is somewhat similar to the addition of glycerol.
A Nyquist plot is shown in Fig. 9 for a ZrP – PTFE composite membrane to which
glycerol had been added. Its glycerol to ZrP mass ratio, MRGLY/ZrP was 0.4. The resistance
of the glycerol containing composite membrane in Fig. 9 was orders of magnitude less than
that of the glycerol-free composite membrane in Fig. 8. While the conductivities of the two
component materials, 6.9×10⁻⁵
– 1.5×10⁻⁴
S cm–1
for the GLY/PTFE membrane in Fig. 7,
and 1.7×10⁻⁵
S cm–1
for the ZrP/PTFE membrane in Fig. 8, were much greater than PTFE
alone, the combination of the three components, in Fig. 9, had a conductivity, 2×10⁻²
S cm–1
,
that was vastly superior to either of the two component materials. The shape of the Nyquist
plot in Fig. 9 is indicative of diffusion.

57
Fig . 8. Electrochemical impedance spectroscopy pattern for a ZrP –PTFE composite
membrane that did not contain glycerol.
A Nyquist plot for a ZrP composite membrane having an MRGLY/ZrP of 0.8 is shown
in Fig. 10. In general its shape was similar to that in Fig. 9. However, its resistance, 3
Ohms, was slightly larger and its conductivity, 6.5 10-3
S cm–1
, was slightly smaller than
the corresponding values derived from Fig. 9. The poorer performance with an MRGLY/ZrP
value of 0.8 is consistent with the morphology seen in Fig. 6, where some of the pores did
not contain ZrP particles and the external membrane surface contained comparatively large
ZrP agglomerates.
1
10
100
1000
10000
100000
1000000
10000000
0.00E+00
2.30E+05
4.60E+05
6.90E+05
9.20E+05
1.15E+06
1.38E+06
0.00E+00 5.00E+05 1.00E+06 1.50E+06 2.00E+06 2.50E+06 3.00E+06
FR
EQ
UE
NC
Y [
Hz]
.
Z I
MA
G[O
hm
] .
Z REAL [Ohm]
R=1000 Ohm

58
Fig . 9. Electrochemical impedance spectroscopy pattern for a ZrP –PTFE composite
membrane having a Glycerol / ZrP mass ratio of 0.4.
Fig . 10. Electrochemical impedance spectroscopy pattern for a ZrP –PTFE composite
membrane having a Glycerol / ZrP mass ratio of 0.8.
1
100
10000
1000000
0
2000
4000
6000
8000
10000
12000
14000
16000
18000
0 500 1000 1500 2000 2500 3000 3500 4000 4500
FR
EQ
UE
NC
Y [
Hz]
.
Z IM
AG
[Oh
m] .
Z REAL [Ohm]
R=1 Ohm
10
1000
100000
10000000
0
100
200
300
400
500
600
700
800
900
0 25 50 75 100 125 150 175 200 225 250
FR
EQ
UE
NC
Y [
Hz]
.
Z IM
AG
[Oh
m]
.
Z REAL [Ohm]
R=3 Ohm

59
The conductivity results for the GLY/ZrP/PTFE composite membranes are shown in
Fig. 11 as a function of the GLY/ ZrP mass ratio, MRGLY/ZrP. The proton conductivity
increased by several orders of magnitude when glycerol was introduced to the ZrP/PTFE
composite membranes. The proton conductivity reached a maximum value (0.02 – 0.045 S
cm-1
) when the GLY/ ZrP mass ratio was in the region of 0.2 to 0.4. It is also evident from
Fig. 11 that the proton conductivity decreased by almost an order of magnitude when the
MRGLY/ZrP was increased to 0.8. This result is consistent with what was presented earlier by
the SEM images showing that larger spherical particles were formed at this MRGLY/ZrP ratio,
i.e., a decrease in the total surface area of ZrP particles leads to a decrease in the proton
conductivity. Furthermore, the non-uniform distribution of ZrP and the appearance of two
distinctive regions of ZrP and glycerol (referring to Fig. 6 (a) and (e) might have contributed
to the decrease in proton conductivity.
Fig . 11. Change of proton conductivity (σ) S cm-1
with glycerol /ZrP mass ratio in the
composite membrane.

60
Proton hopping is generally considered to be the mechanism that is responsible for
proton conductivity. For example, proton hopping in water has been extensively reviewed
[20]. Similarly, protons could be expected to hop between the oxygen atoms in the OH
groups in glycerol, HOCH2-CHOH-CH2OH. That might be an explanation for the
conductivity observed in GLY/PTFE membranes. In ZrP, each zirconium atom is associated
with a Zr(HPO4)2•H2O structure that has two OH groups and one H2O molecule. Hopping
between the oxygen atoms in the OH groups and the water of hydration within a
Zr(HPO4)2•H2O structure molecule might be expected.
Proton conductivity on the external surfaces of ZrP particles has also been suggested
as a phenomenon. Alberti et al. [21, 22] showed that the conductance of ZrP decreased with
the increase in the degree of crystallinity and that although the fraction of the surface
covered with protons is small, their mobility is 104 greater than the protons in the bulk.
Thus, greater external ZrP surface area, results in greater proton conductivity.
The conductivity results obtained in this work have been compared with some
literature values in Table 2. PTFE is an insulator. In contrast the conductivity of ZrP
particles is orders of magnitude greater than that for PTFE. When the void volume of
porous PTFE was filled with glycerol, the conductivity was as good as or better than that of
ZrP particles. When a dry ZrP/PTFE membrane was composed of a combination of a
porous PTFE film plus flakes of ZrP the conductivity was comparable to that of dry ZrP
particles. However when the ZrP/PTFE membrane was composed of a combination of
PTFE particles and ZrP particles compressed together, there was an order of magnitude
increase in the conductivity compared to the combination of porous PTFE and ZrP flakes.
Finally when ZrP was formed in-situ within the pores of a porous PTFE in the presence of
glycerol, the conductivity increased by two orders of magnitude. The conductivity of the
GLY/ZrP/PTFE composite membrane approached 40% of the value for Nafion.
Furthermore, that value was maintained when the temperature was increased from 20 to
200°C provided the steam to feedstock ratio was typical of that required for a direct propane
fuel cell.

61
Table 2 : Summary of conductivity results
Material Proton
Conductivity
[Scm–1
]
Literature Value
Proton Conductivity
[S cm–1
]
This work
PTFE [12] 10 -13
ZrP (particles)
Crystallites – dry [23,24]
Amorphous – dry [15]
Amorphous – wet [15]
10–6
– 10 -5
10–5
10–4
GLY/PTFE (porous film) 0.7 – 1.5 ×10⁻⁴
ZrP(particles)-PTFE (particles)
– dry [12]
10–4
– 10–3
ZrP(flakes)-PTFE (porous film)
– dry [15]
10–5
1.7×10⁻⁵
GLY–ZrP(spheres)-PTFE(porous film)
– dry
– wet (yH2O = 0.86 at 200°C)
0.02– 0.045
0.015
Nafion – 20 C and 95 % Relative
Humidity [25]
– 120°C and 90 % Relative Humidity [25]
0.12
0.013
62
The inclusion of glycerol in the GLY/ZrP/PTFE membrane made two differences.
The morphology of the ZrP changed from flakes to small spheres. Also the surfaces of the
solid ZrP spheres were in contact with glycerol. It is possible that the enhancement in
conductivity in the GLY/ZrP/PTFE membranes may have been caused by proton transport at
the interface between the small solid ZrP spheres and their glycerol coating. In addition to
two bulk phenomena, proton transport though ZrP and proton transport thorough glycerol,
surface phenomena may have also contributed to the conductivity. Presumably two surface
phenomena, proton transport on solid ZrP surfaces and proton hopping via the OH groups in
glycerol, may have been operating simultaneously. Because the PTFE pores contained a
large number of small spheres, together they would have a large surface area. The
combination of the two proton surface transport mechanisms plus the large interfacial area
may help to explain the two order of magnitude improvement in conductivity. Furthermore,
the high surface tension of glycerol and the successive wetting and drying cycles inside the
hydrophobic pores have favored the formation of small aggregates of ZrOCl2. The presence
of glycerol has prevented these aggregates from coalescing, hence, the formation of nano-
scale particles within the confined environment existing in the PTFE pores. These particles
were relatively spherical in shape resulting in a high total surface area and a highly
conducting membrane.
4.4. Conclusions
Glycerol was found to enhance the proton conductivity when added to both a porous
PTFE film and a ZrP/PTFE composite membrane. Small spheres of ZrP (100 – 500 nm)
were observed in the GLY/ZrP/PTFE composite membrane. The enhanced conductivity
may have been caused by a combination of proton transport on the increased surface area on
the exterior of the small ZrP spheres plus proton hopping using both the OH groups in
glycerol and the ZrP bulk. The conductivity of GLY/ZrP/PTFE composite membranes at
20°C approached 40 % of the conductivity of a Nafion membrane. This proton conductivity
was maintained when the membrane was processed at 200°C in the presence of a steam
partial pressure typical of a direct propane fuel cell. For fuel cell operations above the

63
boiling point of water, these membranes could be promising alternatives to Nafion
membranes.
4.5 Acknowledgments
The authors are grateful for the financial support from the Canadian federal
government’s Natural Sciences and Engineering Research Council and from the Ontario
provincial government’s Ministry of Research and Innovation (Ontario Fuel Cell Research
and Innovation Network). The authors wish to also thank Dr. Takeshi Matsuura for his
assistance in providing some literature references.
4.6 References
1. P. J. James, J. A. Elliot, T. J. McMaster, J. M. Newton, A.M.S. Elliot, S. Hanna, M.
Miles, , J. Mater. Sci. 35 (2000) 5111.
2. J.L. Zhang., Z. Xie , J. Zhang , Y. Tang, C. Song , T. Navessin, Z. Shi, D. Song, H.
Wang, D. Wilkinson, Z. Liu, S. Holdcroft, J. Power Sources 160 (2006) 872.
3. C. Yang, S. Srinivasan, A. Bocarsly. , S. Tulyani, J.B. Benziger, J. Membr. Sci. 237
(2004) 145.
4. W. G. Grot, G. Rajendran, US Patent 5,919,583, 1999.
5. C.B. Amphelett, L.A. McDonald, M.J. Redman., J. lnorg. Nucl. Chem. 6 (1958)
220.
6. A. Clearfield, J.A. Stynes, J. Inorg. Nucl. Chem. 26 (1964) 117.
7. R.P. Hamlen, J. Electrochem. Soc. 109 (1962) 746.

64
8. O. Savadogo, J. Power Sources 127 (2004) 135.
9. H. Hou, G. Sun, Z. Wu, W. Jin,, Q. Xin, Inter. J. Hydrog. Energ. 33 ( 2008 ) 3402.
10. F. Bauer, M.Willert-Porada, Fuel Cells 6 (2006) 261.
11. M. Casciola, D. Capitani, A. Comite, A. Donnadio, V. Frittella, M. Pica, M.
Sganappa, A. Varzi, Fuel Cells 8 (2008) 217.
12. Y. Park, K. Jae-Dong, M. Nagai, J. Mater. Sci. Lett. 19 (2000) 1735.
13. F. Liu, B. Yi, D. Xing, J. Yu, H. Zhang, J. Membr. Sci. 212 (2003) 213.
14. R. Jiang, H.R. Kunz, J. Fenton, Electrochim. Acta 51 (2006) 5596.
15. A. Al-Othman, A. Y. Tremblay, W. Pell , S. Letaief ,T.J. Burchell, B. A. Peppley, M.
Ternan, J. Power Sources 195 (2010) 2520.
16. H.L. Lin , S.H. Yeh, T. L. Yu, L.C. Chen, J. Polym. Res. 16 (2009) 519.
17. M.C. Burshe, S.B. Sawant, V.G. Pangarkar, J. Am. Oil Chem. Soc. 76 (1999) 209.
18. Y.J. Wang, Y. Pan, L. Chen, Mater. Chem. Phys. 92 (2005) 354.
19. D. Bianchi, M. Casciola, Solid State Ionics 17 (1985) 7.
20. E. Gileadi, E. Kirowa-Eisner, Electrochim. Acta 51 (2006) 6003.
21. G. Alberti , E. Torracca, J. lnorg. Nucl. Chem. 30 (1968) 1093.

65
22. G. Alberti, M. Casciola, U. Costantino, G. Levi, G. Ricciardi, J. Inorg, Nucl. Chem.
40 (1978) 533.
23. H. Patel, U. Chudasam, J. Chem. Sci., 119 (2007) 35.
24. A. Clearfield, Annu. Rev. Mater. Sci. 14 (1984) 205.
25. M. Casciola, G. Alberti, M. Sganappa, R. Narducci, J. Power Sources 162 (2006)
141.

66
CHAPTER FIVE
A modified silicic acid (Si) and sulphuric acid (S) –ZrP/PTFE/Glycerol
composite membrane for high temperature direct hydrocarbon fuel cells
Amani Al-Othman a,b
, André Y. Tremblaya, Wendy Pell
b, Sadok Letaief, Yun Liu
b,
Brant A. Peppleyc, Marten Ternan
d
(a) Chemical and Biological Engineering, University of Ottawa, 161 Louis Pasteur, Ottawa, ON K1N
6N5, Canada
(b) Catalysis Centre for Research and Innovation, University of Ottawa, 30 Marie-Currie, Ottawa, ON
K1N 6N5, Canada
(c) Chemical Engineering, Queens University, Dupuis Hall, Kingston, ON K7L 3N6, Canada
(d) EnPross Inc., 147 Banning Road, Ottawa, ON K2L 1C5, Canada

67
Chapter 5- A modified silicic acid (Si) and sulphuric acid (S) –
ZrP/PTFE/Glycerol composite membrane for high temperature direct
hydrocarbon fuel cells
ABSTRACT
Composite membranes composed of modified S or Si–zirconium phosphate (ZrP), porous
polytetrafluoethylene (PTFE) and, glycerol (GLY) were synthesized in this work. ZrP was
precipitated via the in-situ reaction of zirconium oxychloride (ZrOCl2) with phosphoric acid
(H3PO4). Silicic acid and sulphuric acid were introduced as additives to phosphoric acid
with variable Si/P or S/P mass ratios in the acid solution/suspension. The modified
membranes were investigated as electrolytes for direct hydrocarbon fuel cells operating at
temperatures~200°C. Our previous work described a composite membrane
(ZrP/PTFE/GLY) synthesis that possessed a proton conductivity of 0.045 S cm–1
. The
present work shows that adding a small amount of silicic acid to phosphoric acid enhanced
the proton conductivity, i.e. by having an Si/P mass ratio of (0.01) in the acid
solution/suspension, the Si-ZrP/PTFE/GLY membrane conductivity was 0.073 S cm–1
. This
value approached the conductivity of Nafion (0.1 S cm–1
). The results also showed that
adding sulphuric acid to phosphoric acid led to a significant decrease in the membrane’s
proton conductivity. The enhancement of proton conductivity for the Si-ZrP/PTFE/GLY
composite membrane might be attributed to the improvement in water retention properties
and the possible formation of the Si–O–P bond.
5.1 Introduction
Proton exchange membrane fuel cells (PEMFC) currently operate at temperatures
around 80 °C with pressures between 1 and 5 bars. PEMFC are attractive for their several
advantages including the high power density, and all solid construction. By far, the
conventional perfluorosulfonic acid (PFSA) membrane (Nafion) is the most commonly used
membrane in PEMFC.

68
The incentives for high temperature operation in PEMFC are, 1) increasing the
reaction kinetics, 2) reduction and /or the elimination of the liquid water accumulation inside
the fuel cell, mainly at the cathode, and 3) heat generation at greater temperatures. The
reduction of the liquid phase will diminish the diffusion resistance, thus, more molecules
will have easier access to the reaction sites.
The proton conductivity of Nafion and similar PFSA membranes is known to be
strongly dependent on the water content needed to solvate the proton of the sulfonic acid
groups. Although increasing the temperature is beneficial in the operation of PEMFC, the
membrane material is still one of the main obstacles. Higher temperatures cause the PFSA
(Nafion) membranes to dehydrate, i.e. a dramatic decrease in proton conductivity.
Therefore, alternative materials have been explored to replace the existing PFSA
membranes. These membrane materials are made of sulfonated aromatic compounds,
solution polymers membranes, inorganic-organic composite membranes, or acid base
polymer materials [1].
Various studies have investigated the synthesis of sulfonated aromatic compounds
for fuel cell applications. Examples are the work of Chikashige et.al. [2], in which
sulfonated poly (arylene ether) ionomers were prepared and, the work of Kang et.al. [3], in
which polybenzimidazole compounds were prepared. Other studies explored the synthesis
of solution polymer membranes such as the work of Kim et.al. [4]. Extensive efforts aimed
at modifying the existing PFSA membranes based on the procedure of Grot [5], to enhance
their water retention properties. Grot proposed the incorporation of inorganic fillers in
membranes. The result is an inorganic-organic composite membrane. The preparation
methods for such membranes are variable. They include the in situ precipitation of the
inorganic material within the polymer matrix, and the introduction of the inorganic material
into the polymer dispersion.
Nafion membranes have been modified by the incorporation of metal hydrogen
phosphates, such as zirconium phosphate (ZrP), a solid proton conductor [6,7], by the
incorporation of silica [8], an inorganic compound, and by the incorporation of metal oxides
particles [9]. In particular, the incorporation of silica in Nafion has received a considerable
attention in the literature due to the hygroscopic nature of silica compounds. Examples are

69
the work of Pereira et.al.[10], in which a Nafion/mesoporous silica membrane was prepared,
and the work of Ke et.al. [11], where nano-sized Nafion/ SiO2 were formed in-situ by the
sol-gel process.
Zirconium phosphate Zr(HPO4)2.H2O, (ZrP), is one example of an inorganic material
that has the attractive characteristics of: 1) possessing proton conductivity and, 2) a layered
structure permitting the passage of guest molecules, 3) having weak acidic groups; thus,
allowing the exchange of the protons in the POH group with other cations [12]. As a result,
the admitted cations accommodated within the layers are expected to cause a change in the
interlayer distance depending on the size of the guest molecule. Other examples of
inorganic materials in composite membranes are ZrO2 and TiO2. These oxides have
attracted attention of scientists due to their water uptake properties.
This work describes an improvement over our previous synthesis of Nafion–free
ZrP/PTFE/Glycerol (GLY) composite membranes [13]. It is aimed at modifying the ZrP
PTFE/GLY membranes using a second acid, either sulphuric acid (H2SO4) or silicic acid
(SiO2.H2O). The modified S and Si–ZrP/PTFE/Glycerol composite membranes were
investigated as potential electrolytes for high temperature PEMFC. To our knowledge, this
type of composite membranes, with this combination of electrolyte materials, has not been
reported in literature. Phosphoric acid solutions (H3PO4) containing small amounts of either
sulphuric acid (H2SO4) or silicic acid (SiO2.H2O, or H2O3Si) were used to react with
zirconium oxychloride (ZrOCl2.8H2O) to form modified ZrP. By having solutions, in which
the acids are mutually soluble, it was expected that a small proportion of the “P” atoms in
the resultant ZrP could be replaced by either “S” atoms or “Si” atoms. Therefore, it is
expected that the incorporation of “Si” would result in zirconium phosphate
(Zr(HPO4)2.H2O) material, and a minor fraction of Zr(H2SiO4)2.H2O, thus, increasing the
OH groups in the ZrP lattice. The incorporation of “S” on the other hand is anticipated to
decrease the number of OH groups in the ZrP lattice by yielding a minor fraction of material
that has the formula Zr(SO4)2.H2O. Since the Grotthus mechanism of proton conduction
[14], is proton hopping between either water molecules or OH groups, the proton
conductivity was expected to increase with increasing the OH groups in the composite
membranes. In this work, the following investigations were performed on the composite

70
membranes: 1) changes in the ZrP morphology upon the introduction of Si and S and, 2) the
evaluation of the modified composite membranes for proton conductivity.
5.2. Experimental
5.2.1. Synthesis of S - ZrP /PTFE/Glycerol and Si-ZrP/PTFE/Glycerol composite
membranes
Unlaminated Sterlitech PTFE films (with a nominal thickness of 50 μm and a
nominal pore size of 0.22 μm) were used as the porous starting material in this work.
Zirconium oxychloride, ZrOCl2•8H2O (Sigma Aldrich) was reacted with 85% o-phosphoric
acid (Fisher Scientific) to produce zirconium phosphate, Zr(HPO4)2•H2O, ZrP according to
the chemical reaction described in equation (1) [15].
ZrOCl2•8H2O + 2 H3PO4 → Zr(HPO4)2•H2O + 2 HCl + 8 H2O (1)
Ethanol (anhydrous ethyl alcohol from Commercial Alcohols Inc.), glycerol
(certified ACS, assay 99.7% from Fisher Scientific) and iso-propanol (HPLC grade, assay
99.8% from EMD) were obtained to prepare the alcoholic suspension of ZrOCl2•8H2O.
ZrOCl2•8H2O suspension was prepared using 50 mL of ethanol, 2 mL of water, 150 mL of
isopropnaol and a specific amount of glycerol (GLY). GLY was added in order to vary the
GLY/ZrP mass ratio in the composite membrane. The alcoholic suspension was placed on a
stirring hot plate and vigorously mixed using a magnetic stirrer.
The PTFE film was first weighed, then placed between Teflon™ hoops. The
Teflon™ hoops were attached to a mixer shaft. The stirred alcoholic suspension was heated
at 70 C, and then introduced into the pores of the PTFE film as the hoops rotated. It was
dripped onto the top side of the PTFE porous film so that it was well distributed. Dripping
was periodically stopped to allow the evaporation of alcohol while the membrane continued
to rotate. The dripping was started again once the rotating membrane appeared to be dry.
This procedure was repeated until the total amount of alcoholic suspension of ZrOCl2.8H2O
was consumed. The resulting membranes were then immersed in H3PO4 for 72 hours,
allowing reaction in Eq. (1) to take place. In subsequent experiments, the zirconium

71
phosphates (ZrP) material was modified by adding either sulphuric acid or silicic acid to
phosphoric acid. For example, SiO2.H2O (- 80 mesh powder, from Sigma Aldrich) was
added to phosphoric acid with variable quantities to study the effect of various Si/P mass
ratios. At some Si/P mass ratios, silicic acid was in solution. However, the solubility of
silicic acid in phosphoric acid is limited. The maximum amount observed to dissolve was
0.1 g SiO2.H2O in 20 mL of 85% H3PO4. In some experiments, silicic acid was in solution,
however, at higher Si/P ratios, when the solubility limit was exceeded, part of it was in
solution while the other part appeared in suspension. Sulphuric acid (A.C.S reagent from
Fisher Scientific) was also used to modify the membranes. Specified volumes of sulphuric
acid were added to phosphoric acid in such a way to vary the S/P mass ratio in the acid
solution. The membranes were then immersed in the acid solutions for 72 hours and then,
were gently rinsed with de-ionized water and isopropanol (ratio of 50:50 by volume)
followed by drying in the oven for 24 hours at 120 C.
A high temperature processing test was performed at 200 °C for a sample of an Si-
ZrP/PTFE/GLY membrane. The sample was first cut, weighed then put in a tube furnace
under a combination of heat treatment and elevated water vapour pressure for 30 minutes.
H2O and argon were injected at an H2O/Ar molar ratio of 6, and yH2O = 0.86 (wet test). This
H2O/Ar molar ratio is identical to the H2O/C3H8 ratio in the direct propane fuel cell reaction
where H2O is a reactant. The processed membrane sample was then re-weighed and placed
in a sealed non–porous Teflon bag and sent for electrochemical impedance spectroscopy
(EIS) analysis.
5.2.2. Characterization of the S- ZrP /PTFE/Glycerol and Si- ZrP/PTFE/Glycerol
composite membranes
Proton conductivity measurements were performed using electrochemical impedance
spectroscopy (EIS) by the four probe method. A Parstat, 2273 instrument and PowerSuite
2.58, 2003 electrochemical software were used. The measurement was done over a
frequency range of 1 – 100 kHz. As explained in our earlier work [13], the value of the real
electrolyte resistance, R, was obtained from the intersection of the line on the Nyquist plot

72
with the x-axis. The membrane thickness, d, was measured and the cross sectional area of
the sample, A, was calculated. The proton conductivity () was obtained from Eq. 2 [16]:
= d / (R×A) (2)
The surfaces of the composite membranes were examined by scanning electron
microscopy (SEM). SEM was performed using a JEOL JSM-7500F Field Emission
Scanning Microscope. Some composite membrane samples were freeze-fractured using
liquid nitrogen prior to SEM analyses to examine their cross sections. Further analysis for
the composite membranes was performed using Fourier transform infrared spectrometer,
FT-IR analysis, using an FT-IR Nicole 6700 Spectrometer equipped with a ZnSe plate. The
spectra for the samples were recorded in the range 3000 – 800 cm−1
at room temperature.
Samples of composite membranes were also analyzed by XRD (X-ray diffraction) using a
Philips PW 1830 generator machine.
5.3. Experimental results
5.3.1 SEM observations and morphology studies of composite membranes
Fig. 1., shows SEM images for the unmodified ZrP/PTFE/GLY, and the Si or S
modified composite membranes, and, compares them based on their top view. The
composite membranes were all synthesized at a GLY/ZrP mass ratio of 0.4. The Si/P and
the S/P mass ratios were 0.004 in the phosphoric acid–silicic acid (solution) for the modified
membranes. SEM images show the ZrP material covering most of the pores of PTFE with
some strands of the PTFE polymer still observable. SEM image (a) presents an unmodified
ZrP/PTFE/GLY composite membrane, whereas images (b) and (c) of the same figure show a
modified, Si-ZrP/PTFE/GLY and S-ZrP/PTFE/GLY composite membranes respectively.
Careful examination of image (a) in Fig. 1, reveals the formation of nearly spherical ZrP
particles, in the size range of 250 – 500 nm. Further examination of images (b) and (c)
shows a visible change in the formed ZrP material’s morphology. It is apparent that the
addition of silicic acid into phosphoric acid, caused a change in the produced ZrP particle
size and shape. Plate-like ZrP particles of nearly 1 um in size were observed in image (b) for
the Si- modified membranes. The particle size for the S–modified membranes also varied in

73
the range of 1 μm to 5 μm in some regions, as seen in image (c), with much less coverage
observed than that appeared in images (a) and (b).
Fig . 1. SEM images for composite membranes, all at a GLY/ZrP mass ratio of 0.4. (a) an
unmodified ZrP/PTFE/GLY membrane, (b) Si- ZrP/PTFE/GLY membrane with an Si/P
mass ratio of 0.004 and (c) a S-ZrP/PTFE/GLY membrane at a S/P mass ratio of 0.004.
In general, the morphology of the Si–modified composite membranes changed from
being nearly spherical in all regions, into an assortment of plate-like ZrP material of 1 um in
size. The S-modification of ZrP also caused a change in morphology. This change in
10 μm(b)10 μm(a)
10 μm(c)

74
morphology was also accompanied by a change in proton conductivity for both, the Si-
modified ZrP/PTFE/GLY and the S-modified ZrP/PTFE/GLY membranes.
The effect of varying the Si/P mass ratios is shown in Fig.2. All ZrP/PTFE/GLY
composite membranes were prepared, at a GLY/ZrP mass ratio of 0.2. The Si/P mass ratios
were varied from 0.0 to 0.02. SEM images in Fig.2. show a top view for the composite
membranes. Image (a) shows an unmodified ZrP/PTFE/GLY membrane (Si/P=0.0). The
ZrP particles appear to be nearly spherical in shape, in the size range of 300-600 nm. Image
(b) shows an Si-ZrP/PTFE/GLY at an Si/P = 0.004 in the phosphoric acid–silicic acid
(solution). At this Si/P ratio, all the silicic acid was soluble in phosphoric acid. It can be
seen that the shape and size of the Si-ZrP material has changed from nearly spherical
particles into a plate-like particles of a 1 µm average size. Image (c) shows an Si-
ZrP/PTFE/GLY membrane with an Si/P = 0.01 in the phosphoric acid – silicic acid
suspension. At this Si/P ratio, some of the silicic acid was in solution, and some of it
appeared in suspension. Additional changes in particles morphology were observed. Larger
size ZrP material appeared, having a flaky shape with an average size of 2 µm. This
noticeable change in size and morphology was accompanied by a change in the proton
conductivity. Images (d) and (e) show an Si-ZrP/PTFE/GLY membrane with an Si/P = 0.02
in the phosphoric acid – silicic acid suspension. A plate like material continued to appear
but it was evident that adding more silicic acid has resulted in much less coverage on top of
the composite membrane. Further examination of image (d), shows strands of the polymer
appeared to be entirely uncovered by the proton conducting material in some regions
whereas the particles appear to agglomerate in other regions. It could be explained as a
phase separation phenomenon as reported in literature for silica containing membranes. Lin
et. al. [17] reported phase separation in Nafion®
/–SO3H functionalized mesoporous silica
composite membranes. Changes in proton conductivities were also observed for these Si-
modified composite membranes, as shall be discussed in section 3.2.

75
Fig . 2. SEM images for a ZrP/PTFE/GLY composite membranes, all at a GLY/ZrP mass
ratio of 0.2., variable Si/P mass ratios, (a) ZrP/PTFE/GLY membrane (Si/P=0.0), (b) Si-
ZrP/PTFE/GLY membrane Si/P = 0.004 (silicic acid is completely dissolved in phosphoric
acid) ,(c) Si–ZrP/PTFE/GLY at Si/P = 0.01 some silicic acid is in suspension in phosphoric
acid, (d) and (e) are for Si–ZrP/PTFE/GLY at an Si/P = 0.02, some silicic acid is in
suspension in phosphoric acid
10 μm(e)

76
Fig . 3. SEM images for an Si– ZrP/PTFE/GLY composite membrane, at a GLY/ZrP mass
ratio of 0.2. and an Si/P mass ratio of 0.01 (some silicic acid is in suspension in the
phosphoric acid) (a) and (b) are top view images. (c) and (d) are cross-sectional view
images obtained by freeze-fracture. Edges of the membrane are indicated by the arrows in
image (c).
Fig.3. shows the SEM results for the Si– ZrP /PTFE/GLY membrane with an Si/P =
0.01, that had some silicic acid in suspension. Images (a) and (b) show top view for the
membrane at a different location than that appeared in Fig.2 (c). This figure confirms the
(b) 1 μm(a) 10 μm

77
changes in morphology and coverage observed in Fig.2. Images (c) and (d) of Fig. 3, are a
cross-sectional view of this composite membrane and they show the following: 1) The ZrP
material appears to be suspended along the cross section of the highly porous support
(PTFE), 2) The ZrP morphology appears to be different within the cross section (nearly
spherical particles of ~ 300 nm in diameter) compared to the (plate-like) particles observed
on the top, and, 3) the intersections of the polymer strands appear to have been nucleation
sites for the ZrP material with particles aggregation observed in some regions. A cross–
sectional SEM view of the unmodified ZrP/PTFE/GLY composite membranes was shown in
our previous work [13]. The cross section was quite different than the open structure shown
in Fig.3. Instead, the cross section shown in our previous work appeared to be densely
packed with the spherical nano-scale ZrP material.
5.3.2. Proton conductivity of the Si–ZrP /PTFE/GLY and S –ZrP /PTFE/GLY
composite membranes
The proton conductivities of the S and Si–ZrP/PTFE/GLY composite membranes
were measured by EIS. The Nyquist plot obtained for the Si–ZrP/PTFE/GLY is shown in
Fig. 4. In the same figure, the resistances of the Si–ZrP/PTFE/GLY (Si/P =0.004) and the
ZrP/PTFE/GLY composite membranes are compared. Both composite membranes were
prepared having a GLY/ZrP mass ratio of 0.2. Both resistances obtained from the Nyquist
plot, were used in Eq. 2 to calculate the proton conductivity. The results show that there is a
decrease in the composite membrane resistance from 0.41 to 0.37 upon the addition of
a small amount of silicic acid into phosphoric acid. The decrease in the composite
membrane resistance led to an enhancement in proton conductivity. A conductivity of 0.056
S cm-1
value was obtained for the Si–ZrP/PTFE/GLY composite membrane, as opposed to a
0.045 S cm-1
for the ZrP/PTFE/GLY membranes, i.e., an enhancement of 24 % in proton
conductivity.
The proton conductivity of the S–modified composite membrane (S–
ZrP/PTFE/GLY) was also measured by EIS. The Nyquist plot in Fig. 5 compares the
resistances of the ZrP/PTFE/GLY composite membrane and the S–ZrP/PTFE/GLY

78
composite membrane. Both membranes were prepared at a GLY/ZrP mass ratio of 0.4, and
the composite membrane modified with sulphuric acid (H2SO4) had an S/P mass ratio of
0.004. It is evident that the addition of sulphuric acid caused an increase in the composite
membrane resistance. The resistance increased from 1 for the ZrP/PTFE/GLY membrane
to 4.5 for the S–ZrP/PTFE/GLY membrane. This increase in resistance resulted in a
decrease in proton conductivity of one order of magnitude. The proton conductivity
decreased from 0.02 S cm-1
to 0.0044 S cm-1
for the S–ZrP/PTFE/GLY membrane. The
effect of sulphuric acid was also investigated at an S/P mass ratio of 0.54. The EIS
measurements (not shown here) determined a resistance of 28 , hence, a conductivity of
6.49×10⁻⁴
S cm-1
,i.e. significant decrease in proton conductivity.
Fig . 4. Electrochemical impedance spectroscopy pattern for an unmodified ZrP/PTFE/GLY
membrane and an Si–ZrP/PTFE/GLY composite membrane, both at a GLY/ZrP mass ratio
of 0.2, and Si/P mass ratio of 0.004 in the phosphoric acid–silicic acid (solution).

79
Fig . 5. Electrochemical impedance spectroscopy pattern for an unmodified ZrP/PTFE/GLY
membrane and a S–ZrP/PTFE/GLY composite membrane, both at a GLY/ZrP mass ratio of
0.4, and S/P mass ratio of 0.004 in the phosphoric acid–silicic acid solution.

80
Fig . 6. A comparison between the three types of membranes, the ZrP/PTFE/GLY, the Si-
ZrP/PTFE/GLY and the S-ZrP/PTFE/GLY in terms of proton conductivity. All were
prepared at a GLY/ZrP mass ratio of 0.4 and Si/P, or S/P mass ratio of 0.004 in the acid
solution.
A comparison of the proton conductivity for the three types of the composite
membranes is shown in Fig.6. The GLY/ZrP mass ratio was 0.4 and the Si/P and, S/P mass
ratios were 0.004, i.e. silicic acid was soluble at these conditions. The Si–ZrP/PTFE/GLY
composite membrane showed the highest proton conductivity. The value of proton
conductivity was improved from 0.02 S cm-1
(for the ZrP/PTFE/GLY membranes, at
GLY/ZrP = 0.4) to 0.027 S cm-1
upon the modification with silicic acid. This increase in
proton conductivity is anticipated to be due to the increase in the number of OH groups as
previously discussed.
0
0.005
0.01
0.015
0.02
0.025
0.03
Si-ZrP ZrP S-ZrP
PR
OT
ON
CO
ND
UC
TIV
ITY
S c
m-1
MODIFIED MEMBRANE TYPE

81
The effect of silicic acid addition at larger Si/P mass ratios was also investigated. As
the Si/P ratio increased, the solubility limit of silicic acid in phosphoric acid was exceeded.
At Si/P ratios larger than 0.004, a portion of silicic acid was soluble and some was still
suspended in H3PO4. The results are shown in Fig. 7 and 8.
The new results for the Si–ZrP/PTFE/GLY composite membranes conductivity are
shown in Fig.7 as a function of the GLY/ZrP mass ratios. The new results are compared
with results that were previously published for the unmodified membranes [13]. The
maximum proton conductivity was reported at a GLY/ZrP mass ratio of 0.2 for both sets of
composite membranes. It can be seen that there was a noticeable enhancement in proton
conductivity upon the addition of silicic acid at all GLY/ZrP mass ratios. For example, the
ZrP/PTFE/GLY composite membrane of 0.2 GLY/ZrP ratio, possessed a proton
conductivity of 0.045 S cm-1
, whereas the modified (Si-ZrP/PTFE/GLY) composite
membrane (prepared at the same GLY/ZrP mass ratio 0.2) possessed a higher proton
conductivity of 0.056 S cm-1
.
A sample of the Si–ZrP/PTFE/GLY composite membrane (soluble silicic acid, Si/P
= 0.004, and GLY/ZrP = 0.2, open triangle symbol) was processed at 200 C and an H2O/Ar
molar ratio of 6, and yH2O = 0.86, (a wet test = the inlet conditions of a direct hydrocarbon
fuel cell). EIS analysis for this sample showed a slight decrease in proton conductivity,
from 0.056 S cm-1
to 0.046 S cm-1
(shown as the solid triangle),i.e., a decrease in
conductivity of only 24%. In comparison, the conductivity of Nafion 117 membranes at 120
C and relative humidity (RH) of 95% is 0.013 S cm-1
[18], and the conductivity of Nafion-
silicate (NF-Si), and Nafion zirconium phosphates (NF-ZrP) at 130 C and 28.8 % RH are
1.27 ×10⁻³
and 1.53 ×10⁻³
S cm-1
respectively [14]. After the 20% decrease in proton
conductivity caused by the wet test, the proton conductivity for the Si–ZrP/PTFE/GLY
composite membrane was still an order of magnitude larger than that of Nafion at
comparable conditions.

82
Fig . 7. Change of proton conductivity (σ) S cm-1
versus glycerol GLY) /ZrP mass
ratio. Open circles present the unmodified ZrP/PTFE/GLY composite membranes.
Triangles: represent the Si-ZrP/PTFE/GLY composite membranes, Si/P mass ratio = 0.004
(silicic acid was completely soluble). Solid symbols represent the 200 ºC wet test result of
proton conductivity (σ) S cm-1
. Diamond symbol represents the Si-ZrP/PTFE/GLY
composite membrane, Si/P mass ratio = 0.01 (some silicic acid was in the form of suspended
particles).
The conductivities of the Si–ZrP/PTFE/GLY membranes were investigated as a
function of their Si/P mass ratios. The results are shown in Fig. 8. The GLY/ZrP mass ratio
was kept constant at 0.2, because the highest conductivity value obtained in Fig. 7 was
obtained at this GLY/ZrP mass ratio. As the Si/P mass ratio increased, proton conductivity
(σ) also increased. As previously stated, up to an Si/P mass ratio of 0.004, silicic acid was
still in solution. The maximum proton conductivity 0.073 S cm-1
was obtained at an Si/P

83
mass ratio of 0.01. When some of the silicic acid was present as insoluble particles, at Si/P
mass ratios in the range of (0.004 < Si/P 0.01), additional proton hopping paths were
provided by the surfaces of the hydrophilic SiO2.H2O suspended particles. At Si/P mass
ratios larger than 0.01, the conductivity decreased reaching a value of 0.051 S cm-1
at an
Si/P mass ratio of 0.02. This decrease in conductivity can be explained by the morphology
studies previously presented in Fig. 2 (d) and (e) for this membrane. Upon the addition of
more silicic acid,( i.e. Si/P mass ratio = 0.02), poor coverage, more voids, and agglomeration
of particles in some regions were obtained. Hence, it led to a decrease in proton
conductivity.
The addition of silicic acid (SiO2.H2O) to phosphoric acid, i.e. at Si/P mass ratios
larger than 0.004, resulted in both soluble SiO2.H2O in H3PO4 and suspended particles of
SiO2.H2O. The presence of SiO2.H2O in solution improved water retention properties due to
its hydrophilic nature. As previously discussed, by having SiO2.H2O in solution, some of
the “P” atoms in ZrP might have been replaced by some of the “Si” atoms. Hence,
increasing the number of OH groups, and, providing more paths for the protons to hop.
Therefore, the proton conductivity increased. The further enhancement in proton
conductivity upon the addition of SiO2.H2O in excess, (of Si/P mass ratios = 0.01) might
have been caused by proton hopping in GLY, on the surface and in the bulk of Si-ZrP, and
hopping on the surfaces of the hydrophilic insoluble silicic acid (Si ̀ O2.H2O) particles.

84
Fig . 8. Change of proton conductivity (σ) with the Si/P mass ratio for the Si-
ZrP/PTFE/GLY membrane at constant GLY/ZrP mass ratio of 0.2. (Si/P mass ratios larger
than 0.004 contained insoluble portion of silicic acid in H3PO4 as indicated by the dashed
line).
5.3.3. FT-IR spectroscopy study
The FT-IR spectra obtained for the ZrP/PTFE/GLY, Si–ZrP /PTFE/GLY and S–
ZrP/PTFE/GLY composite membranes are shown in Fig. 9. All composite membranes were
prepared at a GLY/ZrP mass ratio of 0.4 and Si/P or S/P mass ratios of 0.004. The spectra
of composite membranes revealed characteristic peaks (bands) and shoulders. The
characteristic peaks for the phosphate group at 1150 and 1200 cm-1
, are attributed to the P-O
asymmetric stretching in the PO4 group [19]. The P-O asymmetric stretching peaks were
sharp and observed in all samples spectra. The shoulder at 970 cm-1
for the ZrP/PTFE/GLY
membrane sample is a characteristic of the P-OH stretching bond [19, 20]. The shoulder
appeared at 1690 cm-1
in the unmodified ZrP/PTFE/GLY composite membrane is a

85
characteristic of bulk water [21]. In general, the FT–IR spectra suggest that no major
changes observed on the basic chemical structure of the ZrP material when “S” or “Si”
replaced a minor amount of “P” in the ZrP. One change is observed on the shoulder at 970
cm-1
in the unmodified ZrP/PTFE/GLY composite membranes. This shoulder becomes
progressively less strong in the Si–ZrP/PTFE/GLY composite membrane and least evident
in the S–ZrP/PTFE/GLY composite membrane. The appearance of the shoulder at 1030
cm-1
in the Si–ZrP /PTFE/GLY membrane sample might have resulted from a chemical
interaction between the silicic acid (SiO2.H2O) and ZrP in the composite membrane, and
explained as Le Van So reported [21] follows :
Si – OH + H…..
O – P→ Si – O – P + H2O (3)
This interaction presented in Eq.(3), might have been taking place in our composite
membranes that contained SiO2.H2O and ZrP, ( Zr(HPO4)2. Presumably, an Si–O–P bond
might have been formed. Another possible explanation for the shoulder at 1030 cm-1
in the
Si–ZrP /PTFE/GLY membrane, is that it could be due to the stretching vibrations of the Si–
O–Si bond [21].

86
Fig . 9. FT-IR spectra of composite membranes, ZrP/PTFE/GLY, Si-ZrP/PTFE/GLY and S-
ZrP/PTFE/GLY , all at GLY/ZrP mass ratio of 0.4, Si/P and S/P mass ratios of 0.004.
5.3.4. X-Ray diffraction (XRD) studies
The XRD patterns for different composite membranes are shown in Fig. 10, and 11.
In Fig. 10, the composite membranes studied were the unmodified ZrP/PTFE/GLY and Si-
ZrP/PTFE/GLY composites at variable GLY/ZrP and Si/P mass ratios as indicated on the
graph. In the three samples, there is a highly intense peak appeared at 2 ~ 18 , in addition
to two peaks appeared at 2 ~ 31.5 , and 2 ~ 36.6 . These peaks are all characteristics of
PTFE [23]. However, the PTFE peaks that appeared at 2 ~ 31.5 , and 2 ~ 36.6 in the
Si–ZrP/PTFE/GLY membranes appear to be more intense than those appeared in the

87
unmodified membranes. One possible explanation for that is due to their morphology as
previously seen in SEM analysis (Fig.2). More PTFE area was exposed in the Si–
ZrP/PTFE/GLY membranes, hence, more intense peaks of PTFE were observed.
Fig . 10. XRD pattern for ZrP/PTFE/GLY and Si-ZrP/PTFE/GLY composite
membranes at variable GLY/ZrP and Si/P mass ratios as labeled.

88
Fig . 11. XRD pattern for ZrP/PTFE/GLY and Si-ZrP/PTFE/GLY composite
membranes at GLY/ZrP=0.2 and Si/P mass ratios as labeled, compared with the XRD
pattern for a ZrP powder oven dried at 70 C.
The XRD patterns of the unmodified ZrP/PTFE/GLY and Si-ZrP/PTFE/GLY
composites were compared, in Fig. 11, with the pattern previously obtained for a ZrP
powder, oven dried at 70 C. With the exception of the PTFE peaks in the composites
spectra that appeared at 2 ~ 18 , 31.5 , and 2 ~ 36.6 , it can be seen that the materials
have amorphous structure. There are two broad peaks in the ZrP powder spectrum at 2 ~
25 and, 2 ~ 45 that are consistent with the peaks in the crystalline ZrP [24]. It is evident
that there is a shift in the broad peak appeared at 2 ~ 25 in the ZrP powder XRD pattern,
into a broad reflection at 2 ~ 22 in the unmodified ZrP/PTFE/GLY and in the Si-modified
composite membranes. It is not obvious in the Si-modified composite membrane but can be
seen with careful examination of the XRD spectrum. There is a broad reflection at 2 ~ 37
for both, the unmodified ZrP/PTFE/GLY and the Si– ZrP/PTFE/GLY composite

89
membranes. In general, the XRD spectra suggest that the amorphous ZrP material formed
in the composite membranes possess some crystal structure.
5.4 Discussion of results
The morphology and the size of ZrP material changed as a result of the addition of
silicic acid (SiO2.H2O) or sulphuric acid (H2SO4). In the absence of silicic acid or sulphuric
acid, the ZrP particles were spheres with (250-500) nm in diameter. In contrast, plate-like
particles of 1-5 μm were formed when “S” or “Si” was present as shown in SEM images.
Porosity is one of the important features of the membranes containing either
sulphuric acid or silicic acid. The dense ZrP/PTFE/GLY membranes (Fig.1a) became
porous membranes when either sulphuric acid (Fig. 1c) or silicic acid (Fig. 1b and Fig. 3c
and d) was used during preparation. In some membrane samples (Fig. 2e), poor coverage of
PTFE, by the modified ZrP material was observed. In a fuel cell, such porosity will permit
the undesirable crossover of gases between the anode and the cathode. Composite
membranes should be densely packed with particles to prevent gas crossover.
The XRD patterns confirmed the amorphous nature of the resultant composite
membranes. The broad reflections at 2 ~ 22 and 2 ~ 37 for the unmodified
ZrP/PTFE/GLY and the Si- ZrP/PTFE/GLY composite membrane suggest the presence of
some crystal structure. The PTFE peaks ~ 31.5 , and 2 ~ 36.6 in the Si– ZrP/PTFE/GLY
membranes appeared to be more intense in the Si-modified membranes. This is consistent
with the less coverage of PTFE by the Si-modified ZrP material.
Our hypothesis was that silicic acid would increase the number of OH groups in the
ZrP structure and therefore, increase the conductivity. In contrast, sulphuric acid would
decrease the number of OH groups, and therefore, decrease the conductivity. The
conductivity observed in Fig. 6, supports our hypothesis. The conductivity increased with
silicic acid addition, i.e., having more OH groups and decreased with sulphuric acid, i.e.,
fewer OH groups.

90
This work reported the conductivity enhancement upon the addition of silicic acid,
SiO2.H2O. When silicic acid was in solution with phosphoric acid, at Si/P ratios of 0.004, it
is possible that some of the “P” atoms in ZrP might have been replaced by some “Si” atoms.
This increased the number of OH groups, therefore, provided more paths for the protons to
hop. Proton conductivity enhancement might have been also caused by the possible
formation of the Si-O-P bond, and the formation of water as seen in Eq.(3), thus, providing
more water molecules and multiple paths for proton hopping.
When part of the silicic acid was in solution with phosphoric acid and, the other
portion was in suspension, i.e., at Si/P mass ratio of 0.01, further enhancement in proton
conductivity was observed. The proton conductivity increased reaching a maximum of
(0.073 S cm -1
). SiO2.H2O is a hydrophilic inorganic material. It is possible that the water
content of silicic acid may have increased the number of water molecules in the composite
membrane. Therefore, the enhancement in proton conductivity is explained by the increased
proton hopping in all the preceding paths, in addition to the hopping on the surfaces of the
hydrophilic, insoluble SiO2.H2O particles.
The proton conductivity in the Si-ZrP/PTFE/GLY started to decrease at larger Si/P
mass ratios (0.02). This is consistent with what have been previously studied and shown in
literature. When an excessive addition of inorganic (e.g. SiO2.) compounds occurred, it led
to a decrease in proton conductivity [25]. This result is also consistent with our SEM
observations for the Si–ZrP/PTFE/GLY membrane, at Si/P mass ratio of 0.02. The
formation of a micron size ZrP particles in some regions, and the poor coverage of PTFE by
the modified ZrP material in others, have decreased the total surface area of the ZrP, leading
to a decrease in proton conductivity.
5. 5 Conclusions
Silicic acid (SiO2.H2O) was found to enhance the conductivity of ZrP/PTFE/GLY
composite membranes when added to phosphoric acid prior to the in-situ precipitation
reaction. Sulphuric acid was found to have a negative effect on the membranes proton
conductivity, decreasing it by orders of magnitude. Both silicic acid and sulphuric acid had
91
an effect on the ZrP particles morphology. In the unmodified GLY/ZrP/PTFE composite
membrane, the ZrP material was present as small spheres of (250-500 nm) [13]. When either
silicic acid or sulphuric acid was used, the ZrP morphology was changed into a plate-like
appearance of a larger size (1-5 μm).
When silicic acid (SiO2.H2O) was in solution with phosphoric acid, the enhancement
in proton conductivity may have been caused by the increase in the number of OH groups
and in the number of water molecules in the ZrP lattice. This may be explained by the
increase in the number of possible proton hopping paths including, ZrP surface, the OH
groups in glycerol, and the possible formation of the Si–O–P bond. When part of silicic acid
was in solution with phosphoric acid and the other portion was in suspension (i.e. at Si/P
mass ratio of 0.01), the enhancement in conductivity was attributed to the preceding reasons
plus the proton hopping via the hydrophilic silicic acid particles.
The proton conductivity of the Si–ZrP/PTFE/GLY composite membranes (at Si/P
mass ratio of 0.01) reached a maximum of 0.073 S cm -1
at 20°C, i.e., 73 % of the
conductivity of a Nafion membrane. Increasing the Si/P mass ratio to 0.02, caused the
proton conductivity to decrease. This was attributed to the poor coverage of PTFE, by the
modified ZrP material hence, the reduction in the total ZrP surface area. When a sample of
the Si-ZrP/PTFE/GLY composite membrane was processed at 200°C in the presence of a
steam, under conditions typical of a direct propane fuel cell; the proton conductivity only
decreased by 24 %.
Although the conductivity measurements reported here are very encouraging,
because they approach that of Nafion’s. Nevertheless, additional research will be required
to develop techniques for preparing Si–ZrP/PTFE/GLY membranes that are dense enough to
inhibit gas crossover.
5.6 Acknowledgments
The authors are grateful for the financial support from the Canadian federal
government’s Natural Sciences and Engineering Research Council and from the Ontario

92
provincial government’s Ministry of Research and Innovation (Ontario Fuel Cell Research
and Innovation Network).
5.7 References
1. B. Smitha, S. Sridhar, A.A. Khan, J. Membr. Sci., 259 , 2005, p.10.
2. Y. Chikashige, Y. Chikyu, K. Miyatake, M. Watanabe., Macromolecules, 38, 2005, p.
7121.
3. S. Kang, C. Zhang, G. Xiao , , D. Yan , G. Sun., J. Membr. Sci., 334 , 2009, p. 91.
4. B. Kim, B. Jung, Macromol. Rapid Commun. , 25, 2004, p. 1263.
5. W. G. Grot, G. Rajendran, US Patent 5,919,583, 1999.
6. L. Chen, T. Yu, H. L Lin , S. H. Yeh, J. Membr. Sci., 307, 2008, p. 10.
7. F. Bauer1, M.W. Porada, Fuel Cells, 06, 2006, p. 261.
8. H. L. Tang, M. Pan, J. Phys. Chem. C, 112, 2008, p. 11556.
9. K. Li, G. Ye, J. Pan, H. Zhang , M. Pan, J. Membr. Sci.,347, 2010,p. 26.
10. F. Pereira, K. Vallé, P. Belleville, A. Morin, S. Lambert, C. Sanchez, Chem. Mater.
20, 2008, 1710.
11. C. C. Ke, X. J. Li, S. G. Qu, Z.G. Shao, B. L.Yi, Polym. Adv. Technol. , 2010, 1-7

93
12. C. Ferragina, R. D. Rocco, A. Fanizzi, P. Giannoccaro, L. Petrilli, J. Therm. Ana.
Calorim. , 76, 2004, p. 871.
13. A. Al-Othman , A. Y. Tremblay, W. Pell, Y. Liu, B. A. Peppley , M. Ternan , J.
Power Sources, 199, 2012, p. 14.
14. B. Gurau, E. Smotkin, J. Power Sources, 112, 2002, p. 339.
15. H.L. Lin, S.H. Yeh, T. L. Yu, L. C. Chen, J. Polym. Res 16, 2009, p. 519.
16. Y.J. Wang, Y. Pan, L. Chen, Mater. Chem. Phys. 92, 2005, p. 354.
17. Y. F. Lin, C. Y. Yen, C. C. M. Ma, S. H. Liao, C. H. Lee, Y. H. Hsiao, H. P. Lin, J.
Power Sources, 171, 2007, p.388.
18. M. Casciola, G. Alberti, M. Sganappa, R. Narducci, J. Power Sources, 162, 2006, p.
141.
19. I.F. Amaral, P. L. Granja, M.A. Barbosa, J. Biomater. Sci. Polymer. Edn., 16, 2005,
p.1575.
20. G. ILia, V.Parvulescu, A. Popa, S. Iliescu, J. Optoelectron. Adv. Mater, 10, 2008,
p.3398.
21. L. V. So, J. J. Radioanal. Nucl. Chem., 98/2, 1986, p. 225.

94
22. S. J. Huang, H. K. Lee, and W.H. Kang Bull. Korean Chem. Soc., 26, 2005, p. 241.
23. V.M. Bouznik, S.D. Kirik, L.A. Solovyov, A.K. Tsvetnikov, Powder Diffr., 19, 2004,
p.219.
24. A. Clearfield, J.A. Stynes, J. Inorg. Nucl. Chem. 26 , 1964, p. 117.
25. P. Bébin, M. Caravanier, H. Galiano, J. Membr. Sci. 278 , 2006, p. 35.

95
CHAPTER SIX-GENERAL DISCUSSION

96
Chapter 6 - General discussion
The high cost of polymer electrolyte membrane fuel cells (PEMFC) is one of the
main obstacles that stand in the way of their commercialization. Most PEM fuel cells
currently use hydrogen as a fuel. Hydrogen production, storage and transportation
contribute to the high capital cost of PEMFC. Hydrocarbon fuels have several advantages
over hydrogen because of their existing infrastructure and ease of storage. The use of
hydrocarbon fuels is expected to have a large impact on reducing the cost of PEMFC if they
are directly fed to the fuel cell. This will eliminate the fuel processor unit used to produce
hydrogen that accounts for one third of the capital cost in a PEMFC system. For these
reasons, there is a merit for using hydrocarbon technology instead of hydrogen in the current
research project.
A high performance hydrocarbon (propane) fuel cell with platinum catalyst and
phosphoric acid electrolyte was reported in 1964 by Grubb [1]. The cell operated in the
temperature range of (150 –200) ºC. However, during the 1960’s, it was difficult to predict
the future of hydrocarbon fuel cells, but their theoretically higher efficiency, potentially
lower initial cost have become motivations for future research [2].
The operation of a direct hydrocarbon PEMFC is illustrated using propane as an
example. The anodic reaction taking place is:
C3H8+6H2O = 3CO2 + 20H++20e
–1 (1)
Oxygen or air enters at the cathode, and the following reaction takes place:
5 O2 + 20 H+
+ 20 e–1
= 10 H2O (2)
And the overall reaction is: C3H8 + 5 O2 = 3 CO2 + 4 H2O (3)
It is evident that water is a necessary reactant at the anode, and per one mole of
propane electrochemically oxidized, six moles of water are consumed. Water reacts with
propane at the anode to produce protons, carbon dioxide and 20 moles of electrons. Water

97
has been shown in this work to have a major effect on the hydration level of the proton
conducting material, zirconium phosphate (ZrP).
The investigation of a high temperature membrane was performed on several stages.
First, the degree of hydration of the electrolyte, zirconium phosphate, Zr(HPO4)2.H2O (ZrP)
was studied and evaluated. ZrP was synthesized in its powder form, and investigated for its
proton conducting properties at different temperatures, up to a maximum temperature of 200
ºC. The synthesized ZrP powder characteristic were further studied and investigated using
other techniques such as X-Ray diffraction (XRD) and thermogravimetric analysis (TGA).
These techniques were used to evaluate the ZrP material structure and the water retention
properties.
Second, a composite membrane was developed out of this powder because the ZrP
material is brittle and lacks the mechanical integrity required in a PEMFC membrane.
Porous polytetraflouroethylene (PTFE) was used as a support material for the ZrP
electrolyte. More effort was then directed to improve the proton conductivity of the
ZrP/PTFE composite membrane. The effect of the incorporation of glycerol (GLY) into the
ZrP/PTFE membrane was investigated. A considerable enhancement of ZrP/PTFE proton
conductivity was observed upon the addition of small amounts of GLY. As a result, a
composite membrane composed of ZrP/PTFE/GLY was synthesized.
Third, the effect of the incorporation of a minor component “Si” or “S”, i.e. via
silicic acid (SiO2.H2O) and sulphuric acid (H2SO4) respectively, on the ZrP/PTFE/GLY
composite membrane was studied. The synthesized modified membranes were evaluated for
their morphology, structure and proton conducting properties. A considerable enhancement
of proton conductivity was observed upon the addition of silicic acid.
6.1 Investigation of Zr(HPO4)2.H2O (ZrP)
Zirconium phosphate Zr(HPO4)2.H2O (ZrP) powder was investigated as a possible
proton conducting material for direct hydrocarbon PEMFC. ZrP was synthesized by the
precipitation reaction of ZrOCl2 with aqueous H3PO4 solutions described in Eq. (1), at room
temperature:
98
ZrOCl2•8H2O + 2 H3PO4 → Zr(HPO4)2•H2O + 2 HCl + 8 H2O (4)
At these conditions, amorphous ZrP powder was formed based on what was stated in
literature [3] and based on our earlier work [4]. ZrP powder was dried at different
temperatures and conditions. Some samples were oven dried while others were oven dried
first then processed at the inlet conditions of a hydrocarbon (propane) fuel cell, i.e.
temperature of 200 °C and an H2O/N2 molar ratio of 6.
Various analysis techniques were used to study and evaluate the properties of the
prepared ZrP powder. The samples were studied using X-ray diffraction (XRD),
thermogravemtric analysis (TGA), and electrochemical impedance spectroscopy (EIS). The
proton conductivity of the various ZrP samples was evaluated using the four probe EIS
technique.
This work reported that the proton conductivity of the synthesized ZrP materials
processed at 200 °C, (with continuous H2O injection at an H2O/N2 molar ratio of 6, in
conditions similar to a direct hydrocarbon PEMFC), was one order of magnitude higher than
the ZrP sample that was first oven dried at 70 °C.
In the same work, it was shown that it was possible to maintain a sufficient hydration
level in the ZrP at 200 °C by having an appropriate water content in the vapour phase at the
processing conditions, hence, increasing the proton conductivity. In our direct hydrocarbon
fuel cell, it is possible to maintain these hydration conditions where water is being a
stoichiometric reactant.
6.2 Synthesis of ZrP/PTFE/GLY composite membranes
This work has also investigated the synthesis of composite membranes composed of
zirconium phosphate (ZrP) and porous polytetrafluoethylene PTFE as a mechanical support
for ZrP. Therefore, zirconium phosphate Zr(HPO4)2, a proton conductor, was precipitated in
situ within a porous PTFE membrane according to Eq.(1). PTFE membranes are
characterized with their highly hydrophobic nature, hence, aqueous solutions of the chemical
reagents were not used; instead, ZrOCl2 alcoholic suspension was prepared. Ethanol and

99
isopropanol had a lower surface tension than water and they appeared to wet the PTFE
surface quite well when first investigated in the laboratory.
The amount of ZrP needed to fill the voids of PTFE was calculated based on the void
volume available in the sample sheet. Then, the corresponding amount of ZrOCl2 (derived
from the chemical reaction described in Eq.(1)) was added to the alcohol mixture. The
ZrOCl2 alcoholic suspension was then introduced to the pores of PTFE, followed by
precipitation with phosphoric acid to form ZrP in the pores.
The result was an enhancement of proton conductivity from 10–3
S cm–1
as
previously reported in literature for ZrP/PTFE composites [5] to 0.045 S cm–1
. This was
accomplished by the incorporation of glycerol (GLY) into the ZrOCl2 alcoholic suspension
and ultimately, into the pores of PTFE. The results reported in this study showed that
adding small amounts of GLY to an alcoholic suspension of ZrOCl2•8H2O produced a
composite membrane with a conductivity of 0.02 – 0.045 S cm–1
.
Morphology studies using SEM on this membrane, including top view and cross
sectional view studies showed ZrP spheres in the size range of (100 – 500 nm) in the
composite membrane that were smaller than the PTFE pore diameters (1000 – 2000 nm).
Proton conductivity studies on the other hand, showed an enhanced proton conductivity as
well as a conductivity value that remained unchanged when the membrane was processed at
the inlet conditions to a direct propane fuel cell (200°C and steam mole fraction yH2O =
0.86).
In literature, a detailed description for the mechanism of proton conductivity in
solids was provided [6]. In this thesis, we have also provided a description for the enhanced
conductivity in ZrP/PTFE/GLY composite membranes. Furthermore, the effect of adding
glycerol (GLY) on morphology and conductivity was examined.
It is possible that the enhancement observed in proton conductivity in our composite
membranes may have been caused by, 1) proton transport at the interface between the small
solid ZrP spheres and their glycerol coating, 2) proton transport though ZrP and proton
transport thorough glycerol and, 3) presumably two surface phenomena, a combination of

100
proton transport on solid ZrP surfaces and proton hopping via the OH groups in glycerol.
Furthermore, the successive wetting and drying cycles inside the confined hydrophobic
pores of PTFE, have favored the formation of small aggregates of ZrOCl2. These aggregates
have been prevented from agglomeration due to the presence of glycerol that has a high
surface tension. Thus, very small, relatively spherical ZrP particles were formed. These
particles led to a high total surface area and hence, a highly conducting membrane.
6.3 Substitution of a minority component for phosphorus
In this work, novel composite membranes composed of modified S or Si–zirconium
phosphate (ZrP), porous polytetrafluoethylene (PTFE) and, glycerol (GLY) were also
synthesized. It was aimed at the substitution/modification of a minor component (S or Si)
for phosphorus in the ZrP chemical structure. Thus, the modification was performed by
introducing a certain amount of silicic acid or sulphuric acid into phosphoric acid. It was
then aimed at studying the effect of having variable Si/P or S/P mass ratios in the acid
solution/suspension.
The modification of ZrP/PTFE/GLY membranes was performed by introducing the
ZrOCl2 and GLY materials first into the PTFE pores, and then proceeding with the chemical
reaction described in Eq. (1). At this phase, and prior to reaction, phosphoric acid was
mixed with a specified amount of silicic acid or sulphuric acid. The amounts of both acids
were varied in such a way that would result in a variable S/P or Si/P mass ratios in the silicic
acid–phosphoric acid, or sulphuric acid–phosphoric acid. Sulphuric acid was always in
solution with phosphoric acid, which was not the case with silicic acid. Silicic acid is a
powder and had a limited solubility in phosphoric acid. Therefore, by having a variable Si/P
mass ratios, silicic acid was in solution in some experiments. When the solubility limit was
exceeded in other experiments, part of silicic acid appeared to be in suspension. Both of
these situations effects on proton conductivity and morphology were indentified and studied.
Investigation of these modified ZrP/PTFE/GLY membranes showed that the Si–
modified membranes had enhanced proton conductivity whereas the S–modified membranes
showed a decreased conductivity value. Furthermore, a proton conductivity of 0.073 S cm–1
was obtained for the Si–ZrP /PTFE/GLY membrane that approached the conductivity of
101
Nafion (0.1 S cm-1
) at an Si/P mass ratio of 0.01. At higher mass ratios, i.e. Si/P mass ratio
of 0.02, the conductivity declined.
Morphology studies using SEM on these composite membranes showed that the Si-
ZrP/PTFE/GLY membrane with an Si/P = 0.01 in the phosphoric acid – silicic acid
suspension had a different morphology of ZrP than observed in the unmodified composites.
When all silicic acid was still in solution with phosphoric acid, plate-like ZrP particles of
nearly 1 um in size were appeared. Adding more silicic acid resulted in a portion of it in
solution, while the other portion appeared in suspension, thus, at Si/P mass ratios of 0.01,
larger size ZrP material appeared, having the flaky shape with an average size of 2 µm. At
Si/P mass ratios of 0.02 in the phosphoric acid – silicic acid suspension the plate like
material continued to appear and poorer coverage on top of the composite membrane was
observed. More strands of the polymers appeared to be entirely uncovered with ZrP at some
regions whereas the particles appear to agglomerate in others. The poor coverage observed
at higher Si/P ratios could be explained by a phase separation phenomenon.
The enhancement of proton conductivity in the modified Si-ZrP/PTFE/GLY
composite membrane at Si/P mass ratios of 0.01 was explained in this thesis by, 1) the
improvement in water retention properties of the composite membrane upon the introduction
of silicic acid (hydrophilic), and 2) the possible formation of the Si–O–P bond that provided
an extra path for proton hopping.
This work addressed the change of proton conductivity upon the addition of
excessive amounts of silicic acid. It showed that there is a decrease in proton conductivity
when the Si/P mass ratio was 0.02. This may be attributed to, 1) the formation of excessive
amounts of water, hence, interruption of proton transport inside the membrane and, 2) the
phase separation and the poor coverage of the proton conducting material in the resultant Si-
composite membrane. As a result, this work showed that the composite membrane should
have an appropriate silicic acid content, above which, the membrane conductivity starts to
decrease.

102
6.4. References
1. W.T. Grubb, C.J. Michalski, J. Electrochem. Soc., 111(1964), p. 1015.
2. E.J. Cairns, Advances in Electrochemistry and Electrochemical Engineering, Vol. 8,
C. W. Tobias, ed., Wiley-Interscience, New York, NY, 1971, p. 337.
3. Camino Trobajo, Sergei A. Khainakov, Ara´nzazu Espina, and Jose´ R. Garcı´a, On
the Synthesis of r-Zirconium Phosphate, Chem. Mater., 12 ( 2000) , p. 1787.
4. A. Al-Othman, A.Y. Tremblay, W. Pell, S. Latief, T. J. Burchell, B. Pebbly, M.
Ternan, J. Power Sources, 195 (2010), p. 2520.
5. Y. Park, K. Jae-Dong and M. Nagai. J. Mater. Sci. Lett., 19 (2000), p. 1735.
6. K. D. Kreuer, J. Mol. struct., 177 (1988), p. 265.

103
CHAPTER SEVEN-CONCLUSIONS

104
CONCLUSIONS
This section is devoted to address the conclusions drawn throughout this research
project.
The decrease in zirconium phosphate proton conductivity that has been attributed to
a loss in water content is consistent with our measurements of conductivity and water
content analysis that were reported in this thesis. It was also shown that the vapour phase
water content adjustment during processing at elevated temperatures 200 ºC enhanced the
water content of the zirconium phosphate material. This hydration was accomplished by the
gas phase in contact with the zirconium phosphate membrane that contained an H2O/N2
molar ratio of 6, which is similar to the stoichiometric feed ratio in a direct propane fuel cell.
Furthermore, it has been shown that the conductivity of this ZrP material processed at 200
◦C possessed an enhanced water content and proton conductivity. The proton conductivity
reported from the elevated temperature test was one order of magnitude higher than that for
the ZrP material dried at 70 ◦C in a relatively dry atmosphere. Thus, this thesis showed that
it is possible to operate direct hydrocarbon fuel cells at elevated temperatures, without
encountering degradation in the proton conductivity of the membrane and thereby take
advantage of more rapid kinetics and greater current densities.
Glycerol (GLY) was found to enhance the proton conductivity when incorporated
into a porous PTFE film. It was also found to enhance the proton conductivity when added
to the ZrP/PTFE composite membrane. The inclusion of GLY in the ZrP/PTFE/GLY
membrane made some changes on the composite membranes. First, it changed the
morphology of the ZrP. Second; it enhanced the proton conductivity by orders of magnitude
from being in the order of 10-5
S cm-1
to 0.045 S cm-1
. GLY addition resulted in the
formation of nano-scale spherical ZrP particles, hence, increased the total surface area on the
exterior of the small ZrP spheres, leading to an enhanced proton conductivity approaching
that of Nafion. In this thesis, the technique of using glycerol (GLY) that has a high surface
tension was combined with the successive wetting and drying cycles inside the hydrophobic
pores of PTFE. This may have favored the formation of small, separate, particles of
ZrOCl2, thus, the formation of well defined, spherical nano-scale ZrP particles within the

105
confined environment existing in the PTFE pores. The improvement of proton conductivity
may have been caused by a combination of proton transport on the increased surface area on
the exterior of the small ZrP spheres plus proton hopping using both the OH groups in
glycerol and the ZrP bulk. In this work, it was shown that the proton conductivity remained
unchanged for a sample of this composite membrane processed at 200°C in the presence of a
steam partial pressure typical of a direct propane fuel cell. This conductivity was orders of
magnitude higher than that of Nafion at 130 C. The results of this work offered a
promising alternative for Nafion electrolyte, for fuel cell operations above the boiling point
of water.
The effect of adding silicic acid (SiO2.H2O) was studied and it was found to enhance
the proton conductivity of ZrP/PTFE/GLY composite membranes when added to phosphoric
acid prior to reaction. Sulphuric acid, was found to have a negative effect on the membranes
proton conductivity, decreasing it by orders of magnitude. The proton conductivity of Si–
ZrP/PTFE/GLY composite membranes was 0.073 S cm -1
, i.e., 73 % of the conductivity of a
Nafion membrane. The improvement of proton conductivity was explained by the increase
in the number of OH groups, the increase in the number of water molecules and the possible
formation of the Si-O-P bond that provided more paths for proton hopping. The proton
conductivity however, decreased with excessive addition of silicic acid. This work reported
the poor and the non-uniformly distribution of ZrP obtained when excessive amounts of
silicic acid were introduced to the membrane and attributed the decrease in conductivity
accordingly.

106
CHAPTER EIGHT- CONTRIBUTIONS TO ORIGINAL KNOWLEDGE
AND RECOMMENDATIONS

107
CONTRIBUTIONS TO ORIGINAL KNOWLEDGE
The following is a list of the major contributions to original knowledge, resulted from this
thesis.
1. Nafion–free, inorganic–organic composite membrane, with enhanced proton
conductivity composed of zirconium phosphate, ZrP, (a solid proton conductor),
porous polytetrafluoethylene (PTFE) and, glycerol (GLY) was successfully
developed as a possible electrolyte for direct hydrocarbon fuel cells that might
operate at temperatures approaching 200°C. To our knowledge, this is the first report
of such membranes in the literature.
2. The presence of a water rich vapour phase was shown to produce a zirconium
phosphate solid that was hydrated to a greater extent than the zirconium phosphate
solids prepared in laboratory air. These conditions exist in a direct hydrocarbon fuel
cell where water is present as a reactant, thus, providing water rich vapour phase.
3. Maintaining appropriate water content in the vapour phase at the processing
conditions was shown to be successful in keeping the zirconium phosphate in a
sufficiently hydrated state, so that the conductivity values could be improved by one
order of magnitude.
4. The effect of glycerol (GLY) on the enhancement of proton conductivity in the
prepared composite membranes was presented for the first time. Order of magnitude
enhanced proton conductivity for the ZrP/PTFE/GLY composite membrane, was
reported in this thesis. This value approached that of Nafion.

108
5. The effect of glycerol (GLY) addition on the improvement of PTFE conductivity, i.e,
from being a non proton conducting material, to a material that possessed proton
conductive properties, was reported in this thesis, and for the first time in the
literature.
6. A technique was developed in this thesis, for the formation of nano–scale ZrP
particles upon the addition of glycerol (GLY), combined with successive wetting and
drying inside a confined hydrophobic environment (the pores of PTFE).
7. The enhanced proton conductivity caused by glycerol (GLY) in the ZrP/PTFE/GLY
composite membranes was explained in this work by proton hopping via the OH
groups in glycerol (GLY), in addition to two known phenomena: proton transport on
the exterior surfaces of the ZrP solid spheres, proton hopping through the bulk of the
ZrP.
8. The spherical shape of the ZrP particles obtained in the ZrP/PTFE/GLY composite
membrane was explained in this thesis, based on the presence of glycerol (GLY).
Isopropanol was used during preparation because (unlike water) it wets the PTFE
porous membrane. GLY remained dissolved in isopropanol until it evaporated from
the membrane leaving GLY in the PTFE pores with the hydrophilic zirconium
oxychloride particles. At that point, micelles may have formed, with the
hydrophobic portion directed toward the PTFE and the hydrophilic portion directed
toward the zirconium oxychloride. Such an orientation may have favored the
formation of the ZrP spherical particles.
9. The value of proton conductivity for the ZrP/PTFE/GLY composite membrane was
shown to be maintained when the temperature was increased from 20 °C to 200°C
provided the steam to feedstock ratio that was typical of that required for a direct
propane fuel cell.

109
10. A method of modifying the composite membranes was described, by having
additives such as silicic acid and sulphuric acid incorporated in the prepared
ZrP/PTFE/GLY composite membrane.
11. An enhancement in proton conductivity was reported in this thesis by modifying the
ZrP/PTFE/GLY composite membranes with silicic acid. The effect of silicic acid on
the produced ZrP material morphology and surface coverage of the composite
membrane was studied, evaluated and reported for the first time.
12. The enhanced proton conductivity reported in the Si–modified ZrP/PTFE/GLY
composite membranes was explained in this thesis by a combination of proton
hopping in glycerol (GLY), at the Si-ZrP surface, the Si-ZrP bulk, and at the surfaces
of the hydrophilic silicic acid particles.
13. The value of proton conductivity for the Si–modified ZrP/PTFE/GLY composite
membrane was shown to be maintained when the temperature was increased to
200°C provided the steam to feedstock ratio that was typical of that required for a
direct propane fuel cell.

110
RECOMMENDATIONS FOR FUTURE WORK
This thesis presented a rigorous study for the high temperature ZrP/PTFE/GLY
composite membrane synthesis. In this section, a few recommendations for future research
on this type of composite membranes are presented.
1. This thesis investigated modified, Si–ZrP/PTFE/GLY composite membranes.
However, this modification needs to be further addressed.
This can be accomplished by the addition of silicic acid using a different technique, i.e.
by adding specified amounts of silicic acid to the reaction mixture (the alcoholic
ZrOCl2 suspension) instead of adding it to phosphoric acid. In this case, new
experiments can be performed to study the effect of introducing silicic acid into the
pores of PTFE with GLY and ZrOCl2 first, followed by reaction with phosphoric acid.
2. This thesis reported the effect of silicic acid addition on the enhancement of the
composite membranes proton conductivity and morphology. The issues of having
uniform and complete coverage of the proton conducting material need to be further
investigated.
Experiments can be performed using the successive wetting/drying technique used in
this thesis to prepare the Si modified composite membranes. However, there is a
certain void volume available in the PTFE sheet. Sufficient ZrOCl2 was added in this
work so that the produced amount of ZrP is enough to completely fill the pores of
PTFE. Hence, future experiments can be performed to study the effect of having
various (ZrP, GLY), to silicic acid mass ratios within the composite membrane. These
mass ratios can be varied in such a way that the total amount of the three components is
filling the pores available in the PTFE. These variations of components mass ratios are
anticipated to have an effect on the membranes proton conductivity and morphology.
3. The composite membrane developed in this work should be tested and evaluated for its
performance in a direct hydrocarbon fuel cell, by preparing a membrane electrode
assembly (MEA) and obtaining a fuel cell polarization curve.

111
APPENDIX A
A1- DIRECT HYDROCARBON PROCESS FLOW SHEET AND FUEL CELL
A2- FUEL CELL’S GROOVE DEPTH CALCULATIONS
A3- FUEL CELL COMMISIONING AND START UP PROCEDURE

112
A-1 Direct hydrocarbon oxidation process flow sheet, fuel cell and, fuel cell test station.
The direct oxidation of hydrocarbon process flow sheet is shown in Fig. 1. It was
designed and developed as part of the current research project. Propane is fed to the anode
of the fuel cell. De-ionized water is also fed to the anode, via a peristaltic pump, out of a
burette to provide the necessary water for the anode reaction.
The following reactions are taking place:
Anodic reaction: C3H8 +6 H2O = 3CO2 + 20 H+ + 20 e
–1 (1)
Cathodic reaction: 5 O2 + 20 H+
+ 20 e–1
= 10 H2O (2)
And the overall reaction is: C3H8 + 5 O2 = 3CO2 + 4 H2O (3)
The exit steam at the anode is condensed in a flask to calculate the amount
consumed inside of the fuel cell. Air is fed to the cathodic compartment. The flow rates of
the inlet gaseous streams are measured with electronic flow meters.
The fuel cell is heated to a maximum of 200 C via two heating elements purchased
from Omega and mounted inside the graphite blocks. The temperature is controlled by two
temperature controllers. The anodic and cathodic products (carbon dioxide, unreacted and
partially reacted propane, steam and excess air) are measured by bubble flow meters.
Differential pressure transducers are used between the exit carbon dioxide (CO2), inlet de-
ionized water and the inlet propane to monitor the pressure difference in such a way that a
small differential pressure between streams is maintained. The fuel cell is connected to a
potentiostat, and voltmeter to measure the potential difference and the current across the
cell. The cell potential and other parameters, including reactants flow rates and
temperatures are all monitored by LABVIEW.

113
Fig. 1: Process flow sheet of direct propane electro-oxidation.
The fuel cell consists of two graphite blocks, in which a flow field is engraved. The
fuel cell was custom made in our machine shop with a total machined geometrical cell area
of 5 cm2. The cell is also held together by two stainless steel plates that are gold-plated and
a set of bolts. These two plates can be bolted together once the membrane electrode
assembly is placed inside and further tightened by a torque wrench. The fuel cell is sealed
by a Viton O-ring purchased from McMaster-Carr. The groove depth and dimensions were
calculated then the groove was machined in the graphite plate accordingly. Fig. 2 shows a
top view for a single graphite plate showing the locations of the flow field and the o-ring.

114
Fig.2: Top view of a single graphite plate.

115
A2- FUEL CELL’S GROOVE DEPTH CALCULATIONS
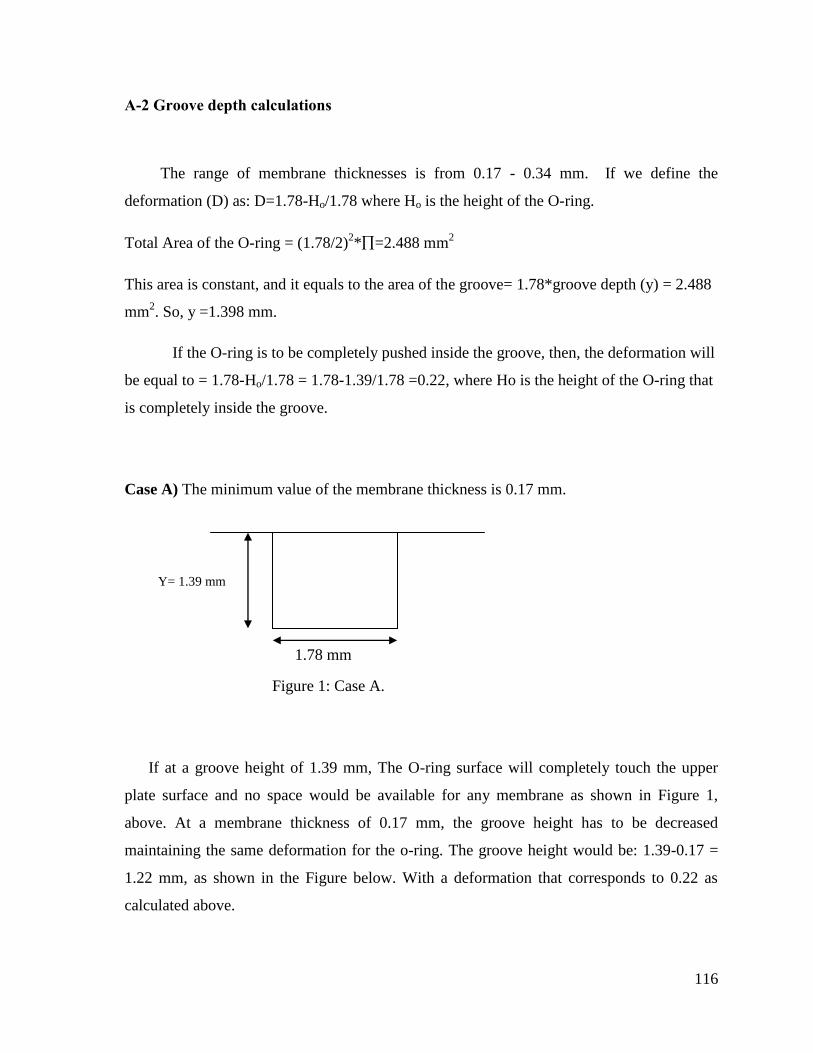
116
A-2 Groove depth calculations
The range of membrane thicknesses is from 0.17 - 0.34 mm. If we define the
deformation (D) as: D=1.78-Ho/1.78 where Ho is the height of the O-ring.
Total Area of the O-ring = (1.78/2)2*=2.488 mm
2
This area is constant, and it equals to the area of the groove= 1.78*groove depth (y) = 2.488
mm2. So, y =1.398 mm.
If the O-ring is to be completely pushed inside the groove, then, the deformation will
be equal to = 1.78-Ho/1.78 = 1.78-1.39/1.78 =0.22, where Ho is the height of the O-ring that
is completely inside the groove.
Case A) The minimum value of the membrane thickness is 0.17 mm.
Figure 1: Case A.
If at a groove height of 1.39 mm, The O-ring surface will completely touch the upper
plate surface and no space would be available for any membrane as shown in Figure 1,
above. At a membrane thickness of 0.17 mm, the groove height has to be decreased
maintaining the same deformation for the o-ring. The groove height would be: 1.39-0.17 =
1.22 mm, as shown in the Figure below. With a deformation that corresponds to 0.22 as
calculated above.
Y= 1.39 mm
1.78 mm
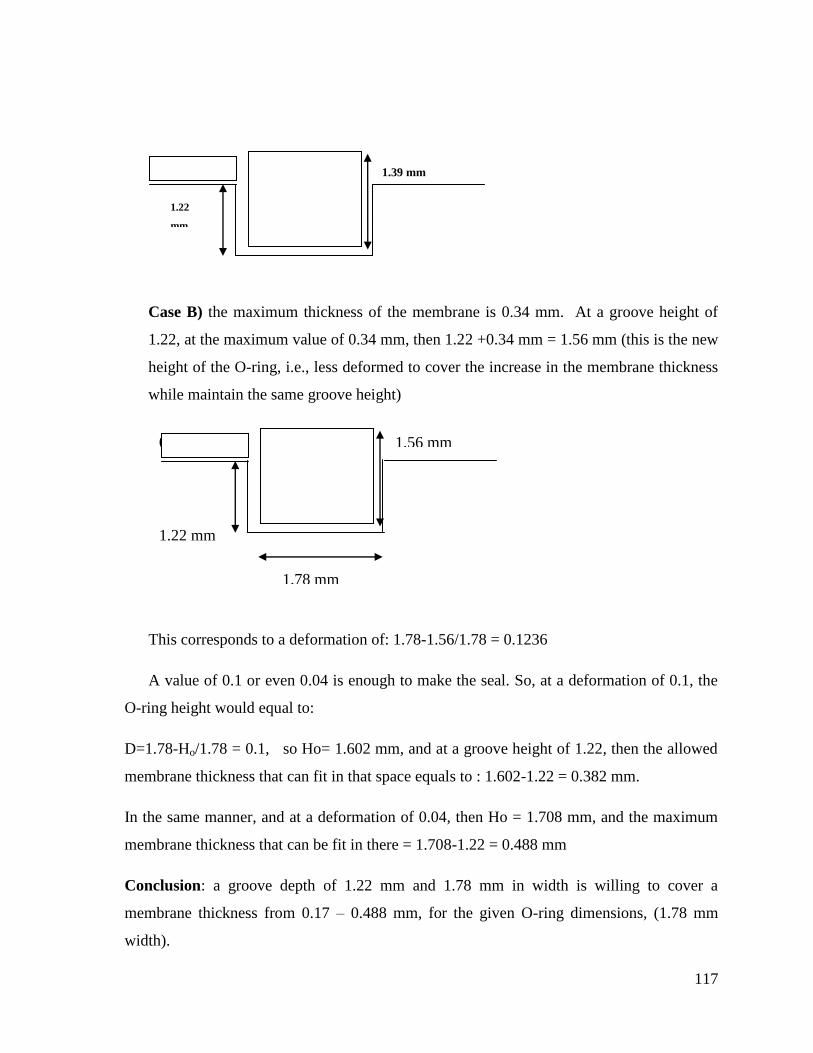
117
Case B) the maximum thickness of the membrane is 0.34 mm. At a groove height of
1.22, at the maximum value of 0.34 mm, then 1.22 +0.34 mm = 1.56 mm (this is the new
height of the O-ring, i.e., less deformed to cover the increase in the membrane thickness
while maintain the same groove height)
This corresponds to a deformation of: 1.78-1.56/1.78 = 0.1236
A value of 0.1 or even 0.04 is enough to make the seal. So, at a deformation of 0.1, the
O-ring height would equal to:
D=1.78-Ho/1.78 = 0.1, so Ho= 1.602 mm, and at a groove height of 1.22, then the allowed
membrane thickness that can fit in that space equals to : 1.602-1.22 = 0.382 mm.
In the same manner, and at a deformation of 0.04, then Ho = 1.708 mm, and the maximum
membrane thickness that can be fit in there = 1.708-1.22 = 0.488 mm
Conclusion: a groove depth of 1.22 mm and 1.78 mm in width is willing to cover a
membrane thickness from 0.17 – 0.488 mm, for the given O-ring dimensions, (1.78 mm
width).
1.39 mm
1.22
mm
0.17 mm
0.34 mm 1.56 mm
1.22 mm
1.78 mm

118
A3- FUEL CELL TEST STATION COMMISIONING AND START UP
PROCEDURE

119
A-3: DHFC test station–start up procedure
Fig.1: Fuel cell test station located in D219.

120
A) LabView
1. Self Calibration: Click on Measure and Automation icon on the desktop, then
Configure, devices and interface. Right click on: NI-PCI-6010 and choose: Self
test then self calibrate.
2. Open Labview main screen (there is a shortcut on the desktop).
3. Ensure that both sides of DPI’s are at atmospheric pressure , this is done by:
3.1 closing the cylinder shut off valve of the propane and the air cylinders
3.2 verifying that the water pump has been shut off.
3.3 opening the anodic reaction products, propane and air rotameter valves. This
ensures that there is no back pressure in the lines upstream of these valves.
3.4 open the on-off valves adjacent to the gas cylinder regulators
3.5 verify that the air and propane gas cylinders have discharge pressure of 0
psig.
4. RUN labview first, then ZERO the LabView readings for the differential pressure
indicators (DPI’s): P1 (water – propane white line on labview) and P2 (air-propane
purple line on labview) when atmospheric pressure is on both sides of the DP cells.
Then close the air and propane rotameter valves. To “Zero” the DP readings, go to
the bar located to the left of “zero DP” label, copy data from there and paste it in the
“zero DP” bar. Then go to EDIT, set current value as default. Go to FILE and save.
The click on PAUSE.
5. Adjust the mass controllers “set points” to the desired values should be done step-
wise, 0.5 volts at a time, followed by a waiting time of 2 minutes. It is also done
when the process is on RUN mode and gases are flowing. Targets are: 5 Volts for

121
propane (F1) (as calibrated- 2.2 mL/min air at NTP) and 4 Volts for Air (F2) (as
calibrated-1.3 mL/min air at NTP), i.e. set them at their full scale.
Note that P1 is the square cole-parmer pressure transmitter (0-1 PsiD), part #: 68071-
52. And P2 is one of the Baratron pressure transducers, from MKS, # 223BD-
00100AAB.
B) Fuel Cell Assembly Procedure
1. Place the MEA inside the fuel cell; put the various plates in the proper order (See Fig. 2
for the order) and once all the layers are properly aligned insert the bolts, and gently
hand tighten the bolts.
Fig. 2: Fuel Cell Assembly-Layers order.
2. Start tightening the bolts using a torque wrench. This is done by (referring to Figure 3)
slightly turning bolt number 1 for example at one corner followed by turning the bolt on
the opposite side of fuel cell (number 2) to obtain the same magnitude of force as bolt #

122
1. Then returning back to bolt number 3 followed by bolt number 4 and so on until all
bolts are tightened.
3. Use the torque wrench to obtain a torque of 10 in-lbf value initially. Then increase torque
vales to 30-40 in-lbf (a general accepted torque values are 30 - 40 in-lbf for 1/4” bolts
and 20 - 30 inch lbs for screws [1]), and in some fuel cell studies a value of 125 inches
lbs (on the torque wrench) is recommended [2].
4. Inspect connections (on the fuel cell) : propane inlet (1A-inlet), water inlet (2A-inlet), air
inlet (1C-inlet), reaction product and unreacted propane outlet (1A-outlet), steam outlet
(2A-outlet), air steam outlet (1C-outlet) and the cathode reaction product (2C-outlet).
5. Ensure that (a) the anode reaction product outlet goes to a bubble flow meter, (b) the
propane and air outlets go to the fume hood to an erlenmeyer flask (500 mL) that
contains 4 cm’s of water, and (c) the cathode product (steam-air mixture) outlet goes to a
flask to be weighed. (Note that the empty flask must be weighed before the experiment
begins). Rather than dead-ending any of the streams, the feed lines to the fuel cell
(propane and air) were submerged in a few cm’s of water (4 cm of water in a 500 mL
flask). This makes the feed lines dead-ended unless the pressure in the lines exceeds a
few cm of water. In those cases, the feed gases will bubble through the water. The head
of water acts as a pressure relief or safety valve and prevents excessive pressure in the
lines.
6. Set the heaters and thermocouples in place and adjust the set points to the desired values
for the temperature controllers (120 °C). In order to adjust the set points on the
temperature controllers these steps are followed, referring to Figure 4 below and when
the temperature controller is ON:

123
6.1 Press the arrows or in order to adjust the SV value to the desired set point
SV. Then press
6.2 Press to make sure that the controller is in the RUN position. This can be
verified when the function r-5 on the PV screen is at RUN. If not you can adjust that using
the arrows then by pressing enter
6.3 Press again until a function (At) is shown on the PV screen. Then by
adjust the value on SV screen to be ON. At that moment the At will start flashing on the
temperature controller, this means it began to heat to the desired set point. Press again.
6.4 To stop the temperature controller from heating you can press , and then
adjust the r-5 function on the PV screen to the STOP condition by using the arrows.
Fig.3: Top view of the anode and cathode
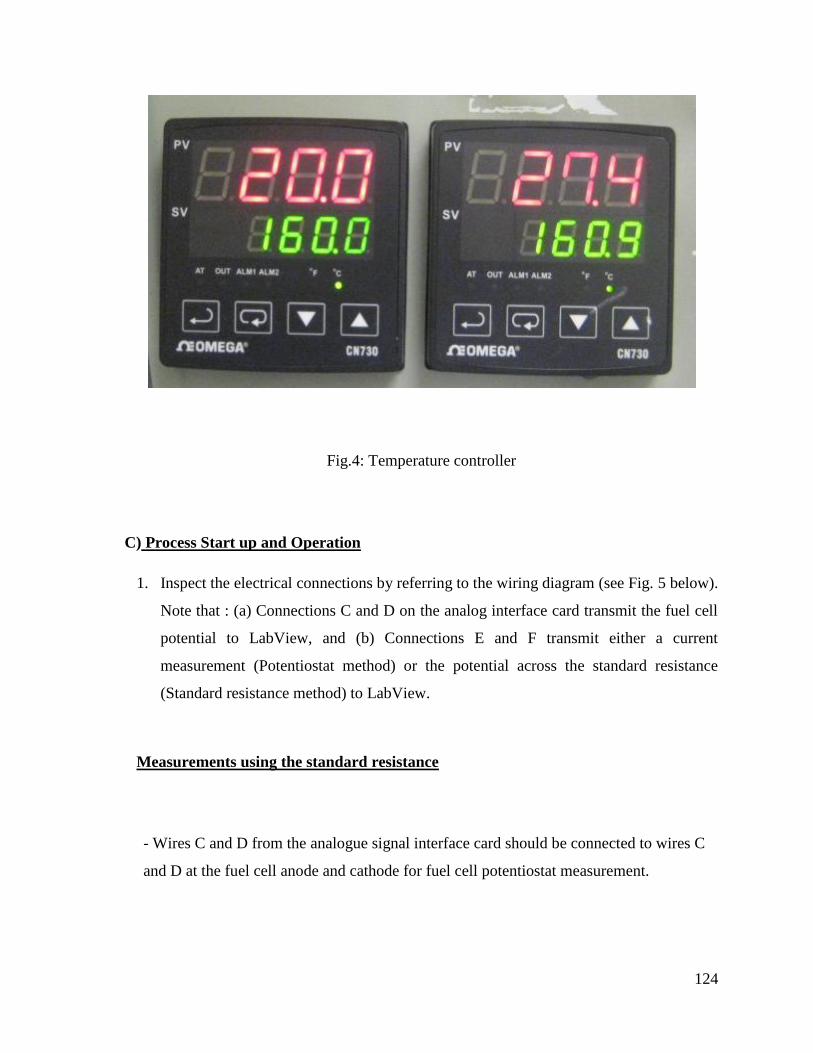
124
Fig.4: Temperature controller
C) Process Start up and Operation
1. Inspect the electrical connections by referring to the wiring diagram (see Fig. 5 below).
Note that : (a) Connections C and D on the analog interface card transmit the fuel cell
potential to LabView, and (b) Connections E and F transmit either a current
measurement (Potentiostat method) or the potential across the standard resistance
(Standard resistance method) to LabView.
Measurements using the standard resistance
- Wires C and D from the analogue signal interface card should be connected to wires C
and D at the fuel cell anode and cathode for fuel cell potentiostat measurement.

125
- Wires C’ and D’ at the fuel cell anode and cathode should remain unconnected to
anything.
- Wires E and F from the analogue signal interface card should be connected to wires G
and H that are across the standard resistance.
Measurements using the potentiostat
- Wires C and D from the analogue signal interface card should be connected to
positions C and D on the potentiostat.
- Wires E and F from the analogue signal interface card should be connected to positions
E and F on the potentiostat.
- Wires E and F at the fuel cell anode and cathode should be connected to wires E’ and
F’ that go to the potentiostat. Wires E and F to the Standard Resistance should not be
connected to anything.

126
Fig. 5: Wiring diagram.
Calibration of the standard resistance using the HP meter.
Connections C, D, E, and F on the analog interface card should not be connected to
anything.
1. Using the 4-wire measurement (shown in Fig.5 for the HP voltmeter), the value of the
standard resistance is determined under the lab conditions. A standard resistance of 0.01
Ohm was obtained from NRC.

127
a) The 4-wire connection to the HP voltmeter (referring to Fig.5) is established. The
outermost wires from the standard resistance should be connected to the HP
voltmeter terminals where the current [1] is generated [ Signal (4-wire) ] and the
innermost wires from the standard resistance are to be connected to the HP voltmeter
terminals that measure potential [2] [ Input (2-wire) ]. Values from [1] and [2] above
shall be used to calculate the resistance.
b) Once the resistance is known, disconnect the 4-wire connection wires and connect
them with E and F. Press the function button on the HP voltmeter to change
measurement to “potential symbolized by V”. The HP voltmeter will now shift the
function to measure the potential. If you do not notice a change in function from
Signal to V signal, press “Hold/Manual” button to change.
c) Record V initially before any gas flow.
2. On the test station rack, turn the main power switch ON. This will cause the heaters to
begin heating and controlling at their set points.
3. Click RUN button on labview.
4. Inspect the gas cylinders connections (all connectors are tightened and no leaks). Close
all the rotameter valves. Close the on/off exit valves near the gas cylinder regulators.
Adjust the propane gas cylinder discharge pressure (head pressure) (before the mass
controller F1 (propane) to a value of 10 psig. Adjust the air gas cylinder discharge
pressure (head pressure) (before air mass controller F2) to a value of 10 psig.
5. Establish the air flow first.
5-1 Close the on-off valve adjacent to the air regulator. Adjust the air cylinder
regulator so that the air cylinder discharge pressure is 10 psig. Open the on-off

128
valve adjacent to the air regulator. Maintain the cylinder discharge pressure at 10
psig, by adjusting the air regulator.
5-2 With the air cylinder discharge pressure at 10 psig, and the on-off valve adjacent
to the air regulator completely open, adjust the air rotameter valve to establish air
flow to the cathode side of the fuel cell. Carefully watch the reading of the
differential pressure transducer, DP2 (purple line, air-propane). It should have
atmospheric pressure on the propane side and on the air side it should have a
maximum differential pressure of 3 mm H2O. This is a pressure slightly above
atmospheric pressure on the air side. This reading represents the P across the
membrane electrode assembly. Experiments have indicated that MEA’s rupture
occurs at a value of P = 3.4 mm H2O.
5-3 Measure the air flow rate with the bubble meter. Adjust the air rotameter to
increase the air flow rate to the smaller value of either (a) 4 V (1.0 mL /min NTP) on
the air mass flow controller or (b) 3 mm H2O on the DP2 cell. Make a note of the
numerical reading on the rotameter scale.
6. Establish propane flow.
6-1 Close the on-off valve adjacent to the propane regulator. Adjust the air
cylinder regulator so that the propane cylinder discharge pressure is 10 psig. Open
the on-off valve adjacent to the propane regulator. Maintain the cylinder discharge
pressure at 10 psig, by adjusting the propane regulator. With the propane cylinder
discharge pressure at 10 psig, and the shut off valve completely open, adjust the
propane rotameter valve to establish propane flow to the anode side of the fuel cell.
Carefully watch the reading of the differential pressure transducer, DP2 (purple line,
air-propane) prior to adjusting the propane rotameter valve. Initially, the air side
should have a maximum differential pressure of 3 mm H2O (labview reading of
0.005). As the pressure on the propane side increases, the differential pressure
should decrease toward zero. This reading represents the P across the membrane

129
electrode assembly. If the reading is positive, the pressure on the air side will be
greater than the pressure on the propane side. If reading is negative the pressure on
the propane side will be greater than that on the air side. Note that the flow rates of
propane and air should be adjusted using rotameter valves until acceptable flow rates
are obtained. In all cases the maximum differential pressure should not exceed 3
mm H2O.
6-2 Measure the propane flow rate with the bubble meter. Adjust the propane
rotameter to increase the propane flow rate on the propane mass flow controller, F2,
to the smaller value of either (a) 5 V (1.0 mL /min NTP) on the propane mass flow
controller or (b) 3 mm H2O (Labview reading of 0.003) on the DP1 cell. Make a
note of the numerical reading on the rotameter scale. It should have atmospheric
pressure on the water side and slightly above atmospheric pressure on the propane
side. Ideally, and after the final adjustment at a propane flow rate of 5 Volts, F1 and
DP2 pressure difference of 3 mm H2O or slightly less is wanted.
6-3 Make a note of the reading of the differential pressure transducer (air-propane).
It should have changed. Now the propane side should be slightly above the air side.
It now should be the opposite of item 5-2 above. Propane must flow through a long
tube to the bubbler in the fume hood.
7. Establish the water flow.
7-1 Turn on the water pump to the smallest flow rate with a hose clamp completely
sealing off the water tube. Then start adjusting the clamp position to allow water to flow
very SLOWLY. Now, the water pressure should rise automatically to approximately
match the propane pressure, but be slightly less than the propane pressure, if the water
channel is closer to the anode product channel than the propane channel. We need to
monitor the differential pressure between the propane and water (DP1). Depending on
the interdigitated channels used, one of the streams (propane) will be at a greater
pressure than water in order to ensure that propane pressure is greater than water
pressure, i.e., the DP1 reading is positive or negative and has a value of approximately 2
mm H2O.

130
8. Click SAVE on Labview to record measurements.
9. All the saved files can be found on my computer, C, DATA. They will be shown
according to the date.
Fig. 6: Calibration of mass controller 1 at head pressure of 10 psig using Air.
Mass Controller F1
R2 = 0,973
0
0,2
0,4
0,6
0,8
1
1,2
1,4
1,6
1,8
2
0 1 2 3 4 5 6
Voltage (V)
Air
Flo
w r
ate
(m
L/m
in)

131
Fig. 7: Calibration of Mass controller 2 at head pressure of 10 psig using Air.
Mass controller F2
R2 = 0,9868
0
0,2
0,4
0,6
0,8
1
1,2
0 1 2 3 4 5 6
Voltage (Volts)
Air
Flo
w r
ate
(m
L/m
in)

132
Fig. 8: Calibration of pressure transducer 1 (HC-H2O).
Fig. 9: Calibration of DP2 ( HC-Air)
DP1 Calibration
y = 709.48x + 0.3676
R2 = 0.9939
0
20
40
60
80
100
120
140
0 0.02 0.04 0.06 0.08 0.1 0.12 0.14 0.16 0.18 0.2
Lab View Reading
Pre
ss
ure
[m
m H
2O
] .

133
References
1. http://www.eaglefuelcells.com/tips.html
2. W. K. Lee et al. J. Power Sources, 84 (1999), p.45.

134
APPENDIX B
REVIEW OF PREVIOUSLY USED TECHNIQUES TO PREPARE
ZrP/PTFE COMPOSITES

135
Appendix B: Review of the techniques previously used to prepare ZrP/PTFE
composites-morphology studies
Several studies were conducted in this work to synthesize ZrP/PTFE composite
membranes. The objective was to have a mechanically stable and conductive composite
membrane by filling the pores of PTFE with the electrolyte material (ZrP). This could be
accomplished by the in-situ precipitation of ZrP according the chemical reaction shown in
Eq (1) below:
ZrOCl2•8H2O + 2 H3PO4 → Zr(HPO4)2•H2O + 2 HCl + 8 H2O
An SEM image for zirconium oxychloride (ZrOCl2.8H2O) is shown in Fig. 1. The
material consists of cuboid shaped particles of 100 + μm length and 50 μm width.
Zirconium oxychloride (ZrOCl2.8H2O) is an off-white solid characterized by being a highly
hygroscopic material.
Fig. 1. SEM image of zirconium oxychloride (ZrOCl2. 8H2O).
136
Composite membranes were first prepared by painting a previously sonicated
alcoholic suspension of ZrOCl2/isopropanol on top of the porous PTFE in all
directions. The PTFE was then rapidly dried in the oven after each painting step.
The procedure was repeated several times to ensure a complete filling of the pores
with ZrOCl2. Glycerol (GLY) was added to H3PO4 to prior to the in-situ reaction to
overcome the effect of surface tension and ensure the full coverage of the acid on top
of the membrane. Electrochemical impedance analysis of this type of composite
membrane was performed and the results showed an enhanced proton conductivity in
the range of 0.03 S/cm. However, the amount of glycerol (GLY) in the membrane
was not yet determined because GLY was added to the acid and the membrane was
rinsed after the reaction. Despite the enhanced proton conductivity, SEM analysis of
this membrane showed a non uniform coverage of the ZrP material on top of the
membrane. Fig.2. shows a top view for the membrane prepared by painting the
ZrOCl2/isopropanol suspension, followed by reaction with concentrated (20 mL of
H3PO4) that contained 0.2 g of GLY. Image (a) shows the ZrP material covering the
surface of the membrane; however, it also shows the non–uniform distribution of the
material on–top of the composite membrane. In particular, and as seen in image (b),
a large agglomerate of ZrP particles appeared on some regions of the PTFE, whereas,
other regions of the PTFE appeared to be uncovered. The previous observations
showed that painting produced a non uniform coverage of the ZrP material.

137
Fig. 2. SEM image of ZrP/PTFE composite membranes when 0.2 g GLY was added to 20
mL H3PO4
Nano–size ZrP particles were also prepared in this research project. The objective
was to prepare the ZrP material first, then introduce it into the PTFE pores. ZrP nano
particles were prepared by titrating a 25 mL of 0.5 M of ZrOCl2 into a stirred 50 mL of
Decane ( n-Decane, practical from J.T. Baker Inc.). Titration of ZrOCl2 was performed
under stirring for 30 minutes followed by the titration of a 25 mL of 1 M H3PO4 into the
stirred emulsion. The emulsion was then kept under vigorous agitation for 2 hours. A
sample was taken and analyzed for the particle size distribution using Malvern zetasizer
nano analyser. The results are shown in Fig. 3. A narrow particle size distribution was
obtained with an average diameter of 5560 nm. A sample of this emulsion was decanted for
several times by adding isopropanol. Then the emulsion was painted on-top of the PTFE
sheet in all direction followed by drying in the oven at 130 ºC. The painting and the oven
drying was repeated several times. SEM analysis was made for a membrane sample
prepared by this method. The results are shown in Fig. 4.

138
Fig. 3. Size distribution of the formed ZrP nano particles.
Fig. 4. SEM image of ZrP nano particle emulsion painted then dried on a PTFE porous
sheet.
Fig.4. shows that the ZrP nano particles agglomerated into larger clusters upon drying,
hence, prevented the ZrP from entering the small pores of PTFE. Consequently, subsequent
research efforts in this work were directed toward the preparation of stirred and heated
alcoholic suspension of ZrOCl2. This alcoholic suspension contained a specified amount of
glycerol. Then, the suspension was introduced into the pores of PTFE as previously
explained in chapter 4 of this thesis.


![Use of Zirconium Phosphate-Sulphate as Acid Catalyst for ......as solid acid catalysts for the conversion of several biomass-based components to chemicals [15,16]. To our knowledge,](https://img.dokumen.tips/doc/110x75/60319d03c96465118108e35f/use-of-zirconium-phosphate-sulphate-as-acid-catalyst-for-as-solid-acid-catalysts.jpg)