Embed Size (px)
Citation preview

Components of the Housing Stock
2002 2003 2004 2005 2006
Total Stock 119,297 120,834 122,187 123,925 126,012
Occupied 104,965 105,560 106,588 108,231 109,575
Owner 71,278 72,054 73,575 74,553 75,380
Renter 33,687 33,506 33,013 33,678 34,195
Vacant 14,332 15,274 15,599 15,694 16,437
For Sale 1,220 1,308 1,307 1,451 1,836
For Rent 3,347 3,676 3,802 3,721 3,737
2nd Homes 6,375 6,626 6,750 6,790 7,034
Other 3,390 3,664 3,740 3,732 3,830
Source: Census Bureau Housing Vacancy Survey

2.0
2.5
3.0
3.5
4.0
4.5
1910 1920 1930 1940 1950 1960 1970 1980 1990 2000
Live Births
1979- Echo Boom
1965-78Baby Bust
1946-64Baby Boom
Data in Millions Source: HHS National Center for Health Statistics

Population Change by Age
-3,000
-2,000
-1,000
0
1,000
2,000
3,000
4,000
5,000
6,000
7,000
15-24 25-34 35-44 45-54 55-64 65-74 75+
'00-'05 '05-'10 '10-'15
Sources: Census Bureau and NAHB Long Term Forecast
Thousands
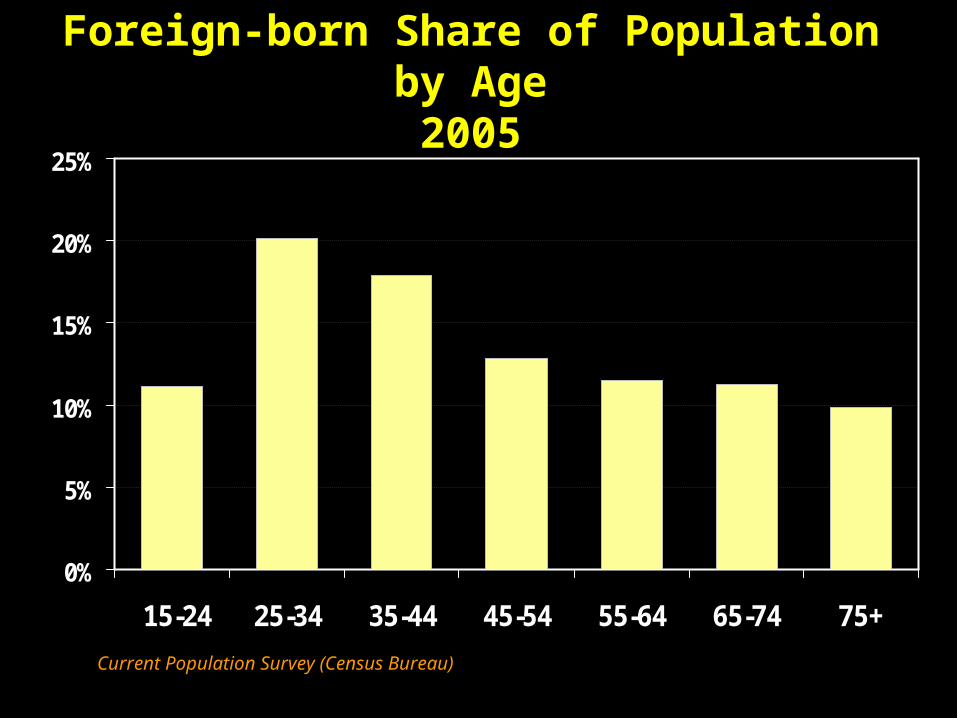
Foreign-born Share of Population by Age2005
0%
5%
10%
15%
20%
25%
15-24 25-34 35-44 45-54 55-64 65-74 75+
Current Population Survey (Census Bureau)

0%
5%
10%
15%
20%
25%
30%
20-24
25-29
30-34
35-39
40-44
45-49
50-54
55-59
60-64
65-69
70-74
75+
Mobility by Age: Moved in Previous 12 Months
Source: Current Population Survey March 2004

Households With Second Homes by Age
0.0%
1.0%
2.0%
3.0%
4.0%
5.0%
6.0%
7.0%
8.0%
< 35 35-44 45-54 55-64 65-74 75+
Survey of Consumer Finances (Federal Reserve Board)

Long Term Demand and Supply
Demand:
1976- 1985
1986- 1995
1996- 2005
2006- 2015
∆ Households 1,398 1,211 1,182 1,502
∆ Vacancies 199 256 347 75
Net Removals 172 166 306 438
1,768 1,633 1,835 2,014
Production:
Single Family 1,030 1,042 1,273 1,447
Multifamily 477 358 307 399
Manufactured 261 233 255 168
1,768 1,633 1,835 2,014
Source: Census Bureau, NAHB Forecast

New Homes Started/Shipped
2005 2006 2007 2008’06-’15
Single Family 1,719 1,478 1,163 1,230 1,447
Multifamily 354 339 292 298 399
Total Starts 2,073 1,817 1,455 1,528 1,846
Manf Homes 148 118 93 105 168
New Housing 2,221 1,936 1,547 1,633 2,014

0
5
10
15
20
25
30
35
1940 1950 1960 1970 1980 1990 2000 2001 2003 2005
Median Age of Housing Stock
Years

R2 = 0.54
0
5
10
15
20
-1% 0% 1% 2% 3% 4% 5% 6%
2006: Chg in Employment v Starts/Pop
•Excluding Louisiana

R2 = 0.77
0
5
10
15
20
-1% 0% 1% 2% 3% 4%
2006: Chg in Population v Starts/Pop


Rental Vacancy Rates 2004
0% to 8%8.1% to 11%
11.1% to 13%
13.1% to 18%
US: 10.2%

Rental Vacancy Rates 2005
0% to 8%8.1% to 11%
11.1% to 13%
13.1% to 15%
US: 9.8%

Rental Vacancy Rates 2006
0% to 8%8.1% to 11%
11.1% to 13%
13.1% to 18%
US: 9.7%

Starts per Capita 2004
6.7 to 10.0
5.0 to 6.7
Less than 5.0
10.0 or more
US: 6.6

Starts per Capita 2005
6.7 to 10.0
5.0 to 6.7
Less than 5.0
10.0 or more
US: 7.0

Starts per Capita 2006
6.7 to 10.0
5.0 to 6.7
Less than 5.0
10.0 or more
US: 6.1

Starts per Capita 2007
6.7 to 10.0
5.0 to 6.7
Less than 5.0
10.0 or more
US: 4.8

Starts per Capita 2008
6.7 to 10.0
5.0 to 6.7
Less than 5.0
10.0 or more
US: 5.0

For more Housing Forecasts and In-Depth Analysis go to
HousingEconomics.com