Embed Size (px)
Citation preview

Components-bandgap relationships in
hybrid organic-inorganic perovskites
Shanti Maria Liga
February 2017
Literature Thesis (12 ECTS)
Under supervision of:
Dr. Sarah Brittman
Dr. Elizabeth von Hauff

1

2
Abstract
Over the last 8 years, hybrid organic-inorganic perovskite solar cells have shown a tremendous
increase in power conversion efficiencies, reaching 22.1% in 2016. A remarkable feature of this
material is the possibility of controlling its properties by chemical management, namely by changing
its elemental composition. One key parameter for solar cells is the optical bandgap, which strongly
depends on the elemental composition of the perovskite. The role played by each component in
generating the bandgap is still under debate, but it has already been demonstrated through simulations
and experimental evidence that it correlates with simple structural features, such as the X-B-X angles
and the B-X distance in the octahedral framework, the size of the organic cation and its interactions
with the inorganic components. Taking into account these correlations helps in improving the light
harvesting efficiency of this material, which can assume a bandgap between 1.1 eV and 3.1 eV
depending on the elements of which it is composed. This tunability offers the possibility of fabricating
colourful solar cells and suitable materials for tandem solar cells.

3
Contents
Abstract 2
Introduction 5
Chapter 1. Crystal structures and electronic structure 6
Chapter 2. The inorganic anion 10
2.1 Influence of the electronegativity of the X anion 10
2.2 Influence of the lattice constant 11
2.3 Current state of the art 12
2.3.1 MAPbX3 halide perovskites, pure and mixed forms 12
2.3.2 MAPbX3, polyanions perovskites 15
2.3.3 FAPbX3, formamidinium halide perovskites 15
2.4 Discussion 15
Chapter 3. The inorganic cation 17
3.1 Current state of the art 17
3.1.1 One B component perovskites 17
3.1.2 Mixed Pb-Sn perovskites 18
3.1.3 Doped CH3NH3PbI3 perovskites in Pb2+ sites 19
3.1.4 Lead- Free forms 20
3.2 Discussion 21
Chapter 4. The organic cation 22
4.1 Influence on X-B-X angles 22
4.2 Influence through H bonding 24
4.3 Current state of the art 25
4.3.1 Perovskites with one A component 25
4.3.2 Mixed organic perovskites 27
4.3.3 Mixed organic-inorganic perovskites 28
4.3.4 A study on CsPbI3 30
Discussion 30
References 32
Appendix 37

4
Introduction.
Hybrid organic-inorganic perovskites recently triggered tremendous research interest following the
astonishing progress of the efficiency of their solar cells, which in less than 8 years of intense research
have reached an efficiency of 22.1% (NREL). This impressive trend has revolutionized solar cell
research and encouraged many research groups to focus on these appealing solution-processable
semiconductors.
Perovskites are, in general, any materials with the same cubic crystal structure of calcium titanate and
chemical formula ABX31. Those used in solar cells are called hybrid organic-inorganic perovskites
because they are composed of a big organic cation, A, and an inorganic framework, constituted by a
metallic cation B, and an anion, X. The most common used organic cation is methylammonium
(CH3NH3+), while the X component is usually a halide, Cl-, Br- or I- and B is most frequently lead.
Organic-inorganic iodoplumbate and bromostannate perovskites were synthesised for the first time
in 19782,3. Around 15 years later, the studies of Mitzi et al.4,5 highlighted the semiconducting
properties of perovskites. However, they were employed in photovoltaic application only in 2009,
when for the first time methylammonium lead iodide (MAPbI3) was used in a liquid-electrolyte-based
dye-sensitized solar cells, reaching an efficiency of 3.9%6. In addition to its impressive performance
as light harvester, MAPbI3 shown also its main drawback, namely its instability in the electrolyte.
Therefore, in the next years, the electrolyte was replaced with a solid organic hole conductor7,8,9.
While investigating the charge-transport properties of a perovskite deposited on mesoporous Al2O3,
it was for the first time recognized that methylammonium halide plumbates were not only good light
harvesters but could also act as n-type component in dye-sensitised solar cells, transporting the
electrons through their thickness to the electrode surface10. In the meanwhile, other studies shown
that it could also perform as p-type layer7,11. These discoveries triggered the research to evolve
towards perovskite thin film solar cells.
Perovskites have drawn great interest because they show a combination of organic and inorganic
characteristics that make them unique materials. Indeed, the long charge carrier lifetime12 and
diffusion length13 in combination with the high absorption coefficient14 and their synthesis, which
involves low-temperature and solution-based deposition, are all features that usually do not appear in
the same material. However, they still show two fundamental problems that the research community
has not yet solved. The first one is instability, which hampers the commercialization of perovskite
solar cells. The second one is the presence of lead in the structure, since it is a toxic element and its
release in the environment is a considerable concern.
Even though perovskites have been the subject of intense and successful research over the last few
years, the understanding of their properties is still under debate. Finding the relationship between the
chemical structure and the resulting properties is a useful tool to overcome some fundamental issues
that limit further development. Moreover, understanding the mechanisms behind the empirical results
helps to rationalize future research.
Since one of their roles in a solar cell is light harvesting, the correlation between the bandgap and the
components has been the subject of a lot of research. Some correlations between the bandgap width,
the properties of the components and their interactions have been highlighted. The optimization of
the bandgap to make solar cells with efficiencies close to that imposed by the Shockley-Queisser limit

5
is not the only objective of this research. Indeed, a motivation to fabricate lower bandgap perovskites
is that of use them for the bottom of tandem solar cells.
In the next pages, an overview of the scientific work that focuses on this topic is given. The role
played by each ion in tuning the optical bandgap is discussed based on theoretical and experimental
studies. The literature study shows also some discrepancies in the bandgap values measured by
different studies and some explanations are provided to account for these differences at the end of
each chapter and in the Appendix.
6
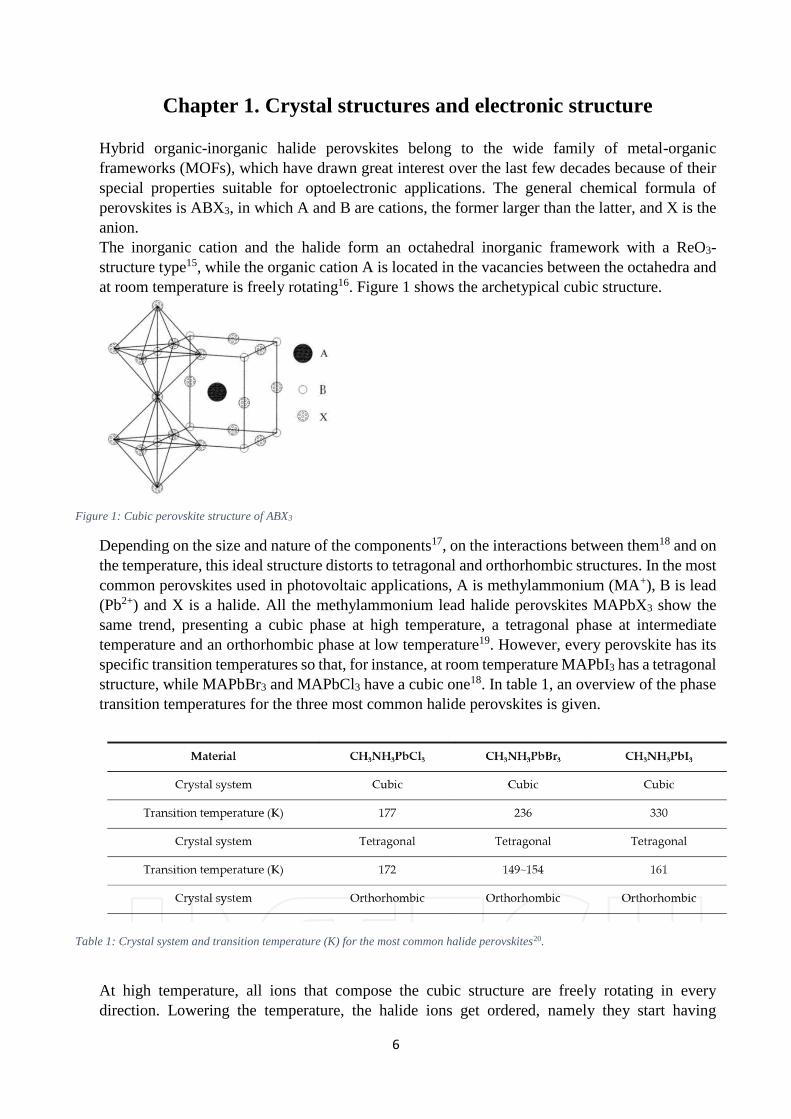
Chapter 1. Crystal structures and electronic structure
Hybrid organic-inorganic halide perovskites belong to the wide family of metal-organic
frameworks (MOFs), which have drawn great interest over the last few decades because of their
special properties suitable for optoelectronic applications. The general chemical formula of
perovskites is ABX3, in which A and B are cations, the former larger than the latter, and X is the
anion.
The inorganic cation and the halide form an octahedral inorganic framework with a ReO3-
structure type15, while the organic cation A is located in the vacancies between the octahedra and
at room temperature is freely rotating16. Figure 1 shows the archetypical cubic structure.
Figure 1: Cubic perovskite structure of ABX3
Depending on the size and nature of the components17, on the interactions between them18 and on
the temperature, this ideal structure distorts to tetragonal and orthorhombic structures. In the most
common perovskites used in photovoltaic applications, A is methylammonium (MA+), B is lead
(Pb2+) and X is a halide. All the methylammonium lead halide perovskites MAPbX3 show the
same trend, presenting a cubic phase at high temperature, a tetragonal phase at intermediate
temperature and an orthorhombic phase at low temperature19. However, every perovskite has its
specific transition temperatures so that, for instance, at room temperature MAPbI3 has a tetragonal
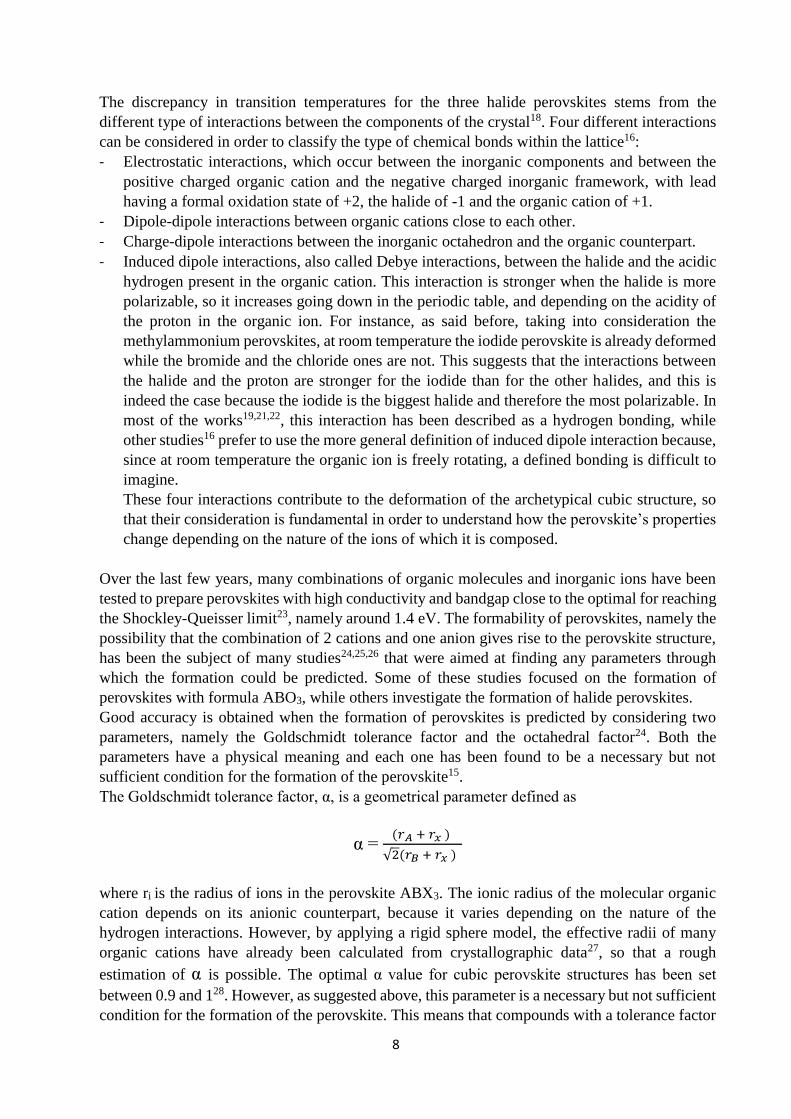
structure, while MAPbBr3 and MAPbCl3 have a cubic one18. In table 1, an overview of the phase
transition temperatures for the three most common halide perovskites is given.
Table 1: Crystal system and transition temperature (K) for the most common halide perovskites20.
At high temperature, all ions that compose the cubic structure are freely rotating in every
direction. Lowering the temperature, the halide ions get ordered, namely they start having

7
preferred positions, so that the symmetry of the system shifts from cubic to tetragonal. The further
decrease in temperature causes the ordering of MA ions, which determines the transformation
from the tetragonal phase to the even less symmetric orthorhombic one. Figure 2 depicts the three
structure phases and show the preferred directions to which the different components direct upon
cooling.
Figure 2: Structure models of the cubic (a), tetragonal (b) and orthorhombic (c) phases of methylammonium lead iodide20.
8
The discrepancy in transition temperatures for the three halide perovskites stems from the
different type of interactions between the components of the crystal18. Four different interactions
can be considered in order to classify the type of chemical bonds within the lattice16:
- Electrostatic interactions, which occur between the inorganic components and between the
positive charged organic cation and the negative charged inorganic framework, with lead
having a formal oxidation state of +2, the halide of -1 and the organic cation of +1.
- Dipole-dipole interactions between organic cations close to each other.
- Charge-dipole interactions between the inorganic octahedron and the organic counterpart.
- Induced dipole interactions, also called Debye interactions, between the halide and the acidic
hydrogen present in the organic cation. This interaction is stronger when the halide is more
polarizable, so it increases going down in the periodic table, and depending on the acidity of
the proton in the organic ion. For instance, as said before, taking into consideration the
methylammonium perovskites, at room temperature the iodide perovskite is already deformed
while the bromide and the chloride ones are not. This suggests that the interactions between
the halide and the proton are stronger for the iodide than for the other halides, and this is
indeed the case because the iodide is the biggest halide and therefore the most polarizable. In
most of the works19,21,22, this interaction has been described as a hydrogen bonding, while
other studies16 prefer to use the more general definition of induced dipole interaction because,
since at room temperature the organic ion is freely rotating, a defined bonding is difficult to
imagine.
These four interactions contribute to the deformation of the archetypical cubic structure, so
that their consideration is fundamental in order to understand how the perovskite’s properties
change depending on the nature of the ions of which it is composed.
Over the last few years, many combinations of organic molecules and inorganic ions have been
tested to prepare perovskites with high conductivity and bandgap close to the optimal for reaching
the Shockley-Queisser limit23, namely around 1.4 eV. The formability of perovskites, namely the
possibility that the combination of 2 cations and one anion gives rise to the perovskite structure,
has been the subject of many studies24,25,26 that were aimed at finding any parameters through
which the formation could be predicted. Some of these studies focused on the formation of
perovskites with formula ABO3, while others investigate the formation of halide perovskites.
Good accuracy is obtained when the formation of perovskites is predicted by considering two
parameters, namely the Goldschmidt tolerance factor and the octahedral factor24. Both the
parameters have a physical meaning and each one has been found to be a necessary but not
sufficient condition for the formation of the perovskite15.
The Goldschmidt tolerance factor, α, is a geometrical parameter defined as
α = (𝑟𝐴 + 𝑟𝑥 )
√2(𝑟𝐵 + 𝑟𝑥 )
where ri is the radius of ions in the perovskite ABX3. The ionic radius of the molecular organic
cation depends on its anionic counterpart, because it varies depending on the nature of the
hydrogen interactions. However, by applying a rigid sphere model, the effective radii of many
organic cations have already been calculated from crystallographic data27, so that a rough
estimation of α is possible. The optimal α value for cubic perovskite structures has been set
between 0.9 and 128. However, as suggested above, this parameter is a necessary but not sufficient
condition for the formation of the perovskite. This means that compounds with a tolerance factor
9
between 0.9 and 1 might not be perovskites if their octahedral factor does not fall in the suitable
range.
The octahedral factor concerns only the inorganic framework of the structure. Indeed, it is equal
to the ratio
μ = rB/rX
and the optimal values for forming a perovskite have been found to be between 0.414 and 0.73215.
The optimal values of α and μ have been determined by drawing a α-μ structure map of more
than 150 ABX3 compounds.
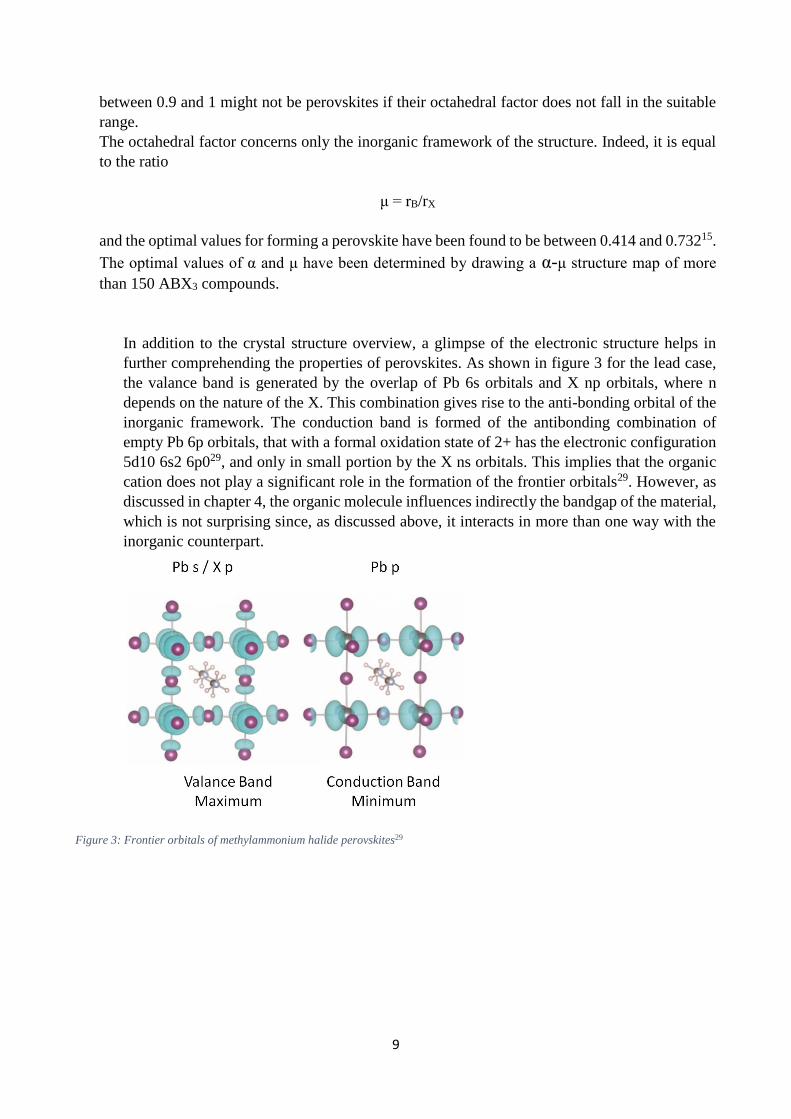
In addition to the crystal structure overview, a glimpse of the electronic structure helps in
further comprehending the properties of perovskites. As shown in figure 3 for the lead case,
the valance band is generated by the overlap of Pb 6s orbitals and X np orbitals, where n
depends on the nature of the X. This combination gives rise to the anti-bonding orbital of the
inorganic framework. The conduction band is formed of the antibonding combination of
empty Pb 6p orbitals, that with a formal oxidation state of 2+ has the electronic configuration
5d10 6s2 6p029, and only in small portion by the X ns orbitals. This implies that the organic
cation does not play a significant role in the formation of the frontier orbitals29. However, as
discussed in chapter 4, the organic molecule influences indirectly the bandgap of the material,
which is not surprising since, as discussed above, it interacts in more than one way with the
inorganic counterpart.
Figure 3: Frontier orbitals of methylammonium halide perovskites29

10
Chapter 2. The inorganic anion
Influence of the electronegativity of the X anion.
As mentioned in Chapter 1, the valance band is the result of the antibonding combination of Pb 6s
orbitals and X np orbitals, while the conduction band is mainly formed by empty Pb 6p orbitals.
A computational study on CsSnX3 perovskites30 found a clear correlation between both the
electronegativity of the halide ion and the bandgap, and the lattice constant of the crystal and the
bandgap. Making use of quasiparticle self-consistent GW (QSGW) electronic structure calculations,
the results fit the experimental values. Figure 4 shows the band structures and partial densities of
states of the cubic phases of the three CsPbX3, where X is I-, Br- or Cl- .
Figure 4: Band structures and partial densities of states of cubic CsSnI3, CsSnBr3 and CsSnCl330.
The analysis of the orbital character of the bands is a good starting point to determine how the halide
influences the change in the bandgap value. Looking at the CsSnI3 band structure, the lowest bands
are the I 5s bands. Of course, by increasing the electronegativity of the halide, these bands move

11
farther down in the energy axis. The second band starting from below is that of the Cs 5p, followed
by the band corresponding to the bonding combination of Sn 5s and I 5p orbitals. The next series of
bands are generated by I 5p states, while the band corresponding to the valance band maximum
(VBM) is produced by the antibonding combination of Sn 5s and I 5p orbitals. The conduction band
minimum (CBM) has mostly a Sn 5 p character, while above there are still I 5p and then Cs 5d
contributions. The minimum value of the bandgap is at the R point.
The analysis of the band structure clarifies the reasons why perovskites with more electronegative
halides have broader bandgap. Indeed, as the electronegativity raises, the X np orbitals (where n is 5
for I-, 4 for Br- and 3 for Cl-) are held more tightly by the nucleus and therefore have a lower energy.
This causes a worse interaction with the Sn 5s orbitals. Therefore, as the interaction between the
orbitals of the two elements diminishes due to a higher energy gap, the bonding orbital will be less
stabilized by this interaction and the antibonding orbital less destabilized. Thus, the latter will assume
a lower energy as compared to the case of strong interaction (Figure 5). The VBM energy drop
implies, of course, an increase in bandgap.
Figure 5: Qualitative representation of the bonding and antibonding interaction for 2 X with different atomic orbitals energy.
Influence of the lattice constant.
In addition to the electronegativity-bandgap correlation, when considering the same perovskite but in
different crystal phases, a relationship between the lattice constant and the bandgap exists30. Indeed,
when the lattice constant is bigger, the B and X ions are further apart and the orbitals in opposite
phases repel with lower energy, so that also in this case, the valance band has a lower energy and the
bandgap broadens. Figure 6 depicts the p orbitals of X pointing towards the Sn 5s orbital at the centre
of the unit cell. When the lattice parameter is bigger, both the bonding and the antibonding
interactions between the orbitals of B and X are reduced.

12
Figure 6: Representation of the X p orbitals pointing towards the Sn 5s orbital at the centre of the unit cell30
Current state of the art.
MAPbX3 halide perovskites, pure and mixed forms.
As discussed in the first chapter, as the temperature drops, the crystal structure of the perovskite
distorts and passes from cubic to tetragonal to orthorhombic. This change in symmetry influences
also the value of the lattice parameters, which, as previously shown, have a direct impact on the value
of the bandgap. It has been calculated through simulations for the case of MAPbI331 that by shifting
from the cubic structure to the tetragonal and from the latter to the orthorhombic the lattice parameters
grow progressively and the bandgap rises from 1.3 eV, to 1.43 eV to 1.61 eV. The bandgap at room
temperature, when this perovskite assumes a tetragonal structure, has been calculated experimentally
to be 1.51 eV. This value was extrapolated from diffuse reflectance UV-Vis spectra using the
Kubelka-Munk equation to convert it to absorption spectra and it is slightly higher that the calculated
one due to underestimation with the DFT using GGA calculation.
At a given temperature, the bandgap of MAPbI3 can be easily tuned by replacing the iodide with
another anion. As calculated from computational studies, when I- is replaced by a more
electronegative anion of the VII group of the periodic table, the bandgap broadens. This phenomenon
was demonstrated experimentally many times and by using different methods32,33,34. One of the latest
work measured not only the bandgap but also the valance and conduction bands energies. The first
one extrapolated from Tauc plots with data taken from UV-vis absorption measurements and the
second ones through direct and inverse photoemission studies32. Not only the electronic properties of
pure MAPbX3 perovskites were investigated, but also those of mixed halide species, namely
MAPbI2.1Br0.9, MAPbBr1.5Br1.5 and MAPbI2.1Cl0.9. However, from the XRD spectra it is not very
clear if the ratio of the two halides is actually the one indicated in the formula, which refers to the
ratios of precursors used. Other previous studies35 indicated the impossibility to form a one phase
film of MAPbI3-xClx with a percentage of Cl higher than 4%. Figure 7 shows the results obtained
from direct and inverse photoemission measurements while in the table the results for the optical
bandgap and the calculated exciton binding energy are given.

13
Figure 7: Energy level diagrams of various perovskite films experimentally derived from ultraviolet direct and inverse photoemission
spectra with a common vacuum level. The numbers in parentheses give the work functions. The table shows the Eg, Eopt and the
difference between these two with an error calculated by measuring 5 samples32.
The results shown in the table are in line with the theoretical explanation given in the previous section.
As the electronegativity of X increases, the interaction between Pb and X drops and the bandgap
increases, so that Eg(MAPbI3) < Eg(MAPbBr3) < Eg(MAPbCl3). Moreover, the bandgap of all the
mixed forms has a value between that of the two pure forms.
The closest elementary anion to iodide with regard to the electronic properties and the size is the
bromide. It was demonstrated that the entire range of alloys with formula MAPb(I1-xBrx)3 can be
synthesised from solution and that these alloys do not show phase segregation33in the dark36. The
variation of the bandgap in the alloyed hybrid perovskites was measured from the onset of the UV-
visible absorption spectra of the perovskite deposited on mesoporous TiO2, as shown in figure 8a. By
increasing the bromide ratio, the bandgap is tuned from 1.58 eV to 2.28 eV when x= 1. This bandgap
shift allows the fabrication of colourful devices as shown in figure 8b.
In order to see how miscible is the MAPbI3/MAPbBr3 alloy, the Vegard’s law can be applied. In
general, it correlates the molar fraction of the components with the change in properties of the alloy.
Figure 8c depicts the value of the bandgap as a function of the Br composition. Empirically, the
nonlinear variation of the bandgap with the Br ratio, which could be caused by the anisotropic nature
of binding, can be expressed as:
Eg[MAPb(I1-xBrx)3] = Eg[MAPbI3] + (Eg[MAPbBr3] - Eg[MAPbI3] – b)x + bx2

14
where b is the bowing parameter. For this case, b has been calculated to be 0.33, which is a value
small enough to consider a good miscibility of the two perovskites. The miscibility is determined by
the small difference in size and properties of iodide and bromide.
Figure 8: a) Uv-vis absorption spectra of MAPb(I1-xBrx)3 b) Photographs of the perovskite alloys on mesoporous TiO2 on FTO glass
substrates. c) A quadratic relationship of the bandgap and the bromide ratio33.
A few months after these observations, also the tunability of MAPbI3 bandgap through addition of
Cl- was tested35. However, the large difference in Cl-I ionic radii hinders formation of the alloy at
high Cl- ratios, so that only films with low Cl- ratio could be prepared from solution35, vapor-assisted
solution deposition37 and coevaporation34. The low incorporation of Cl- in the MAPbI3 structure was
determined by XRD spectra, which indicated the presence of MAPbCl3 phase and no shift of the main
peak of MAPbI3. Even though the bandgap of these Cl--doped MAPbI3 films remains the same, as
calculated from Tauc plots, charge transport increases dramatically, and this is the reason why other
attempts have been made to dope a perovskite with another perovskite with lower HOMO.
The optical properties of the Br analogue MAPbBr3-xClx were studied when the applications of
perovskites in optoelectronic devices were still unknown38. From XRD spectra observations, it is
clear that the combinations of these two anions results in an alloy and not in a two phase system.
Indeed, the peaks indicate just a constant decrease in lattice parameters as the concentration of
15
chloride increases, because of its smaller radius compared to that of the bromide. The bandgap was
measured from optical absorption spectra and shifted from 2.35 eV to 3.11 eV by going from the pure
bromide perovskite to the pure chloride perovskite.
MAPbX3, polyanions perovskites.
A more recent study investigated the optical properties of CH3NH3PbI(3-x)(BF4)x39, where BF4
- was
used in order to take advantage of the electronic properties of F- and avoid the problem of the different
size of iodide and fluoride. In order to confirm the presence of BF4- in the structure, they carried out
ATR-FTIR measurements. The bandgaps were measured from diffused reflectance spectroscopy
followed by Tauc plots and they appear to be almost the same as the bandgap of pure CH3NH3PbI3.
This could be due to the almost same ionic radius of I- and BF4-. In this case, the role of BF4
- can be
compared to that of boron in silicon solar cells.
Another mixed form with a different polyanion, namely SCN-, was studied in order to investigate its
influence on the stability of MAPbI340. In this case, the perovskite under study was MAPbSCN2I, and
the bandgap was calculated from reflection spectra and Kubelka-Munk function. The bandgap of
iodide perovskite was measured to be 1.504 eV while that of the mixed form 1.532 eV. The slightly
higher bandgap of the mixed form could be due to the larger ionic radius of the thiocyanate ion
2.15/2.20 Ȧ41 vs 19.8 Ȧ of the iodide and to its slightly bigger electronegativity42.
FAPbX3, formamidinium halide perovskites.
As for the methylammonium perovskites, also for the formamidinium ones a study about the mixed
halide forms was carried out43. The bandgaps of FAPbIxBr3-x were extracted from Tauc Plots using
data taken from absorption spectra and confirmed by photoluminescence measurements in order to
discard the possibility that the absorption onsets were due to trap or sub-band states. The bandgap
was tuned from 1.48 eV to 2.23 eV going from x = 3 to x = 0.
Discussion.
The experimental results discussed above matched the computational studies from which it was
possible to extract the correlations between the bandgap change and the electronegativity and size of
the X component. Indeed, by replacing the iodide with a more electronegative halide, it was shown
that the bandgap broadens and this trend is evident also in mixed halide perovskites. However, some
discrepancies between different studies should be discussed more in detail in order to understand
where these differences come from. For instance, in one study32 the bandgap of MAPbI2.1Cl0.9 was
measured, even though other studies34,35,37 demonstrated that it is not possible to synthesise mixed
iodide/chloride perovskites with such a high chloride ratio. However, in the same study32, they also
carried out XPS measurements to determine the real I:Cl ratio in the products and they found out that
when the stoichiometric ratio of I:Cl was 2:1, the real ratio was 1:0. Therefore, they referred to the
stoichiometric ratio rather than the real I:Cl ratio. The value of the bandgap for this perovskite is still
much higher than that of the pure iodide one (2.60 eV vs 1.52 eV) and this result is in disagreement
with other observations37 (1.58 eV vs 1.53 eV). What distinguishes these two studies, in addition to
the different synthetic routes used to prepare the samples, is the way in which they extracted the
bandgap. Indeed, they both used Tauc plots but the first study32 considered that the absorption
coefficient is proportional to the square of the energy while the second study37 considered that it is
proportional to the square root of the energy. This difference arises from considering the bandgap of
the perovskite indirect, in the first case, and direct in the second case. Most of the studies consider it

16
to be direct and use the second correlation to draw Tauc plots. However, the nature of the perovskite’s
bandgap is still under debate44.
With regard to the MAPb(I1-xBrx)3 study33, in which they shown a linear correlation between the
bandgap and the bromide content, they incorrectly extracted the bandgap values directly from the
absorption spectra instead of using Tauc plots.

17
Chapter 3. The inorganic cation
The B cation strongly contributes to both the valance and the conduction band, so that the VBM and
CBM can be said to have an intra-atomic B character. This is the reason why, even when replacing
the iodide with other more electronegative halide, the difference in the bandgap is not as large as
expected. Moreover, it might be also the reason why these direct-bandgap semiconductors show very
strong absorption and photoluminescence intensities30.
The most studied divalent B cation is Pb2+ and it has been also the one with which the highest
efficiencies of perovskite solar cells have been reached so far17. However, it is a toxic element, which
is a factor that could hamper the commercialization of perovskite cells because of concerns due to its
possible bioaccumulation in ecosystems and risk for human health. For this reason, some attempts to
replace lead with another divalent metal have been made over the last years.
The closest element to Pb in the periodic table that could replace it in the perovskite structure is Sn.
However, Sn perovskites are not stable in air45 and for this reason mixed Pb-Sn perovskites have been
the subject of considerable research45,46,47,48. Experimentally, the bandgap of MAPbI3 has been
measured from optical spectroscopy to be 1.54 eV, while that of MASnI3 1.20/1.28 eV, depending
on the synthetic procedure45. In order to explain these values and how the valance and the conduction
band energies change when Pb2+ is replaced by Sn2+, simulations were carried out49. It was found that
the spin-orbit-coupling-GW (SOC-GW) method was the one leading to the results closest to the ones
experimentally measured. MAPbI3 and MASnI3 have both a tetragonal crystal structure at room
temperature47 but since Sn is smaller than Pb, the B-X distance in the first case is shorter than in the
latter. Therefore, the difference in bandgap can be attributed to two different factors, namely the
structural and the electronic factor. The first one was determined by doing the calculations for the
two perovskites considering the same lattice parameters. There was still a difference in the bandgap
but lower than the real one, and this reduction was thus due just to structural differences. The
electronic factor is mostly due to the difference in energy between the Sn 5s and the Pb 6s orbital.
Indeed, the latter has a lower energy than the former because of relativistic effect. Its lower energy
makes its interaction with the p orbitals of the iodide weaker so that the antibonding orbital generated
from this interaction and that forms the VBM is less destabilized, namely at lower energy. The CBM,
which is mostly formed by B p orbitals, has also a lower energy when B = Pb, but to a lesser extent
than the VBM, so that the overall effect of shifting from Pb to Sn is a reduction of the bandgap.
In the other chapters it was possible to observe logical correlations between the bandgap and the
components ‘properties, such as the size or the electronegativity. In the case of the metal cation, the
problem is more complicated so that simplified correlations cannot be given. Indeed, the cations that
were investigated do not belong either to the same group of the periodic table46,50 and possess different
properties that can be originated by more complex factors due to their heavy metal nature, such as
spin-orbit coupling.
Current state of the art.
One B component perovskites.
The optical bandgap of FASnI3 was calculated from the onset of the absorbance spectrum and is 1.41
eV, slightly smaller than that of FAPbI3 (1.48 eV)45. As previously touched upon, MASnI3 shows a
different bandgap depending on the synthetic approach employed while MAPbI3 did not present this
behaviour. A big difference between these two perovskites is that the latter is more stable in air than
the other one. Therefore, one possible explanation to this change in bandgap with different conditions

18
is that depending on the environment in which the perovskite is synthesised and stored, it can be more
easily oxidized, so that the final product is not pure MASnI3 but a compound in which some Sn2+ was
oxidized to Sn4+. The oxidized compound has, of course, a different bandgap than MASnI3.
Mixed Sn/Pb perovskites.
Mixed Sn/Pb methylammonium iodide perovskites have been synthesised and characterized by
different research groups, but curiously they all obtained different values of the bandgap46,47,48.
Indeed, one group47 carried out research about solar cells made with perovskites deposited on
mesoporous TiO2 with formula CH3NH3SnxPb1-xI3, and they found that by increasing the amount of
tin the bandgap drops. Figure 9 shows the absorbance spectra of the samples and the table below the
extracted bandgaps from the absorption spectrum edges and the XPS verified formula. The reason
why the iodide ratio is lower than expected for the more tin-enriched alloys is probably that these
perovskites are more easily oxidized during the measurement.
Figure 9: Electronic absorption spectra of CH3NH3SnxPb(1−x)I3 perovskite coated on porous TiO247.
Stoichiometric
formula
XPS verified formula Eg (eV)
CH3NH3PbI3 CH3NH3PbI3.07 1.51
CH3NH3Sn0.3Pb0.7I3 CH3NH3Sn0.37Pb0.63I2.95 1.31
CH3NH3Sn0.5Pb0.5I3 CH3NH3Sn0.56Pb0.44I2.77 1.28
CH3NH3Sn0.7Pb0.3I3 CH3NH3Sn0.74Pb0.26I2.47 1.23
CH3NH3SnI3 CH3NH3SnI1.96 1.10 Table 2: Bandgaps of MAPbxSn1-xI. The second column shows the real Pb:Sn ratio measured from XPS analysis.
Another work48, published also in 2014 as the previous one, found out that the bandgap of the mixed
compounds deposited as thin films do not follow this linear trend but are narrower than the bandgaps
of both the pure compounds. The values were extracted from the absorption spectrum edges
determined from the conversion of diffuse reflectance measurements of the pure and mixed
compounds and their values are listed in the table below. Also in this case, XPS analysis confirmed
that the stoichiometric ratio was maintained. Moreover, they verified that Sn and Pb were
homogenously distributed throughout the film via SEM energy-dispersive X-ray spectroscopy (EDS).
In 2016, a similar trend was observed for mixed perovskite composed by FA0.75Cs0.25Sn0.5Pb0.5I351.
19
Stoichiometric
formula
Eg (eV)
CH3NH3PbI3 1.55
CH3NH3Sn0.25Pb0.75I3 1.24
CH3NH3Sn0.5Pb0.5I3 1.17
CH3NH3Sn0.75Pb0.25I3 1.17
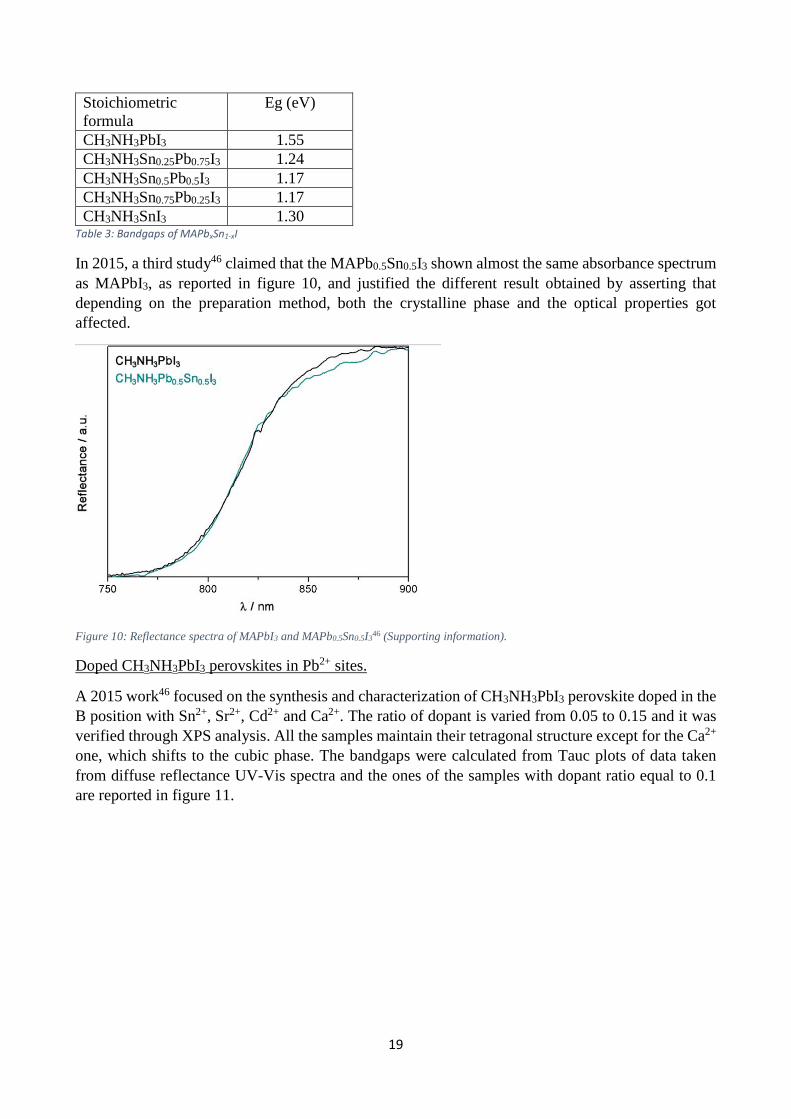
CH3NH3SnI3 1.30 Table 3: Bandgaps of MAPbxSn1-xI
In 2015, a third study46 claimed that the MAPb0.5Sn0.5I3 shown almost the same absorbance spectrum
as MAPbI3, as reported in figure 10, and justified the different result obtained by asserting that
depending on the preparation method, both the crystalline phase and the optical properties got
affected.
Figure 10: Reflectance spectra of MAPbI3 and MAPb0.5Sn0.5I346 (Supporting information).
Doped CH3NH3PbI3 perovskites in Pb2+ sites.
A 2015 work46 focused on the synthesis and characterization of CH3NH3PbI3 perovskite doped in the
B position with Sn2+, Sr2+, Cd2+ and Ca2+. The ratio of dopant is varied from 0.05 to 0.15 and it was
verified through XPS analysis. All the samples maintain their tetragonal structure except for the Ca2+
one, which shifts to the cubic phase. The bandgaps were calculated from Tauc plots of data taken
from diffuse reflectance UV-Vis spectra and the ones of the samples with dopant ratio equal to 0.1
are reported in figure 11.

20
Figure 11: Diffuse reflectance UV-Vis spectra for the MAPbI3 sample, and MAPb1−xBxI3, with B = Sn2+, Sr2+, Cd2+, Ca2+, and x
= 0.10. In the inset, the plot of the optical bandgap values for each sample46.
As shown in the inset of the figure, the only doped perovskite showing a higher bandgap than the
pure form is the Sn one. However, the table below shows the optical bandgap values that were
extracted from the reflectance spectra of all the samples and it seems that this increase occurs only at
this precise concentration.
Table 4: Bandgaps of MAPb1-xBxI3
Lead- Free perovskites
Recently, a completely lead-free perovskite solar cell has been engineered. The lead-free perovskite
has formula MA2CuClxBr4-x and has a 2D structure because of the relatively small ionic radius of
Cu2+ (73 pm) and it is also stable in air thanks to the high stability of Cu2+ in this oxidation state and

21
to the presence of chloride. From absorption spectra and the corresponding Tauc plots, the estimated
bandgaps were 2.48 eV for MA2CuCl4, 2.12 eV for MA2CuCl2Br2, 1.90 eV for MA2CuClBr3 and
1.80 eV for MA2CuCl0.5Br3.5. As predictable, when the ratio of bromide increases the bandgap drops.
Discussion.
The contradictions shown by the different studies on mixed Sn/Pb perovskites highlight many
interesting points of discussion about the bandgap determination. The first two studies47,48 did not use
the Tauc plots to extrapolate the bandgap from the optical experiments but looked directly at the
absoption edge. In this way, they did not take into account that for direct bandgap semiconductor the
correlation between the absorption coefficient and the energy is not linear but quadratic. The third
study46 extrapolated the bandgap value properly from Tauc plots and data taken from diffuse
reflectance spectroscopy, but did not verify whether the ratio of Pb/Sn in the product corresponded
with the stoichiometric one. Lack of inclusion of Sn in the final product would explain why it was
found that MAPb0.5Sn0.5I3 has the same optical properties as MAPbI3.
In general, it might be argued that when the bandgap changes depending on the method used to
prepare the perovskite film, the difference in bandgap has to be correlated not only to a difference in
the preparation method but mainly to a difference in the composition of the final product, difference
that can be ascribed to a different synthetic route. For instance, the degree of oxidation of Sn2+ in Sn4+
in the final product must depend on the synthesis and on the environment in which it was carried out
and in which the perovskite was handled afterwards.
Moreover, it has been argued52,53 that the bandgap of perovskites depends also on the size of the
crystallites, which changes when the perovskite is deposited on mesoporous scaffolds, such as in the
first study47, and when it is prepared as thin film, as in the second study48.

22
Chapter 4. The organic cation
This chapter deals with the interactions between the organic cation and the inorganic framework.
These interplays influence the overall structure of the crystal and the physical and chemical
properties of the perovskite. An overview of the results obtained through simulations and
experimental work over the last few years is presented in order to determine general features that
characterize the dependence of the perovskite’s bandgap on the nature of the organic cation. The
second part of the chapter focuses on state-of-the-art experimental findings that have not yet been
rationalized but contribute to enhancing the stability or the efficiency of perovskite-based solar
cells.
Influence on X-B-X angles.
It has been demonstrated through simulations54,55, in addition to experimental evidence45,43, that
the value of the metal-halide-metal bond angles and the metal-halide bond length influence the
electronic and optical properties of the perovskite, the bond angles more so than the bond length55.
These values are strongly affected by the size and the nature of the organic cation, so that, the
choice of the latter can be used to modulate the bandgap. This is very interesting since the lowest
bandgap reachable by replacing the X component in MAPbX3 perovskites is about 1.6 eV when
using the iodide ion56, still far from the optimal bandgap for reaching the Shockley-Queisser
limit23, around 0.2 eV lower.
Figure 12 depicts how the two metal-halide-metal angles decrease when the archetypical cubic
structure distorts. When the organic cation is sufficiently large to fill the cubooctahedral cage
between the 12 nearest X atoms, these distortions are hindered, so that the angles tilt to a lesser
extent.
Figure 12: Comparison between an untilted cubic configuration and the tilted orthorhombic one in the ab plane (a) and along the c
axis (b)54.
In a 2014 study on steric engineering of metal-halide perovskites55, starting from the observation
that the organic cation does not strongly influence the energy of the frontier orbitals, they
calculated the bandgap of a “Platonic” metal-halide structure, consisting in a regular polyhedron,

23
that does not contain organic cations but just PbI6 octahedra that share the corners regularly. They
used DFT (density functional theory) and calculated how the bandgap changes as a function of
the two halide-lead-halide angles, namely the one along the apical direction and the one along the
equatorial direction. In their calculations the Pb-I length value was kept constant (3.18Å), while
the angles were shifted from 120° to 180°. The results, shown in figure 13, clearly demonstrate
that the angles distortions can be used to modulate the bandgap of the perovskite.
Figure 13: Representation of the change in DFT bandgap depending on the value of the apical and equatorial metal-halide-metal bond
angles. The plot shows also which A cation would generate those specific B-X-B angles and the white discs indicate the cations that
have already been used experimentally. The dashed line is just a guide to the eye to highlight that the plot is almost symmetric55.
Figure 13 indicates also which organic or inorganic cations would give rise to those angular
distortions and differentiates the perovskites that have already been synthesised from those that
have not. The main feature is that the bandgap increases as the angles tilt. The reason for this
trend can be derived from looking at the conduction band formation from the atomic orbitals.
Indeed, when considering the most symmetric structure, the one corresponding to the situation
depicted in the bottom left in figure 13, the conduction band results from the overlap of collinear
orbitals, while by shifting towards lower angles this overlap occurs more and more as a pi (π)
interaction and the energy of the level increases, because of this decreased overlap. The overall
result is an increase in the bandgap. The main conclusion of this study is that the tilt of the optimal
angles influences the bandgap and the size of the organic cation can be used to control this tilting.
The next step to engineering new perovskites with optimal bandgap is to consider many
compounds, which have something in common with the most used ones, and calculate the
bandgap of the correspondent perovskite. Figure 14 shows the cations that have been investigated
together with the resulted perovskite bandgap. As predicted, the latter decreases by increasing the
cation size.

24
Figure 14: Calculated bandgaps of PbI3-based perovskites55.
In general, the size of the organic cation influences also the B-X bond length and it was
demonstrated through simulations that larger cations deliver smaller band-gaps54; however, this
has been considered a second-order effect55 compared with that of the tilted angles deviations.
Influence through H bondings.
The theoretical correlation between the perovskite bandgap and the cation size has been widely
confirmed by experimental data. Indeed, when in the perovskite CH3NH3PbI3, the
methylammonium (MA), which has an effective radius of 217 pm27, is replaced by the slightly
bigger cation CH(NH2)2+ (FA), the formamidinium ion, whose radius measures 253 pm27, the
bandgap decreases from around 1.6 eV to around 1.5 eV. Besides, similar results have been found
by substituting MA with Cs+, which has a smaller radius, namely 188 pm15, the resulting bandgap
being higher, namely 1.73 eV57.
Even though these results seemed to confirm the correlation between the cation size and the
bandgap, some differences appeared too significant to be due to only the small difference in size.
In fact, the difference in size between MA and FA is not that large to justify the different geometry
of crystallization, tetragonal for MAPbI3 and trigonal for FAPbI3. This difference suggested that
probably, together with the size, something else occurs when changing the organic cation.
Effectively, the interaction between the organic cation and the inorganic counterpart changes as
A is replaced, because new H bonds are involved. While in MA there are only three acidic
hydrogen atoms that can interact with the halide, FA contains four hydrogens (figure 15).

25
Figure 15: Lewis structures of methylammonium (a) and formamidinium (b).
As the number of hydrogen bonds with the halide increases, the nature of the Pb-I bond gets more
and more ionic, with a greater negative charge on the halide and a more positive one on the lead
cation. The contribution of lead in the valance and conduction bands increases as the bond
becomes more ionic. This behaviour has been correlated with an increase in spin-orbit coupling,
which indeed plays a bigger role when heavier elements are involved. In absence of spin-orbit
coupling (SOC), the bandgap of MAPbI3 and FAPbI3 would be very similar, even though they
assume different crystal structures. However, when taking into account the SOC, bandgaps very
close to the experimental ones have been calculated. This demonstrates that the decrease in the
bandgap is not due just to the size difference between MA and FA28.
Computational work based on this theoretical explanation matched experimental results28.
Current state of the art.
Perovskites with one A component.
Since halide perovskites started to be a hot research topic, many combinations of materials have
been tested in order to enhance the overall efficiency of perovskite-based solar cells by increasing
the light harvesting and the conductivity of the material. Not only perovskites with organic cations
other than methylammonium were synthesised, but also mixed forms of organic cations and
combinations of organic and inorganic cations.
Despite the high efficiencies that have been reached with MAPbI3 in solar cells, some challenges
have been reported, namely:
- MAPbI3 bandgap is higher than the optimal bandgap to reach the Shockley-Queisser limit of
about 0.2 eV56.
- It is sensitive to moisture, therefore unstable in air17,
- It undergoes a reversible phase transition from cubic to tetragonal phase at 57°C31, that falls
within the device operating temperatures. This change affects the bandgap and the stability of
the material.
Starting from the structural consideration done above, namely bearing in mind the correlation
between cation size and bandgap, Nam-Gyu Park et al.9 reported the synthesis of a lead iodide
perovskite where the methylammonium was replaced by the bigger ethylammonium. In this case,
instead of obtaining a lower bandgap perovskite as expected, since the organic cation was too
large to maintain a 3D lattice structure, the structure shifted to a 2D structure. The optical bandgap
that resulted was 2.2 eV, much higher than that of the methylammonium iodide perovskite.
The formamidinium ion, on the contrary, being slightly bigger than methylammonium, fits well
in the 3D structure so that, as predicted from the previous analysis, FAPbI3 has a lower bandgap

26
than MAPbI3, namely 1.47 eV. This bandgap was calculated from the Tauc Plot of the perovskite
deposited on quartz substrate58. Many synthetic routes have been reported for this
perovskite58,59,60,61 and depending on how it was prepared and of course on the structure of the
engineered device, efficiencies up to 20% were reached61. An illusory advantage of
formamidinium to the methylammonium ion is that the first exhibits thermal stability because the
thermal transition does not occur at device operation temperatures60. However, the black low
bandgap FAPbI3 perovskite shows a yellow polymorph with a larger bandgap at temperatures
lower than 60 °C. This polymorph reduces the photovoltaic performances not only because of its
lower light harvesting because of the bigger bandgap but also because it probably hinders electron
transport58. Figure 16 depicts both the back and the yellow FAPbI3 polymorphs.
Figure 16: Representation of the two FAPbI3 polymorphs along the crystallographic c (left) and a (right) axes. The blue areas
represent the inorganic octahedral PbI6, while the organic cation is represented by the smaller blue and green dots58.
The presence of these two forms, one of which does not show suitable optical properties for
photovoltaic applications, pushed the scientific community to look for mixed organic cation forms
that might combine the good carrier mobility of MAPbI3 and the optimal bandgap of FAPbI3.
Later on, these attempts are described. To conclude the discussion about the FA cation, it has a
lower dipole moment than MA28, factor that could be important in contributing to hysteresis if
assumed that the latter depends on the dipole moment of the A cation.
Regarding this last observation, the guanidinium (GA) ion, depicted in figure 17, drew great
interest because of its symmetry, which theoretically determines a zero dipole moment, so that
the hysteresis might be reduced62. However, it is too large (278 pm63) to fit in the cavity between
the octahedra. An experimental study63 shown that the bandgap of mixed MA/GAPbI3,

27
extrapolated from Tauc plots, changes with the GA/MA ratio just slightly, namely between 1.53
and 1.55 eV and that GA does not directly replace MA in the crystal structure.
Figure 17: Lewis structure of guanidinium ion.
Mixed organic perovskites.
As suggested previously, the perovskites made from single organic cations suitable for photovoltaic
applications show drawbacks that have not been overcome after few but intense years of research.
First of all MAPbI3 undergoes a phase transition within the temperature range of device operation.
Secondly FAPbI3 shows two polymorphs below 60 °C. Thirdly, CsPbI3 is more stable than the organic
alternatives but has a too high bandgap for being a satisfying alternative to the hybrid forms. For this
reason, over the last three years, mixed cation perovskites have been investigated. They have
impressively shown higher performance than the pure forms. Indeed, particular combinations of the
most common cations allow the drawbacks of instability or high bandgap to be avoided.
The first study on the optical and photovoltaic properties of mixed MAxFA1-xPbI3 perovskites as light-
harvesting pigments in mesoscopic solar devices was carried out in 2014 and shown noteworthy
results64. Indeed, the overall efficiency of the cell was higher than both the pure MA and FA cells.
What is remarkable about this study is that the bandgap of the mixed form with MA:FA = 3:2 was
measured to be equal to the bandgap of the pure formamidinium iodoplumbate, namely 1.530 eV,
slightly lower than that of the MA equivalent, namely 1.575 eV. The bandgaps were calculated from
the onset of the absorption spectra measured with an integrating sphere and they are rather different
from those calculated or measured with different techniques.
Other mixed organic forms have been tested for a different purpose, namely in order to modify the
crystal arrangement of the perovskite film on mesoporous materials. Indeed, as for the
ethylammonium case, when MA is partially replaced by 5-aminovaleric acid cations (5-AVA) in
APbI3, these bigger cations do not fit in the cubooctahedral cage and thus, produce a layered structure
composed by alternated inorganic PbI6 octahedra and organic layers65. The latter are probably formed
by 5-AVA cations that bind to each other through hydrogen bonds as it was reported for the case of
4-ammonium-butyric acid (4-ABA) in mixed cation (4-ABA)2MAPb2I7 perovskite66. Figure 18
depicts the layered structure for the case of 4-ABA.

28
Figure 18: Layered crystal structure of (HO2C(CH2)3NH3)2(CH3NH3)Pb2I7
Mixed organic-inorganic perovskites
The combination of organic and inorganic cations has also been the subject of some studies, for
instance, the doping of MAPbI3 with Cs2+ 67. It was demonstrated that, with a 10% Cs2+ doping of
MAPbI3, even though the bandgap was higher than the pure MA perovskite, light absorption was
increased over the whole solar spectrum. Indeed, as shown in figure 19, as the fraction of caesium
increases, the bandgap broadens but at the same time the shape of the absorption spectrum changes.
The presence of Caesium increases the amount absorption in the range of 300-400 nm while reduces
the absorption between 450 and 800 nm. The highest light absorption is achieved via 10% Cs doping
in the MAPbI3 perovskite structure. To confirm that the Cs was homogeneously distributed on the
film, they carried out elemental mapping using energy dispersive spectroscopy (EDS). Moreover,
they checked the morphologies of the films through scanning electron microscopy and atomic force
microscopy images and found out that they were smooth and they completely covered the substrate.

29
Figure 19: (a) UV–vis absorption and (b) transformed Kubelka–Munk spectra of CsxMA1-xPbI3 perovskite films with different Cs ratio67.
One study68 on triple cation perovskites was carried out with the purpose of enhancing the stability
of the black polymorph FAPbI3 in order to maintain the low bandgap and avoiding the instability.
Even though the Cs doping decreases the light harvesting, as shown in figure 20, where the ratio

30
MA:FA is constant, the stability of the perovskite is increased. This was demonstrated by measuring
the change in the device efficiency under operational conditions over time.
Figure 20: The absorbance (dashed lines) and photoluminescence (PL) spectra (solid lines) of CsxM perovskites, where M =
(MA0.17FA0.83)(1-x)Pb(I0.83Br0.17)3 68 .
A study on CsPbI3.
After the success of hybrid organic-inorganic perovskites, some authors69 wondered about the need
for the big cation to be organic rather than inorganic. In order to compare the two materials, they used
Cs+ in place of MA in APbBr3 perovskites. The iodide perovskite was not used because the caesium
lead iodide was found not to have a perovskite structure at standard temperature and pressure. This is
in and of itself a limit, since the perovskite with iodide instead of bromide have a lower bandgap,
closer to the optimal one. However, the caesium perovskite showed more stability at the rise in
temperature than the organic equivalent and also the devices prepared with this inorganic cation gave
good efficiencies, showing that this inorganic perovskite could in principle play the role that is given
to the hybrid ones.
Discussion.
The results obtained from simulations55 give useful information and suggest directions for future
research but they show also some differences with the experimental results. For instance, the
ethylammonium lead iodide was expected to have a bandgap of 1.48 eV55, slightly lower than that
of MAPbI3 because of its bigger radius. Experimentally, a bandgap of 2.2 eV was observed
because it shows a 2D structure instead of 3D one.
Another aspect that would have been difficult to determine from simulations is the polymorphism
of FA at high temperature. Moreover, it is clear that many other factors have to be considered in
addition to the change in bandgap when preparing new perovskites, for instance the stability of
the perovskite and the synthetic route to prepare it.

31
Conclusions
In this work, the influence of the perovskite components on the optical bandgap of this impressive
material was analysed through a review of the most relevant computational and experimental studies
done so far. The aim was to find correlations between the properties of the components and the way
they affect the value of the bandgap.
The analysis of the electronic structure of the inorganic CsSnX3 perovskite30, where X is a halide,
shows that the valance band maximum and the conduction band minimum have both B and X
character. This means that the value of the bandgap is directly affected by a change in B or X. On the
contrary, the A cation does not play a direct role in the formation of these two electronic bands but
still influences the value of the bandgap by affecting the B-X interactions through its size and its
interactions with the inorganic framework. In this way, the bandgap of APbI3 can be theoretically
tuned from 0.99 to 1.79 eV55 by replacing A with cations of different sizes.
Experimental studies proved the correctness of the simulations and sometimes highlighted their
limits. Moreover, some discrepancies between experimental studies were discussed and some
comments about their possible origin were given at the end of each chapter and in the Appendix.
However, since some fundamental properties of perovskites are still under debate, for instance
whether or not it is a direct bandgap semiconductor, it is not possible to argue which of the methods
used to determine the bandgap is the most correct one.

32
References
1. Snaith, H. J. Perovskites : The Emergence of a New Era for Low-Cost , High-. J. Phys.
Chem. Lett. 4, 3623−3630 (2013).
2. Weber, D. CH 3 NH 3 PbX 3 , ein Pb(II)-System mit kubischer Perowskitstruktur. Z.
Naturforsch 1445, 1443–1445 (1978).
3. Weber, D. & Perovskite, C. ( x = 0-3 ), ein Sn ( II ) -System mit kubischer Perowskitstruktur.
Z. Naturforsch 0–3 (1978).
4. Mitzi, D.B., Felid, C. A., Harrison, W.T.A., Guloy, A. M. © 19 9 4 Nature Publishing Group.
Nature 369, 467–469 (1994).
5. D . B . Mitzi , S . Wang , C . A . Feild, C. . A. . C. and A. . M. . G. Conducting Layered
Organic-Inorganic Halides Containing -Oriented Perovskite Sheets. Am. Assoc. Adv. Sci. 267,
1473–1476 (1995).
6. Kojima, A., Teshima, K., Shirai, Y. & Miyasaka, T. Organometal Halide Perovskites as
Visible-Light Sensitizers for Photovoltaic. J. AM. CHEM. SOC. 311, 6050–6051 (2009).
7. Kim, H. et al. All-Solid-State Submicron Thin Film. Sci. Rep. 1–7 (2012).
doi:10.1038/srep00591
8. Etgar, L. et al. High Effi ciency Quantum Dot Heterojunction Solar Cell Using Anatase ( 001
) TiO 2 Nanosheets. Adv. Mater. 2012 24, 2202–2206 (2012).
9. Nh, C. H., Im, J., Chung, J., Kim, S. & Park, N. Synthesis , structure , and photovoltaic
property of a nanocrystalline 2H perovskite-type novel. Nanoscale Res. Lett. 7, 1–7 (2012).
10. Michael M. Lee, Joël Teuscher, Tsutomu Miyasaka, Takurou N. Murakami, H. J. S. Efficient
Hybrid Solar Cells Based on Meso-Superstructured Organometal Halide Perovskites. Science
(80-. ). 338, 643–648 (2012).
11. Etgar, L. et al. Mesoscopic CH 3 NH 3 PbI 3 /TiO 2 Heterojunction Solar Cells. J. Am.
Chem. Soc. 134, 17396−17399 (2012).
12. Bi, Y. et al. Charge Carrier Lifetimes Exceeding 15 μ s in Methylammonium Lead Iodide
Single Crystals. J. Phys. Chem. Lett. 7, 923−928 (2016).
13. Dong, Q. et al. Electron-hole diffusion lengths > 175 m m in solution-grown CH 3 NH 3 PbI
3 single crystals. Science (80-. ). 347, 967–969 (2015).
14. Green, M. & Ho-baillie, A. The emergence of perovskite solar cells. Nat. Photonics 506–514
(2014). doi:10.1038/nphoton.2014.134
15. Chonghea Li, Xionggang Lu, Weizhong Ding, Liming Feng, Y. G. and Z. G. Formability of
ABX ( 3 ) ( X = F , Cl , Br , I ) halide perovskites. Acta Cryst. B64, 702–707 (2008).
16. Walsh, A. Principles of Chemical Bonding and Bandgap Engineering in Hybrid Organic −
Inorganic Halide Perovskites. J. Phys. Chem. C 119, 5755−5760 (2015).
17. Albero, J., Malik, A. R. & Garcia, H. Influence of the Composition of Hybrid Perovskites on
their Performance in Solar Cells. J. Mater. Chem. A 4353–4364 (2016).
doi:10.1039/C6TA00334F
18. Brittman, S., Adhyaksa, G. W. P. & Garnett, E. C. The expanding world of hybrid
perovskites: materials properties and emerging applications. MRS Commun. 5, 7–26 (2015).

33
19. Ong, K. P., Goh, T. W., Xu, Q. & Huan, A. Structural Evolution in Methylammonium Lead
Iodide CH 3 NH 3 PbI 3. J. Phys. Chem. A 119, 11033−11038 (2015).
20. Oku, T. Crystal Structures and Related Perovskite Compounds Used for Solar Cells. Sol.
Cells - New Approaches Rev.
21. Li, W. et al. Mechanical Tunability via Hydrogen Bonding in Metal − Organic Frameworks
with the Perovskite Architecture. J. Am. Chem. Soc. 136, 7801−7804 (2014).
22. Glaser, T. et al. Infrared Spectroscopic Study of Vibrational Modes in Methylammonium
Lead Halide Perovskites. J. Phys. Chem. Lett. 6, 2913−2918 (2015).
23. Shockley, W. & Queisser, H. J. Detailed Balance Limit of Efficiency of pn Junction Solar
Cells. J. Appl. Phys. 32, (1961).
24. Li, C., Chi, K., Soh, K. & Wu, P. Formability of ABO 3 perovskites. J. Alloys Compd. 372,
40–48 (2004).
25. Giaquinta, D. M. Structural Predictions in the AB03 Phase Diagram. Chem. Mater. 6, 365–
372 (1994).
26. W. Travis, E. N. K. Glover, H. Bronstein, D. O. S. and R. G. P. Chemical Science On the
application of the tolerance factor to inorganic and hybrid halide perovskites : a revised.
Chem. Sci. 7, 4548–4556 (2016).
27. Article, E., Kieslich, G., Sun, S. & Cheetham, A. K. Chemical Science Solid-state principles
applied to organic – inorganic perovskites : new tricks for an old dog †. Chem. Sci. 5, 4712–
4715 (2014).
28. Amat, A.; Mosconi, E.; Ronca, E.; Quarti, C.; Umari, P.; Nazeeruddin, Md. K.; Gratzel, M.;
De Angelis, F. Cation-Induced Band-Gap Tuning in Organohalide Perovskites: Interplay of
Spin-Orbit Coupling and Octahedra Tilting. Nano Lett. 14, 3608 (2014).
29. Brivio, F., Walker, A. B. & Walsh, A. Structural and electronic properties of hybrid
perovskites for high-efficiency thin-film photovoltaics from first-principles Structural and
electronic properties of hybrid perovskites for high-efficiency thin-film photovoltaics from.
APL Mater. 042111, (2016).
30. Huang, L. & Lambrecht, W. R. L. Electronic band structure , phonons , and exciton binding
energies of halide perovskites. Phys. Rev. B 165203, 1–12 (2013).
31. Baikie, T. et al. Synthesis and crystal chemistry of the hybrid perovskite (CH3NH3)PbI3 for
solid-state sensitised solar cell applications. J. Mater. Chem. A 1, 5628 (2013).
32. Li, C. et al. Halide-Substituted Electronic Properties of Organometal Halide Perovskite
Films : Direct and Inverse Photoemission Studies. ACS Appl. Mater. Interfaces 8,
11526−11531 (2016).
33. Noh, J. H., Im, S. H., Heo, J. H., Mandal, T. N. & Seok, S. Il. Chemical Management for
Colorful, E ffi cient, and Stable Inorganic − Organic Hybrid Nanostructured Solar Cells.
Nano Lett. 13, 1764−1769 (2013).
34. Kim, T. G., Seo, W., Kwon, H. & Won, J. Influence of halide precursor type and its
composition on the electronic properties of vacuum deposited perovskite films †. Phys.
Chem. Chem. Phys. 17, 24342–24348 (2015).
35. Colella, S. et al. MAPbI 3 ‑ x Cl x Mixed Halide Perovskite for Hybrid Solar Cells : The
Role of Chloride as Dopant on the Transport and Structural Properties. Chem. Mater. 25,
34
4613−4618 (2013).
36. Slotcavage, D. J., Karunadasa, H. I. & Mcgehee, M. D. Light-Induced Phase Segregation in
Halide- Perovskite Absorbers. ACS Energy Lett. 1, 1199−1205 (2016).
37. Sedighi, R., Tajabadi, F., Shahbazi, S. & Gholipour, S. Mixed-Halide CH3NH3PbI3¢xXx
(X=Cl, Br,I)Perovskites: Vapor-Assisted Solution Deposition and Application as Solar Cell
Absorbers. ChemPhysChem 14588, 2382–2388 (2016).
38. Kitazawa, N., Watanabe, Y. & Nakamura, Y. Optical properties of CH 3 NH 3 PbX 3 ( X =
halogen ) and their mixed-halide crystals. J. Mater. Sci. 7, 3585–3587 (2002).
39. Nagane, S., Bansode, U., Game, O. & Ogale, S. CH3NH3PbI(3-x)(BF4)x: molecular ion
substituted hybrid perovskite †. Chem. Commun. 50, 9741–9744 (2014).
40. Jiang, Q. et al. Pseudohalide-Induced Moisture Tolerance in Perovskite. Angew.Chem.
Int.Ed. 54, 7617–7620 (2015).
41. Kawamura, K. et al. Effective Ionic Radii of NO2- and SCN- Estimated In Terms of the
Bottcher Equation and the Lorentz-Lorenz Equation. J. Phys. Chem. 2321, 5205–5208
(1982).
42. Neale, L. G., Neale, L. D. G. & Bonamy, A. F. Calculating group electronegativities using
the Lewis-Langmuir equation Calculating group electronegativities using the revised Lewis –
Langmuir equation. J. Mol. Struct. 639, 151–156 (2003).
43. Eperon, G., Herz, L. M., Herz, L. M. & Snaith, H. J. Formamidinium lead trihalide : A
broadly tunable perovskite for efficient planar heterojunction solar cells Energy &
Environmental Science Formamidinium lead trihalide : a broadly tunable perovskite for e ffi
cient planar heterojunction solar. Energy Environ. Sci. 7, 982 –988 (2014).
44. Hutter, E. M. et al. Direct–indirect character of the bandgap in methylammonium lead iodide
perovskite. Nat. Mater. 1, (2016).
45. Stoumpos, C. C., Malliakas, C. D. & Kanatzidis, M. G. Semiconducting Tin and Lead Iodide
Perovskites with Organic Cations: Phase Transitions, High Mobilities, and Near-Infrared
Photoluminescent Properties. Inorg. Chem. 9019−9038 (2013).
46. Navas, J. et al. New insights into organic – inorganic hybrid. Nanoscale 7, 6216–6229
(2015).
47. Ogomi, Y. et al. CH3NH3SnxPb(1−x)I3 Perovskite Solar Cells Covering up to 1060 nm. J.
Phys. Chem. Lett. 5, 1004–1011 (2014).
48. Hao, F., Stoumpos, C. C., Chang, R. P. H. & Kanatzidis, M. G. Anomalous Bandgap
Behavior in Mixed Sn and Pb Perovskites Enables Broadening of Absorption Spectrum in
Solar Cells. J. Am. Chem. Soc. 136, 8094−8099 (2014).
49. Umari, P., Mosconi, E. & Angelis, F. De. Relativistic GW calculations on Perovskites for
Solar Cell Applications. Sci. Rep. 9, 1–7 (2014).
50. Bruno, A. & Chen, S. Lead-Free MA2CuClxBr4-x Hybrid Perovskites. Inorg. Chem. (2016).
doi:10.1021/acs.inorgchem.5b01896
51. Giles E. Eperon, Tomas Leijtens, Kevin A. Bush, Rohit Prasanna, Thomas Green, Jacob Tse-
Wei Wang, David P. McMeekin, George Volonakis, Rebecca L. Milot, Richard May, Axel
Palmstrom, Daniel J. Slotcavage, Rebecca A. Belisle, Jay B. Patel, Elizabeth S. Parr, H. J. S.
Perovskite-perovskite tandem photovoltaics with optimized bandgaps. Science (80-. ). 354,

35
861–865 (2016).
52. Innocenzo, V. D. et al. Tuning the Light Emission Properties by Bandgap Engineering in
Hybrid Lead Halide Perovskite. J. Am. Chem. Soc. 136, 17730−17733 (2014).
53. Grancini, G. et al. The Impact of the Crystallization Processes on the Structural and Optical
Properties of Hybrid Perovskite Films for Photovoltaics. J. Phys. Chem. Lett. 5, 3836−3842
(2014).
54. Borriello, I., Cantele, G. & Ninno, D. Ab initio investigation of hybrid organic-inorganic
perovskites based on tin halides. Phys. Rev. B - Condens. Matter Mater. Phys. 77, 1–9
(2008).
55. Filip, M. R., Eperon, G. E., Snaith, H. J. & Giustino, F. Steric engineering of metal-halide
perovskites with tunable optical bandgaps. Nat. Commun. 5, 1–9 (2014).
56. Quarti, C. et al. Environmental Science Structural and optical properties of
methylammonium lead iodide across the tetragonal to cubic phase transition : implications
for perovskite solar cells †. Energy Environ. Sci. 9, 155–163 (2016).
57. Eperon, G. E. et al. Environmental Science Formamidinium lead trihalide : a broadly tunable
perovskite for e ffi cient planar heterojunction solar. Energy Environ. Sci. 7, 982–988 (2014).
58. Koh, T. M. et al. Formamidinium-Containing Metal-Halide: An Alternative Material for
Near-IR Absorption Perovskite Solar Cells. J. Phys. Chem. C 118, 16458−16462 (2014).
59. Pang, S. et al. NH2CH=NH2PbI3: An Alternative Organolead Iodide Perovskite Sensitizer
for Mesoscopic Solar Cells. Chem. Mater. 26, 1485−1491 (2014).
60. Nh, H. C., Lee, J., Seol, D., Cho, A. & Park, N. High-Effi ciency Perovskite Solar Cells
Based on the Black. Adv. Mater. 26, 4991–4998 (2014).
61. Yang, Noh, Jeon, K. High-performance photovoltaic perovskitelayers fabricatedthrough
intramolecular exchange. Science (80-. ). 348, 1234–1237 (2015).
62. Giorgi, G., Fujisawa, J., Segawa, H. & Yamashita, K. Organic − Inorganic Hybrid Lead
Iodide Perovskite Featuring Zero Dipole Moment Guanidinium Cations: A Theoretical
Analysis. J. Phys. Chem. 119, 4694−4701 (2015).
63. Marco, N. De et al. Guanidinium : A Route to Enhanced Carrier Lifetime and Open-Circuit
Voltage in Hybrid Perovskite Solar Cells. Nano Lett. 16, 1009−1016 (2016).
64. Pellet, N. et al. Mixed-Organic-Cation Perovskite Photovoltaics for Enhanced Solar- Light
Harvesting ** Angewandte. Angew. Chem. Int. Ed. 53, 3151–3157 (2014).
65. Mei, A. et al. A hole-conductor – free, fully printable mesoscopic perovskite solar cell with
high stability. Science (80-. ). 345, (2014).
66. Mercier, N. (HO2C(CH2)3NH3)2(CH3NH3)Pb2I7: a predicted noncentrosymmetrical
structure built up from carboxylic acid supramolecular synthons and bilayer perovskite
sheets. CrystEngComm 2, 429–432 (2005).
67. Choi, H. et al. Cesium-doped methylammonium lead iodide perovskite light absorber for
hybrid solar cells. Nano Energy 7, 80–85 (2014).
68. Michael Saliba,‡*ab Taisuke Matsui,‡c Ji-Youn Seo, a Konrad Domanski, a Juan-Pablo
Correa-Baena, d Mohammad Khaja Nazeeruddin, b Shaik M. Zakeeruddin, a Wolfgang
Tress, a Antonio Abate, a A. H. and M. G. Cesium-containing triple cation perovskite solar
36
cells: improved stability, reproducibility and high efficiency. Energy Environ. Sci. 9, 1989–
1997 (2016).
69. Kulbak, M., Cahen, D. & Hodes, G. How Important Is the Organic Part of Lead Halide
Perovskite. J. Phys. Chem. Lett. 6, 2452−2456 (2015).
70. Choi, H. et al. Cesium-doped methylammonium lead iodide perovskite light absorber for
hybrid solar cells. Nano Energy 7, 80–85 (2014).
71. Yuxi Tian Ivan G. Scheblykin. Artifacts in Absorption Measurements of Organometal Halide
Perovskite Materials: What Are the Real Spectra? J. Phys. Chem. Lett. 6, 3466−3470 (2015).

37
Appendix
The comparison of results taken from different studies highlighted many discrepancies. Indeed, it was
noted that the value of the bandgap of a perovskite with the same components was calculated to be
different depending on the study. For instance, the bandgap of the most studied perovskite MAPbI3
was measured 1.504 eV40, 1.51 eV31,47, 1.52 eV70, 1.55 eV48, 1.575 eV64, 1.58 eV33,1.61 eV56 and
1.70 eV32. The same occurred for FAPbI3, whose bandgap was measured 1.47 eV58, 1.48 eV45,43 and
1.530 eV64.
One of the reasons for these discrepancies might be the different way in which they extrapolated the
bandgap from optical measurements. Indeed, some authors did it directly from the band edge of the
absorption spectrum, while others did it by plotting the Tauc plot using the optical data. The Tauc
plot shows the correlation between the absorption coefficient and the energy. For direct bandgap
semiconductors, it was demonstrated that the absorption coefficient changes with the square route of
the energy, while for indirect bandgap semiconductors, with the square of the energy. Since it has not
yet been clearly demonstrated whether perovskites are direct or indirect semiconductors, there can be
discrepancies between different studies even when they both used Tauc plots, depending on the
assumptions they made for the bandgap nature of the perovskite.
A 2015 work71 investigated the bandgap discrepancies and tried to give an answer to the question
“What are the real spectra?”. They found three different factors influence the shape of a perovskite
absorption spectrum, namely the poor surface coverage of the sample, the high optical density of
individual crystals and the light scattering. They assumed the absorption measured is equal to:
Ameasured = -log[β(1-γ(λ))10-OD(λ) + (1- β)]
where OD is the optical density of individual crystals, β is the substrate coverage ratio, namely the
are covered by the perovskite over the total area and γ(λ) is the scattering coefficient, which is equal
to 0 for no scattering and to 1 when all the coming light is scattered.
They observed that the scattering effect does not have an influence in the value of the bandgap. On
the contrary, the presence of individual crystals does. In order to observe what was the effect of the
single crystals size on Ameasured, they set β = 0.5, no scattering, and changed the OD(λ) by multiplying
the experimental value of the OD of a single crystal by a factor ζ. Figure 21 shows the shift of the
observed bandgap by increasing the thickness of the single crystals from ζ = 0.5 to ζ= 8 (when the
thickness was estimated to be 1.2 μm).

38
Figure 21: Effect of high optical density of single crystals on absorption edge position71.
From this plot, however, it is not possible to observe the shift of the bandgap that they claim there is.
Indeed, it appears that the onset of all the spectra are at 800nm, namely around 1.55 eV. In order to
verify if their observation was correct, the Tauc plots for direct and indirect bandgap were drawn for
the cases ζ = 1 and ζ = 4 (Figure 22 and 23).
Figure 22: Tauc plot for direct bandgap semiconductor plotted from data extracted from figure 23 when ζ = 1 and 4.

39
Figure 23: Tauc plot for indirect bandgap semiconductor plotted from data extracted from figure 23 when ζ = 1 and 4.
The plots show that there is indeed a shift in the bandgap value. Moreover, they display that the value
of the bandgap is slightly different depending on how it is extrapolated, around 1.59 eV for direct
bandgap assumptions and 1.55 eV for indirect bandgap assumptions. A final remark is that depending
on the point of the curve in which the tangent was considered, the value of the bandgap shifts and this
is moderately important for the direct bandgap case.
Even though these results seem to confirm the idea that the bandgap discrepancies depend on the
inhomogeneity of the sample, other differences in the samples might generate a different value of the
bandgap. Indeed, other studies52 demonstrated that the optical absorption edge shifts to longer
wavelengths when increasing the average crystallite dimension from less than 250 nm to more than
2 μm. They correlated this shift of the optical absorption edge with a bandgap shift without explicitly
extrapolating the bandgap values from Tauc plots. To deposit nanocrystals, the perovskite solution
was deposited on a Al2O3 mesoporous scaffold, while for bigger crystals a flat substrate was used. To
explain the reason why the size of the crystals has an influence on the electronic properties of the
perovskite, another study53 carried out Raman spectroscopy analysis and optical analysis on samples
with different crystal size and prepared with and without the addition of chloride, which plays a role
in the crystallization process10. They found out that in flat films there is a reduced strain on the Pb-I
cage than that present in mesoporous structure and that this is due to a different arrangement of the
organic cations within inorganic cage. When the B and the X ions are not collinear, as explained in
the A cation chapter, the energy of the CBM increases and the overall result is the bandgap
broadening. Figure 24 shows the absorption edge trend when increasing the average crystallite size.

40
Figure 24: MaPbI3 Absorption edge shift with average crystallite size (nm)52.
Moreover, they found out that the presence of Cl- in the crystallization process induces a preferred
crystalline orientation so that the disorder in the mesoporous structure is reduced and the overall effect
on the bandgap is weaker53.
Overall, depending on the size of the crystals and on the surface coverage of the film, slightly different
results may be obtained for the value of the perovskite bandgap. This could have a relevant effect in
studies that try to predict the theoretical limit for the efficiency of perovskite solar cells, while it does
not have a large relevance in this analysis because the differences in the values are very small
compared to the differences in the bandgap values of perovskites composed of different elements or
molecules.

![A Layered Hybrid Perovskite SolarCell Absorber with ...web.stanford.edu/group/karunadasalab/publications/paper5.pdfthe higher bandgap absorber in a dual-absorber tandem device,[10]](https://img.dokumen.tips/doc/110x75/5f4c72f27cb9b27ee061ef07/a-layered-hybrid-perovskite-solarcell-absorber-with-web-the-higher-bandgap-absorber.jpg)