Embed Size (px)
Citation preview

Component blending for bitumen production for Indian refineries
UMA CHAKKOTH1, K R KRISHNA2, M RAMKUMAR2, SYED ARIF HUSSAIN3, P V C RAO2,
N V CHOUDARY2, G SRIGANESH2 and J MURALI KRISHNAN1,*
1Department of Civil Engineering, Indian Institute of Technology Madras, Chennai, India2Fuels Research Lab, HP Green R&D Centre (HPGRDC), Bengaluru, India3Hindustan Petroleum Corporation Limited (HPCL), Mumbai Refinery, Mumbai, India
e-mail: [email protected]; [email protected]; [email protected]; [email protected];
[email protected]; [email protected]; [email protected]; [email protected]
MS received 28 July 2019; revised 24 November 2019; accepted 27 November 2019
Abstract. This investigation pertains to the bitumen production using component blending. During the
manufacture of blended bitumen, the proportion of the constituents, the temperature during blending, and the
duration of blending are selected to meet the penetration at 25�C and the absolute viscosity at 60�C as per the
Indian specifications. The choices of the blend parameters become challenging when the constituents from
multiple crudes are blended to produce different paving grades. Two constituent and three constituent blends for
four different grades of bitumen were prepared in a laboratory blending facility from four different crude
sources. A design of experiments framework was used to develop prediction models for penetration and vis-
cosity. Simulations were carried out to suggest blending schemes to manufacture all the viscosity grades from
different crude sources. Correspondence between the viscosity grade and high-temperature performance grade
was observed for blend parameters for the crude sources investigated in this study.
Keywords. Component blending; blend parameters; blended bitumen formulations; design of experiments;
viscosity grading; performance grading.
1. Introduction
India has twenty-three refineries processing a wide variety
of crude sources. Out of these, paving grade bitumen is
produced from twelve refineries, and the remaining eleven
refineries do not produce bitumen. The crudes processed by
refineries are mainly of medium American Petroleum
Institute (API) gravity from the Middle East, Mexico,
Venezuela and Canada [1]. Most of the crudes processed
are blends of two or more crudes namely Arab light,
Murban, Das, Iran and Basrah light.
The Indian standard specification for paving bitumen was
based on penetration, and it was formulated in 1950. Sub-
sequent amendments were made to the specifications over
the years by including various empirical test methods [2].
Considering the limitations of the penetration based grad-
ing, viscosity-based grading was incorporated in the year
2006. The latest revision of the Indian standard specifica-
tions for paving grade bitumen IS 73 [3] classify the binders
into four viscosity-based grades, and these are VG10,
VG20, VG30, and VG40.
The refineries in India process crudes through air recti-
fication using patented BITUROX technology and
component blending [4, 5]. In the component blending
process, different constituents obtained from the refinery
units, such as the propane deasphalted (PDA) pitch, low
viscous extract, vacuum gas oils, and vacuum tower bottom
(VTB) are blended in conditioning tanks. PDA process is an
extraction process in which vacuum residue is contacted
with propane to extract heavier oils known as deasphalted
oil [6]. The PDA pitch obtained from the deasphalting
process is a low penetration material (typically less than 12
at 25�C) with a viscosity of around 20,000 Poise at 60�C.The extracts are the residue collected from auxiliary
refinery operations units such as fluid catalytic cracking
(FCC) and solvent extraction.
1.1 Blended bitumen formulations
Various factors influence the quality of bitumen processed
using component blending. These factors are the propor-
tions and the consistency of constituents, processing con-
ditions such as the duration of blending, the temperature
during blending, target grade, and other production aspects
of the refinery. Most of the early investigations on blended
bitumen were mainly focused on the influence of blend
proportions on the properties of the blended bitumen*For correspondence
Sådhanå (2020) 45:48 � Indian Academy of Sciences
https://doi.org/10.1007/s12046-020-1268-9Sadhana(0123456789().,-volV)FT3](0123456789().,-volV)

defined in terms of penetration and softening point [7–11].
These studies focused on developing nomographs relating
the blend properties and the specification-based parameters.
Lopatskii [7] developed the prediction models used for
blended bitumen which includes a graphical and analytical
method for determining the softening point of blended
bitumen. Gun and Biryulina [8] investigated the influence
of the properties of the individual constituents which were
tar and ‘oxidized’ bitumen, on the properties of the blended
bitumen processed using it.
Lopatinskii and Lopatinskii [9] developed a nomograph
for arriving at a specific softening temperature based on the
softening point of the blend constituents. Akhmetova and
Glozman [10] proposed a triangular diagram for the choice
of optimal constituent ratios for preparing the blended
bitumen to meet the required specification criteria. Tabolina
et al [11] proposed an analytical expression for finding the
softening point of the blended bitumen based on the soft-
ening point of the individual constituents. In these studies,
the influence of process conditions on the properties of the
blended bitumen during the blend production was not
adequately quantified.
An extensive characterization of blended bitumen was a
result of research efforts carried out by refineries in Israel to
understand the issues related to using propane precipitated
asphalt (PPA) blends in bituminous mixtures [12]. The
research carried out by Ishai and co-workers in three sig-
nificant publications [12–14] discussed different blending
constituents which could be used for processing blended
bitumen. The paving grade bitumen produced using VTB,
extract, and PPA was used for the investigation. The pro-
cess parameters during blending were the temperature
which was kept constant at 125�C for 75 minutes. Fourteen
blends were produced using different proportions of the
constituents with similar process parameters. The blends
were verified for the compliance with Israel standard for
viscosity-based grading [14]. The studies on blended bitu-
men by Ishai and Yuval [14] indicate that the proportion of
extract in a three constituent blend should be in the range of
5 to 15% when blended with PDA pitch and VTB.
Similar to the penetration and softening point based
nomographs, the viscosity based mixing rules were exten-
sively used for different research applications after the
introduction of viscosity based paving grade specifications.
Chaffin et al [15] used viscosity based mixing rules to make
appropriate choices for recycling agents and modifiers
suggested regression analysis to predict the penetration,
viscosity, and ductility of binary mixtures of oxidized
bitumen and vacuum residue (see also [16–18]). The
underlying assumption of these mixing rules that there
exists a linear relationship between the proportion and the
viscosity of the constituents does not hold good at all
conditions, the details of which are reviewed in Centeno
et al [19]. Chakkoth et al [20] evaluated the use of viscosity
based mixing rules to determine the blended bitumen vis-
cosity and the viscosity predictions were obtained with a
wide range of errors. These simplified viscosity mixing
rules can at best give a rough estimate of the expected blend
viscosity as long as the constituents consist of light to
intermediate hydrocarbons. These rules cannot be used for
blend formulations of paving grade bitumen as the com-
pliance of such blends to the specification limits of other
parameters such as penetration, or softening point is ques-
tionable. In addition to this, complex hydrocarbons such as
bitumen pose a serious challenge due to the possible
chemical interactions.
The design of experiment techniques provides an effi-
cient means to formulate a mixture design as well as to
optimize a process [21]. An effective experimentation plan
includes two steps; one is to find an appropriate formulation
for experimental design and the second is to optimize the
process using factorial or response surface methods. The
implementation of the design of experiments techniques
span across all industries, and engineering application
wherein the response variable depends on multiple input
variables. Very few investigations on bituminous materials
have used the design of experiments approach. Bressi et al
[22] used response surface methodology (RSM) to deter-
mine the influence of percentage of reclaimed asphalt
pavement (RAP) and penetration of virgin bitumen on the
quality of the RAP blend (see also [23, 24]).
Recently, the design of experiments framework was used
by Varanda et al [25] to propose blend formulations for
paving grade bitumen using products such as asphaltic
residue, vacuum residue, and extracts obtained from the
refining processes. The blended bitumen data was used in a
constrained mixture design to develop prediction models
for the response variables. The response variables, the
penetration (at 25�C) and the softening point, were fitted
with Scheffe’s polynomial functions. The experimental
design consisted of different proportions of the compo-
nents, and all the blends were prepared at the same process
conditions.
1.2 Motivation
This investigation was initiated to develop an understand-
ing of the issues related to the production of component
blended bitumen in the Indian refineries. Table 1 shows the
requirements for paving grade bitumen as per IS 73 [3].
Here, the penetration at 25�C and viscosity at 60�C are only
shown. The existing blending scheme followed in one of
the Indian refineries is for a two-constituent blend and uses
86.4% of PDA pitch and 13.6% of extracts to process VG30
grade bitumen. The refinery chooses the proportion of the
blend constituents and the blend parameters (temperature
and duration of blending) such that the resulting blend
complies with a target viscosity and penetration as per IS
73 [3]. Since the design of the blending scheme can become
involved when the constituents of different crudes are to be
processed for different paving grades, a need was felt in
48 Page 2 of 16 Sådhanå (2020) 45:48
rationalizing the whole procedure. Also, the refinery
explored the options of using VTB in processing the three
constituent blends. The VTB is used in other refinery pro-
cesses such as visbreaking, deasphalting, coking and
hydroprocessing [26]. As VTB serves as a material which
could be used as a feedstock to different other units in the
refinery, only a minimum quantity of VTB would be
available for blending purposes. With such constraints on
constituents and with multiple crudes being processed, the
development of a robust blending scheme accounting for
the influence of crude type, process factors, and constituent
properties is necessary. This investigation reports such a
design, and towards this end, a multivariate statistical
technique was used.
This work is aimed towards formulating a scheme of
blending for producing paving grade bitumen by varying
the proportion of the constituents and the process parame-
ters. The main objectives of this investigation are:
1. to develop a process protocol for producing the various
grades of paving bitumen in the laboratory, and
2. to develop and validate the prediction model for
penetration and viscosity of the blends for a given crude
source and blend parameters.
The model would also serve as a tool for determining the
blend parameters for bitumen of a particular viscosity grade
from a given crude source.
1.3 Methodology
The constituents obtained from four crude sources with API
of the crude sources ranging from 30.8 to 37.6�, were usedfor developing a blending scheme for all the viscosity
grades as per IS 73 [3]. The blend parameters were the
process conditions, proportions of the constituents and API
of the parent crude. The two constituent and three con-
stituent blends were processed in a pilot scale arrangement
in the laboratory to meet the two key parameters which are
the penetration at 25�C and the absolute viscosity at 60�Cas per the Indian technical specifications. The blending
scheme for VG10, VG20, VG30 and VG40 grade of bitu-
men was finalized for both the two and three constituent
blends. In order to harmonize the blending scheme devel-
oped, the statistical prediction models were formulated by
using blend parameters as the variables using the design of
experiments framework. The penetration and the absolute
viscosity of the blended bitumen were the response vari-
ables for these models.
The blended bitumen data of one set of the crudes were
used to develop the model. The validation of the model was
carried out using the data of another crude source. The
prediction models were used to simulate the process
parameters for different ranges of the blend parameters. For
every simulation carried out a set of optimal solutions was
generated using the desirability function approach. These
simulations focused on relating the influence of blend
proportions and API gravity of the parent crude on the
process parameters. All the manufactured blends were
measured for their performance grade properties, and it was
seen that a correspondence between the viscosity grade and
high-temperature performance grade could be observed for
blend proportion and process parameters for the crude
sources investigated in this study.
2. Experimental investigation
The procedure followed for the design of blending
scheme is explained in this section. It includes the details
on the materials and the experimental procedures used for
processing the two constituent and three constituent
blends.
2.1 Materials
The details on the crude sources are presented in table 2.
The constituents from the identified crude sources were
received from the refinery. The blend constituents were
PDA pitch, vacuum tower bottom (VTB) and residue or
extract from auxiliary refinery units such as solvent
extraction or fluid catalytic cracking units. The two con-
stituent blends, designated as ‘2C’ in this paper were pro-
cessed using PDA pitch and residue. In the case of three
constituent blends, designated as ‘3C’ here, PDA pitch,
VTB, and the residue were used. The constituents of crude
source 1 were used for producing 2C blends. The con-
stituents of crude source 2, 3 and 4 were used for making
both 2C and 3C blends.
The details on the blend constituents are presented in
table 3. The absolute viscosity of PDA pitch from crude
source 2, 3 and 4 was measured using vacuum capillary
viscometer. Due to the high viscosity of the PDA pitch
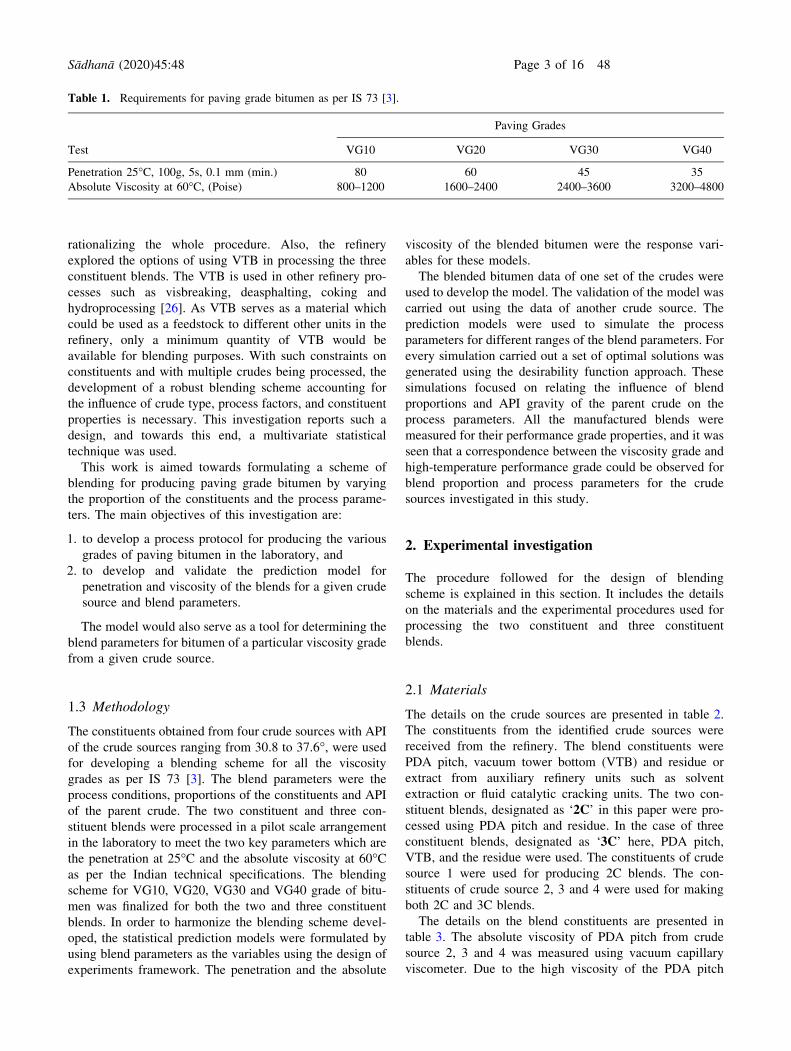
Table 1. Requirements for paving grade bitumen as per IS 73 [3].
Test
Paving Grades
VG10 VG20 VG30 VG40
Penetration 25�C, 100g, 5s, 0.1 mm (min.) 80 60 45 35
Absolute Viscosity at 60�C, (Poise) 800–1200 1600–2400 2400–3600 3200–4800
Sådhanå (2020) 45:48 Page 3 of 16 48

sample obtained from crude source 1, there were difficulties
in carrying out absolute viscosity measurements using
vacuum capillary viscometer. Hence, the apparent viscosity
at 60�C of the PDA pitch from crude source 1 was mea-
sured by carrying out steady shear experiments using par-
allel plate geometry of 25 mm diameter at a shear rate of
0.1 s-1, in the dynamic shear rheometer. For the sake of
comparison, the apparent viscosity measurements carried
out using PDA pitch from crude source 2, 3 and 4 are
reported here (see table 3). The absolute viscosity of VTB
samples of all the crude sources was measured using vac-
uum capillary viscometer. The viscosity of the residue was
measured using a rotational viscometer as per the test
procedure specified in ASTM 2015 [27]. The percentages
of asphaltenes were determined by following the test pro-
cedure as per IP 469 [28].
2.2 Design of blending scheme
The pilot scale laboratory blending facility used as part of
the current investigation consists of IKA Eurostar 100
control homogenizer with an anchor stirrer and a container
for blending, placed under controlled conditions of tem-
perature using a heating plate. The blend parameters were
the temperature, duration of blending and angular velocity
of the stirrer during blending. The proportion of the blend
constituents and the blend parameters were chosen such
that the resulting blend complies with a target viscosity
grade as per IS 73 [3]. Two constituent blended bitumen of
VG30 grade, processed in the refinery using constituents
from crude source 1 was used as a benchmark to determine
the blend parameters for the laboratory blends. For a VG30
bitumen (specification details are given in table 1), the
typical blend proportions used in the refinery are 86.8%
PDA pitch and 13.2% extract for a 2C blend. Preliminary
2C laboratory blends, using constituents from crude source
1, were prepared using the blend proportions identical to
that used in the refinery. The refinery process conditions
dictate that the temperature range of the blending operation
should be in the range of 140 to 160�C. The duration of
blending for each blend was varied between 30 to 120
minutes. The angular velocity was varied between 500 and
700 rpm. It was observed that the measured penetration and
viscosity values were identical for both refinery and labo-
ratory blend when the angular velocity of the stirrer during
laboratory blending was 500 rpm at a temperature of
140�C, and the duration of blending was 45 minutes. For
subsequent blending trials, to reduce the variability in the
trials, the angular velocity of the stirrer during blending of
both 2C and 3C blends for all the grades of bitumen was
kept constant as 500 rpm. The blended bitumen data of
these preliminary blends were used as a reference for
subsequent blending trials.
2.2.1 Two constituent blends: The range of the process
parameters obtained from the preliminary blending trials
was used to design the blending scheme for 2C blends.
Trial blends were produced using constituents from the
crude source 1 to determine the blend parameters for all the
grades. For a particular target viscosity grade, the blend
proportions were kept constant, and the blend parameters
Table 2. Crude source details.
Source ID Crude source API (�) Blend constituents
Source 1 66% Basrah and 34% Murban 34 PDA pitch, Residue
Source 2 80% AXL, 10% Basrah and 10% Iran Mix 37.6 PDA pitch, Residue, VTB
Source 3 75% Basrah and 25% Arab Mix 30.8 PDA pitch, Residue, VTB
Source 4 80% Basrah and 20% Das 32.5 PDA pitch, Residue, VTB
Table 3. Properties of the blend constituents.
Constituents Properties
Crude source
Source 1 Source 2 Source 3 Source 4
PDA Pitch Penetration at 25 �C (dmm) 7 12 19 14
Absolute Viscosity at 60�C (Pa.s) – 2171.2 1666.5 1759.2
Apparent Viscosity at 60�C (Pa.s) (shear rate 0.1 s-1) 3387.3 4711.9 3050.2 3109.2
Asphaltenes (%) 14.1 16 14 17
VTB Penetration at 25�C (dmm) – 113 100 95
Absolute Viscosity at 60�C (Pa.s) – 83.6 101.7 108.1
Asphaltenes (%) – 15.4 12.4 10.9
Residue Viscosity at 60�C (mPa.s) 10 100 342 124
Asphaltenes (%) 0.6 1.5 0.4 0.5
48 Page 4 of 16 Sådhanå (2020) 45:48

(temperature and duration of blending) were varied in the
range discussed earlier. The blend parameters were final-
ized based on the penetration, and the viscosity values of
the blend which was closer to the range specified for a
particular grade of bitumen as per IS 73 [3] (see table 4).
Identical to the exercise carried out for crude source 1, the
blend parameters were determined using the constituents of
crude source 2, 3, 4, and the details are presented in table 4.
2.2.2 Three constituent blends: The proportion of VTB
used for producing the 3C blends was kept between 5 and
15% by weight of the blend, and the proportion of PDA
pitch was kept constant at 75%. The temperature of
blending was kept constant at 140�C. The trial blends for
designing the blending scheme for the 3C blends were
produced using constituents from crude source 2. The blend
proportions were finalized for a target viscosity grade, and
the blend parameters were varied. The penetration and
viscosity values of the blends were measured and verified
for the compliance to the specifications as per IS 73 [3].
The data presented in table 5 are the final blend parameters
for the three constituent blends for all the crude sources.
It was observed that the viscosity values of certain blends
of VG10 (a 2C blend of crude source 2 and 3; 3C blends of
crude 2, 3 and 4) deviated slightly from the specification
limits. The production parameters of these blends were not
changed as the penetration values of the blends complied
with the specifications as per IS 73 [3]. Furthermore, the
laboratory blending scheme has to be scaled appropriately
to suit the refinery applications. The process parameters for
the blends with minor deviation from the specification
limits can be revised during this scaling procedure at the
refinery to obtain the penetration and viscosity values
within the required range.
3. Analysis of blended bitumen data
The experimental database of blended bitumen presented
in the earlier section was used to develop a statistical
model for predicting penetration and viscosity of the
blends. A multivariate statistical technique was used here
for the same. The test variables of the current investi-
gation include the proportion of the constituents, the
temperature during blending and the duration of blending.
For model development, the variables were bifurcated
into two sets, and those were the mixture and the process
variables.
The mixture variables were the proportion of each con-
stituent. To capture the influence of crude type on the
properties of the blended bitumen, API gravity of the parent
crude was included as one of the variables. From blended
bitumen data, for a particular viscosity grade, it was
observed that the temperature and duration of blending
were influenced by the API gravity of the parent crude. For
instance, by keeping all the other blend parameters similar,
on comparing the blend parameters of crude source 3 and 4,
the duration of blending for 2C-VG10 blends of crude
source 4 was reduced by 30 minutes to meet the specifi-
cation limits as per IS 73 [3] (see table 4). Similar varia-
tions in the process parameters were applied for three
constituent blends of crude source 2 to process VG10 grade
blend of crude source 3, and for VG40 grade blend of crude
source 3 and 4 (see table 5). Hence, API gravity was
included as a process variable. Thus, the process variables
consisted of temperature during blending, duration of
blending and API gravity of the crude. Each process vari-
able was assigned levels which were the different values of
the variable at which the experiments were carried out. For
instance, the temperature during blending consists of three
Table 4. Details on blending scheme for 2C blends.
Source
Pitch
(%)
Residue
(%)
Temperature
(�C)Duration
(min.)
Penetration
(dmm)
Absolute viscosity
(Poise)
Viscosity Grade (IS 73)
[3]
1 75 25 160 90 148 828 VG10
80 20 160 90 82 1810 VG20
85 15 140 45 60 3489 VG30
85 15 150 90 43 3792 VG40
2 75 25 160 90 88 787 VG10
80 20 160 90 60 1750 VG20
85 15 140 45 48 2514 VG30
85 15 150 90 30 3859 VG40
3 75 25 160 90 88 1286 VG10
80 20 160 90 60 2240 VG20
85 15 140 45 48 3203 VG30
85 15 150 90 41 4076 VG40
4 75 25 160 60 115 940 VG10
80 20 160 60 64 1797 VG20
85 15 140 45 52 2577 VG30
85 15 150 90 42 3809 VG40
Sådhanå (2020) 45:48 Page 5 of 16 48

levels which were 140, 150 and 160�C. Similarly, the
duration of blending consists of values which were 30, 45,
60, 90 and 120 minutes. The API gravity of the parent
crudes was in the range of 30.8 to 37.6�.
3.1 Experimental design
The functionalities of the Stat-Ease Design-Expert (ver-
sion 11.0.5.0) software [29] were used in the experi-
mental design, model validation and estimation of the
model reliability in this study. As both mixture and
process variables are involved, a combined design was
used. In a typical refinery operation, there are process
parameters which are ‘hard to change’ (HTC) such as
temperature during blending, API gravity of the crude
and ‘easy to change’ (ETC) parameters such as duration
of blending. For the model development, the designations
for the mixture and process variables are presented in
table 6. The parameters with an upper-case designation
are the ETC parameters, and the lower-case designations
are the HTC parameters. To account for the influence
HTC and ETC parameters, the algorithm used in the
current research for the experimental design was I-opti-
mal design of split-plot type [30]. I-optimal designs are
used in response surface methods (RSM) where the
prediction is important. The algorithm minimizes the
integral of the prediction variance of the variables across
the design space [25, 31]. A total of 26 blends from
crude source 2 and 3 (details presented in table 7) were
included as part of the experimental design. In addition
to the data presented in table 4 and 5 earlier, the trial
blend data was included in the experimental design. The
analysis of the blended bitumen was carried out by fitting
the responses (penetration and viscosity of the blends) to
a polynomial function. All the parameters were assumed
to be discrete, and the range of each parameter are given
in table 7 (second row, columns 4 – 8).
3.2 Prediction models: Penetration and Viscosity
The response, penetration at 25�C of the blends given in
table 7 were fit with Scheffe’s reduced polynomial function
[32] given by the equation (1) below where y is the
response variable, xi, xj represents the mixture and process
factors, bi are the linear coefficients and bij are the inter-
action coefficients. The P-values of all the model parame-
ters were used to estimate statistical significance.
y ¼Xn
i¼1
bixi þXn�1
i\j
Xn
j
bijxixj ð1Þ
The mixture variables ‘a,’ ‘b,’ and ‘c’ were observed to
be statistically significant. Figure 1(a) shows the normal
plot of residuals for the model (before transformation)
which indicates a deviation from a normal distribution. The
combined effect of the process variables, denoted by the
parameters ‘ad’, ‘aE’, ‘af’, ‘bE’, ‘bf’, ‘cd’, ‘cE’, ‘cf’, were
not statistically significant. The response variable was
transformed using a logarithmic function and based on the
P-values, the parameters which are not significant (P-
value[ 0.05) were removed, and the model was refined.
The analysis of variance (ANOVA) results for the pene-
tration model, before and after the transformation of the
response variable are presented in table 8.
Table 5. Details on blending scheme for 3C blends.
Source
Pitch
(%)
VTB
(%)
Residue
(%)
Duration
(min.)
Penetration
(dmm)
Absolute viscosity
(Poise)
Viscosity Grade (IS 73)
[3]
2 75 5 20 60 85 1224 VG10
10 15 60 60 2114 VG20
15 10 45 45 3248 VG30
15 10 90 35 4615 VG40
3 75 5 20 30 91 1356 VG10
10 15 60 65 2300 VG20
15 10 45 48 3359 VG30
15 10 120 44 4502 VG40
4 75 5 20 60 100 1250 VG10
10 15 60 68 2076 VG20
15 10 45 51 2945 VG30
15 10 120 43 4030 VG40
Table 6. Model parameters.
Variable Variables Designation Parameter type
Mixture PDA pitch a HTC
VTB b
Residue c
Process Temperature d HTC
Duration E ETC
API gravity f HTC
48 Page 6 of 16 Sådhanå (2020) 45:48

Figure 1(b) shows the normal plots after the log trans-
formation of the response after removing the terms which
are not significant. The parameters which were significant
in the revised model were the combined effect of the
proportion of PDA pitch, residue, and the process vari-
ables. The final model for penetration (in dmm) is given
in equation (2) below. The R2 value of this model was
0.9695.
lnðpenetrationÞ ¼ 5:15274aþ 5:73617bþ 11:75827c
� 0:009557aE�0:067418af�0:071748cd
þ 0:035250cE þ 0:2525306cf
ð2Þ
The analysis similar to that of the penetration model was
carried out for developing the viscosity model. The vis-
cosities at 60�C of the blends given in table 7 were fit with
Scheffe’s reduced polynomial function given by the equa-
tion (1). The response variable was transformed, and the
analysis of variance (ANOVA) results for the viscosity
model, before and after the transformation of the response
variable are presented in table 9.
Figure 2 shows the normal probability plots of the vis-
cosity model before and after the transformation of the
response variables. The parameters indicating the combined
effect of the proportion of PDA pitch, residue, and the
process variables were observed to be statistically signifi-
cant after the logarithmic transformation of the response
variable. The final viscosity model is given in equation (3).
The R2 value of this model was 0.9905.
lnðviscosityÞ ¼ 7:57766aþ 6:20796bþ 8:92844c
þ 0:005467aE þ 0:066777af
þ 0:032396cd�0:511549cf
ð3Þ
3.3 Model validation
The validation of the prediction models (penetration and
viscosity) was carried out using the blended bitumen data of
crude source 4 (API gravity of 32.5�). The penetration and
viscosity models were used to estimate the values for
response variables using the blend parameters of 8 blends
(4 grades - 2C blends; 4 grades - 3C blends) of crude source
4 presented earlier in tables 4 and 5. The limits for the
response variables were a minimum value for the penetra-
tion (at 25�C), and upper and lower limit of the viscosity (at
60�C) as per IS 73 [3]. The variations in the measured and
Table 7. Design generated by an I-optimal algorithm.
Group Run Source ID Pitch VTB Residue
Temperature
(�C)Duration
(min.) API
(�)Penetration
(dmm)
Absolute
viscosity
(Poise)Range 0–1 0–1 0–1 140–160 30–120
1 1 3 0.75 0 0.25 160 90 30.8 88 1286
1 2 3 0.80 0 0.20 160 90 30.8 60 2240
2 3 2 0.75 0 0.25 160 90 37.6 88 787
2 4 2 0.8 0 0.20 160 90 37.6 60 1750
3 5 3 0.85 0 0.15 140 45 30.8 48 3248
3 6 3 0.85 0 0.15 150 90 30.8 41 4076
4 7 2 0.85 0 0.15 140 45 37.6 48 2514
4 8 2 0.85 0 0.15 150 90 37.6 30 3859
5 9 2 0.75 0.15 0.10 140 90 37.6 35 4615
5 10 2 0.75 0.15 0.10 140 75 37.6 46 3530
6 11 2 0.75 0.15 0.10 140 60 37.6 42 3563
6 12 2 0.75 0.15 0.10 140 45 37.6 45 3248
7 13 3 0.75 0.05 0.20 140 30 30.8 91 1356
7 14 3 0.75 0.05 0.20 140 45 30.8 89 1435
8 15 2 0.75 0.10 0.15 140 45 37.6 61 1845
8 16 2 0.75 0.10 0.15 140 60 37.6 60 2114
9 17 3 0.75 0.05 0.20 140 60 30.8 85 1604
9 18 3 0.75 0.10 0.15 140 60 30.8 65 2300
10 19 3 0.75 0.15 0.10 140 45 30.8 48 3359
10 20 3 0.75 0.15 0.10 140 120 30.8 44 4502
12 21 2 0.75 0.05 0.20 140 90 37.6 105 1049
12 22 2 0.75 0.05 0.20 140 120 37.6 85 1224
13 23 2 0.75 0.25 0 140 90 37.6 15 12259
13 24 2 0.75 0.20 0.05 140 45 37.6 32 5897
14 25 2 0.75 0.10 0.15 140 90 37.6 55 2311
14 26 2 0.75 0.10 0.15 140 120 37.6 51 2585
Sådhanå (2020) 45:48 Page 7 of 16 48

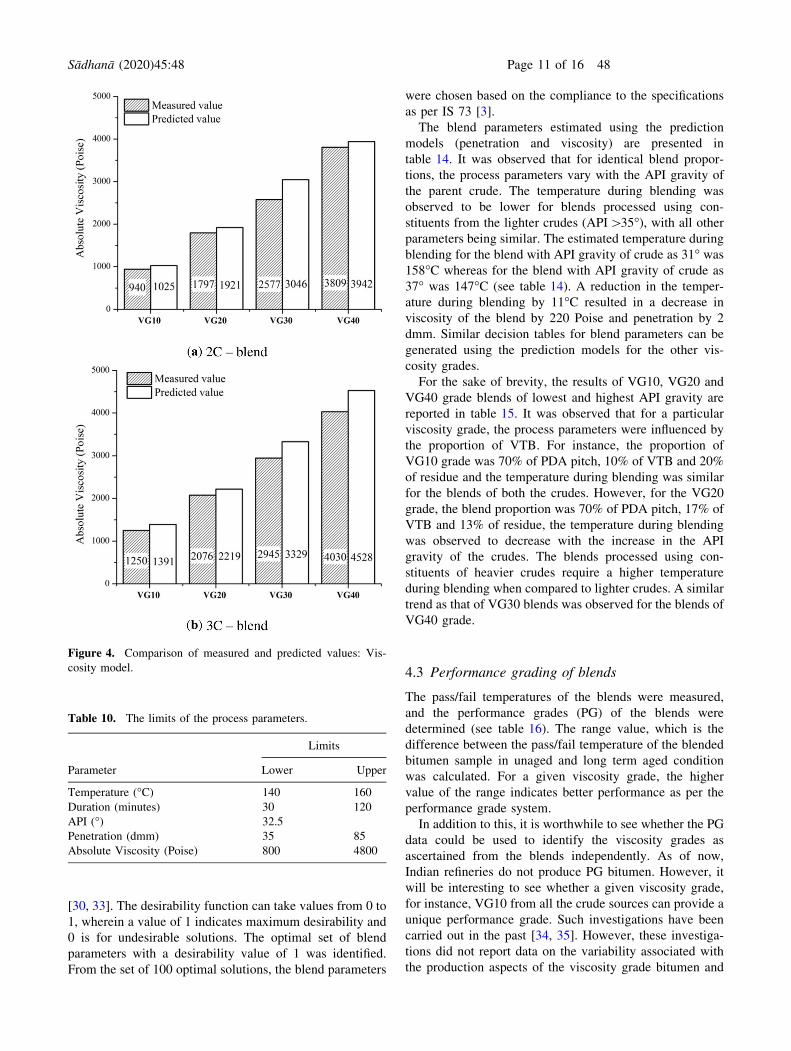
predicted values of the response variables were estimated.
Figure 3 shows the measured and predicted values of
penetration for both 2C and 3C blends. The measured and
predicted viscosity values for all the eight blends are pre-
sented in figure 4.
The mean absolute percentage error (MAPE) was com-
puted to measure the prediction accuracy using the
expression given in equation (4).
MAPE %ð Þ ¼ 100
N
XN
i¼1
yexpi � y
preij j
yexpi
ð4Þ
where N is the number of blends, yprei is the predicted value
of the response variable and yexpi is the measured value of
the response variable. The obtained MAPE was 10.1% for
penetration, and 10.2% for viscosity. The blending
scheme proposed in this investigation is based on condi-
tions in a laboratory. The blend parameters have to be
scaled to suit the conditions at a refinery, during which this
variability could be considered and the parameters be
refined accordingly.
4. Model simulations
The prediction models were evaluated by carrying out
simulations for different ranges of the blend parameters.
The details of two sets of simulations carried out are dis-
cussed here. The first set of simulations was to estimate the
process parameters for a given set of blend proportions. The
second set of simulations was to estimate the blend
parameters for a particular viscosity grade for crudes of
different API gravity.
4.1 Influence of the process parameters
In the context of current investigation on blended bitu-
men, there exists an increasing demand for the lower-
grade (such as VG10) as well as higher-grade (such as
VG40) bitumen, and the refinery operations have to be
suitably designed to address it. One such revision could be
the use of equal blend proportions for processing different
viscosity grades. Towards this end, the simulations were
carried out to verify the correspondence of the blend
proportions to a particular viscosity grade, and they are
discussed below. Table 10 shows the limits of the process
parameters used for this simulation. The simulations for
the process parameters were carried out for two blend
proportions. Firstly, the blend proportions were kept at
75% of PDA pitch and 25% of residue, which was used to
process VG10-2C blend. A set of 100 solutions were
generated with different blend parameters, and it was
observed that the penetration value was in the range of
83–85 and the viscosity values were in the range of
892–993 Poise. Thus, for the blend proportion of 75%
PDA pitch and 25% of residue, only a VG10 grade blend
could be produced for the process parameters shown in
table 10. The set of four blends presented in table 11 was
used to quantify the influence of the process parameters
on the penetration and viscosity of the blends.
The estimated process parameters for the first three
blends in table 11 indicate that for identical temperature
during the blending, a decrease in the duration of blending
results in a decrease in the penetration and the viscosity
Figure 1. Normal probability plot of the residuals - penetration
model.
48 Page 8 of 16 Sådhanå (2020) 45:48

values of the blends. For temperature during the blending of
160�C, a decrease in the duration of blending by 20 minutes
results in a decrease in penetration by 3 dmm and decrease
in viscosity by 75 Poise (see table 11). Similarly, for a
constant duration of blending of 33 minutes, a 2�C decrease
in the temperature during blending resulted in an increase
in penetration by 3 dmm and decrease in the viscosity by 14
Poise as observed from the estimated process parameters of
the last two blends in table 11.
For the second set of simulations, the blend proportions
were kept at 75% of PDA pitch, 10% of VTB and 15% of
residue, which was the proportion used to process VG20-
3C blends. A set of solutions with different process
parameters (temperature and duration of blending) were
generated. The penetration of the blends was in the range of
48–69 and viscosities were in the range of 1962–3031
Poise. Table 12 shows the set of 6 blends which has the
penetration and viscosity values complaint with VG20 and
VG30 grade bitumen specified as per IS 73 [3].
For a given set of blend proportions an increase in the
temperature during blending by 5�C and duration of
blending by 67 minutes, a VG30 grade could be processed
from a VG20 grade blend (the third and fourth blend data in
table 12). It was observed that for a given set of blend
parameters by varying the duration of blending by 30
minutes, the viscosity of blends varies by 257 Poise. This
Table 8. ANOVA results for penetration model.
Variables Term df Error df F-value P-value
Before transformation Subplot 10 9.33 11.61 0.0004
Mixture 2 9.71 39.33 \0.0001
ad 1 14.62 0.0014 0.9708
aE 1 14.13 0.0219 0.8845
af 1 14.25 0.1217 0.7323
bE 1 14.13 0.0597 0.8106
bf 1 10.40 0.0650 0.8038
cd 1 13.84 0.0366 0.8511
cE 1 14.07 0.0552 0.8176
cf 1 14.99 0.0866 0.7725
After transformation Subplot 7 18.00 81.82 \0.0001
Mixture 2 18.00 190.59 \0.0001
aE 1 18.00 10.06 0.0053
af 1 18.00 7.66 0.0127
cd 1 18.00 21.22 0.0002
cE 1 18.00 4.92 0.0397
cf 1 18.00 4.75 0.0428
Table 9. ANOVA results for viscosity model.
Variables Term df Error df F-value P-value
Before transformation Subplot 10 9.33 11.61 0.0004
Mixture 2 9.71 39.33 \0.0001
ad 1 14.60 2.46 0.1381
aE 1 14.21 4.03 0.0641
af 1 14.22 0.0638 0.8042
bE 1 14.19 0.6079 0.4484
bf 1 10.94 0.7922 0.3926
cd 1 13.97 4.39 0.0549
cE 1 14.24 4.91 0.0535
cf 1 14.94 0.4668 0.5049
After transformation Subplot 6 10.44 201.17 \0.0001
Mixture 2 10.62 424.38 \0.0001
aE 1 18.88 39.16 \0.0001
af 1 11.77 8.14 0.0148
cd 1 9.64 5.28 0.0454
cf 1 12.58 22.49 0.0004
Sådhanå (2020) 45:48 Page 9 of 16 48

observation corresponds to the first two blends of VG20
grade. Similar is the case of the first two blends of VG30
grade (see table 12). There is a combined effect of the
process parameters on the penetration and viscosity of the
blend and a decrease in duration results in a variation of
penetration and viscosity values of the blends. The API
gravity of the crude also influences such variations in the
penetration and viscosity values with the change in the
process parameters, and this is discussed in the following
section.
4.2 Influence of API gravity of the crude
The refineries use multiple crudes to process paving grade
bitumen and, in such scenario, it is paramount to identify
the influence process parameters on API gravity of the
parent crude. The prediction models were used to design
the blending scheme for a particular viscosity grade for
crudes of API gravity used in the current study. The limits
of the parameters for determining the blending scheme for a
VG30 grade binder is given in table 13.
The desirability function approach was used to determine
the optimal set of solutions. Desirability function is
extensively used for multivariable optimization procedures
Figure 2. Normal probability plot of the residuals - viscosity
model.
Figure 3. Comparison of measured and predicted values: Pen-
etration model.
48 Page 10 of 16 Sådhanå (2020) 45:48
[30, 33]. The desirability function can take values from 0 to
1, wherein a value of 1 indicates maximum desirability and
0 is for undesirable solutions. The optimal set of blend
parameters with a desirability value of 1 was identified.
From the set of 100 optimal solutions, the blend parameters
were chosen based on the compliance to the specifications
as per IS 73 [3].
The blend parameters estimated using the prediction
models (penetration and viscosity) are presented in
table 14. It was observed that for identical blend propor-
tions, the process parameters vary with the API gravity of
the parent crude. The temperature during blending was
observed to be lower for blends processed using con-
stituents from the lighter crudes (API[35�), with all other
parameters being similar. The estimated temperature during
blending for the blend with API gravity of crude as 31� was158�C whereas for the blend with API gravity of crude as
37� was 147�C (see table 14). A reduction in the temper-
ature during blending by 11�C resulted in a decrease in
viscosity of the blend by 220 Poise and penetration by 2
dmm. Similar decision tables for blend parameters can be
generated using the prediction models for the other vis-
cosity grades.
For the sake of brevity, the results of VG10, VG20 and
VG40 grade blends of lowest and highest API gravity are
reported in table 15. It was observed that for a particular
viscosity grade, the process parameters were influenced by
the proportion of VTB. For instance, the proportion of
VG10 grade was 70% of PDA pitch, 10% of VTB and 20%
of residue and the temperature during blending was similar
for the blends of both the crudes. However, for the VG20
grade, the blend proportion was 70% of PDA pitch, 17% of
VTB and 13% of residue, the temperature during blending
was observed to decrease with the increase in the API
gravity of the crudes. The blends processed using con-
stituents of heavier crudes require a higher temperature
during blending when compared to lighter crudes. A similar
trend as that of VG30 blends was observed for the blends of
VG40 grade.
4.3 Performance grading of blends
The pass/fail temperatures of the blends were measured,
and the performance grades (PG) of the blends were
determined (see table 16). The range value, which is the
difference between the pass/fail temperature of the blended
bitumen sample in unaged and long term aged condition
was calculated. For a given viscosity grade, the higher
value of the range indicates better performance as per the
performance grade system.
In addition to this, it is worthwhile to see whether the PG
data could be used to identify the viscosity grades as
ascertained from the blends independently. As of now,
Indian refineries do not produce PG bitumen. However, it
will be interesting to see whether a given viscosity grade,
for instance, VG10 from all the crude sources can provide a
unique performance grade. Such investigations have been
carried out in the past [34, 35]. However, these investiga-
tions did not report data on the variability associated with
the production aspects of the viscosity grade bitumen and
Figure 4. Comparison of measured and predicted values: Vis-
cosity model.
Table 10. The limits of the process parameters.
Parameter
Limits
Lower Upper
Temperature (�C) 140 160
Duration (minutes) 30 120
API (�) 32.5
Penetration (dmm) 35 85
Absolute Viscosity (Poise) 800 4800
Sådhanå (2020) 45:48 Page 11 of 16 48

performance grade bitumen. In addition to this, the influ-
ence of production parameters on the grades of the blended
bitumen was not precisely known.
On comparing the pass/fail temperature of the blends of
all the viscosity grades, for a given crude source, the
pass/fail temperature of the 3C blends were observed to be
higher than that of the 2C blends at both unaged (except for
VG20 grade blend of crude source 4) and long-term aged
condition (except for VG40 grade blend of crude source 4).
In the case of the short-term aged blends, the pass/fail
temperature of the 3C blends of crude source 3 were
observed to be identical or lesser than the 2C blends. A
similar trend was observed in the case of blends of VG20
and VG40 grade of crude source 2.
The comparison of the blends of crude source 2 is pre-
sented in figure 5 (a) and (b). For a given viscosity grade,
the 3C blends of crude source 2 were observed to have a
higher range value than the 2C blends. For instance, the
range value of 2C-VG30 blend was 41.4�C and that of 3C-
VG30 blend was 42.8�C. The increase in range value of 3C
blends of crude source 2 could be attributed to the process
Table 11. Estimated process parameters - 2C blend.
Sl.No.
Components
Temperature
(�C)Duration
(min.)
Penetration
(dmm)
Absolute viscosity
(Poise)
Viscosity Grade (IS 73
[3])
Pitch
(%)
Residue
(%)
1 75 25 160 53 85 993 VG10
2 75 25 160 46 84 967 VG10
3 75 25 160 33 82 918 VG10
4 75 25 158 33 85 904 VG10
Table 12. Estimated process parameters - 3C blend.
Sl.
No.
Components
Temperature
(�C)Duration
(min.)
Penetration
(dmm)
Absolute viscosity
(Poise)
Viscosity Grade (IS
73) [3]
Pitch
(%)
VTB
(%)
Residue
(%)
1 75 10 15 140 30 69 1962 VG20
2 75 10 15 140 60 65 2219 VG20
3 75 10 15 150 39 61 2143 VG20
4 75 10 15 155 106 51 2885 VG30
5 75 10 15 160 113 48 3031 VG30
6 75 10 15 160 74 51 2591 VG30
Table 13. The limits of parameters – VG30 grade.
Parameter
Limits
Lower Upper
PDA pitch 0.7 0.85
VTB 0 0.2
Residue 0 0.3
Temperature (�C) 140 160
Duration (minutes) 30 120
API (�) 30.8 37.6
Penetration (dmm) 45 50
Absolute Viscosity (Poise) 2400 3600
Table 14. Decision table for paving bitumen – VG30 grade.
Sl.
No.
Pitch
(%)
VTB
(%)
Residue
(%)
Temperature
(�C)Duration
(min.)
API
(�)Penetration
(dmm)
Absolute viscosity
(Poise)
1 70 20 10 158 69 31 49 3224
2 70 20 10 154 71 32 50 3188
3 70 20 10 156 56 33 50 3014
4 70 20 10 145 78 34 50 3161
5 70 20 10 142 82 35 49 3169
6 70 20 10 142 74 36 49 3043
7 70 20 10 147 67 37 47 3004
48 Page 12 of 16 Sådhanå (2020) 45:48

parameters of 3C blends and also the addition of VTB. For
instance, the 2C-VG20 blend of crude source 2 was pro-
cessed using 80% PDA pitch and 20% residue for 90
minutes at temperature during blending kept constant at
160�C. In the case of 3C-VG20 blend, the blend propor-
tions were 75% of PDA pitch, 10% of VTB and 15% of
residue, and the process parameters were the temperature
during blending kept constant at 140�C for 60 minutes.
In order to quantify the influence of the addition of VTB
on the range value, the blend data corresponding to VG30
grade of all the crude sources was used. The process
parameters of these blends, both 2C and 3C, were identical
(the temperature during blending kept constant at 140�C for
a duration of 45 minutes). It was observed that the reduc-
tion of the proportion of PDA pitch by 5% and the addition
of VTB by 10% of the total weight of the blend resulted in
an increase in the range value of the 3C blends of crude
source 2 for VG30 grade. However, the range value of 2C-
VG30 blends of crude source 3 and 4 was higher than that
of 2C-VG30 grade blends.
Similar trends were observed in the case of blends of
crude source 3 and 4 for all the viscosity grades. The range
value of 3C blends was observed to be identical to or lower
than that of 2C blends (except for VG40 blend of crude
source 4). Figure 6 (a) and (b) show the comparison of the
blends of crude source 3. Thus, for the blends processed
Table 15. Decision table for paving bitumen.
Sl.
No.
Pitch
(%)
VTB
(%)
Residue
(%)
Temperature
(�C)Duration
(min.)
API
(�)Penetration
(dmm)
Absolute viscosity
(Poise)
Viscosity Grade (IS
73) [3]
1 70 10 20 156 36 31 88 1077 VG10
2 70 10 20 159 72 37 92 851
3 70 17 13 152 47 31 65 2189 VG20
4 70 17 13 140 36 37 67 1839
5 80 10 10 157 44 31 39 4231 VG40
6 80 10 10 143 32 37 39 3900
Table 16. Paving grades of the blends.
Viscosity Grade (IS
73) [3]
Crude
source
Blend
type
Pass/fail temperature (�C)
Range
(�C)Intermediate
Temperature (�C)PG Grade ASTM
2016 [36]Unaged
Short-term
aged
Long-term
aged
VG10 2 2C 58.7 60.3 20.9 37.8 22 PG 58-XX
3C 62.4 61.9 21.2 41.2 22 PG 58-XX
3 2C 61.3 62 19.1 42.2 22 PG 58-XX
3C 62.9 62.8 23.3 39.6 25 PG 58-XX
4 2C 60 61 18.4 41.6 19 PG 58-XX
3C 62 62.6 20.7 41.3 22 PG 58-XX
VG20 2 2C 63.8 65 23.2 40.6 25 PG 64-XX
3C 66.5 64.6 23.7 42.8 25 PG 64-XX
3 2C 65.7 67 22.6 43.1 25 PG 64-XX
3C 66.9 65.7 24 42.9 25 PG 64-XX
4 2C 63.4 63.6 20.4 43 22 PG 64-XX
3C 62.5 65.5 22.6 39.9 25 PG 64-XX
VG30 2 2C 67.2 66.3 25.8 41.4 28 PG 64-XX
3C 69.7 67.9 26.9 42.8 28 PG 64-XX
3 2C 68.6 69 24 44.6 25 PG 64-XX
3C 69.6 68.6 26.8 42.8 28 PG 64-XX
4 2C 67.9 66.3 20.4 47.5 22 PG 64-XX
3C 68.2 68.3 26.6 41.6 28 PG 64-XX
VG40 2 2C 69.4 72.3 26 43.4 28 PG 70-XX
3C 72.2 68.9 27.6 44.6 28 PG 70-XX
3 2C 69.8 71 25.8 44 28 PG 70-XX
3C 71.1 71.1 27 44.1 28 PG 64-XX
4 2C 69.6 68.7 27.3 42.3 28 PG 70-XX
3C 70.7 69.5 25.6 45.1 28 PG 64-XX
Sådhanå (2020) 45:48 Page 13 of 16 48

using constituents from the lighter crudes, the addition of
VTB would increase the range value. In the case of blends
processed using constituents from heavier crudes (API
\35�) the appropriate choice of process parameters and the
blend proportions would result in higher range values.
The performance grades are specified based on the
pass/fail temperatures at short term aged and long-term
aged condition. For instance, consider two constituent
blend of crude source 2, VG10 sample (VG10-2C). The
highest pass temperature for VG10-2C at short-term aged
condition is 58�C and that in the long-term aged condition
is 22�C (see table 16). Hence, the PG grade would be
designated as PG 58-XX. From the PG data, it was also
observed that the blends (both 2C and 3C) of crude source
2, have similar high and intermediate temperature grades
for all the viscosity grades. The VG10 blends of all the
crude sources had the same high-temperature performance
grade of PG 58-XX. Similarly, the VG20 and VG30 grades
correspond to a high-temperature grade of PG 64-XX (see
table 16). This observation is in agreement with the trend
observed in the simulation of process parameters discussed
earlier that the blend proportions used to produce VG20
binder could be used to produce a VG30 binder. Using the
same analogy, the blend proportions of VG10 could be used
to process only VG10 grade binders, and the blend pro-
portions of VG30 could be used to process both VG30 and
VG40 grades. However, such trends were not observed for
the blends of VG40 grade. The high-temperature grade of
3C-VG40 blends of crude source 3 and 4 was PG 64-XX,
which is similar to that of VG20 and VG30 grade blends
(see table 16).
The correspondence of two different grading systems
(performance and viscosity based) was established using
the study. The blend parameters used to process viscosity
based blended bitumen can be used to process blended
Figure 5. Comparison of blends - Crude source 2.
Figure 6. Comparison of blends - Crude source 3.
48 Page 14 of 16 Sådhanå (2020) 45:48

bitumen complying to performance grade. However, in
such cases, the blending scheme proposed in the study
would require minor refinements.
5. Summary and discussion
This study facilitated in developing a blending
scheme for viscosity grade binders. The blend formula-
tions for all the four viscosity grades VG10, VG20,
VG30, and VG40 as per IS 73 [3], were carried out in
the laboratory facility. The blended bitumen data was
used in an optimal combined design developed using the
design of experiments framework. A Scheffe’s reduced
linear polynomial function was fit to penetration and
viscosity of the blends to develop a prediction model
using the blended bitumen data. The parameters of the
prediction models were the blend proportions, the process
parameters and API gravity of the parent crude. The
penetration and viscosity of the blends were estimated
using the model and compared with the experimental
data. The variations between the estimated and measured
values were quantified using the error estimate (MAPE),
and it was found to be 10.1% for penetration model and
10.2% for viscosity model.
The prediction models were used to estimate the feasi-
bility of processing bitumen of different viscosity grades
using identical blend proportions. The simulation of the
process parameters helped in identifying that the blend
proportions are unique for a particular viscosity grade. It
was observed that using blend proportions of lower vis-
cosity grades, higher viscosity grade blends could be pro-
cessed (an exception to this being blends of VG10 grade).
From performance grades of the blends, it was observed
that the blend of a particular viscosity grade corresponds to
a high-temperature performance grade. The blends of vis-
cosity grade VG10 corresponds to the high-temperature
performance grade PG 58-XX. The high-temperature
grades of VG20 and VG30 grade blends were observed to
be the same, which was PG 64-XX. In the case of VG40
blends, the performance grades were PG 70-XX and PG
64-XX. The correspondence of the viscosity grades to the
performance grades was observed. Such observations
indicate the amenability of using the viscosity grade-based
blending scheme for processing paving bitumen as per the
performance grade specifications.
The influence of API gravity of the parent crude and
proportion of VTB on the blend parameters was charac-
terized, and it could be used as a yardstick for making the
appropriate choice of the blend parameters. The process
parameters of the blends were observed to vary with the
proportion of VTB and such variations are influenced by
the API gravity of the parent crude. It is, however, essential
to understand that the blend parameters are interdependent
and individual effects of each of the parameters on the
penetration and viscosity of the blends have to be
adequately quantified. The experimental database devel-
oped as part of this investigation could be used for under-
standing such influence of each of the process parameters
on the response variables. The characterization of these
influences is essential to refine the existing blending
schemes for its application in the refineries to obtain paving
bitumen of better quality.
References
[1] Reashma P S, Nivitha M R, Veeraragavan A and Krishnan J
M 2017 Development of Unmodified Binder Specifications
for India. J. Assoc. Asph. Paving Technol. 83: 653–669
[2] Reashma P S, Nivitha M R, Veeraragavan A, Sikdar P K and
Krishnan J M 2017 Development of Unmodified Binder
Specifications for India. Transp. Dev. Econ. 3 (2): 12. https://
doi.org/10.1007/s40890-017-0041-1
[3] IS 73 2013 Standard specifications for paving bitumen.
Fourth revision. Bureau of Indian standards, New Delhi,
India
[4] Singh H and Jain P K 1997 Bitumen quality and manufac-
turing processes-past and present technological status. Indian
J. Chem. Technol. 4: 259–276
[5] Rajan N K, Selvavathi V, Sairam B and Krishnan J M 2008
Rheological characterization of blended paving asphalt.
Road Mater. Pavement Des. 9: 67–86
[6] Corbett L W 1984 Refinery processing of asphalt cement.
Transp. Res. Rec. 999: 1–6
[7] Lopatskii A Y 1966 Graphical-analytical method of deter-
mining the softening point of bitumen mixtures. Chem.
Technol. Fuels Oils 2: 802–804
[8] Gun R B and Biryulina T G 1969 Compounded road
asphalts. Chem. Technol. Fuels Oils 5: 707–711
[9] Lopatinskii V A and Lopatinskii A Y 1970 Nomogram for
determining softening temperatures of asphalt blends. Chem.
Technol. Fuels Oils 6: 953–954
[10] Akhmetova R S and Glozman E P 1974 Methods of selecting
raw material composition for asphalt production. Chem.
Technol. Fuels Oils 10: 619–622
[11] Tabolina L S, Posadov I A, Rozental D A and Vinogradov M
V 1982 Dependence of asphalt softening point on its
component composition. Chemi. Technol. Fuels Oils 18:
45–48
[12] Ishai I and Tuffour Y A 1987 The use of propane-
precipitated asphalt (PPA) in bituminous paving mixtures
(with discussion). Assoc. Asph. Paving Technol. Proc. 56:
599–631
[13] Ishai I 1995 Long-term laboratory and field behavior of PPA
asphalt cement blends. J. Assoc. Asph. Paving Technol. 64:
306–339
[14] Ishai I and Yuval R 2002 Reformulation of asphalt cements
for paving. J. Transp. Eng. 128: 111– 122
[15] Chaffin J M, Davison R R, Glover C J and Bullin J A 1995
Viscosity mixing rules for asphalt recycling. Transp. Res.
Rec. 1507: 78–85
[16] Soleymani H R, Bahia H U and Bergan A T 1999 Blending
charts based on performance-graded asphalt binder specifi-
cation. Transp. Res. Rec.. 1661: 7–14
Sådhanå (2020) 45:48 Page 15 of 16 48

[17] Ermak A A, Tkachev S M, Khoroshko S I, Yakubyak V M,
Kadunin V M and Trofimov S A 2005 Production of
compounded asphalts of improved quality. Chem. Technol.
Fuels Oils 41: 486–490
[18] Pustynnikov A Y, Ryabov VG, Kalimullin D T, Nechaev A N
and Treskov A Y 2006 Production of compounded asphalts of
improved quality. Chem. Technol. Fuels Oils 42: 188–191
[19] Centeno G, Sanchez-Reyna G, Ancheyta J, Munoz J A D and
Cardona N 2011 Testing various mixing rules for calculation
of viscosity of petroleum blends. Fuel 90: 3561–3570
[20] Chakkoth U, Ravindran P and Krishnan J M 2017 Influence of
viscosities of PDA pitch and flux on blended bitumen viscosity.
In: Airfield and highway pavements 2017, pp. 225–235
[21] Anderson M J and Whitcomb P J 2002 Mixture DoE
uncovers formulations quicker. Rubber Plastics News 21:
16–18
[22] Bressi S, Pittet M, Dumont A G and Partl M N 2016 A
frame-work for characterizing RAP clustering in asphalt
concrete mixtures. Constr. Build. Mater. 106: 564–574
[23] Chavez-Valencia L E, Manzano-Ramirez A, Luna-Barcenas
G, and Alonso-Guzman E 2005 Modelling of the perfor-
mance of asphalt pavement using response surface method-
ology. Build. Environ. 40: 1140–1149
[24] Hamzah M O, Golchin B, and Tye C T 2013 Determination
of the optimum binder content of warm mix asphalt
incorporating Rediset using response surface method. Con-
str. Build. Mater.. 47: 1328–1336
[25] Varanda C, Portugal I, Ribeiro J, Silva A M S and Silva C M
2017 Optimization of bitumen formulations using mixture
design of experiments (MDoE). Constr. Build. Mater. 156:
611–620
[26] Rakow M S 2003 Petroleum oil refining. In: Fuels and
lubricants handbook: technology, properties, performance,
and testing. West Conshohocken, PA: ASTM International,
pp. 3–30
[27] ASTM 2015 Standard Test Method for Viscosity Determi-
nation of Asphalt at Elevated Temperatures Using a
Rotational Viscometer. D4402 / D4402M-15. ASTM Inter-
national, West Conshohocken, PA
[28] IP 469 2001 Determination of saturated, aromatic and polar
compounds in petroleum products by thin layer chromatog-
raphy and flame ionization detection. Energy Institute
(formerly Institute of Petroleum), London, UK
[29] Design-Expert 11 2017 Minneapolis, MN, USA. Stat-Ease,
Inc.
[30] Myers R H, Montgomery D C and Anderson-Cook C M 2016
Response surface methodology: process and product opti-
mization using designed experiments. Fourth Edition, USA:
John Wiley and Sons, pp. 767–778
[31] Jeirani Z, Jan B M, Ali B S, Noor I M, Hwa S C and
Saphanuchart W 2012 The optimal mixture design of
experiments: Alternative method in optimizing the aqueous
phase composition of a microemulsion. Chemomet. Intell.
Lab. Syst. 112: 1–7
[32] Piepel G F, Szychowski J M and Loeppky J L 2002
Augmenting Scheffe’ linear mixture models with squared
and/or crossproduct terms. J. Qual. Technol. 34: 297–314
[33] Azharul Islam Md, Nikoloutsou Z, Sakkas V, Papatheodorou
M and Albanis T 2010 Statistical optimisation by combina-
tion of response surface methodology and desirability
function for removal of azo dye from aqueous solution. Int.
J. Environ. Anal. Chem. 90: 497–509
[34] Bahia H U and Anderson D A 1995 The new proposed
rheological properties of asphalt binders: Why are they
required and how do they compare to conventional proper-
ties. In: Physical properties of asphalt cement binders. ASTM
Spec. Techn. Publ., 1241: 1–27
[35] Oliver J, Christina C and Peter W 2008 The results of testing
overseas bitumen. Technical Report AP-T110/08, Austroads,
Sydney
[36] ASTM 2016 Standard Test Method for Viscosity Determi-
nation of Asphalt at Elevated Temperatures Using a
Rotational Viscometer. D6373-16. ASTM International,
West Conshohocken, PA
48 Page 16 of 16 Sådhanå (2020) 45:48