Embed Size (px)
Citation preview

COMPONENT ANALYSIS USING MULTIVARIATE CUMULANTS
JAN DE LEEUW AND IRINA KUKUYEVA
Abstract. This paper discusses several different algorithms
to fit linear component analysis approximations to multivari-
ate data matrices. Our algorithms fit multiway models of the
Harshman-Carroll or Tucker type to symmetric arrays of cumu-
lants. We cover both orthogonal and independent component
and factor analysis, while allowing for simple linear constraints
on the coefficients of the linear combinations.
1. Introduction
In component analysis we assume that an observed vector of ran-
dom variables y is a function of a number of unobserved random
variables x. Note that we use the “Dutch Convention” of under-
lining random variables [Hemelrijk, 1966]. Also note that we are
guilty of abuse of language: there is no such thing in the real world
as an “observed random variable”. Calculations with random vari-
ables take place in the world of mathematics, although of course
they can be used to motivate or justify actual calculations with
floating point numbers.
The most common forms of component analysis can be exhibited
in a small 3 × 3 table. The rows correspond with the nature of
Date: Tuesday 1st January, 2013 — 9h 53min — Typeset in Lucida Bright.1

2 JAN DE LEEUW AND IRINA KUKUYEVA
the functional relation between x and y. The columns specify addi-
tional assumed relationships between the different components in
x.
unrestricted orthogonal independent
linear LUCA LOCA LICA
polynomial PUCA POCA PICA
nonlinear NUCA NOCA NICA
Classic component analysis concentrates on linear relationships,
i.e. LUCA, LOCA, and LICA. If we assume the x are joint multi-
normal, then LOCA and LICA are identical. LUCA and LOCA are
basically the same, because we can assume without loss of gen-
erality that the components are orthogonal. The only constraint
imposed by the models is the number of components p, which will
generally be less than the number of variables m.
Both LICA and POCA must be considered computationally conve-
nient approximations to more sensible forms of CA. If we give up
the assumption of normality then there is not much reason to con-
tinue to assume either linearity or orthogonality. Without normal-
ity PICA is more natural, either as separate technique or as an ap-
proximation of NICA.
In this paper we will concentrate on LICA without assuming that
the x are normal. Thus we assume there are m random variables
yj which are linear combinations of p independent components
xs . . There is an p ×m matrix of loadings B such that
(1) yj =p∑s=1
bjsxs .
We do not assume anything about the relative size of p and m,
either one of the two can be the larger one.
COMPONENT ANALYSIS USING MULTIVARIATE CUMULANTS 3
If Y is an n×m data matrix with rows that are, supposedly, inde-
pendent realizations of (y1, · · · , ym), then the problem we study
is how to recover B and/or X from the data.
1.1. Constraints. There can be various simple constraints on B in
our framework. We can, for instance, fix some elements to zero,
require all elements to be non-negative, or require that some el-
ements are equal. In all of these cases the constraints on B are
typically linear.
There is an enormous psychometric and statistical literature dis-
cussing the differences between Principal Component Analysis (PCA)
and Factor Analysis (FA). In our framework, both PCA and FA are
simply special cases of LUCA. In FA there are constraints on B. We
have p > m and bjs = 0 if p+1 ≤ s ≤m and s 6= j. In confirmatory
FA there are additional constraints on B.
In some forms of CA we do not require independence or even or-
thogonality. In psychometric parlance [Kroonenberg, 2008] this
leads to Tucker approximation with a non-diagonal core, and to a
different classes of loss functions and algorithms. The resulting
technique has been discussed recently by Morton and Lim [2009],
also see Lim and Morton [2008], as Principal Cumulant Component
Analysis.
1.2. Loss. In De Leeuw and Sorenson [2012] we follow De Leeuw
[2004, 2008] and directly approximate the data matrix, using the
least squares loss function SSQ(Y − F(X)B), with orthogonality
constraints X′X = I. It is much more difficult, however, to directly
impose independence constraints on X, because independence is
defined, in principle at least, by an infinite number of constraints.
As a consequence, in this paper we do not fit our model to the data
directly, but, as in the most common implementations of compo-
nent and factor analysis, we fit data to the multivariate product mo-
ments, more precisely the multivariate cumulants. An interesting

4 JAN DE LEEUW AND IRINA KUKUYEVA
alternative that we do not explicitly consider in this paper would
be to use the multivariate empirical characteristic function, in dis-
cussed in a related context by Van Montfort and De Leeuw [2004].
If we use moments or cumulants we integrate out the mode corre-
sponding with observations or replications, and consequently we
are left with a loss function that does not involve X any more. Loss
is just a function of the component loadings and the cumulants of
the latent variables. There is a large and confusing psychometric
literature on factor scores that “cannot be computed but must be
estimated”. For our purposes it is sufficient to either generate a set
of independent random numbers with the estimated cumulants, or
to approximate the conditional expectation of the latent variables
given the observed ones.
1.3. Matrix and Array Approximation. In much recent work on
CA the multidimensional arrays of product moments and cumu-
lants are referred to as tensors. There is something to be said for
using tensor notation and terminology in this context, especially
when dealing with multivariate cumulants. See, for example Mc-
Cullagh [1984, 1987]; Peccati and Taqqu [2011]. For our purposes,
however, tensors are overkill. We discuss algorithms to approx-
imate matrices and arrays of statistics by parametrized matrices
and arrays of simpler form.For computational purposes, especially
with programs in R in mind, the arrays are simply vectors of double
precision numbers with a dimension attribute.
A great deal of effort has also gone into developing specialized no-
tation to deal with approximation multidimensional arrays. Again,
we see this as largely irrelevant from the computational point of
view. At some point the various notational constructs correspond
with loops over vectors of indices, and the loops have to be taken
care of, either internally by vectorized R operators or by explicit R
programming. What we are basically suggesting is that the R pro-
gram itself provides the appropriate notation in this case.

COMPONENT ANALYSIS USING MULTIVARIATE CUMULANTS 5
2. Linear Independent Component Analysis
Suppose Jmr is the set of all r−tuples of integers between 1 and
m. There are mr such tuples, and the elements of a particular
J ∈ Jmr are not necessarily distinct. For any J ∈ Jmr we have the
multivariate cumulant
(2) κ(J) =p∑s=1
κrs∏j∈Jbjs ,
with κrs the univariate cumulant of xs of order r .
2.1. Loss Function. We minimize the loss function
(3) σ(B,K) =r∑r=1
αr∑J∈Jr
κ(J)− p∑s=1
κrs∏j∈Jbjs
2
.
Here the αr are r given non-negative weights adding up to one,
and the κ(J) are the observed or estimated multivariate cumulants.
Thus we measure loss only for cumulants up to order r . The uni-
variate cumulants κrs are collected in a matrix K with r rows and
p columns.
It is convenient to collect the κ(J) in an r−dimensional m ×m ×· · · ×m array. The multivariate cumulants define arrays of in-
creasing dimensionality, and each of the arrays is approximated
by a symmetric array with diagonal core structure. Using such a
restrictive parametrization makes it possible to extract more di-
mensions than variables, especially with additional constraints on
the loadings.
It is tempting to choose all αr , except one, equal to zero. For in-
stance, we can fit the third-order cross cumulants only. But we
have to realize that this will not work for symmetric distributions,
in which third-order cumulants are zero. It will not work very well
if the distributions are approximately symmetric, because devia-
tions from symmetry may just be sampling errors. This suggests it

6 JAN DE LEEUW AND IRINA KUKUYEVA
is important to include the loss component with second order cu-
mulants (variances and covariances) with a fairly large weight αr ,so that at least variances and covariances will be fitted well.
2.1.1. Projected Loss. Define
K(B) ∆=argminK
σ(B,K),
and
σ?(B)∆=min
Kσ(B,K) = σ(B,K(B)).
This is the projected loss, which now is a function only of B.
For the derivatives we find, by a simple special case of Danskin
[1966],
Dσ?(B) = D1σ(B,K(B))
For row r of K(B) we find
κr (B) =(C[r]
)−1d[r]
( where C[r] is the r -th elementwise or Hadamard power of C = B′Band the vector d[r] has elements
d[r]s =∑J∈Jr
κ(J)∏j∈Jbjs
2.2. Generating Data. In section A of the appendix we give R code
to generate data according to the LICA model. We use standard
normal pseudo-random numbers to create X, but we power them
to give them non-vanishing third and fourth order cumulants.
1 arti <- make_artificial (n = 1000, m = 9, p = 4,
pow = 2)
2 cumu <- make_cumulants (arti $ y)
If p < m the make_artificial() function creates a column-centered
X such that X′X = nI and B such that B′B = I. Thus Y = XB′ is
column-centered and satisfies 1nY
′Y = BB′, i.e. the covariance ma-
trix of Y is a projector of rank p.

COMPONENT ANALYSIS USING MULTIVARIATE CUMULANTS 7
If err = TRUE then make_artificial() creates an X with p +mcolumns and anm×(p+m)matrix B of the form B = [C | D], with
C′C = I and D diagonal. We will not use these data with common
and unique components in this paper.
3. Algorithms
3.1. Alternating Least Squares. Consider the case in which we are
fitting cumulants of order three only. The loss function is
(4) σ(B) =m∑j=1
m∑`=1
m∑ν=1
κj`ν − p∑s=1
bjsb`sbνs
2
,
where we have absorbed the univariate cumulants κ3s in B. In sim-
ple ALS we minimize instead
(5) σ(A,B, F) =m∑j=1
m∑`=1
m∑ν=1
κj`ν − p∑s=1
ajsb`sfνs
2
,
i.e. we ignore the symmetry and minimize (5) by three linear least
squares block relaxation steps. Define iteration k by
A(k) = argminA
σ(A,B(k), F (k)),(6a)
B(k) = argminB
σ(A(k), B, F (k)),(6b)
F (k) = argminC
σ(A(k), B(k), F).(6c)
This is the CANDECOMP algorithm of Carroll and Chang [1970],
applied to the symmetric third-order array of cumulants. One
would then expect the update A(k+1) = A(k), B(k+1) = B(k), and
F (k+1) = F (k). This produces a monotone convergent algorithm
with at least one subsequential limit (A∞, B∞, F∞), but there is no
guarantee that A∞ = B∞ = F∞. Some results in the context of IND-
SCAL are in Bennani Dosse and Ten Berge [2008]; Ten Berge et al.
[2009].
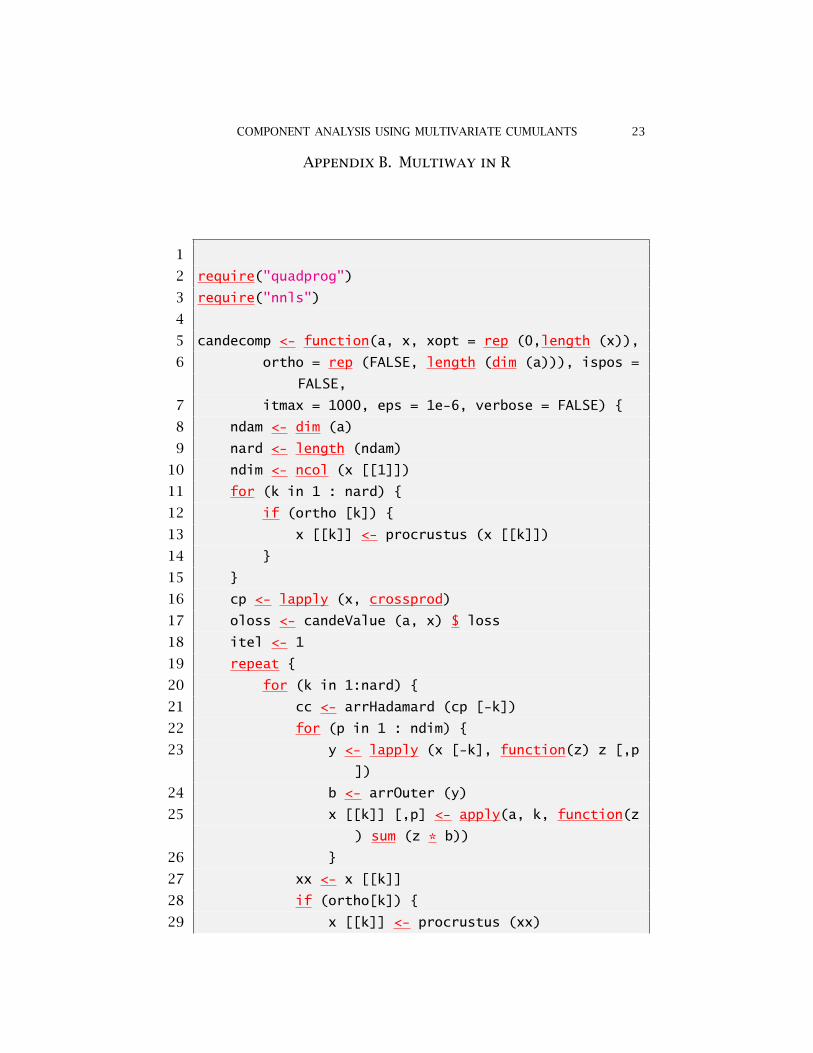
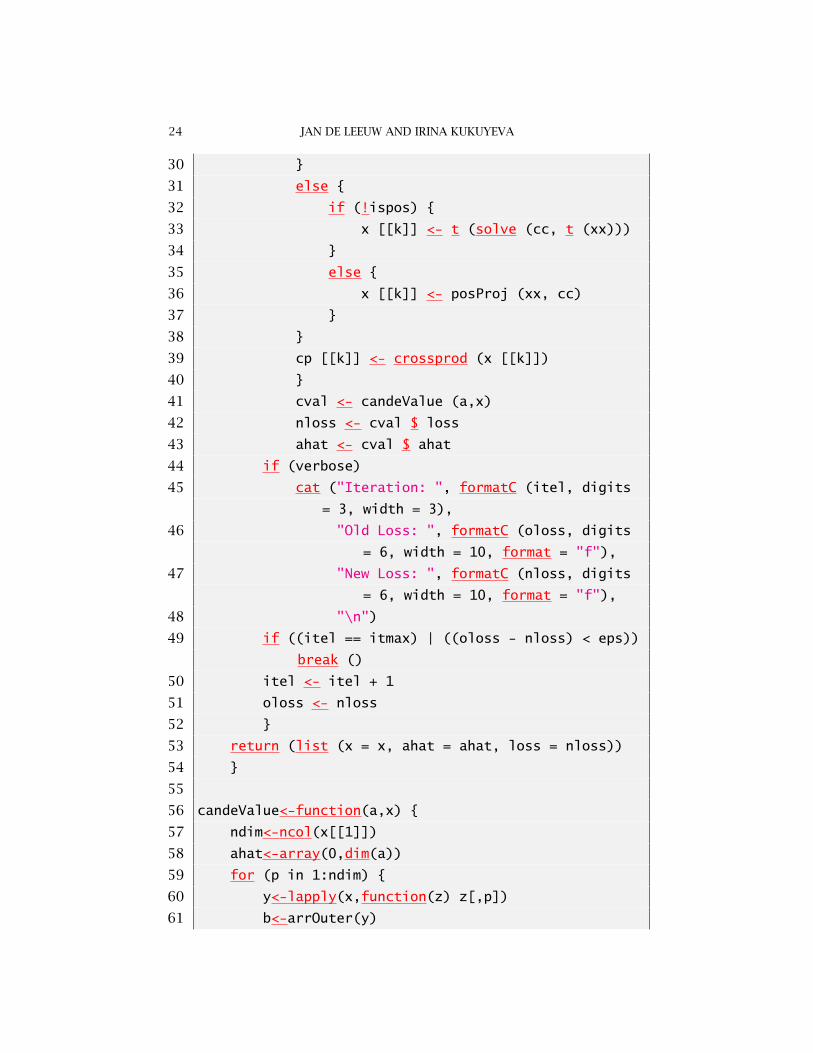
Appendix B gives R code implementing the CANDECOMP algorithm
for arrays of arbitrary order. The code allows for options in which

8 JAN DE LEEUW AND IRINA KUKUYEVA
we can require B to be either non-negative or orthonormal, but for
now we will not use these constraints.
Appendix E gives an alternative implementation of the CANDE-
COMP algorithm which use the apl package [De Leeuw and Yajima,
2011]. It is faster, because the basic functions in apl are written in
C.
3.1.1. Symmetrizing Iterations. If the CANDECOMP algorithm from
the previous section does not converge to a solution with all com-
ponent matrices equal, then we can try to use (6) in combination
with
(7) A(k+1) = B(k+1) = F (k+1) = (A(k) + B(k) + F (k))/3.
Because (7) is a projection, this symmetrized CANDECOMP algo-
rithm is still locally convergent to a fixed point, but monotone and
global convergence is no longer guaranteed.
3.2. Index Partitioning. One solution to the symmetry dilemma
of CANDECOMP is to partition the index set J = {1, · · · ,m} into
three subsets J1, J2, and J3 and to minimize
(8) σ(A,B, F) =∑j∈J1
∑`∈J2
∑ν∈J3
κj`ν − p∑s=1
ajsb`sfνs
2
.
After convergence we concatenate (A∞, B∞, F∞) to find the solution
for B.
The problem with this approach is, of course, that there are many
ways to partition J , and each partition will lead to a different solu-
tion (unless there is perfect fit).
3.3. Cyclic Coordinate Descent. Suppose we replace bjs by bjs =bjs + θδjµδst, i.e. we leave B as is, but only change element (µ, t).In the case of fitting third-order cumulants we see from (4) that
the optimal θ can be found by minimizing a polynomial of degree
six, i.e. by finding the real roots of a polynomial of degree five.
COMPONENT ANALYSIS USING MULTIVARIATE CUMULANTS 9
For fourth-order cumulants the polynomial to minimize will be of
degree eight, and so on.
We cycle through all coordinates, using efficient solvers for finding
roots of polynomials. It is important for this algorithm to effi-
ciently update the relevant quantities after computing each coor-
dinate change.
The CCD method has the advantage that it can easily handle fitting
second, third, and fourth order cumulants simultaneously. This is
more difficult to do with the ALS methods.
3.4. Two-step methods. For the second order cumulants we have,
assuming without loss of generality that the components have unit
variance, S = BB′, where S is the covariance matrix. If the eigen
decomposition of S is S = KΛ2K′, then it follows that B = KΛL′,where L is an p×m orthonormal matrix (remember that we do not
exclude the case p > m). The orthonormal matrix L can then be
determined from the higher order cumulants. This is similar to the
SIMSCAL method of De Leeuw and Pruzansky [1978].
Again, consider the case in which we fit third-order cumulants. We
use the second order information to reduce the size of the problem
and then use CANDECOMP with orthogonality restrictions to find
the optimal rotation. There are some results on INDORT, i.e. or-
thogonal CANDECOMP in the INDSCAL context, in [Bennani Dosse
et al., 2011].
It may be of some interest that this method can be used as a rota-
tion technique for principal component analysis, using the higher
order cumulants to rotate to maximum independence. Also note
that this is equivalent to minimizing loss function (3) in the limit-
ing case in which α2 is infinitely large compared to the other αr .
3.5. General Purpose Optimization Methods. R has a variety of
add-on packages with optimization routines. A good overview,
10 JAN DE LEEUW AND IRINA KUKUYEVA
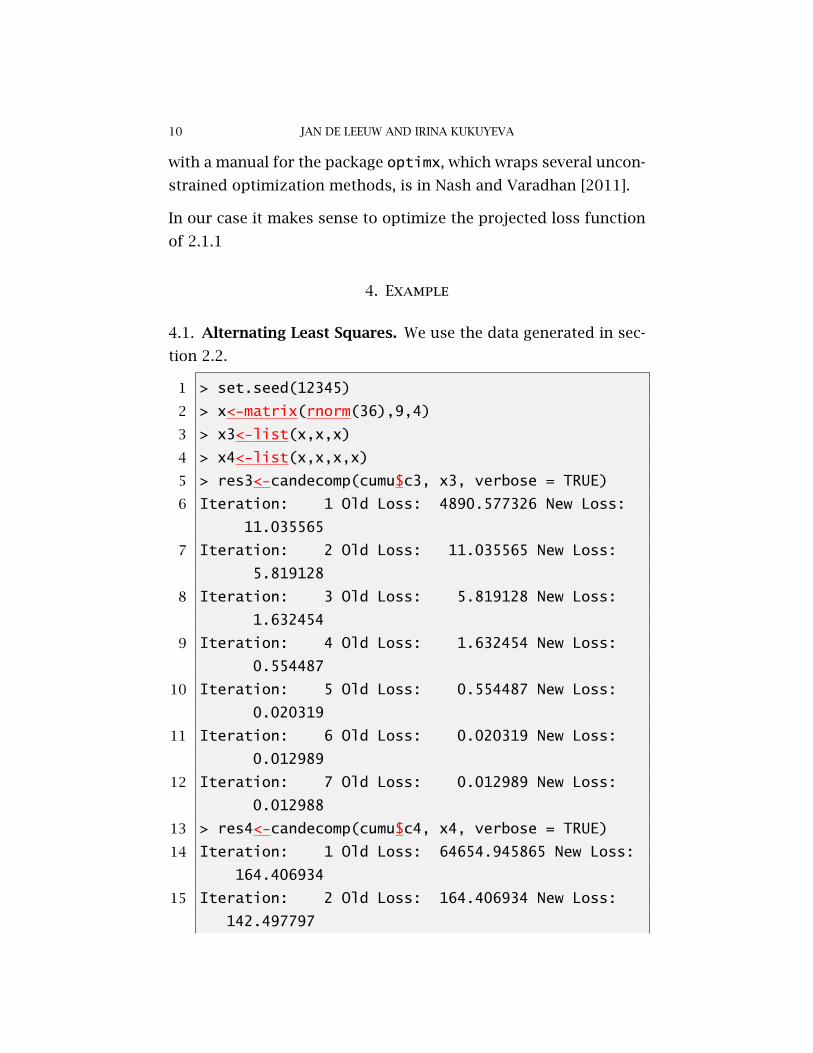
with a manual for the package optimx, which wraps several uncon-
strained optimization methods, is in Nash and Varadhan [2011].
In our case it makes sense to optimize the projected loss function
of 2.1.1
4. Example
4.1. Alternating Least Squares. We use the data generated in sec-
tion 2.2.
1 > set.seed(12345)
2 > x<-matrix(rnorm(36),9,4)
3 > x3<-list(x,x,x)
4 > x4<-list(x,x,x,x)
5 > res3<-candecomp(cumu$c3, x3, verbose = TRUE)
6 Iteration: 1 Old Loss: 4890.577326 New Loss:
11.035565
7 Iteration: 2 Old Loss: 11.035565 New Loss:
5.819128
8 Iteration: 3 Old Loss: 5.819128 New Loss:
1.632454
9 Iteration: 4 Old Loss: 1.632454 New Loss:
0.554487
10 Iteration: 5 Old Loss: 0.554487 New Loss:
0.020319
11 Iteration: 6 Old Loss: 0.020319 New Loss:
0.012989
12 Iteration: 7 Old Loss: 0.012989 New Loss:
0.012988
13 > res4<-candecomp(cumu$c4, x4, verbose = TRUE)
14 Iteration: 1 Old Loss: 64654.945865 New Loss:
164.406934
15 Iteration: 2 Old Loss: 164.406934 New Loss:
142.497797

COMPONENT ANALYSIS USING MULTIVARIATE CUMULANTS 11
16 Iteration: 3 Old Loss: 142.497797 New Loss:
13.202225
17 Iteration: 4 Old Loss: 13.202225 New Loss:
2.182829
18 Iteration: 5 Old Loss: 2.182829 New Loss:
2.179922
19 Iteration: 6 Old Loss: 2.179922 New Loss:
2.179921
20 Iteration: 7 Old Loss: 2.179921 New Loss:
2.179921
If B is the estimate of B, and B is the true B used to compute
the data, then we can find out how well we recover the solution
by computing the matrix (B′B)−1B′B(B′B)−1B′B, which should be
equal to the identity. In R this becomes simply
1 qr.solve(res3$x[[1]], arti$b) %*% qr.solve (arti$b
, res3$x[[1]])
and similarly for the other two solutions in res3 and the four solu-
tions in res4. We do find identity matrices, which also implies that
all solutions for B are identical and there is no need to symmetrize
the CANDECOMP iterations.
If we fit the four-dimensional data using only two-dimensions we
find
1 > set.seed(12345)
2 > x<-matrix(rnorm(18),9,2)
3 > x3<-list(x,x,x)
4 > res3<-candecomp(cumu$c3, x3, verbose = TRUE)
5 Iteration: 1 Old Loss: 484.866406 New Loss:
16.830996
6 Iteration: 2 Old Loss: 16.830996 New Loss:
14.562874

12 JAN DE LEEUW AND IRINA KUKUYEVA
7 Iteration: 3 Old Loss: 14.562874 New Loss:
14.558700
8 Iteration: 4 Old Loss: 14.558700 New Loss:
14.558699
9 Iteration: 5 Old Loss: 14.558699 New Loss:
14.558699
10 > qr.solve(res3$x[[1]], res3$x[[2]]) %*% qr.solve
(res3$x[[2]], res3$x[[1]])
11 [,1] [,2]
12 [1,] 1.000000e+00 2.309441e-16
13 [2,] 2.824184e-15 1.000000e+00
14 > qr.solve(res3$x[[1]], res3$x[[3]]) %*% qr.solve
(res3$x[[3]], res3$x[[1]])
15 [,1] [,2]
16 [1,] 1.000000e+00 3.742154e-16
17 [2,] 4.228399e-15 1.000000e+00
18 > qr.solve(res3$x[[2]], res3$x[[3]]) %*% qr.solve
(res3$x[[3]], res3$x[[2]])
19 [,1] [,2]
20 [1,] 1.000000e+00 2.674211e-18
21 [2,] -2.769133e-17 1.000000e+00
Again there is no need to symmetrize.
4.2. Two-step Method. We first reduce the dimension of the ar-
ray of third-order cumulants by using the nonzero eigenvalues and
corresponding eigenvectors of the second-order cumulants (i.e. the
covariance matrix, which is a projector of rank 4 in this case).
1 red <- array (0, c(4, 4, 4))
2 ev <- eigen (cumu$c2)
3 a <- ev $ vectors [, 1 : 4]
4 b <- sqrt (ev $ values [1 : 4])
5 for (i in 1 : 4) for (j in 1 : 4) for (k in 1 : 4) {
COMPONENT ANALYSIS USING MULTIVARIATE CUMULANTS 13
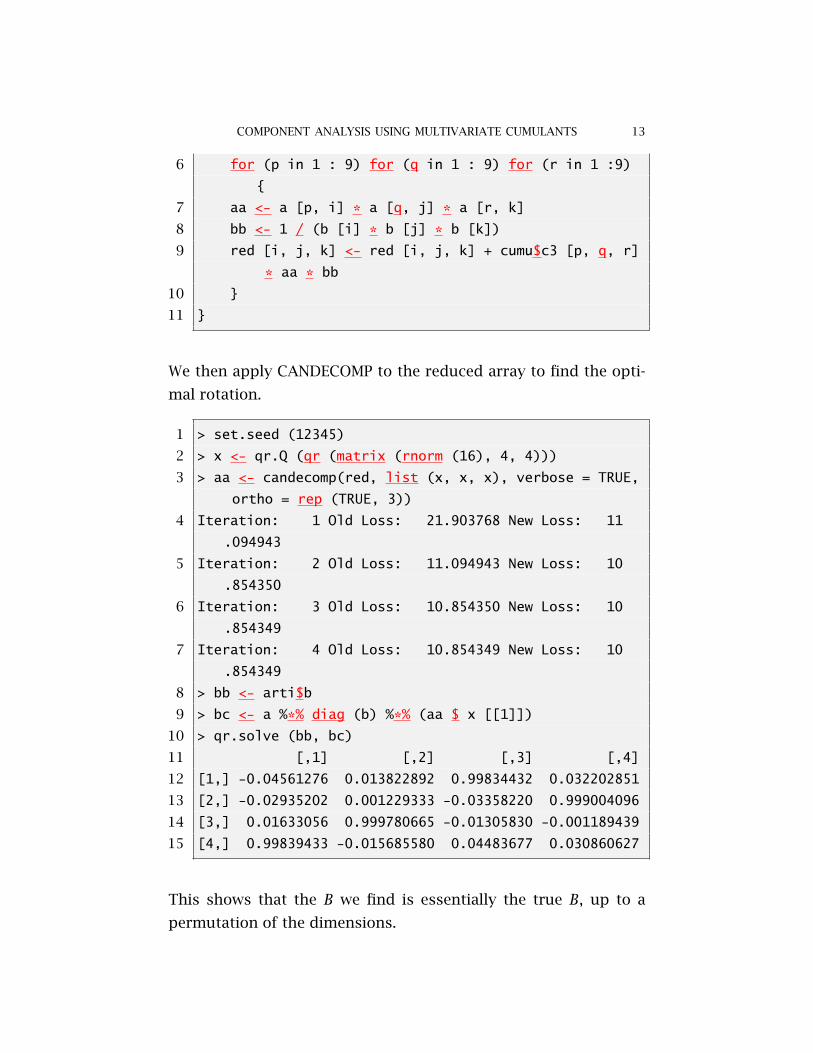
6 for (p in 1 : 9) for (q in 1 : 9) for (r in 1 :9)
{
7 aa <- a [p, i] * a [q, j] * a [r, k]
8 bb <- 1 / (b [i] * b [j] * b [k])
9 red [i, j, k] <- red [i, j, k] + cumu$c3 [p, q, r]
* aa * bb
10 }
11 }
We then apply CANDECOMP to the reduced array to find the opti-
mal rotation.
1 > set.seed (12345)
2 > x <- qr.Q (qr (matrix (rnorm (16), 4, 4)))
3 > aa <- candecomp(red, list (x, x, x), verbose = TRUE,
ortho = rep (TRUE, 3))
4 Iteration: 1 Old Loss: 21.903768 New Loss: 11
.094943
5 Iteration: 2 Old Loss: 11.094943 New Loss: 10
.854350
6 Iteration: 3 Old Loss: 10.854350 New Loss: 10
.854349
7 Iteration: 4 Old Loss: 10.854349 New Loss: 10
.854349
8 > bb <- arti$b
9 > bc <- a %*% diag (b) %*% (aa $ x [[1]])
10 > qr.solve (bb, bc)
11 [,1] [,2] [,3] [,4]
12 [1,] -0.04561276 0.013822892 0.99834432 0.032202851
13 [2,] -0.02935202 0.001229333 -0.03358220 0.999004096
14 [3,] 0.01633056 0.999780665 -0.01305830 -0.001189439
15 [4,] 0.99839433 -0.015685580 0.04483677 0.030860627
This shows that the B we find is essentially the true B, up to a
permutation of the dimensions.

14 JAN DE LEEUW AND IRINA KUKUYEVA
4.3. Cyclic Coordinate Descent. The code in Appendix C can be
used to fit second, third, and/or fourth order cumulants, simulta-
neously or separately. The algorithm can probably be improved a
great deal. What we currently do is compute the loss function at
2R+1 equally spaced points, where R is the highest order cumulant
considered. We then fit a polynomial of degree 2R through these
points, differentiate it, find the roots of the derivative, and use
the real root corresponding with the minimum, using the polynom
package [Venables et al., 2009].
We give three runs, the first fits third-order cumulants, the second
both third-order and fourth-order, and the third just forth-order.
1 > ftf<-candecca(cumu$c2, cumu$c3, cumu$c4, 4, mode = c
(f2 = FALSE, f3 = TRUE, f4 = FALSE), verbose = TRUE
)
2 Iteration: 1 Old Loss: 18.210058 New Loss: 1
.600939
3 Iteration: 2 Old Loss: 1.600939 New Loss: 0
.080718
4 Iteration: 3 Old Loss: 0.080718 New Loss: 0
.016456
5 Iteration: 4 Old Loss: 0.016456 New Loss: 0
.013149
6 Iteration: 5 Old Loss: 0.013149 New Loss: 0
.012995
7 Iteration: 6 Old Loss: 0.012995 New Loss: 0
.012988
8 Iteration: 7 Old Loss: 0.012988 New Loss: 0
.012988
9 > ftt<-candecca(cumu$c2, cumu$c3, cumu$c4, 4, mode = c
(f2 = FALSE, f3 = TRUE, f4 = TRUE), verbose = TRUE)
10 Iteration: 1 Old Loss: 337.030406 New Loss: 83
.236050
11 Iteration: 2 Old Loss: 83.236050 New Loss: 22
.740455

COMPONENT ANALYSIS USING MULTIVARIATE CUMULANTS 15
12 Iteration: 3 Old Loss: 22.740455 New Loss: 2
.742149
13 Iteration: 4 Old Loss: 2.742149 New Loss: 2
.392112
14 Iteration: 5 Old Loss: 2.392112 New Loss: 2
.354895
15 Iteration: 6 Old Loss: 2.354895 New Loss: 2
.349831
16 Iteration: 7 Old Loss: 2.349831 New Loss: 2
.349162
17 Iteration: 8 Old Loss: 2.349162 New Loss: 2
.349079
18 Iteration: 9 Old Loss: 2.349079 New Loss: 2
.349069
19 Iteration: 10 Old Loss: 2.349069 New Loss: 2
.349068
20 Iteration: 11 Old Loss: 2.349068 New Loss: 2
.349068
21 > fft<-candecca(cumu$c2, cumu$c3, cumu$c4, 4, mode = c
(f2 = FALSE, f3 = FALSE, f4 = TRUE), verbose = TRUE
)
22 Iteration: 1 Old Loss: 318.820348 New Loss: 77
.379064
23 Iteration: 2 Old Loss: 77.379064 New Loss: 49
.099478
24 Iteration: 3 Old Loss: 49.099478 New Loss: 3
.016047
25 Iteration: 4 Old Loss: 3.016047 New Loss: 2
.239244
26 Iteration: 5 Old Loss: 2.239244 New Loss: 2
.186204
27 Iteration: 6 Old Loss: 2.186204 New Loss: 2
.180520
28 Iteration: 7 Old Loss: 2.180520 New Loss: 2
.179975
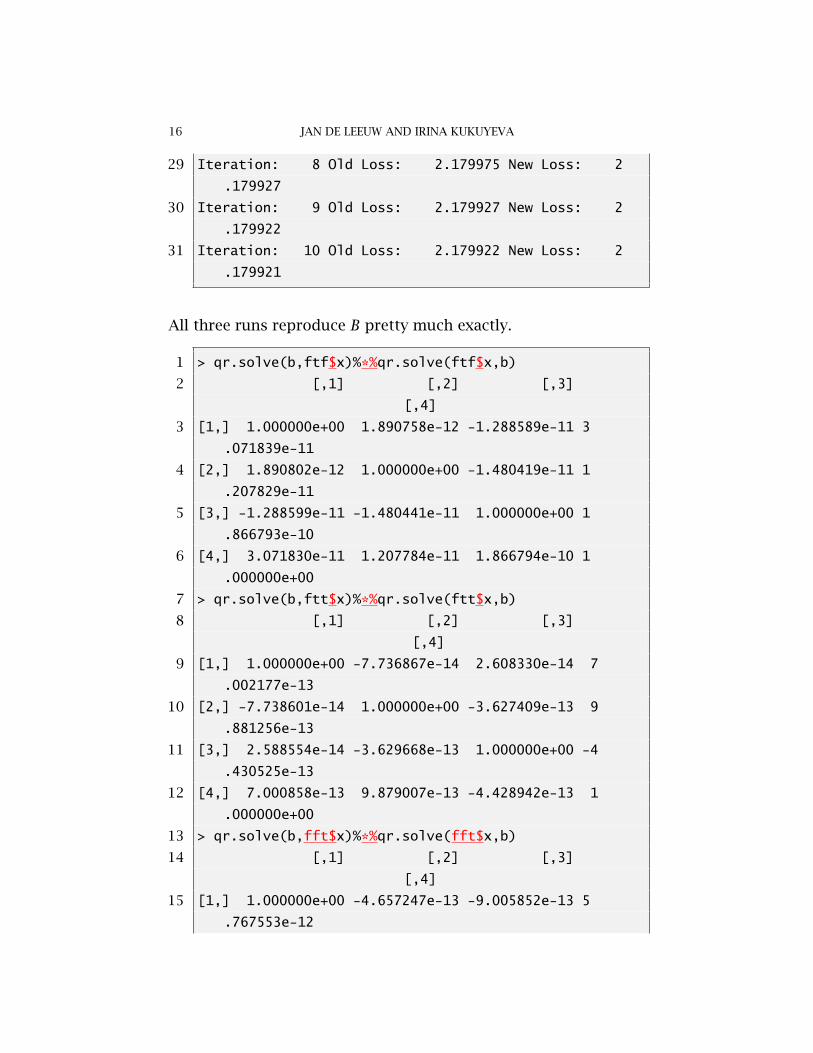
16 JAN DE LEEUW AND IRINA KUKUYEVA
29 Iteration: 8 Old Loss: 2.179975 New Loss: 2
.179927
30 Iteration: 9 Old Loss: 2.179927 New Loss: 2
.179922
31 Iteration: 10 Old Loss: 2.179922 New Loss: 2
.179921
All three runs reproduce B pretty much exactly.
1 > qr.solve(b,ftf$x)%*%qr.solve(ftf$x,b)
2 [,1] [,2] [,3]
[,4]
3 [1,] 1.000000e+00 1.890758e-12 -1.288589e-11 3
.071839e-11
4 [2,] 1.890802e-12 1.000000e+00 -1.480419e-11 1
.207829e-11
5 [3,] -1.288599e-11 -1.480441e-11 1.000000e+00 1
.866793e-10
6 [4,] 3.071830e-11 1.207784e-11 1.866794e-10 1
.000000e+00
7 > qr.solve(b,ftt$x)%*%qr.solve(ftt$x,b)
8 [,1] [,2] [,3]
[,4]
9 [1,] 1.000000e+00 -7.736867e-14 2.608330e-14 7
.002177e-13
10 [2,] -7.738601e-14 1.000000e+00 -3.627409e-13 9
.881256e-13
11 [3,] 2.588554e-14 -3.629668e-13 1.000000e+00 -4
.430525e-13
12 [4,] 7.000858e-13 9.879007e-13 -4.428942e-13 1
.000000e+00
13 > qr.solve(b,fft$x)%*%qr.solve(fft$x,b)
14 [,1] [,2] [,3]
[,4]
15 [1,] 1.000000e+00 -4.657247e-13 -9.005852e-13 5
.767553e-12

COMPONENT ANALYSIS USING MULTIVARIATE CUMULANTS 17
16 [2,] -4.657628e-13 1.000000e+00 4.755735e-13 5
.600477e-12
17 [3,] -9.005071e-13 4.754697e-13 1.000000e+00 7
.356665e-12
18 [4,] 5.767477e-12 5.600118e-12 7.356799e-12 1
.000000e+00
4.4. General Optimization Methods. We use optimx with parame-
ter method="spg". The method finds the same loss function values
as the CCD methods in the previous section. Code is in Appen-
dix D.
4.5. Timing. We give the elapsed time given by system.time()
for the various optimization methods applied to our three different
fits.
Cumulants CANDECOMP CCD OPTIMX
3 0.047 1.392 9.159
3+4 10.458 35.588
4 0.078 7.585 28.679

18 JAN DE LEEUW AND IRINA KUKUYEVA
References
M. Bennani Dosse and J.M.F Ten Berge. The Assumption of Propor-
tional Components when CANDECOMP is Applied to Symmetric
Matrices in the Context of INDSCAL. Psychometrika, 73:303–307,
2008.
M. Bennani Dosse, J.M.F Ten Berge, and J.N. Tendeiro. Some New
Results on Orthogonally Constrained CANDECOMP. Journal of
Classification, 28:144–155, 2011.
J.D. Carroll and J.J. Chang. Analysis of Individual Differences in
Multidimensional Scaling Via an N-way Generalization of Eckart-
Young Decomposition. Psychometrika, pages 283–319, 1970.
J.M. Danskin. The Theory of Max-Min, with Applications. SIAM
Journal on Applied Mathematics, 14:641–664, 1966.
J. De Leeuw. Least Squares Optimal Scaling of Partially Observed
Linear Systems. In K. van Montfort, J. Oud, and A. Satorra,
editors, Recent Developments on Structural Equation Models,
chapter 7. Kluwer Academic Publishers, Dordrecht, Netherlands,
2004. URL http://preprints.stat.ucla.edu/360/lserr.
pdf.
J. De Leeuw. Factor Analysis as Matrix Decomposition. Un-
published, 2008. URL http://www.stat.ucla.edu/~deleeuw/
janspubs/2008/notes/deleeuw_U_08g.pdf.
J. De Leeuw and S. Pruzansky. A New Computational Method to
fit the Weighted Euclidean Distance Model. Psychometrika, 43:
479–490, 1978.
J. De Leeuw and K. K. Sorenson. Least Squares Orthogonal Polyno-
mial Component Analysis in R. Unpublished, 2012.
J. De Leeuw and M. Yajima. apl: APL Array Manipulation Functions,
2011. URL http://R-Forge.R-project.org/projects/apl/.
R package version 0.01-01/r59.
J. Hemelrijk. Underlining Random Variables. Statistica Neerlandica,
20:1–7, 1966.

COMPONENT ANALYSIS USING MULTIVARIATE CUMULANTS 19
P.M. Kroonenberg. Applied Multiway Data Analysis. Wiley Series
in Probability and Statistics. Wiley-Interscience, New York, N.Y.,
2008.
L.-H. Lim and J. Morton. Cumulant Component Analysis: A
Simultaneous Generalization of PCA and ICA. Unpublished,
December 2008. URL http://math.stanford.edu/~jason/
lim-morton-abstract.pdf.
P. McCullagh. Tensor Notation and Cumulants of Polynomials.
Biometrika, 71:461–476, 1984.
P. McCullagh. Tensor Methods in Statistics. Chapman & Hall, Boca
Raton, Florida, 1987.
J. Morton and L.-H. Lim. Principal Cumulant Component Analy-
sis. Unpublished, 2009. URL http://galton.uchicago.edu/
~lekheng/work/pcca.pdf.
J.C. Nash and R. Varadhan. Unifying Optimization Algorithms to
Aid Software System Users: optimx for R. Journal of Statistical
Software, 43(9):1–13, 2011. URL http://www.jstatsoft.org/
v43/i09/paper.
G. Peccati and M.S. Taqqu. Wiener Chaos: Moments, Cumulants and
Diagrams. Springer, Milan, Italy, 2011.
J.M.F Ten Berge, A. Stegeman, and M. Bennani Dosse. The Car-
roll and Chang Conjecture of Equal INDSCAL Components when
CANDECOMP/PARAFAC Gives Perfect Fit. Linear Algebra and Its
Applications, 430:818–829, 2009.
K. Van Montfort and J. De Leeuw. Factor Analysis of Non-Normal
Variables by Fitting Characteristic Functions. Preprint Series
397, UCLA Department of Statistics, Los Angeles, CA, 2004.
URL http://www.stat.ucla.edu/~deleeuw/janspubs/2004/
reports/vanmontfort_deleeuw_R_04.pdf.
B. Venables, K. Hornik, and M. Maechler. polynom: A Collection of
Functions to Implement a Class for Univariate Polynomial Manip-
ulations, 2009. URL http://CRAN.R-project.org/package=
polynom. R package version 1.3-5. S original by Bill Venables,

20 JAN DE LEEUW AND IRINA KUKUYEVA
packages for R by Kurt Hornik and Martin Maechler.

COMPONENT ANALYSIS USING MULTIVARIATE CUMULANTS 21
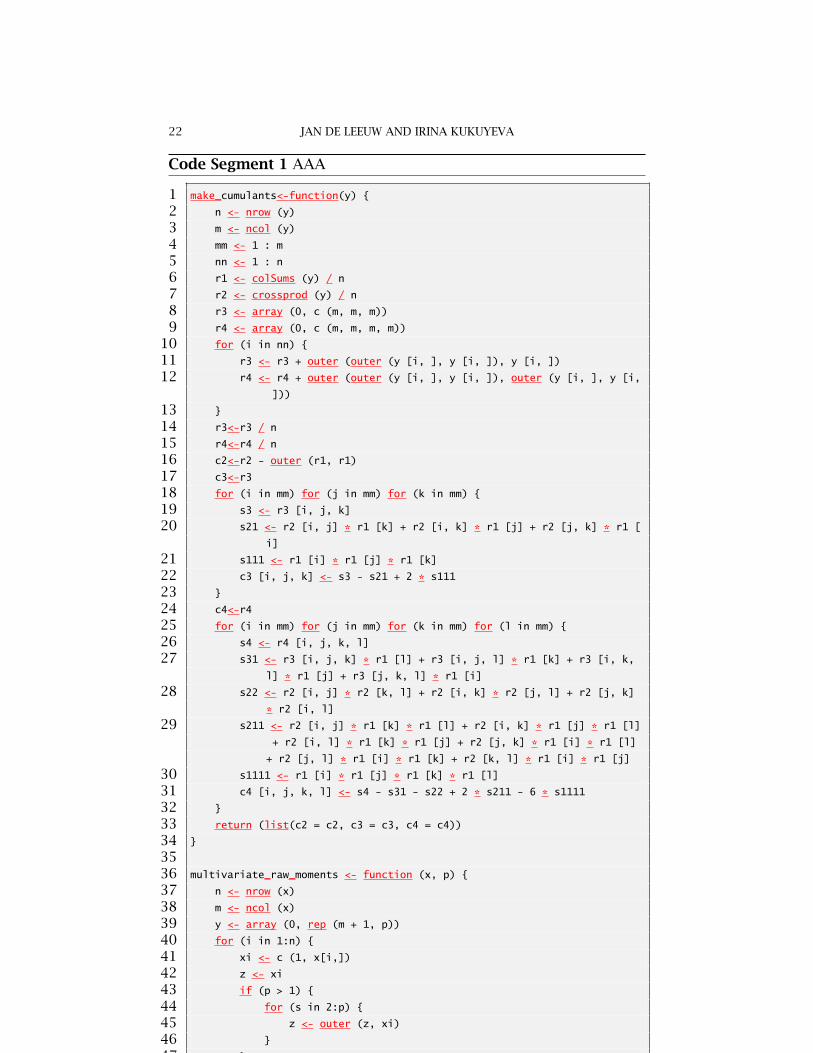
Appendix A. Computing Cumulants
22 JAN DE LEEUW AND IRINA KUKUYEVA
Code Segment 1 AAA
1 make_cumulants<-function(y) {
2 n <- nrow (y)
3 m <- ncol (y)
4 mm <- 1 : m
5 nn <- 1 : n
6 r1 <- colSums (y) / n
7 r2 <- crossprod (y) / n
8 r3 <- array (0, c (m, m, m))
9 r4 <- array (0, c (m, m, m, m))
10 for (i in nn) {
11 r3 <- r3 + outer (outer (y [i, ], y [i, ]), y [i, ])
12 r4 <- r4 + outer (outer (y [i, ], y [i, ]), outer (y [i, ], y [i,
]))
13 }
14 r3<-r3 / n
15 r4<-r4 / n
16 c2<-r2 - outer (r1, r1)
17 c3<-r3
18 for (i in mm) for (j in mm) for (k in mm) {
19 s3 <- r3 [i, j, k]
20 s21 <- r2 [i, j] * r1 [k] + r2 [i, k] * r1 [j] + r2 [j, k] * r1 [
i]
21 s111 <- r1 [i] * r1 [j] * r1 [k]
22 c3 [i, j, k] <- s3 - s21 + 2 * s111
23 }
24 c4<-r4
25 for (i in mm) for (j in mm) for (k in mm) for (l in mm) {
26 s4 <- r4 [i, j, k, l]
27 s31 <- r3 [i, j, k] * r1 [l] + r3 [i, j, l] * r1 [k] + r3 [i, k,
l] * r1 [j] + r3 [j, k, l] * r1 [i]
28 s22 <- r2 [i, j] * r2 [k, l] + r2 [i, k] * r2 [j, l] + r2 [j, k]
* r2 [i, l]
29 s211 <- r2 [i, j] * r1 [k] * r1 [l] + r2 [i, k] * r1 [j] * r1 [l]
+ r2 [i, l] * r1 [k] * r1 [j] + r2 [j, k] * r1 [i] * r1 [l]
+ r2 [j, l] * r1 [i] * r1 [k] + r2 [k, l] * r1 [i] * r1 [j]
30 s1111 <- r1 [i] * r1 [j] * r1 [k] * r1 [l]
31 c4 [i, j, k, l] <- s4 - s31 - s22 + 2 * s211 - 6 * s1111
32 }
33 return (list(c2 = c2, c3 = c3, c4 = c4))
34 }
3536 multivariate_raw_moments <- function (x, p) {
37 n <- nrow (x)
38 m <- ncol (x)
39 y <- array (0, rep (m + 1, p))
40 for (i in 1:n) {
41 xi <- c (1, x[i,])
42 z <- xi
43 if (p > 1) {
44 for (s in 2:p) {
45 z <- outer (z, xi)
46 }
47 }
48 y <- y + z
49 }
50 return (y / n)
51 }
5253 make_artificial<-function(n, m, p, pow, err = FALSE, seed = 12345) {
54 set.seed (seed)
55 mp <- m * p
56 np <- n * p
57 nm <- n * m
58 x <- matrix (rnorm(np), n, p) ^ pow
59 if (err) {
60 x <- cbind (x, matrix (rnorm (nm), n, m) ^ pow)
61 }
62 x <- apply (x, 2, function (z) z - mean (z))
63 x <- sqrt (n) * qr.Q (qr (x))
64 b <- qr.Q ( qr (matrix (sample (1 : mp, mp), m, p)))
65 if (err) {
66 b <- cbind (b, diag (sample (1 : m, m) / m))
67 }
68 return (list (x = x, b = b, y = tcrossprod (x, b)))
69 }
COMPONENT ANALYSIS USING MULTIVARIATE CUMULANTS 23
Appendix B. Multiway in R
1
2 require("quadprog")
3 require("nnls")
4
5 candecomp <- function(a, x, xopt = rep (0,length (x)),
6 ortho = rep (FALSE, length (dim (a))), ispos =
FALSE,
7 itmax = 1000, eps = 1e-6, verbose = FALSE) {
8 ndam <- dim (a)
9 nard <- length (ndam)
10 ndim <- ncol (x [[1]])
11 for (k in 1 : nard) {
12 if (ortho [k]) {
13 x [[k]] <- procrustus (x [[k]])
14 }
15 }
16 cp <- lapply (x, crossprod)
17 oloss <- candeValue (a, x) $ loss
18 itel <- 1
19 repeat {
20 for (k in 1:nard) {
21 cc <- arrHadamard (cp [-k])
22 for (p in 1 : ndim) {
23 y <- lapply (x [-k], function(z) z [,p
])
24 b <- arrOuter (y)
25 x [[k]] [,p] <- apply(a, k, function(z
) sum (z * b))
26 }
27 xx <- x [[k]]
28 if (ortho[k]) {
29 x [[k]] <- procrustus (xx)
24 JAN DE LEEUW AND IRINA KUKUYEVA
30 }
31 else {
32 if (!ispos) {
33 x [[k]] <- t (solve (cc, t (xx)))
34 }
35 else {
36 x [[k]] <- posProj (xx, cc)
37 }
38 }
39 cp [[k]] <- crossprod (x [[k]])
40 }
41 cval <- candeValue (a,x)
42 nloss <- cval $ loss
43 ahat <- cval $ ahat
44 if (verbose)
45 cat ("Iteration: ", formatC (itel, digits
= 3, width = 3),
46 "Old Loss: ", formatC (oloss, digits
= 6, width = 10, format = "f"),
47 "New Loss: ", formatC (nloss, digits
= 6, width = 10, format = "f"),
48 "\n")
49 if ((itel == itmax) | ((oloss - nloss) < eps))
break ()
50 itel <- itel + 1
51 oloss <- nloss
52 }
53 return (list (x = x, ahat = ahat, loss = nloss))
54 }
55
56 candeValue<-function(a,x) {
57 ndim<-ncol(x[[1]])
58 ahat<-array(0,dim(a))
59 for (p in 1:ndim) {
60 y<-lapply(x,function(z) z[,p])
61 b<-arrOuter(y)

COMPONENT ANALYSIS USING MULTIVARIATE CUMULANTS 25
62 ahat<-ahat+b
63 }
64 loss<-sum((a-ahat)^2)
65 return(list(ahat=ahat,loss=loss))
66 }
67
68 tucker<-function(a,x,ident=rep(FALSE,length(x)),ortho=
rep(FALSE,length(x)),ispos=rep(FALSE,length(x)),
isposb=FALSE,itmax=1000,eps=1e-6,verbose=FALSE) {
69 ndam<-dim(a)
70 for (k in 1:nard) if (ident[k]) x[[k]]<-diag(ndam[
k])
71 ndbm<-sapply(x,function(z) ncol(z))
72 nard<-length(ndam)
73 rard<-rev(1:nard)
74 x<-lapply(x,procrustus)
75 xx<-arrKronecker(x)
76 aa<-as.vector(aperm(a,rard))
77 if (!isposb) bb<-lsfit(xx,aa,intercept=FALSE)
78 else bb<-nnls(xx,aa)
79 b<-aperm(array(bb,rev(ndbm)),rard)
80 ahat<-aperm(array(drop(xx%*%bb),rev(ndam)),rard)
81 oloss<-sum((a-ahat)^2)
82 itel<-1
83 repeat {
84 for (k in 1:nard) {
85 if (!ident[k]) {
86 z<-crossprod(flatten(a,k),arrKronecker
(x[-k]))%*%flatten(b,k)
87 x[[k]]<-procrustus(z)
88 }
89 }
90 xx<-arrKronecker(x)
91 aa<-as.vector(aperm(a,rard))
92 if (!isposb) bb<-lsfit(xx,aa,intercept=FALSE)
93 else bb<-nnls(xx,aa)

26 JAN DE LEEUW AND IRINA KUKUYEVA
94 b<-aperm(array(bb,rev(ndbm)),rard)
95 ahat<-aperm(array(drop(xx%*%bb),rev(ndam)),
rev(1:nard))
96 nloss<-sum((a-ahat)^2)
97 if (verbose)
98 cat("Iteration: ",formatC(itel,digits=3,
width=3),
99 "Old Loss: ",formatC(oloss,digits=6,
width=10,format="f"),
100 "New Loss: ",formatC(nloss,digits=6,
width=10,format="f"),
101 "\n")
102 if ((itel == itmax) | ((oloss - nloss) < eps))
break()
103 itel<-itel+1; oloss<-nloss
104 }
105 return(list(x=x,b=b,ahat=ahat,loss=nloss))
106 }
107
108 # Hadamard product of a list of arrays
109
110 arrHadamard<-function(c,f="*") {
111 nmat<-length(c)
112 fun<-match.fun(f)
113 if (nmat == 0) stop("empty argument in arrHadamard
")
114 res<-c[[1]]
115 if (nmat == 1) return(res)
116 for (i in 2:nmat) res<-fun(res,c[[i]])
117 return(res)
118 }
119
120 # outer product of a list of arrays
121
122 arrOuter<-function(x,fun="*") {
123 nmat<-length(x)

COMPONENT ANALYSIS USING MULTIVARIATE CUMULANTS 27
124 if (nmat == 0) stop("empty argument in arrOuter")
125 res<-x[[1]]
126 if (length(x) == 1) return(res)
127 for (i in 2:nmat) res<-outer(res,x[[i]],fun)
128 return(res)
129 }
130
131 # kronecker product of a list of arrays
132
133 arrKronecker<-function(x,fun="*") {
134 nmat<-length(x)
135 if (nmat == 0) stop("empty argument in
arrKronecker")
136 res<-x[[1]]
137 if (length(x) == 1) return(res)
138 for (i in 2:nmat) res<-kronecker(res,x[[i]],fun)
139 return(res)
140 }
141
142 flatten<-function(a,k) {
143 nard<-rev(1:(length(dim(a))-1))
144 apply(a,k,function(z) as.vector(aperm(z,nard)))
145 }
146
147 procrustus<-function(x) {
148 res<-svd(x)
149 return(tcrossprod(res$u,res$v))
150 }
151
152 posProj<-function(x,c) {
153 n<-nrow(x); p<-ncol(x); ip<-diag(p)
154 u<-matrix(0,n,p)
155 for (i in 1:n) {
156 y<-x[i,]
157 u[i,]<-solve.QP(c,y,ip)$solution
158 }

28 JAN DE LEEUW AND IRINA KUKUYEVA
159 return(u)
160 }

COMPONENT ANALYSIS USING MULTIVARIATE CUMULANTS 29
Appendix C. CCD in R
1 require("polynom")
2
3 source("cumulant.R")
4 arti <- make_artificial (n = 1000, m = 9, p = 4, pow =
2)
5 cumu <- make_cumulants (arti $ y)
6
7 candecca <- function (cum2, cum3, cum4, p, mode = c (
f2 = FALSE, f3 = TRUE, f4 = FALSE), itmax = 1000,
eps = 1e-6, verbose = FALSE) {
8 m <- nrow (cum2)
9 e <- eigen (cum2)
10 x <- e $ vectors [, 1: p] %*% diag (sqrt (e $
values [1 : p]))
11 if (mode ["f4"]) {
12 th <- c (-.4, -.3, -.2, -.1, 0, .1, .2, .3, .4
)
13 }
14 if ((!mode ["f4"]) & (mode ["f3"])) {
15 th <- c (-.3, -.2, -.1, 0, .1, .2, .3)
16 }
17 if ((!mode ["f4"]) & (!mode ["f3"])) {
18 th <- c (-.2, -.1, 0, .1, .2)
19 }
20 ot <- outer (th, 0 : (length (th) - 1), "^")
21 w <- th
22 itel <- 1
23 kur2 <- rep (1, p)
24 kur3 <- rep (1, p)
25 kur4 <- rep (1, p)
26 oloss <- 0
27 if (mode ["f2"]) {

30 JAN DE LEEUW AND IRINA KUKUYEVA
28 oloss <- oloss + candeValue (cum2, kur2, list
(x, x)) $ loss
29 }
30 if (mode ["f3"]) {
31 oloss <- oloss + candeValue (cum3, kur3, list
(x, x, x)) $ loss
32 }
33 if (mode ["f4"]) {
34 oloss <- oloss + candeValue (cum4, kur4, list
(x, x, x, x)) $ loss
35 }
36 repeat {
37 nloss <- Inf
38 cc <- crossprod (x)
39 if (mode ["f2"]) {
40 kur2 <- solve (cc ^ 2, candeValue (cum2,
kur2, list (x, x)) $ d)
41 }
42 if (mode ["f3"]) {
43 kur3 <- solve (cc ^ 3, candeValue (cum3,
kur3, list (x, x, x)) $ d)
44 }
45 if (mode ["f4"]) {
46 kur4 <- solve (cc ^ 4, candeValue (cum4,
kur4, list (x, x, x, x)) $ d)
47 }
48 for (j in 1 : m) {
49 for (s in 1 : p) {
50 for (i in 1 : length (th)) {
51 xt <- x
52 xt [j, s] <- x [j, s] + th [i]
53 w [i] <- 0
54 if (mode ["f2"]) {
55 w [i] <- w [i] + candeValue (
cum2, kur2, list (xt, xt))
$ loss
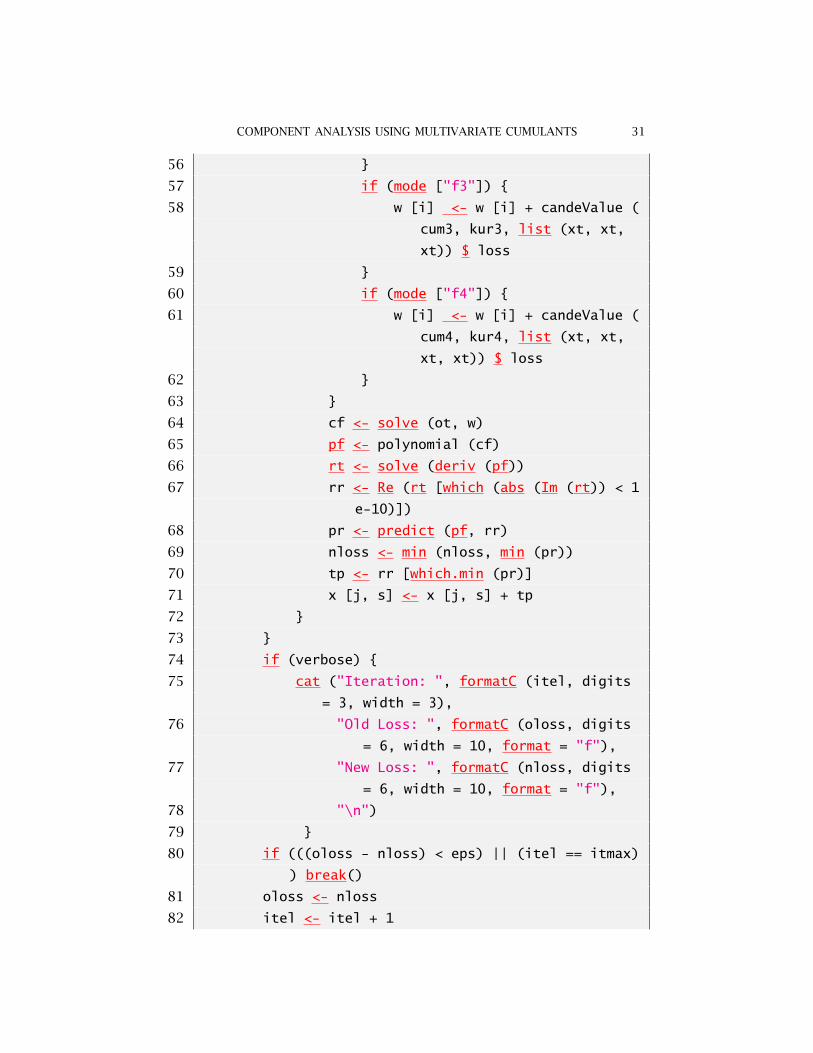
COMPONENT ANALYSIS USING MULTIVARIATE CUMULANTS 31
56 }
57 if (mode ["f3"]) {
58 w [i] <- w [i] + candeValue (
cum3, kur3, list (xt, xt,
xt)) $ loss
59 }
60 if (mode ["f4"]) {
61 w [i] <- w [i] + candeValue (
cum4, kur4, list (xt, xt,
xt, xt)) $ loss
62 }
63 }
64 cf <- solve (ot, w)
65 pf <- polynomial (cf)
66 rt <- solve (deriv (pf))
67 rr <- Re (rt [which (abs (Im (rt)) < 1
e-10)])
68 pr <- predict (pf, rr)
69 nloss <- min (nloss, min (pr))
70 tp <- rr [which.min (pr)]
71 x [j, s] <- x [j, s] + tp
72 }
73 }
74 if (verbose) {
75 cat ("Iteration: ", formatC (itel, digits
= 3, width = 3),
76 "Old Loss: ", formatC (oloss, digits
= 6, width = 10, format = "f"),
77 "New Loss: ", formatC (nloss, digits
= 6, width = 10, format = "f"),
78 "\n")
79 }
80 if (((oloss - nloss) < eps) || (itel == itmax)
) break()
81 oloss <- nloss
82 itel <- itel + 1

32 JAN DE LEEUW AND IRINA KUKUYEVA
83 }
84 return (list(x = x, kur = list (kur2, kur3, kur4),
loss = nloss))
85 }
86
87 candeValue <- function(a, kur, x) {
88 ndim <- ncol (x [[1]])
89 ahat <- array (0, dim (a))
90 d <- rep (0, ndim)
91 for (p in 1 : ndim) {
92 y <- lapply (x, function (z) z[,p])
93 b <- arrOuter (y)
94 d [p] <- sum (a * b)
95 ahat <- ahat + kur [p] * b
96 }
97 loss <- sum ((a - ahat) ^ 2)
98 return (list (ahat = ahat, d = d, loss = loss))
99 }
100
101 arrOuter <- function (x, fun = "*") {
102 nmat <- length(x)
103 if (nmat == 0) {
104 stop ("empty argument in arrOuter")
105 }
106 res <- x [[1]]
107 if (length (x) == 1) {
108 return (res)
109 }
110 for (i in 2 : nmat) {
111 res <- outer (res, x [[i]], fun)
112 }
113 return (res)
114 }

COMPONENT ANALYSIS USING MULTIVARIATE CUMULANTS 33
Appendix D. General Optimization Techniques
1 require("optimx")
2
3 source("cumulant.R")
4 arti <- make_artificial (n = 1000, m = 9, p = 4, pow =
2)
5 cumu <- make_cumulants (arti $ y)
6
7 cangenopt <- function (cum2, cum3, cum4, p, mode = c (
f2 = FALSE, f3 = TRUE, f4 = FALSE), itmax = 1000,
eps = 1e-6, verbose = FALSE) {
8 m <- nrow (cum2)
9 e <- eigen (cum2)
10 x <- e $ vectors [, 1: p] %*% diag (sqrt (e $
values [1 : p]))
11 itel <- 1
12 kur2 <- rep (1, p)
13 kur3 <- rep (1, p)
14 kur4 <- rep (1, p)
15 ansout <<- optimx (as.vector (x), proj_loss,
method = "spg",
16 mode = mode, cum = list (cum2, cum3, cum4)
, kur = list (kur2, kur3, kur4))
17 nloss <- ansout [[2]] [[1]]
18 x <- matrix (ansout [[1]] [[1]], m, p)
19 return (list(x = x, loss = nloss))
20 }
21
22 candeValue <- function(a, kur, x) {
23 ndim <- ncol (x [[1]])
24 ahat <- array (0, dim (a))
25 d <- rep (0, ndim)
26 for (p in 1 : ndim) {

34 JAN DE LEEUW AND IRINA KUKUYEVA
27 y <- lapply (x, function (z) z[,p])
28 b <- arrOuter (y)
29 d [p] <- sum (a * b)
30 ahat <- ahat + kur [p] * b
31 }
32 loss <- sum ((a - ahat) ^ 2)
33 return (list (ahat = ahat, d = d, loss = loss))
34 }
35
36 arrOuter <- function (x, fun = "*") {
37 nmat <- length(x)
38 if (nmat == 0) {
39 stop ("empty argument in arrOuter")
40 }
41 res <- x [[1]]
42 if (length (x) == 1) {
43 return (res)
44 }
45 for (i in 2 : nmat) {
46 res <- outer (res, x [[i]], fun)
47 }
48 return (res)
49 }
50
51 proj_loss <- function (x, mode, cum, kur) {
52 loss <- 0
53 m <- nrow (cum [[1]])
54 x <- matrix (x, m, length (x) / m)
55 cc <- crossprod (x)
56 if (mode ["f2"]) {
57 kur[[1]] <- solve (cc ^ 2, candeValue (cum
[[1]], kur[[1]], list (x, x)) $ d)
58 loss <- loss + candeValue (cum[[1]], kur[[1]],
list (x, x)) $ loss
59 }
60 if (mode ["f3"]) {

COMPONENT ANALYSIS USING MULTIVARIATE CUMULANTS 35
61 kur[[2]] <- solve (cc ^ 3, candeValue (cum
[[2]], kur[[2]], list (x, x, x)) $ d)
62 loss <- loss + candeValue (cum[[2]], kur[[2]],
list (x, x, x)) $ loss
63 }
64 if (mode ["f4"]) {
65 kur[[3]] <- solve (cc ^ 4, candeValue (cum
[[3]], kur[[3]], list (x, x, x, x)) $ d)
66 loss <- loss + candeValue (cum[[3]], kur[[3]],
list (x, x, x, x)) $ loss
67 }
68 return (loss)
69 }

36 JAN DE LEEUW AND IRINA KUKUYEVA
Appendix E. CANDECOMP using the APL package
1 require("apl")
2
3 candecomp <- function (a, ind, ndim, itmax = 100, eps
= 1e-6, intercept = FALSE, verbose = TRUE) {
4 nn <- dim (a)
5 nd <- length (dim (a))
6 ni <- sapply (ind, length)
7 li <- lapply (ni, function (i) 1:i)
8 vv <- list ()
9 cc <- list ()
10 for (i in 1:nd) {
11 vv[[i]] <- matrix (runif (ni[i] * ndim), ni[i
], ndim)
12 cc[[i]] <- crossprod (vv[[i]])
13 }
14 itel <- 1
15 oloss <- Inf
16 adat <- aplSelect (a, ind)
17 repeat {
18 nloss <- mkLoss (ni, adat, vv)
19 if (!verbose) {
20 cat("Iteration: ",formatC(itel,digits=3,
width=3),
21 "nloss : ",formatC(nloss,digits=6,
width=10,format="f"),
22 "\n")
23 }
24 for (i in 1:nd) {
25 f <- matrix (0, ndim, ni[i])
26 for (s in 1 : ndim) {
27 oo <- 1
28 for (k in 1:nd) {
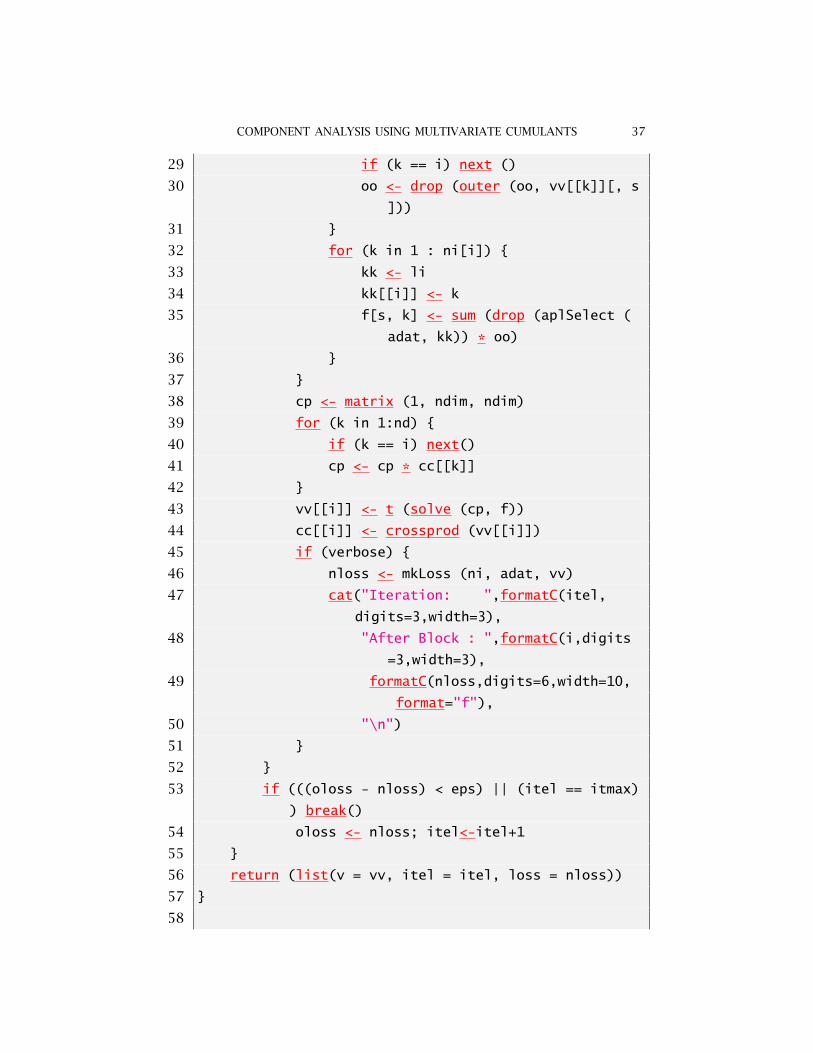
COMPONENT ANALYSIS USING MULTIVARIATE CUMULANTS 37
29 if (k == i) next ()
30 oo <- drop (outer (oo, vv[[k]][, s
]))
31 }
32 for (k in 1 : ni[i]) {
33 kk <- li
34 kk[[i]] <- k
35 f[s, k] <- sum (drop (aplSelect (
adat, kk)) * oo)
36 }
37 }
38 cp <- matrix (1, ndim, ndim)
39 for (k in 1:nd) {
40 if (k == i) next()
41 cp <- cp * cc[[k]]
42 }
43 vv[[i]] <- t (solve (cp, f))
44 cc[[i]] <- crossprod (vv[[i]])
45 if (verbose) {
46 nloss <- mkLoss (ni, adat, vv)
47 cat("Iteration: ",formatC(itel,
digits=3,width=3),
48 "After Block : ",formatC(i,digits
=3,width=3),
49 formatC(nloss,digits=6,width=10,
format="f"),
50 "\n")
51 }
52 }
53 if (((oloss - nloss) < eps) || (itel == itmax)
) break()
54 oloss <- nloss; itel<-itel+1
55 }
56 return (list(v = vv, itel = itel, loss = nloss))
57 }
58

38 JAN DE LEEUW AND IRINA KUKUYEVA
59 mkLoss <- function (ni, adat, vv) {
60 nloss <- 0
61 nsiz <- prod (ni)
62 nd <- length (ni)
63 for (i in 1:nsiz) {
64 indi <- aplEncode (i, ni)
65 vprd <- rep (1, ndim)
66 for (s in 1:nd)
67 vprd <- vprd * vv[[s]][indi[s],]
68 nloss <- nloss + (sum (vprd) - adat[aplDecode(
indi,ni)])^2
69 }
70 return (nloss)
71 }

COMPONENT ANALYSIS USING MULTIVARIATE CUMULANTS 39
Appendix F. TUCKER using the APL package
1 require("apl")
2
3 tucker <- function (a, ind, ndim, itmax = 100, eps = 1
e-6, intercept = FALSE, verbose = TRUE) {
4 nn <- dim (a)
5 nd <- length (dim (a))
6 ni <- sapply (ind, length)
7 li <- lapply (ni, function (i) 1:i)
8 vv <- list ()
9 for (i in 1:nd) {
10 vv[[i]] <- qr.Q (qr (matrix (runif (ni[i] *ndim), ni[i], ndim)))
11 }
12 # mkCore
13 itel <- 1
14 oloss <- Inf
15 adat <- aplSelect (a, ind)
16 repeat {
17 nloss <- mkLoss (ni, adat, vv)
18 if (!verbose) {
19 cat("Iteration: ",formatC(itel,digits=3,
width=3),
20 "nloss : ",formatC(nloss,digits=6,
width=10,format="f"),
21 "\n")
22 }
23 for (i in 1:nd) {
24 f <- matrix (0, ndim, ni[i])
25 for (s in 1 : ndim) {
26 oo <- 1
27 for (k in 1:nd) {
28 if (k == i) next ()

40 JAN DE LEEUW AND IRINA KUKUYEVA
29 oo <- drop (outer (oo, vv[[k]][, s
]))
30 }
31 for (k in 1 : ni[i]) {
32 kk <- li
33 kk[[i]] <- k
34 f[s, k] <- sum (drop (aplSelect (
adat, kk)) * oo)
35 }
36 }
37 cp <- matrix (1, ndim, ndim)
38 for (k in 1:nd) {
39 if (k == i) next()
40 cp <- cp * cc[[k]]
41 }
42 vv[[i]] <- t (solve (cp, f))
43 cc[[i]] <- crossprod (vv[[i]])
44 if (verbose) {
45 nloss <- mkLoss (ni, adat, vv)
46 cat("Iteration: ",formatC(itel,
digits=3,width=3),
47 "After Block : ",formatC(i,digits
=3,width=3),
48 formatC(nloss,digits=6,width=10,
format="f"),
49 "\n")
50 }
51 }
52 if (((oloss - nloss) < eps) || (itel == itmax)
) break()
53 oloss <- nloss; itel<-itel+1
54 }
55 return (list(v = vv, itel = itel, loss = nloss))
56 }
57
58 mkLoss <- function (ni, adat, vv) {

COMPONENT ANALYSIS USING MULTIVARIATE CUMULANTS 41
59 nloss <- 0
60 nsiz <- prod (ni)
61 nd <- length (ni)
62 for (i in 1:nsiz) {
63 indi <- aplEncode (i, ni)
64 vprd <- rep (1, ndim)
65 for (s in 1:nd)
66 vprd <- vprd * vv[[s]][indi[s],]
67 nloss <- nloss + (sum (vprd) - adat[aplDecode(
indi,ni)])^2
68 }
69 return (nloss)
70 }
Department of Statistics, University of California, Los Angeles, CA
90095-1554
E-mail address, Jan de Leeuw: [email protected]
URL, Jan de Leeuw: http://gifi.stat.ucla.edu
E-mail address, Irina Kukuyeva: [email protected]
URL, Irina Kukuyeva: https://sites.google.com/site/ikukuyeva/


![Multivariate Statistics [1em]Principal Component Analysis ...meier/teaching/cheming/4_multivariate.pdf · Principal Component Analysis (PCA) Goal: Dimensionality reduction. We have](https://img.dokumen.tips/doc/110x75/5e80b49cd82bd2127764cf4d/multivariate-statistics-1emprincipal-component-analysis-meierteachingcheming4.jpg)
![Multivariate Statistics [1em]Principal Component Analysis ...stat.ethz.ch/~meier/teaching/cheming/4_multivariate.pdf · Goals of Today’s Lecture Get familiar with the multivariate](https://img.dokumen.tips/doc/110x75/5e11556a9999a7698829e1bd/multivariate-statistics-1emprincipal-component-analysis-statethzchmeierteachingcheming4.jpg)


![Multivariate Statistics [1em]Principal Component Analysis (PCA)stat.ethz.ch/~meier/teaching/cheming/2013/4_multivariate.pdf · Multivariate Statistics Principal Component Analysis](https://img.dokumen.tips/doc/110x75/60715d6774bd640ff35402bf/multivariate-statistics-1emprincipal-component-analysis-pcastatethzchmeierteachingcheming20134.jpg)
![Band selection with Higher Order Multivariate Cumulants ...1.We apply Joint Kurtosis Feature Selection (JKFS) [9] to the problem of band selection and show that it can be effectively](https://img.dokumen.tips/doc/110x75/6029825b897ecd141a6b5ba6/band-selection-with-higher-order-multivariate-cumulants-1we-apply-joint-kurtosis.jpg)