Embed Size (px)
Citation preview


Half yearly compliance report-10 Mtpa JSW Steel Limited October 2015 - March 2016
Compliance Report of Environment Clearance For JSW Steel Limited dated 7th May, 2007 (Refer: F.NO.J -11011/364/2006-IA II(I) dt 7.05.2007) for October 2015 – March 2016
Sl. No
Conditions Compliance
I Specific Conditions 1 Gaseous emissions from various process units shall
conform to the load/ mass based standards. On-line continuous monitors will be installed to monitor particulate matter in the stacks and air emissions from different sources shall not exceed 150mg/Nm3 Interlocking facilities shall be provided so that process can be automatically stopped incase emission level exceeds the limit.
Process units conform to the load/ mass based standards for gaseous emissions. Online continuous monitors have been installed in 35 stacks and the emissions are within 150mg/Nm3. Air pollution control systems are connected with the process.
2 SO2 emissions from sinter plant shall be controlled by installing ESP and scrubbers. Secondary emissions from sinter plant shall also be controlled and monitored.
Dedusting ESP has been provided to control the secondary emissions from sinter plants with 80m stack height. SO2 emissions are controlled.
3 Three continuous ambient air quality monitoring stations shall be installed at the project site, one in downwind direction as well as where maximum GLC of SPM,SO2 & NOx are anticipated in consultation with KSPCB. Data on ambient air quality and stack emission shall be regularly submitted to the Ministry once in six months.
Five number of Continuous online monitoring stations are installed at Vaddu, Vidyanagar township, VV Nagar Township, Shankar Gudda Colony and 10 Mtpa gate. Data on ambient air quality and stack emission is being regularly submitted to the Ministry once in six months.
4 In plant control measures for checking the fugitive emissions from all vulnerable sources like spillage/raw materials/coal handling etc, shall be provided. Further, specific measures like provision of dust extraction and suppression system shall be installed at material transfer points and raw material handling areas.
To control fugitive emissions, yard sprinklers Dry fog system for transfer points, Wind curtains for coal yard, Tyre washing facility for trucks are provided. Materials are transported by covered trucks. Road sweeping machine are provided to control fugitive emissions. In addition thick green belt is provided.

Half yearly compliance report-10 Mtpa JSW Steel Limited October 2015 - March 2016
Fume extraction systems shall be provided at the cast house. Bag filter shall be provided at BF, BOF’s Lime & Dolomite plant. Scrubber shall be provided to gas-based incinerator.
Fume extraction system has been provided at BF, BOF and bag filter at Lime & Dolomite plant. The incinerator is provided with one scrubber.
5 Centralized de-dusting system i.e., collection of fugitive emissions through suction hood & subsequent treatment through bag filter and finally emitted through a stack of appropriately designed height for induction & arc furnaces shall be provided. Secondary fugitive emissions shall be controlled, maintained within the permissible limits, regularly monitored and records maintained.
Instead of Induction and arc furnaces we are having Blast furnaces and Basic Oxygen furnaces. We have provided in Blast Furnace 3 (Cast house is provided with 2 bag filters of 9,00,000 Nm3/h capacity and stock house is provided with 1 bag filter of 7,50,000 Nm3/h capacity) and Steel Melting Shop -2 (4 bag houses with 6,00,000 Nm3/h, 4,80,000Nm3/h, 7,80,000 (4nos)Nm3/h respectively).
6 The particulate emissions from WHRB shall be controlled by installation of ESP & particulate emissions shall not exceed 50mg/Nm3. Further, company shall install bag filter, suction hood, dust extraction device & fume extraction system to control air emissions.
For WHRB boiler, ESP is installed and the particulate emissions are within the given standards.
7 Total water requirement from TB dam and Krishna River (Almatti dam) shall not exceed 2, 05,200 m3/d as per the agreement signed with the State Govt.
However, as per the agreement with Govt. of Karnataka, the water allocation for the steel plant complex is as under: a. Tungabhadra Dam: 22.0 MGD and 10.8 MGD (1,49,095 m3/d) b. Krishna River (Alamatti Dam): 40 MGD. (1,81,824 m3/d) The actual water consumption at the 10 MTPA stage of the plant was 1,22,776m3/d and 1,31,926 m3/d
The blow down from the system shall be treated in RO plant and reused as make up water.
We have installed a 125 m3 / hr R.O Plant for the treatment of blow down water and the treated water is being reused in steel and rolling mills.
Half yearly compliance report-10 Mtpa JSW Steel Limited October 2015 - March 2016
The treated waste water from coke oven, scrubbed water from BF & BOF gas cleaning, slab caster, CRM, power plant etc shall be treated and recycled/reused in the process and for greenbelt.
This is being practiced. The treated waste water from coke oven, scrubbed water from BF & BOF gas cleaning, slab caster, CRM, power plant etc is treated in individual shops; collected and reused for less critical applications like slag quenching, dust suppression and in development of green belt.
8 No effluent shall be discharged outside the factory premises "Zero discharge" shall be followed strictly as proposed
We are utilizing the treated wastewater for recycling in other less critical application area to achieve zero discharge. However during monsoon season there will be discharge of runoff water for which we have sought approval from KSPCB for the same.
9 Solid waste will be generated in the form of BF slag, BOF slag, gas cleaning plant sludge Dedusting system dust including fuel waste oil, organic waste etc.
BF slag is being used for cement making.BOF slag is used in Bulk reception unit and BOF slurry dewatering. Slag, scales and free dust from BF is used in Micro Pellet Plant and Mill Scale Briquetting. Other waste is used as recommended.
Coal fines shall be used in power plant. Coal fines are used in Power plant Used Refractory/debris shall be used in filling low lying areas. Oily waste and organic sludge shall be incinerated in the existing gas fired incinerator and waste oil and decanter sludge shall be used in Coke ovens.
Refractory/ debris are used for filling low lying areas. Being practiced. All oily waste and organic wastes are incinerated in the existing gas fired incinerator and waste oil and decanter sludge is used in Coke ovens.
Chrome sludge generated shall be dumped in secured waste dump and then finally sent to TSDF
There is no generation of chrome sludge in our plant
10 Entire quantity of ash/dust from ESP of WHRB and ash from AFBC boiler of CPP shall be collected and used for making bricks. Bottom ash shall be disposed off in a suitably designed landfill as per CPCB guidelines to prevent leaching to the sub-soil and underground aquifer.
Fly ash generated is used for cement making which a contract with ACC exists and slime pond construction.
11 The company shall develop surface water harvesting structures to harvest the rain water for utilization in lean season besides recharging the ground water table.
Roof top harvesting is provided for Vidyanagr School. Three number of guard ponds(1,00,000, 1,25,000, 50,000 m3 ) and two raw water pond (55,00,000 m3, 11,00,000 m3) are in operation for harvesting rain.

Half yearly compliance report-10 Mtpa JSW Steel Limited October 2015 - March 2016
12 Green belt shall be developed in at least 615 ha (25%) out of total 2,458 ha. Area within and around the plant premises as per the CPCB guidelines in consultation with the DFO.
Over the past fifteen years, we have planted nearly 1.5 million trees for developing the green belt. The process is continuing with commensurate increase in land area in the expansion of the Steel plant to the current 2458 ha. Currently an area of 540 Ha (1333.8 acres @ 1 Ha=2.47 acres) has been covered under greenery. Additional area under plantation of about 141 Ha (348.41 acres) is being carried out. With this, the total green cover will be 730 Ha (1807.84 acres), which is nearly 20% higher than the specified requirement of 615ha.
13 Occupational health Surveillance of the workers should be done on a regular basis and records maintained as per the Factories Act.
The Jindal Sanjeevani Hospital (JSH) is established for Occupational Health Surveillance. Regular medical exam done. Records are maintained
14 Recommendations made in the Charter of Corporate responsibility for Environmental Protection (CREP) for the steel plants shall be implemented.
For the existing plant we have complied with most of the CREP recommendations. The same shall be followed for the expansion project also.
15 The company shall obtain necessary clearances for the linked iron ore mining component before undertaking any construction at the project site or operationalising the Iron & Steel unit
The bulk of our raw materials are being purchased from the local suppliers, and thus we are not depending on any captive mines.
II General Conditions 1 The project authorities must strictly adhere to the
stipulations made by the KSPCB and the state govt. We are adhering to the stipulations made by the KSPCB and the state govt.
2 No further expansion or modifications in the plant shall be carried out without prior approval of the Ministry of Environment and Forests.
Approval of the MOEF being taken for any expansion or modifications in the plant, as and when required.
3 Industrial wastewater shall be properly collected, treated so as to conform to the standards. The treated wastewater shall be utilized for plantation purpose.
Industrial wastewater is treated to conform to the standards. The treated wastewater is being used for less critical application inside the plant and plantation.

Half yearly compliance report-10 Mtpa JSW Steel Limited October 2015 - March 2016
4 The overall noise levels in and around the plant area shall be kept well within the standards(85 dBA) by providing noise control measures including acoustic hoods, silencers, enclosures etc on all sources of noise generation. The ambient noise levels should conform to the standards namely 75dBA (daytime) and 70dBA (night time).
Noise monitoring being carried out regularly in different plant units and also in eight different locations around the plant area. Noise control measures are provided wherever required. The data obtained are found to be well within the standards.
5 Company must undertake socio-economic development activities in surrounding villages like community development programme, educational programmes, drinking water supply and health care etc.
The JSW Foundation is carrying out the CSR activities in the surrounding villages on behalf of the Company.
6 As mentioned in EIA/EMP, Rs.1, 100.00 Crores and Rs.46.10 Crores earmarked towards the capital cost and recurring cost/annum for environmental pollution control measures shall be judiciously used to implement the conditions stipulated by the MoEF as well as the state govt.
All projects suggested in EIA/EMP are being implemented.
7 The Regional Office of this Ministry shall monitor the stipulated conditions. A six monthly compliance report and the monitored data along with statistical interpretation shall be submitted to them regularly.
The reports are being submitted to the Regional Office regularly
8 Project Proponent shall inform the public that the project has been accorded environmental clearance by the Ministry and copies of the clearance letter are available with KSPCB and may also be seen at the Website of the MoEF at http:/envfor.nic.in. This shall be advertised within seven days from the date of issue of the clearance letter at least in two local newspapers of which one shall be in the vernacular language of the locality concerned and a copy of the same should be forwarded to the regional office.
Published in newspapers on 21.05.07

Half yearly compliance report-10 Mtpa JSW Steel Limited October 2015 - March 2016
9 Project authorities should inform the Regional Office as well as the Ministry, the date of financial closure and final approval of the project by the concerned authorities and the date of commencing the land development work.
Noted.

Half yearly compliance report-10 Mtpa JSW Steel Limited October 2015 - March 2016
Compliance report of EC Amendment Conditions for JSW Steel Limited dated 3rd July, 2008 (Ref: F.No. J-11011/364/2006-1A11(I) dt. 3-7-2008) for the period October 2015-March 2016
Sl. No
Conditions Compliance
1 No change in the overall capacity of the plant (10Mtpa) and further expansion/modifications in the plant shall be carried out without prior approval from MoEF
Approval of the MoEF being taken for any expansion or modifications in taken the plant beyond 10 Mtpa
2 All the standards prescribed for the Coke Oven plant shall be followed as per the latest guidelines.
The Coke oven plant is designed based on the notification of 03.02.06
3 Proper and full utilization of coke oven gases in power plant using waste heat recovery steam generators shall be ensured and no flue gases shall be discharged into the air.
A 130MW power plant has been put up to recover waste heat from non recovery Coke Oven 1 & 2
4 Total water requirement from TB dam and Krishna River (Almatti dam) shall not exceed 6508 m3/day.
However, as per the agreement with Govt. of Karnataka, the water allocation for the steel plant complex is as under: a. Tungabhadra Dam: 22.0 MGD and 10.8 MGD (1,49,095 m3/d) b. Krishna River (Alamatti Dam): 40 MGD. (1,81,824 m3/d) The actual water consumption at the 10 MTPA stage of the plant was 1,22,776m3/d and 1,31,926 m3/d
5 Continuous monitoring of the Total Organic Compounds (TOC) shall be done at the outlet of the ETP (BOD plant) and the wastewater shall be used for wet quenching
The TOC analyzer has been procured for regular testing of TOC from BOD Plant and the wastewater is treated in the new multiple stage RO (ZLD) and water reused.
6 All the recommendations made in the CREP for the Coke oven plants shall be implemented.
All the CREP recommendations are implemented.

Half yearly compliance report-10 Mtpa JSW Steel Limited October 2015 - March 2016
7 As proposed total cost of the project will be Rs. 16,454.00 Crores. Rs 1400.00 crores earmarked towards the environmental pollution control measures shall be judiciously used to implement the conditions stipulated by the MoEF as well as the State Government. The funds so provided shall not be diverted for any other purpose.
Funds are being spent accordingly.
8 Regular submission of compliance report to this Ministry including its Regional office at Bangalore, KSPCB and CPCB shall be ensured.
These reports are being submitted to the authorities regularly

JSW STEEL LIMITED
HALF YEARLY ENVIRONMENTAL MONITORING REPORT
October 2015 to March 2016

JSW STEEL LIMITED
HALF YEARLY ENVIRONMENTAL MONITORING REPORT
October 2015 to March 2016

Environmental Quality Report
Month: October 2015 - March 2016
Half Yearly
For
JSW Steel Complex

Half yearly compliance monitoring report
2
CONTENTS
Sl. No. Description Page No.
A Environmental Quality Monitoring-Facilities 5
B JSW Steel Complex-emissions & work area 8
C Environmental Quality -Receptors 11
D Ambient Air Quality Monitoring Data 18
E Water Quality monitoring Data 36
F Stack Quality monitoring Data 45
G Meteorological data 48
H Performance indicators 49
I Solid waste data 50
J Special Analysis 51

Half yearly compliance monitoring report
3
List of Tables
Table No.
Description
1 Ambient Air Quality Monitoring-PM 10
2 Ambient Air Quality Monitoring-PM 2.5
3 Ambient Air Quality Monitoring-SO2
4 Ambient Air Quality Monitoring-NO2
5 Water Quality monitoring- Open well
6 Water Quality monitoring-Bore well
7 Water Quality monitoring-Surface water
8 Water Quality monitoring-ETP
9 Water Quality monitoring-Guard ponds
10 Water Quality monitoring-STP
11 Water Quality monitoring-Boiler Areas (CPP#1)
12 Water Quality monitoring-Boiler Areas (CPP#2)
13 Water Quality monitoring-JPOCL
14 Chimney emissions using stack sampler
15 Meteorological data for Vidyanagar
16 Performance indicators
17 Solid waste generation & utilization
18 Fly ash generation and utilization
19 Special Analysis-TCLP Studies
20 Special Analysis-Dioxin & Furans
21 Special Analysis-Poly Aromatic Hydrocarbons

Half yearly compliance monitoring report
4
List of Figures
Figure No.
Description
1 Location map of Ambient air quality & noise level monitoring stations
2 CAAQ & Manual monitoring-Vaddu
3 Manual monitoring-Vidyanagar
4 Manual monitoring-Basapura
5 Manual monitoring-Gadignur
6 Manual monitoring-Kurekuppa
7 Manual monitoring-Sultanpur
8 Manual monitoring-Talur
9 Manual monitoring-Hampi
10 Manual monitoring-Karadidhama
11 Manual monitoring-Kudtini
12 Manual monitoring-Toranagallu
13 Pollution Rose- Shankar Gudda
14 Pollution Rose- Vidyanagar
15 Pollution Rose- Vaddu
16 Pollution Rose- 10 MT
17 Location map of water quality monitoring
Half yearly compliance monitoring report
5
1. JSW Steel Complex
The following parameters are being monitored within JSW Steel Complex
Units Products Capacity Parameters
JSW Steel Limited
Steel products 10 MTPA
Stack emission Work Area Air Quality Air quality at plant
boundary Drinking Water Quality
(Canteens) Wastewater Quality Noise level at Work
area Noise level at plant
boundary Dust Fall
JSW Energy Limited
Electrical Power
860 MW
JPOCL Oxygen 2 X 2500 TPD
BOC 1 & 2 Oxygen 855 TPD & 1800 TPD
JSW SEVERFIELD
Structural 35000 MTPA
JSW SPCL Cold Rolled Finished Products
0.5 MTPA
JSW Cement Ground Granuled BF Slag
0.59 MTPA
JAMIPOL De-sulphurising Compound
45,000 TPA
2. Beyond JSW Steel Complex
The following parameters are being monitored beyond JSW Steel Complex. Environmental Monitoring Report of IST Steel, Bhuwalka Pipes, KMMI Steel, Padmavathi Steel are not included in this report. Units Capacity Parameters Jindal Sanjeevini Hospitals
72 beds a. Drinking Water- Canteen b. STP- Treated Wastewater
A. ENVIRONMENTAL QUALTIY MONITORING-FACILITIES

Half yearly compliance monitoring report
6
JSW RIPL 3 Townships
( Vidyanagar, V V Nagar, Shankar Gudda Colony) with 7700 Quarters
a. Ambient air quality-PM 10, PM2.5, CO, SO2,NO2 b. Drinking water- WTP c. STP-Treated wastewater d. Meteorological data.
Surrounding Villages ( Receptors) :
a. Vaddu (1.5 km-WNW)
a. Ambient Air Quality b. Water Quality-Bore well, Open well, Surface water c. Ambient Noise Level
b. Talur (4.5 km-WSW) c. Toranagallu(3.5 km-ENE) d. Gadignur (6.0 km-NW) e. Basapur (4.0 km-NW) f. Kurekuppa (6.0km-NNW) g. Kudtini (11.0 km-E) h. Hampi (26.0km-NW) i. Karadidhama(12.0 km-NW) j. Sultanpur (7.5 km-SE) k. Vidyanagar ( 0.5km-SW)
3. Meteorology (Continuous Monitoring)
Locations Parameters
Vidyanagar Wind direction, Wind speed, Temperature, Solar Radiation, Atmospheric Pressure, RH, Rainfall
Vaddu
Wind direction, Wind speed, Temperature MSDS Shankar Gudda 10 MT Gate

Half yearly compliance monitoring report
7
4. Statutory Permits / Clearances a. CFO (Air & Water)
b. Hazardous Waste Authorizations
5. Statutory Compliance Reporting a. Cess returns for the month of Oct sent-EMD/GOV/F014/2772 b. Cess returns for the month of Nov sent-EMD/GOV/F014/2786 c. Cess returns for the month of Dec sent-EMD/GOV/F014/2801 d. Cess returns for the month of Jan sent-EMD/GOV/F014/2650 e. Cess returns for the month of Feb sent-EMD/GOV/F014/2809 f. Cess returns for the month of Mar sent-EMD/GOV/F014/2836 5. Special Analysis 1. Dioxin, Furans in Sinter Plants & Coke dry quenching. 2. PAH in work area.
Sl. No. Units Year Valid up to 1 JSH 2015-16 30.06.2017 2 JSW SPCL 2015-16 30.06.2016 3 JSW Cement 2015-16 30.06.2016 4 JSW RIPL 2015-16 30.06.2016 5 JSW Steel 2015-16 30.06.2016 6 JSW Energy 2015-16 30.06.2016 7 JPOCL 2011-12 30.08.2016 8 Bellary Oxygen
Company 2007-08 30.06.2017
9 JAMIPOL 2010-11 Obtained
Sl. No.
Units Year Valid up to
1 JSW Steel 2010-11 Applied and awaiting clearance from KSPCB
2 Bellary Oxygen Company
2008-09 Applied and awaiting clearance from KSPCB
3 BOC 2008-09 31.12.2016 4 JSW Energy 2015-16 30.06.2020 5 JSW Cement 2015-16 Applied and Awaiting
clearance from KSPCB 6 JSW SPCL 2011-12 30.06.2016

Half yearly compliance monitoring report
8
3. TCLP Studies of 20 samples.
1. Stack Emission Monitoring- Manual
In total there are 4 numbers of stack units in JSW Steel Complex. Stack emission level is being monitored manually at
JSW Steel, (Process: 97;non- process: 246; total:343) JSW Cement Plant, ( 1) JPOCL, ( 7 ) JSW Energy ( 4 )
Vayubodhan stack monitoring kit is used for drawing the flue gas samples and the same is used to measure the temperature and velocity. Sulphur dioxide and oxides of nitrogen in the flue gas are sampled by bubbling flue gas in 3% H2O2 and 0.1N NaOH solution respectively and the analysis of the pollutants are done as per the standard procedures prescribed by CPCB / BIS.
2. Stack monitoring – Continuous Stack emission levels are being monitored at 12 locations in JSW Steel by online stack dust monitors
Corex (1)
Pellet Plant 1 (2)
Blast Furnace 1 (1)
Blast Furnace 2 (2)
Blast Furnace 3 (3) Coke Oven 3 (2)
Steel Melting Shop 1 (4)
Steel Melting Shop 2 (2)
Sinter Plant 1 (2)
Sinter Plant 2 (2)
Sinter Plant 3 (3)
Sinter Plant 4 (2) 3. Noise level at Work areas
Noise level at work areas is monitored using B&K Sound Level Meter
(Model 2237 A).
B. JSW STEEL COMPLEX-EMISSIONS AND WORK AREA

Half yearly compliance monitoring report
9
4. Effluent / Wastewater Quality Monitoring
Wastewater quality is monitored at 9 different locations in JSW Steel at regular intervals for the given month. TSS, pH, BOD5 , COD, Oil & Grease, TDS, Ammonia, Free ammonia, Cyanide, Total carbon, Inorganic carbon, TOC , Phenol, Sulphide are measured. The nine sampling locations (plant-wise) are as follows;
Units Locations Coke oven 3 Coke oven drainage outlet
Coke oven west outlet Coke oven east outlet Coke oven BOD plant outlet
Coke oven 4 Coke oven BOD plant outlet ZLD plant -outlet
Coke oven 1 & 2 Coke oven 1 settling pond Coke oven 2 settling pond
COREX 1 & 2 Corex 1 clarifier Corex 2 Clarifier
Blast furnace 1, 2 , 3 & 4 BF 1 GCP BF 2 GCP BF 3 GCP BF 4 GCP
Steel melting shop 1 SMS I Cooling tower SMS I Clarifier
Steel melting shop 2 SMS II Clarifier SMS II Cooling tower
Hot Strip Mill 1 HSM Clarifier HSM Cooling pond
Cold rolling mill CRM ETP outlet Captive power plant 1 & 2 Cooling pond water
Boiler blow down water

Half yearly compliance monitoring report
10
5. Guard Pond Monitoring There are 3 Guard Ponds inside JSW Steel Complex into which blow-down from different plants flow in. TDS, TSS, pH, Oil & Grease, COD, BOD, Chloride, Ammonical nitrogen, Phenol, Cyanide, Sulphate, Turbidity, Free ammonia and Sulphide are analyzed on a daily basis for the outlet of Guard Ponds I,II & III.
6. Dust Fall Rate Dust fall rate is being measured inside as well as outside the JSW Steel Complex. 10 villages are being monitored monthly.
Guard Ponds Source Guard Pond I 4 MT blow down Guard Pond II 7 & 10 MT blow down Guard Pond III 10 MT blow down
Half yearly compliance monitoring report
11
1. Ambient Air Quality Monitoring- Manual
Ambient air quality is being monitored at 10 receptors-
Toranagallu Village (JA1) Sultanpur Village (JA2)
Talur Village (JA4)
Vaddu Village (JA5)
Gadiganur Village (JA6)
Basapur Village (JA7)
Kurekuppa Village (JA8) Kudutini (JA9)
Karidhama (JA10) and
Hampi (JA11) using High Volume Sampler. The parameters analyzed are PM10, PM2.5, SO2, and NOx. The methodologies adopted are given as in Annexure-I. The location map showing ambient air & noise level stations is given in figure no. 1.
2. Ambient Air Quality Monitoring- Online Continuous Ambient air quality monitoring is being carried out at 4 locations-
Shankar Gudda Colony Vidyanagar Township Vaddu Village and 10MT Gate using online analyzers.
The parameters analyzed are PM 2.5, PM 10, SO2, NOX. The methodology adopted is given as in Annexure-II.
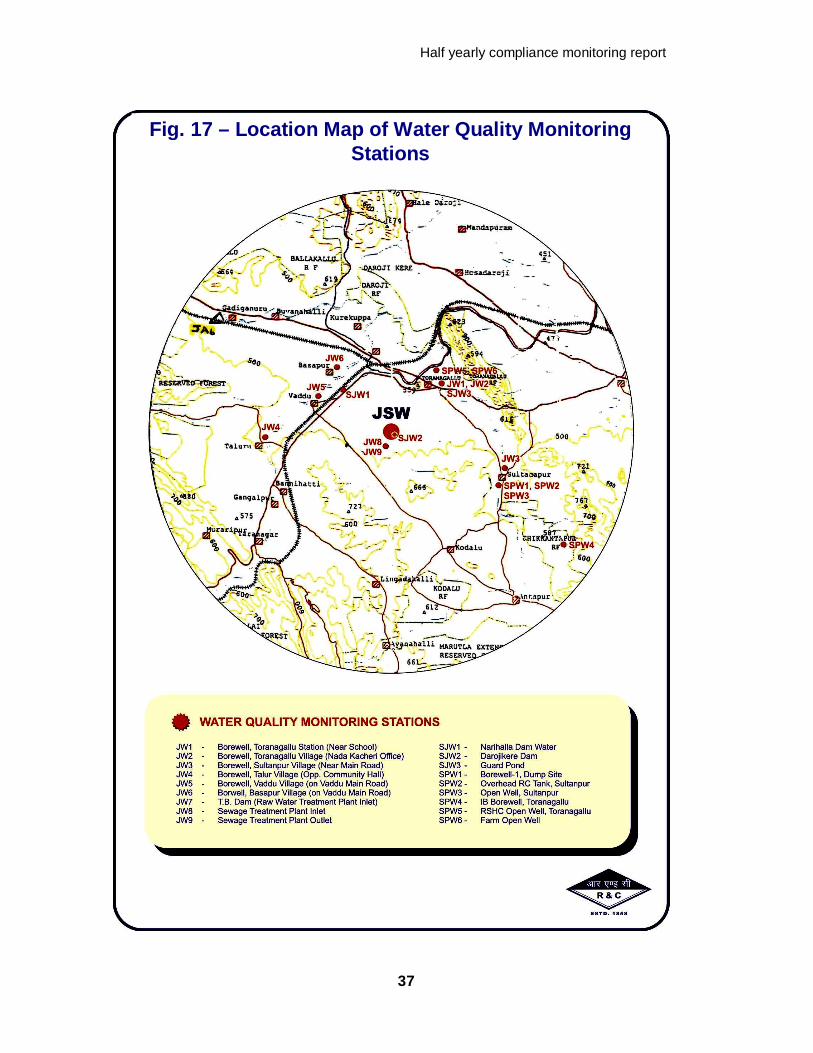
3. Water / Wastewater Quality Monitoring The water quality monitoring programme is as below. Ground water samples were analyzed for the parameters
mentioned in IS: 10500 Surface water samples were analyzed for the parameters
mentioned in IS 2296 Open well water samples were analyzed for the parameters
mentioned in IS 2296
C. ENVIRONMENTAL QUALITY -RECEPTORS

Half yearly compliance monitoring report
12
3 Guard pond outlets were analyzed for the parameters mentioned in GSR 422 E
Domestic sewage samples were analyzed for the parameters mentioned in IS 2490.
4. Ambient Noise Level Measurement
Noise level is being recorded at 11 ambient air quality monitoring stations and at plant boundary monthly.
5. Ambient Area SL. NO.
Area Parameters
1
Continuous Ambient Air Quality Monitoring ( near plant boundary)- Vaddu Vidyanagar V V Nagar 10 MT S G Colony
NO2, SO2 , PM 10, PM2.5,CO
2
Manual Air Quality Monitoring- Talur Vaddu Sultanpur Toranagallu Gadignur Basapur Kurekuppa Kudutini Hampi Karadidhama Vidyanagar
NO2, SO2 , PM 10, PM2.5
3
Water Quality (monthly): a) Surface- Narihalla Kaniganal -U/S, D/S Darojikere Tank Nalla from dumpsite Drinking water to Vaddu village from Vidyanagar,
pH, Color, Turbidity, Temperature, TDS, TSS, Volatile Solids, Total Solids, Total hardness, Oil & grease, DO, BOD3, COD, Residual Chlorine, Nitrogen, Free ammonia, Cl, F, SO4 , S, NO3 , CN, PO4 , C6H5OH,
Half yearly compliance monitoring report
13
Chickanthapura Kodalu
Cr6 , Total Chromium, Fe, Cu, Se, As, Cd, N, B, Hg, Pb, Zn, Sodium, Insecticides / Pesticides.
b) Open well- Toranagallu School HLC Sultanpur Kurekuppa Cattel Farm
pH, Color, Turbidity, Conductivity, TDS, Alkalinity, Total hardness, Fe, Mn, Cl, SO4, TSS, NO3 , F, C6H5OH, Se, As, Cd, N, B, Hg, CN, Pb, Zn, Anionic Detergents, Poly. Aromatic Hydrocarbons, Mineral oil, Residual Chlorine, Pesticides, Coli form Organisms, Alpha & Beta emitters.
c) Bore well- Talur Vaddu Dumpsite Sultanpur Toranagallu.
4 Drinking Water-WTP (Daily): V V Nagar Shankar Gudda Vidyanagar
pH, Conductivity, TDS, TSS, Total Hardness, Ca Hardness, Mg Hardness, Chloride, Turbidity, Free Chlorine, MPN, E coli.
5 STP : V V Nagar Shankar Gudda Vidyanagar Reed Bed Water JSH
pH, TDS, TSS, Turbidity, Free Chlorine, MPN, E coli, BOD3, COD
6 Noise: a.Villages- Talur Vaddu Sultanpur Toranagallu Gadignur Basapur Kurekuppa Kudutini Hampi Karadidhama Vidyanagar.
b. Plant Boundary- JSH

Half yearly compliance monitoring report
14
6. Meteorology Meteorological parameters are monitored by using online meteorological sensors at 5 locations Toranagallu village, Vidyanagar Township, Vaddu village, MSDS & 10MT Gate since July 2012. The Parameters monitored are Wind speed, Wind direction, Rainfall, Temperature, Relative humidity, solar radiation & Atmospheric pressure.

Half yearly compliance monitoring report
15
List of Tables & Figures
Sl No. Table & Figures
Air Quality Monitoring Fig 1 Location map of Ambient air quality & noise level
monitoring stations Tab 1 Ambient Air Quality Monitoring-PM 10
Tab 2 Ambient Air Quality Monitoring-SO2
Tab 3 Ambient Air Quality Monitoring-NO2
Fig 2 CAAQ & Manual monitoring-Vaddu
Fig 3 Manual monitoring-Vidyanagar
Fig 4 Manual monitoring-Basapura
Fig 5 Manual monitoring-Gadignur Fig 6 Manual monitoring-Kurekuppa Fig 7 Manual monitoring-Sultanpur Fig 8 Manual monitoring-Talur
Fig 9 Manual monitoring-Hampi Fig 10 Manual monitoring-Karadidhama Fig 11 Manual monitoring-Kudutini Fig 12 Manual monitoring-Toranagallu Fig 13 Pollution Rose- Shankar Gudda Fig 14 Pollution Rose- Vaddu Fig 15 Pollution Rose- Vidyanagar Fig 16 Pollution Rose- 10 MT

Half yearly compliance monitoring report
16
Water Quality Monitoring Fig 17 Location map of water quality monitoring Tab 4 Water Quality monitoring- Open well Tab 5 Water Quality monitoring-Bore well Tab 6 Water Quality monitoring-Surface water Tab 7 Water Quality monitoring-ETP Tab 8 Water Quality monitoring-Guard ponds Tab 9 Water Quality monitoring-STP Tab 10 Water Quality monitoring-Others
Stack Emission Monitoring Tab 11 Chimney emissions using stack sampler
Meteorological Tab 12 Meteorological data for Vidyanagar Tab 13 Performance indicators
Solid waste Tab 14 Solid waste generation & utilization Tab 15 Fly ash generation and utilization
Special Analysis Tab 16 TCLP Report Tab 17 Dioxins & Furans Tab 18 Poly Aromatic Hydrocarbons

Half yearly compliance monitoring report
17
Fig. I LOCATION MAP OF AMBIENT AIR QUALITY & NOISE LEVEL
MONITORING STATIONS

Half yearly compliance monitoring report
18
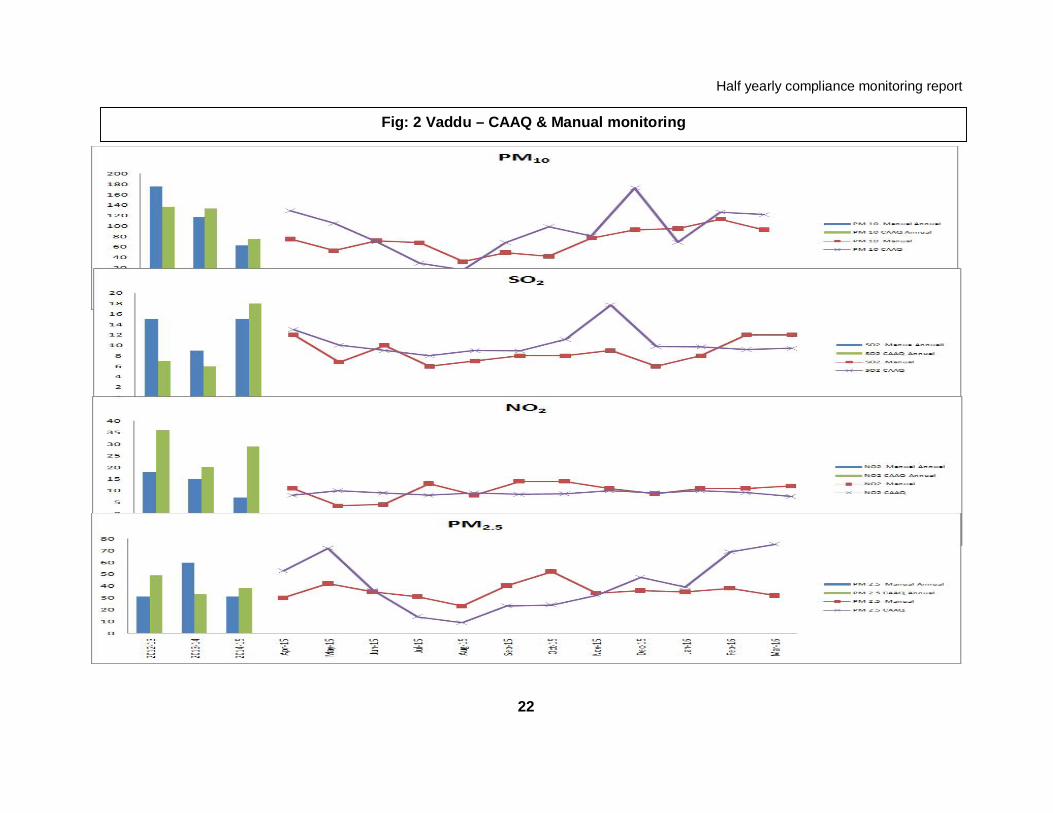
TABLE: 1 AMBIENT AIR QUALITY- PM 10 (24 Hourly Avg.) Unit: µg/m3 (Norms:100) SL.NO LOCATION PM 10
2012-13 2013-14 2014-15 Oct-15 Nov-15 Dec-15 Jan-16 Feb-16 Mar-16 AVG AVG AVG AVG AVG AVG AVG AVG AVG
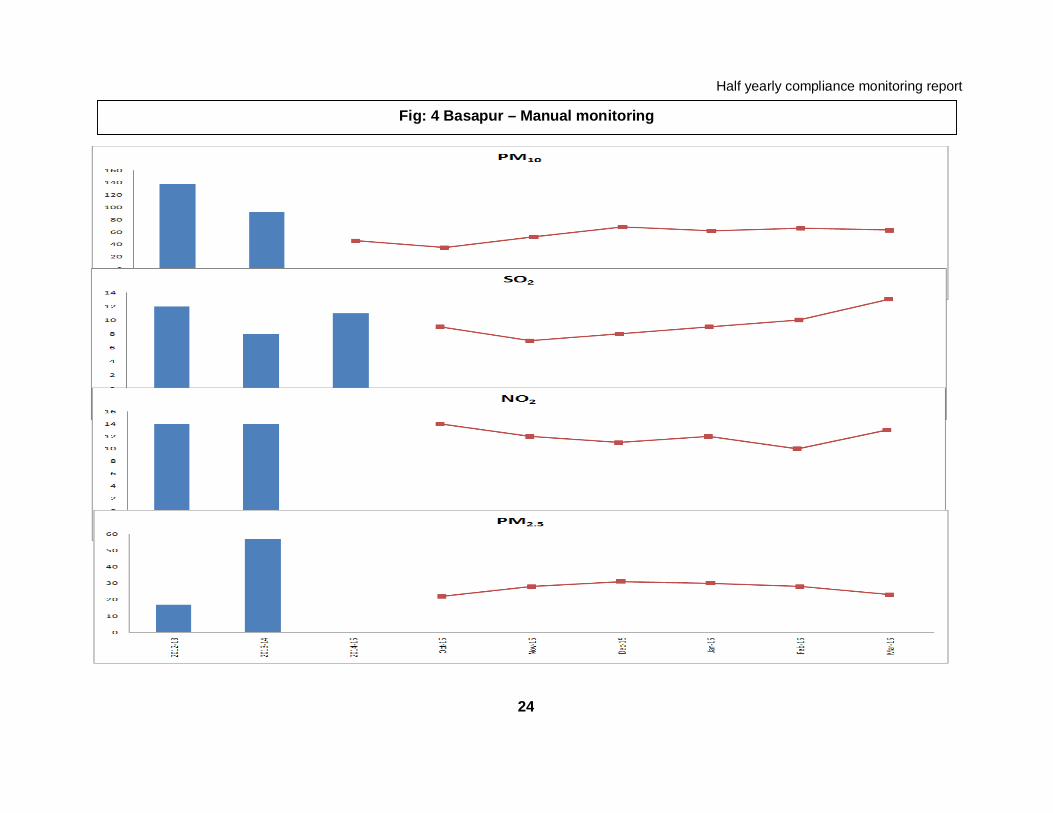
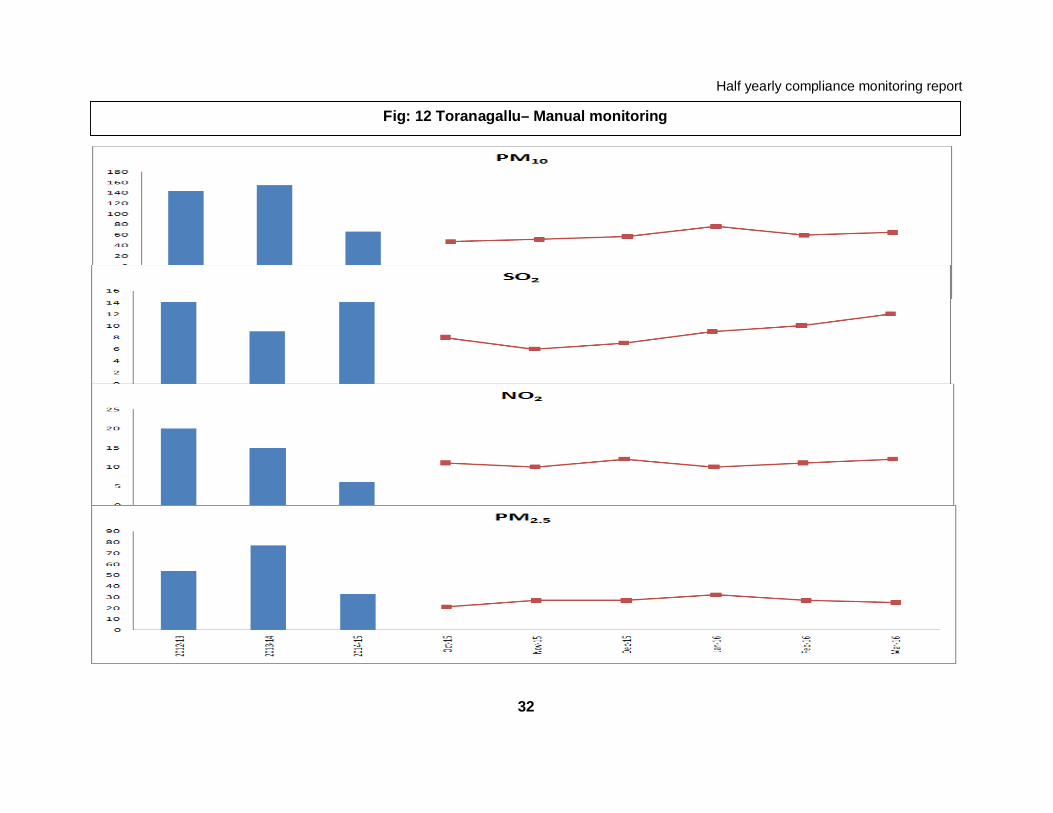
Continuous Monitoring 1 Vidyanagar 63 60 44 53 39 39 23 22 65 2 SHT 142 116 71 36 48 57 78 88 71 4 Vaddu 135 292 76 99 81 173 69 127 122 5 10 MT Gate 181 148 95 55 51 133 81 107 86 Manual Monitoring 1 Sultanpura 129 118 63 55 43 71 93 62 107 2 Talur 93 71 43 43 67 62 52 95 52 3 Vaddu 159 93 63 42 77 93 95 113 93 4 Gadiganur 145 88 35 50 41 98 65 93 52 5 Basapura 136 83 46 35 52 68 62 66 63 6 Kurekuppa 86 75 45 52 34 62 72 63 61 7 Kudithini 43 63 64 64 85 111 115 83 83 8 Karadidhama 25 68 48 46 64 104 95 121 70 9 Hampi 109 55 34 56 51 82 57 56 98 10 Toranagallu 127 117 66 47 51 57 76 59 65
D. AMBIENT AIR QUALITY DATA

Half yearly compliance monitoring report
19
TABLE: 2 AMBIENT AIR QUALITY- PM 2.5 (24 Hourly Avg.) Unit: µg/m3 (Norms:60)
SL NO
LOCATION PM 2.5 2012-13 2013-14 2014-15 Oct-15 Nov-15 Dec-15 Jan-16 Feb-16 Mar-16
AVG AVG AVG AVG AVG AVG AVG AVG AVG Continuous Monitoring 1 Vidyanagar 20 26 17 20 13 19 13 14 28 2 SHT 55 55 25 10 19 16 31 33 36 4 Vaddu 50 62 38 51 32 47 39 69 75 5 10 MT Gate 92 38 29 19 26 52 50 43 30 Manual Monitoring
1 Sultanpura 16 64 28 28 25 31 40 31 33 2 Talur 12 57 24 23 34 29 30 33 24 3 Vaddu 16 60 31 24 34 36 35 38 32 4 Gadiganur 21 63 22 25 21 30 25 27 21 5 Basapura 37 57 22 22 28 31 30 28 23 6 Kurekuppa 8 60 28 23 23 30 31 30 23 7 Kudithini 12 65 30 31 35 33 35 32 27 8 Karadidhama 4 45 27 25 25 30 31 34 26 9 Hampi 14 36 16 26 23 29 25 23 28
10 Toranagallu na 77 33 21 27 27 32 27 25

Half yearly compliance monitoring report
20
TABLE: 3 AMBIENT AIR QUALITY- SO2 (24 Hourly Avg.)
Unit: µg/m3 (Norms:80) SL LOCATION SO2 NO 2012-13 2013-14 2014-15 Oct-15 Nov-15 Dec-15 Jan-16 Feb-16 Mar-16 AVG AVG AVG AVG AVG AVG AVG AVG AVG Continuous Monitoring 1 Vidyanagar 14 20 18 27 29 28.8 29 23 16 2 SHT 16 19 20 16 18 17.8 16 10 10 4 Vaddu Village 7 8 18 11 12 9.8 10 9 9
5 10 MT Gate 9 14 15 13 12 9.5 9 9 7 Manual Monitoring 1 Sultanpura 12 3 16 9 9 8.0 10.0 11.0 13.0 2 Talur 15 4 12 10 10 6.0 10.0 10.0 13.0 3 Vaddu 14 5 15 8 9 6.0 8.0 12.0 12.0 4 Gadiganur 10 12 9 8 9 8.0 11.0 10.0 13.0 5 Basapura 12 20 11 9 7 8.0 9.0 10.0 13.0 6 Kurekuppa 10 13 10 10 9 7.0 9.0 11.0 13.0 7 Kudithini 24 11 15 7 9 6.0 10.0 11.0 12.0 8 Karadidhama 8 2 15 8 9 8.0 9.0 10.0 13.0 9 Hampi 12 4 10 8 8 6.0 9.0 10.0 12.0 10 Toranagallu 4 9 14 8 6 7.0 9.0 10.0 12.0 Na-data not available

Half yearly compliance monitoring report
21
TABLE: 4 AMBIENT AIR QUALITY- NO2 (24 Hourly Avg.)
Unit: µg/m3
SL LOCATION NOx NO 2012-13 2013-14 2014-15 Oct-15 Nov-15 Dec-15 Jan-16 Feb-16 Mar-16 AVG AVG AVG AVG AVG AVG AVG AVG AVG Continuous Monitoring 1 Vidyanagar 13 38 15 12.0 22.7 31.1 26.8 22.7 18.1 2 SHT 30 58 na 11.0 10.0 12.0 12.0 10.1 14.3 4 Vaddu Village 36 15 29 8.7 8.8 8.7 10.0 9.2 7.5 5 10 MT Gate 13 60 34 28.0 35.0 22.7 14.5 8.7 6.3 Manual Monitoring 1 Sultanpura 14 8 6 13 11 11 11.0 12.0 14 2 Talur 14 7 6 12 9 13 12.0 12.0 14 3 Vaddu 18 9 7 14 11 9 11.0 11.0 12 4 Gadiganur 12 17 15 13 12 11 11.0 11.0 11 5 Basapura 13 20 5 14 12 11 12.0 10.0 13 6 Kurekuppa 12 8 7 14 12 11 12.0 12.0 14 7 Kudithini 22 13 7 12 12 11 11.0 10.0 12 8 Karadidhama 9 10 7 11 11 13 11.0 11.0 13 9 Hampi 14 10 6 12 10 11 10.0 10.0 13 10 Toranagallu 5 16 6 11 10 12 10.0 11.0 12
Half yearly compliance monitoring report
22
Fig: 2 Vaddu – CAAQ & Manual monitoring

Half yearly compliance monitoring report
23
Fig: 3 Vidyanagar – CAAQ monitoring
Half yearly compliance monitoring report
24
Fig: 4 Basapur – Manual monitoring

Half yearly compliance monitoring report
25
Fig: 5 Gadignur– Manual monitoring

Half yearly compliance monitoring report
26
Fig: 6 Kurekuppa – Manual monitoring

Half yearly compliance monitoring report
27
Fig: 7 Sultanpur – Manual monitoring

Half yearly compliance monitoring report
28
Fig: 8 Talur – Manual monitoring

Half yearly compliance monitoring report
29
Fig: 9 Hampi– Manual monitoring

Half yearly compliance monitoring report
30
Fig: 10 Karadidhama– Manual monitoring

Half yearly compliance monitoring report
31
Fig: 11 Kudthini– Manual monitoring
Half yearly compliance monitoring report
32
Fig: 12 Toranagallu– Manual monitoring

Half yearly compliance monitoring report
33
Fig: 13 Pollution Rose- Shankar Hill Township

Half yearly compliance monitoring report
34
Fig: 14 Pollution Rose- Vidyanagar

Half yearly compliance monitoring report
35
Fig: 15 Pollution Rose- Vaddu

Half yearly compliance monitoring report
36
Fig: 16 Pollution Rose- 10 MT
Half yearly compliance monitoring report
37
Fig. 17 – Location Map of Water Quality Monitoring Stations

Half yearly compliance monitoring report
38
TABLE: 4 Water Quality- Openwell
Sl. No. Parameters
IS: 10500 Norms Kurekuppa Cattle
Farm Open well
HLC RSEB Quarters TNGL Desirabl
e Permissib
le 1. Colour, Hazen units 5 25 <5 <5 2. Odour Unobjectionable Unobjectionable 3. Taste Agreeable Agreeable 4. Turbidity, NTU 5 10 16.6 2.1 5. pH 6.5-8.5 6.5-8.5 8.2 7.6 6. Conductivity, µmhos/cm - - 1685 2759 7. T.Dissolved Solids, mg/l 500 2000 1092 1790 8. T.Alkalinity as CaCO3, mg/l 200 600 270 396 9. T.Hardness as CaCO3, mg/l 300 600 196 343
10. Calcium as Ca, mg/l 75 200 55 94 11. Magnesium as Mg, mg/l 30 100 14 26 12. Total Suspended Solids, mg/l - - 20 5 13. Iron as Fe, mg/l 0.3 1.0 - - 14. Manganese as Mn, mg/l 0.1 0.3 - - 15. Chlorides as Cl, mg/l 250 1000 252 427 16. Sulphates as SO4, mg/l 200 400 151 111 17. Nitrates as NO3, mg/l 45 100 20 22 18. Flouride as F, mg/l 1.0 1.6 1.1 2 19. Phenols as C6H5OH, mg/l 0.001 0.002 BDL BDL 20. Mercury as Hg, mg/l 0.001 0.001 BDL BDL 21. Cadmium as Cd, mg/l 0.01 0.01 BDL BDL 22. Selenium as Se, mg/l 0.01 0.01 BDL BDL 23. Arsenic as As, mg/l 0.05 0.05 BDL BDL 24. Cyanide as CN, mg/l 0.05 0.05 BDL BDL 25. Lead as Pb, mg/l 0.05 0.05 BDL BDL 26. Zinc as Zn, mg/l 5 15 BDL BDL
27. Anionic detergents as MBAS, mg/l 0.2 1.0 BDL BDL
28. Chromium as Cr, mg/l 0.05 0.05 BDL BDL
29. Poly.Aromatic Hydrocarbons, mg/l _ _ BDL BDL
30. Mineral Oil, mg/l 0.01 0.01 BDL BDL 31. Residual Chlorine, mg/l 0.2 - BDL BDL 32. Pesticides Absent 0.001 BDL BDL
33. Coliform Organisms, MPN/100ml Absent Absent BDL BDL
34. Alpha emitters, µc/ml 10 6 10 6 BDL BDL 35. Beta emitters, µc/ml 10 7 10 7 BDL BDL
E. WATER QUALITY MONITORING DATA
Half yearly compliance monitoring report
39
TABLE: 5 Water Quality- Borewell
Sl. No. Parameters
IS: 10500 Norms Sultanpura Bore
well near Bus stop
Talur Bore Well
TNGL Village
TNGL School Desira
ble Permis
sible 1. Colour, Hazen units 5 25 <5 <5 <5 <5 2. Odour Unobjectionable Unobjectionable 3. Taste Agreeable Agreeable 4. Turbidity, NTU 5 10 1.5 3.2 1.3 0.8 5. pH 6.5-8.5 6.5-8.5 7.7 7.5 7.7 7.9 6. Conductivity, µmhos/cm - - 1547 1971 1689 1735 7. T.Dissolved Solids, mg/l 500 2000 1002 1280 1094 1122 8. T.Alkalinity as CaCO3,
mg/l 200 600 261 333 315 306
9. T.Hardness as CaCO3, mg/l 300 600 451 470 637 480
10. Calcium as Ca, mg/l 75 200 130 133 219 137 11. Magnesium as Mg, mg/l 30 100 31 33 29 33 12. Total Suspended
Solids, mg/l - - 3 4 2 1
13. Iron as Fe, mg/l 0.3 1.0 BDL BDL BDL BDL 14. Manganese as Mn, mg/l 0.1 0.3 BDL BDL BDL BDL 15. Chlorides as Cl, mg/l 250 1000 195 247 313 171 16. Sulphates as SO4, mg/l 200 400 167 78 380 134 17. Nitrates as NO3, mg/l 45 100 6.2 14.9 13.0 9.0 18. Flouride as F, mg/l 1.0 1.5 1.4 1.3 1.4 1.2 19. Phenols as C6H5OH,
mg/l 0.001 0.002 BDL BDL BDL BDL
20. Mercury as Hg, mg/l 0.001 0.001 BDL BDL BDL BDL 21. Cadmium as Cd, mg/l 0.01 0.01 BDL BDL BDL BDL 22. Selenium as Se, mg/l 0.01 0.01 BDL BDL BDL BDL 23. Arsenic as As, mg/l 0.05 0.05 BDL BDL BDL BDL 24. Cyanide as CN, mg/l 0.05 0.05 BDL BDL BDL BDL 25. Lead as Pb, mg/l 0.05 0.05 BDL BDL BDL BDL 26. Zinc as Zn, mg/l 5 15 BDL BDL BDL BDL 27. Anionic detergents as
MBAS, mg/l 0.2 1.0 BDL BDL BDL BDL
28. Chromium as Cr, mg/l 0.05 0.05 BDL BDL BDL BDL 29. Poly.Aromatic
Hydrocarbons, mg/l _ _
BDL BDL BDL BDL
30. Mineral Oil, mg/l 0.01 0.01 BDL BDL BDL BDL 31. Residual Chlorine, mg/l 0.2 - BDL BDL BDL BDL 32. Pesticides Absent 0.001 BDL BDL BDL BDL 33. Coliform Organisms,
MPN/100ml Absent Absent BDL BDL BDL BDL
34. Alpha emitters, µc/ml 10 6 10 6 BDL BDL BDL BDL 35. Beta emitters, µc/ml 10 7 10 7 BDL BDL BDL BDL

Half yearly compliance monitoring report
40
TABLE: 6 Water Quality- Surface water
Sl. No. Parameters
IS: 2296 1982 Norms**
(Class C) Kanigana
l D/S D/W Supply
to Vaddu Darojikere
Outlet
1. pH 6.5 - 8.5 7.6 7.8 8.2 2. Colour - - - - 4. Turbidity - 4.8 6.6 38 5. Temperature - 28 30 24.9 6. Solids - - - - a. Volatile - - - - b. Suspended - 5 9 40 c. Dissolved 1500 1792 540 318 d.Total solids - - - -
7. Total Hardness - 529 127 88 8. Dissolved Oxygen 4.0 5.8 6.2 6.2 9 BOD - 5 days, 20°C 3 8 2 9
10. COD - 15 5 16 11. Free Ammonia - NIL NIL NIL 12. Chloride (as Cl) 600 427 176 71 13. Fluoride (as F) 1.5 1.3 0.2 0.9 14. Sulphates (as SO4) 400 310 86 350 15. Sulphides (as S) - BDL BDL BDL 16. Nitrates (as NO3) 50 9 19.3 35 17. Cyanides (as CN) 0.05 BDL BDL BDL
18. Dissolved Phosphates (as PO4) - BDL BDL BDL
19. Insecticides/ Pesticides - BDL BDL BDL
20. Phenols (as C6H5OH) 0.005 BDL BDL BDL
21. Chromium (as Cr) ( Hexavalent)
0.05 BDL BDL BDL
22. Iron (as Fe) 50 BDL BDL BDL 23. Copper (as Cu) 1.5 BDL BDL BDL 24. Selenium (as Se) 0.05 BDL BDL BDL 25. Arsenic (as As) 0.2 BDL BDL BDL 26. Cadmium (as Cd) 0.01 BDL BDL BDL 27. Mercury (as Hg) BDL BDL BDL 28. Lead (as Pb) 0.1 BDL BDL BDL 29. Zinc (as Zn) 15 BDL BDL BDL
**Class of Water
Class C Drinking water source with conventional treatment followed by disinfection

Half yearly compliance monitoring report
41
TABLE: 7 Water Quality- ETP TABLE: 7.1 ETP-Coke Ovens JSW is the first steel company in the world which has installed a 250m3/h innovative membrane bioreactor + reverse osmosis technology for reuse of effluent recovery type Coke Ovens. The treated water which comes out as clear water is reused in cooling towers in Coke Oven plant itself. Hence no discharge of effluent from coke Ovens. TABLE: 7.2 ETP- Others Parameters MoEF
gazette notification 31.03.2012
GCP-BF1
GCP-BF2
GCP- BF3
GCP- BF4
pH 6.0-8.5 6.8 7.4 7.5 7.2 Oil & grease 10 1.8 2.2 1.6 1.8 Suspended solids 100 92 89 50 70

Half yearly compliance monitoring report
42
TABLE: 8 Water Quality- Guard Ponds
Sl. No.
Parameters
General Standards (Schedule VI of EP Act 1986)*
Guard Pond I Outlet
Guard Pond II Outlet
Guard Pond III Outlet
Sultanpur Seepage (Natural Stream)
1. pH 5.5-9.0 8.4 7.1 7.9 8.2 2. Suspended Solids, mg/l 100 13 52 11 24 3. Oil & Grease 10 2.2 2.6 2.3 Nil 4. Total Residual Chlorine 1 - - - - 5. BOD - 3 days, 20°C 30 3 17 11 4 6. COD 250 16 52 32 17 7. Nitrogen a. Ammonical 50 2.8 5.2 24 - b. Total Kjeldhal 100 - - - -
8. Free Ammonia 5.0 0.32 0.03 0.96 0.2 9. Fluoride (as F) 2.0 5.2 1.3 3.3 1.0
10. Sulphides (as S) 2.0 NIL NIL NIL NIL 11. Cyanides (as CN) 0.2 BDL BDL BDL BDL
12. Dissolved Phosphates (as PO4) 5 BDL BDL BDL BDL
13. Phenols (as C6H5OH) 1.0 BDL 0.04 0.19 BDL
14. Chromium (as Cr) a. Hexavalent b. Total
0.1 2.0
BDL BDL BDL BDL
15. Selenium (as Se) 0.05 BDL BDL BDL BDL 16. Arsenic (as As) 0.2 BDL BDL BDL BDL 17. Cadmium (as Cd) 2.0 BDL BDL BDL BDL 18. Nickel (as N) 3.0 BDL BDL BDL BDL 19. Copper (as Cu) 3.0 BDL BDL BDL BDL 20. Mercury (as Hg) 0.01 BDL BDL BDL BDL 21. Lead (as Pb) 0.1 BDL BDL BDL BDL 22. Zinc (as Zn) 5.0 BDL BDL BDL BDL
Half yearly compliance monitoring report
43
TABLE: 9 Water Quality- STP Sl. No.
Parameters KSPCB NORMS
Vidyanagar STP O/L
SGC STP O/L
VVN STP O/L
1 pH 6-9 7.1 6.9 7.3 2 Turbidity, NTU 2 1.5 1 1.4 3 BOD3, mg/l 10 6 4 8 4 Residual Chlorine Cl2 ,
mg/l 1 BDL BDL BDL TABLE: 10.1 Water Quality- Boiler Areas (CPP#1) Sl. No Parameter Unit Results
1 Colour - - 2 Odour - - 3 pH - 7.9 4 Temperature Deg C 28.4 5 TSS mg/lt 36 6 TDS mg/lt 2270 7 Particle size - 8 Oil & Grease mg/lt 1.2 9 BOD mg/lt 22 10 EC µmhos/cm 4128 11 COD mg/lt 60 12 Chloride mg/lt 544 13 Ammonia (Free) ppm -
TABLE: 10.2 Water Quality- Boiler Areas (CPP#2) Sl. No Parameter Unit Results
1 Colour - - 2 Odour - - 3 pH - 7.8 4 Temperature Deg C 29.1 5 TSS mg/lt 45 6 TDS mg/lt 2811 7 Particle size - - 8 Oil & Grease mg/lt - 9 BOD mg/lt - 10 EC µmhos/cm 3786 11 COD mg/lt - 12 Chloride mg/lt 495 13 Ammonia (Free) ppm -

Half yearly compliance monitoring report
44
TABLE: 10.3 Water Quality- JPOCL Sl. No
Parameter Unit KSPCB Norms JPOCL
1 pH - 5.5-9.0 8.41 2 Colour Hazen 5-25 <1 3 Odour - Unobjectionable Unobjectionable 4 BOD mg/lt 100 8 5 Chloride mg/lt 1000 486 6 Sulphate as SO4 mg/lt 400 194.08 7 TDS mg/lt 2000 2044 8 TSS mg/lt 100 12 9 Oil & Grease mg/lt 10 BDL 10 EC µmhos/cm 2250 3270 11 Residual Na2CO3 Milli q/lit 5.0 BDL 12 Percent Sodium Percent 60 50.13 13 Arsenic mg/lt 0.2 0.07 14 Pesticides mg/lt Absent Absent 15 Cyanide mg/lt 0.2 BDL 16 Boron as B mg/lt 2.0 0.93 BDL-Below Detection Limit

Half yearly compliance monitoring report
45
TABLE: 11 CHIMNEY EMISSIONS
Sl.No Stack Emission Temp Velocity Flow Norms, as per CFO
PM
Raw Material Handling Systems 1 B8 45 16 431,701 50 49 2 B26 44 15 57,439 50 40 3 B10 39 16 158,029 50 52 4 B9 44 16 439,863 50 47 5 B4 45 16 153,997 50 23 6 B3 42 16 425,957 50 35 7 B5 45 11 102,442 50 43
Coke Oven 1&2 8 Coke Oven 1 &2 Operation -
Coke screening 45 7 50,499 50 48
9 Coke Oven 1 &2 Operation - Cutter House
45 9 69,064 50 38
Coke Oven 3 10 Ground Dedusting
System(A&B) 51 14 147,232 50 15
11 Ground Dedusting System (C&D)
50 14 161,099 50 14
12 Coke Dry Quenching 1 52 14 183,961 50 25 13 Coke Dry Quenching 2 51 14 146,248 50 18 14 Process stack AB 236 23 160,000 50 45 15 Process stack CD 70 16 160,000 50 34
Coke Oven 4 16 CDQ 3 61 15 187,751 50 44 17 CDQ 4 61 15 186,576 50 40 18 GDS(C&D) 55 16 239,496 50 39 19 GDS(A&B) 55 16 239,496 50 16 20 Process stack AB 246 24 160,000 50 40 21 Process stack CD 200 24 160,000 50 44
Sinter Plant 1
22 Dedusting ESP 93 17 494,522 150 62 23 Process ESP 151 23 1,434,170 150 70
Sinter Plant 2 24 7J36-SP2 50 12 71,207 50 81 25 Dedusting ESP 83 17 472,204 50 61 26 Process ESP 139 20 1,441,282 50 84
Sinter Plant 3 27 Dedusting ESP 97 17 517,290 50 76 28 Process ESP 2
155 21
1,087,604 50 81
F. STACK MONITORING DATA

Half yearly compliance monitoring report
46
29 Process ESP 1 160 21
1,073,658 50 86
Pellet Plant 1 30 Ball mill
75 19
45,036 150 93 31 Drier 1
58 17
91,863 150 53 32 Drier 2
58 17
91,398 150 37 33 Drier Ore Bin 1
40 13
12,882 150 65 34 Ground ore silo
60 12
11,080 150 91 35 Hood Exhaust
115 20
520,972 150 41 36 lime storage DDS
45 14
9,584 150 45 37 Machine discharge
45 14
9,584 150 45 38 Hood Exhaust
118 20
520,511 150 50 Pellet Plant 2
39 Pellet Plant 2 Ball mill 2 82 18
39,135 50 15
40 Pellet Plant 2 HLS 50 13
56,162 50 12
41 Pellet Plant 2 storage building 42 12 - 50 24
42 Pellet Plant 2 process ESP 123 18
1,398,884 50 44
43 Pellet Plant 2 Vertical mill 80 18
17,927 150 19
Lime Plant 1 44 LCP Kiln 1
110 18
40,249 150 93 45 LCP Kiln 2
110 18
40,563 150 109 46 LCP Kiln 3
103 19
42,073 150 70 47 LCP Kiln 4
106 19
41,539 150 68 Lime Plant 2
48 LCP Kiln 5 103 19 41,730 50 43 49 LCP Kiln 6 106 19 41,136 50 44 50 LCP Kiln 7 111 19 41,988 50 43 51 LCP Kiln 8 105 19 42,645 50 50
Lime Plant 3 52 LCP kiln 9 112 19 99,060 50 49 53 LCP kiln 10 110 19 102,728 50 47 54 LCP kiln 11 107 19 104,825 50 48
Corex 1&2

Half yearly compliance monitoring report
47
55 Corex 1 CDP 69 11 76,095 150 26 56 Corex 1 Cast house DDS 60 16 760,374 150 40 57 Incinerator 52 9 9,368 150 28 58 Corex 1 Stock house DDS - coal 45 9 42,224 150 33
59 Corex 1 Stock house DDS -oxide 45 8 38,587 150 92
60 Corex 2 Stock house DDS - coal 40 9 46,863 150 29
61 Corex 2 Stock house DDS - Oxide 40 6 33,157 150 72
Blast Furnace 1 62 Blast Furnace 1 Cast house DDS 72 15 663,621 150 19
63 Blast Furnace 1 Stock house DDS 45 19 620,585 150 118
64 Blast Furnace 2 Cast House DDS 62 10 400,400 150 53
Blast Furnace 2 65 Blast Furnace 2 Stock House DDS
new 45 11 122,178 150 79
66 Blast Furnace 2 Stock House DDS old
45 10 118,438 150 57
Blast Furnace 3 67 Blast Furnace 3 Cast house east 70 14 887,804 50 35 68 Blast Furnace 3 Stock House 57 14 732,015 50 44
Blast Furnace 4 69 Blast Furnace 4 Cast house East 61 14 859,077 50 32 70 Blast Furnace 4 Stock house Fine
DDS area 45 13 131,451 50 18
71 Blast Furnace 4 stock house 49 14 1,277,210 50 41 Steel Melting Shop 1
72 SMS 1 Convertor secondary dedustinng
60 14 1,120,806 150 22
73 SMS 1 HMDS 1 &2 100 13 79,044 150 111 74 SMS 1 HMDS 3&4 53 7 76,879 150 30 75 SMS1 LHF1 94 9 82,319 150 48 76 SMS 1 LHF 2 92 9 87,126 150 38 77 SMS 1 LHF 3 56 15 108,029 150 36 78 SMS 1 HMPT 1 70 7 199,955 150 52 79 SMS 1 HMPT 2 70 7 220,770 150 80 80 SMS 1 LHF 2 110 8 72,121 150 56
Steel Melting Shop 2 81 SMS 2 converter dedusting 1 69 14 1,078,378 50 28 82 SMS 2 converter dedusting 2 66 13 965,130 50 31 83 SMS 2 HMDS 1 66 11 452,315 50 49 84 SMS 2 HMDS 2 58 8 566,920 50 46
Cold Rolling Mill 1 85 CRM 1 Acid Regeneration Plant 83 6 18,889 50 45

Half yearly compliance monitoring report
48
86 CRM1 Batch Annealing Furnace 323 13 58,711 50 5 87 CRM 1 Continous Pickling Line 72 11 14,990 50 5 88 CRM 1 Electrolytic Cleaning Line 95 15 15,249 50 28
89 CRM1 Fume extraction from Electrolytic Cleaning Line
100 15 15,490 50 22
Hot Strip Mill 1 90 HSM 1 RHF 1 451 10 208,586 150 25 91 HSM1 RHF 2 443 10 207,129 150 19
Hot Strip Mill 2
92 HSM2 RHF 1 583 12 139,918 50 38 93 HSM2 RHF 2 590 12 141,206 50 19 94 HSM 2 RHF 3 510 10 131,273 50 47
LP Mills 95 Bar Rod Mill 515 11 101,300 50 12 96 WRM 514 10 100,006 50 29
Captive Power Plant 1 97 CPP 1 Boiler 1 152 8 360,781 150 10
Captive Power Plant 2 98 CPP2 Boiler 1 252 9 117,765 150 98 99 CPP2 Boiler 2 250 8 113,013 150 107 100 CPP2 Boiler 3 251 9 116,148 150 138 101 CPP2 Boiler 4 248 8 114,666 150 88 102 CPP2 Boiler 5 263 9 112,976 150 95 103 CPP2 Boiler 6 268 8 110,152 150 85 104 CPP2 Boiler 7 266 9 118,621 150 41 105 CPP2 Boiler 8 265 9 111,866 150 42 106 CPP2 Boiler 9 155 13 362,089 150 11
Captive Power Plant 3 107 CPP 3 138 21 1,155,169 100 43
Captive Power Plant 4 108 CPP 4 142 21 1,164,904 100 36

Half yearly compliance monitoring report
49
Table: 11.1 CEMS DATA - OCTOBER-2015 TO MARCH - 2016
SL NO STACKS Norms as
per CFO AVG
1 BF3 EAST C/H 50 28 2 BF3 WEST C/H 50 44 3 COKE OVEN 3 GROUND DEDUSTING AB 50 2 4 PP1 ESP1 150 41 5 PP1 ESP2 150 49 6 SP1 ESP PROCESS 150 43 7 SP2 ESP PROCESS 50 35 8 SP2 ESP DEDUSTING 50 67 9 SP3 ESP PR0CESS 1 50 57
10 SP3 ESP PR0CESS 2 50 43 11 SP3 ESP DEDUSTING 50 72 12 BF3 STOCK HOUSE 50 18 13 BF1 DEDUSTING 150 7 14 BRM1 RHF1 50 13 15 COREX1 150 39 16 CRM1 BAF1 50 13 17 HSM2 RHF1 50 7 18 BF4 EAST C/H 50 3 19 BF4 WEST C/H 50 9 20 SMS1 LHF1 150 130 21 SMS1 LHF2 150 12 22 SMS1 LHF3 150 72 23 SMS1HMDS 1&2 150 186 24 SMS1HMDS 3 150 37 25 CPP3 PM 100 69 26 CPP4 PM 100 70

Half yearly compliance monitoring report
50
Table:11.2 Stack Emission- JPOCL Sl. No.
Unit Temp 0C
Velocity m/s
Flow Nm3/hr
PM mg/Nm3
SO2 mg/Nm3
NOX mg/Nm3
1 DG Set-1 30 9.04 1516 42.30 25.6 25.53 2 DG Set-2 30 9.06 1176 39.7 28.8 24.24 3 Hot Water Heater 30 5.10 1340 - 15.36 13.69 4 Heater J#1 30 8.09 1963 - 11.52 16.54 5 Heater J#2 30 8.09 192 - 19.20 19.11 6 Hot Water Heater-4 30 8.15 3011 23.04 19.11 7 Hot Water Heater-5 30 8.13 1327 - 26.88 13.97
Half yearly compliance monitoring report
51
TABLE: 12 Meteorological Data for Vidyanagar
Month Station level
pressure
Air temperature Humidity Mean of Extremes
Daily max
Daily min
Highest in the month
Date & Year
Lowest in the month
Date & Year
Max Min Avg
millibar deg.C deg.C deg.C deg.C % % %
Oct- 15 to Mar-16
654 38.8 15 38.8 30.03.2015 12 10.01.2016 97 19 50.4
Month Solar Radiation Rainfall Mean wind
speed Min Max Avg Half yearly total
No of rainy days in month
Heaviest fall in Half year
Date & Year
W/m2 W/m2 W/m2 mm mm kmph
Oct-15 to Mar-16
58.72 12227 298.2 102 18 42 07.10.2015 2.22
G. METEOROLOGICAL DATA

Half yearly compliance monitoring report
52
TABLE: 13 Performance Indicators
Month PM SO2 NOx
October 2015 0.88 2.27 0.9
November 2015 0.76 2.24 0.89
December 2015 0.93 2.35 2.82
January 2016 0.85 2.32 0.82
February 2016 0.9 2.7 0.94
March 2016 0.71 2.56 0.9
Every year we measure
H. PERFORMANCE INDICATORS
Half yearly compliance monitoring report
53
TABLE: 14 Solid Waste generation and utilization
Sl.No Waste Waste generated in tons Utilized in Oct `15 to Mar`16
Generation Utilization
1 Coke & Coal fines
Coal fines from RMHS
BF
627340
103327
Coke Oven 41962
JSWEL 513130
Despatch 23822 Shifted to 7MT
yard 0
Boiler 0 Total 682241
Coal dust from COREX Cement plant, BF 25813.93 25814
Coke fines SP & PP 310694 252457 Coke breeze from COKE OVEN Basemix 10161 0
2 Slag
Dry pit slag from IM Bund construction 178644 178644
* Granulated slag from IM (BF & Corex)
Cement plant 1&2 1914928 457600
Sold 0 1637483 Total 0 2095083
Slag from Steel Making Shop (SMS#1-3)
BOF
1061751
211636
IM/RMHS 53828 Micro Pellet
Plant 53149
Sold to cement plant 14339
Land filling 279591 Bund
construction 449209
Total 1061751
Slag from SMS # 2 0 0 HMDS slag from SMS #1
Bund construction 146869 146869
HMDS slag from SMS # 2
Bund construction 0 0
3 Sludge from
Water Treatment
Sludge from COREX Pellet plant & CP 46177 46177
Sludge from SMS #1 Base mix & MPP 68052 68052
Sludge from SMS #2 Base mix & MPP 0 0
I. SOLID WASTE DATA

Half yearly compliance monitoring report
54
Sludge from HSM (belt press cake) Base mix 2736 2736
4 Dust from Process & Bagfilters
Flue dust from BF Sold and SRP 83912 83912 Oxide dust from COREX MPP 9365 9365
Dust from LHF dedusting MPP 1056 1056
HMPT dust from SMS #1 MPP 525 525
Dust from Secondary fume extraction,HMDS, BMCS, LHF
MPP 3478 3478
Lime & dolo dust from LCP MPP 14997 14997
5 Mill scale
Mill scale from SMS Base mix 0 94048
MBP 13391.53 0
Mill scale from HSM Corex 2720.18 0
MBP 77936.43 0
7 CRM Dust Iron Oxide
Dispatched to outside party
(sold) 6375.72 0
MBP & PP 6529
6 Others
Burnt lime/dolo fines from LCP BOF 3556 3556
LS & Dolo fines from LCP
Sinter plant / pellet plant 457815 457816
Refractories
Total (excluding coal waste) 4094286.161 4274595 % of waste utilization (excluding coal waste) 104.4% Total 5068295 5235107 % of waste utilization (sock piled) 103%

Half yearly compliance monitoring report
55
TABLE: 16 Special Analysis-TCLP Studies Analysed by : M/s Bhagavati Ana Labs Pvt limited Reference : As per EPA 1311 (TCLP) Parameter : TCLP-Hazardous Sl. No.
Report No. Location Result
1 BALPL/14-15/CL 2920/21-1 CRX1/BF1 Screw Clarifier Sludge Non-Hazardous 2 BALPL/14-15/CL 2920/21-1 BF4 Slag Non-Hazardous 3 BALPL/14-15/CL 2920/21-1 BF4 Sludge Non-Hazardous 4 BALPL/14-15/CL 2920/21-1 BF4 Flue dust Non-Hazardous 5 BALPL/14-15/CL 2920/21-1 HMDS Slag (10Mt) Non-Hazardous 6 BALPL/14-15/CL 2920/21-1 SMS2 Mill Scale Non-Hazardous 7 BALPL/14-15/CL 2920/21-1 SMS2 Granulated Slag Non-Hazardous 8 BALPL/14-15/CL 2920/21-1 SMS2 Sludge Non-Hazardous 9 BALPL/14-15/CL 2920/21-1 HSM2 Oily Sludge Non-Hazardous 10 BALPL/14-15/CL 2920/21-1 HSM2 Mill Scale Non-Hazardous 11 BALPL/14-15/CL 2920/21-1 CRM2 ETP Oily Sludge Non-Hazardous 12 BALPL/14-15/CL 2920/21-1 CRM2 ETP Magnetic Sludge Non-Hazardous 13 BALPL/14-15/CL 2920/21-1 Slime2 Non-Hazardous 14 BALPL/14-15/CL 2920/21-1 Incinerator Ash2 Non-Hazardous 15 BALPL/14-15/CL 2920/21-1 CPP4 Bottom Ash Non-Hazardous 16 BALPL/14-15/CL 2920/21-1 Coke Oven Tar Sludge Hazardous 17 BALPL/14-15/CL 2920/21-1 Coke Oven Decanter Sludge Non-Hazardous
J. SPECIAL ANALYSIS

Half yearly compliance monitoring report
56
TABLE: 17 Special Analysis-Dioxin & Furans Analysed by : M/s M/s Bhagavati Ana Labs Pvt limited Reference : As per USEPA 23 A Date of Sampling : 24.11.2014 Parameter : Dioxin & Furans @ 11% oxygen correction Norms :0.1 ng/Nm3 TEQ
Sl. No.
Report No. Sample Description Result in ng/Nm3 TEQ
1 07186/14-15/VLL/000/01 Sinter Plant-1 ESP 0.0013 2 07186/14-15/VLL/000/02 Sinter Plant-2 ESP 0.0012 3 07186/14-15/VLL/000/03 Sinter Plant-3 ESP 0.0010 4 07186/14-15/VLL/000/04 Sinter Plant-4 ESP 0.0009 5 07186/14-15/VLL/000/05 Coke Dry Quenching-1 0.0019 6 07186/14-15/VLL/000/06 Coke Dry Quenching-2 0.0016 7 07186/14-15/VLL/000/07 Coke Dry Quenching-3 0.0015 8 07186/14-15/VLL/000/08 Coke Dry Quenching-4 0.0017
TABLE: 18 Special Analysis-Poly Aromatic Hydrocarbons Analysed by : M/s SGS India Reference : IS: 5182 (Part 23 & 12) Parameter : Poly Aromatic Hydrocarbon - BaP Norms : 5 µg/m3
Sl. No.
Report No. Date of Sampling
Location Result in µg/m3
1 BALPL/14-15/CL-2883/1-10 22.12.2014 Coke oven 3-Oven top Battery A
0.357
2 BALPL/14-15/CL-2883/1-10 22.12.2014 Coke oven 3-Oven top Battery B
0.35
3 BALPL/14-15/CL-2883/1-10 22.12.2014 Coke oven 3-Oven top b/w Battery A & Battery B
0.71
4 BALPL/14-15/CL-2883/1-10 22.12.2014 Coke oven 3-Oven top Battery C
0.743
5 BALPL/14-15/CL-2883/1-10 22.12.2014 Coke oven 3-Oven top Battery D
0.617
6 BALPL/14-15/CL-2883/1-10 22.12.2014 Coke oven 3-Oven top b/w Battery C & Battery D
0.757
7 BALPL/14-15/CL-2883/1-10 22.12.2014 Coke oven 4-Oven top Battery A
0.823
8 BALPL/14-15/CL-2883/1-10 22.12.2014 Coke oven 4-Oven top Battery B
0.89
9 BALPL/14-15/CL-2883/1-10 22.12.2014 Coke oven 4-Oven top b/w Battery A & Battery B
0.647
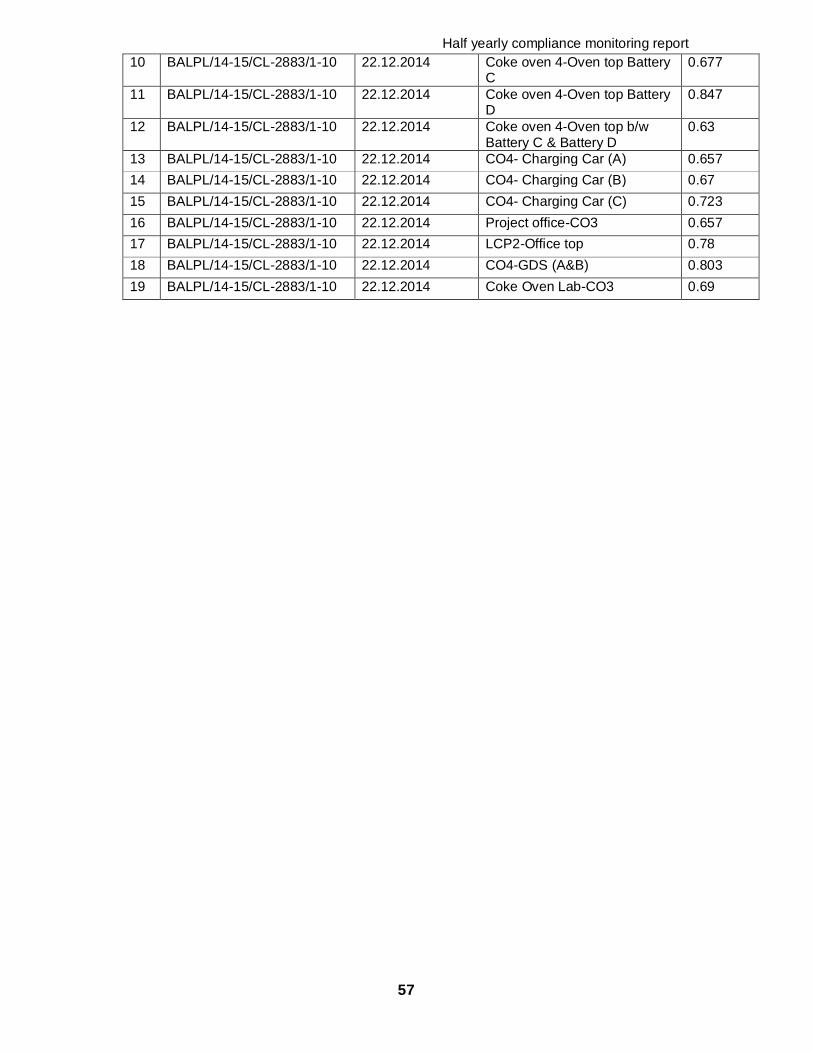
Half yearly compliance monitoring report
57
10 BALPL/14-15/CL-2883/1-10 22.12.2014 Coke oven 4-Oven top Battery C
0.677
11 BALPL/14-15/CL-2883/1-10 22.12.2014 Coke oven 4-Oven top Battery D
0.847
12 BALPL/14-15/CL-2883/1-10 22.12.2014 Coke oven 4-Oven top b/w Battery C & Battery D
0.63
13 BALPL/14-15/CL-2883/1-10 22.12.2014 CO4- Charging Car (A) 0.657 14 BALPL/14-15/CL-2883/1-10 22.12.2014 CO4- Charging Car (B) 0.67 15 BALPL/14-15/CL-2883/1-10 22.12.2014 CO4- Charging Car (C) 0.723 16 BALPL/14-15/CL-2883/1-10 22.12.2014 Project office-CO3 0.657 17 BALPL/14-15/CL-2883/1-10 22.12.2014 LCP2-Office top 0.78 18 BALPL/14-15/CL-2883/1-10 22.12.2014 CO4-GDS (A&B) 0.803 19 BALPL/14-15/CL-2883/1-10 22.12.2014 Coke Oven Lab-CO3 0.69

Half yearly compliance monitoring report
58
Annexure- I Ambient Air Quality Monitoring Methodologies (Manual)
Sl.No Parameter Methodology Reference
1 PM10 Gravimetric method IS 5182 Part 23 Method of Measurement of Air pollution
2 PM2.5 Light Scattering method 3 Sulphur di -
Oxide Improved West and Geake Method
IS 5182 Part 2 Method of Measurement of Air pollution
4 Nitrogen di-oxide Modified Jacob and Hochheiser Method
IS 5182 Part 6 Method of Measurement of Air pollution
5 Carbon monoxide
6 Ammonia Indophenol’s Blue Method Method 401, Air sampling and analysis, 3rd edition, Lewis publishers
7 Benzene Adsorption and desorption followed by GC analysis
8 Benzo (a) pyrene
Solvent Extraction & GC analysis
IS 5182 part 12, 2004 , BIS method USEPA method TO-13
9 Arsenic AAS method after sampling EPM 2000 filter Paper
IS 5182 Part 23 Method of Measurement of Air pollution, APHA method
10 Nickel
11 Lead
Half yearly compliance monitoring report
59
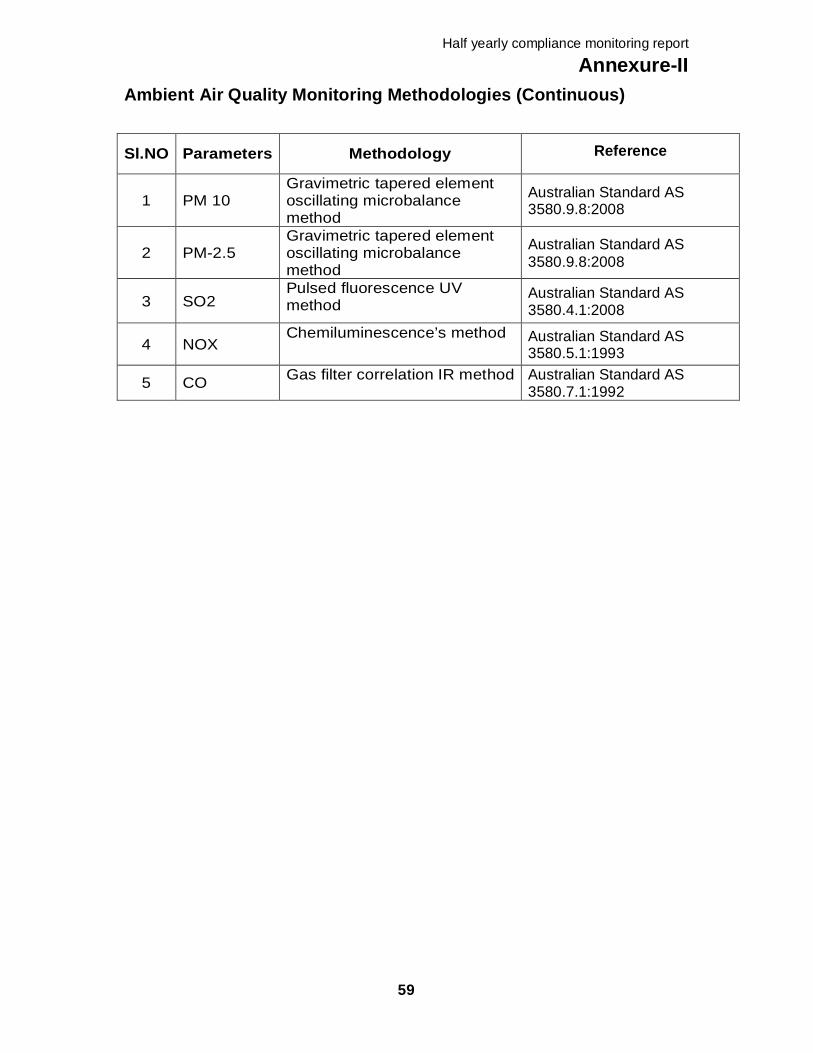
Annexure-II Ambient Air Quality Monitoring Methodologies (Continuous)
Sl.NO Parameters Methodology Reference
1 PM 10 Gravimetric tapered element oscillating microbalance method
Australian Standard AS 3580.9.8:2008
2 PM-2.5 Gravimetric tapered element oscillating microbalance method
Australian Standard AS 3580.9.8:2008
3 SO2 Pulsed fluorescence UV method
Australian Standard AS 3580.4.1:2008
4 NOX Chemiluminescence’s method Australian Standard AS
3580.5.1:1993
5 CO Gas filter correlation IR method Australian Standard AS 3580.7.1:1992