Embed Size (px)
Citation preview
Independent Pricing and Regulatory Tribunal
PO Box Q290, QVB Post Office, NSW 1230Level 8, 1 Market St, Sydney NSW 2000T (02) 9290 8400 F (02) 9290 2061ABN 49 202 260 878
www.ipart.nsw.gov.au • www.ess.nsw.gov.au
Compliance and operation of the N
SW Energy Savings Schem
e during 2009 - July 2010
Compliance and p ration of the NSW Energy Savings Scheme during 2011Report to Minister
NSW Energy Savings SchemeJuly 2012


Compliance and Operation of the NSW Energy Savings Scheme during 2011 Report to Minister
NSW Energy Savings Scheme July 2012

ii IPART Compliance and Operation of the NSW Energy Savings Scheme during 2011
© Independent Pricing and Regulatory Tribunal of New South Wales 2012
This work is copyright. The Copyright Act 1968 permits fair dealing for study, research, news reporting, criticism and review. Selected passages, tables or diagrams may be reproduced for such purposes provided acknowledgement of the source is included.
ISBN 978-1-922127-17-4
The Committee members for this report are:
Mr James Cox PSM, Chief Executive Officer and Full Time Member
Mr Eric Groom, Principal Adviser and Committee Member
Dr Brian Spalding, Committee Member
Inquiries regarding this document should be directed to:
Margaret Sniffin (02) 9290 8486
Liz Mayfield (02) 9290 8489
Independent Pricing and Regulatory Tribunal of New South Wales PO Box Q290, QVB Post Office NSW 1230 Level 8, 1 Market Street, Sydney NSW 2000
T (02) 9290 8400 F (02) 9290 2061
www.ipart.nsw.gov.au

Contents
iii IPART Compliance and Operation of the NSW Energy Savings Scheme during 2011
Contents
Foreword 1
1 Executive summary 3 1.1 What is the ESS? 3 1.2 IPART’s role as Scheme Regulator and Scheme Administrator 4 1.3 Scheme Participants’ performance in 2011 4 1.4 Accredited Certificate Providers’ performance in 2011 5 1.5 Auditing activities 6 1.6 Creation, ownership and surrender of certificates 6 1.7 Projected supply and demand for certificates 7 1.8 What does the rest of this report cover? 7
2 Developments in the ESS during 2011 8 2.1 Changes affecting showerhead replacement programs 8 2.2 Amendments to the ESS Rule 10 2.3 Review of the cost effectiveness of the ESS 11 2.4 Trends in costs of administering the ESS 12 2.5 Review and redesign of ESS website and application documentation 12 2.6 Introduction of pre-application workshops 15 2.7 Developments in commercial lighting activities 16 2.8 Introduction of a system to verify residential activity 16 2.9 Conferences and presentations 17 2.10 Harmonisation of energy efficiency schemes 17
3 Scheme Participants’ compliance performance 19 3.1 Summary of Scheme Participants’ compliance performance in 2011 20 3.2 Energy savings shortfalls carried forward 22 3.3 Energy savings shortfall penalties paid 22 3.4 Exempt loads 23
4 Accredited Certificate Providers’ performance 25 4.1 Accredited Certificate Providers’ compliance performance in 2011 26 4.2 Risk management 30 4.3 RESAs accredited to create certificates for 2011 31 4.4 RESAs amended and cancelled during 2011 32 4.5 Applications under assessment at the end of 2011 33

Contents
iv IPART Compliance and Operation of the NSW Energy Savings Scheme during 2011
4.6 Disclosure of external funding 33 4.7 Case studies 34
5 Audit activities 37 5.1 Summary of audit activity in 2011 37 5.2 ESS Audit Services Panel 38 5.3 Compliance and Performance Monitoring Strategy 39 5.4 Scheme Participant audits 39 5.5 Accredited Certificate Provider audits 40
6 ESS Registry – creation, ownership and surrender of certificates 41 6.1 Creation of certificates 41 6.2 Surrender of certificates 48 6.3 Transfer of certificates 48
7 Current and projected supply and demand 50 7.1 Developments that influenced certificate supply and demand in 2011 50 7.2 Trends in the certificate (ESC) spot price 51 7.3 Our approach for projecting certificate supply and demand to 2012 53 7.4 Projection results 56
Appendices 59 A Overview of the ESS 61 B Creation of certificates 72 C Estimated energy savings 82
Glossary 98

Foreword
Compliance and Operation of the NSW Energy Savings Scheme during 2011 IPART 1
Foreword
This is our third annual report on the Energy Savings Scheme (ESS) and discusses the second full year of operation of the scheme. The number of certificates created increased from 804,318 certificates for 2010 to 1,086,120 certificates for 2011. This was close to the number of certificates required by retailers to meet their 2011 compliance obligations under the scheme.
2011 was, however, a year of significant change. In 2010, 49% of certificates were created through activities in households and 22% were created through commercial sector activities. By contrast, in 2011, 60% of certificates were created through commercial sector activities and only 20% through household activities. The prime factors leading to this change were the removal of showerhead projects from the scheme and the growth in energy efficient lighting activities in commercial businesses.
One of our key concerns is to ensure that certificates are created only where genuine energy savings have occurred. We carefully monitor the energy savings activities of accredited parties, and use audits undertaken by independent third parties to verify savings. Compliance with the requirements of the scheme was generally good during 2011. The number of invalidly created certificates declined from 7.7% of total creation in 2010 to 4.6% in 2011. This improvement occurred at a time when the number of certificates created was increasing and the expansion of commercial lighting activities required us to consider new providers, new products and new business models.
During 2011, we took a number of steps to improve compliance. Where we consider the risk of invalid certificate creation is high, we have required companies to withhold from trade a percentage of the certificates they create. These certificates are then released for trade if a subsequent audit demonstrates that they represent valid energy savings. One company, Enact Energy, was suspended from the ESS in 2011 because of substantial failures to comply with the requirements of the scheme.
We introduced an address verification and monitoring system to track residential activities to remove the potential for double counting. All companies must submit their databases to us before they can register certificates. Not only has this improved the accuracy of information being captured by businesses, it has also improved the results obtained through the audits. We intend to extend the address verification system to our commercial sector projects in 2012.

Foreword
2 IPART Compliance and Operation of the NSW Energy Savings Scheme during 2011
From the start of 2011 showerhead replacement activities in the ESS shifted from in-home installations to door-to-door sales. In many cases, the showerhead sales programs were following a ‘giveaway’ model. This resulted in significantly higher risks of invalid certificate creation. We responded quickly by requiring businesses to undertake audits before certificates were created and imposing requirements to ensure that the sales were genuine. In December 2011, the ESS Rule was amended to remove showerhead activities from the ESS.
We undertook some initiatives during 2011 to increase awareness and understanding of the Energy Savings Scheme. The new ESS website was launched in January 2012. It is structured around meeting the needs of participants and other stakeholders. Information is presented in a user-friendly format. Our scheme newsletter, published quarterly, is read by over 2,000 subscribers. It keeps stakeholders and the general public informed about the latest developments in the scheme. We introduced and held five pre-application workshops in the latter half of 2011. These have been well attended and well received.
As noted, commercial lighting activities increased rapidly in 2011. This includes acceptance of new emerging lighting technologies. We have been keen to ensure that the new activities do not give rise to safety concerns. We have ensured that service providers are fully aware of their safety obligations. We are working closely with NSW Fair Trading to clarify our respective responsibilities in terms of safety and to agree a process for addressing any electrical safety issues that may arise.
In late 2011, the Premiers of NSW and Victoria agreed to work together on energy efficiency. This partnership will increase consistency between the ESS and the Victorian Energy Efficiency Target scheme and reduce the costs of participation. We are working closely with agencies in NSW and our counterparts in Victoria, the Essential Services Commission, to ensure the success of this initiative.
I would like to thank my colleagues on the Committee, Brian Spalding and Eric Groom, for their wise counsel and participation in decision making. I would also like to thank the ESS Team for their efforts to ensure the continued success of the scheme.
James Cox PSM Chief Executive Office and Full Tribunal Member

1 Executive summary
Compliance and Operation of the NSW Energy Savings Scheme during 2011 IPART 3
1 Executive summary
The Independent Pricing and Regulatory Tribunal of NSW (IPART) is both Scheme Regulator and Scheme Administrator for the NSW Energy Savings Scheme (ESS). In these roles we monitor and report annually to the Minister for Resources and Energy on the scheme participants’ compliance, and other aspects of the scheme’s performance and operation. This is our third annual report on the ESS, and covers the 2011 calendar year.
1.1 What is the ESS?
The ESS is established under Part 9 of the NSW Electricity Supply Act 1995 (the Act), and commenced operation in July 2009. Its stated objectives are to:
assist households and businesses to reduce their electricity consumption and electricity costs
complement any national scheme for reducing carbon pollution by making the reduction of greenhouse gas emissions achievable at a lower cost, and
reduce the cost of, and the need for, additional energy generation, transmission and distribution infrastructure.1
To meet these objectives, the Act sets out annual energy savings targets to 2020. It obliges all electricity retailers operating in NSW and certain other parties – known as Scheme Participants – to meet these targets by purchasing and surrendering Energy Savings Certificates (certificates). It also provides for parties to be accredited to create those certificates from specific energy savings projects. These parties are known as Accredited Certificate Providers.
The annual energy savings targets are expressed as a percentage of Scheme Participants’ annual liable electricity acquisitions. The targets increase each year until 2014, after which they remain steady until 2020. For 2011, the target was 2.5% of liable acquisitions made during the compliance year. For all Scheme Participants combined, this target is equivalent to 1,334,259 MWh of energy saved, or 1,414,315 certificates.
1 Section 98 of the Act.

1 Executive summary
4 IPART Compliance and Operation of the NSW Energy Savings Scheme during 2011
1.2 IPART’s role as Scheme Regulator and Scheme Administrator
As noted above, IPART is both Scheme Regulator and Scheme Administrator of the ESS. We:
monitor and report on Scheme Participants’ compliance with their ESS obligations
assess Accredited Certificate Providers’ applications to create certificates from specific energy savings projects under the Energy Savings Scheme Rule of 2009 (ESS Rule), and accredit those we consider eligible
monitor and report on Accredited Certificate Providers’ compliance with the conditions of their accreditation and the ESS Rule
conduct independent audits to ensure the integrity of the scheme is maintained
manage the GGAS & ESS Registry which tracks the creation, transfer and surrender of certificates2
monitor and publish annual reports on the supply of and demand for certificates.
We also host the ESS website, which can be found at www.ess.nsw.gov.au.
As allowed under the Act, IPART delegated the exercise of its functions as ESS Scheme Administrator and Scheme Regulator to an ESS Committee.3 In 2011, this Committee comprised Mr James Cox as full-time IPART Member, and Dr Brian Spalding and Mr Eric Groom as Committee Members, and met a total of 20 times.
The net cost of administering both ESS and GGAS was approximately $2.4 million in 2011. This cost was partially covered through the fees imposed on participants, which include application fees ($500) and certificate registration fees ($0.70 per certificate) (see Section 6.1). Revenue from these fees amounted to approximately $813,000 in 2011.
1.3 Scheme Participants’ performance in 2011
For each year, Scheme Participants are required to demonstrate that they have met their individual annual energy savings target in their Annual Energy Savings Statement (AESS), which they submit to IPART. To meet their target, they must surrender the appropriate number of certificates. If they do not have enough certificates, they can carry forward an energy savings shortfall of up to 10% of their individual target to the next year. If they choose to do this, they must make up the shortfall by the time they submit their AESS for the following year. In addition, they can meet some or all of their obligations by paying a penalty in lieu of surrendering certificates. 2 See https://www.ggas-registry.nsw.gov.au. 3 Section 152(4) of the Act allows IPART, with the approval of the Minster, to delegate the
exercise of our functions as Scheme Administrator and Scheme Regulator to another person or body.

1 Executive summary
Compliance and Operation of the NSW Energy Savings Scheme during 2011 IPART 5
During 2011, there were 33 Scheme Participants. All but 2 of these participants met their compliance obligations for the year through either surrendering sufficient certificates, carrying forward a shortfall and/or payment a penalty.
Together, these participants surrendered 1,063,564 certificates, which is equivalent to 74% of the total number of certificates required to meet their combined compliance obligations for the year. They also carried forward energy savings shortfalls equivalent to 128,402 certificates (9%), and chose to pay penalties equivalent to 251,361 certificates (18% or approximately $6 million). At 30 June 2012, there were 264,803 certificates created in 2011 or prior years that had not yet been surrendered.
The 2 Scheme Participants that failed to meet their compliance obligations had a combined compliance obligation equivalent to 571 certificates (or 0.04% of the total combined obligations). These participants did not surrender any certificates, carry forward an energy savings shortfall or pay a penalty within the required timeframe. As at 30 June 2012, both had an outstanding penalty liability.
The ESS legislation includes provisions that allow a portion of the Scheme Participants’ electricity sales to be excluded in calculating their annual liable electricity acquisitions (from which their individual annual energy savings targets are calculated in MWh).4 This portion relates to the electricity they sell to entities that have been granted exemptions for part of the load they use in ‘emissions intensive and trade exposed’ industries or activities. In 2011, 9 Scheme Participants supplied electricity to entities with exempt loads and had a portion of these loads excluded. Together, the excluded portions comprised around 20% of the total electricity supplied in NSW during the year.
1.4 Accredited Certificate Providers’ performance in 2011
Accredited Certificate Providers are voluntary participants in the ESS who have applied for and received accreditation to create certificates in respect of specific energy savings projects, known as Recognised Energy Savings Activities (RESAs). Once accredited, they are subject to the conditions of their accreditation, which set out their compliance obligations.
During 2011, Accredited Certificate Providers’ overall compliance performance was acceptable. There were 30 instances of non-compliance during the year. Most of these related to failure to submit an Annual Report Statement by the required deadline or improper creation of certificates, and were relatively minor in nature. All except one of the compliance performance issues were satisfactorily resolved.
4 Sections 119-122 of the Act and the Ministerial Order published on 24 December 2010.

1 Executive summary
6 IPART Compliance and Operation of the NSW Energy Savings Scheme during 2011
Of the 14 instances of improper creation of certificates, 6 instances were considered material in nature or quantity. Four of these instances involved Enact Energy, and led to the suspension of all Enact Energy’s accreditations in June 2011. The suspension was lifted from Enact Energy’s showerhead replacement and commercial lighting activities after several weeks, and from its showerhead sales activities after 12 months, once the compliance performance issues were satisfactorily resolved (see Section 4.1.4 for more information).
During 2011, 37 RESAs were accredited to create certificates of 2011 vintage, and during early 2012, an additional 14 RESAs were accredited to create certificates of 2011 vintage.
1.5 Auditing activities
To help manage compliance with the ESS, the Act empowers IPART, as Scheme Regulator and Scheme Administrator, to impose audit requirements on the parties that participate in the scheme.5 We established a panel of independent third party auditors under the ESS Audit Services Panel to undertake these audits. This panel undertook a total of 39 audits, including:
11 audits of Scheme Participants’ annual energy savings statements for the 2011 compliance year (conducted in the first quarter of 2012), and
28 certificate creation audits of Accredited Certificate Providers’ RESAs (conducted during 2011).
1.6 Creation, ownership and surrender of certificates
As at 30 June 2012, the ESS Registry had recorded the creation of 1,086,120 certificates for energy saving activities in 2011 – taking the total number of certificates created for activities in 2009, 2010 and 2011 to 2,127,447. The Registry had also recorded the transfer of 1,106,819 certificates between parties, and the surrender of 1,063,564 certificates by Scheme Participants in 2011.
In general, the certificates associated with an energy saving activity are created after the energy savings have occurred. However, the ESS Rule allows certificates for certain types of activities to be created in advance of the actual savings (known as deeming)6, and for some limited forward creation of certificates7. When deeming and forward creation are taken into account, we estimate that in 2011, the ESS resulted in actual energy savings of 424,083 MWh, and further savings of 399,141 MWh to be realised across future years.8
5 Sections 152 and 154 of the Act. 6 Section 9 of the ESS Rule. 7 Section 7.4 of the ESS Rule. 8 Section 174 of the Act requires an estimate of the actual energy savings that have been realised
with regard to the number of certificates created.

1 Executive summary
Compliance and Operation of the NSW Energy Savings Scheme during 2011 IPART 7
1.7 Projected supply and demand for certificates
As in 2010, the supply of certificates in 2011 was almost in balance with the demand for certificates to meet Scheme Participants’ compliance obligations. This balance was maintained largely because a significant number of new RESAs were accredited during 2011, and there was an upsurge in commercial lighting activities.
In 2012, we expect the supply of and demand for certificates to continue to remain in balance because commercial lighting activities have continued to increase, which has more than offset the removal of showerhead replacement activities. However, in 2013 we expect supply will become tighter. This is primarily because ESS targets will nearly double between 2011 and 2013, from around 1.4 million certificates (which are measured in tonnes of carbon dioxide equivalent (tCO2-e)) to almost 2.7 million certificates.
1.8 What does the rest of this report cover?
The rest of this report discusses the compliance with and operation of the ESS during 2011 in detail:
Chapter 2 outlines developments in the ESS during the year, including changes to legislation
Chapters 3 and 4 focus on the performance of the Scheme Participants and Accredited Certificate Providers
Chapter 5 discusses our auditing activities and findings
Chapter 6 provides key statistics on the creation, surrender and transfer of certificates recorded in the Registry, and
Chapter 7 provides information about the demand for and supply of certificates during 2011 and presents some possible scenarios for demand and supply in the coming years.
The appendices provide an overview of the ESS and its key elements, detailed information on the certificates created since the scheme commenced and the estimated energy savings achieved through those activities. The glossary provides a general guide to the terminology used in ESS.

2 Developments in the ESS during 2011
8 IPART Compliance and Operation of the NSW Energy Savings Scheme during 2011
2 Developments in the ESS during 2011
The 2011 calendar year was the second full year of operation of the ESS. During this year, there were some notable developments in the scheme. These included changes affecting showerhead replacement programs, growth in commercial sector projects and a focus on activities to promote awareness and understanding of the scheme. The sections below outline these developments.
2.1 Changes affecting showerhead replacement programs
IPART has been concerned about the integrity of the showerhead replacement programs accredited under the ESS Rule for some time. As our last annual report discussed,9 in early 2010 we became concerned that businesses accredited to create certificates from showerhead replacement programs were not always complying with the conditions of their accreditation. In March 2010, we reviewed the information requirements for these programs, and strengthened the requirements for verification of energy savings to maintain integrity of the ESS and minimise the risk of invalid certificate creation. We also introduced more stringent conditions of accreditation.
In December 2010, the ESS Rule was amended to further strengthen the requirements for these programs. The amendments included narrowing the eligibility criteria so only ultra-low-flow showerheads were eligible; establishing that a maximum of 3 showerheads could be replaced per household, and revising the default savings factors for showerhead programs. At the same time, the ESS Rule was amended to allow showerhead sales programs to be accredited to create certificates.
In 2011, we continued to be concerned about showerhead replacement programs. Early in the year, we reviewed the requirements for showerhead sales programs, and made changes to the administration of these programs to tighten these requirements. We also suspended the accreditation of the one business (Enact Energy) that was accredited for showerhead sales activities. Then in late 2011, the ESS Rule was amended so that all showerhead replacement activities (including installation and sales) ceased to be eligible for accreditation.
9 See IPART, Compliance and Operation of the NSW Energy Savings Scheme during 2010, July 2011,
pages 8-10 for further information.
2 Developments in the ESS during 2011
Compliance and Operation of the NSW Energy Savings Scheme during 2011 IPART 9
2.1.1 Changes to the administration of showerhead sales programs
In early 2011, we reviewed the requirements imposed on showerhead sales programs. These programs were being conducted door-to-door rather than through retail outlets, and most were effectively give-away programs. We considered this created a significant risk of invalid certificate creation.
To reduce this risk, we made changes to the administration of these programs so that:
the Installation Discount Factor varied, depending on the price paid by a customer purchasing the showerhead, and
the energy savings certificates could not be created until after an audit had been completed (ie, a pre-registration audit approach applied).
We also made changes to the documentation and procedures necessary to support showerhead sales programs, such as requiring financial invoices of showerhead sales to be tracked.
These changes were introduced on 2 February 2011 and were detailed in our ESS Notice 01/2011 – Showerhead Sales Programs, published on our website.10
2.1.2 Suspension of accreditation
In early 2011, only one business, Enact Energy, was accredited to create certificates in respect of showerhead sales activities. We suspended this accreditation when it was discovered that Enact Energy had improperly created certificates due to substantial failures to comply with its accreditation conditions. Enact had not, among other matters, maintained up-to-date records of the data, assumptions and methodology it used to calculate the energy savings from its activities. This matter is discussed in more detail in Section 4.1.4.
2.1.3 Removal of showerhead replacement activities from ESS
Even after the above changes were implemented, we remained concerned about the potential for inaccurate, and possibly purposefully manipulated record-keeping of showerhead replacement activities. We were also concerned that it was possible that many of the showerheads being replaced were already low-flow showerheads (which would mean that no new energy savings were likely to result). Further, our 2011 determination on retail electricity prices had recommended that showerhead replacement activities be removed from the ESS.11
10 www.ess.nsw.gov.au 11 IPART, Changes in regulated electricity retail prices from 1 July 2011, June 2011, p 14.
2 Developments in the ESS during 2011
10 IPART Compliance and Operation of the NSW Energy Savings Scheme during 2011
On 23 November 2011, the Minister for Resources and Energy announced that showerhead replacement activities would be removed from the ESS.12 This change occurred with the amendment to the ESS Rule, effective 22 December 2011.
2.2 Amendments to the ESS Rule
In addition to removing showerhead replacement activities from the scheme, a range of other amendments to the ESS Rule were made in 2011 (also effective 22 December 2011). These amendments were made after consultation with stakeholders.13 Some had the effect of broadening the scope of activities and projects eligible for accreditation, while others tightened, clarified or simplified the requirements. The amendments included:
modifying the definition of ‘lighting upgrade’ to expressly allow for the modification of existing lighting End-User Equipment, including de-lamping activities
including hotels, motels and the ‘common areas’ of Building Code of Australia Class 2 buildings (such as residential apartments blocks) in the definition of ‘commercial premises’ under the Commercial Lighting Energy Savings Formula
expanding the definition of ‘Site’ to allow energy savings activities at locations where the electricity consumption is not measured by a single meter, such as street lighting, traffic signals and network loss reduction equipment
expanding the definition of ‘Energy Saver’ to clearly allow network loss reduction activities
making it simpler and easier to determine when NABERS ratings periods are completed
including the requirement that lighting upgrades in commercial buildings are ‘fit for purpose’
removing ‘sales’ as an eligible halogen lighting replacement activity where installation of the End-User Equipment requires re-wiring by an electrician
removing tungsten incandescent lamps from the Commercial Lighting Energy Savings Formula
improving consistency by treating the use of T5 adaptors in the same way as lamp replacements (including limiting the allowable Nominal Lamp Lifetimes to 30,000 hours).
12 www.trade.nsw.gov.au/__data/assets/pdf_file/0004/417541/NSW-Government-removes-
showerheads-from-scheme.pdf. 13 Further information on the consultation process can be found on the Department of Trade and
Investment, Regional Infrastructure and Services (DTIRIS) website: www.trade.nsw.gov.au/energy/sustainable/efficiency/scheme/ess-rule.

2 Developments in the ESS during 2011
Compliance and Operation of the NSW Energy Savings Scheme during 2011 IPART 11
2.3 Review of the cost effectiveness of the ESS
In early 2011, we commissioned Databuild Research & Solutions Pty Ltd (Databuild) to review the cost effectiveness of the ESS, in terms of both the cost per MWh of energy saved and cost per tonnes of carbon dioxide equivalent (tCO2-e) reduced. The review covered the first 18 months of the scheme’s operation, from July 2009 to December 2010, and aimed to:
quantify costs associated with delivering energy efficiency under the scheme while it was still relatively early in its lifecycle
undertake a cost-benefit analysis based of the scheme to help us report on the scheme’s performance, and
investigate how scheme participants were delivering the scheme, including scheme experience, delivery models, and drivers and barriers to entering the scheme.
To quantify the costs of the scheme, Databuild took account of the costs incurred by all parties, including Scheme Participants, Accredited Certificate Providers and IPART as Scheme Administrator. It used data provided by the 15 Scheme Participants14 and 18 Accredited Certificate Providers15 who elected to participate in the review. For the cost-benefit analysis, it used data from these 33 participants and from IPART’s certificate creation forecasts from 2009 through to 2020. The sole benefit considered was the reduction in energy used. This was conservatively quantified using the wholesale cost of energy rather than the retail cost.
At the time the review was undertaken, the projects accredited under the ESS consisted primarily of projects that had transitioned from GGAS, and projects that used Default Savings Factors (eg, showerhead replacement programs). Databuild found that these 2 types of projects had very different inherent cost structures. The transitioned projects’ costs had been realised before the ESS commenced. This meant the costs were not directly attributable to participating in the scheme, and so were excluded from the analysis. The costs of Default Savings Factor projects were directly attributable to participating in the scheme. Therefore, Databuild based the net costs per certificate on the average costs of the Default Savings Factor projects.
The cost-benefit analysis compared total expected costs to the total expected benefits to determine whether the ESS is a cost effective way to achieve energy savings and greenhouse gas abatement. It found that the benefits outweighed the costs by more than 2:1, and that the scheme produced a net benefit to society of more than $24 per energy savings certificate (Table 2.1). It therefore concluded that the ESS is cost effective.
14 Which represents 70% of total number of Scheme Participants. 15 Which represents 30% of the total number Accredited Certificate Providers in 2009 and 55% in
2010.

2 Developments in the ESS during 2011
12 IPART Compliance and Operation of the NSW Energy Savings Scheme during 2011
Table 2.1 Total net costs and benefits per certificate created
Year Total 2009-2020
Net certificate generation cost/certificate ($/certificate) ($15.07)
Net lifetime benefit per MWh saved ($) $39.63
Total net cost or benefit/certificate ($/certificate) $24.56
More information on the analysis can be found in Databuild’s report, which is available on the ESS website.16
2.4 Trends in costs of administering the ESS
For the 2010/11 financial year, the combined budget for administering the ESS and GGAS was $2.7 million. More than half of this cost (54%) was associated with staffing (salaries, superannuation, leave, etc). Approximately 80% was allocated to the ESS, giving a total budget of around $2.1 million.
The total budget increased by 27% relative to 2009/10. The main driver of the increase was the employment of additional staff to handle the expanding workload associated with the increasing obligations under the ESS. For example, in 2011, the number of applications for accreditation was approximately 16% higher than in 2010, and the number of Accredited Certificate Providers was 31% higher. This increased the workload associated with assessing applications, and ongoing reporting, monitoring, auditing and compliance activities.
Other drivers of the budget increase included the costs associated with redesigning the ESS website and application documentation for Accredited Certificate Providers to address complex technical issues that arose in relation to new energy saving activities (discussed in more detail in Section 2.5 below).
Overall, we consider that the growth and development of the ESS is being handled in an effective and cost-efficient manner based on the current needs of the program.
2.5 Review and redesign of ESS website and application documentation
During 2011, we reviewed the ESS website and the documentation it provides for businesses applying to become Accredited Certificate Providers. We found that after almost 2 years of operation, both the website and documentation needed to be updated to provide a better user experience with clearer, easier to understand information.
16 www.ess.nsw.gov.au/News_Events_and_Updates/ESS_Cost_Effectiveness_Analysis_Report.

2 Developments in the ESS during 2011
Compliance and Operation of the NSW Energy Savings Scheme during 2011 IPART 13
We launched a redesign project in partnership with the Office of Environment and Heritage (OEH) in May 2011. OEH worked directly with us on the project, and seconded one part-time staff member to the IPART project team. The project costs were shared between both organisations, with OEH contributing 64% of the total cost. The new website and application documentation were launched in January 2012.
2.5.1 Redesign of ESS website
The ESS website is used by all ESS participants and other stakeholders as a source of information and documentation. In the first phase of the redesign project, we researched users’ needs by testing the usability of the original website, which was launched in 2009. Based on the findings of these tests, we then developed a new website, including the information design and architecture, and the visual design, copywriting and search engine. In the final phase, we conducted accessibility and usability tests and made final adjustments to the website.
The new ESS website caters to the needs of all users, including potential applicants, consultants, householders or long-term participants in the ESS (see Figure 2.1). It provides targeted information based on the way in which the user participates in the ESS, and highlights the products and equipment that are the foundation of energy savings projects.

2 Developments in the ESS during 2011
14 IPART Compliance and Operation of the NSW Energy Savings Scheme during 2011
Figure 2.1 Home page of the new ESS website
2.5.2 Update of application documentation
In parallel with the redesign of the website, we reviewed and updated the documentation provided on the website for use by businesses applying to become Accredited Certificate Providers. The update’s aim was to make it easier for applicants to navigate their entry into the ESS and to encourage better quality applications. Its scope included:
streamlining documentation by reducing the number of essential documents referred to by applicants
using less formal language, written from the applicants’ perspective
restructuring documents to provide clearer guidance about the required systems, processes and project and equipment information, and
trialling the new application documents with prospective applicants.
During 2012, we will monitor the time required to assess applications and the completeness of those applications to assess the impact of the updated documentation.

2 Developments in the ESS during 2011
Compliance and Operation of the NSW Energy Savings Scheme during 2011 IPART 15
2.6 Introduction of pre-application workshops
In 2011, we introduced pre-application workshops to assist businesses considering applying for accreditation and to shorten the application process by improving the quality of applications. The workshops improve applicants’ understanding of the ESS, the application process, and the obligations of Accredited Certificate Providers.
The pre-application workshops are typically held on a monthly basis over a full day, at no cost to the participant. They are targeted at companies that have already identified energy savings activities, and are prepared to allocate time and effort to participate in the ESS.
The workshops are intensive, and cover the following topics:
overview of the ESS
eligibility criteria
calculation of energy savings certificates
audit regimes, and
record keeping requirements.
The also provide a valuable opportunity for potential applicants to understand the technical components of ESS by reviewing case studies and sample scenarios, and to explore the potential outcomes of the projects they have in mind.
Demand for and participation in the workshops has been strong. During the second half of 2011, we held 5 workshops for 65 participants from 53 companies. These workshops have contributed to an increased number of applications, and also resulted in better quality applications that can be processed in a more efficient and timely manner. For example, after the 2011 workshops, we received 16 applications for accreditation from workshop participants, which represents an application response rate of 30%.
In addition, feedback from participants has been very positive, and several companies have reported that their participation in the workshops led to both financial and business benefits for their companies. The feedback has also helped us identify areas to further develop and enhance future workshops and the program as a whole.

2 Developments in the ESS during 2011
16 IPART Compliance and Operation of the NSW Energy Savings Scheme during 2011
2.7 Developments in commercial lighting activities
There was a significant increase in commercial lighting activities in 2011, including 21 new accreditations, and significant increases in the number of certificates created from these activities and the proportion of total certificates created they represent (Table 2.2). Many of the accreditations in the sector involved replacing 50 watt halogen downlights with more energy efficient lighting options. However, some involved completely redesigning a business’ lighting using various lighting technologies and lighting controls. The businesses receiving lighting upgrades ranged from small retail premises to large industrial sites.
Table 2.2 Commercial lighting accreditations and certificates
Calendar year Number of new accreditations
Certificates created from commercial lighting activities
Proportion of total certificates created
2009 2 10,123 3.7%
2010 8 70,343 9.2%
2011 21 505,684 46.6%
To assist potential and existing Accredited Certificate Providers in this sector, we provided updated, comprehensive guidance in the Commercial Lighting Energy Savings Formula Guide17. This document covers an extensive range of information about the requirements for carrying out commercial lighting upgrades under the ESS.
2.8 Introduction of a system to verify residential activity
Accredited Certificate Providers are required to maintain records of their activities, including the locations (full addresses) where they conducted the activity and created certificates. As residential programs tend to involve a large number of locations, there is greater risk of errors – such as recording incomplete or incorrect addresses, duplicating addresses, and recording invalid or non-existent addresses. Certificates created from incomplete data are considered invalid unless the information can be verified.
To manage this risk, we introduced a system to validate the record keeping information supplied to us by Accredited Certificate Providers, known as the Address Verification Checking and Management System (AVCMS). The system involves requiring all Accredited Certificate Providers using Default Savings Factors to submit extracts of their record keeping database prior to creating energy savings certificates. We then review this information prior to the commencement of audits, and identify and reject any incomplete, duplicate or invalid records. This system has helped to improve the results of our audits, and has sent a strong signal to Accredited Certificate Providers to improve their own record keeping arrangements.
17 IPART, Commercial Lighting Energy Savings Formula Guide, February 2011.

2 Developments in the ESS during 2011
Compliance and Operation of the NSW Energy Savings Scheme during 2011 IPART 17
2.9 Conferences and presentations
In June 2011, we made a presentation at the Asian Clean Energy Forum in the Philippines. The conference was attended by delegates from around the world to exchange information and ideas on programs to stimulate energy efficiency.
In August 2011, we hosted the Energy Efficiency Forum and were pleased to have Dr Grayson Heffner from the International Energy Agency (IEA) attend as a guest speaker. Dr Heffner delivered a paper on the IEA’s new work program aimed at identifying how energy utilities can deliver energy efficiency.
The forum brought together officials from the NSW, Victoria, South Australia and the Commonwealth Governments, as well as representatives from energy retailers and network operators to share experiences in implementing energy efficiency programs. The forum provided an opportunity to exchange information and improve the understanding between jurisdictions for future knowledge sharing.
In December 2011, we made a presentation at the Policies for Energy Provider Delivery of Energy Efficiency (PEPDEE) workshop. This is an initiative of the IEA and the Regulatory Assistance Project. The aim is to promote knowledge sharing on how energy providers can improve the energy efficiency of their customers, and how governments and regulators can mobilise these efforts.
We also made a presentation to the Lighting Council of Australia on how the ESS operates, and the opportunities for the industry to become more involved in the ESS.
2.10 Harmonisation of energy efficiency schemes
A Joint Regulators Forum between NSW and Victoria was established in July 2011 to discuss topical operational and administrative issues facing the ESS and Victorian Energy Efficiency Target (VEET) schemes. We attended 2 forum meetings during the year.
On 14 December 2011, the NSW and Victorian Premiers announced an agreement to pursue a reform agenda with the aim of promoting economic growth, making it easier to do business, and putting downward pressure on the cost of living and running a business.18 As part of this reform agenda, the Premiers agreed to increase the consistency between the ESS and VEET schemes.
18 www.premier.nsw.gov.au/sites/default/files/111214%20-%20NSWVictoria.pdf

2 Developments in the ESS during 2011
18 IPART Compliance and Operation of the NSW Energy Savings Scheme during 2011
While the ESS and VEET are broadly similar, there are differences that may increase costs for those who participate in both schemes. Aligning the energy efficiency schemes will:
make it easier for firms creating energy efficiency certificates to operate in both States
reduce compliance costs for electricity retailers that operate in both jurisdictions, and
potentially broaden the range of activities that can occur in both jurisdictions.
The Premiers agreed to establish a joint Taskforce to report on options and recommendations by late 2012. The Taskforce will assess the impact on all stakeholders, including scheme administrators, participants and consumers. As Scheme Administrator of the ESS, we are a member of the technical working group which reports to the joint Taskforce.

3 Scheme Participants’ compliance performance
Compliance and Operation of the NSW Energy Savings Scheme during 2011 IPART 19
3 Scheme Participants’ compliance performance
Scheme Participants include all holders of NSW electricity retail licences, NSW electricity generators that supply directly to retail customers in NSW, and market customers in NSW that purchase their electricity directly from the National Electricity Market (NEM).
Each Scheme Participant is required to calculate its individual energy savings target for the year, and obtain and surrender sufficient certificates to meet this target. If it does not surrender sufficient certificates, it will have an energy savings shortfall. In this case, it can choose to carry forward some or all of this shortfall to the following year (within allowable limits) and/or pay a shortfall penalty.
Each Scheme Participant is also required to lodge an Annual Energy Savings Statement (AESS) for the calendar year with IPART (as Scheme Regulator) by no later than 18 March of the following year. The AESS must include the Scheme Participant’s calculation of its individual energy savings target for the year, the extent to which it met that target by surrendering certificates, any energy savings shortfall and any penalty it is required to pay. It must also include particulars of the Scheme Participant’s liable acquisitions and deductions in respect of any partially exempt loads.
In the majority of cases, we require the AESS to be accompanied by an independent audit report. However, Scheme Participants submitting nil returns can complete a simplified AESS which does not require an audit. In addition, we can grant audit exemptions for Scheme Participants that had low electricity purchases for the year and/or a very simple AESS.
During 2011, there were 33 Scheme Participants – including 29 retail electricity suppliers, 2 generators that supply directly to retail customers, and 2 market customers that purchase directly from the NEM. The sections below summarise these Scheme Participants’ compliance performance in 2011, and then discuss their energy savings shortfalls, penalties for energy savings shortfalls, applications for amended AESS and deductions for exempt loads in more detail.

3 Scheme Participants’ compliance performance
20 IPART Compliance and Operation of the NSW Energy Savings Scheme during 2011
3.1 Summary of Scheme Participants’ compliance performance in 2011
Of the 33 Scheme Participants, 18 fully met their 2011 individual energy savings targets under the ESS, including any remaining obligations for the 2010 compliance year. Of these, 11 surrendered sufficient certificates to meet their energy savings target, while a further 7 did not directly purchase or sell electricity in NSW and so were not required to surrender any certificates.
The remaining 15 Scheme Participants had an energy savings shortfall. Of these:
9 carried forward some or all of their shortfall to 2012
1 chose to pay a penalty covering its entire shortfall
3 chose to pay a penalty for part of the shortfall and carried forward the remainder to 2012
2 failed to meet their obligations and will be required to pay the shortfall penalty.
Table 3.1 provides the reconciliation between the certificates required to meet Scheme Participants’ combined compliance obligation for 2011 (including the shortfall carried forward from 2010, but excluding the shortfall carried forward to 2012) and the certificates surrendered. It shows that Scheme Participants’ combined compliance obligation was equivalent to 1,443,327 certificates, and that over 70% of this obligation was met by surrendering certificates (1,063,564 certificates). The bulk of the remaining obligation was met by paying penalties (equivalent to 251,361 certificates). The outstanding obligation (penalties to be paid by the 2 participants who failed to meet their obligations) is equivalent to 571 certificates, or 0.04% of the combined compliance obligation.
Table 3.1 Reconciliation of certificates required and certificates surrendered for calendar year 2011
Certificates required to meet 2011 compliance obligations 1,414,315 Total certificates surrendered 1,063,564
Add: Certificates required to meet shortfalls carried forward from 2010
29,012 Add: Penalties paid 250,790
Less: Shortfall carried forward to 2012
(128,402) Add: Penalties to be paid 571
Total certificates required to be surrendered
1,314,925Total certificates required to be surrendered
1,314,925
Table 3.2 provides details of the compliance performance of individual Scheme Participants.

3 Scheme Participants’ compliance performance
Compliance and Operation of the NSW Energy Savings Scheme during 2011 IPART 21
Table 3.2 Scheme Participants’ compliance for the 2011 compliance year
Compliance performance Scheme Participant
Surrendered sufficient certificates to meet their individual 2011 energy savings target
Aurora Energy Pty Ltd Australian Power & Gas Pty Ltd
Delta Electricitya
Dodo Power & Gas Ltd EnergyAustralia (now Ausgrid)
Eraring Energyb
Lumo Energy
Macquarie Generationa
Red Energy Pty Ltd Tarong Energy Corporation Ltd
Tomago Aluminium Company Pty Ltdb
Did not directly purchase or sell electricity in NSW and therefore was not required to surrender certificates
Actew AGL Retail Ltd Diamond Energy Pty Ltd GridXPower Pty Ltd Metered Energy Simply Energy Stanwell Corporation WINenergy
Surrendered certificates to meet part of their 2011 energy savings target and chose to carry forward their energy savings shortfall to 2012
AGL Sales AGL Sales (Queensland Electricity) Pty Ltd Country Energy (now Essential Energy) ERM Power Retail Pty Ltd Integral Energy (now Endeavour Energy) Origin Energy Electricity Limited (including Cogent Energy and Sun Retail)c Powerdirect Pty Ltd
Surrendered certificates to meet part of their 2011 energy savings target, chose to carry forward part of their energy savings shortfall to 2012, and paid a penalty to cover any remaining obligations
Momentum Energy Pty Ltd TRUenergy Pty Ltd TRUenergy Yallourn
Met their entire 2011 obligations by paying a penalty
Infigen Energy Markets Pty Ltd
Failed to meet their obligation Sanctuary Energy Pty Ltd Independent Electricity Retail Solutions Pty Ltd
a A direct supplier of electricity. b A market customer. Section 101(2) of the Act defines a market customer as: a customer that has classified any of its electricity loads as a market load and that is registered with the Market Operator as a market customer under the National Electricity Rules (within the meaning of the National Electricity (NSW) Law). c Origin Energy submitted a single AESS covering Origin Energy Electricity, Cogent Energy and Sun Retail.
Note: In March 2011, Origin purchased Country Energy's electricity and gas retailing business as well as Integral Energy's electricity retailing business; and TRUenergy acquired EnergyAustralia’s retail customer base. Accordingly, 2011 energy savings statements for sales attributed to Country Energy and Integral Energy were submitted by their renamed distribution businesses, Essential Energy and Endeavour Energy, respectively.

3 Scheme Participants’ compliance performance
22 IPART Compliance and Operation of the NSW Energy Savings Scheme during 2011
3.2 Energy savings shortfalls carried forward
Section 116 of the Act provides that that a Scheme Participant with an energy savings shortfall for a given year can elect to carry forward at least some of this energy savings shortfall to the next year. Under the legislation, the maximum amount of energy savings shortfall that may be carried forward is equivalent to 10% of the Scheme Participant’s individual energy savings target.19 Any shortfall carried forward must be met in the following compliance year.
For the 2011 compliance year, 11 Scheme Participants elected to carry forward a total of 128,402 certificates to the 2012 compliance year. This equates to 9% of the total compliance obligation for 2011 across all Scheme Participants.
3.3 Energy savings shortfall penalties paid
Section 112 of the Act provides that a Scheme Participant with an energy savings shortfall for a given year (which it has not carried forward to the following year) is liable to pay a penalty in respect of that shortfall. This effectively allows the Scheme Participant to ‘buy out’ its compliance obligations for that year.
The Scheme Participant’s penalty liability is calculated by multiplying its energy savings shortfall by the ESS penalty rate for that year. This rate is established by taking the base penalty rate (listed in the Regulation, and expressed in $ per MWh), then multiplying it by the penalty conversion factor (also listed in the Regulation). This converts the base rate to $ per tCO2-e, which is the unit of measure for energy savings shortfalls. Figure 3.1 illustrates the penalty calculation.
Every year, the base penalty rate is indexed by changes in the CPI using an equation listed in the Regulation. For 2011, the ESS penalty rate was $23.99 per tCO2-e.
As noted above, 4 Scheme Participants chose to pay a penalty in respect of some or all of their energy savings shortfall to meet their 2011 compliance obligations. Their combined penalty payments totalled approximately $6 million, which was equivalent to an energy savings shortfall of 250,790 certificates (Table 3.3).
Table 3.3 Scheme Participants that chose to pay penalties in 2011
Scheme Participant Energy savings shortfall (certificates)
Penalty ($)
Infigen Energy Markets Pty Ltd 7,410 $177,757
Momentum Energy Pty Ltd 9,525 $228,493
TRUEnergy Pty Ltd 196,752 $4,719,844
TRUenergy Yallourn Pty Ltd 37,103 $890,056
Total 250,790 $6,016,150
19 Section 116(4) of the Act.

3 Scheme Participants’ compliance performance
Compliance and Operation of the NSW Energy Savings Scheme during 2011 IPART 23
The 2 Scheme Participants that failed to meet their obligations – Independent Electricity Retail Solutions (IERS) and Sanctuary Energy – owed penalties for a combined energy savings shortfall equivalent to 571 certificates. This shortfall represents 0.04% of the total certificates required to be surrendered in 2011.
The Regulation provides for Scheme Participant to apply to IPART, as Scheme Regulator, to amend the assessment of their penalty liability within a year of the original assessment. If approved, this allows them to surrender a certain number of additional certificates after the end of the year and thus reduce their penalty liability for that year (and receive a refund for the amount they overpaid). As at 30 June 2012, 3 Scheme Participants had applied for an amendment of their penalty liability.
Figure 3.1 Calculating the penalty associated with an energy savings shortfall
3.4 Exempt loads
The ESS includes provisions that allow a portion of the Scheme Participants’ electricity sales to be excluded in calculating their annual liable electricity acquisitions, from which their individual energy savings targets are calculated in MWh. In particular, a number of large electricity customers have been granted exemptions for part of the electricity load they use in ‘emissions intensive and trade exposed’ industries or activities. These entities are set out in a Ministerial Order published by the Minister for Energy in the Government Gazette.20
20 The Ministerial Order published on 24 December 2010 applies for the 2011 year. For 2012
compliance, the Ministerial Order published on 16 December 2011 applies. See www.nsw.gov.au/gazette.
Penalty ($)
Energy savings shortfall (tCO2-e)
ESS penalty rate($/tCO2-e)
Penalty Conversion Factor
(MWh/tCO2-e)
Base penalty rate ($/MWh) x
x

3 Scheme Participants’ compliance performance
24 IPART Compliance and Operation of the NSW Energy Savings Scheme during 2011
The Ministerial Order lists each exempt entity (company or business name), the trade exposed activity, the specific location where the activity takes place, and the proportion of the load that is exempt under the ESS (either 60% or 90%). These entities must provide their electricity retailer with details of their exempt load in order to claim the exemption. The retailer then deducts this proportion of the load from its annual liable electricity acquisitions, thereby reducing its annual energy savings target (in MWh).
During 2011, 25 entities were granted exemptions for 33 specified locations. These included:
8 locations granted exemptions for 60% of the load. The activities undertaken at these locations included the production of tissue paper, glass containers, ceramic floor and wall tiles, chlorine gas, sodium hydroxide, ammonium nitrate, nitric acid, ethanol and hydrogen peroxide, magnetite concentrate.
25 locations granted exemptions for 90% of the load. The activities undertaken at these locations include the manufacture of paper, newsprint, packaging and flat glass, the production of lime, clinker, magnesia, carbon black, ethylene and polyethylene, coke and iron, as well as steel making, aluminium smelting and petroleum refining.
Nine Scheme Participants supplied electricity to these entities at these locations. In total, the exempt loads comprised approximately 20% of the total electricity supplied in NSW during the 2011 compliance period.
Appendix A, Section A.6 provides further information on the Ministerial Order and the Exemptions Rule.

4 Accredited Certificate Providers’ performance
Compliance and Operation of the NSW Energy Savings Scheme during 2011 IPART 25
4 Accredited Certificate Providers’ performance
Accredited Certificate Providers are voluntary participants in the ESS. They apply for accreditation in respect of eligible Recognised Energy Savings Activities (RESAs) as defined in the ESS Rule (see Box 4.1). Once accredited, they can create certificates from these activities. One certificate represents the energy savings associated with the abatement of one tonne of carbon dioxide equivalent (tCO2-e).
To become an Accredited Certificate Provider, an entity must apply to IPART (as Scheme Administrator) for accreditation. Their application must demonstrate that they and their proposed RESA fully meet the criteria for accreditation according to the Act, Regulation and ESS Rule. Once accredited, they are subject to a number of conditions of accreditation which outline their ongoing compliance responsibilities.
An Accredited Certificate Provider may be accredited for more than one RESA – for example:
RESA 1: providing lighting upgrades in both the commercial and industrial sectors, and
RESA 2: selling new high-efficiency refrigerators, and removing and appropriately disposing of existing refrigerators built before 1996.
An Accredited Certificate Provider must lodge a separate application for each RESA. Once accredited, each RESA may be further classified into separate projects. For example, in RESA 2 above, the refrigerator sales activity and the refrigerator removal activity would be classified as different projects. The Accredited Certificate Provider is required to register the certificates created by each individual project, which are tracked separately in the Registry.
75 Accredited Certificate Providers and 113 RESAs were accredited to create certificates of 2011 vintage21. The RESAs included a total of 172 individual projects. The sections below summarise the Accredited Certificate Providers’ compliance performance during the year, and then discuss their RESAs in more detail.
21 The calendar year in which energy savings activities occurred, or were deemed to have
occurred.

4 Accredited Certificate Providers’ performance
26 IPART Compliance and Operation of the NSW Energy Savings Scheme during 2011
Box 4.1 What are Recognised Energy Savings Activities?
RESAs are specific activities implemented by an Accredited Certificate Provider that increasethe efficiency of electricity consumption, or reduce electricity consumption, without negativeeffects on production or service levels, by:
modifying end-user equipment or usage of end-user equipment (including installingadditional components)
replacing end-user equipment with other end-user equipment that consumes lesselectricity
installing new end-user equipment that consumes less electricity than other end-userequipment of the same type, function, output or service, or
removing end-user equipment that results in reduced electricity consumption, where thereis no negative effect on production or service levels, including safety.
4.1 Accredited Certificate Providers’ compliance performance in 2011
All Accredited Certificate Providers are responsible for complying with the conditions of their accreditation and other obligations under the ESS. Failure to do so may result in breach notices, or suspension or cancellation of their accreditation. The Act sets out the actions that constitute a contravention of these obligations, including:
contravening the conditions of accreditation (which include submitting annual report statements by the required deadline, undertaking annual, periodic or ‘spot’ audits of their RESAs as prescribed, and notifying the Scheme Administrator of any changes to their accredited RESA) (S138)
improperly creating certificates (S133)
obstructing the Scheme Administrator (S157)
supplying false or misleading information (S158).
During 2011, there were 30 instances of contravention (Table 4.1). Most of these related to failure to submit an Annual Report Statement by the required deadline or the improper creation of certificates. These instances were discovered through our administration processes, the compliance audit process, or by voluntary declaration by the Accredited Certificate Provider.
Table 4.1 Contraventions by Accredited Certificate Providers
2010 2011
Failure to submit an Annual Report Statement by the required deadline (S138) 3 15
Improper creation of certificates (S133) 11 14
Failure to engage an auditor by the required deadline (S138) 0 1

4 Accredited Certificate Providers’ performance
Compliance and Operation of the NSW Energy Savings Scheme during 2011 IPART 27
4.1.1 Failure to submit an Annual Report Statement
The 15 instances of failure to submit Annual Report Statements involved 14 Accredited Certificate Providers. Three Accredited Certificate Providers (in respect of 4 accreditations) promptly completed their outstanding compliance obligations by submitting their Annual Report Statement once advised of the breach. Another 8 satisfactorily completed their outstanding obligations after we advised them of the breach and sent several reminders.
The remaining 3 Accredited Certificate Providers did not submit their Annual Report Statement. The accreditations of 2 of these providers were subsequently cancelled, while the third submitted its Annual Report Statement in May 2012. This Accredited Certificate Provider, the University of Wollongong, is restricted from creating any further certificates until it meets a number of requirements (discussed further below).
4.1.2 Improper creation of certificates
The 14 instances of improper creation of certificates involved 9 Accredited Certificate Providers. Of these instances, 12 resulted from some form of administrative error on the part of the Accredited Certificate Provider, rather than critical or systematic errors. Five of the instances were considered material in nature or quantity, while the other 7 were considered non-material.
Together, these 14 instances resulted in the over-creation of 50,006 certificates, and Enact Energy was responsible for 75% of this over-creation. In each instance, we notified the Accredited Certificate Providers involved and most agreed to voluntarily forfeit the over-created certificates. However, as at 30 June 2012, a small proportion (0.4%) of the over-created certificates had yet to be forfeited.
Reasons for improper creation
The specific reasons for the instances of improper certificate creation were:
administrative error, such as registering the incorrect number of certificates, the incorrect vintage or the incorrect project identifier (5 instances)
use of incorrect input data or ineligible data (4 instances)
use of ineligible or inaccurate nomination forms (3 instances)
incorrect data and critical issues with record keeping (1 instance)
certificate creation under the incorrect vintage, lack of records to support certificate creation and systemic issues in record keeping arrangements (1 instance).

4 Accredited Certificate Providers’ performance
28 IPART Compliance and Operation of the NSW Energy Savings Scheme during 2011
Material instances of improper creation
In general, the number of certificates improperly created is considered ‘material’ if it exceeds 5% of the total certificate claim being audited. (See Box 4.2 for more information on materiality.)
The 5 instances of improper creation in 2011 considered to be material involved 3 Accredited Certificate Providers. The first instance involved Western Sydney Local Health District. This instance resulted in the over-creation of 131 certificates, which represented 14% of the 2009 vintage certificates claimed and 3.5% of the 2010 vintage certificates claimed. It was identified during a periodic audit and caused by the use of incorrect input data being used in certificate calculations. Western Sydney Local Health District agreed to voluntarily forfeit 131 certificates, and implemented corrective action to prevent future occurrences of this error.
The second instance involved the University of Wollongong. It resulted in the over-creation of 210 certificates, which represented 22% of the certificates claimed. In this case, the auditor found that the over-creation was caused by critical issues with the record keeping arrangements. As at 30 June 2012, the University of Wollongong had not responded to our request to voluntarily forfeit the over-created certificates or addressed the issues in relation to its record keeping. The University of Wollongong has been restricted from creating certificates until these issues are resolved.
The remaining 3 instances involved Enact Energy and its showerhead replacement activities. Together, these instances involved the over-creation of 48,221 certificates. The auditor identified that the over-creation was caused by errors arising from systemic issues with the record keeping arrangements. Enact Energy agreed to voluntarily forfeit:
8,730 certificates that were over-created as a result of administration error when registering certificates
2,074 certificates that were over-created as a result of ineligible nomination forms, and
37,407 certificates that were over-created as a result of certificate creation under the incorrect vintage.
Enact Energy’s accreditation was suspended in June 2011 while these issues were investigated. See Section 4.1.4 for further information.
Non-material instances of improper creation
The 7 instances of improper certificate creation considered to be immaterial involved 7 Accredited Certificate Providers. Together, these instances resulted in the over-creation of 1,454 certificates. In all cases, the Accredited Certificate Providers agreed to voluntarily forfeit (or forego the creation of) these certificates.

4 Accredited Certificate Providers’ performance
Compliance and Operation of the NSW Energy Savings Scheme during 2011 IPART 29
Box 4.2 What is meant by materiality?
In auditing Accredited Certificate Providers, auditors are required to identify any errors and assess their materiality. Errors are considered to be material if they could adversely influence the integrity of the activity undertaken or the number of certificates registered by an Accredited Certificate Provider. As a guide, errors that result in improperly created certificatesare generally considered to be material if the improperly created certificates exceed 5% of the total certificate claim being audited.
When an auditor finds a material error, the audit is considered a ‘failed audit’. The Accredited Certificate Provider is required to take immediate corrective actions to rectify the error, and to‘make good’ the error by voluntarily forfeiting a percentage of its total certificate claim equal to the error rate identified by the auditor. (For example, if an auditor identifies a 10% error rate, then the Accredited Certificate Provider is required to forfeit 10% of the certificates that were subject to the audit.) Once these actions are taken, there is generally a ‘re-audit’. We may decide to amend the Accredited Certificate Provider’s conditions of accreditation to reflect the findings or recommendations of the auditor. In these circumstances we may require the Accredited Certificate Provider to enter into a Deed agreement whereby a prescribed percentage of future certificate creation is withheld from trade until completion of asubsequent audit.
When an auditor finds a non-material error, the Accredited Certificate Provider is usually givena period of time in which to make the recommended changes and report to us on thosechanges. It is also required to ‘make good’ the error by voluntarily forfeiting the number of improperly created certificates identified during the audit (rather than a percentage of its total certificate claim in line with the identified error rate).
For further information on materiality and treatment of errors, refer to our Compliance and Performance Monitoring Strategy on our website.a
a www.ess.nsw.gov.au/For_Auditors/Audit_process.
4.1.3 Failure to engage an auditor by the required deadline
The one instance of failure to engage an auditor by the required deadline involved the University of Wollongong. The Accredited Certificate Provider met this obligation after several reminders.
4.1.4 Suspension of accreditation
The Regulation provides the Scheme Administrator with the power to suspend an accreditation for a variety of reasons. This includes when the Accredited Certificate Provider has contravened its accreditation conditions and/or the legislation governing the ESS.

4 Accredited Certificate Providers’ performance
30 IPART Compliance and Operation of the NSW Energy Savings Scheme during 2011
In 2011, it was discovered that Enact Energy had improperly created certificates and had not maintained an up-to-date record of the data, assumptions and methodology it used to calculate the energy savings from its activities. A large number of certificates had been created without complete and correct nomination forms. Furthermore, certificates of 2010 vintage had been created for activities undertaken in 2011. These were clear contraventions of both accreditation conditions and the legislation that resulted from system failures in Enact Energy’s record keeping and quality assurance processes.
We considered that this contravention could adversely affect the integrity of the ESS, and so suspended Enact Energy’s accreditation under the ESS on 9 June 2011. The suspension covered all of Enact Energy’s activities, including showerhead replacement, showerhead sales, and commercial lighting activities.
On 20 June 2011, we lifted the suspension in relation to Enact Energy’s showerhead replacement and commercial lighting activities. We also amended its accreditation conditions in relation to these activities to stipulate a requirement for a ‘pre-registration’ audit. This meant that Enact Energy could not create certificates in respect of these activities until an audit of the activities and associated record-keeping arrangements had been completed and positive assurance given over any proposed certificate creation.
On 22 June 2012, we lifted the suspension in relation to Enact Energy’s showerhead sales activities. We also entered into a Deed agreement with Enact Energy whereby it agreed to voluntary forfeit 37,407 certificates that had been over-created for activities in 2010. All voluntary forfeitures were completed by 30 June 2012 and the matter has now been closed.
4.2 Risk management
When determining the audit regimes for individual Accredited Certificate Providers, we apply a risk management approach. The type and frequency of audits is determined by the risk rating of the RESA and the performance of the Accredited Certificate Provider. We adjust these regimes to reward good performance as well as to respond to poor performance.
In 2011, we moved quickly to manage a number of risks to the ESS that emerged in relation to showerhead sales programs. As discussed above, we suspended an Accredited Certificate Provider’s accreditation temporarily, and then imposed appropriate requirements on the provider to manage the ongoing risk, including placing it on a pre-registration audit regime and entering into a Deed agreement.

4 Accredited Certificate Providers’ performance
Compliance and Operation of the NSW Energy Savings Scheme during 2011 IPART 31
Suspending an Accredited Certificate Provider’s accreditation is an extreme measure, which we use when we have serious concerns about the activities of an Accredited Certificate Provider and evidence of serious instances of invalid certificate creation. We have only used this measure once since the ESS commenced. While the Accredited Certificate Provider was suspended, it was given clear guidance on the steps it would need to take for the suspension to be lifted.
Placing an Accredited Certificate Provider on a pre-registration audit regime provides the highest level of assurance. A pre-registration audit means that only certificates that receive positive assurance from an audit can be registered. However, it also means that revenue from the sale of certificates cannot be earned until after the audit is completed.
Entering into a Deed agreement between IPART and the Accredited Certificate Provider also provides a high level of assurance. The Accredited Certificate Provider enters into the Deed on a voluntary basis. The terms and conditions of the Deed vary to reflect individual circumstances, but generally they require the Accredited Certificate Provider to withhold from trade a portion of certificates created until an audit is completed. By using a Deed, revenue can be earned from the sale of certificates not covered by the Deed prior to auditing. If certificates are found to be invalid during an audit, they are forfeited from the retained portion. In the worst case, additional certificates may need to be forfeited. Once the audit is finalised, the terms of the Deed may be adjusted up or down to reflect the performance of the Accredited Certificate Provider in meeting its conditions of accreditation.
4.3 RESAs accredited to create certificates for 2011
To be accredited, a RESA needs to meet the criteria for one of the 3 broad methods for calculating energy savings set out in the ESS Rule, or one of its sub-methods. These methods are the Project Impact Assessment Method, the Metered Baseline Method, and the Deemed Energy Savings Method.
The majority of RESAs accredited to date use the default savings factors or the commercial lighting formula sub-methods of the Deemed Energy Savings Method. These methods are simple to apply, and make use of deeming energy savings at the time of certificate creation, with consequential discounting of those savings. Neither requires technical monitoring and ongoing measurements to determine energy savings which is also an advantage. In each case, specific factors are listed in the Schedules to the ESS Rule which determine the exact number of certificates that can be claimed from each activity.
Some of the RESAs accredited to date use the Project Impact Assessment Method or the Metered Baseline Method, or the other sub-methods of the Deemed Energy Savings Method to claim savings. These methods cover a broader range of activities, and are more technically complex. They are more suited to capital-intensive energy efficiency projects in the commercial and industrial sectors. Deeming of the energy

4 Accredited Certificate Providers’ performance
32 IPART Compliance and Operation of the NSW Energy Savings Scheme during 2011
savings is possible under most of the calculation methods, with the exception of the Metered Baseline Method.
Table 4.2 shows the number of RESAs accredited to create certificates, by the year in which they were accredited and the method they used to calculate the energy savings claimed. The RESAs accredited in 2012 include those where the application lodgement and project implementation occurred prior to 31 December 2011, but were accredited in the first half of 2012. These RESAs were allowed to claim 2011 vintage certificates.
Appendix A, Section A.8 provides more information on the 3 methods and their sub-methods, and on the process for incorporating a new methodology into the ESS Rule.
Boxes 4.3 to 4.6 provide some examples of RESAs accredited under each of the 3 methods that were active during 2011.
Table 4.2 Number of RESAs by year accredited and energy savings calculation method
2009 2010 2011 2012a
Project Impact Assessment Method 15 10 5 3
Metered Baseline Method
Baseline per unit of output 4 1 0 0
Baseline unaffected by output 1 0 1 2
Normalised baselines 0 0 0 0
NABERS baseline 0 4 1 1
Deemed Energy Savings Method
Default Savings Factors 9 7 9 0
Commercial Lighting Formula 2 8 21 7
High Efficiency Motor Formula 0 0 0 0
Power Factor Correction Energy Savings Formula 1 1 0 1
Total RESAs accredited 32 31 37 14 a Applications accredited in the first half of 2012 that can claim 2011 vintage certificates.
4.4 RESAs amended and cancelled during 2011
During 2011, we assessed 32 amendments to existing RESAs. The Accredited Certificate Providers sought these amendments for a variety of reasons. However, in general, they included at least one of the following:
amendment to the nominated number of certificates that can be created
addition or removal of Special Accreditation Conditions
amendment to audit and/or reporting requirements
amendment to the application of equations and/or methods used
amendment due to changes to the ESS Rule.

4 Accredited Certificate Providers’ performance
Compliance and Operation of the NSW Energy Savings Scheme during 2011 IPART 33
We also processed 8 cancellations of RESAs. The majority of cancellations were due to the Accredited Certificate Provider withdrawing its participation in the scheme following the cessation of RESA activity. One cancellation was made on the grounds that the corporation was placed under external administration/control.
4.5 Applications under assessment at the end of 2011
We receive applications for accreditation throughout the year. Once an application is deemed complete and the application fee of $500 has been paid, we review the information provided against the requirements of the Act, Regulation, Rule and our published policies and procedures. Where information is deemed insufficient or is missing, we request this information from applicants and assessment of the application is placed on hold until the information is received. The application assessment process then continues, although we may need to make further requests for information from the applicant. The process of requesting and awaiting further information from applicants impacts on the time taken to finalise our assessment.
As at 31 December 2011, we had 22 applications under assessment. Of these:
10 were on hold, awaiting further information requested from the applicant
4 were undergoing initial assessment as they had been received in late November or December
4 were being prepared for consideration by the ESS Committee
3 were on hold, awaiting re-submission of the application due to incomplete information or change of methodology, and
1 was on hold as the application methodology only became eligible for consideration following the December 2011 Rule change (see Section 2.2).
4.6 Disclosure of external funding
When applying for accreditation, applicants are required to list sources of external funding, and to provide evidence that the funding provider is aware of proposed certificate creation under the ESS. During 2011, a number of applicants identified that part of the funding for implementing their energy savings activities had been provided through the Energy Efficiency for Small Business Program (EESBP) run by OEH. We informed the EESBP administrator, or required the applicant to inform the administrator of the intention to claim ESCs for these activities.
As the range of funding sources for energy efficiency increases, we expect to see more applicants incorporating external funding models into their energy savings activities.

4 Accredited Certificate Providers’ performance
34 IPART Compliance and Operation of the NSW Energy Savings Scheme during 2011
4.7 Case studies
During 2011, the types of energy savings activities were diverse, covering all calculation methods under the ESS Rule. The case studies below describe a selection of RESAs during 2011.
4.7.1 Example of a RESA accredited under the Project Impact Assessment Method
Box 4.3 Out Performers – OP008 Westpac DCD
Out Performers is accredited for an energy savings project at Westpac’s North Ryde andChatswood data centres. Data centres consume significant amounts of electricity (severalmegawatts) and have a high energy density per square metre of data centre floor area. Byimplementing server virtualisation, devices can be decommissioned and thus achieve energysavings.
Server virtualisation increases the efficiency of server utilisation by dividing one physical serverinto multiple isolated virtual environments This results in a reduction in the number of serversand associated IT equipment that reduces electricity consumption, heat dissipation and hencethe load on the air conditioning system. The combined reduction in electricity demand and airconditioning load contributes to the overall energy savings.
Energy savings from this project resulted in the 5-year forward creation of 10,592 certificates.

4 Accredited Certificate Providers’ performance
Compliance and Operation of the NSW Energy Savings Scheme during 2011 IPART 35
4.7.2 Examples of RESAs accredited under the Deemed Energy Savings Method
Box 4.4 Autonomous Energy Pty Ltd – Lighting Energy Efficiency Upgrade in Commercial Buildings
As part of the Office of Environment & Heritage’s Energy Saver Program, Autonomous Energyconducted a Level 2 Energy Audit for Pymble Ladies’ College in Sydney. Significant energy andcost savings were identified and Autonomous Energy provided a comprehensive efficiencyupgrade package, identifying all existing T8 fluorescent fixtures and halogen lamps as a majoropportunity for an upgrade to LED fixtures.
A small trial of the LED fixtures at the school was approved and subsidised by the National SolarSchools Program. Overwhelmingly positive results were achieved in this trial and a much largerroll out of the LED technology was completed.
Autonomous Energy replaced and recycled over 1,500 T8 fluorescent tubes and over 500 halogens for Pymble Ladies’ College over two separate roll out phases during 2011 withadditional upgrades completed in 2012.
Autonomous Energy used the Commercial Lighting Energy Savings Formula to calculate theenergy savings from this project. The determination of actual energy and cost savings followedcurrent best practice, as defined by the International Performance Measurement & VerificationProtocol (IPMVP) framework. This calculation takes into account logged hours of use of each of the different areas upgraded, seasonal variations in temperature and output as well as theeffects of time of use electricity tariffs and all other electricity network and peak demandcharges. From these calculations, it was established that a reduction in electricity costs of $22,606 per annum was achieved.
Energy savings from this project resulted in the creation of 2,679 certificates during 2011.

4 Accredited Certificate Providers’ performance
36 IPART Compliance and Operation of the NSW Energy Savings Scheme during 2011
Box 4.5 Essential Energy – Streetlighting Replacement Program
Street lights can be high electricity consumers because of the large numbers and extendedhours of operation. Essential Energy’s Energy Efficient Luminaire Program involves upgradingstreet lights with more efficient units to achieve energy savings in partnership with localgovernment. The program is the first of its kind in New South Wales (NSW), paving the way forsignificant environmental and cost savings for Essential Energy and its stakeholders.
Essential Energy provides streetlighting maintenance services for local councils in its networkregion and offers lighting upgrades to councils, or responds to councils requesting lightingupgrades.
Street lighting is supplied through a utility meter along with other loads but is not generallysub-metered. For billing purposes, the Australian Energy Market Operator (AEMO) publishesNational Electricity Market load tables for unmetered connection points as required underSchedule 12 of the National Electricity Market metrology procedure. These values are used as areference to calculate interval energy data for unmetered connection points.
Essential Energy is using the street lighting lamp power consumption figures provided in theAEMO National Electricity Market Load Tables for unmetered connection points. This providesfor consistency with the billing information provided to local councils by Essential Energy.
Essential Energy uses the commercial lighting formula to calculate energy savings from thisprogram. As specified in the ESS Rule, energy savings are calculated on the default of4,500 operating hours per annum.
6,141 Energy Savings Certificates were created from energy savings associated with thisinitiative in 2011.
4.7.3 Example of RESA accredited under the Metered Baseline Method
Box 4.6 Knowledge Global Pty Ltd – Fitness First Efficiency Verification Program
Knowledge Global Pty Ltd is accredited for its efficiency verification program at 37 Fitness Firstgyms in NSW. Health clubs are very energy intensive with large lighting and HVAC loads, aswell as energy consumption from pool heating and pumping, hot water use, saunas and otherequipment. This project includes a series of energy efficiency initiatives including: behaviouralchanges and reporting, lighting and controls upgrades, and HVAC maintenance and upgrades.
This project was accredited under the Metered Baseline Method - Baseline Unaffected byOutput. This method established a consumption baseline for each site before the project wasimplemented, using 5 years' worth of data from monthly electricity bills. The energy savingsare then determined by calculating the difference between the actual monthly energyconsumption and the corresponding baseline consumption for that month.
Energy savings from this project resulted in the creation of 3,054 certificates during 2011.

5 Audit activities
Compliance and Operation of the NSW Energy Savings Scheme during 2011 IPART 37
5 Audit activities
The ESS legislation provides wide auditing powers to assist us in fulfilling the functions of Scheme Administrator and Scheme Regulator. For example, to ensure that the integrity of certificates created under ESS is maintained, we are able to impose audit requirements on ESS participants and to use those audits to provide assurance that:
Scheme Participants are meeting their individual energy savings targets, and
Accredited Certificate Providers are creating certificates in accordance with the Act, Regulation and the ESS Rule.
To assist us and ESS participants in meeting these audit requirements, we have established a panel of eligible independent third party auditors, known as the ESS Audit Services Panel (the Audit Panel). The sections below summarise ESS audit activity in 2011, and provide information on the Audit Panel, the Compliance and Performance Monitoring Strategy, and the audit requirements placed on Scheme Participants and Accredited Certificate Providers.
5.1 Summary of audit activity in 2011
For the 2011 compliance year, the Audit Panel undertook 11 audits of Annual Energy Savings Statements (AESS), which covered 13 Scheme Participants’ statements. These audits aim to confirm the inputs provided by Scheme Participants when reporting their liable energy acquisitions and any claimed exempt loads. Primarily, they involve the auditor checking the calculations and, if confirmed, signing off on the number of certificates to be surrendered for compliance.
During 2011, the Audit Panel undertook 28 audits covering 34 RESAs as part of the compliance regime imposed on applicants and Accredited Certificate Providers. The scopes of these audits generally cover certificate creation and record keeping arrangements. They aim to validate information supplied during the application phase, to verify an Accredited Certificate Provider’s ongoing eligibility, and to verify calculations carried out by an Accredited Certificate Provider in the course of creating certificates. Audit frequencies vary for each RESA.

5 Audit activities
38 IPART Compliance and Operation of the NSW Energy Savings Scheme during 2011
Of the 28 audits of RESAs, 11 were initiated by the Scheme Administrator to perform audits of high-risk activities, such as showerhead projects. These 11 audits were initiated prior to the registration of certificates or on a volumetric basis after the creation of a set number of certificates, usually 10,000. The total cost of these audits was just under $220,000. When audits are initiated by the Accredited Certificate Provider, we approve the scope of the audit, however we generally do not know the audit cost.
Table 5.1 provides summary data on audit activity in 2011.
Table 5.1 ESS audit activity
2010 2011
AESS audits
Number of audits 18a 13b
Number of AESSs covered 20a 13b
RESA audits initiated by the Scheme Administratorc
Number of audits 11 11
Number of RESAs covered 11 13
RESA audits initiated by Accredited Certificate Providersc
Number of audits 5 17
Number of RESAs covered 7 21 a Conducted in the first quarter of 2011. b Conducted in the first quarter of 2012. c Conducted during the 2011 calendar year.
5.2 ESS Audit Services Panel
All ESS audits must be undertaken by a member of the Audit Services Panel with IPART (acting as either the Scheme Administrator or Scheme Regulator) as the principal client. All audits are paid for by the relevant Scheme Participant or Accredited Certificate Provider.
Audit firms are eligible to apply to be members of this panel at any time. We assess applications against specific selection criteria to ensure that each firm on the panel has both the institutional capacity to support the audit process, and appropriate lead auditors with demonstrated skills and experience required to conduct reasonable assurance audits under the ESS.22
Panel members provide services in accordance with an Audit Services Panel Agreement. In addition to auditing, they may provide advice or consultancy services to Accredited Certificate Providers or to IPART under this agreement where no
22 A Panel Application Form is available from the Scheme website at www.ess.nsw.gov.au/
For_Auditors/Join_the_audit_panel.

5 Audit activities
Compliance and Operation of the NSW Energy Savings Scheme during 2011 IPART 39
conflict of interest exists. Audit Services Panel members may not be accredited as an Accredited Certificate Provider because of potential conflicts of interest.
At the end of 2011, 8 firms with a total of 21 lead auditors were appointed to the Audit Services Panel. Table 5.2 lists the Audit Services Panel members at the end of 2011.
Table 5.2 Audit Services Panel members at the end of 2011
Clear Environment Pty Ltd Ernst & Young
Energetics Pty Ltd GHD Pty Ltd
ENVIRON Australia Pty Ltd PricewaterhouseCoopers
ERM Pty Ltd URS Australia Pty Ltd
5.3 Compliance and Performance Monitoring Strategy
Our Compliance and Performance Monitoring Strategy helps us manage the compliance of participants in the ESS. Our objective in establishing this strategy is to inform all stakeholders how we assess risk, determine audit regimes and manage ongoing compliance with the ESS. Our approach includes:
using a risk-based approach by assigning a risk rating of low, medium, high or extreme for each RESA
rewarding good compliance performance and allowing a prompt and fair response to poor compliance
providing an opportunity to reduce audit costs, and
clearly stating the ESS materiality threshold and describing how errors will be treated.
The Compliance and Performance Monitoring Strategy is published on our website.23
5.4 Scheme Participant audits
Scheme Participants are required to lodge an audited AESS with us (as the Scheme Regulator) each year in respect of the previous year’s compliance period. In 2011, 9 audit exemptions were granted on the basis of low or nil electricity purchases in NSW. We have adopted this approach to increase the probability that Scheme Participants meet the energy savings targets established by the legislation.
AESS audits for the 2011 compliance year were conducted in early 2012 prior to the compliance deadline of 18 March 2012. These audits were carried out after the end of the calendar year, as they are required to capture all electricity sales or purchases made by Scheme Participants for the calendar year.
23 www.ess.nsw.gov.au/For_Auditors/Audit_process.

5 Audit activities
40 IPART Compliance and Operation of the NSW Energy Savings Scheme during 2011
5.5 Accredited Certificate Provider audits
When we accredit an Accredited Certificate Provider to carry out an eligible RESA, we impose audit requirements on them as part of the conditions of their accreditation. The audits may be required for one or more of the following purposes:
to assess the eligibility for accreditation of an applicant, or a proposed change to the calculation methodology of an existing accreditation
to establish compliance with the requirements of the Act, Regulation and Rules governing creation of certificates
to confirm the level of compliance with any conditions of accreditation.
Our decisions to impose audit requirements are based on risk assessments that have regard to the nature of the RESA, the compliance record of the Accredited Certificate Provider, and the number of certificates to be created.

6 ESS Registry – creation, ownership and surrender of certificates
Compliance and Operation of the NSW Energy Savings Scheme during 2011 IPART 41
6 ESS Registry – creation, ownership and surrender of certificates
Under the Act, IPART (as Scheme Administrator) is required to maintain a register of Accredited Certificate Providers and of certificate creation and ownership.24 In 2009, the GGAS Registry was upgraded to incorporate the ESS and is now known as the GGAS & ESS Registry. The Registry was originally designed by Logica. Logica is also contracted to operate the Registry.
The Registry is an online database which can be found at https://www.ggas-registry.nsw.gov.au. It can be accessed by all ESS participants and members of the public. Its basic functions include:
listing details of accreditations and projects in both GGAS and the ESS
facilitating the creation and transfer of certificates
listing details and tracking ownership of certificates
allowing participants to surrender certificates to meet mandatory obligations or personal offset schemes.
The sections below set out key statistics regarding the creation, transfer and surrender of certificates recorded in the Registry in 2011. Data in this chapter are current as at 30 June 2012 and include certificates of 2009-11 vintages (that is, certificates created for activity performed during those calendar years). Note that totals for creation of 2009-10 vintage certificates may be less than previously reported because some certificates created have subsequently been forfeited (as discussed in Section 4.1.2).
6.1 Creation of certificates
When a certificate is created, the Registry records information about each certificate including the entity, activity and activity type associated with it, and the vintage and creation date. The Registry also tracks the certificate status (live, surrendered, or forfeited) and ownership history. One certificate represents one tonne of carbon dioxide equivalent emissions and once surrendered, cannot be reused.
24 Section 161 of the Act.

6 ESS Registry – creation, ownership and surrender of certificates
42 IPART Compliance and Operation of the NSW Energy Savings Scheme during 2011
The Registry imposes a $0.70 charge for the creation of each certificate. This charge is intended to cover the cost of establishing, operating and maintaining the Registry. Refer to Section 1.2 for details of our revenue and costs for the 2011 calendar year.
6.1.1 Number of certificates created
A total of 1,086,120 certificates were created for energy savings activities undertaken during 2011. This is an increase of 42% from 2010.
Certificates created under the Deemed Energy Savings Method increased significantly in 2010 due to an increase in showerhead replacement activities. In 2011, certificates created under the Deemed Energy Savings Method continued to increase, however the type of activities changed from showerhead activities to commercial lighting activities (see Section 6.1.2). Certificates created under the Metered Baseline Method have increased slightly each year. Certificates created under the Project Impact Assessment Method have declined from 2009, but increased slightly from 2010. This is partly due to the fact that projects that transitioned from GGAS in 2009 were predominantly Project Impact Assessment Method projects
Figure 6.1 Certificates created each year by calculation method
Note: 2009 represents the 6-month period from 1 July 2009 to 31 December 2009.
0
200,000
400,000
600,000
800,000
1,000,000
1,200,000
2009 2010 2011
Num
ber o
f cer
tific
ates
cre
ated
Deemed Energy Savings Method Metered Baseline Method Project Impact Assessment Method

6 ESS Registry – creation, ownership and surrender of certificates
Compliance and Operation of the NSW Energy Savings Scheme during 2011 IPART 43
Table 6.1 Certificates created each year by calculation method
Calculation method 2009 2010 2011
Deemed Energy Savings - Commercial Lighting Formula 10,123 70,343 505,684
Deemed Energy Savings - Default Savings Factors 37,733 425,982 269,223
Deemed Energy Savings - Power Factor Correction 0 0 228
Metered Baseline - baseline per unit of output 89,497 153,475 144,229
Metered Baseline - baseline unaffected by output 630 856 3,909
Metered Baseline - normalised by NABERS scheme 4,073 14,339 37,577
Project Impact Assessment Method 134,886 99,390 125,270
Total certificates created 276,942 764,385 1,086,120
Note: 2009 represents the 6-month period from 1 July 2009 to 31 December 2009.
6.1.2 Types of certificates created
The majority of certificates created since 2009 have been from showerhead replacement activities, mostly from activities during 2010. In 2009, the majority of certificates were created from process change/control systems and lighting projects under the Project Impact Assessment Method. In 2010, 56% of certificates were created from showerhead replacement activities, however in 2011, the focus changed to commercial lighting activities in response to showerhead replacement activities no longer being eligible. Consequently, 47% of certificates created in 2011 were from projects under the Commercial Lighting Formula. Figure 6.2 shows certificates created under these activities each year. Table 6.2 details certificates created by all project types.
Figure 6.2 Types of projects that created certificates each year
Note: 2009 represents the 6-month period from 1 July 2009 to 31 December 2009. Other includes project types listed in Table 6.2.
0
100,000
200,000
300,000
400,000
500,000
600,000
700,000
Other ProcessChange/Control
Systems
Lighting (CLF) ShowerheadsNum
ber o
f cer
tific
ates
cre
ated 2011
2010
2009

6 ESS Registry – creation, ownership and surrender of certificates
44 IPART Compliance and Operation of the NSW Energy Savings Scheme during 2011
Table 6.2 Certificates created each year by project type
Calculation method 2009 2010 2011
Lighting (CLF) 10,123 70,343 505,684 Showerheads 37,032 424,685 266,354 Process Change/Control Systems 118,871 173,527 148,532 HVAC/Chiller 7 16,683 37,878 Building Upgrade 4,073 14,339 37,577 Lighting (PIAM) 87,023 19,725 28,943 Compressed Air 4,424 19,200 24,274 Multiple Activities 7,720 13,735 15,869 Refrigeration 0 1,606 9,696 Fans/Pumps 6,968 9,245 8,216 Lighting (DSF) 0 1,039 2,831 Power Factor Correction 0 0 228 Whitegoods 701 258 38 Total certificates created 276,942 764,385 1,086,120
Note: 2009 represents the 6-month period from 1 July 2009 to 31 December 2009.
6.1.3 Accredited Certificate Providers that created certificates
Since 2009, Out Performers and Enact Energy have created the most certificates. In 2010, Enact Energy created significantly more certificates than any other Accredited Certificate Provider due to its showerhead replacement activities. With the amendments to the ESS Rule in 2011, Accredited Certificate Providers with commercial lighting projects created the most certificates that year. Figure 6.3 shows the Accredited Certificate Providers that have created the most certificates. Refer to Appendix B for information on certificate creation by individual activity.

6 ESS Registry – creation, ownership and surrender of certificates
Compliance and Operation of the NSW Energy Savings Scheme during 2011 IPART 45
Figure 6.3 Accredited Certificate Providers that have created the most certificates
Note: 2009 represents the 6-month period from 1 July 2009 to 31 December 2009.
6.1.4 Certificates created by sector
Energy savings activities can be conducted in the commercial, residential and industrial sectors. The residential sector was the primary source of certificates in 2010 due to showerhead replacement activities. This changed to the commercial sector in 2011 due to the increase in commercial lighting activities and reduction of showerhead replacement activities.
Table 6.3 Certificates created each year by sector
Sector 2009 2010 2011
Commercial 100,066 170,439 655,589
Residential 37,740 376,128 215,942
Industrial 139,136 217,818 214,589
Total certificates created 276,942 764,385 1,086,120
Note: 2009 represents the 6-month period from 1 July 2009 to 31 December 2009.
6.1.5 Estimated energy savings associated with those certificates
In general, certificates are created after the energy savings occur. Under the Metered Baseline Method and Project Impact Assessment Method certificate creation reflects energy savings which occurred during the calendar year. For the most part, RESAs using this method are large scale, industrial projects with significant annual savings.
0 50,000 100,000 150,000 200,000 250,000 300,000 350,000
Watts Green
Demand Manager
Woolworths
Orica
Tomago Aluminium
Sales Solutions
Ozzy Fortune
Aspect Energy
Low Energy Supplies & Services
Hydro Aluminium Kurri Kurri
Enact Energy
Out Performers
Number of certificates created
2009 2010 2011

6 ESS Registry – creation, ownership and surrender of certificates
46 IPART Compliance and Operation of the NSW Energy Savings Scheme during 2011
However, for some projects where the annual energy savings are small, the ESS Rule allows certificate creation in advance of actual energy savings:
Under the Project Impact Assessment Method, it is possible to make an up front assessment of estimated future savings and certificates can be forward created in advance of energy savings. Up to 5 years of energy savings can be brought to account at the commencement of the RESA (see section A.8.1 for further information).
The Deemed Energy Savings Method is a generic approach for measuring the lifetime or 'deemed' energy savings up front before the actual savings occur. The deeming period depends on the type of activity and ranges from 1.5 years to 25 years (see section A.8.3 for further information).
As certificates can be created in advance of energy savings, an estimate of the actual energy savings occurring in future years is calculated by pro-rating the certificates created each year across the forward creation or deeming period, where applicable.
Under the Project Impact Assessment Method, the discount factors listed in Table 16 of the ESS Rule (see Table A.2) are applied across the 5-year forward creation period. The discount factor increases each year, therefore energy savings are highest in the first year and decrease each year thereafter. Accredited Certificate Providers who use this methodology can claim the energy savings above the amount allowed to be forward created at the end of the 5-year forward-creation period25.
Under the Deemed Energy Savings Method, energy savings are distributed equally across each year of the deeming period. The deeming period varies depending on the technology.
During 2011, 1,086,120 certificates were created which is equivalent to 1,024,642 MWh. However when taking into account the forward creation and deeming associated with this certificate creation, we estimate that the actual energy savings26 in 2011 was 424,083 MWh.27 The remaining energy savings are realised across future years as shown in Table 6.4.
Appendix C provides the estimated energy savings by individual RESA activity.
25 Subject to verification by audit and the provision of appropriate evidence that the discounted
energy savings have actually occurred. 26 Section 174 of the Act requires an estimate of the actual energy savings that have been realised
with regard to the number of certificates created. 27 Includes energy savings under all calculation methods. Where forward creation or deeming has
been applied, only energy savings relevant for the 2011 calendar year are included.
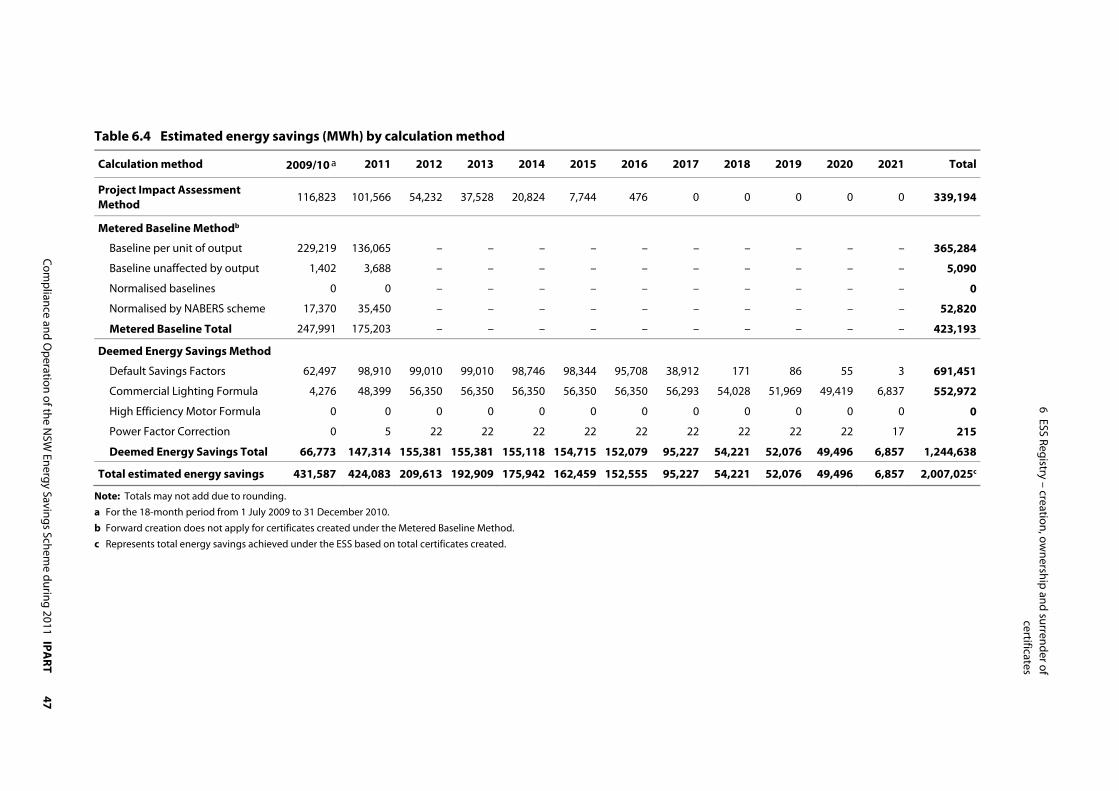
47 Com
pliance and Operation of the N
SW Energy Savings Schem
e during 2011 IPART
6 ESS Registry – creation, ow
nership and surrender of certificates
Table 6.4 Estimated energy savings (MWh) by calculation method
Calculation method 2009/10 a 2011 2012 2013 2014 2015 2016 2017 2018 2019 2020 2021 Total
Project Impact Assessment Method
116,823 101,566 54,232 37,528 20,824 7,744 476 0 0 0 0 0 339,194
Metered Baseline Methodb
Baseline per unit of output 229,219 136,065 – – – – – – – – – – 365,284
Baseline unaffected by output 1,402 3,688 – – – – – – – – – – 5,090
Normalised baselines 0 0 – – – – – – – – – – 0
Normalised by NABERS scheme 17,370 35,450 – – – – – – – – – – 52,820
Metered Baseline Total 247,991 175,203 – – – – – – – – – – 423,193
Deemed Energy Savings Method
Default Savings Factors 62,497 98,910 99,010 99,010 98,746 98,344 95,708 38,912 171 86 55 3 691,451
Commercial Lighting Formula 4,276 48,399 56,350 56,350 56,350 56,350 56,350 56,293 54,028 51,969 49,419 6,837 552,972
High Efficiency Motor Formula 0 0 0 0 0 0 0 0 0 0 0 0 0
Power Factor Correction 0 5 22 22 22 22 22 22 22 22 22 17 215
Deemed Energy Savings Total 66,773 147,314 155,381 155,381 155,118 154,715 152,079 95,227 54,221 52,076 49,496 6,857 1,244,638
Total estimated energy savings 431,587 424,083 209,613 192,909 175,942 162,459 152,555 95,227 54,221 52,076 49,496 6,857 2,007,025c
Note: Totals may not add due to rounding. a For the 18-month period from 1 July 2009 to 31 December 2010.
b Forward creation does not apply for certificates created under the Metered Baseline Method.
c Represents total energy savings achieved under the ESS based on total certificates created.

6 ESS Registry – creation, ownership and surrender of certificates
48 IPART Compliance and Operation of the NSW Energy Savings Scheme during 2011
6.2 Surrender of certificates
The total number of certificates surrendered by Scheme Participants to meet their compliance obligations for 2011 was 1,063,564 (Table 6.5). The Registry also allows any member of the public to own certificates which can be surrendered to offset emissions – known as voluntary surrender. No certificates have yet been surrendered in this way. As ESS certificates trade at a much higher price than GGAS certificates, they are a less cost effective option for voluntary surrender. Consequently, the ESS has not attracted the voluntary surrender activity that occurred under GGAS.28
At 30 June 2012, 264,803 certificates (of 2009-2011 vintage) remain available for surrender in future compliance years.
Table 6.5 Total certificates surrendered
Certificates surrendered by Scheme Participants
Certificates surrendered by voluntary participants
2009 compliance year 148,928 0
2010 compliance year 651,655 0
2011 compliance year 1,063,564 0
Total certificates surrendered 1,864,147 0
6.3 Transfer of certificates
Certificates are transferrable and the Registry records all changes in ownership of certificates. However, the Registry is not a trading platform as trading of certificates is expected to occur outside of the Registry whether bilaterally (ie, directly between the buyer and seller), through brokers or through other trading platforms.
During 2011, a total of 1,106,819 certificates were transferred in 182 individual transfers. Table 6.6 shows the number of certificates transferred in each month of this year.
28 See IPART, Compliance and Operation of the NSW Greenhouse Gas Reduction Scheme during 2011,
July 2012, section 5.4..

6 ESS Registry – creation, ownership and surrender of certificates
Compliance and Operation of the NSW Energy Savings Scheme during 2011 IPART 49
Table 6.6 Certificates transferred each calendar month
Month Number of transfers Number of certificates transferred
January 2011 18 63,575
February 2011 20 166,896
March 2011 23 215,197
April 2011 15 48,132
May 2011 8 62,281
June 2011 6 29,190
July 2011 11 59,723
August 2011 12 61,126
September 2011 13 70,019
October 2011 15 80,535
November 2011 17 80,544
December 2011 24 169,601
Total 182 1,106,819

7 Current and projected supply and demand
50 IPART Compliance and Operation of the NSW Energy Savings Scheme during 2011
7 Current and projected supply and demand
IPART monitors and publishes information about the supply of, and demand for, certificates annually, including our projections of future supply and demand. However, it is important to note that our projections are based on known information about existing participants and applications for accreditation, and where necessary, some conservative assumptions.
Also note that information about historic creation of certificates by Accredited Certificate Providers is publicly available on the GGAS & ESS Registry.29 This data should assist market participants in making their own projections of supply and demand.
The following sections outline the developments that influenced certificate supply and demand in 2011, trends in the certificate spot price (which may influence supply and demand in the coming years), our approach for projecting future certificate supply and demand to 2013, and our projection results.
7.1 Developments that influenced certificate supply and demand in 2011
In 2011, the total demand for certificates was 1,414,315. However, as in any year, this figure was not known in advance – rather it was identified after all Scheme Participants had submitted their Annual Energy Savings Statements.
The demand for certificates in a given calendar year is largely determined by the energy savings target for that year, and the number of certificates that Scheme Participants are obliged to surrender to meet their individual targets (based on their liable electricity acquisitions for that year). In recognition of the fact that certificate supply might not be sufficient to meet demand in a given year, especially in the early stages of the ESS, the Government made provisions for Scheme Participants to be able to carry forward up to 10% of their obligation to surrender certificates for a given year.30
29 https://www.ggas-registry.nsw.gov.au. 30 For the 2009 compliance period this carry forward provision was 50% in recognition of the short
lead-time between commencement of the ESS on 1 July 2009 and the initial compliance deadline of 29 April 2010. The carry forward provision for subsequent compliance years is 10%.

7 Current and projected supply and demand
Compliance and Operation of the NSW Energy Savings Scheme during 2011 IPART 51
Similar to the first two compliance periods for the Scheme (July to December 2009, and calendar year 2010) the supply of certificates for the 2011 compliance year came close to meeting Scheme Participants’ total obligation for that year, despite the 2011 target almost doubling from the previous year. This increase in supply was largely due to the significant number of RESAs accredited during 2011 and an upsurge in commercial lighting activities. In particular:
During 2011, 33 Accredited Certificate Providers were accredited for 37 RESAs.
During the period 1 January 2012 to 30 June 2012 (ie, the deadline for Scheme Participants’ to submit their amended AESSs), a further 18 new Accredited Certificate Providers31 and 18 new RESAs were accredited to create 2011 vintage certificates, for immediate supply to the market.
In total, 47 Accredited Certificate Providers, representing 62 RESAs, created 1,086,120 certificates for eligible energy savings activity in 2011. In addition, 281,892 certificates remained unsurrendered from previous calendar years, resulting in a total of 1,368,012 certificates available for the purposes of 2011 compliance. This total represented approximately 97% of the energy savings target for 2011, well above the notional 90% figure (which accounts for a carry forward of up to 10% of a Scheme Participant’s obligation into the next year).
7.2 Trends in the certificate (ESC) spot price
IPART does not regulate the price of certificates. However, we observe trends in the published certificate spot market price, as these can influence supply and demand. For example, if prices go up, more projects will be cost effective to implement, which may in turn lead to an increase in certificate supply. Similarly, if certificate supply rises rapidly this is likely to have a negative impact on certificate price if this supply is viewed to outstrip demand.
Figure 7.1 shows the trend in the spot prices recorded for spot trades (where known). It indicates that in the 3 years since the ESS commenced operation, the certificate spot price climbed significantly from $16.75 in August 2009 to $32.00 in March 2011 (prior to the 2010 compliance year deadline of 18 March 2011). For the next 12 months the spot price remained very stable tracking in a band of $30 to $32, peaking again at $32 during late February to mid March 2012 (just prior to the 2011 compliance year deadline of 18 March 2012). More recent trades (eg, in June 2012) suggest that, although softening, spot prices continued to track in a band of $26 to $29. This relative stability in price is in marked contrast to the Victorian VEET scheme where certificates have traded in the range of $14.50 to $41.50 during 2011, with the price dropping sharply in January 2012 due to a perceived oversupply in the market
31 These Accredited Certificate Providers had submitted their applications prior to the end of 2011
and, subject to meeting all eligibility requirements, were able to create 2011 vintage certificates from the date their applications were lodged.

7 Current and projected supply and demand
52 IPART Compliance and Operation of the NSW Energy Savings Scheme during 2011
Figure 7.1 Trends in the ESC spot price over the period July 2009 to July 2012
Note: This figure shows a 4 week rolling average of the last market spot price. This data accounts only for certificates traded through NGES and may not reflect the price paid by certificate buyers at the times shown. The Scheme Administrator recommends that persons seek independent advice before buying or selling certificates, and cautions against making decisions based solely on this chart.
Data source: The Green Room, published by NGES (see www.nges.com.au).
Please note that published data indicates that spot trades constitute only a small proportion of total certificate transactions. Most transactions are bilateral trades, where the price may be agreed in advance for an extended period. The prices for such transactions may differ significantly from the prevailing spot price. Nevertheless, the spot price provides a useful guide to broad movements in the certificate price over time.
Also note that several factors could influence certificate supply and demand in 2012 and beyond, and so could also influence the certificate price. These include:
uncertainty about further development of the ESS,
uncertainty about harmonisation with other state energy efficiency schemes, including Victoria (as per the joint NSW and Victorian Premiers’ announcement on 14 December 2011)
uncertainty about the potential for the Australian Government to introduce a national energy efficiency scheme, and how this might interact with, and/or impact on, the ESS
the publication of projections for the future certificate supply and demand.
Box 7.1 provides an overview of market commentary from The Green Room, a weekly report of spot market trades published by Nextgen.
$0.00$3.00$6.00$9.00
$12.00$15.00$18.00$21.00$24.00$27.00$30.00$33.00$36.00
Jul-0
9
Oct
-09
Jan-
10
Apr
-10
Jul-1
0
Oct
-10
Jan-
11
Apr
-11
Jul-1
1
Oct
-11
Jan-
12
Apr
-12
Jul-1
2
ESC
Spot
Pric
e
Four week rolling average Penalty

7 Current and projected supply and demand
Compliance and Operation of the NSW Energy Savings Scheme during 2011 IPART 53
Box 7.1 Market commentary for 2011 from Nextgen, The Green Room, Editions 286-337
January 2011: It was reported that the first trade in over 2 months took place at $30, with more expected as Scheme Participants readied to meet the 2010 compliance year deadline of18 March 2011. It was also reported that the Christmas period had brought changes to the ESC market with an alteration to the deeming value of low flow showerhead replacements which would have the effect of reducing the supply of ESCs to Scheme Participants.
March 2011: Following a lengthy period of unexpected inactivity, trading returned to the market with several spot trade deals transacted at the $32 mark.
September 2011: It was reported that the ESC market sprang to life again after a period of relative inactivity since the 18 March 2011 compliance deadline, with trading in a band of $28 to $32. It was also reported that this made it “one of the least volatile [certificates], in price anyway, in the environmental commodity industry”.
December 2011: Trading was largely absent since October, returning in December with tradesin the vicinity of $31. It was reported that the ESS looks to be going through some changes that will affect participants going forward, with showerhead activities ceasing from 22 December 2011, but expansion in other areas such as the inclusion of hotels and motels in the definition of commercial premises, and the expansion of the definition of site (that will enable ESCs to be created at locations where there are no electricity meters such as street and traffic lights).
As Scheme Participants are required to pay a base penalty rate of $25.52 per MWh (equivalent to $23.99 per tCO2-e) if they fail to meet their annual compliance obligation, the effective certificate price ceiling during 2011 was $34.27. This certificate ceiling price is calculated on the basis of the prescribed penalty conversion factor of 0.94 (as per Schedule 5A of the Act) and is inclusive of company tax (as payment of the penalty may not be tax deductible, unlike the purchase of certificates).
The base penalty rate (which is CPI adjusted each year) is set to increase from $25.52 to $26.45 per MWh for the 2012 compliance year (equivalent to $24.86 per tCO2-e). This will mean the effective certificate price ceiling for the 2012 compliance year will rise to $35.51.
7.3 Our approach for projecting certificate supply and demand to 2012
To calculate future certificate demand, we use the methodology prescribed in Section 106 of the Act, which involves making a number of assumptions about some of the inputs for this methodology. To calculate certificate supply, we use the expected certificate creations (as nominated by Accredited Certificate Providers for their accredited RESAs and current applicants for their impending RESAs) as our base data, and 2 supply scenarios.

7 Current and projected supply and demand
54 IPART Compliance and Operation of the NSW Energy Savings Scheme during 2011
7.3.1 Projecting certificate demand
Certificate demand under the ESS is driven by the legislated targets for each year, which are met through the surrender of certificates by Scheme Participants (ie, electricity retailers). The Energy Savings Scheme Target for each year is allocated to Scheme Participants in proportion to their liable acquisitions.
A Scheme Participant’s liable acquisitions include all its NSW electricity purchases from AEMO, plus any unregistered generator sales (including rooftop solar photovoltaics) less any exempt load deductions32 in NSW. This reduces the ‘effective’ target by approximately 20%33.
We base our calculation of the future demand for certificates on the methodology prescribed in Sections 106 and 107 of the Act. The future demand calculation is primarily based on estimates of future electricity demand in NSW as determined by TransGrid.34
In simple terms, we calculated the demand in each year from 2009 to 2013 (inclusive) as follows:
Demand = Total Liable Acquisitions * Energy Savings Target * Energy Conversion Factor
where
Total Liable Acquisitions = TransGrid’s Total End Use Electricity Sales (for NSW only)35 + Total Unregistered Generator Purchases36 – Total Exempt Load Deductions
The Energy Savings Target and Energy Conversion Factor are prescribed in Schedule 5 to the Act. To calculate the Total Liable Acquisitions we used:
TransGrid’s mid-range estimates of electricity demand for NSW (excluding the ACT), as published in its Annual Planning Report 201137
our own assumption that Exempt Load Deductions will equal approximately 20% of all electricity purchases in NSW.
32 Refer to Sections 3.4 and A.6 for further information on exempt loads. 33 Refer to Appendix A, Section A.7 for a table showing the ESS targets and further information. 34 TransGrid is the electricity planning authority for NSW and owns, operates and manages the
New South Wales high voltage electricity transmission network. 35 As per Table A3.1 of the New South Wales Annual Planning Report released by TransGrid on
30 June of each year. Note: projected End Use Sales in this report also includes the ACT. 36 Total Unregistered Generator Purchases includes solar photovoltaic (PV) generation. 37 TransGrid NSW Annual Planning Report 2011, see
www.transgrid.com.au/network/np/Pages/default.aspx. The TransGrid NSW Annual Planning Report for 2012 was not available when this report was prepared, therefore projections may differ.

7 Current and projected supply and demand
Compliance and Operation of the NSW Energy Savings Scheme during 2011 IPART 55
Note that the projections for electricity demand in TransGrid’s Annual Planning Report 2011 reflect assumptions about the impact of the global economic recovery on electricity consumption, and improved business and consumer sentiments. They also reflect price forecasts intended to take account of the effect of the proposed introduction of the Carbon Pricing Mechanism on 1 July 2012.38
Also note that our assumption about the Total Exempt Load Deductions in 2012 and beyond is in line with the actual exemptions for the 2009, 2010 and 2011 compliance years. In all these years, the deductions were equal to approximately 20% of Scheme Participants’ total energy purchases in that year. Therefore, we consider a Total Exempt Load Deduction figure of 20% to be a suitable proxy for estimating demand in future years.
7.3.2 Projecting certificate supply
To derive the base data for calculating future supply of certificates, we use Accredited Certificate Providers’ and applicants’ calculations of the number of certificates they have created, and/or expect to create, from their RESAs over the period 1 July 2009 to 31 December 2013. For RESAs already accredited, we generally use the Nominated Number of certificates reported in the Accreditation Notice. However, where annual reports have been submitted (as part of an Accredited Certificate Provider’s accreditation conditions) we use the updated forecast figures in these reports. For RESAs still in the application stage, we use forecast numbers that are an expected creation pattern based on the applicant’s own calculations.
We projected certificate supply to the end of 2013 under 2 different supply-side scenarios. These scenarios are based on our knowledge of the potentially variable sources of supply for certificates, and include:
Scenario 1: The projected supply of certificates is based on the energy savings expected to be achieved by currently accredited RESAs only (ie, excluding RESAs still in the application stage), and with no adjustment for possible changes to the ESS Rule (ie, changes to add new technologies). This scenario is the low-range projection.
Scenario 2: The projected supply of certificates is based on the energy savings expected to be achieved by all currently accredited RESAs and all RESA applicants (to date) with no adjustment for possible changes to the ESS Rule. It is assumed that applicant RESAs will be accredited and will commence energy saving activities as anticipated by their proponents. This scenario is the high-range projection.
38 The TransGrid Annual Planning Report for 2012 was not available when this report was
prepared, therefore projections may differ.

7 Current and projected supply and demand
56 IPART Compliance and Operation of the NSW Energy Savings Scheme during 2011
While the Act allows for the ESS to continue until 2020, we have chosen to project certificate supply and demand to the end of 2013 only. This shortened timeframe reflects the fact that any projection more than 2 years out may be unreliable due to:
the relatively short history of the ESS to date (and therefore only a limited, albeit growing, knowledge of participant behaviour), and
the effect of forward creation on projections, whereby some project proponents are eligible to forward create certificates for up to 5 years in advance (see Section A.8).
Note that the certificate supply scenarios in Figure 7.2 below only include RESAs that are currently accredited and applications that are currently being assessed (as at 30 June 2012). We anticipate that further applications will be received in the future which will add to the certificate supply illustrated below. In addition, some Scheme Participants either hold a surplus of certificates, or elect to pay the penalty rather than source and surrender certificates for their compliance obligation, resulting in surplus certificates being available towards supply for 2012 (and future year) compliance.
7.4 Projection results
Figure 7.2 shows our latest projections for certificate supply and demand to 2013, based on data current at 30 June 2012.
Figure 7.2 IPART’s projections for certificate supply and demand, 2009 to 2013
Note: As at 30 June 2012. The projections above are for illustrative purposes only and should not be relied upon.
-
500,000
1,000,000
1,500,000
2,000,000
2,500,000
3,000,000
2009 2010 2011 2012 2013Supply - Actual Supply - Scenario 2 - High Range Supply - Scenario 1- Low Range Unsurrendered ESCs from years priorAnnual Demand Annual Demand with max shortfall allowance

7 Current and projected supply and demand
Compliance and Operation of the NSW Energy Savings Scheme during 2011 IPART 57
7.4.1 Outlook for certificate supply
As Figure 7.2 indicates, total supply (including unsurrendered certificates from prior years39) came very close to meeting demand in 2011 (and in the two preceding years). It is again anticipated to come close under both supply-side scenarios in 2012, despite the cessation of certificate supply from showerhead replacement activities (which became ineligible after 23 December 2011). However, the outlook for supply in 2013 becomes tighter under both supply-side scenarios. This is primarily because ESS targets will nearly double between 2011 and 2013, from around 1.4 million tCO2-e to almost 2.7 million.
These forecasts of supply are conservative in nature as the demand/supply outlook may vary from that presented here if the ESS Rule changes, if applications currently being assessed fail to be accredited, or if estimates of future certificate creation by applicants and accredited parties are inaccurate. Some types of project activity are established and relatively known, whereas others utilise emerging technologies where take-up rates are yet to be fully established. Estimates of future certificate creation for this second group of project activities are particularly uncertain. Also, while the amount of unsurrendered certificates contributing towards future 2012 compliance is known (following recent completion of 2011 compliance), we are unable to predict the future pattern of surrender amounts for 2013. Hence, a zero contribution is assumed for 2013.
Scenario 1, which represents the forecast for accredited projects only and is inherently conservative, shows supply increasing in 2012 but flattening slightly in 2013, such that supply falls short of demand for that year. This flattening is due to the fact that a number of accreditations forward created certificates (for 5 years) in the years 2009 to 2013, with no further ability to create certificates until at least 2014 (if eligible). However, the remainder of accredited projects will continue to create certificates after 2012, and it is these projects that effectively balance out the ‘hiatus’ in certificate creation from the aforementioned projects.
Scenario 2 shows supply more than meeting demand in 2012, although less so for 2013. The basis for the increase in supply under Scenario 2 is that applications for RESAs become accredited, and then meet their program delivery expectations (in terms of certificate creation).
The only real difference in the 2 supply-side scenarios is the level of energy savings proposed to be achieved for lighting upgrade programs. Recent certificate creation activity suggests that an increase in supply in this market adequately compensated for the reduction in supply from showerhead activities which became ineligible in late 2011. This trend is expected to continue as new and emerging lighting technologies establish.
39 A certificate created with a particular vintage may be surrendered against a compliance
obligation for any year thereafter. (For example, a certificate of 2010 vintage may be surrendered against a compliance obligation in any year from 2010 onwards.)

7 Current and projected supply and demand
58 IPART Compliance and Operation of the NSW Energy Savings Scheme during 2011
7.4.2 Supply versus demand
Our projections suggest that demand for certificates will steadily rise in the period 2012 to 2013 (and beyond) (Figure 7.2). This rise can be attributed primarily to:
the steadily increasing ESS target (identified in Table A.1 of Appendix A), which rises in yearly increments to 2014 after which a constant 5% of total electricity sales is maintained, and
a modest but steady growth in electricity demand over the next 5 years (noting however, that this growth is from a reduced base following a 5% reduction in annual energy forecasts, as identified by TransGrid in its 2011 Annual Report40).
Under Scenario 1, annual supply of certificates is below annual demand for 2012, but when unsurrendered certificates from years prior are taken into account, total supply meets demand for 2012. In 2013, with unsurrendered certificates assumed as zero, total supply drops well below demand, including the allowable 10% shortfall. However, as certificates do not expire, any cumulative surplus of supply experienced in 2012 may assist in meeting the projected demand for 2013.
Under Scenario 2, cumulative supply largely meets demand for the 2012 compliance year, exceeding it when unsurrendered certificates from years prior are taken into account. However, in 2013, with unsurrendered certificates assumed as zero, cumulative supply still falls below demand (but not to the same extent as Scenario 1). However, there is more uncertainty about this scenario, due to the nature of the assumptions about the implementation of projects. It is likely that, as new activities, methodologies and additional factors for end-user-equipment are added to the ESS Rule, new applications will be submitted to conduct activities in these areas. This will result in changes to the supply projections shown above.
It should be noted that under both scenarios above, the projections do not encompass additional supply of certificates from any new technologies or new activities that might be introduced following a change to the ESS Rule.
40 Refer section 4.1.6 of the TransGrid 2011 Annual Report. More recently, the Australian Energy
Market Operator’s 2011 Electricity Statement of Opportunities (as updated on 2 March 2012) also forecasts growth from 2011-12 (from a 5% reduction in its previous forecast of annual energy) – refer http://www.aemo.com.au/Electricity/Planning/Electricity-Statement-of-Opportunities

7 Current and projected supply and demand
Compliance and Operation of the NSW Energy Savings Scheme during 2011 IPART
5
Appendices

7 Current and projected supply and demand
60 IPART Compliance and Operation of the NSW Energy Savings Scheme during 2011

A Overview of the ESS
Compliance and Operation of the NSW Energy Savings Scheme during 2011 IPART 61
A Overview of the ESS
The ESS is a NSW-based energy efficiency scheme which commenced on 1 July 2009. It is legislated to continue until 2020 or until a national scheme with similar objectives is introduced. Its principal objective is to achieve energy savings and to reduce carbon emissions by creating a financial incentive to reduce the consumption of electricity through energy savings activities. It does not include the use of gas.
The ESS is designed to increase opportunities to improve energy efficiency by placing obligations on parties to undertake or pay for energy efficiency programs, and rewarding companies that undertake eligible projects that either reduce electricity consumption or improve the efficiency of electricity use. It was developed as a complementary but independent measure to the Carbon Pollution Reduction Scheme (CPRS) proposed at the time by the Commonwealth Government. It is modelled on the end-use energy efficiency part of the Demand Side Abatement component of the Greenhouse Gas Reduction Scheme (GGAS). This part of GGAS ceased with the commencement of the ESS.
The ESS is governed by NSW legislation and places a mandatory obligation on Scheme Participants (electricity retailers and other parties licensed to buy or directly supply electricity in NSW) to obtain and surrender Energy Savings Certificates (ESCs), which represent eligible energy savings under the ESS. Scheme Participants purchase certificates from Accredited Certificate Providers, who create certificates following the implementation of Recognised Energy Savings Activities (RESAs). Companies that are Scheme Participants may also apply to become Accredited Certificate Providers.
Figure A.1 provides an overview of the structure of ESS. The sections below provide more information on key elements of the scheme, including the:
functions of the Scheme Regulator and Scheme Administrator
Scheme Participants
Accredited Certificate Providers and RESAs
ESS Registry
ESS legislation
Ministerial Order and Exemptions Rule, and
ESS targets.

A Overview of the ESS
62 IPART Compliance and Operation of the NSW Energy Savings Scheme during 2011
Figure A.1 Structure of the ESS
A.1 Functions of Scheme Regulator and Scheme Administrator
The Scheme Regulator’s role is to monitor the Scheme Participants’ compliance with the ESS targets, which includes conducting independent audits of this compliance.
The Scheme Administrator’s roles include:
assessing applications for accreditation as an Accredited Certificate Provider
accrediting these providers to undertake eligible activities and to create certificates from those activities
monitoring compliance of Accredited Certificate Providers by conducting independent audits
managing the GGAS & ESS Registry – an online database which records the creation, transfer and ultimate surrender of certificates.
A.2 Scheme Participants
Electricity retailers and certain other parties who buy or directly supply electricity in NSW are mandatory participants in the ESS and are called Scheme Participants. Scheme Participants are required to meet individual energy savings targets based on the size of their share of NSW’s liable electricity acquisitions (see Section A.7).
IPART as Scheme
Administrator and Scheme
Regulator
MINISTER
Accredited Certificate Providers
(supply side)
Audit Panel
GGAS & ESS Registry
Annual Compliance & Operation report
Scheme Participants (demand side)
Trading activities

A Overview of the ESS
Compliance and Operation of the NSW Energy Savings Scheme during 2011 IPART 63
Scheme Participants buy certificates from Accredited Certificate Providers. Each Scheme Participant must calculate its individual energy savings target and obtain and surrender certificates in order to meet its target. If a Scheme Participant does not surrender sufficient certificates, it will have an energy savings shortfall and can choose to carry this shortfall forward to the following year (within the allowable limits) or be subject to a shortfall penalty.
To comply with the ESS, Scheme Participants must lodge an Annual Energy Savings Statement (AESS) with the Scheme Regulator each year. The legislation provides for the Scheme Regulator to require that these statements be audited as part of its assessment of Scheme Participants’ compliance. Where an audit is required, Scheme Participants are required to engage an auditor from the ESS Audit Services Panel.
A.3 Accredited Certificate Providers and Recognised Energy Savings Activities
Companies voluntarily apply for accreditation in the ESS to undertake Recognised Energy Savings Activities (RESAs). Once accredited, they are called Accredited Certificate Providers. They are subject to a number of conditions of accreditation which outline their responsibilities as determined by the Act, Regulation and the Energy Savings Scheme Rule of 2009 (ESS Rule).
RESAs are the specific activities implemented by Accredited Certificate Providers to reduce the consumption of electricity or increase the efficiency of electricity consumption. A RESA cannot include an activity that has been undertaken to comply with any statutory requirement (eg, another scheme or DA requirement). In addition, a RESA cannot reduce the scope or quantity of production or service from the use of electricity. For example, closing part of a factory would not qualify as a RESA under the ESS as production has reduced. In addition, a RESA must have been implemented on or after 1 July 2008 to be eligible.
The legislation provides for the Scheme Administrator to require audits of RESAs as part of the assessment of compliance by Accredited Certificate Providers. Where an audit is required, Accredited Certificate Providers are required to engage an auditor from the ESS Audit Services Panel.
A.4 ESS Registry
The ESS Registry is a web-based database that records Accredited Certificate Providers and certificates as required by legislation. The Registry tracks certificate creation, transfer and surrender and can be accessed by all participants and members of the public.

A Overview of the ESS
64 IPART Compliance and Operation of the NSW Energy Savings Scheme during 2011
Certificates are transferrable and the Registry records all changes in ownership of certificates. However, the Registry is not a trading platform as trading of certificates is expected to occur outside of the Registry whether bilaterally, through brokers or through other trading platforms.
A.5 The ESS legislation
The ESS is established in NSW through the Electricity Supply Act 1995 (the Act). The Act sets out the legal and technical framework of the ESS as well as the functions and responsibilities of Scheme Regulator and Scheme Administrator.
The Act is supported by the Electricity Supply (General) Regulation 2001 (the Regulation) which makes provision for aspects of the operation of the ESS. The Regulation provides further details of the ESS, such as:
the assessment of compliance of Scheme Participants
the eligibility requirements for accreditation as an Accredited Certificate Provider
the conditions of accreditation that are imposed by the Scheme Administrator
the creation and transfer of certificates
the conduct of audits
the requirement to maintain a register of Accredited Certificate Providers and a register of certificate creation and ownership.
The ESS Rule issued by the Minister for Energy provides additional eligibility requirements and calculation methodologies for Accredited Certificate Providers and their accreditations. The ESS Rule sets out:
the types of eligible and ineligible activities
the requirements for eligible applicants
detailed calculation methodologies
the calculation methods for the creation of certificates.
The NSW Department of Trade and Investment, Regional Infrastructure and Services (DTIRIS) has responsibility for policy development of the ESS and ultimate responsibility for any legislative changes introduced to the ESS. DTIRIS is responsible for recommending any rule changes to the Minister for Energy. The Office of Environment and Heritage (OEH) provides policy support and recommends developments to the ESS.

A Overview of the ESS
Compliance and Operation of the NSW Energy Savings Scheme during 2011 IPART 65
A.6 Ministerial Order and the Exemptions Rule
Exemptions are allowed under the ESS for electricity loads used in conjunction with emissions intensive trade exposed industries or activities. They are granted by the NSW Minister for Energy via a Ministerial Order.41 The Ministerial Order lists each exempted person (company), and each emissions intensive trade exposed activity being carried out, the location and the proportion of electricity load granted exemption (either 60% or 90%). The Ministerial Order also allows a further deduction for network losses and authorises the Scheme Regulator to make rules with respect to the way in which the deduction of the exempt load is applied and the evidence needed in support of these deductions.
The most recent Ministerial Order was published on 16 December 2011 and applies from 1 January 2012 until it is revoked. Any change to the Ministerial Order needs to be gazetted prior to 31 December of the year preceding the year the order is to have its effect. After commencement of the year, any change to the Order will not take effect until the following year. For the purpose of the 2011 compliance year, the Ministerial Order published on 24 December 2010 applies.
Scheme Participants that supply electricity to a person specified in the Ministerial Order are entitled to deduct a specified portion of the electricity load from that location from their liable acquisitions using the Scheme Regulator Exemptions Rule No. 1 of 2009 (Exemptions Rule). The Exemptions Rule outlines the manner in which Scheme Participants calculate and claim deductions from the total value of their liable acquisitions and specifies the evidence Scheme Participants must provide in support of any deductions.
Exemptions under the ESS are designed to align with the approach the Commonwealth Government takes regarding emissions intensive trade exposed industries and activities in implementing its expanded Renewable Energy Target and any proposed national scheme. It is regularly revised and updated to take account of any changes.
A.7 ESS targets
The ESS has legislated targets for each year that need to be met through the surrender of certificates by Scheme Participants. The ESS target for each year is allocated to Scheme Participants in proportion to their liable electricity acquisitions. A Scheme Participant’s liable acquisitions include all its NSW electricity purchases from AEMO, plus any unregistered generator sales (including rooftop solar photovoltaic) less any exempt sales in NSW. This results in an ‘effective’ target that, for NSW, is approximately 20% less than the legislated target (20% being the approximate percentage of exempt sales).
41 The Ministerial Order can be downloaded from the ESS website at
www.ess.nsw.gov.au/How_the_scheme_works/Framework_and_Rules.

A Overview of the ESS
66 IPART Compliance and Operation of the NSW Energy Savings Scheme during 2011
Table A.1 shows the target (both with and without exemptions) gradually increasing until 2014, after which it remains constant until 2020.
Table A.1 Annual ESS targets over life of scheme
Year ESS target (% of annual liable electricity sales)
Effective ESS target (% of annual NSW electricity sales)
2009a 0.5% 0.4%
2010 1.5% 1.2%
2011 2.5% 2.0%
2012 3.5% 2.8%
2013 4.5% 3.6%
2014-2020 5.0% 4.0% a Half year from 1 July.
The targets were developed following modelling by consultants engaged by the former Department of Environment, Climate Change and Water. The modelling involved estimation of the marginal cost of abatement for various energy efficiency activities, and the amount of energy savings that could be achieved based on differing certificate prices.
Although the targets in the ESS are based on electricity sales (MWh), certificates are measured in tonnes of CO2-e to be consistent with GGAS and a national scheme. In converting MWh to CO2-e, a recognised and robust greenhouse emission factor needs to be applied. Drawing on work carried out by the Commonwealth, the value of 1.06 kg CO2-e/kWh has been approved for use in the ESS. This factor is called the ESS ‘certificate conversion factor’ and is listed in Schedule 5B of the Act.
A.8 Calculation methods
The ESS Rule sets out the type of activities undertaken by Accredited Certificate Providers and the methodologies for calculating the number of certificates. The 3 methodologies are:
Project Impact Assessment Method.
Metered Baseline Method.
Deemed Energy Savings Method.
This section describes each calculation method in more detail.

A Overview of the ESS
Compliance and Operation of the NSW Energy Savings Scheme during 2011 IPART 67
A.8.1 Project Impact Assessment Method
The Project Impact Assessment Method calculates savings from one-off energy savings projects. This method is most appropriate when:
energy savings are small compared to the site’s consumption
baseline energy consumption data for the site is unavailable, or
the variation in the baseline energy consumption due to other factors is high.
The energy savings can be determined by various means, including by direct measurement or by an engineering assessment. The Project Impact Assessment Method applies a confidence factor which reflects the accuracy and/or reliability of the data used to calculate energy savings.
One of the advantages of the Project Impact Assessment Method is that it is possible to make an up-front assessment of estimated future savings (known as forward creation of certificates). This is considered to be an incentive where projects achieve small annual savings that might be insufficient to warrant accreditation under the ESS.
The ESS Rule allows the forward creation of up to 5 years of certificates from a RESA that has ongoing energy savings as soon as the RESA is commenced. However, discount factors will apply to any forward creation (see Table A.2).
Table A.2 Discount factors for calculating forward creation of certificates under the Project Impact Assessment Method
Year Discount factor
1 1.00
2 0.80
3 0.60
4 0.40
5 0.20
Source: Schedule 5, Table 16 of the ESS Rule.
The ESS Rule also allows Accredited Certificate Providers who use the forward creation provisions under the Project Impact Assessment Method to revisit the savings claimed at the end of the 5-year period and to ‘top up’ the savings if a greater level of savings can be verified. But to do this, they need to have maintained adequate records so that any additional savings claimed can be validated by an audit of the project.

A Overview of the ESS
68 IPART Compliance and Operation of the NSW Energy Savings Scheme during 2011
A.8.2 Metered Baseline Method
The Metered Baseline Method involves measuring the electricity consumption before the RESA commences to establish a baseline electricity consumption standard for the site, and then measuring this consumption again after the RESA has commenced to establish new levels of electricity consumption. The difference between these measurements represents the impact of the RESA (assuming that the remainder of the site continues to operate as it did before the RESA commenced). This idea of ‘before’ and ‘after’ measurements is fundamental to the design of the ESS as the recognition of energy savings is based on being able to confirm savings against a baseline.
The Metered Baseline Method comprises 4 sub-methods for measuring consumption. Which of these is most appropriate depends on the nature of the project. These methods include the baseline per unit of output, baseline unaffected by output, normalised baseline and National Australian Built Environment Rating System (NABERS) methods.
Baseline per unit of output method
This method is most appropriate where consumption is strongly linked to output (eg, aluminium smelting). This method is usually used if:
the consumption of all energy sources for the site are linear functions of output (that is they directly reflect each other)
where the energy consumption that is fixed (that is, the proportion of energy consumed at the site does not vary with variations in output), can be measured or estimated, and
output has not changed by more than 50% from the average output over the period that the baseline was measured.
Baseline unaffected by output method
This method is most appropriate where energy consumption is not linked to output (eg, schools and swimming pools).
Normalised baseline method
This method is most appropriate where the baseline needs to be normalised to remove explainable variation from the baseline. Examples may include changes to ambient conditions or input characteristics.

A Overview of the ESS
Compliance and Operation of the NSW Energy Savings Scheme during 2011 IPART 69
National Australian Built Environment Rating System baseline method
The NABERS method is based on the normalised baseline approach and consists of 2 methods which are Method 4a for existing NABERS buildings and Method 4b for new NABERS buildings. These methods are used for normalising baseline energy consumption of offices, hotels and shopping centre buildings which use the NABERS Method for measuring building energy performance.
NABERS ratings (administered by the Office of Environment and Heritage) are star based, with more stars indicating a higher level of energy efficiency. The number of buildings with NABERS ratings is expected to increase significantly following the introduction of the national Commercial Building Disclosure (CBD) program42 which came into effect in November 2010. As part of the CBD program, most building owners or lessors seeking to sell or lease commercial office space with a net lettable area of 2,000m² or more will be required to have and to disclose to interested parties a current NABERS energy rating for the building.
A.8.3 Deemed Energy Savings Method
The Deemed Energy Savings Method is used for the installation of common end-user equipment, such as refrigerators and more energy efficient lighting. The method comprises 4 sub-methods, which provide robust and easy-to-use equations and factors for specific activities and/or equipment to calculate the energy savings/number of certificates claimed. The method allows certificates to be claimed at the time of implementation of the energy savings activity, for the energy savings that will occur over the deemed lifetime for the activity.
As part of the calculation methodology of each sub-method, there are assumed deeming periods for different activities. The Scheme Administrator also takes account of these deeming periods when determining actual annual energy savings from accredited RESAs.
Table A.3 shows the deeming periods for some of the common activities/equipment. The sections below outline the 4 sub-methods
default savings factors
commercial lighting energy savings formula
high-efficiency motor energy savings formula, and
power factor correction energy savings formula.
42 See www.cbd.gov.au

A Overview of the ESS
70 IPART Compliance and Operation of the NSW Energy Savings Scheme during 2011
Table A.3 Deeming periods for certain activities and/or equipment under the Deemed Energy Savings Method
Activity and/or end-user equipment Deeming period
Replacement of 50W ELV halogen lamp with 35W ELV halogen lamp 4,000-10,000 hours
Replacement of 50W ELV halogen lamp and magnetic transformer with 35W ELV halogen lamp and electronic transformer – Residential & Commercial
4,000-10,000 hours
Replacement of a 50W halogen ELV lamp and transformer with a CFL, CCFL, LED or CMH, which has a Lamp Life of ≥ 10,000 hours
10,000 hours
Shower rose replacement 7 years
Purchase of a new high efficiency Clothes Washer 12 years
Purchase of a new high efficiency Dishwasher 16 years
Destruction of refrigerator or freezer built before 1996 7 years
Purchase of a new high efficiency Refrigerator 16 years
Purchase of a new high efficiency Freezer 20 years
Upgrade of commercial lighting, where the upgrade cannot be easily 'reversed': Other lighting
10 years
Upgrade of commercial lighting, where the upgrade cannot be easily 'reversed': Road lighting
12 years
Installation of high efficiency motor 12-25 years
Power factor correction equipment 10 years
Default savings factors
The default savings factors sub-method is used for projects that involve the installation or supply of end-user equipment types listed in Tables 1 to 8 of Schedule A of the ESS Rule. This includes the replacement of halogen down-lights with energy efficient alternatives; the sale or purchase of energy efficient clothes washers, dishwashers, fridges or freezers; the retirement of old spare fridges and freezers; and the installation of energy efficient shower heads. It does not include the installation of compact fluorescent light globes or water flow restrictors.
Commercial lighting energy savings formula
This sub-method is used for projects that only involve energy savings attributable to commercial lighting upgrades.
An electronic Commercial Lighting Calculation Tool is available on the ESS website for persons to calculate the number of certificates they may create from a commercial lighting upgrade. The tool sets out the correct factors and discounts applicable for all eligible types of commercial lighting installations. As new technologies become available, both the ESS Rule and this tool will be updated to take account of new developments.

A Overview of the ESS
Compliance and Operation of the NSW Energy Savings Scheme during 2011 IPART 71
The advantage of the Commercial Lighting Calculation Tool is that it simplifies the calculation of energy savings and certificate creation that may be achieved from a lighting upgrade. An applicant can easily determine whether a project is eligible, and whether participation in the ESS is warranted.
High efficiency motor energy savings formula
This sub-method is used for projects that only involve energy savings attributable to the sale or installation of one or more high efficiency motors. Table 12 of the ESS Rule contains an extensive list of default load utilisation factors for high efficiency motors where the end-user equipment and end-use are known. The load utilisation factors are divided into different categories depending on the end-use industry sector (eg, agriculture, mining, construction etc).
Table 13 in the ESS Rule lists a number of default load utilisation factors where the end-user equipment and end-use are not known, and consequently is based on rated output in kW for different sizes of high efficiency motors.
Power factor correction energy savings formula
This sub-method is used for projects that only involve energy savings attributable to the reduced losses from the installation of Power Factor Correction (PFC) equipment.
The Electricity Service and Installation Rules of NSW43 require the power factor of a site to be a minimum of 0.9 lagging. As such, certificates can be generated only by the implementation of PFC which increases the power factor of a site above 0.9 to a maximum of 0.98.
A.8.4 Process of incorporating new methods into the ESS Rule
As noted above, if a RESA or RESA project is unable to satisfy the criteria in one of the 3 methods listed in the ESS Rule, then the applicant can either modify its project, if possible, or apply to have a new methodology incorporated into the ESS Rule.
For parties seeking to have new methodologies included in the ESS Rule, guidelines have been developed for the process that should be followed in making a request. This information is available from the Office of Environment and Heritage, which has responsibility for investigating areas to develop and expand the ESS Rule. Changes to the ESS Rule, including the addition of new methodologies, are the responsibility of the NSW Department of Trade and Investment, Regional Infrastructure and Services and require approval by the Minister for Resources and Energy.
43 www.industry.nsw.gov.au/energy/electricity/network-connections/rules

B Creation of certificates
72 IPART Compliance and Operation of the NSW Energy Savings Scheme during 2011
B Creation of certificates
The ESS Rule makes provisions for the creation of certificates where an Accredited Certificate Provider is carrying out an eligible RESA. This appendix provides a detailed breakdown of certificate creation for each vintage year by individual RESA activity.
Both current and cancelled activities are included. An asterisk (*) beside the activity name indicates that it has been cancelled.
Data in this chapter are current as at 30 June 2012.

73 Com
pliance and Operation of the N
SW Energy Savings Schem
e during 2011 IPART
B Creation of certificates
Table B.1 Project Impact Assessment Method (certificates)
Company and RESA activity name 2009 2010 2011 Total
BOC Ltd: Port Kembla LMPC 0 1,052 0 1,052
Boral Ltd: Berrima Kiln 6 Upgrade 6,350 8,942 7,500 22,792
Coles Supermarkets Australia Pty Ltd: Coles Supermarket Lighting Controls Upgrade 0 0 11,647 11,647
Commonwealth Bank of Australia: Voltage reduction in branch network lighting 275 0 0 275
Commonwealth Bank of Australia: Branch Network BMS Upgrade 271 538 0 809
Commonwealth Bank of Australia: Lighting Controls 282 560 0 842
Commonwealth Bank of Australia: VSD Upgrades on cooling fans and condenser pump 58 116 0 174
Continental Carbon Australia Pty Ltd: Installation of VSD on boiler fan 816 0 0 816
Demand Manager Pty Ltd: Lighting Aggregation Project - PIAM 44,886 0 0 44,886
GridX Power Pty Ltd: Glenfield MiniGrid Home Space Cooling Project* 7 0 0 7
Merck Sharp & Dohme (Australia) Pty Ltd: Lighting voltage reduction* 0 0 0 0
Norske Skog Paper Mills (Aust) Ltd: Deckers Feed Pump Bypass 2,246 4,456 4,456 11,158
Norske Skog Paper Mills (Aust) Ltd: Paper machine vacuum system optimisation 0 3,019 5,288 8,307
NSW Roads and Traffic Authority: Upgrade of Traffic Lights 31,180 0 0 31,180
Out Performers (Griffone Family Trust trading as): EAF Efficiency 17,447 0 0 17,447
Out Performers (Griffone Family Trust trading as): Heel Procedure 9,335 0 0 9,335
Out Performers (Griffone Family Trust trading as): Heat Slingers 700 0 0 700
Out Performers (Griffone Family Trust trading as): Fume Fan VSD 1,618 0 0 1,618
Out Performers (Griffone Family Trust trading as): Grasso Compressor VSD 517 0 0 517
Out Performers (Griffone Family Trust trading as): Glycol Heat Exchanger 900 0 0 900
Out Performers (Griffone Family Trust trading as): Compressor System Upgrade 1,665 0 0 1,665
Out Performers (Griffone Family Trust trading as): Condenser System Upgrade 1,615 0 0 1,615
Out Performers (Griffone Family Trust trading as): Eleebana WPS 172 0 0 172
Out Performers (Griffone Family Trust trading as): Burwood Beach WWTW PPS 0 623 0 623

B Creation of certificates
74IPA
RT Compliance and O
peration of the NSW
Energy Savings Scheme during 2011
Company and RESA activity name 2009 2010 2011 Total
Out Performers (Griffone Family Trust trading as): Burwood Beach WWTW SPS 0 2,110 0 2,110
Out Performers (Griffone Family Trust trading as): Network Leak Detection 2010 0 1,210 0 1,210
Out Performers (Griffone Family Trust trading as): VSD Installation and Control Stockton 2 0 0 56 56
Out Performers (Griffone Family Trust trading as): Pump Replacement Wallsend 0 0 2,398 2,398
Out Performers (Griffone Family Trust trading as): Toronto Trans Lake Pumping 0 0 349 349
Out Performers (Griffone Family Trust trading as): Leak Detection Program 2011 0 0 711 711
Out Performers (Griffone Family Trust trading as): Swansea 3A WWPS VSD 453 0 0 453
Out Performers (Griffone Family Trust trading as): Swansea 3A WWPS Sewer Relining 117 0 0 117
Out Performers (Griffone Family Trust trading as): Kahibah No. 1 WWPS 233 0 0 233
Out Performers (Griffone Family Trust trading as): Belmont WWTW DO Control 0 2,188 0 2,188
Out Performers (Griffone Family Trust trading as): Swansea 4 WWPS Relining 0 42 0 42
Out Performers (Griffone Family Trust trading as): Shortland WWTW DO Reduction 0 370 0 370
Out Performers (Griffone Family Trust trading as): Berry Park WWPS Rising Main 0 284 0 284
Out Performers (Griffone Family Trust trading as): Burwood Beach WWTW Blowers 0 398 0 398
Out Performers (Griffone Family Trust trading as): Compressed Air Projects 2,759 19,200 24,274 46,233
Out Performers (Griffone Family Trust trading as): OP013 Commercial and Industrial Chillers 0 13,111 37,812 50,923
Out Performers (Griffone Family Trust trading as): OP011 Nationwide News 0 3,572 0 3,572
Out Performers (Griffone Family Trust trading as): OP008 Westpac DCD 0 10,592 0 10,592
Out Performers (Griffone Family Trust trading as): OP015 Commercial and Industrial Refrigeration 0 1,606 3,253 4,859
Out Performers (Griffone Family Trust trading as): OP016.1.2 Rio Tinto HVO 0 0 1,290 1,290
Out Performers (Griffone Family Trust trading as): OP016.1.1 Rio Tinto Spiral Upgrade 0 0 1,540 1,540
SEE Enterprises Pty Limited: Lurgi and Flakt 2 baghouse flow reduction-OneSteel Waratah 0 5,516 0 5,516
Tooheys Pty Ltd: Ammonia Refrigeration 0 0 6,443 6,443
University of Technology Sydney: Building 2 Lighting Upgrade 585 0 0 585
University of Wollongong: Occupancy Sensor and Voltage Reduction for Lighting 323 643 0 966
Visy Pulp & Paper Pty Ltd: Cooling Water Pumps Improvement 855 1,258 957 3,070

75 Com
pliance and Operation of the N
SW Energy Savings Schem
e during 2011 IPART
B Creation of certificates
Company and RESA activity name 2009 2010 2011 Total
Western Sydney Local Health District: Installation of variable speed drives on air handling plant 0 0 0 0
Woolworths Ltd: Supermarket After Hours Lighting Controls 9,221 17,984 17,296 44,501
Table B.2 Metered Baseline Method – baseline per unit of output (certificates)
Company and RESA activity name 2009 2010 2011 Total
Amcor Packaging (Australia) Pty Ltd: Botany Paper Mill - Whole of Site 7,090 11,669 11,315 30,074
Carter Holt Harvey Australia Pty Ltd: Oberon Refiner Control Improvement* 7,363 1,766 0 9,129
Hydro Aluminium Kurri Kurri Pty Ltd: Kurri Kurri Smelter Upgrade and Retrofit 44,836 77,638 74,500 196,974
Orica Australia Pty Ltd: Botany Chlorine Plant Upgrade 12,129 29,378 28,414 69,921
Tomago Aluminium Company Pty Ltd: Smelting Electrical Energy Reduction 18,079 33,024 30,000 81,103
Table B.3 Metered Baseline Method – baseline unaffected by output (certificates)
Company and RESA activity name 2009 2010 2011 Total
Haron Robson Energy Pty Ltd: Chiller Up-Grade 0 0 0 0
Knowledge Global Pty Ltd: Fitness First Efficiency Verification Program 0 0 3,054 3,054
Sydney Markets Limited: Building E Chillers Replacement 0 0 66 66
Western Sydney Local Health District: EPC and GEEIP 630 856 789 2,275

B Creation of certificates
76IPA
RT Compliance and O
peration of the NSW
Energy Savings Scheme during 2011
Table B.4 Metered Baseline Method – NABERS baseline (certificates)
Company and RESA activity name 2009 2010 2011 Total
Charter Hall Asset Services Limited: Building Energy Consumption Reduction 4,073 0 12,062 16,135
Colonial First State Property: NABERS Energy Efficiency Program 0 2,540 7,427 9,967
Eureka Funds Management: NABERS Energy Efficiency Program 0 0 0 0
Investa Properties Ltd: Office Buildings Assessed using NABERS 0 10,618 13,604 24,222
LIF Pty Ltd: Commercial Building Energy Efficiency Upgrades 0 0 0 0
Stockland Property Management Pty Ltd: NABERS Energy Monitoring and Modification 0 1,181 4,484 5,665
Table B.5 Deemed Energy Savings Method – Power Factor Correction Energy Savings Formula (certificates)
Company and RESA activity name 2009 2010 2011 Total
Ausgrid: PFC Aggregation Program 0 0 0 0
Demand Manager Pty Ltd: PFC Aggregation Project - Commercial 0 0 0 0
Demand Manager Pty Ltd: PFC Aggregation Project - Industrial 0 0 0 0
Tooheys Pty Ltd: PFC method RESA 0 0 228 228

77 Com
pliance and Operation of the N
SW Energy Savings Schem
e during 2011 IPART
B Creation of certificates
Table B.6 Deemed Energy Savings Method – Commercial Lighting Formula (certificates)
Company and RESA activity name 2009 2010 2011 Total
AGL Energy Services Pty Ltd: Commercial Lighting Replacement Project 7,622 1,448 459 9,529
Ausgrid: Commercial Lighting Aggregation Program 660 3,416 0 4,076
Autonomous Energy Pty Ltd: Lighting Energy Efficiency Upgrade in Commercial Buildings 0 0 12,469 12,469
Blue Green Engineering Pty Ltd: Energy Efficient Commercial Lighting Replacements 0 0 0 0
Carbon Reduction Institute Pty Ltd: CRI Commercial Lighting (551B) 0 0 9,388 9,388
Carbon Reduction Institute Pty Ltd: CRI Commercial Lighting (551C) 0 0 24,049 24,049
Demand Manager Pty Ltd: Commercial Lighting Aggregation Project 0 201 18,915 19,116
Ecolight Installations Pty Ltd: Modification and replacement of commercial lighting 0 0 907 907
Ecovantage Pty Ltd: Commercial Lighting Upgrade Program 0 48 5,082 5,130
Ecovation Pty Ltd: Ecovation Lighting 0 0 0 0
Enact Energy Pty Limited: Commercial Lighting Activities 0 0 17,819 17,819
Essential Energy: Commercial Lighting Retrofit Program 0 1,185 4,291 5,476
Essential Energy: Streetlighting Replacement Program 0 0 6,141 6,141
Global Sustainability Initiatives Pty Ltd: ABESP Commercial Lighting Replacement 0 3,800 1,159 4,959
Glolight Pty Ltd: Energy Efficient Lighting Upgrades 0 0 5,159 5,159
Gosford City Council: Gosford Town Centre Car Parks LED Lighting Project 0 0 0 0
Green Alliance: T5 Commercial Lighting 0 364 0 364
Green Connection Group Pty Ltd: Commercial Lighting Upgrade Program 0 0 0 0
Green Energy Trading Pty Ltd: Commercial Lighting Aggregation Project 0 0 8,848 8,848
Greenbank Environmental Pty Ltd: Commercial Lighting Upgrade Program 0 0 0 0
Greenearth Energy Efficiency Pty Ltd: HID Lighting Equipment Upgrade and Optimisation 0 96 153 249
Hilton Hotels of Australia Pty Limited: Hilton Sydney - Guest floor lighting retrofit 0 0 3,079 3,079
HMBC Pty Ltd Trading as Energy E-nnovations: Supply & Installation of Energy Efficient Lighting Products 0 0 4,352 4,352
Lakeco Pty Ltd, trading as Nickel Energy: Replacement of halogen downlights and fluorescent lighting 0 0 0 0
Low Energy Supplies and Services Pty Ltd: Commercial Lighting Upgrade Projects 0 336 0 336

B Creation of certificates
78IPA
RT Compliance and O
peration of the NSW
Energy Savings Scheme during 2011
Company and RESA activity name 2009 2010 2011 Total
Low Energy Supplies and Services Pty Ltd: Commercial Lighting Halogen Replacement Program 0 1,090 118,592 119,682
Low Energy Supplies and Services Pty Ltd: Commercial Lighting Upgrade Program 0 0 60,746 60,746
Lowa Investments Pty Ltd: LED Installation Program 0 0 6,367 6,367
Maxee Innovations Pty Ltd: Commercial Lighting Retrofit Program 0 0 5,792 5,792
NSW Roads and Traffic Authority: Traffic light globe replacement project 1,841 8,497 6,458 16,796
Out Performers (Griffone Family Trust trading as): OP012 Commercial and Industrial Lighting 0 49,815 112,489 162,304
Ozzy Fortune Pty Ltd trading as Your Green Planet: YGP Commercial Lighting 0 0 0 0
Robcath Pty Ltd: Commercial Lighting Project 0 47 0 47
Sustain Agility Pty Ltd: Managed Certificate Projects 0 0 66 66
Sydney Markets Limited: Sydney Markets Lighting RESA 0 0 2,426 2,426
The Green Guys Group Pty Ltd: Commercial Lighting Replacement 0 0 38,500 38,500
Trade In Green Pty Ltd: Lighting Efficiency Program - Commercial 0 0 6,459 6,459
Urban Group Energy Pty Ltd: b-Efficient Commercial Lighting 0 0 1,391 1,391
Woolworths Ltd: Lighting - T5 Upgrades 0 0 24,128 24,128

79 Com
pliance and Operation of the N
SW Energy Savings Schem
e during 2011 IPART
B Creation of certificates
Table B.7 Deemed Energy Savings Method – Default Savings Factors (certificates)
Company and RESA activity name 2009 2010 2011 Total
Aspect Energy: Residential Showerlite Program (ESS Rule V1)* 35,928 105,745 0 141,673
Aspect Energy: Residential Showerlite Program (2) (ESS Rule V1)* 0 0 0 0
Aspect Energy: Residential Showerlite Program (ESS Rule V2)* 0 0 3,429 3,429
Ausgrid: Hairdresser down-light replacement program 0 1,039 0 1,039
Ausgrid: Commercial Lighting - LED replacement of Halogen Downlights 0 0 0 0
Australian Eco Developments Pty Ltd: Showerhead Replacement Program - Residential 0 0 5,250 5,250
Australian Eco Developments Pty Ltd: Showerhead Replacement Program - Commercial 0 0 210 210
Combined Force Pty Ltd: Meters slow with Low H20 - Residential (ESS Rule V1) 0 9,454 0 9,454
Combined Force Pty Ltd: Meters slow with Low H20 - Commercial (ESS Rule V1) 0 546 0 546
Combined Force Pty Ltd: Meters slow with Low H20 - Residential (ESS Rule V2) 0 0 0 0
Combined Force Pty Ltd: Meters slow with Low H20 - Commercial (ESS Rule V2) 0 0 0 0
Cyanergy Pty Ltd: Energy Savings Program - Residential 0 0 0 0
Cyanergy Pty Ltd: Energy Savings Program - Commercial 0 0 0 0
Demand Manager Pty Ltd: Carbon Saver Program 0 0 0 0
Easy Being Green Pty Ltd (formerly ClimateBank): Change for the better 0 0 0 0
Enact Energy Pty Limited: Halogen Replacement - Residential 0 0 0 0
Enact Energy Pty Limited: Halogen Replacement - Commercial 0 0 0 0
Enact Energy Pty Limited: Showerhead Replacement - Residential (ESS Rule V1) 0 201,715 0 201,715
Enact Energy Pty Limited: Showerhead Replacement - Commercial (ESS Rule V1) 0 35,777 0 35,777
Enact Energy Pty Limited: Halogen and Transformer Replacement - Commercial 0 0 0 0
Enact Energy Pty Limited: Showerhead Replacement - Residential (ESS Rule V2) 0 0 402 402
Enact Energy Pty Limited: Showerhead Replacement - Commercial (ESS Rule V2) 0 0 0 0
Enact Energy Pty Limited: Showerhead Sales - Residential (ESS Rule V2)* 0 0 2,872 2,872
Enact Energy Pty Limited: Showerhead Sales - Commercial (ESS Rule V2)* 0 0 18,639 18,639

B Creation of certificates
80IPA
RT Compliance and O
peration of the NSW
Energy Savings Scheme during 2011
Company and RESA activity name 2009 2010 2011 Total
Enact Energy Pty Limited: NSW Showerhead Sales - Residential 0 0 23,757 23,757
Enact Energy Pty Limited: NSW Showerhead Sales - Commercial 0 0 8,279 8,279
Envirocare & Savers t/a Wellbeinggreen: Shower Rose Replacement Program - Residential (ESS Rule V1)* 0 19,938 0 19,938
Envirocare & Savers t/a Wellbeinggreen: Shower Rose Replacement Program - Commercial (ESS Rule V1)* 0 794 0 794
Envirocare & Savers t/a Wellbeinggreen: Shower Rose Replacement Program - Residential (ESS Rule V2)* 0 0 0 0
Envirocare & Savers t/a Wellbeinggreen: Shower Rose Replacement Program - Commercial (ESS Rule V2)* 0 0 0 0
Envirocare & Savers t/a Wellbeinggreen: Halogen Lamp Replacement Program - Residential (ESS Rule V2* 0 0 0 0
Envirocare & Savers t/a Wellbeinggreen: Halogen Lamp Replacement Program - Commercial (ESS Rule V2)* 0 0 0 0
Envirocare & Savers Pty Ltd t/a Wellbeinggreen: Showerhead Sales - Residential* 0 0 0 0
Envirocare & Savers Pty Ltd t/a Wellbeinggreen: Showerhead Sales - Commercial* 0 0 0 0
Envirocare & Savers Pty Ltd t/a Wellbeinggreen: Halogen Lamp Sales - Residential* 0 0 0 0
Envirocare & Savers Pty Ltd t/a Wellbeinggreen: Halogen Lamp Sales - Commercial* 0 0 0 0
Fieldforce Services Pty Ltd: Replacement of showerheads (ESS Rule V1) 0 0 0 0
Fieldforce Services Pty Ltd: Replacement of halogens 0 0 0 0
Fieldforce Services Pty Ltd: Replacement of showerheads (ESS Rule V2) 0 0 0 0
Genco Australia Pty Ltd: Showerhead Replacement - Residential 0 0 0 0
Genco Australia Pty Ltd: Showerhead Replacement - Commercial 0 0 0 0
Genco Australia Pty Ltd: Halogen Replacement - Residential 0 0 2,514 2,514
Genco Australia Pty Ltd: Halogen Replacement - Commercial 0 0 317 317
Genco Australia Pty Ltd: Showerhead Sales - Residential 0 0 0 0
Genco Australia Pty Ltd: Showerhead Sales - Commercial 0 0 0 0
Genco Australia Pty Ltd: Halogen Sales - Residential 0 0 0 0
Genco Australia Pty Ltd: Halogen Sales - Commercial 0 0 0 0
Green Made Easy Pty Ltd: Installation of Raindrop shower heads (ESS Rule V1) 0 0 0 0
Green Made Easy Pty Ltd: Installation of Raindrop shower heads (ESS Rule V2) 0 0 0 0
Greenmoola.com Pty Ltd: Greenmoola.com Rebate Program 0 0 38 38

81 Com
pliance and Operation of the N
SW Energy Savings Schem
e during 2011 IPART
B Creation of certificates
Company and RESA activity name 2009 2010 2011 Total
Low Energy Supplies and Services Pty Ltd: Direct Sales and Installations - Showerheads (ESS Rule V1)* 0 0 0 0
Low Energy Supplies and Services Pty Ltd: Direct Sales and Installations - Showerheads (ESS Rule V2)* 0 0 0 0
Lowa Investments Pty Ltd: Lowa Group LED sales program 0 0 0 0
Next Energy Pty Ltd: Fridge Buyback 0 0 0 0
Ozzy Fortune Pty Ltd trading as Your Green Planet: Showerheads - Residential (ESS Rule V1) 0 23,978 0 23,978
Ozzy Fortune Pty Ltd trading as Your Green Planet: Showerheads - Commercial (ESS Rule V1) 0 5,942 0 5,942
Ozzy Fortune Pty Ltd trading as Your Green Planet: Showerheads - Residential (ESS Rule V2) 0 0 56,090 56,090
Ozzy Fortune Pty Ltd trading as Your Green Planet: Showerheads - Commercial (ESS Rule V2) 0 0 19,954 19,954
Sales Solutions Australia Pty Ltd: Shower Rose Replacement Project 0 0 89,886 89,886
Sydney Water Corporation: Washing Machine Rebate Program* 701 258 0 959
Sydney Water Corporation: Waterfix* 1,104 2,364 0 3,468
Watts Green Pty Ltd: Energy Efficiency Refit Program - Residential (ESS Rule V1) 0 12,676 0 12,676
Watts Green Pty Ltd: Energy Efficiency Refit Program - Commercial (ESS Rule V1) 0 5,756 0 5,756
Watts Green Pty Ltd: Energy Efficiency Refit Program - Residential (ESS Rule V2) 0 0 31,704 31,704
Watts Green Pty Ltd: Energy Efficiency Refit Program - Commercial (ESS Rule V2) 0 0 5,882 5,882

C Estimated energy savings
82 IPART Compliance and Operation of the NSW Energy Savings Scheme during 2011
C Estimated energy savings
This appendix details estimated energy savings where forward creation or deeming applies by individual activity. Refer to Section 6.1.2 for further information on estimated energy savings. Estimated energy savings are reported in MWh.
Data in this chapter are current as at 30 June 2012.

83 Com
pliance and Operation of the N
SW Energy Savings Schem
e during 2011 IPART
C Estim
ated energy savings
Table C.1 Project Impact Assessment Method (MWh savings)
2009/10 2011 2012 2013 2014 2015 2016 2017 2018 2019 2020 2021 Total
BOC Ltd: Port Kembla LMPC 992 0 0 0 0 0 0 0 0 0 0 0 992
Boral Ltd: Berrima Kiln 6 Upgrade 14,426 7,075 0 0 0 0 0 0 0 0 0 0 21,502
Coles Supermarkets Australia Pty Ltd: Coles Supermarket Lighting Controls Upgrade
0 3,520 2,959 2,226 1,494 761 29 0 0 0 0 0 10,988
Commonwealth Bank of Australia: Voltage reduction in branch network lighting
259 0 0 0 0 0 0 0 0 0 0 0 259
Commonwealth Bank of Australia: Branch Network BMS Upgrade 763 0 0 0 0 0 0 0 0 0 0 0 763
Commonwealth Bank of Australia: Lighting Controls
794 0 0 0 0 0 0 0 0 0 0 0 794
Commonwealth Bank of Australia: VSD Upgrades on cooling fans and condenser pump
164 0 0 0 0 0 0 0 0 0 0 0 164
Continental Carbon Australia Pty Ltd: Installation of VSD on boiler fan
359 180 128 77 26 0 0 0 0 0 0 0 770
Demand Manager Pty Ltd: Lighting Aggregation Project - PIAM
19,772 9,878 7,055 4,232 1,409 0 0 0 0 0 0 0 42,345
GridX Power Pty Ltd: Glenfield MiniGrid Home Space Cooling Project 7 0 0 0 0 0 0 0 0 0 0 0 7
Merck Sharp & Dohme (Australia) Pty Ltd: Lighting voltage reduction 0 0 0 0 0 0 0 0 0 0 0 0 0
Norske Skog Paper Mills (Aust) Ltd: Deckers Feed Pump Bypass
6,323 4,204 0 0 0 0 0 0 0 0 0 0 10,526
Norske Skog Paper Mills (Aust) Ltd: Paper machine vacuum system optimisation
2,848 4,989 0 0 0 0 0 0 0 0 0 0 7,837

C Estim
ated energy savings
84IPA
RT Compliance and O
peration of the NSW
Energy Savings Scheme during 2011
2009/10 2011 2012 2013 2014 2015 2016 2017 2018 2019 2020 2021 Total
NSW Roads and Traffic Authority: Upgrade of Traffic Lights 13,735 6,862 4,901 2,940 979 0 0 0 0 0 0 0 29,415
Out Performers (Griffone Family Trust trading as): EAF Efficiency 7,685 3,839 2,742 1,645 548 0 0 0 0 0 0 0 16,459
Out Performers (Griffone Family Trust trading as): Heel Procedure
4,112 2,054 1,467 880 293 0 0 0 0 0 0 0 8,807
Out Performers (Griffone Family Trust trading as): Heat Slingers
308 154 110 66 22 0 0 0 0 0 0 0 660
Out Performers (Griffone Family Trust trading as): Fume Fan VSD 713 356 254 153 51 0 0 0 0 0 0 0 1,526
Out Performers (Griffone Family Trust trading as): Grasso Compressor VSD
228 114 81 49 16 0 0 0 0 0 0 0 488
Out Performers (Griffone Family Trust trading as): Glycol Heat Exchanger
396 198 141 85 28 0 0 0 0 0 0 0 849
Out Performers (Griffone Family Trust trading as): Compressor System Upgrade
733 366 262 157 52 0 0 0 0 0 0 0 1,571
Out Performers (Griffone Family Trust trading as): Condenser System Upgrade
711 355 254 152 51 0 0 0 0 0 0 0 1,524
Out Performers (Griffone Family Trust trading as): Eleebana WPS 76 38 27 16 5 0 0 0 0 0 0 0 162
Out Performers (Griffone Family Trust trading as): Burwood Beach WWTW PPS
196 157 118 78 39 0 0 0 0 0 0 0 588
Out Performers (Griffone Family Trust trading as): Burwood Beach WWTW SPS 664 531 398 265 133 0 0 0 0 0 0 0 1,991
Out Performers (Griffone Family Trust trading as): Network Leak Detection 2010
381 304 228 152 76 0 0 0 0 0 0 0 1,142
Out Performers (Griffone Family Trust trading as): VSD Installation and Control Stockton 2
0 18 14 11 7 4 0 0 0 0 0 0 53

85 Com
pliance and Operation of the N
SW Energy Savings Schem
e during 2011 IPART
C Estim
ated energy savings
2009/10 2011 2012 2013 2014 2015 2016 2017 2018 2019 2020 2021 Total
Out Performers (Griffone Family Trust trading as): Pump Replacement Wallsend
0 754 603 452 302 151 0 0 0 0 0 0 2,262
Out Performers (Griffone Family Trust trading as): Toronto Trans Lake Pumping
0 110 88 66 44 22 0 0 0 0 0 0 329
Out Performers (Griffone Family Trust trading as): Leak Detection Program 2011
0 224 179 134 89 45 0 0 0 0 0 0 671
Out Performers (Griffone Family Trust trading as): Swansea 3A WWPS VSD
200 100 71 43 14 0 0 0 0 0 0 0 427
Out Performers (Griffone Family Trust trading as): Swansea 3A WWPS Sewer Relining
52 26 18 11 4 0 0 0 0 0 0 0 110
Out Performers (Griffone Family Trust trading as): Kahibah No. 1 WWPS
103 51 37 22 7 0 0 0 0 0 0 0 220
Out Performers (Griffone Family Trust trading as): Belmont WWTW DO Control
688 550 413 275 138 0 0 0 0 0 0 0 2,064
Out Performers (Griffone Family Trust trading as): Swansea 4 WWPS Relining
13 11 8 5 3 0 0 0 0 0 0 0 40
Out Performers (Griffone Family Trust trading as): Shortland WWTW DO Reduction
116 93 70 47 23 0 0 0 0 0 0 0 349
Out Performers (Griffone Family Trust trading as): Berry Park WWPS Rising Main
89 71 54 36 18 0 0 0 0 0 0 0 268
Out Performers (Griffone Family Trust trading as): Burwood Beach WWTW Blowers
125 100 75 50 25 0 0 0 0 0 0 0 375
Out Performers (Griffone Family Trust trading as): Compressed Air Projects
7,253 13,071 10,163 7,255 4,347 1,527 0 0 0 0 0 0 43,616

C Estim
ated energy savings
86IPA
RT Compliance and O
peration of the NSW
Energy Savings Scheme during 2011
2009/10 2011 2012 2013 2014 2015 2016 2017 2018 2019 2020 2021 Total
Out Performers (Griffone Family Trust trading as): OP013 Commercial and Industrial Chillers
1,851 15,643 12,441 9,238 6,035 2,832 0 0 0 0 0 0 48,041
Out Performers (Griffone Family Trust trading as): OP011 Nationwide News
345 1,054 830 605 380 156 0 0 0 0 0 0 3,370
Out Performers (Griffone Family Trust trading as): OP008 Westpac DCD 0 3,331 2,665 1,998 1,332 666 0 0 0 0 0 0 9,992
Out Performers (Griffone Family Trust trading as): OP015 Commercial and Industrial Refrigeration
0 1,528 1,222 917 611 306 0 0 0 0 0 0 4,584
Out Performers (Griffone Family Trust trading as): OP016.1.2 Rio Tinto HVO
0 107 384 303 222 141 60 0 0 0 0 0 1,217
Out Performers (Griffone Family Trust trading as): OP016.1.1 Rio Tinto Spiral Upgrade
0 127 459 362 265 168 71 0 0 0 0 0 1,453
SEE Enterprises Pty Limited: Lurgi and Flakt 2 baghouse flow reduction-OneSteel Waratah
513 1,632 1,285 938 591 244 0 0 0 0 0 0 5,204
Tooheys Pty Ltd: Ammonia Refrigeration 0 444 1,937 1,532 1,127 722 316 0 0 0 0 0 6,078
University of Technology Sydney: Building 2 Lighting Upgrade
258 129 92 55 18 0 0 0 0 0 0 0 552
University of Wollongong: Occupancy Sensor and Voltage Reduction for Lighting
911 0 0 0 0 0 0 0 0 0 0 0 911
Visy Pulp & Paper Pty Ltd: Cooling Water Pumps Improvement 1,993 903 0 0 0 0 0 0 0 0 0 0 2,896
Western Sydney Local Health District: Installation of variable speed drives on air handling plant
0 0 0 0 0 0 0 0 0 0 0 0 0
Woolworths Ltd: Supermarket After Hours Lighting Controls 25,665 16,317 0 0 0 0 0 0 0 0 0 0 41,982
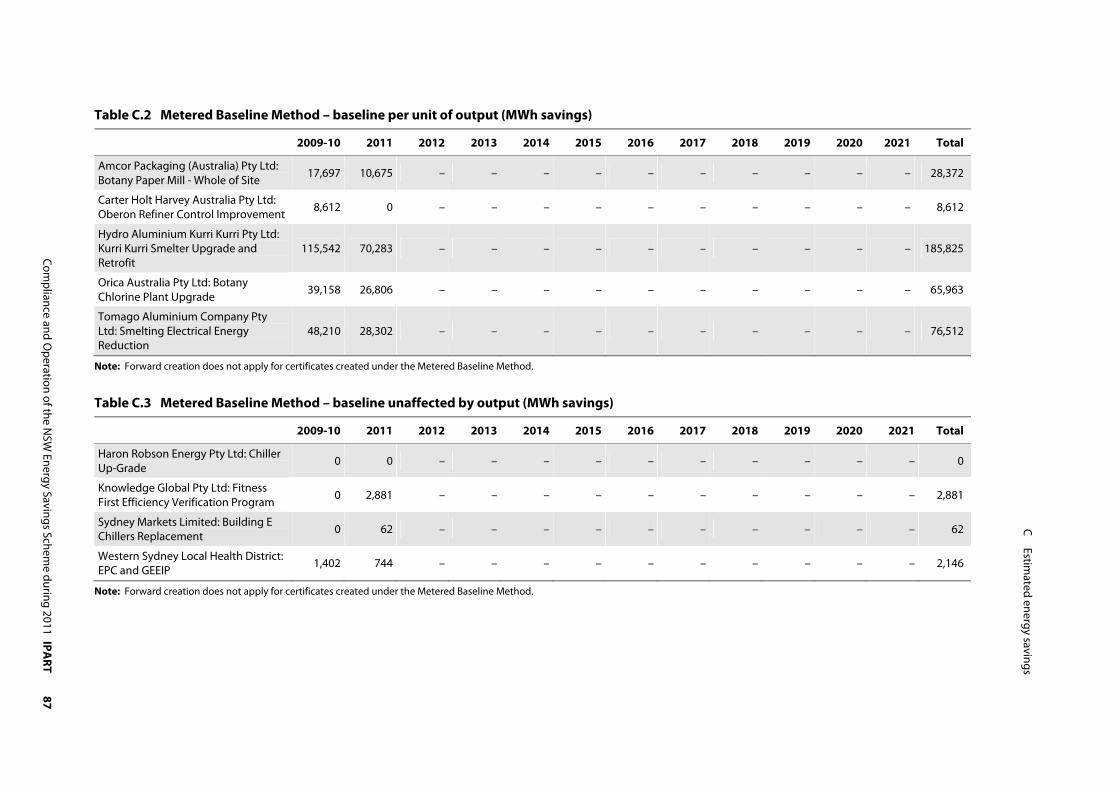
87 Com
pliance and Operation of the N
SW Energy Savings Schem
e during 2011 IPART
C Estim
ated energy savings
Table C.2 Metered Baseline Method – baseline per unit of output (MWh savings)
2009-10 2011 2012 2013 2014 2015 2016 2017 2018 2019 2020 2021 Total
Amcor Packaging (Australia) Pty Ltd: Botany Paper Mill - Whole of Site
17,697 10,675 – – – – – – – – – – 28,372
Carter Holt Harvey Australia Pty Ltd: Oberon Refiner Control Improvement
8,612 0 – – – – – – – – – – 8,612
Hydro Aluminium Kurri Kurri Pty Ltd: Kurri Kurri Smelter Upgrade and Retrofit
115,542 70,283 – – – – – – – – – – 185,825
Orica Australia Pty Ltd: Botany Chlorine Plant Upgrade
39,158 26,806 – – – – – – – – – – 65,963
Tomago Aluminium Company Pty Ltd: Smelting Electrical Energy Reduction
48,210 28,302 – – – – – – – – – – 76,512
Note: Forward creation does not apply for certificates created under the Metered Baseline Method.
Table C.3 Metered Baseline Method – baseline unaffected by output (MWh savings)
2009-10 2011 2012 2013 2014 2015 2016 2017 2018 2019 2020 2021 Total
Haron Robson Energy Pty Ltd: Chiller Up-Grade
0 0 – – – – – – – – – – 0
Knowledge Global Pty Ltd: Fitness First Efficiency Verification Program
0 2,881 – – – – – – – – – – 2,881
Sydney Markets Limited: Building E Chillers Replacement 0 62 – – – – – – – – – – 62
Western Sydney Local Health District: EPC and GEEIP 1,402 744 – – – – – – – – – – 2,146
Note: Forward creation does not apply for certificates created under the Metered Baseline Method.

C Estim
ated energy savings
88IPA
RT Compliance and O
peration of the NSW
Energy Savings Scheme during 2011
Table C.4 Metered Baseline Method – NABERS baseline (MWh savings)
2009/10 2011 2012 2013 2014 2015 2016 2017 2018 2019 2020 2021 Total
Charter Hall Asset Services Limited: Building Energy Consumption Reduction
3,842 11,379 – – – – – – – – – – 15,222
Colonial First State Property: NABERS Energy Efficiency Program 2,396 7,007 – – – – – – – – – – 9,403
Eureka Funds Management: NABERS Energy Efficiency Program 0 0 – – – – – – – – – – 0
Investa Properties Ltd: Office Buildings Assessed using NABERS
10,017 12,834 – – – – – – – – – – 22,851
LIF Pty Ltd: Commercial Building Energy Efficiency Upgrades 0 0 – – – – – – – – – – 0
Stockland Property Management Pty Ltd: NABERS Energy Monitoring and Modification
1,114 4,230 – – – – – – – – – – 5,344
Note: Forward creation does not apply for certificates created under the Metered Baseline Method.

89 Com
pliance and Operation of the N
SW Energy Savings Schem
e during 2011 IPART
C Estim
ated energy savings
Table C.5 Deemed Energy Savings Method – Default Savings Factors (MWh savings)
2009/10 2011 2012 2013 2014 2015 2016 2017 2018 2019 2020 2021 Total
Aspect Energy: Residential Showerlite Program (ESS Rule V1) 21,519 19,093 19,093 19,093 19,093 19,093 16,668 0 0 0 0 0 133,654
Aspect Energy: Residential Showerlite Program (2) (ESS Rule V1)
0 0 0 0 0 0 0 0 0 0 0 0 0
Aspect Energy: Residential Showerlite Program (ESS Rule V2)
0 462 462 462 462 462 462 462 0 0 0 0 3,235
Ausgrid: Hairdresser down-light replacement program 588 392 0 0 0 0 0 0 0 0 0 0 980
Ausgrid: Commercial Lighting - LED replacement of Halogen Downlights 0 0 0 0 0 0 0 0 0 0 0 0 0
Australian Eco Developments Pty Ltd: Showerhead Replacement Program - Residential
0 625 708 708 708 708 708 708 82 0 0 0 4,953
Australian Eco Developments Pty Ltd: Showerhead Replacement Program - Commercial
0 25 28 28 28 28 28 28 3 0 0 0 198
Combined Force Pty Ltd: Meters slow with Low H20 - Residential (ESS Rule V1)
1,204 1,274 1,274 1,274 1,274 1,274 1,274 70 0 0 0 0 8,919
Combined Force Pty Ltd: Meters slow with Low H20 - Commercial (ESS Rule V1)
70 74 74 74 74 74 74 4 0 0 0 0 515
Combined Force Pty Ltd: Meters slow with Low H20 - Residential (ESS Rule V2)
0 0 0 0 0 0 0 0 0 0 0 0 0
Combined Force Pty Ltd: Meters slow with Low H20 - Commercial (ESS Rule V2)
0 0 0 0 0 0 0 0 0 0 0 0 0
Cyanergy Pty Ltd: Energy Savings Program - Residential 0 0 0 0 0 0 0 0 0 0 0 0 0

C Estim
ated energy savings
90IPA
RT Compliance and O
peration of the NSW
Energy Savings Scheme during 2011
2009/10 2011 2012 2013 2014 2015 2016 2017 2018 2019 2020 2021 Total
Cyanergy Pty Ltd: Energy Savings Program - Commercial 0 0 0 0 0 0 0 0 0 0 0 0 0
Demand Manager Pty Ltd: Carbon Saver Program 0 0 0 0 0 0 0 0 0 0 0 0 0
Easy Being Green Pty Ltd (formerly ClimateBank): Change for the better
0 0 0 0 0 0 0 0 0 0 0 0 0
Enact Energy Pty Limited: Halogen Replacement - Residential
0 0 0 0 0 0 0 0 0 0 0 0 0
Enact Energy Pty Limited: Halogen Replacement - Commercial 0 0 0 0 0 0 0 0 0 0 0 0 0
Enact Energy Pty Limited: Showerhead Replacement - Residential (ESS Rule V1)
27,185 27,185 27,185 27,185 27,185 27,185 27,185 0 0 0 0 0 190,297
Enact Energy Pty Limited: Showerhead Replacement - Commercial (ESS Rule V1)
4,822 4,822 4,822 4,822 4,822 4,822 4,822 0 0 0 0 0 33,752
Enact Energy Pty Limited: Halogen and Transformer Replacement - Commercial
0 0 0 0 0 0 0 0 0 0 0 0 0
Enact Energy Pty Limited: Showerhead Replacement - Residential (ESS Rule V2)
0 54 54 54 54 54 54 54 0 0 0 0 379
Enact Energy Pty Limited: Showerhead Replacement - Commercial (ESS Rule V2)
0 0 0 0 0 0 0 0 0 0 0 0 0
Enact Energy Pty Limited: Showerhead Sales - Residential (ESS Rule V2)
0 387 387 387 387 387 387 387 0 0 0 0 2,709
Enact Energy Pty Limited: Showerhead Sales - Commercial (ESS Rule V2)
0 2,512 2,512 2,512 2,512 2,512 2,512 2,512 0 0 0 0 17,584
Enact Energy Pty Limited: NSW Showerhead Sales - Residential
0 3,202 3,202 3,202 3,202 3,202 3,202 3,202 0 0 0 0 22,412

91 Com
pliance and Operation of the N
SW Energy Savings Schem
e during 2011 IPART
C Estim
ated energy savings
2009/10 2011 2012 2013 2014 2015 2016 2017 2018 2019 2020 2021 Total
Enact Energy Pty Limited: NSW Showerhead Sales - Commercial 0 1,116 1,116 1,116 1,116 1,116 1,116 1,116 0 0 0 0 7,810
Envirocare & Savers Pty Ltd t/a Wellbeinggreen: Shower Rose Replacement Program - Residential (ESS Rule V1)
2,687 2,687 2,687 2,687 2,687 2,687 2,687 0 0 0 0 0 18,809
Envirocare & Savers Pty Ltd t/a Wellbeinggreen: Shower Rose Replacement Program - Commercial (ESS Rule V1)
107 107 107 107 107 107 107 0 0 0 0 0 749
Envirocare & Savers Pty Ltd t/a Wellbeinggreen: Shower Rose Replacement Program - Residential (ESS Rule V2)
0 0 0 0 0 0 0 0 0 0 0 0 0
Envirocare & Savers Pty Ltd t/a Wellbeinggreen: Shower Rose Replacement Program - Commercial (ESS Rule V2)
0 0 0 0 0 0 0 0 0 0 0 0 0
Envirocare & Savers Pty Ltd t/a Wellbeinggreen: Halogen Lamp Replacement Program - Residential (ESS Rule V2
0 0 0 0 0 0 0 0 0 0 0 0 0
Envirocare & Savers Pty Ltd t/a Wellbeinggreen: Halogen Lamp Replacement Program - Commercial (ESS Rule V2)
0 0 0 0 0 0 0 0 0 0 0 0 0
Envirocare & Savers Pty Ltd t/a Wellbeinggreen: Showerhead Sales - Residential
0 0 0 0 0 0 0 0 0 0 0 0 0
Envirocare & Savers Pty Ltd t/a Wellbeinggreen: Showerhead Sales - Commercial
0 0 0 0 0 0 0 0 0 0 0 0 0

C Estim
ated energy savings
92IPA
RT Compliance and O
peration of the NSW
Energy Savings Scheme during 2011
2009/10 2011 2012 2013 2014 2015 2016 2017 2018 2019 2020 2021 Total
Envirocare & Savers Pty Ltd t/a Wellbeinggreen: Halogen Lamp Sales - Residential
0 0 0 0 0 0 0 0 0 0 0 0 0
Envirocare & Savers Pty Ltd t/a Wellbeinggreen: Halogen Lamp Sales - Commercial
0 0 0 0 0 0 0 0 0 0 0 0 0
Fieldforce Services Pty Ltd: Replacement of showerheads (ESS Rule V1)
0 0 0 0 0 0 0 0 0 0 0 0 0
Fieldforce Services Pty Ltd: Replacement of halogens
0 0 0 0 0 0 0 0 0 0 0 0 0
Fieldforce Services Pty Ltd: Replacement of showerheads (ESS Rule V2)
0 0 0 0 0 0 0 0 0 0 0 0 0
Genco Australia Pty Ltd: Showerhead Replacement - Residential
0 0 0 0 0 0 0 0 0 0 0 0 0
Genco Australia Pty Ltd: Showerhead Replacement - Commercial
0 0 0 0 0 0 0 0 0 0 0 0 0
Genco Australia Pty Ltd: Halogen Replacement - Residential 0 351 712 712 478 120 0 0 0 0 0 0 2,372
Genco Australia Pty Ltd: Halogen Replacement - Commercial
0 44 90 90 60 15 0 0 0 0 0 0 299
Genco Australia Pty Ltd: Showerhead Sales - Residential
0 0 0 0 0 0 0 0 0 0 0 0 0
Genco Australia Pty Ltd: Showerhead Sales - Commercial 0 0 0 0 0 0 0 0 0 0 0 0 0
Genco Australia Pty Ltd: Halogen Sales - Residential 0 0 0 0 0 0 0 0 0 0 0 0 0
Genco Australia Pty Ltd: Halogen Sales - Commercial
0 0 0 0 0 0 0 0 0 0 0 0 0
Green Made Easy Pty Ltd: Installation of Raindrop shower heads (ESS Rule V1)
0 0 0 0 0 0 0 0 0 0 0 0 0

93 Com
pliance and Operation of the N
SW Energy Savings Schem
e during 2011 IPART
C Estim
ated energy savings
2009/10 2011 2012 2013 2014 2015 2016 2017 2018 2019 2020 2021 Total
Green Made Easy Pty Ltd: Installation of Raindrop shower heads (ESS Rule V2)
0 0 0 0 0 0 0 0 0 0 0 0 0
Greenmoola.com Pty Ltd: Greenmoola.com Rebate Program
0 2 3 3 3 3 3 3 3 3 3 3 36a
Low Energy Supplies and Services Pty Ltd: Direct Sales and Installations - Showerheads (ESS Rule V1)
0 0 0 0 0 0 0 0 0 0 0 0 0
Low Energy Supplies and Services Pty Ltd: Direct Sales and Installations - Showerheads (ESS Rule V2)
0 0 0 0 0 0 0 0 0 0 0 0 0
Lowa Investments Pty Ltd: Lowa Group LED sales program 0 0 0 0 0 0 0 0 0 0 0 0 0
Next Energy Pty Ltd: Fridge Buyback 0 0 0 0 0 0 0 0 0 0 0 0 0
Ozzy Fortune Pty Ltd trading as Your Green Planet: Showerheads - Residential (ESS Rule V1)
2,078 3,232 3,232 3,232 3,232 3,232 3,232 1,154 0 0 0 0 22,621
Ozzy Fortune Pty Ltd trading as Your Green Planet: Showerheads - Commercial (ESS Rule V1)
515 801 801 801 801 801 801 286 0 0 0 0 5,606
Ozzy Fortune Pty Ltd trading as Your Green Planet: Showerheads - Residential (ESS Rule V2)
0 7,559 7,559 7,559 7,559 7,559 7,559 7,559 0 0 0 0 52,915
Ozzy Fortune Pty Ltd trading as Your Green Planet: Showerheads - Commercial (ESS Rule V2)
0 2,689 2,689 2,689 2,689 2,689 2,689 2,689 0 0 0 0 18,825
Sales Solutions Australia Pty Ltd: Shower Rose Replacement Project
0 12,114 12,114 12,114 12,114 12,114 12,114 12,114 0 0 0 0 84,798
Sydney Water Corporation: Washing Machine Rebate Program
112 82 82 82 82 82 82 82 82 82 52 0 905
Sydney Water Corporation: Waterfix 542 467 467 467 467 467 393 0 0 0 0 0 3,272

C Estim
ated energy savings
94IPA
RT Compliance and O
peration of the NSW
Energy Savings Scheme during 2011
2009/10 2011 2012 2013 2014 2015 2016 2017 2018 2019 2020 2021 Total
Watts Green Pty Ltd: Energy Efficiency Refit Program - Residential (ESS Rule V1)
735 1,708 1,708 1,708 1,708 1,708 1,708 974 0 0 0 0 11,958
Watts Green Pty Ltd: Energy Efficiency Refit Program - Commercial (ESS Rule V1)
334 776 776 776 776 776 776 442 0 0 0 0 5,430
Watts Green Pty Ltd: Energy Efficiency Refit Program - Residential (ESS Rule V2)
0 4,273 4,273 4,273 4,273 4,273 4,273 4,273 0 0 0 0 29,909
Watts Green Pty Ltd: Energy Efficiency Refit Program - Commercial (ESS Rule V2)
0 793 793 793 793 793 793 793 0 0 0 0 5,549
a Total does not add due to rounding.
Table C.6 Deemed Energy Savings Method – Power Factor Correction Energy Savings Formula (MWh savings)
2009/10 2011 2012 2013 2014 2015 2016 2017 2018 2019 2020 2021 Total
Ausgrid: PFC Aggregation Program 0 0 0 0 0 0 0 0 0 0 0 0 0
Demand Manager Pty Ltd: PFC Aggregation Project - Commercial 0 0 0 0 0 0 0 0 0 0 0 0 0
Demand Manager Pty Ltd: PFC Aggregation Project - Industrial
0 0 0 0 0 0 0 0 0 0 0 0 0
Tooheys Pty Ltd: PFC method RESA 0 5 22 22 22 22 22 22 22 22 22 17 215

95 Com
pliance and Operation of the N
SW Energy Savings Schem
e during 2011 IPART
C Estim
ated energy savings
Table C.7 Deemed Energy Savings Method – Commercial Lighting Formula (MWh savings)
2009/10 2011 2012 2013 2014 2015 2016 2017 2018 2019 2020 2021 Total
AGL Energy Services Pty Ltd: Commercial Lighting Replacement Project
1,216 899 899 899 899 899 899 899 899 539 43 0 8,990
Ausgrid: Commercial Lighting Aggregation Program 416 385 385 385 385 385 385 385 385 353 0 0 3,845
Autonomous Energy Pty Ltd: Lighting Energy Efficiency Upgrade in Commercial Buildings
0 363 1,176 1,176 1,176 1,176 1,176 1,176 1,176 1,176 1,176 813 11,763
Blue Green Engineering Pty Ltd: Energy Efficient Commercial Lighting Replacements
0 0 0 0 0 0 0 0 0 0 0 0 0
Carbon Reduction Institute Pty Ltd: CRI Commercial Lighting (551B)
0 579 886 886 886 886 886 886 886 886 886 306 8,857
Carbon Reduction Institute Pty Ltd: CRI Commercial Lighting (551C)
0 1,484 2,269 2,269 2,269 2,269 2,269 2,269 2,269 2,269 2,269 785 22,688
Demand Manager Pty Ltd: Commercial Lighting Aggregation Project
19 1,803 1,803 1,803 1,803 1,803 1,803 1,803 1,803 1,803 1,784 0 18,034
Ecolight Installations Pty Ltd: Modification and replacement of commercial lighting
0 40 86 86 86 86 86 86 86 86 86 46 856
Ecovantage Pty Ltd: Commercial Lighting Upgrade Program 1 484 484 484 484 484 484 484 484 484 483 0 4,840
Ecovation Pty Ltd: Ecovation Lighting 0 0 0 0 0 0 0 0 0 0 0 0 0
Enact Energy Pty Limited: Commercial Lighting Activities
0 1,681 1,681 1,681 1,681 1,681 1,681 1,681 1,681 1,681 1,681 0 16,810
Essential Energy: Commercial Lighting Retrofit Program
57 738 738 738 738 738 738 681 0 0 0 0 5,166
Essential Energy: Streetlighting Replacement Program 0 14 579 579 579 579 579 579 579 579 579 565 5,793

C Estim
ated energy savings
96IPA
RT Compliance and O
peration of the NSW
Energy Savings Scheme during 2011
2009/10 2011 2012 2013 2014 2015 2016 2017 2018 2019 2020 2021 Total
Global Sustainability Initiatives Pty Ltd: ABESP Commercial Lighting Replacement
72 468 468 468 468 468 468 468 468 468 396 0 4,678
Glolight Pty Ltd: Energy Efficient Lighting Upgrades
0 25 487 487 487 487 487 487 487 487 487 461 4,867
Gosford City Council: Gosford Town Centre Car Parks LED Lighting Project 0 0 0 0 0 0 0 0 0 0 0 0 0
Green Alliance: T5 Commercial Lighting 29 34 34 34 34 34 34 34 34 34 5 0 343
Green Connection Group Pty Ltd: Commercial Lighting Upgrade Program
0 0 0 0 0 0 0 0 0 0 0 0 0
Green Energy Trading Pty Ltd: Commercial Lighting Aggregation Project
0 517 835 835 835 835 835 835 835 835 835 318 8,347
Greenbank Environmental Pty Ltd: Commercial Lighting Upgrade Program
0 0 0 0 0 0 0 0 0 0 0 0 0
Greenearth Energy Efficiency Pty Ltd: HID Lighting Equipment Upgrade and Optimisation
3 23 23 23 23 23 23 23 23 23 21 0 235
Hilton Hotels of Australia Pty Limited: Hilton Sydney - Guest floor lighting retrofit
0 7 290 290 290 290 290 290 290 290 290 283 2,905
HMBC Pty Ltd Trading as Energy E-nnovations: Supply & Installation of Energy Efficient Lighting Products
0 169 411 411 411 411 411 411 411 411 411 242 4,106
Lakeco Pty Ltd, trading as Nickel Energy: Replacement of halogen downlights and fluorescent lighting
0 0 0 0 0 0 0 0 0 0 0 0 0
Low Energy Supplies and Services Pty Ltd: Commercial Lighting Upgrade Projects
21 32 32 32 32 32 32 32 32 32 11 0 317

97 Com
pliance and Operation of the N
SW Energy Savings Schem
e during 2011 IPART
C Estim
ated energy savings
2009/10 2011 2012 2013 2014 2015 2016 2017 2018 2019 2020 2021 Total
Low Energy Supplies and Services Pty Ltd: Commercial Lighting Halogen Replacement Program
85 11,291 11,291 11,291 11,291 11,291 11,291 11,291 11,291 11,291 11,206 0 112,908
Low Energy Supplies and Services Pty Ltd: Commercial Lighting Upgrade Program
0 4,768 5,731 5,731 5,731 5,731 5,731 5,731 5,731 5,731 5,731 963 57,308
Lowa Investments Pty Ltd: LED Installation Program 0 442 601 601 601 601 601 601 601 601 601 159 6,007
Maxee Innovations Pty Ltd: Commercial Lighting Retrofit Program
0 211 546 546 546 546 546 546 546 546 546 335 5,464
NSW Roads and Traffic Authority: Traffic light globe replacement project
966 1,440 1,440 1,440 1,440 1,440 1,440 1,440 1,440 1,440 1,361 554 15,845
Out Performers (Griffone Family Trust trading as): OP012 Commercial and Industrial Lighting
1,391 15,312 15,312 15,312 15,312 15,312 15,312 15,312 15,312 15,312 13,921 0 153,117
Ozzy Fortune Pty Ltd trading as Your Green Planet: YGP Commercial Lighting
0 0 0 0 0 0 0 0 0 0 0 0 0
Robcath Pty Ltd: Commercial Lighting Project
1 4 4 4 4 4 4 4 4 4 4 0 44
Sustain Agility Pty Ltd: Managed Certificate Projects
0 2 6 6 6 6 6 6 6 6 6 4 62
Sydney Markets Limited: Sydney Markets Lighting RESA 0 229 229 229 229 229 229 229 229 229 229 0 2,289
The Green Guys Group Pty Ltd: Commercial Lighting Replacement 0 3,091 3,632 3,632 3,632 3,632 3,632 3,632 3,632 3,632 3,632 541 36,321
Trade In Green Pty Ltd: Lighting Efficiency Program - Commercial
0 219 609 609 609 609 609 609 609 609 609 391 6,093
Urban Group Energy Pty Ltd: b-Efficient Commercial Lighting
0 61 131 131 131 131 131 131 131 131 131 70 1,312
Woolworths Ltd: Lighting - T5 Upgrades 0 1,584 3,252 3,252 3,252 3,252 3,252 3,252 1,668 0 0 0 22,762

Glossary
98 IPART Compliance and Operation of the NSW Energy Savings Scheme during 2011
Glossary
This glossary provides a general guide to the terminology used in ESS. It is designed to be read in conjunction with the Act, Regulation and ESS Rule. This glossary should not be relied upon as a substitute for legal advice, and does not override the true definitions of these terms in the Act, Regulation or ESS Rule.
Term Meaning
Accredited Certificate Provider
A person accredited by the Scheme Administrator to create EnergySavings Certificates (ESCs) in respect of a Recognised Energy Savings Activity.
Act The Electricity Supply Act 1995 which established the Energy Savings Scheme (in particular Part 9 of the Act).
Approved Corresponding Scheme
A scheme in another jurisdiction that the Minister has determined to have similar objectives to the ESS and an equivalent complianceregime to the ESS. Once a scheme is determined to be an ApprovedCorresponding Scheme, persons may carry out Recognised Energy Savings Activities that are approved under the Approved Corresponding Scheme and create Energy Savings Certificates (ESCs).
Base Penalty Rate Is listed in Schedule 5A of the Act, and is $23.99 for 2011.
Baselines The level of energy consumption, or energy intensity against which improvements are measured, and from which the calculation of Energy Savings Certificates are made.
Carbon Dioxide Equivalent (CO2-e)
The standard unit for the quantification of all greenhouse gases.One Energy Savings Certificate represents the energy savingsequivalent to the abatement of one tonne of carbon dioxide equivalent (tCO2-e).
Certificate Conversion Factor Is listed in Schedule 5B of the Act as 1.06, and is used to convert the number of MWh of Energy Savings from a Recognised Energy Savings Activity to tonnes of carbon dioxide equivalent. This is done by multiplying the MWh saved by the Certificate Conversion Factor.

Glossary
Compliance and Operation of the NSW Energy Savings Scheme during 2011 IPART 99
Term Meaning
Confidence Factor A factor applied, when calculating the number of Energy Savings Certificates using either the Project Impact Assessment Method or the Metered Baseline Methods, that reflects that the accuracy ofAccredited Certificate Provider’s methodology. A more accuratemethodology will generally result in a higher Confidence Factor,and a larger number of certificates.
Consumer Price Index (CPI) Is the Consumer Price Index (All Groups Index) for Sydney. Under the Energy Savings Scheme, the Scheme Penalty Rate is adjusted, prior to the commencement of each calendar year, by the CPI, to give the adjusted Penalty Rate for that calendar year.
Default Savings Factors A default figure which may be used to calculate the number ofEnergy Savings Certificates (ESCs) for each activity listed in Schedule A of the ESS Rule. The use of Default Savings Factors allows all the energy savings associated with the activities listed in Schedule A to be brought forward to the point at which the activity takes place.
End-user Equipment
End-user equipment refers to the electricity consuming equipment, processes, or systems, including equipment directly consumingelectricity and any other equipment which controls or influencesthe consumption of electricity.
Energy Saver The person contractually liable for the energy consumed by the end-user equipment or site that is the subject of a Recognised Energy Savings Activity (RESA), or the person nominated in writing to be the Energy Saver in respect of a RESA.
Energy Savings Energy Savings refers to the calculated reduction in electricity consumption arising from a Recognised Energy Savings Activity(RESA) and calculated according to the ESS Rule.
Energy Savings Certificate (ESC)
A transferable certificate under Part 9 of the Act, which is created in accordance with the ESS Rule. A certificate represents the Energy Savings associated with the abatement of one tonne of carbon dioxide equivalent (tCO2-e).
Energy Savings Scheme Rule
The Energy Savings Scheme Rule of 2009 published by the Minister for Energy, sets out the primary eligibility requirements, calculation methodologies and arrangements for the creation of EnergySavings Certificates. This rule is amended from time to time.
Energy Savings Target The Energy Savings Target refers to a figure, specified in Schedule 5 of the Act, that is applied to the total Liable Acquisitions in NSW todetermine each Scheme Participant’s Individual Energy Savings Target for each calendar year.
Entitlement Date The date an ESS application for accreditation is accepted as being lodged in a complete and acceptable form by the SchemeAdministrator, and once accredited, the date from which anAccredited Certificate Provider may create certificates.

Glossary
100 IPART Compliance and Operation of the NSW Energy Savings Scheme during 2011
Term Meaning
Energy Savings Shortfall If a Scheme Participant fails to surrender enough Energy Savings Certificates to meet its Individual Energy Savings Target for the year, it has an Energy Savings Shortfall for that year and is liable to pay a penalty for each Energy Savings Certificate it has failed to surrender.
Exempt Electricity Load An Exempt Electricity Load is the load attributed to a person or classof person which has been granted partial exemption (60% or 90%)from the scheme by the Minister, as specified in the Ministerial Order.
Implementation Date The Implementation Date is the date on which the Energy Savingsfrom the Recognised Energy Savings Activity (RESA) commences.
Individual Energy Savings Target
The Individual Energy Savings Target is the number of Energy Savings Certificates (ESCs) which a Scheme Participant must surrender each year to meet its obligations under the Energy Savings Scheme. This target is determined by multiplying the Energy Savings Scheme Target for that year by the total liable acquisitions in that year and the certificate conversion factor.
Liable Acquisition Is any purchase of electricity by a Scheme Participant which is purchased from the Market Operator, or from parties not registeredwith the Market Operator for supply to end users in NSW whoseloads have not been listed as Exempt Electricity Loads.
Market Operator Is the entity responsible for the administration and operation of the wholesale national electricity market in accordance with theNational Electricity Law (currently the Australian Energy MarketOperator (AEMO)).
Ministerial Order The Ministerial Order is published annually, or when required, andlists all emissions intensive trade exposed industries, their locationand proportion of electricity load granted an exemption (either 60%or 90%) under the ESS.
National Australian Built Environment Rating System (NABERS)
Is a ratings methodology administered by the NABERS Administrator (currently the Office of Environment and Heritage (OEH)) which can be used to calculate Energy Savings under theMetered Baseline Method. The NABERS Method can be used for new or existing buildings.
Penalty Conversion Factor Is specified in Schedule 5A of the Act, and is 0.94 for the duration ofthe Scheme.
(ESS) Penalty Rate Is calculated by multiplying the Base Penalty Rate per MWh by the Penalty Conversion Factor. The ESS Penalty Rate is the amount percertificate that is applied to a Scheme Participant’s Energy Savings Shortfall to calculate the monetary penalty as a result of the shortfall. The ESS Penalty Rate is listed in Schedule 5A of the Act.
Recognised Energy Savings Activity (RESA)
A specific activity, approved by the Scheme Administrator, which isimplemented by an Energy Saver and increases the efficiency ofelectricity consumption or reduces electricity consumption with no negative effect on production or service levels.

Glossary
Compliance and Operation of the NSW Energy Savings Scheme during 2011 IPART 101
Term Meaning
Regulation Electricity Supply (General) Regulation 2001.
Retail Supplier A Scheme Participant under the Energy Savings Scheme. Includes all holders of an electricity retail licence in NSW.
Scheme Administrator The body responsible for administering functions such as accrediting Accredited Certificate Providers, verifying Energy Savings activity and maintaining a registry of certificates. The NSW Independent Pricing and Regulatory Tribunal (IPART) is the Scheme Administrator for the Energy Savings Scheme.
Scheme Participant A person who is required to comply with an Individual Energy Savings Target. Scheme Participants include all Retail Suppliers of electricity in NSW, any person directly supplying a customer in NSWor any person directly purchasing electricity from the MarketOperator (other than a Retail Supplier).
Scheme Registry An online registry of Accredited Certificate Providers and Energy Savings Certificates.
Scheme Regulator The body that monitors the compliance of Scheme Participants with their Individual Energy Savings Targets under the Act. The NSWIndependent Pricing and Regulatory Tribunal (IPART) is the Scheme Regulator for the Energy Savings Scheme.
Site
A Site refers to all the End end-user equipment for which the electricity consumed is measured by the same utility meterallocated a National Meter Identifier (NMI) under the National Electricity Law, or by other meters or logging devices approved by the Scheme Administrator.