Embed Size (px)
Citation preview

Complexity and Diversity of Asian Migration
Manolo I. Abella1
In terms of contemporary migration, what distinguishes Asia from other
regions is the rapid growth of a market-led intra-regional migration system. Except for
the long festering ethnic war in Sri Lanka, the region saw relatively few incidences of
refugee-producing violent conflicts during the last decade. What featured prominently in
the Asian landscape was the opening up to the global economy of two giant economies,
China and India, and the financial crisis that put the brakes on the rapid growth of the
tiger-economies of Southeast Asia. With the ending of the cold war, the energies of the
region have turned to modernizing their productive infrastructures and producing goods
for the global market, absorbing huge amounts of foreign capital and generating
employment and higher per capita incomes in the process. With the exhaustion of their
labour reserves, Japan, the Republic of Korea, Hong Kong and Taiwan(China), Singapore
and Malaysia progressively turned to external sources of labour to meet emerging
shortages. This led to the rapid emergence of a regional labour migration system that
seems to have withstood the financial crisis and is acquiring more permanent
characteristics in spite of the avowed policy of all the states not to allow permanent
settlement.
For the huge continental states with their vast reserves of labour cross-border
or external migration remains to this day an insignificant development. In China, the
rising mobility of labour has so far been largely contained within the borders of its vast
continent, and so it is with India. However, elsewhere in the region the unbalanced pace
of industrialization led to greater and more diversified cross-border movements of labour.
While many Asian workers still found their way to the oil-rich region of the Persian Gulf,
the 1990s saw more workers – notably in southeast Asia, moving to better-paying jobs
closer to home. Aside from Japan, the more attractive destinations became Taiwan
(China), the Republic of Korea, Hong Kong, Singapore and Malaysia. Being more
remote from the sub-region, workers in the Indian sub-continent still largely went to
Saudi Arabia, Kuwait, and the other Gulf States, but there has been a notable rise in the
number of Bangladeshi plantation workers in Malaysia, Sri Lankan domestic helpers in
Singapore, and Nepalese construction workers in the Republic of Korea. At the same
time, the traditional migration front along Thailand’s borders with Burma and Laos
became activated as the country’s per capita income jumped far ahead of those of its
immediate neighbours.
The big picture
Over the period 1995 to 1999 an average of some 2 million Asian workers
were reported to have left their countries every year under contract to work abroad. To
this average we estimate that one needs to add at least another 600,000 to take into
1 I would like to thank Prof. Florian Alburo of the UP School of Economics for sharing with me his data
base on recent migration in Asia.

2
account those who left without registering because they were not required to (as is the
case with professionals in India), those admitted as “trainees”, those who left for tourism
or business but ended up getting employed abroad (based on numbers who overstayed
their visas), and those who crossed borders clandestinely but later registered when
offered the chance to be documented by amnesty.
A comparison of outflows from origin countries and counted foreign
populations (stocks) in destination countries suggests that the migration system is
characterized by high turn-over or relatively short stay of worker migrants. For example,
the cumulative number of Filipino workers who registered contracts to work in Hong
Kong over the period 1997-2000 reached almost half a million, but the Hong Kong
authorities reported a Filipino worker population of just over 151,000 in 2001. Many had
obviously returned again and again, registering every time they have a renewal of their
contracts. This pattern holds also for other migration destinations of Asian workers
within Asia and the Middle East.
Our estimate of the dimension of recent labour emigration is shown in Table
1.2 Over 1.2 million of the 2.6 million (about 46 percent) originated from one of the
South Asian countries. A very large proportion of these workers followed earlier
compatriots who went to the Persian Gulf region to perform all kinds of service and
maintenance jobs, build houses, serve as store-keepers or guard establishments, but the
period did see a small but significant flow of professionals and technical workers
heading for North America and Europe. There were also significant flows to Southeast
Asia to work in plantations in Malaysia, as domestic helpers in Singapore, and as
construction labour in Korea. Some were too poor to venture far away such as the many
thousands of farmers from Nepal’s valleys who migrated regularly for work during
planting and harvesting seasons in northeast India, as well as young women who got
trafficked into prostitution and ended up, for instance, in Bombay’s brothels.
Another 1.3 million migrant workers came from Southeast Asia, notably
Filipinos, Indonesians, Thais, Burmese, and Vietnamese. Young Indonesian men easily
found their way to Malaysia to take up all sorts of unskilled and semi-skilled jobs in
construction, helping to build its new capital city and the world’s tallest building in Kuala
Lumpur. The women found their way to Saudi Arabia to work as domestic helpers. While
the Philippines and Thailand also sent large numbers of workers to fill unskilled jobs in
2 The size of the labour migration movements for the region as a whole is very difficult to establish with
precision because of the weakness of monitoring systems on both sides of the migration chain, the
existence of unpoliced borders and the prevalence of illegal working among those admitted for other
purposes. Important movements such as those across the Nepal-Indian border, across the long Myanmar-
Thai border, across the Straits of Malacca between Indonesia and Malaysia, and from the Chinese mainland
to Taiwan, have largely gone unrecorded and are seldom reckoned in studies of migration in the region.
Even where there is closer monitoring of the flows, the reported data are often hard to compare because of
differences in concepts and measures used. To draw a rough map of the recent developments one has to
rely on assorted administrative reports coming from emigration control bodies in the major Asian countries
of origin and attempt to validate them from the immigration statistics of the countries of destination.
National censuses especially in the latter countries would have been more reliable sources but they are
conducted too infrequently to serve our purpose.
3
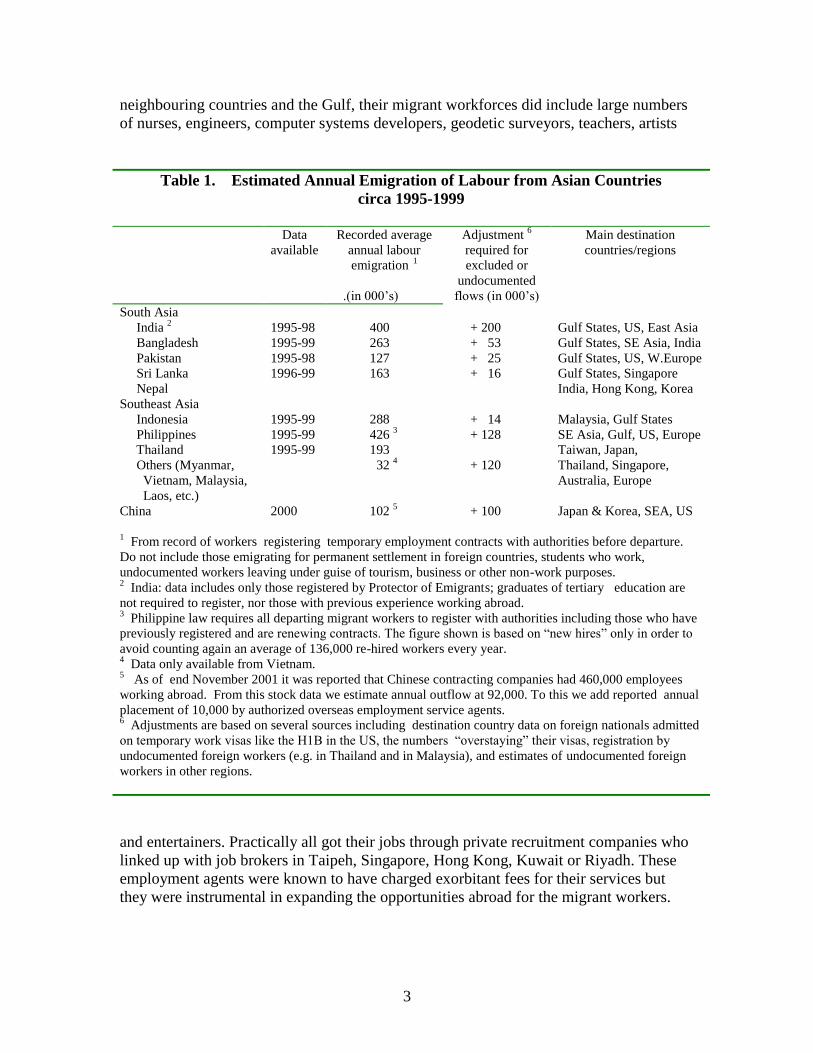
neighbouring countries and the Gulf, their migrant workforces did include large numbers
of nurses, engineers, computer systems developers, geodetic surveyors, teachers, artists
Table 1. Estimated Annual Emigration of Labour from Asian Countries
circa 1995-1999
Data
available
Recorded average
annual labour
emigration 1
.(in 000’s)
Adjustment 6
required for
excluded or
undocumented
flows (in 000’s)
Main destination
countries/regions
South Asia
India 2
1995-98 400 + 200 Gulf States, US, East Asia
Bangladesh 1995-99 263 + 53 Gulf States, SE Asia, India
Pakistan 1995-98 127 + 25 Gulf States, US, W.Europe
Sri Lanka 1996-99 163 + 16 Gulf States, Singapore
Nepal India, Hong Kong, Korea
Southeast Asia
Indonesia 1995-99 288 + 14 Malaysia, Gulf States
Philippines 1995-99 426 3 + 128 SE Asia, Gulf, US, Europe
Thailand 1995-99 193 Taiwan, Japan,
Others (Myanmar,
Vietnam, Malaysia,
Laos, etc.)
32 4 + 120 Thailand, Singapore,
Australia, Europe
China 2000 102 5 + 100 Japan & Korea, SEA, US
1
From record of workers registering temporary employment contracts with authorities before departure.
Do not include those emigrating for permanent settlement in foreign countries, students who work,
undocumented workers leaving under guise of tourism, business or other non-work purposes. 2 India: data includes only those registered by Protector of Emigrants; graduates of tertiary education are
not required to register, nor those with previous experience working abroad. 3
Philippine law requires all departing migrant workers to register with authorities including those who have
previously registered and are renewing contracts. The figure shown is based on “new hires” only in order to
avoid counting again an average of 136,000 re-hired workers every year. 4 Data only available from Vietnam.
5 As of end November 2001 it was reported that Chinese contracting companies had 460,000 employees
working abroad. From this stock data we estimate annual outflow at 92,000. To this we add reported annual
placement of 10,000 by authorized overseas employment service agents. 6 Adjustments are based on several sources including destination country data on foreign nationals admitted
on temporary work visas like the H1B in the US, the numbers “overstaying” their visas, registration by
undocumented foreign workers (e.g. in Thailand and in Malaysia), and estimates of undocumented foreign
workers in other regions.
and entertainers. Practically all got their jobs through private recruitment companies who
linked up with job brokers in Taipeh, Singapore, Hong Kong, Kuwait or Riyadh. These
employment agents were known to have charged exorbitant fees for their services but
they were instrumental in expanding the opportunities abroad for the migrant workers.

4
How much has labour emigration grown during the period? From the recorded
flows for the two periods, 1990-1994 and 1995-1999, it would appear that gross
emigration rose at an annual rate of 6 percent for the region as a whole. This would make
the migration growth over two times faster, on the average, than the growth of the labour
force of the origin countries, justifying the claim that mobility has risen significantly in
some parts of the region. In southeast Asia, the growth was initially even higher, but the
financial crisis which hit the region in 1997 and whose effects are still being felt in some
places today, put the brakes at least momentarily on further expansion.
An emerging Asian migration system
Asia itself absorbed an increasing proportion of the growing mobility of its
labour – from less than 6 percent of the small numbers migrating for work at the close of
the 1970s to over 40 percent over the second half of the 1990s. This reckoning of course
excludes the movements of labour within China or within India. Much of the earlier
flows of migrant labour consisted of unskilled labour, mostly male, for construction who
were recruited to help build Hong Kong and Singapore, and later Kuala Lumpur and
Bangkok as modern metropolises. Towards the mid 1980s the demand for foreign labour
progressively shifted to female workers as native women in the rapidly industrializing
countries left housework to fill up vacancies in industry. Armies of Indonesian, Filipino,
and Sri Lankan female domestic helpers were brought in to take over child care and
house cleaning in Malaysia, Singapore and Hong Kong.
While the pace of industrialization and its consequences on conditions in the
labour market might suffice to explain some of these movements it is clear that factors
like ethnicity, geography, state policy have played a more important role in shaping this
migration system. The biggest destination countries appeared not to be the richest
countries like Japan, the Republic of Korea or Singapore, but middle-income countries
such as Malaysia and Thailand, and even a low-income country like India. In 1997 alone,
some 318,000 Indonesians registered with their Manpower Department to go and work
in Malaysia. It is difficult to say how many more went there clandestinely. In the last
amnesty programme in Thailand, the authorities reported over half a million Burmese
working in the country. The Thais themselves have been emigrating to work abroad. In
1999 some 115,000 Thai workers were recruited and left for Taiwan (China) and another
18,000 for Malaysia.
The period of the early 1990s saw significant changes in the regional labour
market as several economies became the production centres for trans-national companies
seeking more flexible sources of labour to mass produce semi-conductors and related
components. These industries typically required young workers able to work for long
hours performing tedious, repetitive operations. The first countries to host them like
Taiwan (China) and Malaysia were not the ones with abundant labour supplies but they
attracted the trans-national companies because of their well-developed infrastructure, and
more open policies to foreign investments. Labour shortages however, soon emerged as
more attractive opportunities were opened to native workers. To find workers to take
their place, host countries eventually opened up their doors to foreign labour.

5
Table 2. Intra-Asian Labour Migration : estimated number of non-national Asian
workers in selected countries, circa 2000
Country of
employment
Authorized +
(w/o work permit)
Stock estimate
000’s
Estimated
rate of
growth 4
p.a. %
Main countries of origin
India 1
(580)
Tibet, Nepal, Bangladesh, Sri Lanka, Afghanistan
Pakistan 2 (1,200) Afghanistan, Bangladesh, Myanmar
Malaysia 850 + (200) 1.5 5 Indonesia, Philippines, Thailand, Bangladesh
Thailand 103 + (562) Myanmar, Laos, Bangladesh, India
Singapore 590 + ( 17) 9.1 Indonesia, Malaysia, China, Philippines, Thailand
Brunei 80 Indonesia, Malaysia, Philippines
Hong Kong (China) 310 6.6 Philippines, Thailand
China 60 Hong Kong (China), Japan,
Taiwan (China) 380 + ( 3) 9.2 Thailand, Philippines, Indonesia
Japan 710 + (192) 4.5 Korea, China, Philippines, Thailand
Rep. of Korea 123 + (163) 8.0 China, Philippines
Australia 3 138 + ( 20) China, Vietnam, SE Asia, India
Notes:
1 India : We assumed that half of the estimated 1.2 million refugees have joined the work force
2 Pakistan : We assumed that half of the estimated 2.5 million refugees have joined the workforce. 3
Australia : Of the 242,000 permanent residents originating from Asia added between 1993 and 2000 we
used the average LFPR (57%) of all overseas-born Australians to derive the estimate. Authorities
estimated that some 28,000 non-citizens were unlawfully in Australia in the middle of 2000. We assumed
70 percent were engaged in one form of employment or another. 4 Estimated from most recent 5 year period.
5 Malaysia: Number of migrant workers actually grew rapidly from 1993 to 1998, but the financial crisis
led to severe decline.
The population of Asian workers employed in a country other than their own
within the region still represents a rather insignificant proportion of the aggregate work
force of the whole region. We estimate that around the beginning of the new century they
numbered about 6.2 million, probably a million more than the number of Asian workers
in the Middle East, and just slightly more than the total reported population of Asian
citizens (or Asian-born) living in western Europe and North America3. Table 2 above,
which puts together the available data from official sources in receiving countries
(except for India and Pakistan), shows that a large proportion (about 42 percent) of this
worker migration has taken place in Southeast Asia.
3 Of this figure a large proportion (some 1.78 million) comes from the estimated undocumented foreign
worker population in Pakistan and India. The rest can probably be treated with more confidence since they
come from official sources. For example, the Japanese, Koreans, and Australians have very good count of
foreigners who have overstayed their visas

6
What is more important to note however is the rather high growth rate of the
migrant worker population in each country even during a period that was marked by an
unprecedented financial crisis. As Table 2 shows, the foreign worker population from
other Asian countries proceeded to grow at a brisk pace throughout the second half of the
1990s. It was only in Malaysia where the financial crisis reversed the rapid growth which
saw the numbers of registered foreign workers more than double in five years from
532,000 in 1993 to 1.1 million in 1998.
The regional migration system is largely built on temporary foreign worker
policies since attitudes to immigration, especially of the unskilled, remain fairly closed.
No country in the region, except for Australia and New Zealand, considers itself open to
permanent immigration except to the highly qualified. Where official policy allows it, the
employment of unskilled foreign workers is usually based on one-year work permits
which however can be renewed. The immigration laws in both Japan and the Republic of
Korea do not allow the employment of unskilled foreign labour even for temporary
periods. Notwithstanding these limitations, the system has thrived because there is a
strong and growing demand for labour in some countries and there are labour surpluses
in others. In Japan and Korea the legal restriction on the admission and employment of
unskilled foreign labour has been ingeniously circumvented through the so-called
“foreign trainee” schemes. In addition, Japan encouraged and subsidized the return of
“Nisseis” or foreign nationals of Japanese descent, mostly the children or grandchildren
of those who settled in South America.
The lack of congruence between official policy and the demands of the labour
market on the one hand, and capacity of Government to implement policy on the other,
have led in some countries to a high incidence of clandestine migration and illegal
employment. One of the countries most vulnerable to illegal migration is Thailand which
has long land borders with Myanmar, Laos, and Cambodia. Rapid industrialization during
the 1980s and 1990s led to an exodus of labour away from low-wage sectors like fishing,
rice milling, garments, construction, and domestic services. Because the country’s laws
did not allow the admission and employment of unskilled foreign labour a market for
undocumented foreign labour quickly developed. It is hardly surprising that by the year
2000 there were nearly 5.5 undocumented for each registered foreign worker in Thailand.
The Republic of Korea exhausted its labour surpluses in agriculture at least a decade
earlier, but its national security concerns insured that its borders would not be penetrated
by clandestine migration. What breached the wall was its decision to follow Japan and
install a “foreign trainee system” in response to pressures from the Federation of Small
Business whose members were particularly affected by labour shortages. It did not take
much time before the trainee system led to swelling the ranks of undocumented foreign
workers since the latter earned better as “illegals” than as “trainees”.
In Asia the organization of migration was left largely in the hands of the
private sector. Labour agreements covering the supply of migrant labour and providing
for their protection have been the exception rather than the rule. The effectiveness of
attempts by sending states to impose more control over migration processes has been

7
greatly limited by the reluctance or unwillingness of receiving states to enter into
agreements which would reduce their ability to use migration as a source of flexibility of
their labour market. The few exceptions include the agreements between Malaysia and a
few Governments like Bangladesh for the supply of plantation labour. The steps taken by
the Philippine Government to unilaterally set minimum wage standards for its nationals
being recruited for different countries has led, in the face of competition among suppliers,
to unskilled Filipino workers being priced out of some markets like Taiwan and
Singapore.
Determinants of demand for migrant labour
What developments in the region have been behind the growth and character of
this migration system? There is no doubt that many factors have contributed to the
growth of labour migration in the region, but among them the only ones that lend
themselves easily to measurement are the economic and demographic changes in
countries of employment and countries of origin. These include measures of a country’s
overall economic performance, the existence of reserves of labour such as
underemployed workers in agriculture and women not participating in the labour force,
the relative levels and the growth of wages, a country’s openness as indicated by exports,
and the size of the foreign relative to the native workforce.
Table 3 Employment of migrant labour in 1990s and possible “pull” indicators
S. Arabia Kuwait Malaysia Japan Singapore Korea
1.GDP growth (1990-99) 1.6 5.0 7.3 1.3 8.0 5.7
2.LF growth (1990-98) 3.5 -2.9 3.5 0.9 2.0 2.3
3.Employment growth/
native LF growth
1.16 a 1.02 1.0 0.98
4.LF in agriculture % 20 2 21 5 0 11.0
5.LFPR of women (25-54
years)
23.3 56.6 50.2 66.5 64 56.6
6.Wage increase in
manufacturing (1999)
1990=100
183 129 201 153
7.Foreign LF/Total LF circa
1999
57 79 18.1 1.1 27.9 1.4
8.Foreign LF
change in stock (index)
1992=100
1999=108
1990=100
2000=138
1993=100
2000=150
1990=100
2000=237
1993=100
2000=306
1992=100
2000=707
9. growth % p.a. 1.1 3.0 6 b 9 17 27.8
Notes: a Based on change from 1980 to 1992.
b Foreign workforce in Malaysia actually rose faster from 532700 in 1993 to 1.4 million in 1997,
but declined after the financial crisis.
Sources: World Bank, World Development Indicators 2001
ILO, Key Indicators of the Labour Market 2001-2002
ADB, Key Indicators 2001, Asian Development Bank
8
Table 3 above brings together data on the growth of the foreign labour force in
selected major countries of destination of Asian migrant labour and growth of GDP
(1990-99), growth of employment vis a vis growth of the labour force, the participation
of women in the labour force, and growth of average wages in manufacturing. Since
temporary labour migration from Asia went very largely to only two regional destinations
- Asia itself and the Gulf States - we looked at representative countries from both
regions.
The growth in output greatly outpaced the growth of the labour force in all the
countries except Saudi Arabia. In Kuwait the 5 percent rate of expansion of the economy
took place in spite of the decline in the labour force. Singapore’s economy grew at a rate
four times faster than the growth of its work force suggesting important structural
changes that allowed a jump in labour productivity. The Malaysian and the Korean
economies grew at more than double the growth of their workforces.
The underlying structural changes in these economies are suggested by row 4.
It is clear that no more underemployed labour can be drawn from agriculture in Japan and
Kuwait, and from the city-state of Singapore. Whether or not agricultural labour
surpluses still exist in the Republic of Korea also appears questionable in spite of the
higher percentage reported employed in that sector.4 In Malaysia, large reported
shortages of labour in the plantation sector side by side with the still relatively large
proportion of labour (21 percent) in that sector suggest a lack of geographical mobility
from one rural to another rural area and unwillingness of native workers to work in
plantations which are in remote, sparsely-populated regions. Also, there seems to be
greater scope for increasing the labour force participation of women in Malaysia and
Korea, and certainly in Saudi Arabia and Kuwait.
The relative size of the population of foreign workers and its growth over time
is indicated by different measures in the last three rows. The two Gulf States continued to
rely heavily on foreign labour. Saudi Arabia had only 723,000 foreign workers in 1975 at
the start of the oil boom. By 1985 their number has climbed to 3.5 million, a huge
proportion of whom were Yemenis and construction workers from Pakistan, India, the
Philippines, Thailand, and the Republic of Korea. The worries about the presence of a
large foreign population led to the “Saudization policy” which was introduced in 1985.
Since then the number of foreign workers appears to have stabilized. In 1992 the foreign
workforce was reported to be lower at 3.03 million but it did grow slowly afterwards at
just over 1 percent a year. It is interesting to note the changing sex composition of the
foreign workforce as the share of women went up from 12 percent in 1992 to 33 percent
in 1999, reflecting the reduction in construction employment and the growth of domestic
services.
The foreign labour population is still insignificant in the case of Japan and the
Republic of Korea, but it is growing rapidly particularly in the latter. The fast ageing of
the Japanese national work force will sooner or later push the issue of opening to
immigration to the forefront of public debate. There are already questions regarding the
4 Between 1995 and 2000 the work force employed in agriculture in Korea actually declined by 47,000.
9
sustainability of its social security system as dependency ratios reach untenable levels. In
the case of Singapore it is interesting to note that in spite of many earlier policies aimed
at discouraging the employment of foreign labour, their share in the workforce has
actually reached an all time high of 28 percent.
The eight row shows an index with different base years due to unavailability of
data. The last row shows annual (compound) rates of growth to compare the more easily
the experience of the countries. It does appear that the employment of foreign workers is
correlated with the decadal average rate of economic growth as measured by GDP, as
well as with the growth of exports which is no doubt related to the latter. Where growth
was slower, the foreign worker population also grew slower as in Saudi Arabia
(compared to Kuwait), and in Japan (compared to Korea and Singapore). This
relationship would also have held for Malaysia where the growth rate of the foreign
workforce actually was approaching 15 percent a year before the financial crisis, but the
latter made the average for the whole period (1993-2000) lower.
It is odd that the growth of the total labour force (row 2) does not appear to be
correlated with the growth of the foreign labour force (row 9) in Saudi Arabia and
Kuwait which both rely heavily on the latter. In the case of Saudi Arabia the rapid growth
of the total labour force seems to be largely on account of the baby boom generation.
From 1996 to 1999 the population of Saudis belonging to ages 20 to 34 rose at a
compound rate of over 8 percent annually. In the case of Kuwait the reported decline of
the total workforce between 1990 and 1999 is difficult to explain.
The impact of foreign workers on average wages cannot be expected to be
significant in Japan or the Republic of Korea where they still represent a very tiny part of
the employment. Whether or not it was significant in the case of Malaysia and Singapore
would be interesting to examine. Our rough indicators show rapid rises in spite of the
high admissions of foreign labour in both countries. For example, in Malaysia, average
wages of labour in the private sector were rising annually at double digit levels for many
occupations until the financial crisis started to bite in 2000 (Azizah Kassim,2002).
However, what needs to be asked is how much higher would have been the growth had
there been no admission of foreign labour.
Emigration and the push factors
The four Asian countries shown in Table 4, namely the Philippines, India,
Indonesia and Bangladesh experience an estimated yearly outflow of about 1.8 million
migrant workers, or just about over one-seventh of one percent of their aggregate
population in 1998. There are however significant differences among the countries. The
Philippines experienced an emigration of 29 for every 100 workers it added yearly to its
labour force, whereas only one for every 17 new workers in India got to go outside the
country for employment. The rate of emigration from Indonesia has also grown
significantly over the years, followed far behind by the Bangladeshis.

10
Why is it more likely for Filipinos and Indonesians to work abroad than for
Indians and Bangladeshis? Income differentials with countries of destination seem to be a
poor predictor of the rate of labour emigration as would be apparent from a comparison
of the countries’ per capita incomes (GNI) expressed in purchasing power parity. The
Philippines and Indonesia have higher incomes per capita than India or Bangladesh but
both also have higher emigration rates. However, this would be consistent with the
general assumption in the migration literature that emigration propensities are low at very
low levels of income. They rise as incomes rise because migration requires resources,
information, and larger economic transactions between the origin and the destination
countries. It is of course possible that the very aggregated data hide more than they
reveal about the real relationships. At a lower than national-level of aggregation an
inverse relation between income and emigration rate may still hold, but there are
unfortunately no statistics to trace the emigration rate by level of income within each
country.
The seventh row in Table 4 shows the growth rates of per capita income – first,
over the long period from 1965 to 1999, and then for the period 1995 to 1998. A
comparison of the latter with the rate of labour emigration suggests that the expectation
of an inverse relation is justified. More slowly improving incomes at home were
associated with higher rates of labour emigration, while faster growth meant lower rates
of emigration. However, the longer history of income improvements shown in the 1965
to 1999 averages do not give any such indication. Indeed, in Bangladesh the rate of
emigration has been rising continuously over the years, apparently unaffected by
fluctuations in incomes. How population growth contributes to propensities to emigrate in
an agricultural country is not very clear.
Table 4 Major countries of emigration and possible “push” indicators
Philippines India Indonesia Bangladesh
1.Labour outflow/LF a 1995-2000 0.29 0.06 0.22 0.13
2. LF growth rate (1980-99) 2.6 2.0 2.8 2.6
3.Growth of N in industry 1990
1999
2.2
2.8
6.33
6.75
7.7
11.5
7
4.1
4. % Employed in agriculture 1996-98 47 63 (1980) 41 54
5. Per capita GNI (PPP) US$ 3,990 2,230 2,660 1,530
6.GDP p.c.ave.growth p.a. 1965-99
1995-98
0.9
0.4
2.4
3.4
4.8
- 2
1.3
2.8
7.Exports of goods & services per capita US$ 492 48.4 269 47
8. Exports as % of GDP 1980
1998
24
56
6
12
34
28
4
14
9.Telephone mainlines per 1000 pop 37 22 27 30

11
Notes: a
The cumulative emigration flow over 1995 to 2000 divided by the additional workers who joined
the labour force over the same period.
Sources: World Bank, World Development Indicators 2001
ILO, Key Indicators of the Labour Market 2001-2002
ADB, Key Indicators 2001, Asian Development Bank
Growth of industrial employment outpaced the growth of the labour force in
the four countries, impressively in the case of India and Indonesia, but only marginally in
the case of the Philippines. In both India and Indonesia, employment in the industry
sector rose two to four times faster than the long-term average growth rate of the labour
force. These four countries however started out with huge labour resources, a large
proportion of whom, especially in India and Bangladesh, were still employed in
agriculture. Real wages had not risen by any significant degree in agriculture and this
dampened any wage pressures that might have been generated by greater absorption in
industry.
Is the rate of emigration a function of a country’s integration through trade
with the global economy? This is a big question which we cannot hope to properly
address here. However some rough indicators appear to support this common perception.
The last four rows of Table 4 show indicators of the outward orientation of the countries
through exports of goods and services. Exports accounted for a very small share of the
output of the two South Asian economies which also had small emigration rates, unlike
the two Southeast Asian economies which were considerably more outward oriented. The
period did see the countries, except for Indonesia, considerably increase the share of
exports in their outputs from 1980 on. The differences were large nevertheless. the
Philippines, which had the highest emigration rate, exported on a per capita basis more
than ten times the value of goods and services exported by India or Bangladesh, and
slightly less than double that of Indonesia.
B. Skill Dimension of Asian Migration
Contemporary labour migration in Asia has a bottom-heavy structure
dominated by the movement of workers in blue-collar occupations. Since the mid 1970s
most of the workers who left their countries in South Asia and in Southeast Asia for work
outside their countries were recruited to perform jobs in construction, small factories,
domestic services, and agriculture. Only a thin layer of managers, professionals and
technicians, mostly employed by trans-national corporations, topped the migration flows
within and out of the region. The structure reflected the more rapid expansion of labour-
intensive sectors like manufacturing and construction in the rapidly industrializing
economies of the region, as well as the social changes transpiring in these societies. The
unmet demand for labour in the early stages of industrialization were for construction
workers, assembly-line production workers, and replacement female workers who can
liberate native women to pursue formal sector employment. It was only in the 1990s
when global competition in the development of computer software and IT equipments

12
intensified that the demand for migrant labour progressively began to show a more varied
technical composition.
Unlike the movement of the unskilled which was largely from the less to the
more developed countries, the flow of the highly-skilled moved in all directions – from
the less to the more developed and vice versa, among the less developed, and of course
among the developed. According to Iguchi (2001) there were some 2.6 million reported
business travellers from Japan in 2000 of whom 1.6 million went to Asian destinations
notably China, Taiwan (China), and Thailand and Singapore. These statistics (although
they include repeat travel by some persons) already give a rough indication of the
dimension of “circulation” of managers and technical people from the more developed to
the less developed regions generated by investments and trade. Unfortunately similar
statistics re not regularly reported out by the other countries to give a more
comprehensive picture of overall flows within the region.
We have assembled in Table 5 available information on registered stocks and
flows of highly-skilled foreigners in countries of Asia and the Pacific. These represent
foreign workers who have been admitted for purposes of employment which means that
Table 5 Immigration to Asia Pacific of the highly-skilled, 2000
Destination
country
flows stocks Principal Countries of origin
Australia
44,730
UK (23%),USA (10%), Japan (6%),China (4%)
China 220,000
Indonesia 22,800 Japan (15%), Australia (10%), Korea( 8%), Philippines ( 6%),
Thailand (5%)
Rep.of Korea 34,700 17,700 US, Canada, Japan, UK
Malaysia
31,949 Japan (17%), India (17%), Singapore (9%), China (7%),
Taiwan (4%), Philippines ( 4%)
Singapore 110,500
Thailand 44,100 OECD (72%) of which Japan (30&)
Other sources: Taiwan, China, India, Philippines
Vietnam 30,000 Hong Kong, Taiwan, Korea, Singapore, Thailand
they intended to stay for at least a year. 5 The statistics shown in the third column were
highly-skilled foreigners from all countries who had been granted a visa or permit that
5 The dimensions and character of the movement of the highly-skilled for purposes of work is extremely
difficult to monitor and assess because many countries in the region offer visa-free admission for short-
term periods to nationals of the developed countries and to nationals of partner-countries in regional
economic groupings. For example, among the ASEAN countries there has been a long-standing agreement
for visa-free admission if the purpose of entry is short-term stay such as tourism or business. In practice,
the recording of foreigners who enter a country for purposes of work usually only starts when their stay is
expected to go beyond the usual visa-free period of two weeks to one month

13
entitled them to work or to get employed. Generally one observes that, except for
Singapore where they represented about 5 percent of the work force, the highly skilled
foreign workers did not have a big presence in any of the other countries. One must
however be careful in drawing conclusions from these statistics since the numbers may
not fully reflect their importance to these economies. The 220,000 reported for China
accompanied the direct foreign investments which was crucial to the rapid modernization
of its infrastructure and industry, and sterling economic performance over the past two
decades. On the other hand, in the Republic of Korea they were mainly engaged in
teaching languages and in entertainment (a wide category which may include
prostitution).
The movement of the highly-skilled into the countries of the region is clearly
related to the flows of foreign direct investments. State policies provide especially for the
liberal admission of managers and technical personnel needed to facilitate the
establishment of subsidiaries or branches of transnational corporations. Singapore has a
relatively huge share of the population of highly-skilled immigrants in the region, no
doubt due to her position as the hub of operations of many transnational companies and
as a transport and trading centre of the region. The numbers in China and in Vietnam are
not very large relative to the size of their respective economies but are nonetheless
impressive when one considers their history.
The emergence of Asia as the dominant origin of immigrants to North America
and Australia is well documented, and the recent competition for Indian IT workers
highlights the importance of Asia as a source of highly trained and educated migrant
workers. In 1999 in Australia Asian-born immigrants numbered 868,900 or 19.4 percent
of all foreign born in Australia. In Canada in 1996, some 1,081,000 or 21.8 percent of all
foreign-born were born in Asia. In the European member states of OECD, there were a
total of 1,242,000 Asian nationals reported in 1990. But more significant is the fact that
Asians represented a large proportion of the immigration of the highly-skilled especially
to the United States, Canada, and Australia. In the United States Martin (2001) reported
that in FY98 Asians were one-third of US immigrants, but half of those who received
employment-based immigration visas. According to the US State Department, close to
69 percent of all who were granted this employer-sponsored visas (H-1B) to the USA
from the beginning of 1990 to the end of 1997 came from only four countries from Asia.
In Britain, some 18,257 foreign IT professionals were admitted in 2000 of whom 11,474
came from India (Khadria,2001).
Table 6: USA H-1B Visas issued
To Asians 1990-1997
Number
Share %
Total all countries 275,278 100.0
From:
China 12,367 4.5
India 97,675 35.5

14
Japan 23,504 8.5
Philippines 55,734 20.2
Sub-total 189,280 68.7
Source : US Department of State
The flows of the highly-skilled can be assessed not only from the numbers
passing through this “employment gate”, but also those passing through the “academic
gate” which today number some half a million foreigners on “student visas” and another
300,000 on cultural “exchange visitors” visas (J1). During the 1990s Asians dominated
the foreign student admissions to US colleges and universities, with some 55,000 students
from China and 46,000 from Korea reported in 1998. A considerable percentage of
foreign students tend to enter the labour market during their stay, and many eventually
change status to become permanent residents. Those who graduate with Ph.Ds are
especially likely to stay and teach in the US. According to the National Science
Foundation, there were 23,559 science and engineering faculty members of Asian origin
in the US in 1997, accounting for over half of all foreign and for 10.5 percent of the total
number of academics, foreign and native, in these fields.6
As mentioned at the beginning of this section the migration flows within Asia
and to regions other than the immigration countries of North America and Australia
consisted largely of people recruited to perform blue-collar work. What we know about
these flows of migrant workers come from registrations of work contracts, mostly for
short-periods of employment, that the states of origin require. Technical and skilled
workers represented a tiny proportion of the flows from Bangladesh, Pakistan, Sri Lanka,
and Thailand, but much larger in the Philippines. In the case of India it is difficult to say
how large is the share of the highly-skilled since the data come from registrations which
are limited to those with lower level educational attainment. In India, the law does not
require college graduates (and those who have previously worked abroad) to submit their
contracts to the Protector of Emigrants for approval prior to accepting employment
abroad. Looking at changes over time one notes that the flow seemed to have become
slightly less-skilled in the case of Pakistan, Sri Lanka, and Bangladesh, did not change in
Thailand, but improved in the Philippines.7 The Table 7 below gives a flavour of these
differences.
There is little sign that the emigration of the highly-skilled has caused concern
over “brain drain” or emigration’s impact on development in the countries of the region.
This may be partly due to the existence of large numbers of unemployed educated youth
in many countries from Pakistan in the west to Indonesia in the east. It is also probably
due to the observation that prospects of working abroad has increased the expected
returns to additional years of education and induced many to invest in more schooling,
especially in occupations in high demand overseas. Thus, one observes the phenomenon
of demand creating its own supply. In India, the number of graduates in IT technology
6 See National Science Foundation, Science and Engineering Indicators 2000, vols. 1& 2.
7 One should note that the category “professionals” in the case of the Philippines includes many artists and
entertainers.

15
has greatly expanded over the past five years. According to Khadria India already
produces about 70,000 to 85,000 software engineers, and about 45,000 other IT
graduates, but the Indian Institutes of technology are still under pressure to increase their
intake of students. In the Philippines a very significant shift in enrolment in favour of
engineering and information technologies education has also been observed. It already
has a large nursing education infrastructure because of the demand for nursing education,
clearly stimulated by expected salaries abroad and not at home.
Are temporary migration policies here to stay?
Labour migration has been viewed, both in countries of origin and destination,
as a temporary phenomenon that would one day wind down when the need for it declines.
This presumably would come when economic structures complete their adjustment to
conditions in the labour market. Today no country in Asia considers itself open to
permanent settlement by immigrants, a right granted by law or constitution only to
immediate family members of their own nationals who marry foreigners or have children
with them. In Japan and the Republic of Korea doors are shut not only to permanent
immigration, but also to the admission for employment of unskilled foreign labour.
Explicit policies allowing the temporary admission and employment of the latter however
do exist in Malaysia, Singapore, Taiwan (China), Hong Kong (China), Brunei
Darussalam, and Australia. Thailand is currently confronted with a huge problem with
undocumented foreign labour and is still debating whether or not to adopt a law providing
for their documentation and employment.
The admission of unskilled foreign labour has been envisaged purely as a
means to deal with imbalances in the labour market which are expected to be transitory.
Labour immigration policies in Singapore and Malaysia even feature a “foreign workers
levy”, a head tax charged the employer of foreign workers to serve as a disincentive by
making it more expensive to employ the latter relative to native workers. Work permits
are usually not for longer than one year although they are renewable. Work permits are
tied to specific employers to whom they are granted, precluding the mobility of the
foreign worker in the local labour market. In all the Asian states and territories the
entitlement to family reunification is granted only to those who earn above a certain
minimum threshold salary, effectively excluding the possibility to all unskilled labour.
The whole panoply of labour immigration regulations have been designed to add to
greater flexibilization of the labour market and to minimize the possibility of settlement
by foreigners not possessing the right qualifications.
There are so far no signs indicating that temporary foreign policies will be
abandoned as they have been, for example, in Western Europe during the recession in the
second half of the 1970s. The Asian financial crisis, which turned out to be an economic
crisis of major proportions, did lead to the forced return of thousands of migrant workers
particularly from Malaysia, Korea, and Thailand but this was merely a temporary
adjustment. Policies were not changed but in some countries merely suspended. Flows of
foreign labour from Southeast Asia to the Republic of Korea, Japan, Hong Kong,
Singapore, and Taiwan (China) dipped slightly in 1997 and 1998 but they quickly

16
recovered thereafter. As shown in Table 2 there was in fact a substantial increase in the
population of migrant workers in all the countries from the beginning of the 1990s to
2000.
Table 7 SKILL MIX or OCCUPATIONAL CLASSIFICATION SELECTED COUNTRIES Based on Flow Data PHILIPPINES SRI LANKA 1980 1987 1998 1992 1997 Professionals 15.5% 27.6% 25.3% High level 1% 0.4%
Administrative 0.5 0.4 0.1 Middle level 5 3.4
Clerical 3.4 3.6 1.3 Skilled 18 16.4
Sales 0.3 1.0 1.1 Unskilled 8 13.6
Service 14.9 33.7 27.7 Housemaid 68 66.2
Agriculture 1.0 0.6 0.1 source: SMC Atlas
Production 64.4 33.2 34.3
Others - 0.1 0.6
source: POEA PAKISTAN
1990 1996
Professional 9.5% 7.1%
BANGLADESH Service 21.3 19.7
1977-86 1998 Production 63.2 60.0
Professionals & Semi Prof 6.5% 3.5% Others 6.0 13.2
Skilled 34.7 27.9 source: SMC Atlas
Semi Skilled 7.8 19.2 Unskilled 51.0 49.2 source: SMC Atlas
INDIA 1985
Professionals 5.20%
Skilled/semi skilled 47.0
Unskilled 40.1
Service -
Other 7.7
Source: 1985 column, country studies
compiled in Tan (1987)
THAILAND
1981 by educational level:* 1999 2000 Professionals -
Skilled/semi skilled 40.5% Below college degree 98% 97.80%
Unskilled 21.50 College degree 1.9 2.1
Service - Others 0.1 0.1
Other 38.00
by occupation:*
Academic/professional 2.0 2.2
Management/administration 1.3 1.2
Commerce 6.7 8.5
Others 90.0 88.1
Source: 1981 column, country studies compiled in Tan 1987; 1999 column, Department of Employment

17

18
Annex Table : Employment of highly-skilled foreign workers in Asia/Pacific
Destination
country
Immigration programme/
categories
Recorded stocks and
flows
Principal Countries of
origin
Occupations or
industries of
employment
Australia Skill-based programme
most under temporary business
visa category
Flow (2000) 44,730
UK = 23%
USA = 10
Japan = 6
China = 4
Academic
Mangers
Medical practitioners
Trade & related workers
China Foreign investments
Stock (2000) 220,000
Indonesia Highly-skilled categories Flow (1997) 22,800 Japan = 15%
Australia = 10
Korea = 8
Philippines = 6
Thailand = 5
Professionals, managers,
supervisors,
Rep.of Korea Professional/Skilled categories Stock (2000) 17,700
Flow (2000) 34,700
US, Canada, Japan
UK
Language teaching
Entertainers
Malaysia Expatriates Stock (2001) 31,949
=3.8 % of total
documented labour
immigrants
Asia/Pacific= 73%
Japan = 17
India = 17
Singapore = 9
PRChina = 7
Taiwan = 4
Philippines = 4
46% in manufacturing
Philippines
Singapore Highly-skilled
Employment pass holders; they
may qualify to become
permanent residents
Stock (2000) 110,500
103,500 in technician
and professional jobs
Thailand Alien employment permits
issued as part of
investment promotion
Flow (2000) 44,100
OECD = 72%
Japan =30
Taiwan
China
India
Philippines
professionals and
administrators
Vietnam Foreign investments and ODA Stock (2000) 30,000 Hong Kong (China)
Taiwan (China)
R. of Korea
Singapore
Thailand