Embed Size (px)
Citation preview

Extracted from:
Complex Network Analysis in PythonRecognize → Construct → Visualize → Analyze → Interpret
This PDF file contains pages extracted from Complex Network Analysis in Python,published by the Pragmatic Bookshelf. For more information or to purchase a
paperback or PDF copy, please visit http://www.pragprog.com.
Note: This extract contains some colored text (particularly in code listing). Thisis available only in online versions of the books. The printed versions are blackand white. Pagination might vary between the online and printed versions; the
content is otherwise identical.
Copyright © 2018 The Pragmatic Programmers, LLC.
All rights reserved.
No part of this publication may be reproduced, stored in a retrieval system, or transmitted,in any form, or by any means, electronic, mechanical, photocopying, recording, or otherwise,
without the prior consent of the publisher.
The Pragmatic BookshelfRaleigh, North Carolina


Complex Network Analysis in PythonRecognize → Construct → Visualize → Analyze → Interpret
Dmitry Zinoviev
The Pragmatic BookshelfRaleigh, North Carolina

Many of the designations used by manufacturers and sellers to distinguish their productsare claimed as trademarks. Where those designations appear in this book, and The PragmaticProgrammers, LLC was aware of a trademark claim, the designations have been printed ininitial capital letters or in all capitals. The Pragmatic Starter Kit, The Pragmatic Programmer,Pragmatic Programming, Pragmatic Bookshelf, PragProg and the linking g device are trade-marks of The Pragmatic Programmers, LLC.
Every precaution was taken in the preparation of this book. However, the publisher assumesno responsibility for errors or omissions, or for damages that may result from the use ofinformation (including program listings) contained herein.
Our Pragmatic books, screencasts, and audio books can help you and your team createbetter software and have more fun. Visit us at https://pragprog.com.
The team that produced this book includes:
Publisher: Andy HuntVP of Operations: Janet FurlowManaging Editor: Brian MacDonaldSupervising Editor: Jacquelyn CarterDevelopment Editor: Adaobi Obi TultonIndexing: Potomac Indexing, LLCCopy Editor: Nicole AbramowitzLayout: Gilson Graphics
For sales, volume licensing, and support, please contact [email protected].
For international rights, please contact [email protected].
Copyright © 2018 The Pragmatic Programmers, LLC.All rights reserved.
No part of this publication may be reproduced, stored in a retrieval system, or transmitted,in any form, or by any means, electronic, mechanical, photocopying, recording, or otherwise,without the prior consent of the publisher.
Printed in the United States of America.ISBN-13: 978-1-68050-269-5Encoded using the finest acid-free high-entropy binary digits.Book version: P1.0—January 2018

To my beautiful and most intelligent wife,Anna, and to our children: graceful ballerina,
Eugenia, and romantic gamer, Roman.
Explore the NetworkNetwork exploration in Gephi goes hand in hand with selecting visual properties.Let’s paint and resize the graph nodes based on some of their measures.
You will learn about network measures in Chapter 8, Measuring Networks,on page ? and Chapter 11, Unearthing the Network Structure, on page ?.For now, it suffices to know several basic facts about two of them, as detailedin the following table:
MeaningMeasure
The number of immediate neighbors—adjacent nodes. Thedegree is a non-negative integer number. The larger the
Degree
degree of a food item is, the more nutrients it provides.The larger the degree of a nutrient is, the more food itemsprovide it.
Nodes form tightly knit groups called communities. Allfoods and nutrients within a community serve some com-
Communitystructure
mon purpose. Each community has a unique integeridentifier called modularity class.
Node degree is the simplest possible node measure. There is no need to cal-culate it explicitly. To make node size proportional to the degree, click theicon with concentric circles in the Appearance window, then on the Rankingbutton. Select Degree from the “—Choose an attribute” pull-down menu.Select node sizes that correspond to the smallest and largest degrees (10 and40 are good choices). And don’t forget to click Apply. Can you see which nodeshave the highest degrees?
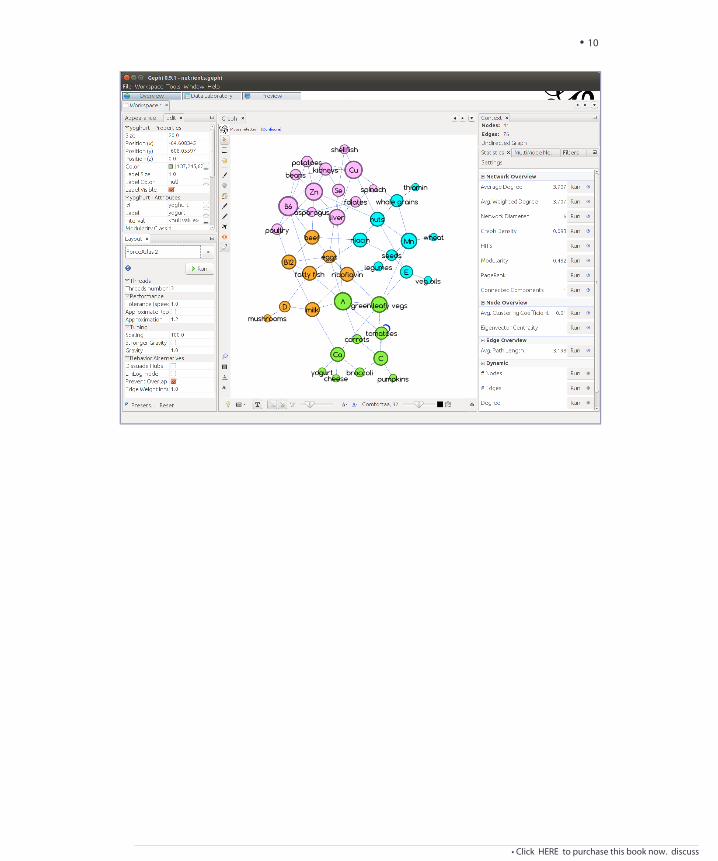
Playing with size is fun; playing with color is more fun. Let’s paint the nodesaccording to their modularity classes, as I’ve done in the figure on page 8.To partition a network into communities, click the Run button next to theModularity command in the Network Overview section of the Statistics window.Proceed by clicking OK and Close in the next two dialogs. In the end, you willsee a floating-point number next to Modularity. The number is a measure ofthe quality of the decomposition from Outline Modularity-Based Communities,on page ?. Return to the artist’s palette icon, then click the Partition button.Select Modularity Class from the “—Choose an attribute” pull-down menu.Don’t forget to click Apply. If you feel artistic, like me, play with the nodecolors. Painting the beef group pink and the vegetable group green is a no-brainer, but can you choose a good color for the vitamins?
• Click HERE to purchase this book now. discuss

If you plan to use Gephi for more sophisticated CNA jobs, the table on page 9will help you find which sections of this book match the items in the Statisticswindow.
Sketch the NetworkYou’re done with rough rendering, but the layout is still awful. Let’s turnour attention to the lower-left corner of Gephi. Select your favorite layout fromthe “Choose a layout” pull-down menu. When a network is large (500 or morenodes), the Fruchterman-Reingold layout is usually the most efficient. Forsmaller networks, the ForceAtlas 2 layout, with some tweaking, works mar-vels. To make things easier, here’s a tip: set the scaling to 100.0 (to placenodes reasonably far apart) and check the Prevent Overlap box. Run the toolfor a while. You’ll notice that after a couple of seconds, the nodes settle attheir new positions, but the graph as a whole may continue drifting, rotating,or both.
The last step is to adjust the labels, because surely some of them don’t mindtheir manners and sit on top of each other. Select Label Adjust from the“Choose a layout” pull-down menu and run the tool for a couple of seconds.This layout engine distorts the original Fruchterman-Reingold but makes
• 8
• Click HERE to purchase this book now. discuss

NetworkX referenceMeasure
Degree Centrality, on page ?Average Degree
Think in Terms of Paths, on page ?Network Diameter
Betweenness Centrality, on page ?↑ Also calculates betweennesscentrality
Closeness and Harmonic Closeness Central-ity, on page ?
↑ Also calculates closenesscentrality
Networks as Circles, on page ?↑ Also calculates eccentricity
Start with Global Measures, on page ?Graph Density
HITS Hubs and Authorities, on page ?HITS (Hubs and Authorities)
Outline Modularity-Based Communities, onpage ?
Modularity
PageRank, on page ?PageRank
Split Networks into Connected Components,on page ?
Connected Components
Explore Neighborhoods, on page ?Avg. Clustering Coefficient
Eigenvector Centrality, on page ?Eigenvector Centrality
Think in Terms of Paths, on page ?Avg. Path Length
sure that neither nodes nor labels overlap. Hopefully, your network layoutresembles the following figure.
• Click HERE to purchase this book now. discuss
Sketch the Network • 9
• 10
• Click HERE to purchase this book now. discuss

The Graph window still shows a sketch, but this is a high-quality sketchthat nicely displays the structure of the network of foods and nutrients.There are five compact groups in the network that could be tentatively calledVeggies, Cereals, Meats, Proteins, and Folates. You can explore each group’sinternal composition, as well as connections to the other groups. You caneven show this sketch to your boss or customer. But it would look muchbetter when rendered at high resolution and converted to a presentation-quality image. (Save the project via File > Save As… into a .gephi file to avoiddata loss if Gephi crashes!)
• Click HERE to purchase this book now. discuss
Sketch the Network • 11