Embed Size (px)
Citation preview

UNIVERSITY OF PIRAEUS
SCHOOL OF INFORMATION AND COMMUNICATION TECHNOLOGIES
DEPARTMENT OF DIGITAL SYSTEMS
MSc. IN BIG DATA & ANALYTICS
MSc DIPLOMA THESIS
COMPLEX EVENT PROCESSING FOR REAL-TIME EVENTS
IDENTIFICATION
Author: Chrysostomos Symvoulidis, ME 1615
Academic supervisor: Prof. Dimosthenis Kyriazis
Piraeus
September 2018

2

3
Acknowledgements
First of all, I would like to express my sincere gratitude to Prof. Dimosthenis Kyriazis, my
academic supervisor, who provided me with his feedback and support throughout this thesis
project.
Next, I would like to thank my family and friends for their support, during this Master of
Science.

4

5

6
TABLE OF CONTENTS
ABSTRACT 12
KEYWORDS 12
CHAPTER 1 – INTRODUCTION 14
1.1. PROBLEM 14
1.2. PURPOSE – GOALS 14
1.3. OUTLINE – STRUCTURE OF THE THESIS 15
CHAPTER 2 – THEORETICAL BACKGROUND 16
2.1. CONTEXT AND CONTEXT-AWARE APPLICATIONS 16
2.1.1. Context and Context Awareness 16
2.1.1.1. What is Context? 16
2.1.1.2. Previous Definitions of Context 17
2.1.1.3. What is Context-Awareness? 17
2.1.1.4. Previous Definitions of Context-Aware 18
2.1.2. Context-aware applications 18
2.2. RULE ENGINES 19
2.2.1. Deterministic inference engines 20
2.2.2. Backward chaining inference engines 20
2.2.3. Forward chaining inference engines 21
2.3. COMPLEX EVENT PROCESSING 22
2.3.1. Overview 22
2.3.2. Architecture 24
2.3.3. Events in Complex Event Processing engines 25
2.3.4. Event Processing Languages 25
2.3.4.1. RAPIDE-EPL 26
2.3.4.2. SASE+ 26
2.3.4.3. CAYUGA EVENT LANGUAGE (CEL) 26
2.3.5. Related Work 27
2.3.5.1. Drools Fusion 27
2.3.5.2. Apache Flink 31
2.3.5.3. Esper 32

7
2.3.5.4. Apache Spark 33
2.3.5.5. Apache Storm 33
2.4. SYSTEM MONITORING 34
2.4.1. Monitoring Solutions 35
2.4.1.1. Prometheus 35
2.4.1.2. Netdata 36
CHAPTER 3 – OVERALL ARCHITECTURE 38
3.1 DATA COLLECTION 39
3.1.1. Prometheus 39
3.1.2. Netdata 41
3.1.3. Real-time collection 43
3.2. COMPLEX EVENT PROCESSING WITH DROOLS FUSION 45
3.2.1. Rules 45
3.2.2. Dynamic CEP 46
3.2.2.1. Interval change of rules 47
3.2.2.2. Using a listener to notify the engine for potential changes in the rules file 47
3.3. APPLICATION IN 5G INFRASTRUCTURES 47
3.3.1. A short introduction to 5G 47
3.3.2. Complex Event Processing in 5G infrastructures 48
CHAPTER 4 – EXPERIMENTAL EVALUATION 51
4.1. CPU BENCHMARKS 51
4.2. FILE IO BENCHMARKS 52
4.3. MORE THAN ONE TESTS AT ONCE 53
4.3. LOW USAGE OF VM 54
CHAPTER 5 – CONCLUSIONS 56
5.1. CONCLUSIONS 56
5.2. FUTURE WORK 56
REFERENCES 58
8
LIST OF FIGURES
FIGURE 1: BACKWARD CHAINING INFERENCE ENGINE, DROOLS DOCUMENTATION 21
FIGURE 2: FORWARD CHAINING INFERENCE ENGINE, DROOLS DOCUMENTATION 22
FIGURE 3: COMPLEX EVENT FORMULATION 24
FIGURE 4: PROMETHEUS OVERALL ARCHITECTURE 36
FIGURE 5: NETDATA DEMO 37
FIGURE 6: OVERALL ARCHITECTURE 39
FIGURE 7: PROMETHEUS GUI 41
FIGURE 8: NETDATA GUI 42
FIGURE 9: MATILDA ORCHESTRATOR 50
FIGURE 10: CPU BENCHMARK 1 ALERTS 52
FIGURE 11: FILE IO BENCHMARK ALERTS 53
FIGURE 12: THIRD BENCHMARK ALERTS FIRED 53
FIGURE 13: GRAPHICAL REPRESENTATION OF CPU UTILIZATION IN PROMETHEUS 54
FIGURE 14: MEMORY UTILIZATION GRAPH 54
FIGURE 15: LOW CPU, MEMORY AND DISK UTILIZATION ALERTS 55
9
LIST OF SNIPPETS
SNIPPET 1: RAPIDE-EPL EXAMPLE [GARCIA, 2012] 26
SNIPPET 2: CAYUGA CEP LANGUAGE SAMPLE [CAYUGA] 27
SNIPPET 3: SAMPLE DROOLS FUSION RULE 28
SNIPPET 4: ESPER EPL SAMPLE QUERY 33
SNIPPET 5: PROMETHEUS MONITORED DATA 40
SNIPPET 6: NETDATA JSON 43
SNIPPET 7: JAVA OBJECT 44

10
LIST OF TABLES
TABLE 1: DROOLS FUSION TEMPORAL REASONING OPERATORS .............................................. 31

11

12
Abstract
Complex Event Processing is a very broad scientific area with application in many
sections like business process automation, network monitoring, abnormal use of computing
resources detection, etc. The purpose of this master thesis is to design and develop a
Complex Event Processing solution for monitoring applications, virtual machines and
containers, in order to warn the orchestrator of such infrastructures for abnormal use of
computing resources through alerts and suggestions of act. The developed Complex Event
Processing engine is based on Drools Fusion, a module of Drools that is intended to execute
CEP processes. A dynamic CEP engine has been created, in order to make it more flexible and
interactive, letting the user to alter the rules at real-time.
Keywords
Complex Event Processing (CEP); Stream processing; Anomaly detection; Event
identification; Context Awareness;

13
14
Chapter 1 – Introduction
1.1. Problem
In computing clouds and new communication networks, like 5G, numerous problems
issues regarding the orchestration of their computing resources exist. For that reason, an
engine that can, not only recognize possible factors that affect the use of these resources, but
to come up with solutions when needed, is required. The decisions have to be in real-time,
thus a technology that can handle large stream of information is needed. Hence, Complex
Event Processing is chosen.
Complex Event Processing (CEP) is a method used primarily for the analyzation and
process of streams of information, in order to identify events [Luckham, 2012]. CEP is a
technique that combines data gathered from multiple sources and infer complex patterns
that suggest more complicated situations. The purpose of Complex Event Processing is to
identify such complex, yet meaningful events and act accordingly.
1.2. Purpose – Goals
The main purpose of this thesis is to explore the capabilities of Complex Event
Processing techniques for the identification of abnormal usage of virtual machines and its
application components, in order to facilitate on the decision-making of orchestrating
environments, like a Computing cloud, or a computing infrastructure in general. These
anomalies regard numerous factors that comprise a system, including the CPU utilization,
memory utilization, receiving and sending packets through the network, etc.
Complex Event Processing is a technology that is based on rules. Most of the engines
that exist have certain limitations regarding their dynamicity on real-time modification of
the rules without having to restart the engine. For that reason, this thesis aims at giving
dynamic capabilities in the engine, making it more interactive with the user and more
adjustable when needed.

15
1.3. Outline – Structure of the Thesis
This rest of this thesis is organized as follows:
• Chapter 2 is dedicated at providing the theoretical background on the terms
of Context Awareness Engines and Complex Event Processing.
• On Chapter 3 an overall architectural description of the developed engine is
given, focusing on the way the monitoring of the machines is done and how
the Complex Event Processing engine is organized.
• On Chapter 4 the developed engine is put under an experimental evaluation
and the results are presented in detail.
• Finally, Chapter 5 is devoted on the conclusions of this Master thesis,
summarizing the work and providing ideas on how to extend the current work.

16
Chapter 2 – Theoretical Background
This chapter describes the basic principles of Context Awareness Engines, as well as
Complex Event Processing (CEP) and Stream Processing in general. Also, part of this chapter
is dedicated to the related work found in the CEP research area. This chapter covers the state
of the art on this academic field providing a complete picture of what is in fact Complex Event
Processing and where and why it is used.
2.1. Context and Context-aware applications
This chapter will present in detail the terms of context and context-awareness and
how these terms relate to Complex Event Processing, which will be discussed furtherly in the
next sections.
2.1.1. Context and Context Awareness
2.1.1.1. What is Context?
The need for more personalized interactive applications and services led us in the use
of context-aware systems that can provide, and exploit user information, also referred as
context. But, in order to fully understand these terms and how to use context properly, we
should appose the following definitions. Abowd and Dew [Dey, 1999A] refer to context as:
“any information that can be used to characterize the situation of an entity. An entity is a
person, place, or object that is considered relevant to the interaction between a user and an
application, including the user and applications themselves.”
The use of context is significant in many applications and services in a wide range of
different fields. From gathering insight and personalized information for the users of mobile
devices, to mechanisms made to ease the development of mobile applications.

17
The above definition is overall the most accepted, but in order to get fully compliant
with the term and the use of context in today’s applications, in the next sub-chapter there
will be a historic review of the previous definitions of context and the context-aware
applications.
2.1.1.2. Previous Definitions of Context
Starting from 1994, Schilit and Theimer on their work [Schilit, 1994] introduced the
term “context-aware” and referred to context as the location of nearby people and objects
and any potential changes, either location-wise or object-wise. In a similar manner Brown et
al. [Brown, 1994] defined context as location too, the individual people around the user,
current temperature, etc. Ryan, Pascoe et al. on their work [Ryan, 1998] defined context as
the user’s location, identity and time.
But these definitions were not the only ones that were given. Others have defined
context in a different way. Brown [Brown, 1996A] defined context as the elements of the
user’s environment or the situation he/she is currently in that the computer is aware of.
Franklin et al. [Franklin, 1998] on the other side identify context as the current situation of
the user. Ward et al. [Ward, 1997] see context as the condition of the computers
environment, where Rodden et al. [Rodden, 1998] define it to be the application’s setting.
Finally, Hull et al. [Hull, 1997] defined context as the whole environment including aspects
of the current situation.
2.1.1.3. What is Context-Awareness?
Schilit and Theimer [Schilit, 1994] in their work also defined the term of context-
aware application as a system that:
“adapts according to its location of use, the collection of nearby people and objects, as well as
changes to those objects over time.”
Yet, Want et al. [Want, 1992] were the first that studied the field of context-aware
computing on their work. Since then, a number of attempts have been made in order to

18
define context-aware computing, but the most common and generally accepted was the one
given by Dey and Abowd [Dey, 199A]. They refer to context-awareness as:
“the ability of a system or a mechanism to collect information of its environment and behave
accordingly”
2.1.1.4. Previous Definitions of Context-Aware
The first definition of context-aware applications was given by Schilit and Theimer
[Schilit, 1994] that define them as applications that are able to collect information regarding
their context and adapt themselves based on that. Other tried to relate the term of context-
aware applications with other concepts like adaptive [Brown, 1996A], responsive [Elrod,
1993] and environment directed [Fickas, 1997].
Starting from the general cases of context-aware, Hull et al. [Hull, 1997] and Pascoe
et al. [Pascoe, 1998; Ryan, 1998] define context-aware computing as the capability of
computers to identify and interact to certain conditions of the user’s environment and the
computing devices themselves. Dey et al. [Dey, 1998] also defined context-awareness and
context-aware computing as the use of context by the computers in order to automate a
procedure and to provide great adaptation of the computational services.
Moving on to the definitions that approach context-awareness as the adaptability of
a system, Ward [Ward, 1997] Dey [Dey, 1998] and Brown [Brown, 1997] among others
define context-aware applications those that can actively alter their behaviors and adapt to
certain conditions based on the context they get as an input. Also, Fickas et al. [Fickas, 1997]
defined another term; the environment-directed applications to be the applications that can
monitor any changes that are made to their environment and adapt accordingly.
2.1.2. Context-aware applications
The increasing use of mobile devices led to the creation of location-aware
applications like the one described by Harter [Harter, 2002]. This platform gathers
information from sensors, creates a model of the building and allows applications to gather
19
location information of the users as they walk around it. Aside from location, other factors
like noise and light are used as context, in order to create a more adaptive environment.
An example is the one described by Baldauf et al. in their work [Baldauf, 2007] where
all users in a given environment are equipped with mobile devices. The purpose of this
system is to give the users the ability to write messages that are sent or received when a set
of conditions is fulfilled. For example, send a message to the first doctor passing through a
specific room at a specific time in a hospital.
The Context Toolkit [Context-Toolkit; Dey, 2001] is a framework that features a list
of capabilities to build context-aware applications. The Context Toolkit eases the process of
transforming a non-context-aware application into an application capable of using context.
This toolkit also can make an application resistant to changes of context so that when a
change of context occurs there will be no need of modification of the application. In essence,
the Context Toolkit is responsible for the development, the deployment and the management
of context-aware applications [Baldauf, 2007].
Yet another use of a context in a context-aware framework is presented by Biegel et
al. [Biegel, 2004]. This framework eases the development of context-aware applications
while providing the developers a list of useful mechanisms and tools. Using this framework,
a developer is able to communicate with sensors and actuators with an event-based
communication mechanism through a visual programming tool, as well as to extract higher-
level context information from a probabilistic mechanism.
2.2. Rule Engines
Rule Engines are a part of Expert Systems (ES) within the Artificial Intelligence (AI)
area that aim at providing a computational system human decision making [Garcia, 2012].
The term “rule engine” though was quite unclear until Chisholm in his work “How to build a
business rule engine” [Chisholm, 2004], presented in a very clear way what are the rule
engines, and which are the key parts that comprise one.

20
Rule engines are based on a set of rules or a knowledge base that comprise the
inference capabilities of the engine. There are three types of inference methods that are
frequently used. The deterministic inference engines, backward chaining inference engines
and forward chaining inference engines. These concepts will be furtherly described in the
next sections.
2.2.1. Deterministic inference engines
These engines are very commonly used in Domain Specific Languages (DSL) for
inference using a custom algorithm. Such paradigms can be found in a great amount of
scientific works like Carvalho et al. [Carvalho, 2011] who used such engines in Open
Modeling Language (OML) in order to handle ontologies. Qichao [Qichao, 2010] on his work
introduces a metamodel inference engine a Model Representation Language (MRL) to extend
MARS system.
This type of inference engines is known to be easily manipulated and maintained, thus
they are used broadly. However, because of its constraints on the implementation, it is not
used widely and other approaches like backward or forward chaining inference engines are
preferred.
2.2.2. Backward chaining inference engines
Backward chaining inference engines, also called goal-driven inference engines,
iterate within their own Knowledge Base, based on the data available, and are triggered by a
goal. These engines start from the goal-state they want to achieve and based on the data
provided, try to create paths to reach the goal that was set in the first place. The most
common algorithm used in such engines is the depth-first search (DFS). A backward
inference engine architecture is depicted graphically on the figure below.

21
Figure 1: Backward Chaining Inference Engine, Drools Documentation, Online:
https://docs.jboss.org/drools/release/5.3.0.Final/drools-expert-docs/html/ch01.html
2.2.3. Forward chaining inference engines
Forward chaining inference engines are considered to be the exact opposite method
of backward chaining. These inference engines are also called data-driven and are based on
the facts (the data) arriving in the system. There are two main approaches followed in
forward chaining; process inference engines and reactive engines. The first type of engines
regards non-automatic inference engines that are triggered by the user. The second type,
also called Complex Event Processors regards an event-triggered engine that provides
automatic inference. On the figure below a detailed architecture of a forward chaining
inference engine is provided. More on Complex Event Processing on the next chapter.

22
Figure 2: Forward Chaining Inference Engine, Drools Documentation, Online:
https://docs.jboss.org/drools/release/5.3.0.Final/drools-expert-docs/html/ch01.html
2.3. Complex Event Processing
2.3.1. Overview
Complex Event Processing (CEP) is a technology used mainly for analyzing and
processing series of correlated events through a set of techniques and tools [Luckham, 2002].
Complex Event Processing engines use a reactive alternative to process information in order
to identify and propose solutions to problems quickly.
This technology is widely used in a great amount of information systems, including
network monitoring and anomaly detection, business process automation and business
intelligence, among others. This type of processors is able to handle events in real time and
get results very fast, thus speeding up the decision-making process. CEP engines can identify

23
events from numerous data streams that are often correlated, identify possible event
patterns and situations, as well as alerting when necessary and trigger actions that have to
be done [Garcia, 2012].
There are two major categories of processes in CEP engines [Luckham, 2002]:
• Processes that are triggered by events and execute some actions; similar to
business logic. Queries that are running in the CEP engine are triggered when
events (the data gathered) are collected. The queries are presented in a form of
rules and are specified using an Event Processing Language(EPL).
• Events moving between activity processes, that are then “translated” into events
that are meaningful to the system through input and output adapters.
The process architecture a CEP engine is comprised by four main components that in
composition build the previous types of processes mentioned above. These components are:
• A diagram presenting the processes in the system along with the way they are
connected
• The flow of the events, meaning the way they are forwarded in between the
connectors of the system
• The rules that form the behavior of the system
• Possible constraints that specify the limits of the system.
Complex events are created based on the abstraction of single events, also called low-
level events that do not have any level of abstraction. The figure below presents graphically
the way the complex events are created.

24
Figure 3: Complex event formulation
2.3.2. Architecture
The basic architecture of most Complex Event Processing engines includes the same
five components as presented below:
• Input adapters: these components handle the connection with the external
sources and the way the streaming data is forwarded in the engine.
• Processing engine: this engine is responsible for matching the events with
the rules.
• Database connectivity: a component that handles any connection with
databases or data warehouses.
• Configuration front-end: the tool that help configure the processing engine.
• Output adapters: any information regarding the external systems connected
to the Complex Event Processing engine.

25
2.3.3. Events in Complex Event Processing engines
The most important element of the CEP engines is the events. Events, according to
[Luckham, 2002] have three main characteristics:
• The form of the event, meaning way the events are represented. That can be
either a string, a JSON or and XML etc. The information stored may regard the
time of the event occurred, etc. as well as the two rest characteristics, meaning
the significance and the relativity.
• Information regarding the significance of the event has to be hold.
• Relativity has to do with the relationship between the current event and other
events. Events may be related by time, causality or in aggregation. These
terms are described below.
There are three ways that events may correlate:
• Time: this type of relation regards the order the events are occurred (e.g.
event B occurred after event B). This can be identified using a timestamp that
is assigned to every event and presents the exact time it occurred.
• Causality: Some events may occur only when some others happened. This is
what causality represents (e.g. event B depends on event A, event B can only
happen when event A does not, etc.)
• Aggregation: This is an abstracted level of relationship in events. In order to
make it easier to understand, an example is used. Event A is occurred only
when a set of event B’s are occurred.
2.3.4. Event Processing Languages
Event Processing Languages (EPL) play a significant role in Complex Event Processing
engines. This chapter presents the major EPLs that are more frequently used.

26
2.3.4.1. RAPIDE-EPL
Luckham on his work in [Luckham, 1995] presented an event pattern language called
RAPIDE-EPL, a declarative language used for writing event patterns.
RAPIDE-EPL is a simple query language that combines mathematical expressions
with programming features like conditions or assignments. The event patterns that are
written with RAPIDE-EPL include information such as timestamps, causal dependencies, and
potential dependencies between events.
A sample query in RAPIDE-EPL is presented on the snippet below:
Snippet 1: RAPIDE-EPL Example [Garcia, 2012]
The snippet above shows a RAPIDE-EPL query is constantly fired when every event
“EVENT” that has as param1 STE and param2 larger than 100 in a time window of 60
seconds [Garcia, 2012].
2.3.4.2. SASE+
Gyllstrom et al. on their work [Gyllstrom, 2008] proposed SASE+, which eventually
was developed in the University of Massachusetts [SASE+]. SASE+ is a SQL-like Event
Programming Language that is mainly focused on identifying temporal event patterns.
SASE+ supports a great number of features including sliding windows, event sequencing,
filtering conditions etc.
2.3.4.3. CAYUGA EVENT LANGUAGE (CEL)
Brenna et al. [Brenna, 2007] on their work presented CAYUGA a Complex Event
Processing engine that was after developed at the Cornell Database Group. Cayuga is, like
EVERY Event (param1 = "STE", param2 > 100) WHERE timer: within (60 seconds)

27
SASE+, a simple SQL-like language that uses non-finite automations to match event patterns
to queries.
The snippet below presents a sample in Cayuga language:
2.3.5. Related Work
2.3.5.1. Drools Fusion
Drools Fusion [Drools-Fusion] is the module created by Redhat as an extension to
Drools [Drools], responsible for adding Complex Event Processing capabilities into the
platform. Drools is a business rule management system that allows fast and reliable
evaluation of business rules. Drools supports both forward- and backward-chaining. Fusion
is a module among others (OptaPlanner, WorkBench, etc.) that comprise the overall Drools
platform, making it a complete Business Rule Management framework. Drools has been
written and is available in Java.
Drools Fusion has many features that make it a great solution for problems that need
to be solved through Complex Event Processing techniques. In order to describe the
capabilities provided by Fusion we need to start from the basics, and how it handles events.
Events are distinguished as a record of a state change and have a few distinguishing
characteristics [Drools-Fusion]:
• They are usually immutable, meaning that they cannot be changed after they
are detected, but this does not mean that a Java object that is identified as an
event is immutable too.
• They have strong temporal constraints, in a way that they can be matched
with other events that happen at a relative point in time.
SELECT * FROM FILTER {IsMyFriend (userID) and Type = add and IsSimilar (ObjectProfile, p)} F
Snippet 2: Cayuga CEP language sample [Cayuga]

28
• Automatic lifecycle management is enabled. Events can only be matched
with facts in a time window. In that case, Drools Fusion can automatically
manage the event and delete it in order to release its associated resources on
the working memory.
• Sliding windows are supported. All the events have timestamps linked to
them, thus making the creation of sliding windows possible.
Events on Drools are a special type of facts. Facts in Drools are an instance of an
application object represented as a Java Object [JBoss BPM]. Facts are declared as events in
Drools giving them the aforementioned characteristics. After the declaration of events is
complete, a set of rules are created that are match with the events. These rules are in the
form of “WHEN condition THEN action”. A sample rule in Drools Fusion is represented in the
snippet below:
The entry point shown in the snippet above is the gate that connects the engine with
the events.
Fusion supports two event processing modes, Cloud mode and Stream mode:
• Cloud mode: This is the default processing mode of Drools Fusion and
behaves the exact same way as any other forward chaining rule engine. The
drawback here is that in Cloud mode there is no notion of time and the events
rule “sample rule 1”
when
$something : SomeObject ( str == “Something” ) from entry-point
“Sample Entry Point”
then
// make an action
end
Snippet 3: Sample Drools Fusion rule

29
are not handled by order. Drools looks at the events without any order and
tries to match them with rules.
• Stream mode: Stream mode is used when the engine has to process streams
of events. In this mode, time and event order play a significant role, since
events are correlated by the notion of time and rules are matched to events at
a given time window.
Sliding windows can be supported in two ways:
• Sliding Time Windows: This type of sliding windows allows the user to match
events that occur in the last X time units (e.g. in the last 2 minutes).
• Sliding Length Windows: Using this way of sliding windows works the same
way with time windows but the difference is that instead of using time as the
matching metric, on length windows Drools uses the number of times an event
has been occurred (e.g. last 10 events).
Temporal reasoning is also supported in Drools Fusion. The most common operators
used in Fusion are presented on the table below:
Operator Description Example
After An event is correlated with
another when the first one
occurs a specified amount of
time after the second
$eventA: EventA (this after
[2m30s, 5m] $eventB)
Before An event is correlated with
another when the first one
occurs a specified amount of
time before the second
$eventA: EventA (this
before [2m30s, 5m]
$eventB)
Coincides An event is correlated with
another when they occurred
at the same time
$eventA: EventA (this
coincides $eventB)

30
During An event is correlated with
another when one is
occurred during the
occurrence of the other
$eventA: EventA (this
during $eventB)
Finishes An event is correlated with
another when one is
occurred after the other but
both finish on the same time
(based on the timestamp)
$eventA: EventA (this
finishes $eventB)
Finished By An event is correlated to
another when one started
before the other, but both
finish at the same time
$eventA : EventA( this
finishedby $eventB )
Includes An event is correlated to
another when the event
being correlated occurs
during the other
$eventA : EventA( this
includes $eventB )
Meets An event is correlated to
another when it starts right
when the other finishes
$eventA : EventA( this meets
$eventB )
Met By An event is correlated to
another when the current
event starts at the same time
the other finishes
$eventA : EventA( this
metby $eventB )
Overlaps An event is correlated to
another when the current
event starts before the other
but finishes after it
$eventA : EventA( this
overlaps[ 5s ] $eventB )

31
Overlapped By An event is correlated to
another when the current
event starts after the other
but finishes before it
$eventA : EventA( this
overlappedby[ 5s ] $eventB
)
Starts An event is correlated to
another when both start at
the same time but the
current event ends before
the other
$eventA : EventA( this starts
$eventB )
Started By An event is correlated to
another when the correlated
event ends before the
current event but both start
at the same time
$eventA : EventA( this
startedby $eventB )
Table 1: Drools Fusion temporal reasoning operators
Drools Fusion is the selected Complex Event Processing framework for this thesis. Οn
the next chapters there will be a detailed description of the architecture of the developed
engine and how Drools Fusion is integrated in the overall solution.
2.3.5.2. Apache Flink
Apache Flink [Apache-Flink] is a distributed real-time high-performance Stream
Processing Engine developed in the Apache Software Foundation. Flink handles any kind of
data produced as a stream of events and can process them as unbounded and bounded.
• Unbounded streams: That type of streams do not have a defined end, and in
that case the data must be processed in a continuous manner, since it is
produced in real time. Also, unbounded streams processing often requires the
order in which the events are occurred.

32
• Bounded streams: In contrast with unbounded streams, bounded have both
start and end and can be processed before performing any type of
computations.
Flink can handle several types of windowing. These are presented in the list below:
• Sliding windows: The window slides over the stream of the incoming data
and aggregates the streaming data, just like the sliding windows support in
other Complex Event Processing frameworks.
• Tumbling windows: These are much like the sliding windows but there are
no overlaps between the windows. Using this type of windows, groups the
events together in buckets and the applies potential aggregations.
• Session windows: The session windows groups elements of the stream by
sessions of activity. There are no overlaps when using session windows and
no fixed start of fixed end in contrast to tumbling or sliding windows. During
inactive times the window closes and stops receiving any more elements, and
a session gap is occurred.
2.3.5.3. Esper
Esper [Esper] is an open source software mainly used for Complex Event Processing
available in Java [Java] and .NET as Nesper. Esper has been developed keeping in mind that
stream processing and stream analytics play a big part in the Complex Event Processing area.
For that reason, low latency and high throughput are a priority.
Esper uses a high-level SQL-like Processing Language (Esper Processing Language –
EPL) for the writing of the queries. Sliding windows are also supported, much like every CEP
framework. Data windows are also supported, that are similar to Fusion’s sliding length
windows. EPL supports various formats of Java objects and handles event pattern
recognition through the EPL Pattern Engine. This engine is represented as a dynamic state
machine in which states other sub-states may exist. Rapide as presented by Luckham et al.
in his work [Luckham, 1995] was used as the main idea for the Esper Processing Language.

33
In the snippet below, a sample of the Esper EPL is presented that is executed when
the parameter param1 of the object Sample is equal to 1 and returns the max price in a
window of 60 seconds.
2.3.5.4. Apache Spark
Apache Spark [Apache-Spark] is a big data distributed computing system for general
execution graphs. It provides a high-level API in many frequently used programming
languages including Java, Python and Scala for both batch processing and stream processing.
Spark supports machine learning techniques through the Mllib library which
provides a great amount of machine learning algorithms (e.g. linear regression, k-Means,
etc.) for streaming data. The difference to other stream processing systems like Flink or
Storm is that the input streams in Spark are divided into Resilient Distributed Datasets
(RDDs) and then processed as micro batches.
2.3.5.5. Apache Storm
Apache Storm [Apache-Storm] is a distributed stream processing framework
developed by Apache. Storm offers Trident-ML [Trident-ML], a high-level of abstraction
library for real-time online machine learning. Storm has a few main components that
comprise a storm engine:
• Tuples: The main data structure of Apache Storm. All the incoming data is
represented as tuples which is an ordered list of elements and support all the
primitive data types.
• Streams: Streams in Apache Storm are both unbounded and bounded and are
entering the Storm system in the form of tuples
SELECT max(price) FROM Sample (param1 = 1) .win.time (60 sec)
Snippet 4: Esper EPL sample query

34
• Spouts: These components are responsible for reading the tuples in a
topology and forwarding them to the bolts.
• Bolts: Bolts are the components that are responsible for the data processing
part in a Storm topology. Bolts receive the data from the spouts, process them
and then forward them into other bolts.
• Topology: The topology is the directed graph that represents the way Spouts
and Bolts are connected. Each Spout and Bolt is represented as a node in the
topology of Storm, where the links between them represent the data flow.
2.4. System Monitoring
Every computer has hardware resources like CPUs, memory, disk and network
interfaces, etc. The same thing occurs respectively in Virtual Machines and Containers. While
using the machine, computing resources are allocated for the execution of processes.
Inappropriate usage of the resources of each computing unit may lead to several resource
usage related problems. For example, the computing unit could run out of memory, or the
CPU may reach very high levels of usage, thus forcing the machine to stop the processes that
are currently running on it.
Monitoring the machines comes as a solution to such problems. Through monitoring
we can know directly how the system performs, if there any problems or failures and gather
information that can be furtherly analyzed in order to understand the system better. In
microservices architectures, monitoring plays even greater role, since most of the systems
are distributed. In such cases, monitoring solutions should monitor each the services
comprising the whole system separately, but also as a unit, in order to get aggregated results.
The bigger the application is, the more necessary and important monitoring is.
Debugging or identifying possible issues in an architecture that consists of hundreds or even
thousands of application services / microservices is impossible without a complete
monitoring solution.
35
Monitoring solutions can collect several information regarding the computing and
hardware resources including CPU usage, memory and disk usage and other network related
metrics like throughput, jitter, etc. Other functionalities of the system can be monitored too,
including the running processes / tasks on a machine.
The monitoring solutions that will be used in this current thesis will be presented on
the chapter below.
2.4.1. Monitoring Solutions
This chapter describes the monitoring solutions that are used in this thesis. The two
main monitoring engines are Prometheus [Prometheus] and Netdata [Netdata].
2.4.1.1. Prometheus
Prometheus [Prometheus] is an open-source monitoring and alerting toolkit that was
originally created for SoundCloud. Over time Prometheus was chosen by companies and
became more and more powerful. It features several characteristics including a query
language for handling data dimensionality and a time series database for extraction of
valuable information from the data. But the most important features of Prometheus are the
Pushgateway for batch jobs to expose metrics to Prometheus, the Alertmanager for handling
alerts and the Grafana [Grafana] support for visualizing of the data.
The figure below presents in detail the architecture of Prometheus.

36
Figure 4: Prometheus overall architecture, Online: https://prometheus.io/docs/introduction/overview/
As presented in Figure 4 above, Prometheus scrapes metrics from instrumented jobs
instantly or through the Pushgateway for short-lived jobs. Prometheus then stores the
scraped metrics into a time series database that can be then queried, in order to execute
graphs and other functions like alerts in real time. Grafana or other data visualization tools
can be used for the visualization of the collected and analyzed data.
2.4.1.2. Netdata
Netdata [Netdata] is an open-source light-weight (it only takes 1% of the CPU usage,
a few megabytes of RAM and no disk I/O to be instantiated) monitoring tool. Through
Netdata a great variety of metrics related to the system itself can be collected (e.g. Quality of
Service (QoS) metrics, CPU, RAM, Disk usage, network, etc.) and visualized using its simple
Graphical User Interface.
Netdata can collect more the 5000 metrics automatically out of the box with zero
configuration making it very easy to use. Also, an adequate to Prometheus’ Alertmanager is
also available. Alarm handling is supported, in the form of notifications via e-mails, Slack, etc.

37
Unlike other monitoring solutions, Netdata instead of aggregating all the metrics from
the various servers to a central place, it keeps the data on the server it is collected, thus
allowing it to collect thousands of metrics per second without burdening the system. Finally,
Netdata is highly extensible, since using its Plugin API, more or less anything can be
monitored (BASH, Node.js, Python, Java, Ruby, etc.).
Figure 5 below depicts the GUI of Netdata. The list on the right side of the figure
presents the large list of the available metrics that Netdata is capable of monitoring.
Figure 5: Netdata demo, Online: http://london.my-netdata.io

38
Chapter 3 – Overall architecture
This chapter describes the architecture of the developed engine. More specifically, on
chapter 3.1. the tools used for the monitoring are presented. Also, the way the data is
collected from the Fusion Engine is described. On the following chapter (3.2.) the
architecture of the Drools Fusion engine is presented, including type of the data the engine
collects, the events identified by the engine, the matched rules.
The whole system is organized as follows: the tools used for monitoring the Virtual
Machine are Prometheus [Prometheus] and Netdata [Netdata]. After the collection of the
monitored data by Prometheus, a simple interval HTTP request from the developed Java
application collects the data.
Afterwards, the data is fed to Drools Fusion engine to match it with the rules that are
already created. When a rule matches with a set of real-time monitoring data, it gets fired
and an alert activated. On the figure below, a graphical representation of the overall
architecture is depicted:

39
Figure 6: Overall architecture
As presented also in the figure above the rules that represent the events, are stored
in Drools Fusion. The engine has dynamic rule change capabilities at runtime, which will be
discussed furtherly below.
3.1 Data collection
As already mentioned the mechanisms used for monitoring the Virtual Machine are
Prometheus and Netdata. This chapter describes the data provided by the two monitoring
mechanisms.
3.1.1. Prometheus
Prometheus is an open-source monitoring solution that supports alerting and metric
collection. Also, Prometheus supports scraping monitoring data from other tools like

40
Netdata which is also used, or Node-Exporter. A sample list of the monitored data is shown
on the snippet below, as collected directly from the VM:
Prometheus support a graphical user interface for executing in real-time queries on
the monitored data and presenting in either graph or console logs the outcomes. A sample of
this GUI is depicted on the figure below:
# HELP node_vmstat_unevictable_pgs_scanned /proc/vmstat information
field unevictable_pgs_scanned.
# TYPE node_vmstat_unevictable_pgs_scanned untyped
node_vmstat_unevictable_pgs_scanned 0
# HELP node_vmstat_unevictable_pgs_stranded /proc/vmstat information
field unevictable_pgs_stranded.
# TYPE node_vmstat_unevictable_pgs_stranded untyped
node_vmstat_unevictable_pgs_stranded 0
# HELP node_vmstat_workingset_activate /proc/vmstat information field
workingset_activate.
# TYPE node_vmstat_workingset_activate untyped
node_vmstat_workingset_activate 579847
# HELP node_vmstat_workingset_nodereclaim /proc/vmstat information
field workingset_nodereclaim.
# TYPE node_vmstat_workingset_nodereclaim untyped
node_vmstat_workingset_nodereclaim 0
# HELP node_vmstat_workingset_refault /proc/vmstat information field
workingset_refault.
# TYPE node_vmstat_workingset_refault untyped
node_vmstat_workingset_refault 6.045205e+06
# HELP node_vmstat_zone_reclaim_failed /proc/vmstat information field
zone_reclaim_failed.
# TYPE node_vmstat_zone_reclaim_failed untyped
node_vmstat_zone_reclaim_failed 0
# HELP process_cpu_seconds_total Total user and system CPU time spent
in seconds.
# TYPE process_cpu_seconds_total counter
process_cpu_seconds_total 113950.18
# HELP process_max_fds Maximum number of open file descriptors.
# TYPE process_max_fds gauge
process_max_fds 1024
Snippet 5: Prometheus monitored data

41
Figure 7: Prometheus GUI
3.1.2. Netdata
Netdata is the monitoring solution chosen for this thesis as the metric collection.
Netdata has many more metrics available and a simple Graphical User Interface for
representation of the data in the form of graphs. The GUI of Netdata is shown in the figure
below:

42
Figure 8: Netdata GUI
A large list of metrics can be collected through Netdata including CPU, Memory
utilization, Disk Read and Write speed, IPv4 and IPv6 networking related data, including
received and sent packets, lost packets, errors, running applications on the system and many
more. On the snippet below, a sample of the collected metrics is depicted in the form of JSON:

43
3.1.3. Real-time collection
For the collection of the metrics from Netdata and Prometheus an interval HTTP
request is trigger every 5 seconds from the Java application. The data is collected as JSON
and then passed to a Java Object which is used as the input to Drools Fusion. Not everything
ipv6.icmpechos: {
name: "ipv6.icmpechos",
context: "ipv6.icmpechos",
units: "messages/s",
last_updated: 1534240404,
dimensions: {
InEchos: {
name: "InEchos",
value: 0
},
OutEchos: {
name: "OutEchos",
value: 0
},
InEchoReplies: {
name: "InEchoReplies",
value: 0
},
OutEchoReplies: {
name: "OutEchoReplies",
value: 0
}
}
}
Snippet 6: Netdata JSON

44
that is collected is used, so a cleaning process has been done. The complete Java Object that
is eventually forwarded to Drools Fusion included the data as shown below:
As shown in the snippet above, a great number of collected metrics are used, including
CPU and memory utilization, IPv4 sent and received packets, open and aborted TCP
connections, etc.
this.timeStamp: 1534241147
this.memUsagePerc: 6.145445235294336
this.cpuUsagePerc: 34.848484799999994
this.diskSizePerc: 29.881866386940164
this.diskUtilPerc: 0.3498443
this.upTime: 3373425
this.ipv4PacketsReceived: 71.8757846
this.ipv4PacketsDelivered: 71.8757846
this.ipv4PacketsForwarded: 0.0
this.ipv4PacketsSent: 71.8757846
this.ipv4RSKbpsReceived: 236.0391692
this.ipv4RSKbpsSent: 236.0270333
this.ipv4TcpConnsOpenActive: 18.0005107
this.ipv4TcpConnsOpenPassive: 3.0000851
this.ipv4TcpConnsAbortsOnTimeout: 0.0
this.ipv4TcpConnsAbortsOnLinger: 0.0
this.ipv4TcpConnsAbortsOnBadData:
0.1264583
this.ipv4TcpConnsAbortsOnMemory: 0.0
this.ipv4TcpConnsAbortsFailed: 0.0
this.ipv4TcpConnsAbortsOnClose: 0.0
Snippet 7: Java Object

45
3.2. Complex Event Processing with Drools Fusion
3.2.1. Rules
As mentioned before, events in Drools Fusion are in the form of rules. The rules that
are triggered alert the system for abnormal use, thus suggesting the orchestrator to make
any required changes. The rules have to do with CPU, disk and memory utilization, TCP
connections, received and sent Kbps, etc.
The rules are presented in the list below:
• High CPU utilization
• High Memory utilization
• High Disk utilization
• Low free Disk percentage
• Great number of TCP aborts
• Uptime of the VM
Also, more complex rules are identified, including high CPU, memory or disk
utilization for a time window of 30 minutes, low CPU, memory or disk for a time window of
30 minutes etc. The last set of rules (the ones regarding low utilization) are also created in
order to notify the orchestrator of the system to release unnecessary resources.
Rules as created on Drools Fusion are presented in the snippets 7 and 8 below:

46
As someone might see the alert also prints the exact number of seconds that the CPU
utilization has exceeded the limit of 95%.
3.2.2. Dynamic CEP
The developed Complex Event Processing engine has dynamic rule changing
capabilities as shown also on the work of Bhargavi et al. [Bhargavi, 2013]. There are two
ways for the rules to be changed at real-time:
rule "CPU usage over 95% over time of 1800 seconds (at least 30
minutes)"
salience 1
when
$cpuOverTW : NetdataBucket(cpuCountOver >= 360) from entry-point
NetdataBucket
then
System.out.println("ALERT: CPU usage is over 95% for the last "
+ $cpuOverTW.getCpuCountOver()*5 + " seconds");
// Scaling is recommended
end
Snippet 7: High CPU usage for the last 30 minutes
rule "CPU usage less than 5% over time of X seconds (at least 1 hour)"
salience 1
when
$cpuLowTW : NetdataBucket(cpuCountLow >= 720) from entry-point
NetdataBucket
then
System.out.println("ALERT: CPU usage is less than 5% for the last
" + $cpuLowTW.getCpuCountLow()*5 + " seconds");
// Unnecessary resources should be released
end
Snippet 8: Low CPU usage for the last 1 hour

47
3.2.2.1. Interval change of rules
Using this way an interval request from the Drools Fusion is made forcing it to re-
read the rules file and then add it to the inference engine. In our case, this process is done
every 5 seconds. So, any possible changed made to rules file are taken into account the next
time the rules are read by Fusion.
3.2.2.2. Using a listener to notify the engine for potential changes in the rules file
The second way to make the engine dynamic, as far as the rules are concerned is to
add a listener to the engine, that notifies it whenever any changes are made to the rules file.
In that case, every time there is change on the rules file, Drools Fusion is instantly notified
and reads the file again.
3.3. Application in 5G infrastructures
3.3.1. A short introduction to 5G
5G is the fifth generation of wireless technology. But us as users, will face it as one of
the fastest and most powerful technologies we ever seen. Downloading will be faster than
ever and a more robust network will be introduced, making a massive impact on how we
live, work and play. The advantages of 5G connectivity will assist also on making businesses
more efficient and to help consumers get access to more information faster than ever before.
Things that are still under test like smart cities, autonomous cars, and immersive education
will also be benefited when 5G comes to life [Verizon-5G].
5G comes with a revolutionary way to change the internet once and for all, thus also
leading to the change of the vertical industry too. This will be realized, providing an ultra-
fast wireless world wide web, leading us to the 4th Industrial Revolution. Specifically, 5G
attempts to combine multiple technologies of different layers and areas to achieves its goals.
These include higher capacity and data rate, where end-to-end (E2E) latency will be
minimized, device connectivity will be maximized, using not only mobiles and smart devices,

48
but sensors too and finally, the cost of using such services (internet, Software-as-a-Service
(SaaS)) will be highly reduced as referred by Gupta et al. in their work [Gupta, 2015].
Internet of Things (IoT) will also be a key enabler to 5G [Ijaz, 2016]. Today, the
growing prevalence and existence of low cost computing devices and sensors in almost any
situation possible (health-, weather-, etc., related sensors), empower the communication
capabilities to the realization of the IoT using 5G. High bandwidth and low latency which are
the two major requirements in IoT are standards in 5G. In other words, we can say that, both
5G and Internet of Things will be co-assisted, and one is in need of the other. From the IoT
perspective, 5G will help on the use of IoT devices and spread of the IoT in general, where
from the 5G perspective, IoT will be able to use 5G’s capabilities at the end, thus helping us
identify its true limits.
3.3.2. Complex Event Processing in 5G infrastructures
The abovementioned innovations that 5G will bring are for sure going to change the
way we see and understand the internet and will make our lives easier. For instance, IoT
sensors that are related to health will be much cheaper and the connectivity will be faster. In
such cases, the examination of a patient by a doctor could be done remotely, saving time and
money.
But, in order to achieve such results, the orchestration of such networks should be
done carefully, in order for the network to work seamlessly. There are two major techniques
that will assist on the management of 5G networks; Network Slicing and Cloud Computing.
These two methodologies will be used for network and resource virtualization and will be
broadly used in 5G and its services.
The term Network Slice (NS) is introduced to serve such diverse ecosystems. A
network slice part of the computing infrastructure (consisting mainly of the virtualized
resources and virtual network functions, without excluding physical network functions too,
if necessary), that aims to support a set of services. A network slice is created after a request,
based on the available compute, network and storage resources of the infrastructure and the

49
requirements that are requested by the service provider [NGMN]. Over a network slice, a set
of infrastructure management and application-oriented orchestration services are provided.
The challenge with the developed Complex Event Processing engine comes with its
integration in such environments. As mentioned before, 5G comes with very fast and low
latency connectivity, thus facilitating in the trouble-free data transfer and services use. These
services will be executed on infrastructures that are handled and managed by intelligent
orchestrators for greater and smoother operation of the services.
5G networks have to be operated by intelligent orchestration platforms able to
support end-to-end applications and services provision over a programmable network,
compute and storage infrastructure [5G-PPP]. Through the manipulation of virtualization
and “softwarization” technologies, developers and operators have to better match needs and
capabilities, building application-aware networks and network-aware applications.
Here comes the use the developed Complex Event Processing engine as part of an
intelligent orchestrating framework. Its purpose is to identify meaningful events regarding
the 5G infrastructure and alert the orchestrator for anomalies that may rise during the
deployment of applications and services.
The use of such engines in 5G environments is beneficial due to their ability to
understand fully the context of a 5G infrastructure, adapt to it and facilitate on the decision-
making of the execution manager of the orchestrator. An approach of how the engine can be
integrated in an orchestrating environment is depicted in the figure below as depicted by the
MATILDA project [MATILDA-5G].

50
Figure 9: MATILDA orchestrator
As presented in Figure 9, the Complex Event Processing engine should be part of the
Context-awareness engine. It is part of the overall orchestrator and is responsible for
identifying events based on the data provided by the monitoring mechanisms.
51
Chapter 4 – Experimental Evaluation
For the evaluation of the engine, a series of experiments has been done, that show the
actual use of the CEP engine on a Virtual Machine with benchmarks. The VM used was
deployed on Okeanos [Okeanos-GRNET] a cloud service, for the Greek Research and
Academic Community that has available resources for testing purposes. The VM used has 2
CPUs, 4 GB of RAM and 20 GB of internal storage and runs on Ubuntu 16.04. The
benchmarking tool used, as mentioned above is sysbench [sysbench]. The results are
presented below.
Sysbench
Sysbench is a free scriptable benchmarking tool for Linux and MacOS that works
through the terminal. Sysbench is capable of executing tests that are related to the CPU, the
Memory and the Disk IO of the machine, as well as SQL databases IO benchmarks, etc.
4.1. CPU benchmarks
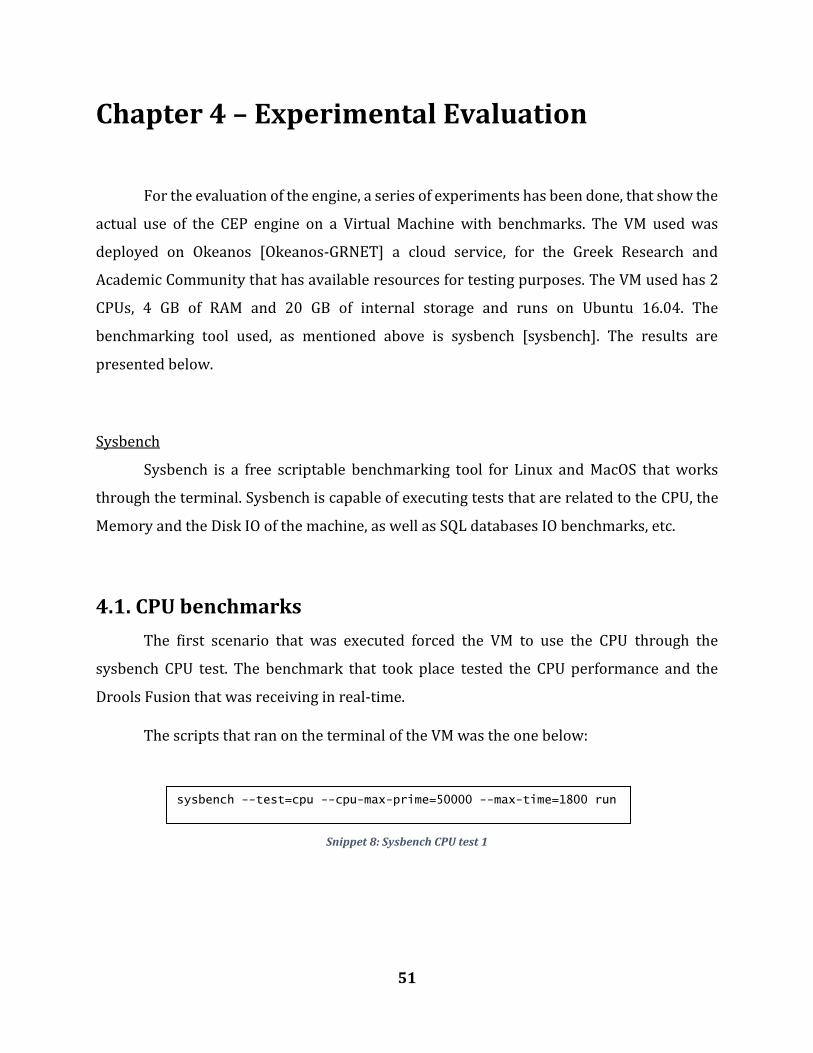
The first scenario that was executed forced the VM to use the CPU through the
sysbench CPU test. The benchmark that took place tested the CPU performance and the
Drools Fusion that was receiving in real-time.
The scripts that ran on the terminal of the VM was the one below:
sysbench --test=cpu --cpu-max-prime=50000 --max-time=1800 run
Snippet 8: Sysbench CPU test 1

52
This command runs a CPU test with an upper limit of primes generator of 50000. The
rules that were executed, alerted the system as follows:
As someone might notice, the CPU alert that was triggered, suggested that the CPU
usage was over 95% for the last 30 minutes, but Disk and Memory were not used at all, thus
alerting for unnecessary resources.
The second benchmark that tested the CPU was the same with the first, but the
difference was that the cpu-max-prime metric was bigger, so that the test would run longer.
The results were the same in that benchmark too, meaning that there were alerts that were
warning for high CPU usage but still, memory and disk were not affected at all. Instead there
were low, forcing the CEP engine to alert for low utilization.
4.2. File IO benchmarks
A file IO benchmark was also created to force the VM to use the disk and the memory.
The script that was executed was the one presented on the snippet below:
UNNEEDED RESOURCES ALERT: Disk usage is less than 1% for the last 1850
seconds
UNNEEDED RESOURCES ALERT: Memory usage is less than 5% for the last 215
seconds
ALERT: CPU usage is over 95% for the last 1800 seconds
sysbench --test=fileio --file-total-size=15G prepare
sysbench --test=fileio --file-total-size=15G --file-test-mode=rndrw --init-
rng=on --max-time=300000 --max-requests=0 run
Snippet 10: File IO benchmark
Figure 10: CPU benchmark 1 alerts

53
The commands above forced the machine to create files that combined were in total
size of 15 GB (128 files, 122880 Kb each, 15360 Mb in total). After the files were created
several read / write / delete processes were executed pushing the disk and the memory to
their limits. During that test the alerts that were popping up in the system warned for not
only high disk and memory utilization, but for CPU too. A sample of the alerts are depicted
on the figure below:
4.3. More than one tests at once
While trying to push the machine to its limits, several tests were executed, forcing it
to use both the CPU and the memory into high levels for a great amount of time. After 3 hours
of testing just the CPU and memory the alerts that were appearing were as follows:
As someone might notice, even though that both the memory and the CPU of the
machine were overused, the disk remained low, regarding the utilization.
ALERT: Disk utilization is over 85% for the last 1800 seconds
ALERT: Memory usage is over 95% for the last 1850seconds
ALERT: CPU usage is over 95% for the last 1545 seconds
Figure 11: File IO benchmark alerts
UNNEEDED RESOURCES ALERT: Disk usage is less than 1% for the last 5850 seconds. Currently using (%):0.0
ALERT: Memory usage is over 85% for the last 8575 seconds. Currently using (%):
89.0856505131072165
ALERT: CPU usage is over 90% for the last 11255 seconds. Currently using:
(%)91.798995
Figure 12: Third benchmark alerts fired

54
Figure 13: Graphical representation of CPU utilization in Prometheus
Figure 12 above presents in a graphical way the CPU utilization at the moment the
benchmark started. Instantly, the CPU utilization increased. The same occurred for the
memory too. The memory utilization is presented on figure 13 below:
Figure 14: Memory utilization graph
4.3. Low usage of VM
A set of rules that regard low utilization of the resources of the Virtual Machine was
created too. These set of rules are created keeping in mind that possibly in an infrastructure
that manages computing resources, machines could be associated with resources that are
not needed and could be released.

55
Situations where billing for resources, like the Amazon WS [Amazon-WS] or the
Google Cloud [Google Cloud], is a fact. In such cases the user of such systems can be alerted
to release resources that are no longer required, to reduce the cost.
In fact, most of the time the VM existed, there were no processes that were currently
running, thus not using the resources addressed to it. While that happened, the CEP engine
was indeed alerting for low CPU, Memory and Disk usage. More specifically, the alerts that
were showing up, are as follows:
Other rules that had to do with the uptime of the system or the sent/received kbps
ratio were also created but never executed. The VM did not fail while it was tested and the
threshold for sent/received kbps was never exceeded.
UNNEEDED RESOURCES ALERT: Disk utilization is less than 4% for the last 2085
seconds
UNNEEDED RESOURCES ALERT: Memory usage is less than 5% for the last 1955
seconds
UNNEEDED RESOURCES ALERT: CPU usage is less than 5% for the last 1850 seconds
Figure 15: Low CPU, Memory and Disk utilization alerts

56
Chapter 5 – Conclusions
This chapter sums up the overall work of this thesis and evaluates the results. In
addition, a part of this chapter is dedicated to the future work that can be done in order to
extend this work.
5.1. Conclusions
In this thesis a Complex Event Processing engine has been developed for the
identification of events that affect the use of the resources in computing infrastructures, like
computing clouds. After the engine was developed it was tested in an environment to
examine whether the events identified are indeed useful to the orchestrator of such
infrastructures and facilitate on the decision-making.
Apart from that, the developed engine allows the user to modify at real-time the rules
of that are currently fired making it dynamic and interactive. Thus, even when the current
rules are not meaningful, they can be either deleted or modified, or new rules can be added
if necessary, in order to provide more useful results.
5.2. Future Work
The following list suggests several features that can be adapted to the current version
of the engine to make it more intelligent:
• The first feature that should be included is the addition of semantics in the
rules. Using semantics, the rules engine can collect the whole input from the
monitoring mechanisms and identify itself what data is useful and what is not.
At the current version of the engine, the initially collected data is cleaned and
only a small part of them are inserted to the engine, and possibly valuable
information are not exploited.

57
• Machine learning techniques can be used to automatically change the rules
based on the importance of them. This will make the engine even more
intelligent, making to understand itself whether a rule that is currently
matched to an event is meaningful to the orchestrating mechanisms or not.
This could happen, if the actions of the orchestrators are kept and matched
with the rules fired by the engine. If the events are not taken under
consideration when a decision is made, it means that they are not useful and
need to be altered.
• The last modification that can be made to the engine is to identify even more
complex situations. Drools Fusion has many more capabilities than the ones
used in this engine and using some of them will make the engine more useful
and worthier.

58
References
[5G-PPP] 5G PPP Architecture Working Group, View on 5G Architecture, Online: https://5g-
ppp.eu/wp-content/uploads/2014/02/5G-PPP-5G-Architecture-WP-For-public-
consultation.pdf
[Amazon-WS] Amazon Web Services (AWS), Online: https://aws.amazon.com/
[Apache-Flink] Apache Flink website, Online: https://flink.apache.org
[Apache-Spark] Apache Spark website, Online: https://spark.apache.org
[Apache-Storm] Apache Storm website, Online: http://storm.apache.org/
[Bhargavi, 2013] R. Bhargavi, R. Pathak, V. Vaidehi (2013), “Dynamic Complex Event
Processing – Adaptive Rule Engine”, IEEE, 2013 International Conference on Recent
Trends in Information Technology (ICRTIT), 2013
[Baldauf, 2007] M. Baldauf, S. Dustdar. F. Rosenberg (2007), “A survey on context aware
systems”, International Journal of Ad Hoc and Ubiquitous Computing (IJAHUC), 2007
[Biegel, 2004] G. Biegel, V. Cahill (2004), “A Framework for Developing Mobile, Context-aware
Applications”, Second IEEE Annual Conference on Pervasive Computing and
Communications, 2004
[Brown, 1996A] P. Brown (1996), “The Stick-e Document: A framework for creating context-
aware applications”, In the Proceedings of the Electronic Publishing ’96, pp. 259-272,
Laxenburg, Austria, IFIP, 1996, Online:
http://www.cs.ukc.ac.uk/research/infosys/mobicomp/Fieldwork/Papers/ps/Stick
eDocument.ps
[Brown, 1997] P.J. Brown, J. Bovey, X. Chen (1997), “Context-aware applications: From the
laboratory to the marketplace”, IEEE Personal Communications 4(5): pp. 58-64, 1997,
Online: http://www.cs.ukc.ac.uk/people/staff/pjb/papers/personal_comms.html

59
[Carvalho, 2011] N. Carvalho, A. Simoes (2011), “OML: A scripting approach for manipulating
ontologies”, 6th Iberian Conference on Information Systems and Technologies, pp.1-
6, 2011
[Cayuga] Cayuga website, Online: http://www.cs.cornell.edu/database/cayuga/
[Brenna, 2007] L. Brenna, A. Demers, J. Gehrke, M. Hong, J. Ossher, B. Panda, M Riedewald, M.
Thatte, W. White (2007), “Cayuga: A High-Performance Event Processing Engine”,
International conference on Management of data (SIGMOD ’07), 2007
[Chen, 2003] H. Chen, T. Finin, A. Joshi (2003), “An Ontology for Context-Aware Pervasive
Computing Environments”, Cambridge University Press, 2003
[Chen, 2004] H. Chen (2004), “An Intelligent Broker Architecture for Pervasive Context-Aware
Systems”, PhD Thesis, University of Baltimore, 2004
[Chisholm, 2004] M. Chisholm (2004), “How to build a business rule engine”, Elsevier 2004
[Context-Toolkit] The Context Toolkit, Online http://www.cs.cmu.edu/~anind/context.html
[Dey, 1999A] A. Dey, G. Abowd (1999), “Towards a Better Understanding of Context and
Context-Awareness”, Springer, 1999
[Dey, 1999B] A. Dey (1999), “Providing architectural support for building context-aware
applications”, College of Computing, Georgia Institute of Technology, 1999
[Dey, 2001] A. Dey (2001), “Understanding and using context”, Journal Personal and
Ubiquitous Computing, Springer 2001
[Drools-Fusion] Drools Fusion Documentation, Online
https://docs.jboss.org/drools/release/5.2.0.CR1/drools-fusion-docs/html_single/
[Drools] Drools Documentation, Online
https://docs.jboss.org/drools/release/7.5.0.Final/drools-
docs/html_single/index.html
[Elrod, 1993] S. Elrod, D. Salber, G. Abowd (1993), “Responsive office environments”, In the
Proceedings of the 1st International Workshop on Managing Interactions in Smart
60
Environments (MANSE '99), pp. 114-128, Dublin, Ireland, Springer Verlag. December
13-14, 1999, Online:
http://www.cc.gatech.edu/fce/contexttoolkit/pubs/MANSE99.pdf
[Esper] Esper website, Online: http://www.espertech.com/esper/
[Fickas, 1997] S. Fickas, G. Kortuem, Z. Segall (1997), “Software organization for dynamic and
adaptable wearable systems”, In the Proceedings of the 1st International Symposium
on Wearable Computers (ISWC'97), pp. 56-63, Cambridge, MA, IEEE. October 13-14,
1997, Online: http://www.cs.uoregon.edu/research/wearables/Papers/iswc97.ps
[Franklin, 1998] D. Franklin, J. Flaschbart (1998), “All gadget and no representation makes
jack a dull environment”, In the Proceedings of the AAAI 1998 Spring Symposium on
Intelligent Environments (AAAI Technical Report SS-98-02), pp. 155-160, Palo Alto,
CA, AAAI Press, March 23-25, 1998, Online:
http://www.ils.nwu.edu/~franklin/Pubs/Franklin-SprSym98.pdf
[Garcia, 2012] J. Garcia (2012), “A Complex Event Processing System for monitoring
manufacturing systems”, MSc Thesis, Tampere University of Technology, Automation,
Mechanical and Materials Engineering Faculty, 7 March 2012, Online:
https://dspace.cc.tut.fi/dpub/bitstream/handle/123456789/20958/garcia_izaguirr
e.pdf;sequence=3
[GitHub] GitHub website, Online: https://github.com/
[Google Cloud] Google Cloud, Online: https://cloud.google.com/
[Grafana] Grafana, Online: https://grafana.com/
[Gupta, 2015] A. Gupta, R. K. Jha, “A Survey of 5G Network: Architecture and Emerging
Technologies”, IEEE Access, vol. 3, pp. 1206-32, 2015

61
[Gyllstrom, 2008] D. Gyllstrom, Y. Diao, N. Immerman (2008), “On Supporting Kleene
Closure over Event Streams”, ICDE, IEEE 24th International Conference on Data
Engineering, pp.1391-1393, 2008
[Harter, 2002] A. Harter, A. Hopper, P. Steggles, A. Ward, P. Webster (2002), “The Anatomy of
a Context-Aware Application”, ACM, 2002
[Ijaz, 2016] A. Ijaz et al., "Enabling Massive IoT in 5G and Beyond Systems: PHY Radio Frame
Design Considerations", in IEEE Access, vol. 4, pp. 3322-3339, 2016. doi:
10.1109/ACCESS.2016.2584178
[Java] Java programming language, Online: https://www.java.com/
[JSON] Javascript Object Notation (JSON) website, Online: https://www.json.org/
[Luckham, 2002] D. Luckham (2002), “The power of events”, Addison Wesley, Boston, San
Francisco, New York et al., 2002
[Luckham, 2012] D. Luckham (2012), “Event Processing for Business: Organizing the Real-
Time Enterprise”, Hoboken, New Jersey: John Wiley & Sons, Inc., 2012
[Netdata] Netdata website, Online: https://my-netdata.io/
[NGMN] NGMN Alliance, Description of Network Slicing Concept, January 2016, Online:
https://www.ngmn.org/uploads/media/160113_Network_Slicing_v1_0.pdf
[Okeanos-GRNET] Okeanos website, Online http://okeanos.grnet.gr/
[Pascoe, 1998] J. Pascoe (1998), “Adding generic contextual capabilities to wearable
computers”, In the Proceedings of the 2nd IEEE International Symposium on
Wearable Computers (ISWC'98), pp. 92-99, Pittsburgh, PA, IEEE. October 19-20,
1998, Online: http://www.cs.ukc.ac.uk/pubs/1998/676/content.zip
[Prometheus] Prometheus monitoring solution website, Online: https://prometheus.io/

62
[Qichao, 2010] L. Qichao (2010), “Metamodel Recovery from Multi-tiered Domains Using
Extended MARS”, COMPSAC, IEEE 34th Annual on Computer Software and
Applications Conference, pp.279-288, 2010
[JBoss BPM] Red Hat JBoss BPM Suite 6.1 Documentation, Online:
https://access.redhat.com/documentation/en-
us/red_hat_jboss_bpm_suite/6.1/html/development_guide/
[Rodden, 1998] T. Rodden, K. Cheverst, N. Davies, A. Dix (1998), “Exploiting context in HCI
design for mobile systems”, In the Workshop on Human Computer Interaction with
Mobile Devices, Glasgow, Scotland. May 21-23, 1998, Online:
http://www.dcs.gla.ac.uk/~johnson/papers/mobile/HCIMD1.html#_Toc42081896
7
[Ryan, 1998] N. Ryan, J. Pascoe and D. Morse (1998), “Enhanced reality fieldwork: the context-
aware archaeological assistant”, Computer Applications and Quantitative Methods in
Archaeology, Online:
http://www.cs.ukc.ac.uk/research/infosys/mobicomp/Fieldwork/Papers/CAA97/
ERFldwk.html
[SASE+] SASE+ website, Online: http://sase.cs.umass.edu/
[Schilit, 1994] B. Schilit, M. Theimer (1994), “Disseminating active map information to mobile
hosts”, IEEE Network 8(5): pp. 22-32, 1994, Online:
ftp://ftp.parc.xerox.com/pub/schilit/AMS.ps.Z
[sysbench] sysbench GitHub repository, Online: https://github.com/akopytov/sysbench
[Trident-ML] Trident-ML GitHub repository, Online:
https://github.com/pmerienne/trident-ml
[Verizon-5G] Verizon – What is 5G, Online: https://www.verizon.com/about/our-
company/5g/what-5g

63
[Want, 1992] R. Want, A. Hopper, V. Falcao, J. Gibbons (1992), “The Active Badge location
system”, ACM Transactions on Information Systems 10(1): pp. 91-102. January 1992,
Online: http://www.parc.xerox.com/csl/members/want/papers/ab-tois-jan92.pdf
[Ward, 1997] A. Ward, A. Jones, A. Hopper (1997), “A new location technique for the active
office”, IEEE Personal Communications 4(5): pp. 42-47, October 1997, Online:
http://www.it.kth.se/edu/Ph.D/LocationAware/ftp.orl.co.uk:/pub/docs/ORL/tr.97.
10.pdf

![[MS-CEPM]: Microsoft Complex Event Processing Engine … · 2018-05-24 · Microsoft Complex Event Processing Engine Manageability Protocol](https://img.dokumen.tips/doc/110x75/5f0c5fd17e708231d43515ba/ms-cepm-microsoft-complex-event-processing-engine-2018-05-24-microsoft-complex.jpg)