Embed Size (px)
Citation preview

Complex and fractionated electrograms; origin and location
The heart cell
The heart consists of cells (cardiomyocytes) with a length of approximately 100 μm
and a width and thickness of 20 μm. Adult cardiomyocytes are unable to proliferate, if they
die due to heart disease, they will not be replaced. Instead, collagen deposition is usually
initiated to maintain rigidity of the heart. To compensate for reduced cardiac function during
heart failure, cell size may increase (hypertrophy) (figure 1).
The cell membrane of cardiomyocytes consists of a lipid bi-layer which contains ion
channels that are responsible for the depolarizing and repolarizing currents flowing into and
out of the cells. Ion channels consist of complex proteins that form pores (channels) across the
lipid bi-layer. Differences in ion concentrations inside and outside the cell result in a voltage
gradient across the membrane of about - 90 mV (inside negative compared to outside). If the
membrane potential is increased to - 60 mV an action potential is generated. Ion channels are
not static, but gradually open and close. They differ with respect to ion selectivity, that is the
type of ions they allow to pass, and gating, the conditions that influence their opening and
closing. For voltage-gated channels, the probability of being open is controlled by the
membrane potential. Ligand-gated channels are controlled by the binding of a molecule
(ligand) to the channel protein, whereas for stress-activated channels opening is controlled by
a mechanical force applied to the channel.
Voltage-gated ion channels play a major role for the generation of an action potential
under normal conditions. They have specialized charged protein domains, called voltage
sensors, which are sensitive to changes in the membrane potential. Changes above a certain
threshold value exert sufficient electrical force on these domains to encourage the channel to
close or open. Most important voltage-gated ion channels for the cardiac cell are the sodium
(Na+), calcium (Ca
++) channels for depolarization and various potassium (K
+) channels for
repolarization. Sodium and calcium channels give rise to an inward current, while potassium
channels are responsible for outward current that bring the membrane potential back to its
resting value (figure 2). The sodium channels generate, after opening at a membrane potential
of -60 mV, the upstroke of the action potential. They close very quickly after the upstroke, but
then calcium channels have already opened and maintain the membrane potential around 0 V,
the plateau phase of the action potential. Potassium channels are then opened to initiate an
outward current that brings the membrane potential back to its resting value of -90 mV.
Interestingly there is one potassium channel that generates (for a short time) a repolarizing
current (ITo) immediately after the upstroke. Activation of this ITo channel results in a notch of
the action potential,
Coupling between cardiomyocytes
Cardiomyocytes are embedded in a collagen matrix that gives the heart its rigidity and
allows distribution of the cardiac contractility. Contraction of the cells is heralded by
electrical activity that starts in the sinus node and propagates via the atria, AV node and
bundle branches to ventricular myocardium. To allow propagation of the action potential,
cardiomyocytes are electrically coupled by connexins. Connexins are channel proteins that
allow ions and small molecules to pass from a cell to its neighbors. Various connexins are
present in the heart, each with different biophysical characteristics. In the ventricle
connexin43 (Cx43) is the main connexin, whereas atrial cells are connected by Cx43 and
Cx40. Connexins are located at sites where cells are close together (intercalated disk) (figure
3). In adult cardiomyocytes most of the connexins are present at the intercalated disks at the
long ends of the cells; At side-by-side locations of the cells much less connexins are present.
This difference in connexin distribution results in a difference in current flow, which is

greater in the fiber direction than perpendicular to it. Because of this, conduction velocity is
larger in the fiber direction.
Genesis of the extracellular electrogram
Extracellular electrograms arise because current between cardiomyocytes flows partly
through the membrane into extracellular space. Because extracellular space has resistance, the
current will generate an electrical potential, the extracellular electrogram.
In an activated (depolarized) cell the transmembrane potential of the ventricular
cardiomyocyte is about +20 mV. Adjacent cells, which are at rest, have a membrane potential
of -90 mV. Because the extracellular potential is low, there is a voltage gradient between
activated and non-activated cells of about 110 mV. The shape of the potential change from an
activated to a resting cell is as indicated in figure 4 (similar to the upstroke of the action
potential). This potential change (difference) will generate a current. The current strength is
dependent on the voltage difference between two intracellular points and the resistance
between those points. Mathematically the current is the first derivative of the potential divided
by the resistance. The voltage gradient in figure 4 results in an axial current. The amplitude of
this current is small at the front (site C) and the back (site A) of the activation front (1 yellow
arrow). In contrast, current amplitude is high at the site where the activation front is present
(site B, 4 yellow arrows). This spatial difference in axial current size raises a problem; the
axial current increases from site A to the site B. Because the number of charge carriers per
volume content is constant, current increase must come from current flow through the
membrane. From the point of maximal depolarization (site B) toward the front of the
activation front (site C) the axial current decreases. This means that current must disappear,
which again is only possible through the membrane. Thus we have a transmembrane current
that is inward at the back of the activation front and outward at the front (blue and red arrows
respectively). This is called a current dipole. Current from the dipole is flowing through the
membrane in extracellular space that has resistance and therefore a potential field is generated
in the extracellular space. This potential field can be calculated by simple mathematics. Spach
and coworkers have measured the potential field of a Purkinje strand (figure 5). Calculations
and measurements show that the potential field is positive in front of the activation front and
negative at the back of the activation front. If activation proceeds, this potential field moves.
At a recording site where activation passes, we first observe the positive field of the
approaching wave front. If the activation front is exactly at the recording site, the potential is
zero and if the activation recedes, the potential field becomes negative. At the site where
activation arises, the potential is only negative, whereas the potential is only positive at the
site where activation comes to an end (figure 6).
The amplitude of the extracellular electrogram not only depends on the dipole strength
but also from the distance of the recording point to the bundle. The further away, the smaller
the amplitude. For larger distances, the amplitude of a unipolar electrogram decreases with
the power of two of the distance. Next to a reduction in amplitude the frequency content of
the signal decreases with distance. The downstroke of the electrograms become less sharp
with increasing distance.
The important characteristics of the unipolar electrogram thus are: 1) at a site where
activation is passing, the extracellular electrogram is biphasic; 2) at a site where activation is
arising, the extracellular electrogram is only negative; 3) at a site where activation comes to
an end, the electrogram is positive only. This is the basis of unipolar extracellular signal
morphology in case we are dealing with a simple (1D) myocardial bundle. The heart has,
however, three dimensions as well as fiber orientation, that both may affect electrogram
morphology. Spach et al have recorded electrograms of a 2D sheet of myocardial tissue that
was stimulated in the center. The activation pattern and 3 electrograms are shown in figure 7.

The pattern is elliptically shaped, because activation is faster in the fiber direction than
perpendicular to it. The reason for this is that the electrical coupling is tighter in the fiber
direction because of the abundance of connexins at the long ends of the cells. The authors
observed different configurations for the extracellular electrograms. At site “a” where
activation starts, the electrogram is negative only, compatible with an origin of activation. At
site “b” the electrogram is biphasic consisting of a positive deflection, followed by a negative
one. This is the signal we expect at a site where activation is passing. However, at recording
site “c” activation is passing as well and although a biphasic deflection is recorded, it is
preceded by a small negative one. This initially negative deflection is caused by remote
activation in the fiber direction that in fact runs away from recording site “c”. This activation
front is strong and its negative contribution overrules the positive contribution of the weak
wave front running toward site “c”, at least if this front is at a distance. If this front is close to
site “c” and passes the recording site, the following biphasic deflection is generated.
Activation times
To determine spread of activation, activation times have to be assessed. This
parameter indicates the time myocardial tissue underneath the electrode is activated. There is
a good correlation between the upstroke in the action potential, which marks depolarization of
a cardiomyocyte, and the point of steepest negative deflection in the unipolar extracellular
electrogram. This is even true in ischemic myocardium (figure 8). In a unipolar recording the
different electrode, which is connected to the positive input of an amplifier, is at the recording
site, whereas the negative input is connected with the indifferent electrode, which is far away
from the heart (theoretically at infinity). For a bipolar recording the indifferent electrode is
located close to the different one. If the distance between the electrode terminals is small
(order of magnitude 1 mm) the bipolar electrogram is equal to the first derivative of the
unipolar one (figure 9).
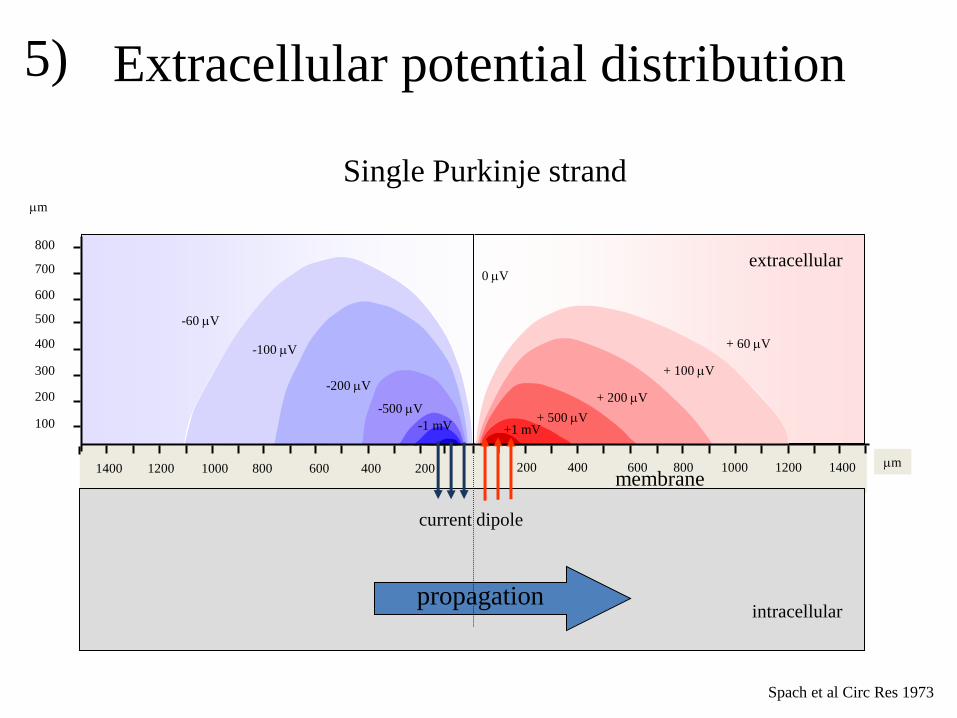
The advantage of a bipolar electrogram is that deflections caused by remote activation
are reduced as to deflections caused by local activation. Disadvantages are the direction
dependence (figure 10) and the interpretation of signal morphology, which is more difficult.
Because of the direction dependence activation time is difficult to assess in a bipolar
electrogram. It should be the positive or negative peak in the electrogram, but never the
beginning of a bipolar electrogram. As with the unipolar electrogram the part of the signal
that marks local activity is preceded and followed by deflections that are remote.
Complex and fractionated electrograms
A major problem of electrograms with multiple deflections, as shown in figure 11, is
selecting the local component (and activation time), the more so because multiple local
components can be present. Several algorithms have been developed in the past to determine
the local component, but all have drawbacks hampering a solid selection. Only if multiple
recordings are present from neighbouring sites, a reliable selection will be possible.
Electrograms may be complex/fractionated because of: 1) remote activation, 2)
changes in conduction velocity, 3) asynchronous conduction in neighbouring myocardial
strands. Remote activation may generate an additional deflection in a “local” electrogram,
because the extensive field of view of the electrode will also pick up the signal of remote
activation. Both the unipolar and bipolar electrogram are subject to remote deflections, but the
effect is greater for unipolar electograms. Remote ventricular activation may cause
deflections in an atrial recording as illustrated in figure 12. The apparently highly fractionated
electrograms in the atrial tracings (MAP) look very wide, but consist of a local (fractionated)
atrial part and a remote ventricular deflection (arrow).

Figure 13 shows that the right superior pulmonary vein (RSPV) is located close to the
superior caval vein (SCV). Therefore, recordings made in the RSPV may pick up signals
generated by activation in the SCV, as illustrated in Figure 14, making a number of
electrograms of the RSPV electrode (LAS 4-5 and 5-6) more complex than they really are.
Deflections indicated by the open arrows are generated by activation in SCV.
Atrial tissue overlays the coronary sinus (CS) and gives rise to double potentials if
electrograms are recorded in the CS (Figure 15). The first deflection is caused by activation
in atrial tissue, whereas the second component is caused by activation in the pericoronary
muscle of the CS. At site 4 coronary sinus and atrium are electrically coupled; the two
deflections are very close together at this site (upper tracing). Separation between the two
components increases towards the distal end of the electrode (direction of LAA).
In infarcted myocardium electrograms usually consist of a remote and a local
component. Figure 16 illustrates epicardial recordings during sinus rhythm over an infarcted
area in an isolated (Langendorff perfused) heart (Durrer 1964). Complexity of electrograms is
caused by the initial Q wave that precedes the local deflection (negative deflection indicated
by red arrow in c3). The local deflection in c3 is indicated by the blue arrow. The simple idea
is that the Q-wave occurs because you are looking at the cavity potential through the infarct
(non-excitable) zone. In fact it is the activation at the subepicardium that runs away from the
recording sites that causes the negative deflection.
Changes in conduction velocity may also cause complex electrograms. Wave front
curvature, tissue discontinuities and fibrillatory conduction may affect the shape of the
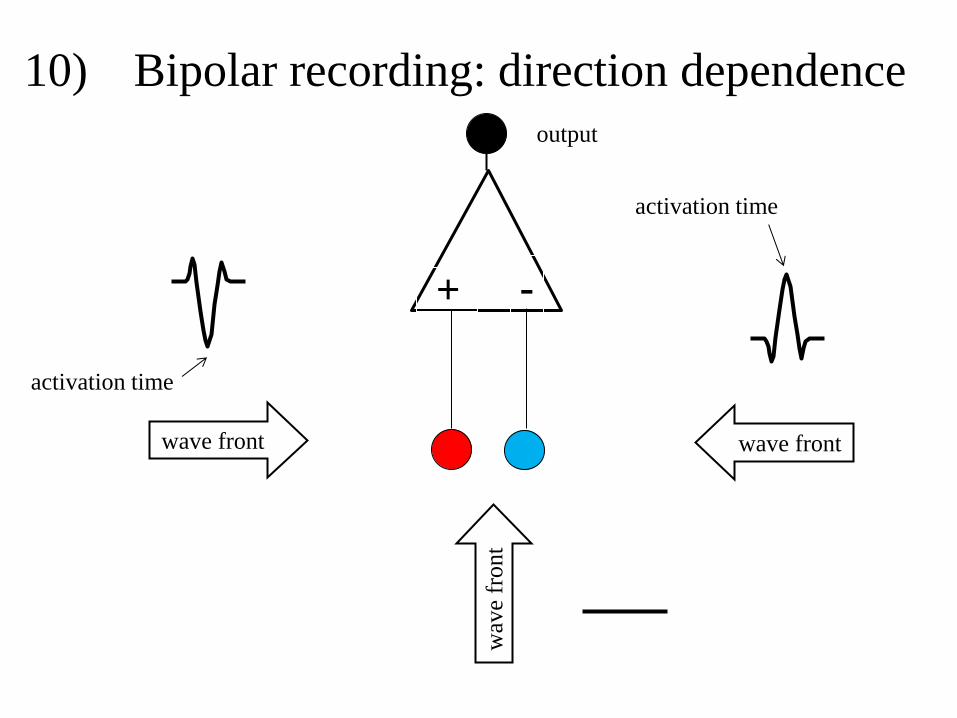
extracellular electrogram. Tissue discontinuities may occur in diseased myocardium where
inexcitable tissue as collagen and fat separates myocardial bundles. In such areas myocardial
bundles with a small diameter may be coupled to bundles with a large width. A cell culture
model that illustrates this aspect with coupled myocardial cells, is illustrated in figure 17.
Myocardial cells are grown on a glass substrate in a star shaped pattern with 8 arms.
Stimulation is applied at the upper arm and recordings are made at the entrance of this arm to
the star centre. During basic stimulation (S1), the extracellular signal (upper tracing) is
biphasic, as expected for a passing wave front. The intracellular recording of the lower tracing
shows, however, a tiny nod in the upstroke. After the premature stimulus (S2), this nod
becomes more prominent. In addition the biphasic (almost positive) deflection in the
extracellular electrogram is followed by a negative deflection now. This is caused by
activation delay at the entrance that is due to the fact that the wave front in the small bundle
must activate the large area of the star center. The premature stimulus generates less current
then the basic one because less sodium channels are available for activation, although more
current is needed at the tissue discontinuity to activate the star centre.
Complexity of extracellular electrograms will also increase in case of fibrillatory
conduction. Activation of the pectinate muscle in the right atrium after stimulation of
Bachmann’s bundle (BB) is illustrated in figure 18 (Berenfeld 2002). At stimulation
frequencies less than 6 Hz the activation pattern is rather smooth and activation delay small
(max 30 ms). Electrograms in both Bachman’s bundle and pectinate muscle (PM) are normal
at these frequencies. If stimulation rate is increased to 8 Hz, activation in BB remains similar,
but in the area of PM activation delay increases to 120 ms. Here, the activation pattern
becomes more complex due to areas of functional conduction block and impaired conduction
and the electrograms become very complex due to the ensuing fibrillatory (heterogeneous)
conduction.
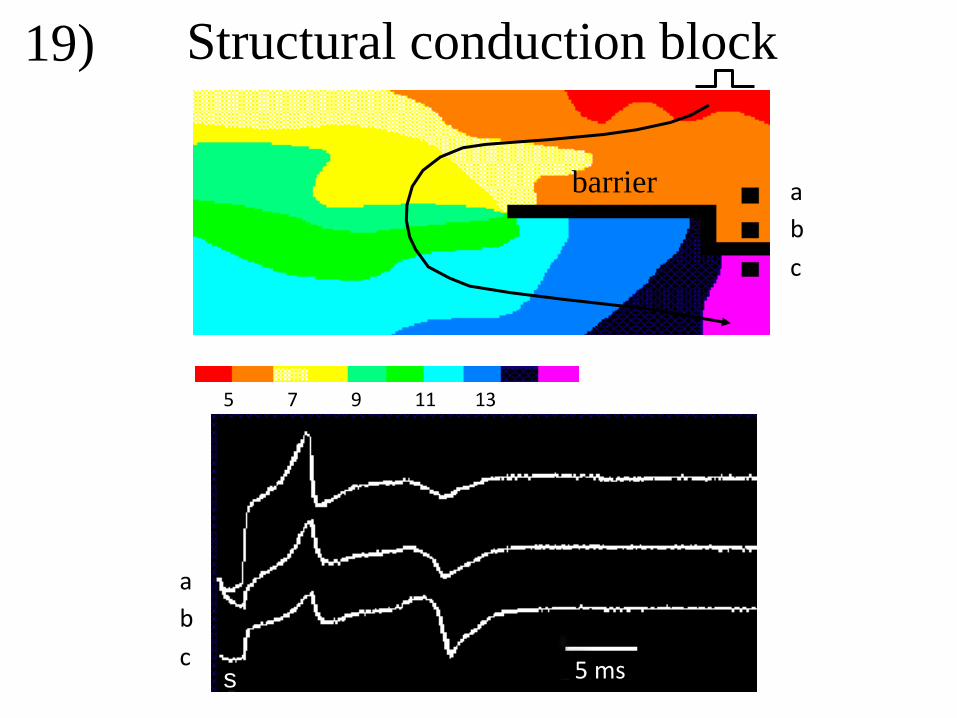
Asynchronous activation is another cause of increased complexity of extracellular
electrograms. Asynchronous activation may be caused by electrical barriers as illustrated in
figure 19 for a superfused epicardial sheet of myocardium. A structural barrier was made by
incising the tissue from the right to the center (black line). Recordings were made at the right

side of the barrier at sites above and below the barrier. The tissue was stimulated at the upper
right. Activation moves toward the barrier and gives rise to initial positive deflections in all 3
electrograms. The signal is positive because this wave front is blocked at the barrier.
Electrograms recorded at site “a” and “b” are local deflections, whereas electrogram at site
“c”, distal from the barrier, is remote. Activation induced by the stimulus also curves around
the edge of the barrier and arrives at the distal side of the barrier (electrode “c”) after about 14
ms. The corresponding (second) deflection in “c” is biphasic, because activation is passing;
the positive part of this deflection is smaller than the negative one because the arriving wave
front virtually starts at the edge of the barrier. Similar deflections are present at the same
instant in the electrograms recorded at the sites “a” and “b”, but these are remote. The
amplitude of the signal is lower the further the electrode is away from the barrier.
The left panel of figure 20 shows activation maps of an epicardial sheet of myocardial
tissue stimulated at the centre at BCL 600 ms (S1 upper panel) and after a (second) premature
stimulus of 320 ms (S3). Activation pattern after the basic stimulus is smooth, without zones
of conduction block. After the premature stimulus, a zone of (functional) conduction block
(black line) arises at the left, 30 to 40 ms after onset of activation. Extracellular electrograms
around the line of block (dashed red line) are illustrated in the right panel. Signals close to the
line of block show double deflections caused by activation on either side of the line. For
electrograms proximal to the line of block, the first deflection is shaper (local activity) than
the second one (remote activity). For electrograms distal from the line of block the second
deflection is the local one and sharper than the first one (Schalij 1988).
Fractionated electrograms arise in areas where myocardial and collagen bundle
intermingle and may happen in infarcted myocardium where myocardial bundles survive
(figure 21). The signal in the lower panel is a bipolar electrogram of which the first deflection
is caused by remote activation and the second deflection by local activation in the surviving
myocardial bundles. The local activation time is difficult to assess because the local deflection
reveals multiple components.
Intermingling of myocardial and collagen bundles is also illustrated in figure 22. The
left panel shows the histology of an infarcted papillary muscle. Red marks collagen, yellow
myocardial tissue. The papillary muscle was superfused in a tissue bath. Recorded, highly
fractionated, extracellular electrograms are shown at the right. Of the selected white area
histology is indicated at different levels in the right panel. Note that separated bundles (like
“d” and “e”) may merge at a certain level (210 μm), while others merge and diverge again
(“f”).
An infarcted area with surviving myocardial bundles is schematically illustrated in
figure 23 showing a number of separated myocardial bundles of which adjacent ones are
interconnected at some sites. Activation that proceeds from “a” to “b” has to follow the
indicated route (black line). An electrogram recorded at the black dot will be fractionated as
indicated at the right lower part of the slide. Fractionation arises because the signal is
composed of deflections generated by (remote) activation in the different bundles (signals at
the right). Only the deflection caused by activation directly underneath the black electrode is
local. Because activation in the different bundles is asynchronous, due to time delay,
deflections are shifted in time. The preparation was stimulated at the left lower corner and
activation has to follow the indicated zig-zag course perpendicular to the fiber direction.
Interestingly, the electrogram at the center becomes smooth if all the bundles are stimulated
simultaneously at the left and activation runs parallel to the fiber direction (figure 24) Again,
the electrogram is the sum of all the deflections generated by activation in the various
bundles, but now deflections occur simultaneously. The sum of these signals is illustrated by
the electrogram at the lower right. It shows a standard biphasic deflection in the ideal case. In

reality, this smooth deflection will not occur, but activation in the fiber direction will give rise
to less fractionation than activation that runs perpendicular to the fibers.
In case multiple bundles are present, local activation is reflected by the deflection
generated by activation in the bundle directly underneath the recording electrode. In case the
surface of the recording electrode covers more than one bundle, multiple local deflections are
in fact present.
Assessing local activation time in a single fractionated electrogram is often difficult.
Figure 25 shows recordings made from an infarcted papillary muscle. An electrode array with
5 electrode terminals was positioned perpendicular to the fiber direction. If only one recording
had been available, it would be difficult to assess the local activation times in the tracings.
Activation times (presumed to be the point of maximal negative dV/dt) in the electrograms
are indicated by coloured dots. All local deflections have (remote) deflections in neighbouring
tracings that occur at exactly the same time (see deflections along the dotted vertical lines).
Note that the amplitude of the remote deflections decrease the further the electrode is away
from the electrode with the local deflection. These observations indicate that the preparation
consists of multiple isolated bundles (right panel) that are, however, coupled at some sites.
The figure also shows that electrode “c” covers 2 bundles, which means that there are two
activation times in tracing “c”.
Thus, depending on the size of the recording electrode and the diameter of myocardial
bundles, multiple (local) activation times can be present. The model of the superfused
infarcted papillary muscle is, however, a rather simple example, because the model is
virtually 2 D and myocardial and collagen bundles run parallel.

The ventricular heart cell
100 μm
healthy
heart failure
1)

Action potential and ion currents
–90 mV
0 mV
+20 mV
Ito
IK1
ICa
IKs
IKr
100 ms
INa
depolarizing current
repolarizing current
2)

Cell 1 Cell 2
Cell 1
Cell 2
- - - -
+ + + + +
Cell-cell coupling
activated at rest
Current flow
Intercalated disk connexins
3)
+ + + + - - - - -

transmembrane current
membrane
+20 mV
-90 mV
A B C
current dipole
propagation
extracellular
intracellular
I
I
I
Generation of transmembrane current 4)
Extracellular potential distribution
Single Purkinje strand
Spach et al Circ Res 1973
200
400
600
800
500
300
100
700
m
200 400 600 800 1000 1200 1400 200 400 600 800 1000 1200 1400 m
-60 V
-200 V
-100 V
-500 V
+ 60 V
+ 200 V
+ 100 V
+ 500 V
0 V
membrane
propagation
-1 mV +1 mV
current dipole
extracellular
intracellular
5)

Unipolar extracellular electrogram
myocardial bundle
propagation potential field
6)

2 4 6 8 10 12 14 16 18 20 ms
1 mm
1 mV
1 mm
Activation in 2D
Spach 1979
a b
c
7)

Activation time Activation time
t = 0 ms
t = 0 ms
ischemia control
intracellular
recordings
extracellular
recordings
50 mV
20 mV
Activation times in unipolar electrograms
200 ms
8)

Activation time in bipolar recording
+-+-
unipolar
bipolar Wave front
+ -
activation time
activation time
9)
+
-
Bipolar recording: direction dependence
activation time
activation time
wave front wave front
wav
e fr
on
t
10)
output

Complex electrograms
Local and remote deflections
11)

III
HRA
MAP bipolar
MAP unipolar
V A
Ventricular complex in atrial recording
ventricular deflection
atrium
12)

RSPV
RMPV
RIPV
LSPV
SCV
Left atrium
Right
atrium
LSPV
RIPV LIPV
RSPV
SCV
ICV
CS
adjacent structures
de Bakker Wittkampf 2012
RSPV - SCV
13)

Sinus Rhythm
SCV
RSPV
20 ms
SCV activity recorded in RSPV
de Bakker Wittkampf 2012
14)

LAA
cs
LA
atrium
coronary sinus
Double potentials in CS
a
cs
1
2
3
4
1 2
3 4
15)

Epicardial unipolar electrogram
Infarcted area
Durrer D Am Heart J 1964
16)
100 µ
Tissue discontinuities
ENDO; Patient: ?, diagnosis: ?, date: 30-03-2000
Q:\D30035.d00: {\it18}
1350...1550 ms 3 mV/s, 1197 mm/s, 0.025 mV/cm [-0.35,0.25 mV]
0.25 mV
140 ms S1 S2
Intracellular recording
Extracellular recording
17)

Fibrillatory conduction Tissue discontinuities in pectinate muscle network in RA
Berenfeld O, Circ Res. 2002;90:1173-1180
0 30 60 90 120 ms 6 Hz 8 Hz
6 Hz 8 Hz
18)
a
b
c
a
b
c
5 7 9 11 13
5 ms s
Structural conduction block
barrier
19)

Double potentials
Schalij M, 1988
20)
10 20 30 50 60 40 70 80 90 100 ms
20
80
30
10
S1
S3

Intermingling myocardial bundles
& collagen fibers
fibrosis
myocardium
1 mV
50 ms
bipolar recording
21)

e
c
d
b
c
e
d
b
c
e
d
b
e
d
b
c
0 μm 70 μm 140 μm 210 μm
200 μm
Infarcted papillary muscle
surviving myocardium
fibrosis
f f f
22)
c
d
e
b
a
b
c
d
e

Fractionated electrogram
fibrosis
myocardium
Asynchronous conduction
a
b
+
23)

electrogram fibrosis
myocardium
Synchronous conduction
activation
front +
24)

Activation times
in fractionated electrograms
fibrosis
a
b
c
d
e ?
?
25)


![Fractionated stereotactic radiosurgery with adaptive dose delivery … · [1] Biau J, Khalil T, Verrelle P, Lemaire JJ. Fractionated radiotherapy and radiosurgery of intracranial](https://img.dokumen.tips/doc/110x75/5f93427b1669d706c03ea228/fractionated-stereotactic-radiosurgery-with-adaptive-dose-delivery-1-biau-j-khalil.jpg)