Embed Size (px)
DESCRIPTION
activated carbon from nut shell
Citation preview

PRODUCTION AND CHARACTERIZATION OF ACTIVATED CARBON FROM HAZELNUT SHELL AND HAZELNUT HUSK
A THESIS SUBMITTED TO THE GRADUATE SCHOOL OF NATURAL AND APPLIED SCIENCES
OF MIDDLE EAST TECHNICAL UNIVERSITY
BY
ÇİĞDEM ÇUHADAR
IN PARTIAL FULFILLMENT OF THE REQUIREMENTS FOR
THE DEGREE OF MASTER OF SCIENCE IN
CHEMICAL ENGINEERING
JUNE 2005

Approval of the Graduate School of Natural and Applied Sciences
Prof. Dr. Canan Özgen
Director
I certify that this thesis satisfies all the requirements as a thesis for the degree of Master of Science.
Prof. Dr. Nurcan Baç Head of Department
This is to certify that we have read this thesis and that in our opinion it is fully adequate, in scope and quality, as a thesis and for the degree of Master of Science.
Prof. Dr. N. Suzan Kıncal Co-Supervisor
Prof. Dr. Hayrettin Yücel
Supervisor
Examining Committee Members
Prof. Dr. Timur Doğu (METU, CHE)
Prof. Dr. Hayrettin Yücel (METU, CHE)
Prof. Dr. N. Suzan Kıncal (METU, CHE)
Dr. Cevdet Öztin (METU, CHE)
Prof. Dr. Zeki Aktaş (AÜ, CHE)

iii
PLAGIARISM
I hereby declare that all information in this document has been obtained and presented in accordance with academic rules and ethical conduct. I also declare that, as required by these rules and conduct, I have fully cited and referenced all material and results that are not original to this work.
Çiğdem ÇUHADAR

iv
ABSTRACT
PRODUCTION AND CHARACTERIZATION OF ACTIVATED CARBON FROM HAZELNUT SHELL AND HAZELNUT HUSK
ÇUHADAR, Çiğdem
M.Sc. Department of Chemical Engineering
Supervisor: Prof. Dr. Hayrettin YÜCEL
Co-Supervisor: Prof. Dr. N. Suzan KINCAL
June 2005, 110 pages
In this study, the pore structures and surface areas of activated carbons
produced from hazelnut shell and hazelnut husk by chemical activation technique
using phosphoric acid (H3PO4), at relatively low temperatures (300, 400 and
500oC), were investigated. Raw materials were impregnated with different H3PO4
solutions of 30%, 40%, 50% and 60% by weight. To produce activated carbon,
acid impregnated samples were heated; at a heating rate of 20 oC/min to the
final carbonization temperature and held at that temperature for 2 hours.
The volume and surface areas of mesopores (2-50 nm) and BET surface areas of
the samples were determined by N2 gas adsorption technique at -195.6oC. The
pore volume and the area of the micropores with diameters less than 2 nm were
determined by CO2 adsorption measurements at 0oC by the application of
Dubinin Radushkevich equation.
v
N2 (BET) surface areas of the hazelnut shell and hazelnut husk based activated
carbons were in the range of 242-596 m2/g and 705-1565 m2/g, respectively.
CO2 (D-R) surface areas of the hazelnut shell and hazelnut husk based activated
carbons were in the range of 433-576 m2/g and 376-724 m2/g, respectively.
The highest BET surface area was obtained as 596 m2/g among hazelnut shell
based samples (HS 60.4; shell impregnated with 60 wt.% H3PO4, carbonized at
400 ºC) and as 1565 m2/g among hazelnut husk based samples (HH 40.4; husk
impregnated with 40 wt.% H3PO4, carbonized at 400 ºC). Hazelnut shell based
activated carbons were mainly microporous while hazelnut husk based ones were
mesoporous.
Keywords: Activated Carbon, Hazelnut Shell, Hazelnut Husk, Pore Structure,
H3PO4 Activation

vi
ÖZ
FINDIK KABUĞU VE FINDIK ÇOTANAĞINDAN AKTİF KARBON
ÜRETİMİ VE KARAKTERİZASYONU
Çuhadar, Çiğdem
Yüksek Lisans, Kimya Mühendisliği Bölümü
Tez Yöneticisi: Prof. Dr. Hayrettin YÜCEL
Ortak Tez Yöneticisi: Prof. Dr. N. Suzan KINCAL
Haziran 2005, 110 sayfa
Bu çalışmada, kimyasal aktivasyon tekniği ile aktive edici madde olarak fosforik
asit (H3PO4) kullanılmak suretiyle oldukça düşük sıcaklıklarda (300, 400 ve
500oC) fındık kabuğu ve fındık çotanağından üretilen aktif karbonların gözenek
yapıları ve yüzey alanları incelenmiştir. Hammaddelere 30%, 40%, 50% ve 60%
ağırlıksal derişimdeki H3PO4 çözeltileri emdirilmiş; asit emdirilmiş örnekler aktif
karbon üretmek için 20oC/dak. ısıtma hızıyla son karbonizasyon sıcaklıklarına
kadar ısıtılıp 2 saat süreyle sabit sıcaklıkta tutulmuştur.
Ürünlerin mezogözenek (2-50 nm) yüzey alanları ve hacimleri ve BET yüzey
alanları -195.6oC de N2 gaz adsorbsiyon tekniği kullanılarak, çapları 2 nm den
küçük olan mikrogözeneklerin gözenek hacmi ve yüzey alanı 0oC de CO2
adsorpsiyon ölçümleriyle Dubinin-Radushkevich denkleminin kullanılmasıyla elde
edilmiştir.

vii
Fındık kabuğu ve fındık çotanağından üretilen aktif karbonların BET yüzey
alanlarının sırasıyla 242-596 m2/g ve 705-1565 m2/g aralıklarda olduğu
ölçülmüştür. Ürünlerin CO2 (D-R) yüzey alanları fındık kabuğundan üretilenler
için 433-576 m2/g ve fındık çotanağından üretilenler için 376-724 m2/g
aralıklarında bulunmuştur.
Fındık kabuğundan üretilen aktif karbonlar içinde en yüksek BET yüzey alanını
HS 60.4 örneği (ağırlıkça 60% asit derişimi ve 400 oC karbonizasyon sıcaklığı)
596 m2/g olarak, fındık çotanağından üretilenler içinde ise HH 40.4 örneği
(ağırlıkça 40% asit derişimi ve 400 oC karbonizasyon sıcaklığı) 1565 m2/g olarak
vermiştir. Fındık kabuğundan üretilen aktif karbonların çoğunlukla
mikrogözenekli, fındık çotanağından üretilen aktif karbonların ise mezogözenekli
oldukları tespit edilmiştir.
Anahtar Kelimeler: Aktif Karbon, Fındık Kabuğu, Fındık Çotanağı, Gözenek Yapısı,
H3PO4 Aktivasyonu

viii
To My Family,
DEDICATION
ix
ACKNOWLEDGEMENTS
I wish to express my deepest gratitude to my thesis supervisors Prof. Dr.
Hayrettin Yücel and Prof. Dr. N. Suzan Kıncal for all their understanding, support
and sound advice in all aspects of my research work. I am very much obliged for
their objective and tolerant attitude, creating very pleasant working conditions.
I should mention, Özge Yazıcıoğlu, Emrah Irmak, Yalçın Yılmaz, Nahide Özkan,
Oluş Özbek, Salih Obut, İsmail Doğan, Açelya Gökalp, Deniz Akkaş, my
laboratory mates Wisam Abdallah and Ural Yağşi, my dear brother Özgür
Çuhadar and many others that I could not mention here, who gave me helpful
suggestions for the improvement of the document and moral support.
I would like to thank Ms. Gülten Orakcı, Ms. Mihrican Açıkgöz, Ms. Kerime
Güney, Mr. Selahattin Uysal, Dr. Necati Özkan and Dr. Kemal Behlülgil for their
help in the chemical and physical analysis of the samples.
Thanks are due to all the staff of the Chemical Engineering Department.
x
TABLE OF CONTENTS
PLAGIARISM ........................................................................................... iii
ABSTRACT.............................................................................................. iv
ÖZ......................................................................................................... vi
DEDICATION..........................................................................................viii
ACKNOWLEDGEMENTS ............................................................................. ix
TABLE OF CONTENTS ................................................................................ x
LIST OF TABLES .....................................................................................xiv
LIST OF FIGURES ................................................................................... xv
LIST OF SYMBOLS ................................................................................ xviii
CHAPTER
1. INTRODUCTION.................................................................................... 1
2. ACTIVATED CARBON ............................................................................. 5
2.1. Definition and Properties .................................................................. 5
2.2. Principle of Activation Process........................................................... 7
2.2.1. Raw Materials........................................................................... 7
2.2.2. Production Methods................................................................... 9
xi
2.2.2.1. Chemical Activation........................................................... 10
2.2.2.2. Physical Activation ............................................................ 12
2.3. Physical Structure of Activated Carbon ............................................. 15
2.4. Porosity....................................................................................... 17
2.5. Chemical Properties of Activated Carbon .......................................... 19
3. METHODS USED IN PHYSICAL CHARACTERIZATION OF
ACTIVATED CARBON............................................................................... 22
3.1. General ....................................................................................... 22
3.2. Gas Adsorption Phenomena and Standard Isotherms.......................... 24
3.2.1. The Brunauer, Emmett and Teller (BET) Theory........................... 25
3.2.2. Pore Characterization by Adsorption / Desorption ........................ 27
3.2.3. Characterization of Microporosity............................................... 30
3.3. True Density Determinations .......................................................... 33
4. PREVIOUS WORK ON PREPARATION OF ACTIVATED CARBON .................... 35
4.1. Chemical Activation....................................................................... 36
4.2. Physical Activation ........................................................................ 40
5. EXPERIMENTAL WORK ......................................................................... 44
5.1. Properties and Preparation of Raw Materials...................................... 45
5.1.1. Properties of Raw Materials ...................................................... 45
5.1.2. Preparation of Raw Materials .................................................... 46
5.2. Carbonization Experiments ............................................................. 47
5.2.1. Experimental Set-Up ............................................................... 47
5.2.2. Chemical Activation of Samples................................................. 48

xii
5.3 Characterization of the Products....................................................... 50
5.3.1. Nitrogen Gas Adsorption Measurements ..................................... 51
5.3.2. CO2 Gas Adsorption Measurements............................................ 51
5.3.3. True Density Determinations .................................................... 54
6. RESULTS AND DISCUSSION ................................................................. 55
6.1 Preliminary Experiments ................................................................. 55
6.2. Physical Characterization of the Products.......................................... 57
6.2.1. Results Based on Nitrogen Gas Adsorption.................................. 58
6.2.2. Carbon Dioxide Gas Adsorption Results ...................................... 68
6.2.3. True Density Determinations .................................................... 76
6.3. Chemical Analysis of Products......................................................... 77
6.3.1. Carbon Content ...................................................................... 79
6.3.2. Oxygen and Hydrogen Content ................................................. 79
6.3.3. Nitrogen Content .................................................................... 80
6.3.4. Ash content............................................................................ 81
6.4. TGA of Impregnated Hazelnut Shells and Hazelnut Husks ................... 81
7. CONCLUSIONS ................................................................................... 85
8. RECOMMENDATIONS........................................................................... 87
REFERENCES ......................................................................................... 88
APPENDICES
A. ANALYSIS OF N2 SORPTION DATA ......................................................... 93
A.1. Analysis of Mesopores ................................................................... 93

xiii
A.2. Determination of BET Surface Area.................................................. 98
A.3. Sample Calculation ....................................................................... 99
A.3.1. Calculation of Mesopore Volume and Area .................................. 99
A.3.2. Calculation of BET Surface Area .............................................. 100
B. ANALYSIS OF CO2 ADSORPTION DATA ................................................. 101
B.1. Analysis of Micropores ................................................................. 101
B.2. Sample Calculation ..................................................................... 102
C. ANALYSIS OF HELIUM PYCNOMETER DATA ........................................... 104
D. TABULATED FORM OF CHEMICAL COMPOSITIONS OF
ACTIVATED CARBONS ........................................................................... 106
E. TGA RESULTS................................................................................... 107

xiv
LIST OF TABLES
Table
1.1 Pore Sizes of Activated Carbon....................................................... 3
2.1 Fixed Carbon Contents of Raw Materials Employed in Activated Carbon
Manufacture. ..................................................................................... 8
5.1 Chemical Composition of Raw Materials ......................................... 45
5.2 Impregnation Ratios and Weight Increases of the Raw Materials ....... 47
5.3 Experimental Conditions and Sample Codes for Hazelnut Shell.......... 49
5.4 Experimental Conditions and Sample Codes for Hazelnut Husk.......... 50
6.1 Yield Values (%) of Selected Products and Raw Materials ................. 82
6.2 Material Balance on Activated Carbon Production ............................ 83
D.1 Chemical Compositions of Activated Carbons and Raw Materials ..... 106

xv
LIST OF FIGURES
Figure
2.1 Pore Structure of Activated Carbon (TEM) ........................................ 6
2.2 Schematic Representation of (a) Nongraphitizing and (b) Graphitizing
Structure of Carbon.......................................................................... 15
2.3 Carbon Atom Arrangements in Graphite Crystal .............................. 17
3.1 Micropore, Mesopore and Macropore Regions of Activated Carbon ..... 23
3.2 Schematic Representations of Different Types of Adsorption Isotherm 25
3.3 Types of Adsorption-Desorption Hysteresis Loops............................ 28
3.4 Block-Diagram of the Overall Experimental Approach ...................... 34
5.1 Procedure Followed in Experiments ............................................... 44
5.2 Experimental Set-up................................................................... 48
5.3 Schematic Representation of Surface Analyzer................................ 53
6.1 BET Surface Areas of Hazelnut Shell Based Samples........................ 58
6.2 BET Surface Areas of Hazelnut Shell Based Samples........................ 59
6.3 BJH Mesopore Areas of Hazelnut Shell Based Samples ..................... 60
6.4 Mesopore Volumes of Hazelnut Shell Based Samples ....................... 61
6.5 N2 Adsorption/Desorption Isotherms of Hazelnut Shell Based Carbons 62
6.6 BET Surface Areas of Hazelnut Husk Based Products ....................... 63
6.7 Comparison of BET Surface Areas of HS and HH Based Products ....... 63

xvi
6.8 BET Surface Areas of Hazelnut Husk Samples Impregnated with 60%
H3PO4 solution. ................................................................................ 64
6.9 BET Surface Areas of Hazelnut Husk Samples at Carbonization
Temperature of 400 ºC. .................................................................... 65
6.10 BJH Mesopore Areas of Hazelnut Husk Based Samples ................... 65
6.11 BJH Mesopore Volumes of Hazelnut Husk Based Samples ............... 66
6.12 N2 Adsorption/Desorption Isotherms of 60% H3PO4 Impregnated
Hazelnut Husk Samples..................................................................... 67
6.13 N2 Adsorption/Desorption Isotherms of Hazelnut Husk Samples
Impregnated with 30, 40 and 50% H3PO4 and Carbonized at 400 ºC........ 67
6.14 Micropore Area Values of Hazelnut Shell Based Products ................ 69
6.15 Micropore Volume Values of Hazelnut Shell Based Products ............ 69
6.16 Comparisons of BET, D-R and BJH Results of Hazelnut Shell Based
Products ......................................................................................... 71
6.17 Micropore Area Values of Hazelnut Husk Based Products ................ 72
6.18 Micropore Volume Values of Hazelnut Husk Based Products ............ 73
6.19 Comparisons of BET, D-R and BJH Results for Hazelnut Husk Based
Products ......................................................................................... 74
6.20 Comparison of HH and HS Series in terms of BET, Micro- and
Mesopore Areas. .............................................................................. 75
6.21 True Density Values of the Activated Carbons............................... 77
6.22 Elemental Analysis Results of Activated Carbons and Raw Materials . 78
E.1 TGA Result of 40% H3PO4 Impregnated Hazelnut Shell at 400 ºC .... 107
E.2 TGA Result of 50% H3PO4 Impregnated Hazelnut Shell at 400 ºC .... 108
E.3 TGA Result of 60% H3PO4 Impregnated Hazelnut Shell at 500 ºC .... 108

xvii
E.4 TGA Result of 50% H3PO4 Impregnated Hazelnut Husk at 400 ºC .... 109
E.5 TGA Result of 60% H3PO4 Impregnated Hazelnut Husk at 400 ºC .... 109
E.6 TGA Result of 60% H3PO4 Impregnated Hazelnut Husk at 500 ºC .... 110

xviii
LIST OF SYMBOLS
Am : Cross-sectional area of the adsorbate, nm2
C : A constant in equation 3.1
CSAN2 : Cross sectional area of nitrogen molecule, nm2
Dp : Pore diameter, µm
Ei : Adsorption potential, kJ/mol
∆G : Gibbs free energy change of the reaction, kJ/mol
I : Intercept of the BET plot
K : A constant in equation B.1
M : Adsorbate molecular weight, g/mol
NA : Avagadro’s constant, 6.023*1023 molecules/mol
Pi : Partial pressure of the gas i, atm, Pa, psia, mmHg
P : Pressure, atm, Pa, psia, mmHg
P0 : Saturation pressure, mmHg
q1 : Heat of adsorption of the first layer, kJ/mol
q2 : Heat of adsorption of the second and subsequent layers, kJ/mol
R : The gas constant, 8.314x10⁷erg/mole-K, 8.314x10⁻³ KJ/mole-K
rp : Actual pore radius, mean radius of the liquid meniscus, nm or µm
rK : Kelvin radius, nm
rKAVE : Average Kelvin radius, nm
rPAVE : Average pore radius, nm
S : Slope of the BET plot
SBET : BET surface area, m2/g
Scum : Cumulative pore surface area, m2 /g
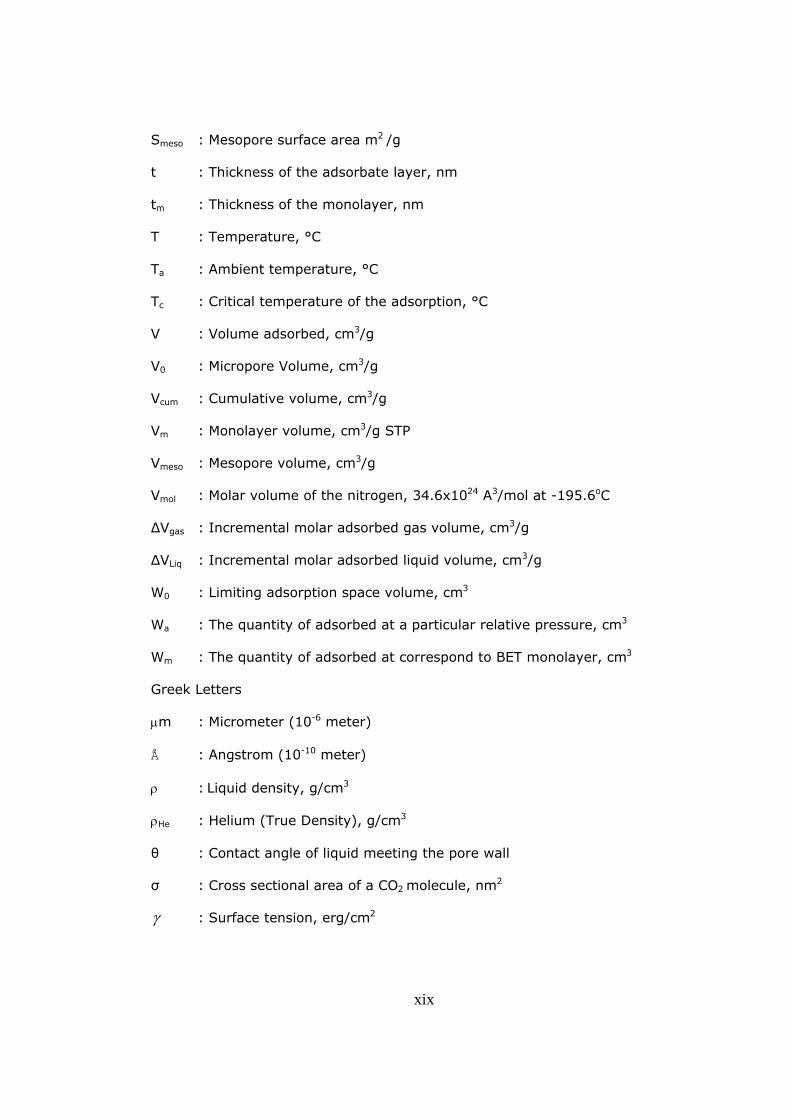
Smeso : Mesopore surface area m2 /g
t : Thickness of the adsorbate layer, nm
tm : Thickness of the monolayer, nm
T : Temperature, °C
Ta : Ambient temperature, °C
Tc : Critical temperature of the adsorption, °C
V : Volume adsorbed, cm3/g
V0 : Micropore Volume, cm3/g
Vcum : Cumulative volume, cm3/g
Vm : Monolayer volume, cm3/g STP
Vmeso : Mesopore volume, cm3/g
Vmol : Molar volume of the nitrogen, 34.6x1024 A3/mol at -195.6oC
∆Vgas : Incremental molar adsorbed gas volume, cm3/g
∆VLiq : Incremental molar adsorbed liquid volume, cm3/g
W0 : Limiting adsorption space volume, cm3
Wa : The quantity of adsorbed at a particular relative pressure, cm3
Wm : The quantity of adsorbed at correspond to BET monolayer, cm3
Greek Letters
µm : Micrometer (10-6 meter)
Å : Angstrom (10-10 meter)
ρ : Liquid density, g/cm3
ρHe : Helium (True Density), g/cm3
θ : Contact angle of liquid meeting the pore wall
σ : Cross sectional area of a CO2 molecule, nm2
γ : Surface tension, erg/cm2
xix
1
CHAPTER I
INTRODUCTION
Activated carbon is a predominantly amorphous solid that has an extraordinarily
large internal surface area and pore volume. These unique characteristics are
responsible for its adsorptive properties, which are exploited in many different
liquid- and gas-phase applications. Through choice of precursor, method of
activation, and control of processing conditions, the adsorptive properties of
products are tailored for applications as diverse as the purification of potable
water and the control of gasoline emissions from motor vehicles.
The structure of activated carbon is best described as a twisted network of
defective carbon layer planes, cross-linked by aliphatic bridging groups. X-ray
diffraction patterns of activated carbon reveal that it is nongraphitic, remaining
amorphous. This property of activated carbon contributes to its most unique
feature, namely, the highly developed and accessible internal pore structure.
Activated carbon is generally considered to exhibit a low affinity for water, which
is an important property with respect to the adsorption of gases in the presence
of moisture. Commercial activated carbon products are produced from organic
materials that are rich in carbon, particularly coal, lignite, wood, nut shells, peat,
pitches, and cokes. (Kirk-Othmer, 2003)
The pyrolysis of starting material with the exclusion of air and without addition of
chemical agent usually results in an inactive material with a specific surface area
of the order of several m2/g and low adsorption capacity. One can prepare a
carbon with a large adsorption capacity by activating the carbonized products
with a reactive gas. The majority of activated carbon used throughout the world

2
is produced by steam activation (physical activation). In this process, the
carbonized product is reacted with steam over 900oC. Another procedure used in
the production of activated carbon involves the use of chemical activating agents
before the carbonization step. The most commonly used activating agents are
phosphoric acid, zinc chloride and salts of sodium and magnesium. Chemical
agents act as dehydration agents and they may restrict the formation of tar
during carbonization. Chemical activation is usually carried out at lower
temperatures than the simple pyrolysis and the activation process with steam or
carbon dioxide. The production at lower temperatures promotes the development
of a porous structure, because under these conditions elementary crystallites of
smaller dimensions are formed. (Smisek and Cerny, 1970)
Most of the available surface area of activated carbon is nonpolar in nature.
However, during production the interaction of surface with oxygen produces
specific active sites giving the surface of slightly polar nature. As a result, carbon
adsorbents tend to be hydrophobic and organophilic. (Ruthven, 1984)
Activated carbon may not be pure carbon but also contain some impurities
depending on the type of starting material. It must be noted that, the adsorption
characteristics of activated carbon for certain uses (such as adsorption of
electrolytes and non-electrolytes from solutions) are significantly influenced by
even small amounts of ash. Moreover, the adsorption of gases is also influenced
by the ash content. Therefore, the raw material should contain as small ash as
possible. On the other hand, the raw material must have relatively low cost
(Balcı, 1992).
To meet the engineering requirements of specific applications, activated carbons
are produced and classified as granular, powdered, or shaped products.
Activated carbon is a recyclable material that can be regenerated. Thus the
economics, especially the market growth, of activated carbon is affected by
industry regeneration capacity. Landfill disposal is becoming more restrictive
environmentally and more costly (Kirk-Othmer, 2003).
3
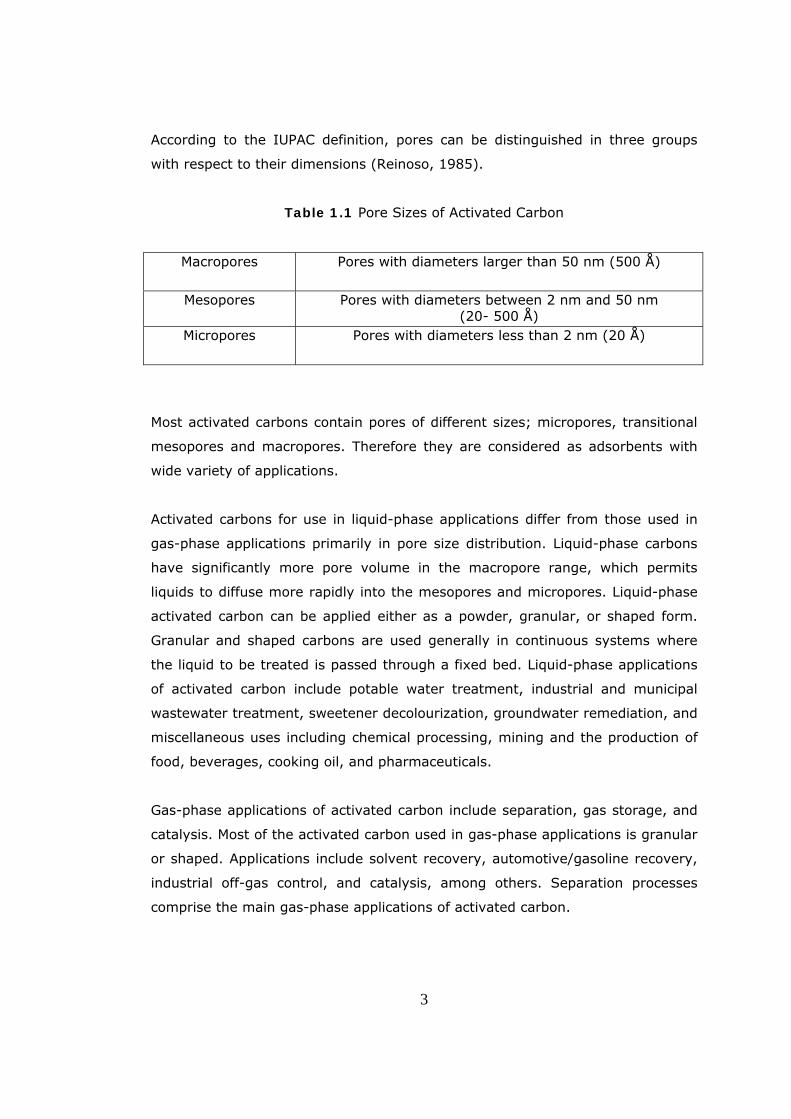
According to the IUPAC definition, pores can be distinguished in three groups
with respect to their dimensions (Reinoso, 1985).
Table 1.1 Pore Sizes of Activated Carbon
Macropores Pores with diameters larger than 50 nm (500 Å)
Mesopores Pores with diameters between 2 nm and 50 nm (20- 500 Å)
Micropores Pores with diameters less than 2 nm (20 Å)
Most activated carbons contain pores of different sizes; micropores, transitional
mesopores and macropores. Therefore they are considered as adsorbents with
wide variety of applications.
Activated carbons for use in liquid-phase applications differ from those used in
gas-phase applications primarily in pore size distribution. Liquid-phase carbons
have significantly more pore volume in the macropore range, which permits
liquids to diffuse more rapidly into the mesopores and micropores. Liquid-phase
activated carbon can be applied either as a powder, granular, or shaped form.
Granular and shaped carbons are used generally in continuous systems where
the liquid to be treated is passed through a fixed bed. Liquid-phase applications
of activated carbon include potable water treatment, industrial and municipal
wastewater treatment, sweetener decolourization, groundwater remediation, and
miscellaneous uses including chemical processing, mining and the production of
food, beverages, cooking oil, and pharmaceuticals.
Gas-phase applications of activated carbon include separation, gas storage, and
catalysis. Most of the activated carbon used in gas-phase applications is granular
or shaped. Applications include solvent recovery, automotive/gasoline recovery,
industrial off-gas control, and catalysis, among others. Separation processes
comprise the main gas-phase applications of activated carbon.

4
Some of the major raw materials used, are agricultural by-products. Although
they have very high volatile content and hence give low yields of activated
carbon, they are relatively inexpensive and economical starting materials. In
Turkey, agricultural by products including hazelnut shell and husk are
abundantly available.
Turkey is the largest hazelnut producer and exporter in the world. It covers
approximately 70 percent and 82 percent of the world’s production and export
respectively. About 60 percent of the crop is produced in the Eastern Black Sea
Region, 15 percent is produced in the Central Black Sea Region and the
remaining 25 percent is produced in the Western Black Sea Region. Turkey's
average in-shell production is 350-400 000 t, this value has reached up to
500 000 t in recent years (Köksal, 2000). Accordingly, 140,000 tons of hazelnut
shell and 110,000 tons of hazelnut husks are obtained as waste. Hazelnut shell is
mainly used for heating purposes in the Black Sea Region but hazelnut husk is
mostly left to decay because of moist climate.
Most of the studies have shown that, activated carbons obtained from
agricultural by-products can be favorably compared with other activated carbons
used in industry with respect to their adsorptive properties (Balcı, 1992).
The objective of this study is to produce activated carbon from agricultural
wastes; hazelnut shell and hazelnut husk by chemical activation using
phosphoric acid and characterize these products in terms of pore volume and
surface area by BET (Braunauer, Emmet, Teller) method, BJH (Barrett, Joyner,
Hallenda) Method, DR (Dubinin, Radushkevich) Method and Helium Pycnometer.
The major novelty of this work is the production of activated carbons from
phosphoric acid impregnated hazelnut shell and hazelnut husk samples by
chemical activation technique in a temperature range of 300oC to 500oC and with
different acid concentrations. The applicability of hazelnut husk for the
production of activated carbon was investigated for the first time in this study.

5
CHAPTER II
ACTIVATED CARBON
2.1. Definition and Properties
Activated carbon is a microcrystalline, nongraphitic form of carbon. X-ray
analysis of activated carbons shows a structure which is much more disordered
than that of graphite, having crystallites only a few layers in thickness and less
than 10 nm in width (Smisek and Cerny, 1970). The spaces between the
crystallites of activated carbon constitute the microporous structure with a large
internal surface area of 250 m2/g-2500 m2/g. Its chemical structure allows it to
preferentially adsorb organic materials and other nonpolar compounds from the
gas or liquid streams. Because of these properties, they have been used for
many decades for the purification of gases, the separation of gas mixtures,
purification of exhausted air, especially the recovery of solvents, removal of
heavy metals, decolourization of solutions and purification of water.
Carbonaceous adsorbents found greater use in the solution of environmental
problems related to water purification and removal of air pollutants (Smisek and
Cerny, 1970; Hassler, 1974).
The removal of impurities from gases and liquids by activated carbon takes place
by adsorption. Adsorption is a term, which describes the existence of a higher
concentration of a substance at the interface between a fluid and a solid than is
present in the fluid. Adsorption process can be considered as either physical
adsorption or chemisorption.

In physical adsorption the impurities are held on the surface of the carbon by
weak van der Waals forces while in chemisorption, the forces are relatively
strong and adsorption occurs at active sites on the surface. Therefore, in
chemisorption the efficiency of carbon will depend upon its accessible surface
area and also upon the presence of active sites on the surface where
chemisorption may occur (Balcı, 1992).
The porous structure and chemical nature of an activated carbon is a function of
the raw materials used in its preparation and the activation method used. This is
the reason why surface area or pore volume of activated carbons can vary widely
from one kind to another. Pore structure of activated carbon (from TEM) is
shown in Figure 2.1.
Figure 2.1 Pore Structure of Activated Carbon (TEM) (Yağşi, 2004)
The internal surface area of activated carbons can be determined by the
adsorption of nitrogen, but there is no guarantee that the entire surface is
available for the adsorption of organic compounds. Since organic molecules are
6

7
much larger than a nitrogen molecule and if the pores are the same size as
molecular dimensions, it is possible to have a sieving action. Thus, it is essential
for an adsorptive carbon to have a large accessible surface area which in turn is
directly related to pore size distribution (Balcı, 1992).
2.2. Principle of Activation Process
During carbonization of a carbonaceous material (i.e., pyrolysis in the absence of
air and without addition of chemical agents), most of the noncarbon elements
(hydrogen, oxygen, traces of sulphur and nitrogen) are first removed in a
gaseous form by pyrolytic decomposition.
The atoms of elementary carbon thus released are grouped into organized
crystallographic formations known as elementary graphitic crystallites. The
mutual arrangements of these crystallites is irregular, so that free interstices
remain between them, and, apparently as the result of deposition and
decomposition of tarry substances, these become filled or blocked by
disorganized carbon. The resulting carbonized product generally has only a small
adsorption capacity. Activation of the carbonized material is possible via two
routes: chemical activation and physical activation (Wigmans, 1989).
2.2.1. Raw Materials
The quality of the resulting activated carbon is considerably influenced by the
raw material. Although the activation procedure employed mainly determines
the chemical nature of the surface oxides and the surface area of the resultant
product, the structure of the pores and the pore size distributions are largely
predetermined by the nature of the starting material. Any cheap substance with
a high carbon and low ash content can be used as a raw material. Raw materials
for the production of activated carbon include number of carbonaceous

8
materials, especially wood, peat, brown coal, bituminous coal, lignite, coconut
shells, almond shells, pits from peaches and other fruit, petroleum-based
residues and pulp mill residues (Balcı, 1992).
Since the manufacturing process involves the removal of volatile matter, the
economic relationship between price, availability and quality of raw materials on
one side and volatile content on the other side, is an important one. The most
important advantages of using bituminous coal and anthracite are their relatively
low volatile content and hence high yield of product.
Fixed carbon contents of some raw materials are given in Table 2.1. On the
other hand, the younger fossil materials-wood, (mainly birch wood and beech
wood) peat and wastes of vegetable origin (such as fruit stones, almond shell,
coconut shell, saw dust) can be activated easily and give high quality products.
(Smisek and Cerny, 1970; Martin, 1981; Holden, 1982)
Table 2.1 Fixed Carbon Contents of Raw Materials Employed in Activated
Carbon Manufacture (Holden, 1982).
Material Percent Carbon Content
Soft Wood 40
Hard Wood 40
Coconut Shell 40
Lignite 60
Bituminous Coal 75
Anthracite 90

9
2.2.2. Production Methods
Activated carbon can be prepared by one of the following two methods:
• Carbonization after addition of substances, which restrict the formation of
tar. In this way, a carbonized product with the properties of a good
activated carbon can be obtained in a single operation. Yet, the activation
agent like ZnCl2, H3PO4, KOH, K2S or KCNS that has to be applied in large
quantities has to be removed via washing in order to reveal the porous
structure and to make the material practically applicable. This route is
generally called “chemical activation.”
• Partial gasification, generally called “physical activation.” The activation
agents most often used are steam, carbon dioxide, and air or a
combination of these. During activation of the intermediate product, the
disorganized carbon (depending on the carbonization procedure, 10-20%
burn-off) is first removed to expose the surface of the elementary
crystallites to the action of the activation agent. The further development
of the porosity on increasing burn-off depends on the mechanism of
carbon removal via active site formation and the relative rate of reaction
in the direction parallel with the plane of the graphitic layers compared to
carbon removal in the direction perpendicular to this plane (Wigmans,
1989).
The basic production processes can be combined in different ways. Sometimes
the chemically activated carbon is subjected to additional activation with gaseous
environment in order to change the pore structure of the final product.
In contemporary technologies both types of activation, chemical and physical are
widely used. Although high quality products can be obtained by both procedures,
sometimes, they are not equally good for all purposes. For example, for the
recovery of solvent, chemically activated carbons are preferred, whereas for
10
water treatment, carbon activated with steam appears to be preferable. (Smisek
and Cerny, 1970)
2.2.2.1. Chemical Activation
In chemical activation the precursor is impregnated with a given chemical agent
and pyrolyzed after that. As a result of the pyrolysis process, a much richer
carbon content material with a much more ordered structure is produced, and
once the chemical agent is eliminated after the heat treatment, the porosity is
highly developed. Several activating agents have been reported for the chemical
activation process: phosphoric acid, zinc chloride and alkaline metal compounds.
Phosphoric acid and zinc chloride are activating agents usually used for the
activation of lignocellulosic materials which have not been previously carbonized;
while, alkaline metal compounds, usually KOH, are used for activation of coal
precursors or chars.
An important advantage of chemical activation is that the process normally takes
place at a lower temperature and for a shorter time than those used in physical
activation. In addition, very high surface area activated carbons can be obtained.
Moreover, the yields of carbon in chemical activation are usually higher than
those in physical activation because the chemical agents used are substances
with dehydrogenation properties that inhibit formation of tar and reduce the
production of other volatile products. On calcinations, the impregnated chemicals
dehydrate the raw materials, which results in changing and aromatization of the
carbon skeleton by the creation of a porous structure and surface area. However,
the general mechanism for the chemical activation is not so well understood as
for the physical activation. Other disadvantages of chemical activation process
are the need of an important washing step because of the incorporation of
impurities coming from the activating agent, which may affect the chemical
properties of the activated carbon, and the corrosiveness of the chemical
activation process (Lozano-Castello, 2001; Balcı, 1992).

11
The material mainly used in the production of activated carbon consists
predominantly of cellulose, and therefore in a discussion of the mechanism of
chemical activation, the action of the chemical agent on cellulose must first be
considered. Cellulose is composed of elongated macromolecules, up to
1800-2000 nm long, orientated in the direction of their longitudinal axes, which
form agglomerates known as micelles. The orientated chains of molecules are
laterally bounded by bonds of different types of strength. The electrolytic action
of the activation agent causes the cellulose to undergo a change known as
swelling, during which the arrangement of the molecules in the direction of the
longitudinal axis remain unchanged, but the lateral bonds are broken down with
the result that the inter-and-intra micelle voids increase until finally the cellulose
is dispersed. Simultaneously other reactions, hydrolytic or oxidative, take place,
by which the macromolecules are gradually depolymerized. The processes lead
to the formation of a homogeneous plastic mass consisting of the partially
depolymerized substance uniformly saturated with the activation agent
(Browning, 1963, Smisek and Cerny, 1970).
An important factor in chemical activation is the degree of impregnation. This
weight ratio of the anhydrous activation agent to the dry materials is defined as
the coefficient of impregnation. The effect of the degree of impregnation on the
porosity of the resulting product is apparent from the fact that the volume of salt
in the carbonized material is equal to the volume of pores, which are freed by its
extraction. For small degrees of impregnation, a small increase in impregnation
amount causes an increase in the total pore volume of the product showing an
increase in the volume of smaller pores. When the degree of impregnation is
further raised, the number of larger diameter pores increases and the volume of
the smallest pores decreases (Balcı, 1992).
The activated carbons produced through chemical activation, especially when
ZnCl2 is used, must be cleaned from the chemical agent before their commercial
use. One advantage of using phosphoric acid in chemical activation is that, it
can be cleaned from the activated carbon by rinsing with boiling pure water
(Yağşi, 2004).

12
2.2.2.2. Physical Activation
a. Carbonization
The method of production of the carbonized intermediate product has a marked
effect on the quality of the final activated carbon product. The main aim of
carbonization is to reduce the volatile content of the source material in order to
convert it to a suitable form for activation. During the phase of the
carbonization, carbon content of the product attains a value of about 80 percent.
By carbonization most of the non-carbon elements, hydrogen and oxygen are
first removed in gaseous form by pyrolytic decomposition of the starting material
and the freed atoms of elementary carbon are grouped into organized
crystallographic formation known as elementary graphitic crystallites (Balcı,
1992).
Carbonization of lignocellulosic material starts above 170oC and it is nearly
completed around 500oC- 600oC. In the production of charcoal, it is desirable to
carry out its pyrolysis sufficiently quickly, in order to reduce the time of contact
of the carbon formed with the decomposition products. The rate of pyrolysis is
significantly influenced by the moisture content of the starting material. Further
important factors are uniform heating of the retort and the temperature of
carbonization, which must not be very high (Yağşi, 2004).
In the simple carbonization product, the mutual arrangement of the crystallites
is irregular, so that free interstices remain between them. However, as a result
of deposition and decomposition of tarry substances, these become filled or at
least blocked by disorganized (amorphous) carbon. The resulting carbonized
product has small adsorption capacity. Presumably, at least for carbonization at
lower temperatures, part of the formed tar remains in the pores between the
crystallites and on their surface. Such carbonized materials can then be partially
activated by removing the tarry products by heating them in a stream of an inert
gas, or by extracting them with a suitable solvent, or by a chemical reaction (for
13
example, heating in an atmosphere of sulphur vapor at temperatures lower than
those at which reactions with carbon take place). (Smisek and Cerny, 1970;
Wigmans, 1985)
b. Activation of Carbonized Intermediate Product with Gaseous Agents
A carbon with a large adsorption capacity can also be produced by activating the
carbonized material under such conditions that the activating agent reacts with
the carbon. The most common activation agents are steam, carbon dioxide and
oxygen (air). The activation step is generally conducted at temperatures
between 800oC and 1100oC. The active oxygen in the activating agent basically
burns away the more reactive portion of the carbon skeleton as carbon monoxide
and carbon dioxide, depending on the gaseous agent employed.
The reaction of carbon with carbon dioxide is endothermic and, for a given
carbon in the absence of a catalyst, takes place at a rate several orders of
magnitude slower than the carbon-oxygen reaction at the same temperature: it
proceeds very slowly at temperatures below 1000 K (727 oC). The endothermic
reaction between carbon and water vapor (steam) is favored by elevated
temperature and reduced pressure and occurs slowly at temperatures below
1200 K. The reactions of carbon with molecular oxygen are favored
thermodynamically at all temperatures up to 4000 K.
Activation takes place in two stages. In the initial stage, when the burn off is not
higher than 10 percent, disorganized carbon is burnt out preferential and the
closed and clogged pores between the crystallites are freed. By the removal of
disorganized carbon, the surface of the elementary crystallites became exposed
to the action of the activation agent. The burning out of the crystallites must
proceed at different rates on different parts of the surface exposed to reaction;
otherwise new pores could not be formed. The removal of nonorganized carbon
and the non-uniform burn out of elementary crystallites leads to the formation of
new pores, and to the development of the macroporous structures. The effect
which becomes increasingly significant is the widening of existing pores, or the

14
formation of larger size pores by the complete burn out of walls between
adjacent micropores.
According to the type of the gaseous activation agent, some difficulties may
arise. Activation with steam and carbon dioxide are carried out at temperatures
between 800 ºC and 1100 ºC. At lower temperatures, reactions are too slow.
However, the temperature must be carefully chosen to make the chemical
reaction between carbon and gaseous agent the rate determining factor. In
kinetics control region, reactions take place at the interior surface of the carbon.
Hence the removing of carbon from the pore walls causes the enlargement of the
pores. However at much higher temperatures reactions become diffusion
controlled and occurs on the outside of the carbon particle (Balcı, 1992).
The reaction of oxygen with carbon is exothermic. Therefore, for the activation of
the carbonized product with oxygen it may be difficult to maintain the correct
temperature in the oven. Possible local overheating prevents uniform activation.
Furthermore, due to the very aggressive action of oxygen, burn out is not limited
to pores but also occur on the external surface of the grain by causing great
loss. It must be noted that, carbons activated with oxygen have a large amount
of surface oxides. Due to the difficulties and disadvantages explained, oxygen
(air) activation is rarely used (Balcı, 1992).
The main factors that influence the rates of the reactions of carbon with carbon
dioxide, steam and oxygen are: i) the concentration of the active sites on the
carbon surface, ii) the crystallinity and structure of the carbon, iii) the presence
of inorganic impurities and iv) the diffusion of reactive gases to the active sites.
Generally, carbonization and activation steps are carried out separately, but
recently there is an increasing tendency to conduct the two processes together.
(Smisek and Cerny, 1970; Hassler, 1974; Wigmans, 1985; Rodriguez-Reinoso,
1991)

2.3. Physical Structure of Activated Carbon
The structure studies of Franklin (1951) on carbonized materials showed two
distinct well defined classes; nongraphitizing carbons and graphitizing carbon.
(Figure 2.2)
In general, the nongraphitizing carbons are formed from substances containing
little hydrogen or more oxygen. Such substances develop a strong system of
cross linking of crystallites on heating at low temperature, forming a porous
mass. The graphitizing carbons are prepared from substances containing more
hydrogen. The crystallites remain relatively mobile during the early stages of
carbonization and cross linking is much weaker. As a result, softer and less
porous carbon is obtained (Balcı, 1992).
Figure 2.2 Schematic Representation of (a) Nongraphitizing and
(b) Graphitizing Structure of Carbon (Smisek and Cerny, 1970)
15

16
Activated carbons, together with other types of chars, form a group of
carbonaceous materials of which the structure and the properties depending on
it are more or less similar to the structure and properties of graphite. Graphite is
composed of layer planes formed by carbon atoms ordered in regular hexagons,
similar to those in the rings of aromatic organic compounds. The interatomic
distance between the carbon atoms in the individual layer planes is 0.142 nm.
The layer planes are in parallel array with an interlayer spacing of 0.335 nm,
shown in Figure 2.3. However, the structure of activated carbon differs
somewhat from that of graphite. During carbonization process, several aromatic
nuclei, having a structure similar to that of graphite are formed. Planar
separation distance in carbon is approximately 0.36 nm. From X-ray
spectrograph, these structures have been interpreted as microcrystallite
consisting of fused hexagonal rings of carbon atoms structurally, carbon can
therefore be considered to consist of rigid interlinked cluster of microcrytallites.
Each microcrystallite comprises a stack of graphite planes (Smisek and Cerny,
1970).
Microcrystallites are interconnected by interaction of functional groups
terminating the graphitic planes. The diameter of the planes forming the
microcrystallites, as well as the stacking height, has been estimated at 2 -5 nm
indicating that each microcrystallite consists of about 5-15 layers of graphite
planes (Wolff, 1959).

Figure 2.3 Carbon Atom Arrangements in Graphite Crystal.
2.4. Porosity
During the process of activation, the spaces between the elementary crystallites
become cleared of various carbonaceous compounds and nonorganized carbon.
Carbon is also removed partially from the graphitic layers of the elementary
crystallites. The resulting voids are termed as pores. Results seem to indicate
that, there are pores with a contracted entrance (ink-bottle shaped), pores in the
shape of capillaries open at both ends or with one end closed, pores in the shape
of more or less regular slits between two planes, v-shaped, tapered pores, and
other forms (Smisek and Cerny, 1970).
17

18
In most cases, it is difficult to determine the pore shapes reliably. However, the
calculation of diameters of pores assuming cylindrical capillary shapes yields
values which approach the actual dimensions of the pores. Activated carbon
usually has pores belonging to several groups, each group having a certain
range of values for the effective dimensions.
Pores of an effective diameter larger than about 50 nm, are classified as
macropores. Their volume in the activated carbon is generally between
0.2 cm3/g and 0.5 cm3/g and their surface area is 0.5 m2/g to 2 m2/g.
Transitional pores are those in which capillary condensation with the formation of
a meniscus of the liquefied adsorbate can take place. This phenomenon usually
produces a hysteresis loop on the adsorption isotherm. The effective diameters
of transitional pores are in the range of 2 nm to 50 nm. Their specific surface
area is generally around 5 % of the total surface area of the activated carbon.
Pores with an effective diameter of less than about 2 nm are called micropores.
The micropore volume is generally around 0.15 cm3/g to 0.50 cm3/g. Usually the
specific surface area of micropores amounts to over 90 % of the total specific
surface area. Each of these three groups of pores has its specific function in the
process of adsorption on activated carbon. According to the type of application,
the percentages of the transitional pores and the micropores could be adjusted
employing special production procedures. (Gregg and Sing, 1967; Smisek and
Cerny, 1970; Rodriguez Reinoso, 1989; Balcı, 1992).
The suitability of active carbon for a particular application depends on the ratio in
which pores of different sizes are present. Thus, for the adsorption of vapors and
gases from mixtures in which they are present in small concentrations, markedly
microporous active carbons are the most suitable. But active carbons used for
the recovery of vapors of industrial organic solvents from waste gases and
removal of heavy metals from solutions should contain a certain fraction of
transitional pores (Smisek and Cerny, 1970).

19
2.5. Chemical Properties of Activated Carbon
The adsorptive properties of activated carbon are determined not only by its
pore structure but also by its chemical composition. The decisive component of
the adsorption forces on a highly ordered carbonaceous surface is the dispersion
component of the van der Waals forces. Disturbances in the elementary
microcrystalline structure as, for example, by the presence of imperfect graphitic
layers in the crystallites, obviously change the arrangement of the electron
clouds in the carbon skeleton. As a result incompletely saturated valences or
unpaired electrons appear, and this influences the adsorptive properties of the
active carbon, especially for polar substances.
Activated carbon contains two types of admixtures. One of them is represented
by chemically bonded elements, in the first place oxygen and hydrogen. These
are derived from the starting material and remain in the structure of activated
carbon as a result of imperfect carbonization or become chemically bonded to
the surface during activation. The other type of admixture consists of ash, which
is not an organic part of the product. The ash content and its composition vary
widely with the kind of active carbon. In adsorption of electrolytes and
non-electrolytes from solutions, the adsorption characteristics of active carbon
are significantly influenced even by small amounts of ash (Smisek and Cerny,
1970).
The elemental composition of activated carbon typically comprises 85-90 % C,
0.5 % H, 0.5 % N, 5 % O, and 1 % S, the balance of 5-6 % representing
inorganic (ash) constituents. However, these values can not serve as
specification for activated carbon's quality or properties (Faust and Aly, 1983).
Surface areas generated by the more reactive edges of the microcrystallite
contain a wide variety of functional groups and are accordingly quite
heterogeneous in nature. The nature of the relevant functional groups is
determined to a large extent by the method of activation as well as by the type

20
of raw material from which the activated carbon is produced (Cookson, 1980;
Wigmans, 1985).
The oxygen content of starting material has a considerable influence on the
arrangement and size of the elementary crystallites formed in carbonaceous
adsorbents. In adsorbents prepared from materials of high oxygen content, the
distance between the parallel graphitic layers is appreciably smaller. Moreover,
the course of carbonization and the required carbonization temperature depend
strongly on the oxygen content of raw material. On the other hand, if oxidizing
gases possess the oxygen, this oxygen also be chemisorbed and bound as
surface oxides on the edge of the layer planes. The presence of chemisorbed
oxygen on the surface of activated carbon has important effects on its capacity
to adsorb water vapor and other polar adsorbate vapors. The oxygen content of
activated carbon ranges between 1 % and 25 % and has been shown to vary
considerably with the activation temperatures. The oxygen content generally
decreases with an increase in the activation temperature (Balcı, 1992).
Carbons activated at lower temperatures, 200oC-500oC, termed as L-carbons,
generally will develop acidic surface oxides. The acidic surface oxides could
mainly include phenolic hydroxyl groups. The carbons activated by chemical
treatment in aqueous solutions with such oxidizing agents as chloride,
permanganate, persulfate, hydrogen peroxide and nitric acid, develop the same
characteristics as L-carbon. The carbons activated at higher temperatures,
800oC–1000oC, termed as H-carbons, will develop basic surface oxides.
Adsorption of electrolytes is affected by the presence of basic or acidic surface
oxides. The presence of surface oxygen complexes will also impart a polar
character to the activated carbon surface, which should result in preferential
adsorption of comparatively polar organic compounds (Balcı, 1992).
Materials prior to activation contain hydrogen in the form of hydrocarbon chains
and rings attached to border atoms of the hexagon planes. Most of this hydrogen
is removed during activation at temperatures below 950oC, but some hydrogen
is still held after activation and is not released unless much higher temperatures
are reached. It is to be noted that, the evolution of this latter portion of
21
hydrogen at very high temperatures is paralleled by a simultaneous decrease in
adsorptive power. Hydrogen is more strongly chemisorbed than oxygen. Infrared
studies showed that hydrogen was present in aromatic and aliphatic form. The
aromatic hydrogen was suggested to be bonded covalently to the carbon atoms
at the periphery of the aromatic basal planes. The aliphatic hydrogen was
suggested to be present in the form of aliphatic chains and alicyclic rings
attached to the peripheral aromatic rings. In addition to hydrogen and oxygen,
calcined sulphur, nitrogen, chlorine and other elements can also be present in
active carbon (Balcı, 1992).

22
CHAPTER III
METHODS USED IN PHYSICAL CHARACTERIZATION OF
ACTIVATED CARBON
3.1. General
Conventional classification of pores according to their diameters, originally
proposed by Dubinin and now officially adopted by the International Union of
Pure and Applied Chemistry, (IUPAC) is mostly used. (This classification is given
in Table 1.1 in Chapter I.)
Table 1.1 Pore Sizes of Activated Carbon
Macropores Pores with diameters larger than 50 nm (500 Å)
Mesopores Pores with diameters between 2 nm and 50 nm (20- 500 Å)
Micropores Pores with diameters less than 2 nm (20 Å)
There are numerous techniques and methods for the characterization of pore
structure of activated carbon. Since the size of the pores vary in a wide range,
(e.g. macro, meso, micro) there is not single technique to provide information in

all ranges of pores. Therefore, in most cases a combination of different methods
are used. For the quantitative characterization of the pore structures; estimation
of pore surface area, pore volume, and pore size distribution together with the
true and apparent density determinations are needed. For this purpose; the
adsorption of gases and vapors by standard gravimetric or volumetric techniques
helium pycnometry and mercury porosimetry are still classical and convenient
approaches to the general characterization of porosity in activated carbon.
Complementary techniques, such as, small angle scattering (X-rays or
Neutrons), transmission electron microscopy, etc. are also used for the
characterization of pores. (Şenel, 1994)
Figure 3.1 Micropore, Mesopore and Macropore Regions of Activated Carbon
Figure 3.1 shows micro, meso and macropore regions of activated carbon. In the
following sections of this chapter, the main theory and methods involved in these
characterization tests are given.
23

24
3.2. Gas Adsorption Phenomena and Standard Isotherms
When a gas (adsorbate) is confined in a closed space in the presence of an
outgassed solid (adsorbent), an adsorption process begins. The gas molecules
are transferred and accumulated on and in the solid material as a result of the
forces between the solid surface and the adsorbate. Physical adsorption includes
attractive dispersion forces, repulsive forces, at very short distances well as the
contribution from the polarization and electrostatic forces between the
permanent electric moment and the electric field of the solid. The amount
adsorbed on a solid surface will depend upon the temperature, pressure and the
interaction potential between the vapor and the surface. Therefore, at some
equilibrium pressure and temperature, a plot of weight of gas adsorbed per unit
weight of adsorbent versus relative pressure (P/P0) is referred as the sorption
isotherm of a particular vapor-solid interface.
Brunauer et al. (1940), based upon an extensive literature survey, found that
most of the adsorption isotherms fit into one of the five types shown in
Figure 3.2. Type I isotherm indicates a microporous adsorbent. Type II
isotherms are most frequently encountered when adsorption occurs on
nonporous powders or on powders with pore diameters larger than micropores.
The inflection point of the isotherm usually occurs near the completion of the
first adsorbed monolayer and with increasing relative pressure, second and
higher layers are completed until at saturation the number of adsorbed layers
becomes infinite.
Type III isotherms are observed when the adsorbate interaction with an
adsorbed layer is greater than the interaction with the adsorbent surface. Type
IV isotherms occur on porous adsorbents possessing pores mainly in the
mesopore range. The slope increases at higher pressures as it is true for the
Type II, the knee generally occurs near the completion of the first monolayer.
Type V isotherms result from small adsorbate-adsorbent interaction potentials
similar to the Type III isotherms. However, they are also associated with the
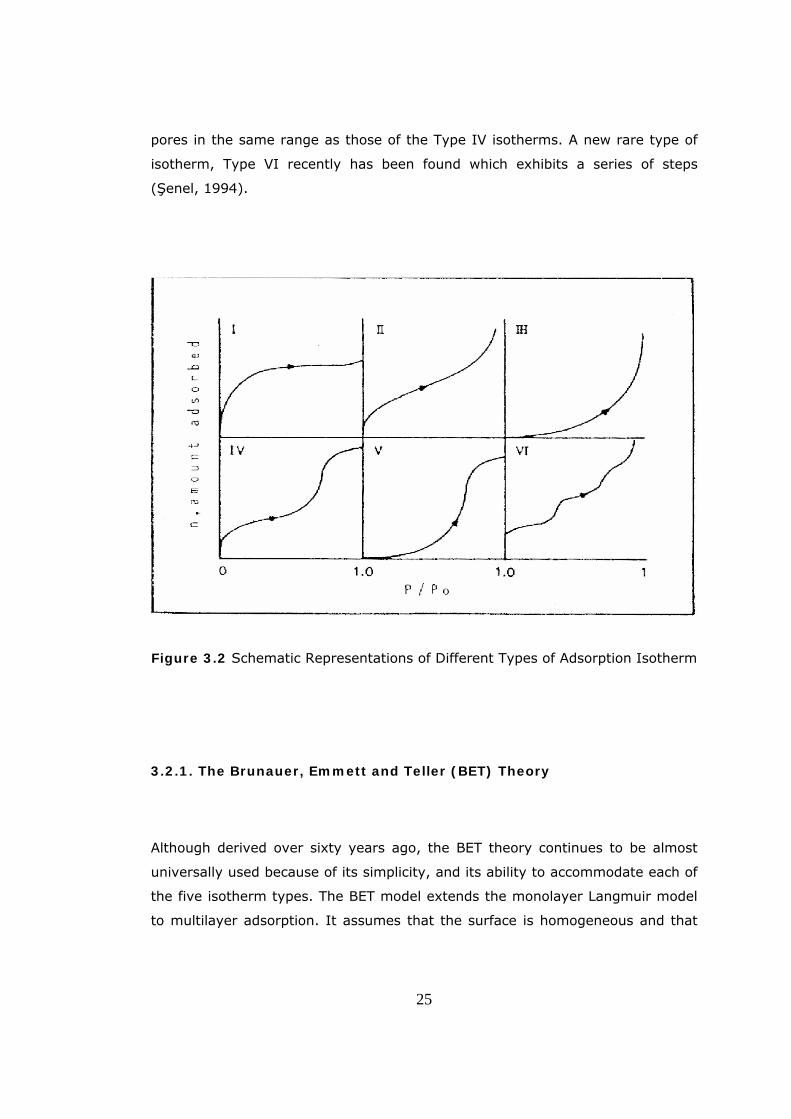
pores in the same range as those of the Type IV isotherms. A new rare type of
isotherm, Type VI recently has been found which exhibits a series of steps
(Şenel, 1994).
Figure 3.2 Schematic Representations of Different Types of Adsorption Isotherm
3.2.1. The Brunauer, Emmett and Teller (BET) Theory
Although derived over sixty years ago, the BET theory continues to be almost
universally used because of its simplicity, and its ability to accommodate each of
the five isotherm types. The BET model extends the monolayer Langmuir model
to multilayer adsorption. It assumes that the surface is homogeneous and that
25

the different layers of molecules do not interact. Each adsorbed molecule in the
monolayer is assumed to be adsorption site for second layer of molecules, and
so on as the relative pressure increases, until bulk condensation occurs.
In the region of relative pressures near the completion of monolayer, the BET
theory and experimental isotherms do agree very well leading to a powerful and
extremely useful method for the estimation of surface areas of various materials
including activated carbon, coal and coal chars. In the final form it is given as;
[ ]PPVPO − =
CV m
1+
Om PP
CVC 1−
(3.1)
where; 'V" and 'Vm" are the volume adsorbed, at the relative equilibrium
pressure P/Po, and the monolayer capacity respectively, "C" is a constant, which
is related exponentially to the heat of adsorption at the first and subsequent
layers by the equation:
(3.2) ( )[ RTqqC /exp 21 −= ]
where; "q1" is the heat of adsorption of the first layer, "q2", is the heat of
adsorption of the second and subsequent layers. The determination of surface
areas from the BET theory is a straightforward application of equation (3.1). A
plot of P/V(P-Po) versus P/Po, will yield a straight line usually in the range of
0.05 < P/Po < 0.35. The slope "S" and the intercept of "I" of a BET plot will give
[ ]
CVCS
m
1−= and CV
Im
1= (3.3)
Solving the preceding equations for "Vm" and "C" gives;
IS
V m +=1
and ISC 1+= (3.4)
26
The BET equation usually gives a good representation of the frequently
appearing Type II and IV isotherms within the range of
relative pressures 0.05-0.3, and this range is generally used in practice for
measurement of the surface area. At higher relative pressures, the BET equation
is usually inaccurate because of capillary condensation effect, while at P/Po
values below about 0.05, the amount of adsorbed gas is too small to be
measured with sufficient accuracy. A poorer description is obtained for the type
I, III and V isotherms, but in practice, they too are often analyzed by the BET
method. In order to calculate the surface area, it is necessary to know the mean
cross-sectional area Am occupied by one molecule of adsorbate gas. The specific
surface area is calculated from the equation,
mol
mAmBET
VANVS = (3.5)
in which; "Vm" is volume of monolayer, "NA" is the Avagadro's constant and Vmol
is the molar volume of the gas. The cross-sectional area of any adsorbed gas
molecule can be estimated from the density of the condensed phase of the gas.
For surface area determinations, nitrogen as being the ideal adsorbate, exhibits
the unusual property that on almost all surfaces its "C" value is sufficiently small
to prevent localized adsorption and yet adequately large to prevent the adsorbed
layer from behaving as a two dimensional gas. Thus, the unique properties of
nitrogen have led to its acceptance as a universal, standard adsorbate with an
assigned cross sectional area of 0.162 nm2 at its boiling point of -195.6oC
(Şenel, 1994). Using BET it is possible to measure pores down to 10 Å.
3.2.2. Pore Characterization by Adsorption / Desorption
Another way to get information on the porous texture of the adsorbent is to look
at the shape of the desorption isotherm. It is commonly found for porous solids
27

that the adsorption and desorption branches are not coincident over the whole
pressure range. At relative pressures above 0.3, De Boer (1958) has identified
five types of hysteresis loops, which are correlated with various pore shapes;
Figure 3.3 shows idealization of the four types of hysteresis (Gregg and Sing,
1982).
Figure 3.3 Types of Adsorption-Desorption Hysteresis Loops
Type I hysteresis is often associated with capillary condensation in open-ended
cylindrical-shaped pores. The formation of a cylindrical meniscus occurs at a
higher P/Po than the emptying process, which proceeds through the evaporation
from a hemispherical meniscus. Type II corresponds to spheroidal cavities or
voids as well as to "ink- bottle" pores. The liquid trapped in the body of the pore
until P/Po is reduced to allow evaporation from the neck; therefore, the release
of condensate is limited by the neck radius. Type III hysteresis exhibits no
limiting adsorption at P/Po = 1 and is indicative of slit shaped pores. Type IV
hysteresis is associated with Type I isotherms, that is with microporous
28

adsorbents. The hysteresis part of the isotherms contains information about the
mesopores. There is a relationship between shape and position of the isotherm
and the pore geometry, due to condensation and evaporation phenomena. These
can be described by Kelvin's capillary condensation equation (Gregg and Sing,
1967) as;
29
] [ o
molP
PPRTCosVr
/ln2 θσ−
= (3.6)
where, "rp" is the mean radius of the liquid meniscus, “σ” is the surface tension,
"R" is the gas constant ,"T" is the absolute temperature, "(θ)" is the angle of
contact between the condensed phase and the surface of the solid. In finding the
pore radius by the Kelvin equation it is necessary to take into consideration the
thickness "t" of the adsorbate layer. Then, the actual pore radius "rp" is given by,
trr kp += (3.7)
The term "rk" indicates the radius into which condensation occurs at the required
relative pressure. This radius, called the Kelvin radius or the critical radius, is not
the actual pore radius since some adsorption has already occurred on the pore
wall prior to condensation, leaving a center core or radius, rk. Alternatively,
during desorption, an adsorbed film remains on the pore wall when evaporation
of the center core takes place. Halsey (1948) set up a useful analytical
expression for the thickness of the layer “t” as a function of the relative
pressure,
( )
3/1
/ln5
⎥⎦
⎤⎢⎣
⎡=
om
PPtt (3.8)
Here, "tm" is the thickness of the monolayer. Thus, replacing equation (3.6) and
(3.8) into (3.7) for nitrogen as the adsorbate at its normal boiling point of
-195.6oC, with "tm" as 0.354 nm, the equation:

( )PPr
OP
/log15.4
=( )⎥⎦
⎤⎢⎣
⎡+
PP O /log303.2554.3 (3.9)
is obtained. Here, a closely packed hexagonal liquid structure is assumed for the
nitrogen molecules. The question of whether or not the adsorption or desorption
branch is better suited for calculation of the mesopore size has not yet been
answered definitely. For a symmetrical pore geometry, calculation of the size
distribution of the mesopores from the adsorption or desorption data permits a
simple determination of the mesopore surface area. The gas volumes adsorbed
or desorbed upon a change of the relative pressure are taken from the
isotherms, and Equation (3.9) is used to calculate the corresponding mesopore
radius. Assuming certain pore geometry, the contribution to the surface area
from the pores of various sizes can be found from the pore radius distribution.
Stepwise computational methods for finding the pore radius distribution and the
mesopore surface area and volume are described by several investigators
(Orr, 1959; Broekhoff, 1970). One computational method (BJH), proposed by
Barrett, Joyner and Halenda (1951), is frequently used in practice. Derivations of
the related equations are given in Appendix A. 1.
3.2.3. Characterization of Microporosity
Adsorption on microporous solids is not very well understood in comparison with
that on non-porous or mesoporous solids. Pore sizes of similar order of
magnitude as the sizes of the adsorbate molecules lead neither to the
progressive completion of a monolayer nor to multilayer adsorption but to the
filling up of the micropore volume with the adsorbate in a liquid-like condition. A
major development in understanding adsorption of gases and vapors on
microporous carbons was provided by the potential theory of adsorption of
Polanyi (1932).
30

Potential theory assumes that at the adsorbent surface the molecules of gases
are compressed by attractive forces acting between the surface and the
molecules and these forces of attraction decrease with increasing distance from
the surface. Polanyi described the adsorption space as a series of equipotential
surfaces, each with the adsorption potential Ei, and each enclosing a volume Wi.
As one moves away from the surface the values of adsorption potential decrease
until it falls to zero and the adsorption space increases up to a limiting
value Wo (zero potential). At the surface, W=O and Ei=Emax. The building up of
the volume enclosed within the adsorption space may be described by the
function of the type E = f(W).
Polanyi assumed that since dispersion and electrostatic forces are independent of
temperature, the adsorption potential at constant volume filling is also
temperature independent. This means that the curve E = f(W) should be the
same for a given gas and a given adsorbent at all temperatures. This relationship
between "E" and “W” is called the characteristic curve. Polanyi expressed the
adsorption potential for volume filling as the amount of work necessary to
compress the adsorbate from its equilibrium vapor pressure P1 to the
compressed adsorbate pressure, P2.
∫ ==2
1 1
2lnP
P PPRTdP
PRTE (3.10)
Thus, "E" is equal to the ∆G "equivalent free energy change". The state of the
compressed adsorbate in the adsorption space depends on the temperature.
Polanyi distinguished three different cases. (i) when the temperature is well
below the critical temperature of the adsorbate, Tc, the adsorbed vapor may be
considered as liquid-like. (ii) when the temperature is just below the TC most of
the adsorbate will be as liquid like but also the adsorbate may be as compressed
gas. (iii) when the temperature is above the Tc, the adsorbate will be as
compressed gas. The first case is, by far, the most common one. Therefore the
adsorption potential will take the form in Equation 3.11.
31

PPRTE Oln= (3.11)
In this equation it is assumed that the liquefied adsorbate is incompressible and
has the normal density of the liquid at the given adsorption temperature, then it
is possible to obtain the volume filled adsorption space by Equation 3.12.
molnVnMW ==ρ (3.12)
where, "n" is the amount adsorbed in moles, "M" is the molecular weight of the
adsorbate and "ρ" is the liquid density. The temperature-invariance of the
adsorption potential which is the fundamental postulate of the Polanyi's theory,
has been demonstrated (1966), mainly by Dubinin and co-workers and they
have added a second postulate. They stated that for an identical degree of filling
of the volume of adsorption space, the ratio of adsorption potentials for any two
vapors is constant which is called the affinity coefficient, "β". Dubinin's treatment
has been modified by Kaganer to yield a method for calculation of specific
surface from the isotherm. Using the experimental data and assuming that pore
size distribution is Gaussian, Dubinin and Radushkevich, arrived at an expression
which is known as "Dubinin Radushkevich", (D-R) equation;
⎟⎠⎞
⎜⎝⎛−=
PPDWW O
O2logloglog (3.13)
where D is 2.303 K (RT / β )2. A plot of log W against log (Po/P) will be a straight
line having an intercept equal to micropore volume, "Wo". Dubinin and Astakhov,
assuming a Weibull distribution of pore sizes, rather than a Gaussian, obtained
the following "Dubinin - Astakhov, (D-A)" equation;
⎟⎠⎞
⎜⎝⎛−=
PPDWW On
O logloglog ' (3.14)
32
33
where D'= 2.303(n-1) (RT/E)n. It follows from the equation (3.14), that "DR"
equation is a special case of "D-A" equation (3.13), when n=2 (Şenel, 1994).
3.3. True Density Determinations
True density of a porous solid is defined as the ratio of the mass to the volume
occupied by that mass. Therefore, contribution to the volume made by pores or
internal voids must be excluded when measuring the true density. To determine
the true density of a solid, one needs to have a non interacting fluid which
completely fills all the pores. In reality, no fluid completely fills the pore volume
of activated carbons. Therefore, the term, true density should be treated in this
way.
Helium is the smallest molecule available with an atomic diameter of 1.7Å.
Therefore, it has the best chance of penetrating the entire porosity of activated
carbon.
Figure 3.4 depicts a block-diagram of the overall experimental approach. The
physical characterization of activated carbon samples were characterized
according to this scheme.

34
N2 ADS./DES. (-195.6oC)
CO2 ADS./DES. (0oC)
BJH (KELVIN HALSEY EQN'S)
D-R EQ'N MICROPORES
Dp<2 nm
MESOPORES 50 nm>Dp>2 nm
SURFACE AREA
BET
TRUE DENSITY He PYCNOMETER
Figure 3.4 Block-Diagram of the Overall Experimental Approach

35
CHAPTER IV
PREVIOUS WORK ON PREPARATION OF ACTIVATED CARBON
Activated carbon is one of the most commonly used adsorbents in many different
liquid- and gas-phase applications in the industry for its adsorptive properties. In
this study, production of activated carbon from hazelnut shell and hazelnut husk
and the quality of the products have been investigated.
As lignocellulosic materials are heated in an inert atmosphere, they decompose
to various pyrolysis products. Depending on their volatility, these products can
be grouped into three classes; chars, gases and tars. Char is a carbon-rich
nonvolatile solid residue, usually constituting approximately 15-20 percent yield.
Gas phase products include all lower molecular weight products (CO, CO2, CH4,
H2, etc.) including water. Usually gas phase products constitute 20-25 percent of
the total products of pyrolysis. Tars are any of several high molecular weight
products that are volatile at carbonization temperatures but condense onto any
surface near room temperature. Tar comprises approximately 60-65 percent of
the products (Schwenker and Pascu, 1957; Roberts, 1970; Agrawal and Mc
Cluskey 1983). Any one of the pyrolysis products could be the most desirable
product. Most commercial scale pyrolysis plants are designed to have only one
class as the principal product with at least one of the other classes serving as a
fuel source. For manufacture of activated carbon, the char is the desirable
product.
Pyrolysis of lignocellulosic materials such as shells or stones of fruits etc. is
extremely complex. The major components, lignin, cellulose and hemicellulose
mainly react independently and the pyrolysis of the lignocellulosic materials is
the result of hundreds of cocurrent and consecutive reactions. In order to

36
investigate mechanism of pyrolysis, it is better to study pyrolysis of each
component separately. Cellulose is the major components of plant cells and
hemicelluloses have approximately the similar molecular structure with cellulose.
So investigation of cellulose pyrolysis mechanism gives an idea about the
pyrolysis of lignin and hemicellulose (Balci, 1992).
Pyrolysis of pure cellulose has been widely studied. During heating in an inert
atmosphere, molecular bonds will be broken. Since C-O bonds are weaker than
the C-C bonds the principal candidates for scission are the 1,4 C-O-C glucosidic
and the 1,5 C-O-C acetal linkages in the cellulose macromolecule. The breakage
of 1,4 glucosidic bonds results in depolymerization of cellulose and is responsible
for the formation of tars. As discussed by Agrawal (1988 a,b) the breakage of
1,5 acetal bonds leads to ring opening and results in formation of gases and
chars.
The influence of the experimental conditions such as temperature, heating rate,
residence time at high temperature can be interpreted in terms of competition
between these two types of cellulose degradation. At temperatures below about
300oC, the ring opening reaction is favored over depolymerization. Higher
heating rates cause temperatures favorable to depolymerization to be reached
more quickly, and hence give higher tar yield. Trace amount of impurities are
thought to catalyze the ring opening reactions. (Agrawal and Mc Cluskey, 1983)
The production of activated carbon is a typical gas-solid reaction. The adsorptive
capacities of activated carbon are mainly associated with its internal pore
properties such as pore surface area, pore volume and pore size distribution,
which develop during the activation of chars (Balcı, 1992).
4.1. Chemical Activation
Aygün et al. (2003) produced activated carbon from almond shell, hazelnut shell,
walnut shell and apricot stone through chemical activation using ZnCl2 (30wt. %)

37
as the activating agent. Highest surface area of activated carbons from the
almond shell, hazelnut shell and walnut shell were found with 10 h activation at
750 °C but for apricot stones it was obtained with 18 h activation at 800 °C.
Activated carbon from the hazelnut shells had the highest surface area (793
m2/g) and iodine number (965 mg/g). Iodine molecule gives information on the
surface area contributed by pores larger than 10 Å. The order of suitability of
raw materials for activated carbon production was established as hazelnut shell >
walnut shell ≈ apricot stone > almond shell.
Lozano-Castello et al. (2001) produced activated carbons from Spanish
anthracite by using KOH. In this study the activation agent/coal ratio was found
to be the most important parameter in a chemical activation process. As
activation agent/coal ratio increases micropore volume and surface area
increases reaching a maximum ratio of 4:1 giving micropore volume of 1.45 cc/g
and a BET surface area of 3290 m2/g. The higher the temperature and the time
of pyrolysis, the higher the micropore volume. In other words, the lower the
heating rate during the pyrolysis process, the higher the microporosity
development. Also, it was concluded that an acid washing after carbonization
could be avoided because the results were not very different from those obtained
with water washing. In a next study they used NaOH to produce activated
carbon from Spanish anthracite. Nitrogen flow and the activating agent/coal ratio
were found to be the most important parameters to achieve the best
development of porosity. The highest result was obtained for 960 ml/min
nitrogen flow rate and activating agent/coal ratio of 3:1 at 730 °C as BET surface
area of 2669 m2/g, V-DR N2 as 1.04 cc/g and V-DR CO2 as 0.64 cc/g. It was
concluded that physical mixing of NaOH and coal rendered the best results.
Balcı et al. (1994) carbonized ammonium chloride-impregnated and untreated
almond shell and hazelnut shell samples in a flow of nitrogen at relatively low
temperatures. It was observed that, chemical activation carried out at 350oC
gave products with surface area values above 500 m2/g. However, the surface
area values observed for the products obtained from untreated raw materials
were about half of this value. It was also observed that, the surface area of
38
products obtained from NH4Cl-impregnated samples reached values of over
700 m2/g when the carbonization temperature was increased to 700oC.
Girgis et al. (1998) carbonized phosphoric acid impregnated apricot stones at
300, 400 and 500oC. For impregnation, a ratio of acid volume: weight of raw
precursor of 1.5/1 was employed and it was observed that, as the temperature
increased the BET surface area increased from 700 m2/g up to 1400 m2/g. In
this study, they used 20%, 30%, 40% and 50% phosphoric acid by weight. The
highest BET surface area was obtained from the sample which was impregnated
with 30% phosphoric acid and carbonized at 500oC.
Girgis et al. (2002) obtained activated carbon from date pits by using phosphoric
acid. The raw material was impregnated with increasing concentrations of H3PO4
(30-70 wt. %) followed by pyrolysis at 300, 500 or 700 oC. Carbons obtained at
300 oC were very poorly porous, although with high capacity for the uptake of
probe molecules from solution. Carbons obtained at 500 and 700 oC were found
to be good to excellent adsorbents. The best porosity development was found at
700 oC with 50 wt. % H3PO4 impregnated sample having 945 m2/g of BET
surface area.
Demirbaş et al. (2002) studied the removal of Ni(II) from aqueous solution by
adsorption onto hazelnut shell activated carbon. Activated carbons were obtained
by impregnation of the raw material with concentrated H2SO4 and activation in a
hot air oven at 150 oC for 24 h. Activated carbons used in the batch mode
adsorption studies had a BET surface area of 441 m2/g. It was suggested that
adsorption data of hazelnut shell based activated carbons fitted best to the
Langmuir adsorption isotherm. Adsorption increased with increasing
temperature, pH and agitation speed, and decreasing particle size.
Cimino et al. (2000) studied on removal of toxic cations and Cr(VI) from
aqueous solution by hazelnut shell as biosorbent substrate. Activated hazelnut
shells were prepared by using H2SO4 as the activating agent and drying in an air
oven at 40 oC for 2 h. Hazelnut shell showed a good efficiency in removing from
aqueous solution toxic ions such as three and hexavalent chromium, cadmium

39
and zinc. Based on the Langmuir isotherm model, at pHadj 4.0 for Cd2+, Cr3+ and
Zn2+ ions the maximum sorption capacities were 5.42, 3.08 and 1.78 g Kg -1,
respectively. For hexavalent chromium removal pH interval is 2.5-3.5 and the
maximum sorption capacity at pHadj 2.0 is 17.7 g Kg –1.
Toles et al. (1997) prepared activated carbon from almond and pecan shells,
which were hard, lignocellulosic precursors for the production of granular
activated carbon (GACs) in order to create carbons for the adsorption of both
organic compounds and metals. They activated samples either chemically, with
H3PO4, or physically, with CO2, under a variety of conditions followed by
oxidation at 300 ºC for 4 hours. Chemically produced activated carbons had BET
surface areas between 955-1267 m2/g while surface areas of physically produced
activated carbons were in the range of 104-485 m2/g. Total yield was obtained
as 33-41% for chemical activation and 7-22 for physical activation of the raw
materials.
Bevla et al. (1984 a,b) produced activated carbon from almond shells through
chemical activation. Among several activating agents (H3PO4, ZnCl2, K2CO3 and
Na2CO3), ZnCl2 activation gave the best products with high adsorption capacities.
Raw material particle size, activation time and impregnation ratio were studied,
showing the impregnation ratio to be the most effective variable in increasing
the adsorptive power of the products up to 2111 m2/g. It was observed that,
activating reagent recovery and adsorptive capacity increased as the raw
material particle size decreased. A maximum adsorption capacity had been
observed at 500 oC.
Hu et al. (2001) prepared activated carbons from ZnCl2 impregnated coconut
shells by pyrolysis under nitrogen flow until temperature reached 800 oC, and
then switching the gas flow to carbon dioxide. Activating agent/shell ratio (w/w)
was between 0.25 and 3. The BET surface area increased with increasing ratio of
ZnCl2 to shell from 0.25 to 2 and reached a maximum of 2450 m2/g. It was
indicated that as the activating agent/shell ratio was higher than 2, many
micropores were enlarged to mesopores. Also, CO2 flow resulted in larger
mesopore and total pore volumes especially for long-time activated samples.

40
Ahmedna et al. (2000) produced activated carbon from rice straw, rice hulls,
sugarcane bagasse and pecan shells. Rice straw, rice hulls and sugarcane
bagasse based activated carbons were obtained by activating with a mixture of
nitrogen and carbon dioxide at 900 oC after the pyrolysis at 750 oC. Pecan shell
based activated carbons were produced by both physical and chemical activation
methods. In chemical activation of pecan shells 25% and 50% H3PO4 solutions
were used as activating agent. Carbonization of pecan shells was performed at
450 oC under the flow of nitrogen, air or a mixture of both. Chemically activated
pecan shells found to have higher surface area values (1200 m2/g) than
physically activated ones. Also, sugarcane bagasse showed a better potential
than rice straw or rice hulls as precursor of granular activated carbons with the
desirable properties of a sugar decolorizing carbon.
4.2. Physical Activation
Solano et al. (1980) produced activated carbon from direct activation of almond
shells with CO2 or air, or by activation after carbonization under nitrogen
atmosphere. It was observed that, direct activation with carbon dioxide in the
temperature range of 750oC and 900oC gave activated carbons with similar or
larger surface area and micropore volumes than those obtained by carbonization
followed by activation. The products obtained by the activation of air in the
temperature range from 300 to 400oC, did not show large surface areas. It was
also observed that, at low temperatures direct activation with air developed
meso and macroporosity to a larger extent than the activation which was
preceded by carbonization. However, the reverse case was observed for the high
temperature products. The products had surface areas ranging from 150 m2/g to
about 2000 m2/ g for different degrees of burn off and types of production.
Toles et al. (2000) prepared a series of steam or CO2 activated carbons made
from almond shells using six different activation or activation/oxidation methods.
They compared the carbons to each other and to two commercial carbons in an
effort to ascertain the relative value of the carbons in terms of yield, surface

41
area, attrition, surface functional groups, organic uptake, metal uptake, as well
as estimated cost of production. Of the six methods investigated, the method
that produced the best overall performing almond shell carbon and least
expensive carbon in terms of production cost was the “Air-Activation” method.
This method involved the simultaneous activation and oxidation of almond shells
under an air atmosphere.
Arol et al. (2002) tested activated carbons made of hazelnut shells, apricot and
peach stones to determine their suitability for gold metallurgy. The raw materials
were carbonized under a flow of nitrogen at 650 oC and then activated with
steam at 800 or 900 oC. Peach stone was found to result in hardest carbon and
hazelnut shell the weakest. In terms of BET surface area, peach stones had the
largest surface area of 923 m2/g followed by apricot stones (850 m2/g) and
hazelnut shells (825 m2/g). It was concluded that active carbons produced from
apricot and peach stone can be employed in the recovery of gold from gold
cyanide bearing solutions.
Rodriguez-Reinoso et al. (1982) prepared activated carbons from almond shells
by means of carbonization in a flow of nitrogen at 750-900 oC, followed by
activation in a flow of carbon dioxide at 650-800 oC. Activation with carbon
dioxide led to the appearance of micropores and to a considerable increase in
surface area. The highest BET surface area (adsorption at 77 K) was obtained as
1597 m2/g for the material carbonized at 850 oC and activated at 825 oC for 24 h
with 5 oC/min heating rate.
Yun et al. (2001) investigated the pre-carbonization effect on the porosity
development in activated carbons. Two types of activated carbons were
manufactured from rice straws, by the one-stage and two-stage processes,
respectively. Carbonization was performed at 700, 800 and 900 oC under
nitrogen flow and samples were activated at the same temperatures in CO2 for
3 h. In pre-carbonization step the raw material was heated until the temperature
reached 900 oC under nitrogen flow and kept at that temperature for 1 h. It was
found that the inclusion of pre-carbonization process contributed to the
formation of activated carbons with higher values of the BET surface area and

42
microporosity than those of activated carbons without pre-carbonization. It was
found that 800 oC, 3 h were the optimum activation conditions within the
experimental range, resulting in (790 m2/g).
Wartelle et al. (2000) used macadamia nut shells, hazelnut shells and black
walnut shells as the precursors for activated carbon production. Carbonization of
raw materials was done at 700-750 oC under nitrogen flow. Activation was
performed at 800 oC in a mixture of CO2-N2 or at 850 oC with steam. BET surface
areas of the products were found as 583, 572 and 829 m2/g for macadamia nut
shells, hazelnut shells and black walnut shells, respectively. A gas
chromatographic analysis revealed that macadamia nut shell granular activated
carbons seem to be an excellent adsorbent for polar and non-polar compounds
from C3 and C6-C10 tested.
Reinoso et al. (1985) prepared activated carbons from plum and peach stones by
carbonization followed by carbon dioxide activation with activation time ranging
from 8 hours to 16 hours. The adsorption of N2, CO2, i-butane, paranitrophenol
and methylene blue had been studied to investigate the microporosity. N2
adsorption studies gave the micropore volumes ranging from 0.27 cm3/g to
0.77 cm3/g for products from plum stones and 0.23 cm3/g to 0.38 cm3/g for
those obtained from peach stones for various production methods and
conditions. Porosimeter results showed that, macro and meso porosities were
more developed in carbons prepared from plum stones. Direct activation led to
development of these two ranges of porosity, especially macro porosity to larger
extents.
Sanchez et al. (2001) prepared three series of activated carbons from Quercus
agrifolia wood using a two-step process, carbonization followed by physical
activation with CO2. They characterized samples by N2 and CO2 adsorption. They
used three activation temperatures, 800, 840 and 880oC, covering the
18-85 wt % yield range by variation of residence time. They obtained activated
carbons with a well-developed porous structure, predominantly microporous with
high BET surface areas. They found no direct relationship between exposed BET
surface areas (the surface where activation reaction takes place), evolution and

43
gasification rate variation. They produced activated carbons with BET surface
areas in the range of 400-1200 m2/g.
Baçaoui et al. (2001) prepared a series of activated carbons from olive-waste
cakes by physical activation with steam. They carried out adsorption of
N2 (-195.6oC), CO2 (0oC) and mercury porosimetry experiments to determine the
characteristics of all carbons prepared. They found experimental response
varying between: 13–27% for the total yield, 115–490 mg/g for the adsorption
of methylene blue, 741–1495 mg/g for the adsorption of iodine, 514–1271 m2/g
for the BET surface area, 0.225–0.377 cm3/g for the micropore volume,
0.217-0.557 cm3/g for the volume of pores with a diameter greater than 3.7 nm
and 31.3–132 m2/g for the external surface area. They exploited the results
obtained using response surface methodology. They represented these
responses and studied in all experimental regions of activation time and
activation temperature, the most influential factors in activated carbon
preparation. They obtained the optimal activated carbon when using 68 min as
activation time and 822oC as activation temperature.

CHAPTER V
EXPERIMENTAL WORK
The main aim of this study was to produce activated carbon from agricultural
wastes; hazelnut shell and hazelnut husk and to characterize these products.
Chemical activation method was applied by using phosphoric acid as the
activating agent. A summary of the experimental procedure is shown in Figure
5.1.
44
Figure 5.1 Procedure Followed in Experiments
CCrruusshhiinngg
CCoooolliinngg
DDrryyiinngg
PPrroodduucctt
IImmpprreeggnnaattiioonn CCaarrbboonniizzaattiioonn
SSiieevviinngg
DDrryyiinngg
CCrruusshhiinngg
RRaaww MMaatteerriiaall
WWaasshhiinngg WWiitthh DDiissttiilllleedd WWaatteerr

5.1. Properties and Preparation of Raw Materials
5.1.1. Properties of Raw Materials
Hazelnut shells and hazelnut husks used throughout the experiments were
obtained from Trabzon and Giresun, respectively.
Elemental analysis of raw materials and activated carbons were carried out using
a “Leco CHN Elemental Analyzer”. Ash contents of the products were determined
by Thermogravimetric Analyzer (TGA) and ash contents of the raw materials
were determined by following TS 6879 (Turkish Standards Institution (TSE)).
The chemical compositions of raw materials are given in Table 5.1. Ash content
of raw hazelnut shell is surprisingly low compared to the husk. Also, in the
literature raw materials generally have ash content of 3-5 %. This low ash
content might be a specific property for hazelnut shell. Aygün et al. and
Balci et al. also reported ash content of hazelnut shell as 0.49% and 1.33%,
respectively.
Table 5.1 Chemical Composition of Raw Materials
Raw materials C%
(wt.)
H%
(wt.)
N%
(wt.)
O %( wt.)
(by difference)
Ash%
(wt.)
Hazelnut Shell 49.4 6.3 0.3 43.6 0.4
Hazelnut Husk 42.7 5.2 0.9 45.4 5.8
45

46
5.1.2. Preparation of Raw Materials
Raw materials were dried at room temperature. Hazelnut shells were crushed by
a home blender and hazelnut husks were ground by a laboratory type grinding
machine. The resulting particles were sieved and the hazelnut shell particles
having sizes 12-18 mesh (1-1.7 mm) and hazelnut husk particles having
sizes 20-50 mesh (0.3-0.8 mm) were used in the rest of the experimental work.
In the literature particle sizes of raw materials used in activated carbon
production is generally in the range of 0.2-2 mm. The choice of using smaller
particle size for hazelnut husks is because of heterogeneous physical structure of
the material. To have uniform size of hazelnut husk, grinding was required.
Through the experiments the effect of activating agent concentration was
investigated. So, raw materials with the desired particle sizes were treated with
60%, 50%, 40% and 30% (wt.) H3PO4 solutions separately at 25oC for 24 hours.
As a proportion, in the impregnation of hazelnut shells 1 g. shell was mixed with
2 ml acid solution while 1 g. of hazelnut husk was mixed with 5 ml of acid
solution. The reason for choosing these amounts of acid volumes was to obtain
homogenous mixtures of raw materials and acid solutions, and allow all particles
contact with the acid.
After impregnation, solution was filtered to remove the residual acid.
Subsequently, the impregnated samples were air dried at room temperature for
3 days. The ratio of weight of dried samples (impregnated) to the weight of raw
material before the impregnation step indicates the weight increase. After this
procedure, the dried samples were ready for the carbonization experiments. In
Table 5.2, the impregnation ratios and weight increases of the raw materials are
given.

47
Table 5.2 Impregnation Ratios and Weight Increases of the Raw Materials
Raw material
H3PO4 conc. (wt. %)
Impregnation ratio (acid : raw material)
(w : w)
Weight inc.
% 30 2.32 21 40 2.50 23 50 2.66 35
Hazelnut Shell (2 ml acid: 1 g
shell) 60 2.82 40 30 5.80 133 40 6.25 212 50 6.65 275
Hazelnut Husk (5 ml acid: 1 g
husk) 60 7.05 348
5.2. Carbonization Experiments
5.2.1. Experimental Set-Up
Carbonization experiments were carried out in a horizontal “Lenton Unit C2”
furnace. To ensure the inert atmosphere in the furnace by N2 gas flow, a 20 mm
inside (24 mm outside) diameter quartz tube of 90 cm length was placed
horizontally into the furnace. The inlet and the outlet of quartz tube were
connected with quartz fittings, to avoid the escape of N2 from the system and to
avoid the entrance of air to the system.
To measure the N2 flow rate passing through the system a N2 flow meter was
connected to inlet of furnace. A bubbler in a cooling bath was used at the outlet
of the system to cool the outlet gases and to indicate the N2 flow by bubbling.
After cooling, the outlet gases were purged to the hood by a heat resistant hose.
Experimental set up used in the experiments is shown in Figure 5.2.

valve
48
Figure 5.2 Experimental Set-up
5.2.2. Chemical Activation of Samples
In this study, the effect of activating agent concentration and carbonization
temperature, on the properties of the products was investigated. For this
purpose, raw materials, impregnated with 30%, 40%, 50% and 60% (wt.) H3PO4
solutions were carbonized for 2 hours at carbonization temperatures of 300, 400,
and 500 ºC.
Activation of phosphoric acid impregnated raw materials was carried out by
carbonizing the materials under nitrogen flow (200 cc/min or 64 cm/min) at a
heating rate of 20oC/min. In the literature high nitrogen velocities (30 cm/min)
were recommended. A faster removal of the gases evolved during carbonization
process favors the creation of micropores or, in other words, a lower
concentration of these gases produces higher micropore development
N2
samplequartz
flowmeter furnacecooling bath
hood

49
(Lozano-Castello, 2001). Samples were placed in the furnace and the N2 flow
started to purge the air in the quartz tube, and continued for 30 minutes. After
purging, the furnace was started to heat till the chosen carbonization
temperature was achieved, and the temperature was kept constant by the
temperature controller of the furnace. Carbonization time was measured from
the point when the selected temperature was reached. After 2 hours of
carbonization time, the furnace was cooled using a hair dryer. Lastly, when the
temperature of furnace decreased down to 100oC, product was taken to a flask
and distilled water was added to prevent interaction with the air. Experimental
conditions and samples codes are given in Table 5.3 and Table 5.4 for hazelnut
shell and hazelnut husk, respectively.
Table 5.3 Experimental Conditions and Sample Codes for Hazelnut Shell
Fixed Parameters Variable Parameters
Particle size 12-18 mesh H3PO4
conc.
(wt.%)
Carbonization
Temp. (ºC)
Sample Code
N2 flow rate 200 cc/min
(velocity:
63 cm/min)
30
300
400
500
HS 30.3
HS 30.4
HS 30.5
Heating Rate 20 ºC/min
40
300
400
500
HS 40.3
HS 40.4
HS 40.5
Carbonization
Time
2 hours
50
300
400
500
HS 50.3
HS 50.4
HS 50.5
Mixing
Proportion
2:1
(ml acid : g. shell)
60
300
400
500
HS 60.3
HS 60.4
HS 60.5

50
Table 5.4 Experimental Conditions and Sample Codes for Hazelnut Husk
Fixed Parameters Variable Parameters
Particle size 20-50 mesh H3PO4
conc.
(wt.%)
Carbonization
Temp. ºC
Sample
Code
N2 flow rate 200 cc/min
(velocity: 63 cm/min)
30 400 HH 30.4
Heating Rate 20 ºC/min 40 400
HH 40.4
Carbonization
Time
2 hours 50 400
HH 50.4
Mixing
Proportion
5:1
(ml acid : g. husk)
60
300
400
500
HH 60.3
HH 60.4
HH 60.5
5.3 Characterization of the Products
Before the characterization, products were crushed by a mortar in distilled water
to obtain smaller particles and rinsed with boiling distilled water until the pH
values of the activated carbons reached to 5-6. Decreasing particle size of the
products before washing step, results in higher removal of the acid and more
effectively opening of pores filled by tarry substances. Suspension pH values of
the activated carbons were determined by following TS 5896 (Turkish Standards
Institution (TSE)).
Prior to making all characterization tests, the samples were oven dried at 110oC
overnight under vacuum. Through the characterization of the products, the effect
of activating agent concentration and carbonization temperature to the pore
structure, total surface area and true densities of the samples were examined.
51
5.3.1. Nitrogen Gas Adsorption Measurements
A commercial volumetric gas adsorption apparatus “ASAP 2000”, Accelerated
Surface Area and Porosimetry System manufactured by Micromeritics Co., USA
was used to measure the surface area and to determine the pore size
distributions of mesopores using N2 adsorption data at -195.6oC. Analysis of the
micropores was also determined by this unit by CO2 adsorption at 0oC, the
details of which are explained in the following section. Schematic diagram of this
apparatus is given in Figure 5.3 (Yağşi, 2004).
To measure the mesopore surface area and the mesopore volume of the samples
nitrogen gas adsorption and desorption isotherms were obtained at -195.6oC. For
each experimental point, an equilibration time of about 30 minutes was allowed.
The cross sectional area of the nitrogen molecule was taken as 0.162 nm2
(Şenel, 1994). Surface area of the samples was determined by using BET
equation. The area and the volumes of the pores as well as their distributions
were evaluated from the nitrogen adsorption isotherms using the Barrett, Joyner
and Halenda (BJH) method (as indicated in section 3.2.2), (Barrett et al., 1951)
considering the IUPAC mesopore range definition which ranges from 50 nm down
to 2 nm in terms of the pore diameters of the cylindrical pores.
5.3.2. CO2 Gas Adsorption Measurements
The micropore volume of the samples was estimated by application of the
Dubinin-Radushkevich equation to carbon dioxide adsorption at 0oC. The data
were automatically collected and evaluated by using the software/ computer
system. A minimum of 30 minutes was allowed for equilibrium to be established
at each point of the CO2 isotherm. Micropore surface area of the samples were
calculated from the DR micropore volume, taking the cross sectional area and
the density of a CO2 molecule as 0.17 nm2 and 1.181 g/cm3, respectively. The

52
saturation vapor pressure was taken as 26142.000 mmHg at the analysis
temperature of 0oC (Micromeritics ASAP 2000, User Manual, Appendix C, 1993).

53
Fig
ure
5.3
Sch
emat
ic R
epre
senta
tion o
f Surf
ace
Anal
yzer
Figure 5.3 Schematic Representation of Surface Analyzer

54
5.3.3. True Density Determinations
True (Helium) densities of samples were determined by using a commercial
Pycnometer. The He Pycnometer instrument is consisted essentially of a sample-
holding vessel, a cylinder fitted with a movable piston, the relative position of
which is indicated on the front panel dial to five decimal places and a pressure
detector. A dial light reveals whether the pressure in the system is the same as
that in the detector.
In a typical run, 0.1-0.2 g degassed sample was placed into a propylene cup and
then, both were evacuated in the pycnometer chamber for a sufficient time.
After filling the system with helium, chamber was opened to atmosphere by
means of a 4 position valve. By this way, enough helium is allowed to escape
into the system in order to reduce the pressure in the system to the atmospheric
reference pressure.
After some time, the valve was turned to gauge position for sealing the helium in
the system at atmospheric reference pressure. Once the valve is in gauge
position, the variable volume chamber, sample chamber and pressure detector
are connected and sealed off as a closed system. When the variable volume is
changed so as to decrease the volume of the system, the pressure increase to
the point where contact is broken between the bellows of the pressure detector
and an electric contact in the detector. This indicates where the reading should
be taken. After obtaining three values; for empty cup, for standard volume and
for sample as “VCELL”, “VEXP” and “VSAMP” values, respectively, true density of the
sample was determined using the known weight of sample according to
procedure given in Appendix C.

55
CHAPTER VI
RESULTS AND DISCUSSION
6.1 Preliminary Experiments
At the beginning of the experimental work the plan was to obtain activated
carbons from hazelnut husk by physical activation with steam and from hazelnut
shell by chemical activation using potassium hydroxide as the activating agent.
In the physical activation of hazelnut husk, carbonization temperature was
400 ºC and activation temperatures were 400, 600 and 800 ºC. BET surface area
results showed that samples activated at 400 and 600 ºC had very low surface
areas (2-5 m2/g). The reason for this result could be the choice of lower
activating temperatures with respect to the literature values (900 ºC, steam).
But, it was also observed that the sample was not resistant to 800 ºC activation
temperature, resulting in only 13% yield. A comparison was made with hazelnut
shell in order to have an idea on applicability of hazelnut husk in activated
carbon production. Physical activation with steam was applied to hazelnut shell
using the same parameters with hazelnut husk experiments (400 ºC
carbonization, 600 ºC activation temperatures). BET surface area results showed
that, under the same conditions with hazelnut husk, hazelnut shell gave higher
surface areas (313- 334 m2/g) with respect to hazelnut husk. These preliminary
results led to the conclusion that hazelnut husk was not a proper precursor for
activated carbon production by physical activation with steam.

56
For the production of activated carbon from hazelnut shell, potassium hydroxide
(KOH) was tried as the activating agent. Solid KOH was dissolved in 10 ml
distilled water and shells were mixed with these solutions in the shell/KOH ratio
of 1:1 and 2:1. But, it was observed that gas evolved during carbonization was
very dense and the system pressure became unstable. This was attributed to
either blockage of the quartz tube or dragging of the sample in the tube. So, the
experiments of KOH impregnated samples could not be completed and no
product was obtained. Changes in experimental parameters like, gas flow rate,
carbonization temperature, input weight of raw material did not solve this
problem, the reason probably being the incompatibility of KOH with the structure
of hazelnut shell. KOH might have changed the structure of the raw material
during impregnation in such a way that the layers of carbon matrix collapsed
when carbonization started and the material became nonporous and sticky;
resulting in the failure of the experiment.
Since no product could be obtained by using potassium hydroxide as the
activating agent, another chemical, phosphoric acid, was tried in the
impregnation step for hazelnut shell. 60 wt. % H3PO4 solution was mixed with
hazelnut shells in the ratio of 2 ml acid: 1 g shell. At carbonization temperature
of 400 ºC and under 200 cc/min N2 flow rate, six experiments were performed.
BET surface areas of the products were obtained by using N2 adsorption data.
Surface area results were around 380-420 m2/g., the average of which was
398.5 m2/g. For these data the standard deviation was found as 16.3, which was
4% of the average of BET surface areas, showing that the experiments were
reproducible. On the other hand, at the same temperature but 130 cc/min gas
flow rate, exactly under the same experimental conditions, two activated carbon
samples were obtained having BET surface areas of 399 and 512 m2/g. It was
noticed that, this difference in BET surface areas was because of the difference
in the amount of raw material placed in the tube. In the production of the
activated carbon having 399 m2/g of BET surface area, 18 gram of raw material
was used, while for the production of the sample having 512 m2/g of BET surface
area 6 gram of raw material was used. The less the input weights of the raw
material, the higher the surface area of the products. When the sample in the
tube was not loose, the tarry substances formed during carbonization might

57
cover the reaction surface of the material and lower the reaction rate. The rest of
the experiments were performed by placing 6-7 grams of impregnated hazelnut
shells in the furnace. When phosphoric acid impregnation was applied to
hazelnut husks, even higher surface area activated carbons were obtained.
The objective of this study was to investigate the pore structures and surface
areas of activated carbons produced from hazelnut shell and hazelnut husk at
relatively low temperatures (300, 400 and 500oC) and for different H3PO4
concentrations (30%, 40%, 50% and 60% wt.). The pore structure of the
activated carbons was characterized by different physical techniques; nitrogen
adsorption at -195.6oC and carbon dioxide adsorption at 0oC. By using helium
pycnometry true densities of the products were obtained.
In terms of chemical characterization, the analyses were limited to the
determination of C, H, N, O elements and ash analysis; to provide information on
elemental composition. Under identical experimental conditions, TGA
experiments were carried out to supply information in terms of yields of acid
impregnated samples.
6.2. Physical Characterization of the Products
The physical characterization of the products was carried out according to the
experimental procedures given in Figure 3.4. The samples were characterized by
determination of solid (true) density, mesopore area, micropore area, mesopore
volume, micropore volume and surface area. BET (N2) surface area
measurement, Helium pycnometry and D-R method (CO2) were used to
determine these values.

6.2.1. Results Based on Nitrogen Gas Adsorption
The nitrogen adsorption measurements of the products include the determination
of the (i) BET surface area, (ii) volume of mesopores, and (iii) cumulative
surface area of mesopores.
i. Hazelnut Shell Based Activated Carbons
BET surface area values of hazelnut shell based activated carbons are shown in
the Figure 6.1. Samples impregnated with 30% H3PO4 solution (HS 30.3,
HS 30.4, and HS 30.5) had very low values of surface area. Moreover, samples
carbonized at 300 ºC gave relatively low results. Sample HS 60.4, which was
impregnated with 60% H3PO4 and carbonized at 400 ºC, had the highest BET
area, 596 m2/g. In Figure 6.2 the effect of carbonization temperature and
phosphoric acid concentration to BET surface areas can be seen more clearly.
BET Surface Area (m2/g)
1
84
4 3
252 270
134
426
242
94
596
380
0
100
200
300
400
500
600
700
HS30.3
HS30.4
HS30.5
HS40.3
HS40.4
HS40.5
HS50.3
HS50.4
HS50.5
HS60.3
HS60.4
HS60.5
Figure 6.1 BET Surface Areas of Hazelnut Shell Based Samples
58

0
100
200
300
400
500
600
700
200 300 400 500 600
Carbonizaiton Temp. (oC)
BET
Sur
face
Are
a (m
2 /g)
30% H3PO440% H3PO450% H3PO460% H3PO4
Figure 6.2 BET Surface Areas of Hazelnut Shell Based Samples
As the H3PO4 concentration increased, BET surface area values increased. In the
literature the impregnation ratio generally shows a maximum point. So, using
higher concentrations of phosphoric acid in impregnation can result in higher BET
surface areas but probably reaches a maximum, then tends to decrease. In the
literature it was shown that in chemical activation there are two different
mechanisms: the first one is the micropore formation which starts with the
addition of chemicals to the raw materials and the second one is the pore
widening which is the result of the chemical effect inside the opened pores. Pore
widening normally begins when there are a number of opened pores in the
structure; therefore, it becomes significant when the impregnation ratio is
reasonably high (Lozano-Castello, 2001). So, to some extent, increasing the
impregnation ratio results in mainly formation of micropores and higher surface
areas but higher impregnation ratios can result in widening of micropores and
formation of meso- and macropores giving lower surface areas.
In Figure 6.2 the appropriate carbonization temperature can be seen to be
400 ºC. 300 ºC was not enough for the formation of pores and obtaining
59

acceptable areas. Increasing the carbonization temperature to 500 ºC resulted in
relatively lower surface areas. In the literature at lower temperatures the ring
opening reaction is said to be favored over depolymerization. Ring opening
results in formation of char, which is the desirable product in our case. At 500 ºC
depolymerization can be favored resulting in the formation of tarry substances
hence lower surface areas.
Six activated carbons, which had the highest BET surface areas among twelve
hazelnut shell based products, were chosen and other characterization methods
were applied. In Figure 6.3 the BJH mesopore areas of the selected products
were shown. Activated carbons produced at 500 ºC had lower mesopore areas
then the ones carbonized at 400 ºC. Also, as acid concentration increased
mesopore areas increased.
BJH Mesopore Area (m2/g)
3027
47
15
58
34
0
10
20
30
40
50
60
70
HS 30.4 HS 30.5 HS 40.4 HS 40.5 HS 50.4 HS 50.5
Figure 6.3 BJH Mesopore Areas of Hazelnut Shell Based Samples
60
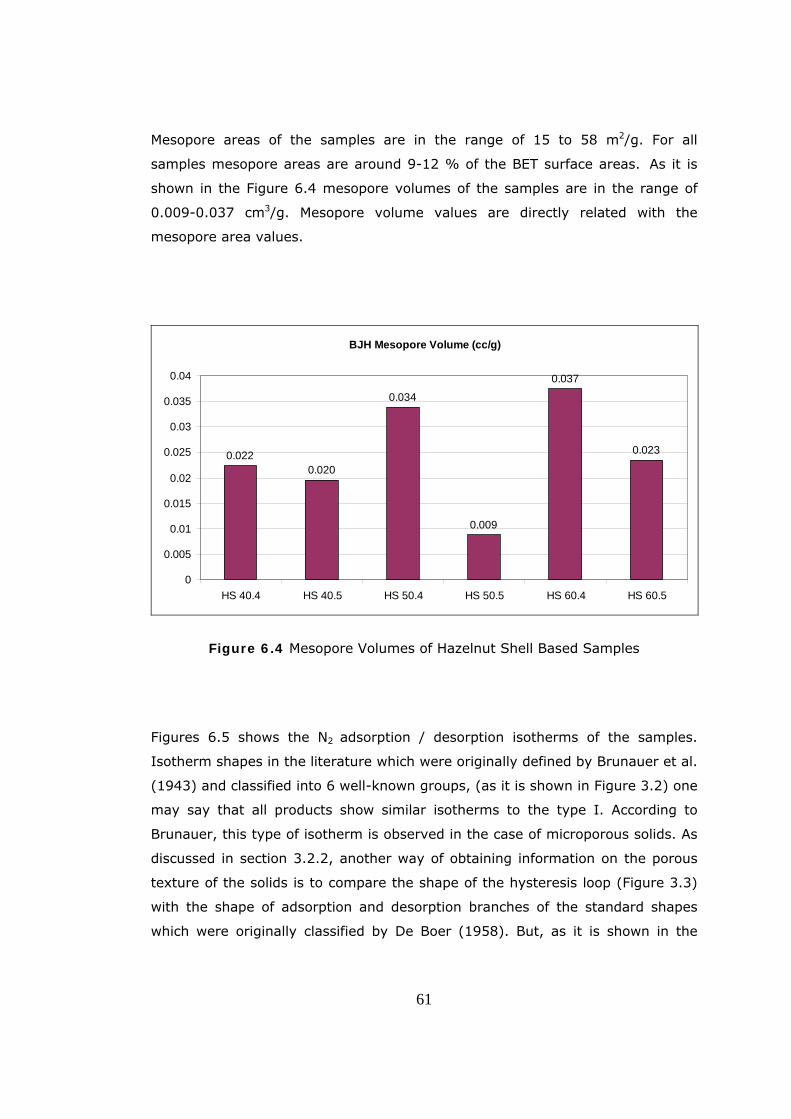
Mesopore areas of the samples are in the range of 15 to 58 m2/g. For all
samples mesopore areas are around 9-12 % of the BET surface areas. As it is
shown in the Figure 6.4 mesopore volumes of the samples are in the range of
0.009-0.037 cm3/g. Mesopore volume values are directly related with the
mesopore area values.
BJH Mesopore Volume (cc/g)
0.0220.020
0.034
0.009
0.037
0.023
0
0.005
0.01
0.015
0.02
0.025
0.03
0.035
0.04
HS 40.4 HS 40.5 HS 50.4 HS 50.5 HS 60.4 HS 60.5
Figure 6.4 Mesopore Volumes of Hazelnut Shell Based Samples
Figures 6.5 shows the N2 adsorption / desorption isotherms of the samples.
Isotherm shapes in the literature which were originally defined by Brunauer et al.
(1943) and classified into 6 well-known groups, (as it is shown in Figure 3.2) one
may say that all products show similar isotherms to the type I. According to
Brunauer, this type of isotherm is observed in the case of microporous solids. As
discussed in section 3.2.2, another way of obtaining information on the porous
texture of the solids is to compare the shape of the hysteresis loop (Figure 3.3)
with the shape of adsorption and desorption branches of the standard shapes
which were originally classified by De Boer (1958). But, as it is shown in the
61

isotherm figures of the samples, there is no distinct hysteresis loops at
adsorption / desorption isotherms.
N2 Adsorption/Desorption
0
20
40
60
80
100
120
140
160
180
200
0 0.1 0.2 0.3 0.4 0.5 0.6 0.7 0.8 0.9 1
Relative Pressure (P/P0)
Volu
me
Adso
rbed
(cc/
g ST
P)
HS 60.5
HS 60.4
HS 50.5
HS 50.4
HS 40.5
HS 40.4
Figure 6.5 N2 Adsorption/Desorption Isotherms of Hazelnut Shell Based Carbons
ii. Hazelnut Husk Based Activated Carbons
In Figure 6.6 BET surface areas of hazelnut husk based activated carbons are
shown. HH 60.3 sample, impregnated with 60% H3PO4 solution and carbonized
at 300 ºC, had the lowest surface area 705 m2/g. The highest BET surface area
was obtained for the sample impregnated with 40% H3PO4 solution and
carbonized at 400 ºC as 1565 m2/g (HH 40.4). In Figure 6.8 the appropriate
carbonization temperature was seen as 400 ºC for 60 wt.% H3PO4 treatment.
Similar to hazelnut shell results, carbonization at 300 ºC and 500 ºC resulted in
lower surface areas. But, when compared to the values of hazelnut shell based
products, hazelnut husk gave much higher values. (Figure 6.7)
62

BET Surface Area (m2/g)
705
1305
1016
14191565
1429
0
200
400
600
800
1000
1200
1400
1600
1800
HH 60.3 HH 60.4 HH 60.5 HH 50.4 HH 40.4 HH 30.4
Figure 6.6 BET Surface Areas of Hazelnut Husk Based Products
BET Surface Area (m2/g)
252 270426
242
596
380
705
1305
1016
14191565
1429
0
200
400
600
800
1000
1200
1400
1600
1800
HS40.4
HS40.5
HS50.4
HS50.5
HS60.4
HS60.5
HH60.3
HH60.4
HH60.5
HH50.4
HH40.4
HH30.4
Figure 6.7 Comparison of BET Surface Areas of HS and HH Based Products
63

600
700
800
900
1000
1100
1200
1300
1400
300 400 500
Carbonization Temp. (oC)
BET
Sur
face
Are
a (m
2 /g)
60% H3PO4
Figure 6.8 BET Surface Areas of Hazelnut Husk Samples Impregnated with 60% H3PO4 solution.
In Figure 6.9, the effect of acid concentration to BET surface areas of the
samples carbonized at 400 ºC was shown. As discussed earlier for hazelnut shell
based carbons, BET surface area showed a maximum for 40% H3PO4
impregnated product and decreased as the acid concentration increased.
BJH mesopores areas of the products are shown in Figure 6.10. Mesopore areas
of the samples are in the range of 302-1042 m2/g. For samples HH 60.3 and HH
30.4 the mesopores areas correspond to 43% and 49% of BET surface areas,
respectively. For the other samples mesopore areas are around 62-82% of the
BET surface areas.
64

1250
1300
1350
1400
1450
1500
1550
1600
30% 40% 50% 60%
H3PO4 concentration
BET
Sur
face
Are
a (m
2 /g)
400 ºC
Figure 6.9 BET Surface Areas of Hazelnut Husk Samples at Carbonization Temperature of 400 ºC.
BJH Mesopore Area (m2/g)
302
996
836
1042978
696
0
200
400
600
800
1000
1200
HH 60.3 HH 60.4 HH 60.5 HH 50.4 HH 40.4 HH 30.4
Figure 6.10 BJH Mesopore Areas of Hazelnut Husk Based Samples
65
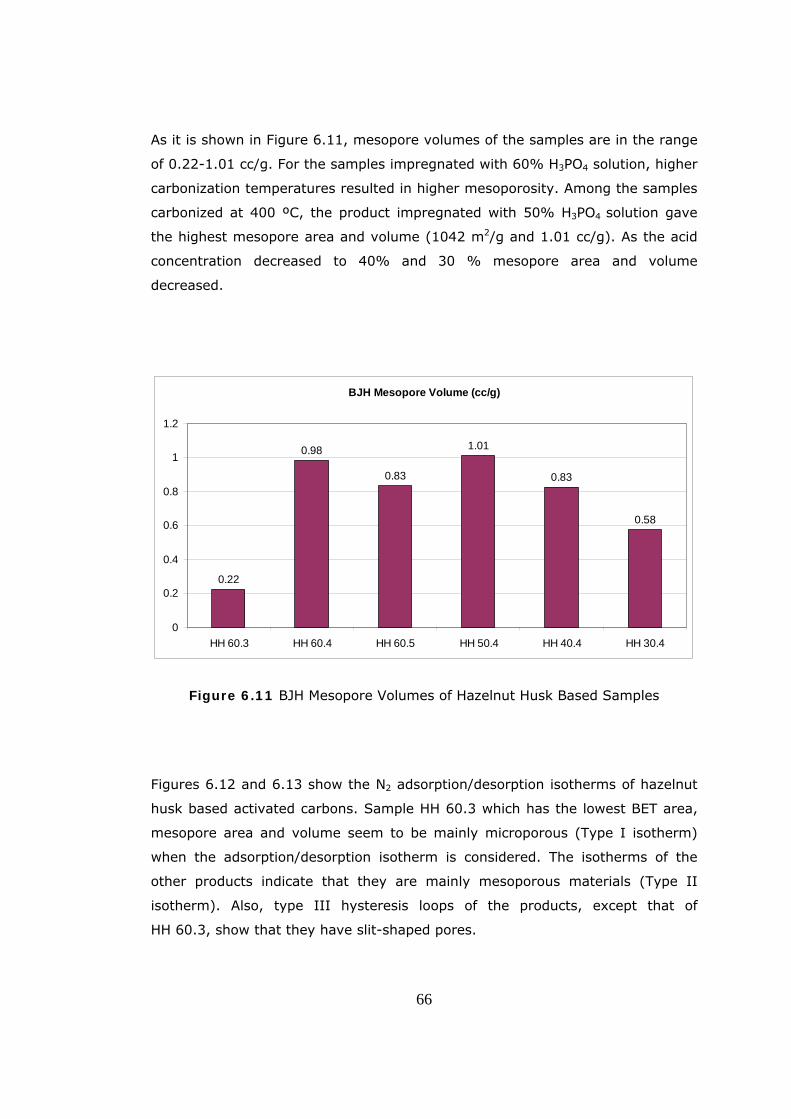
As it is shown in Figure 6.11, mesopore volumes of the samples are in the range
of 0.22-1.01 cc/g. For the samples impregnated with 60% H3PO4 solution, higher
carbonization temperatures resulted in higher mesoporosity. Among the samples
carbonized at 400 ºC, the product impregnated with 50% H3PO4 solution gave
the highest mesopore area and volume (1042 m2/g and 1.01 cc/g). As the acid
concentration decreased to 40% and 30 % mesopore area and volume
decreased.
BJH Mesopore Volume (cc/g)
0.22
0.98
0.83
1.01
0.83
0.58
0
0.2
0.4
0.6
0.8
1
1.2
HH 60.3 HH 60.4 HH 60.5 HH 50.4 HH 40.4 HH 30.4
Figure 6.11 BJH Mesopore Volumes of Hazelnut Husk Based Samples
Figures 6.12 and 6.13 show the N2 adsorption/desorption isotherms of hazelnut
husk based activated carbons. Sample HH 60.3 which has the lowest BET area,
mesopore area and volume seem to be mainly microporous (Type I isotherm)
when the adsorption/desorption isotherm is considered. The isotherms of the
other products indicate that they are mainly mesoporous materials (Type II
isotherm). Also, type III hysteresis loops of the products, except that of
HH 60.3, show that they have slit-shaped pores.
66
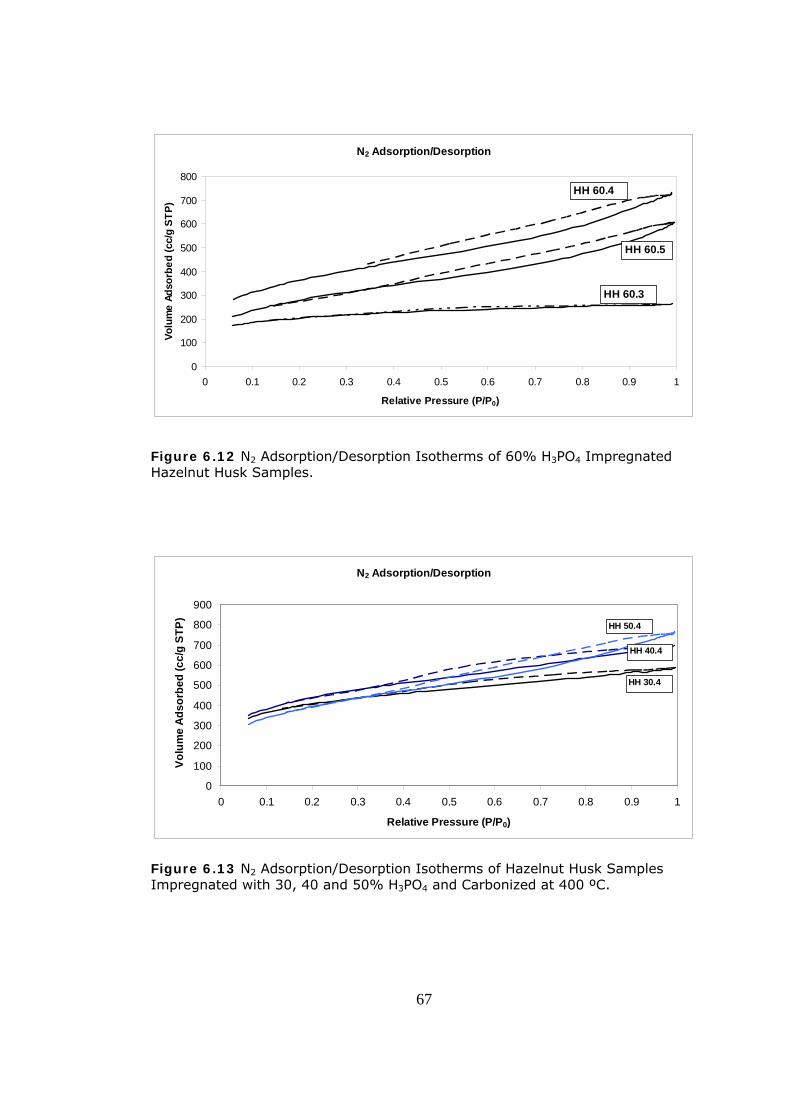
N2 Adsorption/Desorption
0
100
200
300
400
500
600
700
800
0 0.1 0.2 0.3 0.4 0.5 0.6 0.7 0.8 0.9 1
Relative Pressure (P/P0)
Volu
me
Adso
rbed
(cc/
g ST
P)
HH 60.3
HH 60.4
HH 60.5
Figure 6.12 N2 Adsorption/Desorption Isotherms of 60% H3PO4 Impregnated Hazelnut Husk Samples.
N2 Adsorption/Desorption
0
100
200
300
400
500
600
700
800
900
0 0.1 0.2 0.3 0.4 0.5 0.6 0.7 0.8 0.9 1
Relative Pressure (P/P0)
Volu
me
Adso
rbed
(cc/
g ST
P)
HH 40.4
HH 30.4
HH 50.4
Figure 6.13 N2 Adsorption/Desorption Isotherms of Hazelnut Husk Samples Impregnated with 30, 40 and 50% H3PO4 and Carbonized at 400 ºC.
67
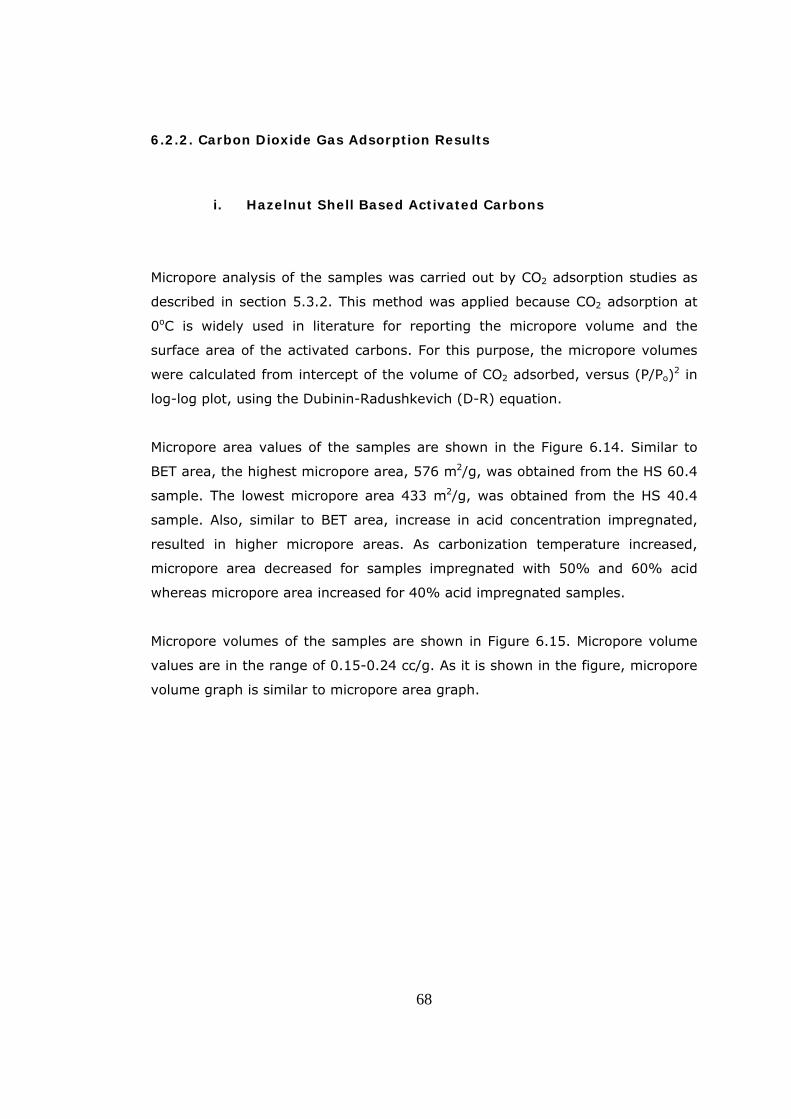
68
6.2.2. Carbon Dioxide Gas Adsorption Results
i. Hazelnut Shell Based Activated Carbons
Micropore analysis of the samples was carried out by CO2 adsorption studies as
described in section 5.3.2. This method was applied because CO2 adsorption at
0oC is widely used in literature for reporting the micropore volume and the
surface area of the activated carbons. For this purpose, the micropore volumes
were calculated from intercept of the volume of CO2 adsorbed, versus (P/Po)2 in
log-log plot, using the Dubinin-Radushkevich (D-R) equation.
Micropore area values of the samples are shown in the Figure 6.14. Similar to
BET area, the highest micropore area, 576 m2/g, was obtained from the HS 60.4
sample. The lowest micropore area 433 m2/g, was obtained from the HS 40.4
sample. Also, similar to BET area, increase in acid concentration impregnated,
resulted in higher micropore areas. As carbonization temperature increased,
micropore area decreased for samples impregnated with 50% and 60% acid
whereas micropore area increased for 40% acid impregnated samples.
Micropore volumes of the samples are shown in Figure 6.15. Micropore volume
values are in the range of 0.15-0.24 cc/g. As it is shown in the figure, micropore
volume graph is similar to micropore area graph.
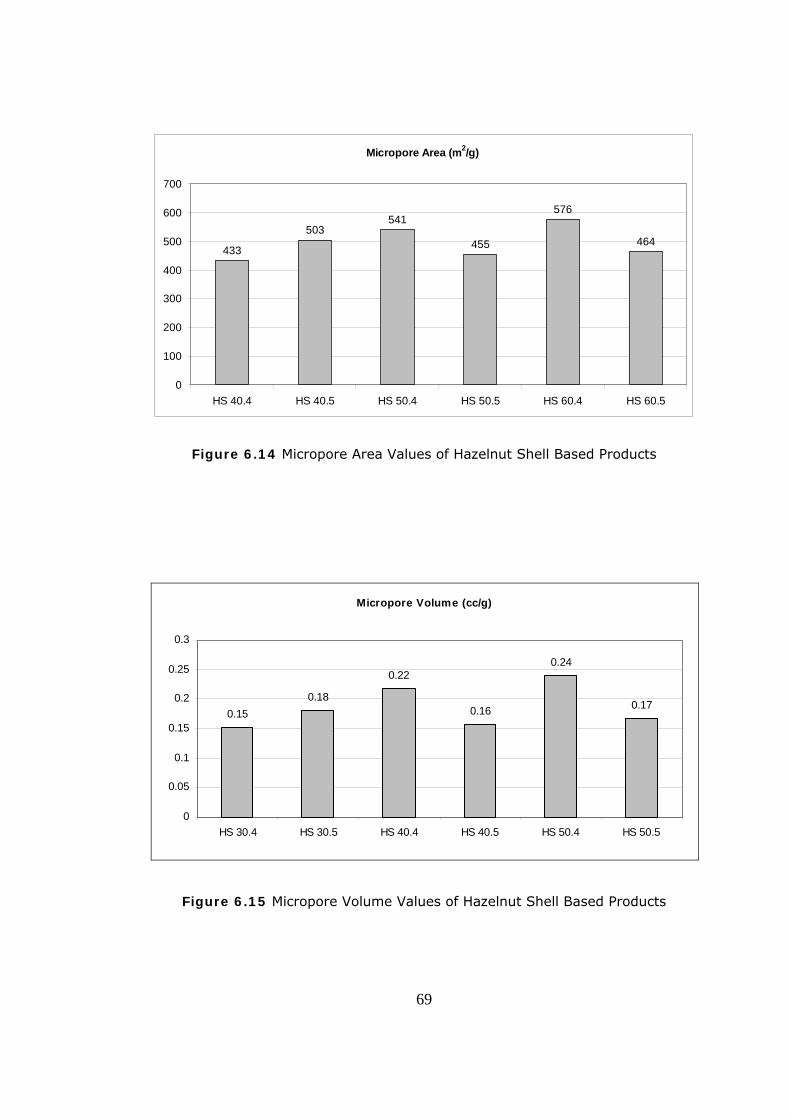
Micropore Area (m2/g)
433
503541
455
576
464
0
100
200
300
400
500
600
700
HS 40.4 HS 40.5 HS 50.4 HS 50.5 HS 60.4 HS 60.5
Figure 6.14 Micropore Area Values of Hazelnut Shell Based Products
Micropore Volume (cc/g)
0.150.18
0.22
0.16
0.24
0.17
0
0.05
0.1
0.15
0.2
0.25
0.3
HS 30.4 HS 30.5 HS 40.4 HS 40.5 HS 50.4 HS 50.5
Figure 6.15 Micropore Volume Values of Hazelnut Shell Based Products
69

70
BET equation has been used extensively to determine surface areas of activated
carbons from nitrogen adsorption isotherms measured at -195.6oC. It is now
generally agreed that N2 adsorption at -195.6oC does not measure the total
surface area of activated carbons for two important reasons. First, due to the
activated diffusion limitations, N2 molecules at -195.6oC do not posses enough
kinetic energy to readily penetrate into the micropores. Thus, impractically long
periods are required for equilibrium to establish. Secondly, the micropores
undergo some decrease in their size at low temperatures. Therefore, in some
cases, the CO2 areas greatly exceed those determined from N2 adsorption at
-195.6oC for two reasons. First, minimum dimension of a CO2 is smaller than
that of N2 molecule. Second, kinetic energy of CO2 molecules at the adsorption
temperatures used far exceeds that of N2 molecules at -195.6oC. Consequently,
rate of diffusion of CO2 into the activated carbon micropores will be significantly
higher than that of N2 (Senel, 1994).
Other interpretation have also been found in literature that CO2 adsorption may
be influenced by the quadropole moment of CO2 molecule interacting with the
oxygen functionalities present on the carbon surface and that higher surface
area may be caused by a CO2 induced swelling effect (Senel, 1994). CO2 can
measure pores down to 4-5 Å while BET can measure pores down to 10 Å.
As it is shown in the Figure 6.16, for all the samples except for HS 60.4,
micropore areas are greater than BET areas. For increasing acid concentrations,
BET, micropore and mesopore areas of samples carbonized at 400 ºC were all
increased. Mesopore areas of all the samples decreased with increasing
carbonization temperature from 400 ºC to 500 ºC. So, it cannot be claimed that
the decrease in surface area is because of the enlargement of the micropores to
mesopores for samples impregnated with 50% and 60% acid. The 40% acid
impregnated sample gave higher results for 500 ºC carbonization temperature.
For low acid concentration impregnated samples the difference between BET and
micropore areas was more obvious whereas for 60% acid impregnated samples
these values were closer.
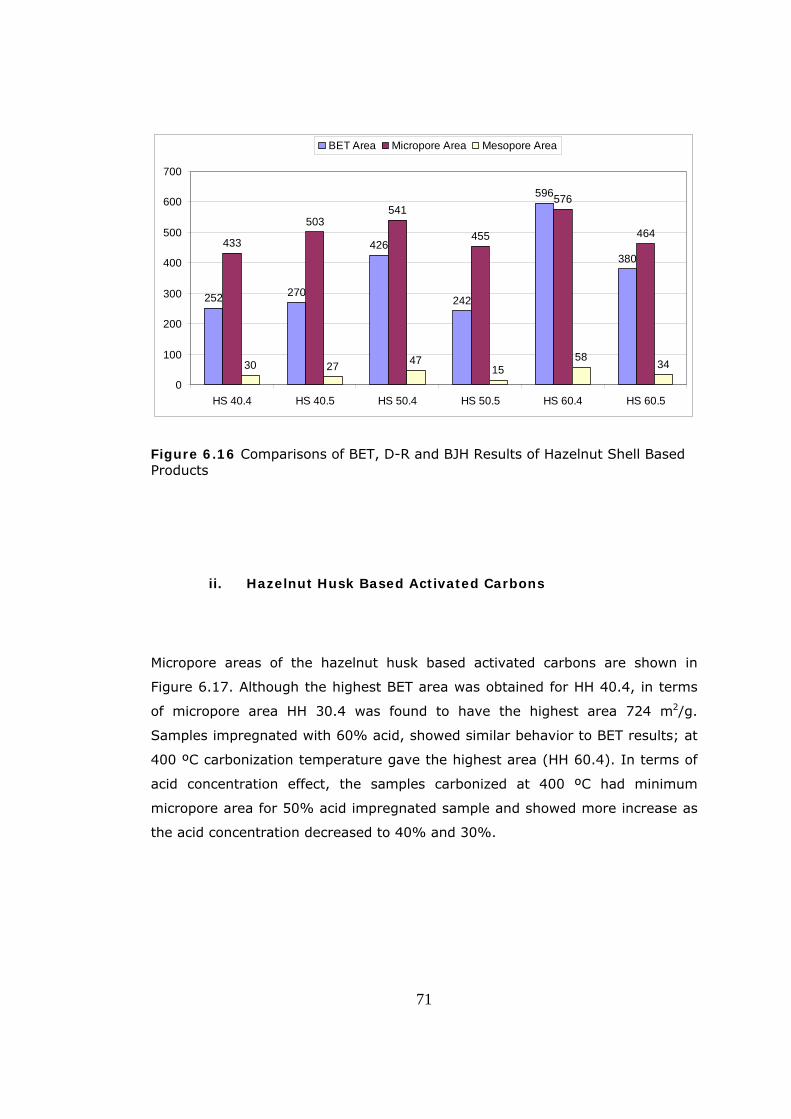
252 270
426
242
596
380433
503541
455
576
464
30 27 4715
5834
0
100
200
300
400
500
600
700
HS 40.4 HS 40.5 HS 50.4 HS 50.5 HS 60.4 HS 60.5
BET Area Micropore Area Mesopore Area
Figure 6.16 Comparisons of BET, D-R and BJH Results of Hazelnut Shell Based Products
ii. Hazelnut Husk Based Activated Carbons
Micropore areas of the hazelnut husk based activated carbons are shown in
Figure 6.17. Although the highest BET area was obtained for HH 40.4, in terms
of micropore area HH 30.4 was found to have the highest area 724 m2/g.
Samples impregnated with 60% acid, showed similar behavior to BET results; at
400 ºC carbonization temperature gave the highest area (HH 60.4). In terms of
acid concentration effect, the samples carbonized at 400 ºC had minimum
micropore area for 50% acid impregnated sample and showed more increase as
the acid concentration decreased to 40% and 30%.
71

Micropore Area (m2/g)
376
602
445511
710 724
0
100
200
300
400
500
600
700
800
HH 60.3 HH 60.4 HH 60.5 HH 50.4 HH 40.4 HH 30.4
Figure 6.17 Micropore Area Values of Hazelnut Husk Based Products
Micropore volumes of the samples are shown in Figure 6.18. Micropore volumes
are in the range of 0.18-0.53 cc/g. Although, HH 40.4 was the second in
micropore area values, it had the highest micropore volume 0.53 cc/g. Samples
impregnated with 60% acid showed the same behavior like in micropore area
graph. In terms of acid concentration effect, the lowest micropore volume was
found for 50% acid impregnated sample again as 0.20 cc/g.
72

Micropore Volume (cc/g)
0.18
0.410.38
0.26
0.53
0.47
0
0.1
0.2
0.3
0.4
0.5
0.6
HH 60.3 HH 60.4 HH 60.5 HH 50.4 HH 40.4 HH 30.4
Figure 6.18 Micropore Volume Values of Hazelnut Husk Based Products
In Figure 6.19 BET, mesopore and micropore areas of the samples were
compared. Unlike the hazelnut shell based activated carbon results, BET areas
were higher than micropore areas. As acid concentration increased from 30% to
50%, the mesopore areas increased while micropore areas decreased but, for
sample HH 60.4 an increase in micropore area and a decrease in mesopore area
was observed. Except for samples HH 30.4 and HH 60.3, mesopore areas were
higher than micropore areas for all samples.
73

705
1305
1016
14191565
1429
376
602
445511
710 724
302
996
836
1042978
696
0
200
400
600
800
1000
1200
1400
1600
1800
HH 60.3 HH 60.4 HH 60.5 HH 50.4 HH 40.4 HH 30.4
Area
(m2 /g
)
BET Area Micropore Area Mesopore Area
Figure 6.19 Comparisons of BET, D-R and BJH Results for Hazelnut Husk Based Products
Figure 6.20 shows BET, micropore and mesopore areas of all the products to
make a comparison between hazelnut shell and hazelnut husk based samples.
BET surface areas and mesopore areas of HH based samples were very much
higher than those of HS based ones. For samples impregnated with 40 wt. %
phosphoric acid and carbonized at 400 ºC, micropore areas were found as
433 m2/g and 710 m2/g for HS 40.4 and HH 40.4, respectively. Although
activated carbons produced from hazelnut husk were mainly mesoporous, the
micropore areas exceeded that of hazelnut shell based samples for most of the
products.
74

0
200
400
600
800
1000
1200
1400
1600
1800Ar
ea (m
2 /g)
BET Area Micropore Area Mesopore Area
BET Area 252 270 426 242 596 380 1429 1565 1419 705 1305 1016
Micropore Area 433 503 541 455 576 464 724 710 511 376 602 445
Mesopore Area 30 27 47 15 58 34 696 978 1042 302 996 836
HS 40.4 HS 40.5 HS 50.4 HS 50.5 HS 60.4 HS 60.5 HH 30.4 HH 40.4 HH 50.4 HH 60.3 HH 60.4 HH 60.5
Figure 6.20 Comparison of HH and HS Series in terms of BET, Micro- and Mesopore Areas.
Results in Figure 6.20 can be compared with the literature survey results also.
Girgis et al. (1998) produced activated carbon from apricot stone by using
40 wt.% phosphoric acid and 400 ºC carbonization temperature, resulting in
1303 m2/g surface area. Under similar conditions hazelnut shell sample resulted
in 252 m2/g surface area, but hazelnut husk sample gave a higher result of
1565 m2/g. Additionally, impregnation with 50 wt. % phosphoric acid and
carbonization at 400 ºC gave 1372 m2/g surface area for apricot stone while HS
and HH based samples had 426 and 1419 m2/g, respectively. Hazelnut shell
samples had lower surface areas than apricot stones while hazelnut husks had
higher results under similar conditions.
Girgis et al. (2002) produced activated carbons from date pits using phosphoric
acid. Impregnation with 50 wt. % acid and carbonization at 500 ºC resulted in
BET surface area of 556 m2/g and micropore area of 464 m2/g for date pits.
Hazelnut shell sample had 242 m2/g of BET surface area and 455 m2/g of
micropore area under similar conditions. Considering the micropore areas of the
75

76
samples it can be stated that hazelnut shells and date pits give close results
under similar experimental conditions. But, generally the structure of the
starting material very much influences the adsorptive properties and surface
chemistry of the products as in the case of apricot stones and hazelnut shell and
husk.
6.2.3. True Density Determinations
True densities values of the activated carbons are determined at room
temperature by Helium Pycnometry as explained in section 5.3.3 and are shown
in Figure 6.21.
As it is shown in figure true density values of hazelnut shell and hazelnut husk
based samples are in the range of 1.52-1.75 g/cc and 1.74-2.55 g/cc,
respectively. True densities of all the products are increasing with the increasing
carbonization temperature. By increasing carbonization temperature, the volatile
matter (low density matter) content of the activated carbon might decrease
resulting in the increase in true density. Acid concentration has no significant
effect on true density of hazelnut shell based products, but true densities of
hazelnut husk based activated carbons are increasing with increasing acid
concentration.

Pycnometer Results (True Density)
1.52 1.61 1.57 1.671.54
1.75 1.741.86
2.06
1.62
2.55
0
0.5
1
1.5
2
2.5
3
HS 40.4 HS 40.5 HS 50.4 HS 50.5 HS 60.4 HS 60.5 HH 30.4 HH 40.4 HH 50.4 HH 60.3 HH 60.4
Den
sity
(g/c
c)
Figure 6.21 True Density Values of the Activated Carbons
6.3. Chemical Analysis of Products
Elemental (C, H, O) analysis of activated carbons and raw materials, which was
carried out according to the procedure explained in section 5.1.1, is given in
Figure 6.22 and Table D.1 in Appendix D. As it can be seen from this figure,
activated carbons produced in this study contain about 70.3-83.1 % carbon,
1.7-2.6 % hydrogen, 12.4-22.6 % oxygen, trace amount of N and 0.8-3.4 %
ash.
77

Figure 6.22 Elemental Analysis Results of Activated Carbons and Raw Materials
79.2
82.6
81.3
80.8
83.1
80.7
76.9
80.4
70.3
77.2
78.2
77.5
49.4
42.7
15.3
14.0
16.0
12.4
22.6
16.1
0102030405060708090
HS 40.4
HS 40.5
HS 50.4
HS 50.5
HS 60.4
HS 60.5
HH 60.3
HH 60.4
HH 60.5
HH 50.4
HH 40.4
HH 30.4
raw
HSra
wHH
C
H O
ash
Fig
ure
6.2
2 E
lem
enta
l Anal
ysis
Res
ults
of Act
ivat
ed C
arbons
and R
aw M
ater
ials
78

79
6.3.1. Carbon Content
Data reported in Figure 6.22. indicates that, for hazelnut shell based activated
carbons, 50% and 60% acid impregnated samples have higher carbon content at
400 ºC than 500 ºC. But, carbon content of 40% acid impregnated sample was
increased with increasing carbonization temperature. The highest carbon content
was found for the hazelnut shell, impregnated with 60% H3PO4 and carbonized at
400 ºC as 83.1%.
Carbon content of hazelnut husk, impregnated with 60% acid and carbonized at
500 ºC was found to have the lowest carbon content of all the activated carbons
as 70.3%. The highest carbon content was found for sample HH 60.4 as 80.4%
for activated carbons produced from hazelnut husk. Raw hazelnut shell and
hazelnut husk have 49% and 43% carbon content, respectively. Carbonization of
the samples impregnated with H3PO4 resulted in higher carbon contents.
For a typical activated carbon, carbon content is reported to be around 85-90 %
(Section 2.5, Faust and Aly, 1983). As carbon content of the activated carbon
increase it is expected that the BET surface area value increase. BET area value
is the most important parameter for activated carbons. High carbon content
value is desired to achieve high BET surface area.
6.3.2. Oxygen and Hydrogen Content
The presence of oxygen and hydrogen influence the adsorptive properties of
activated carbon. As discussed in Section 2.5 these elements are combined with
the atoms of carbon by chemical bonds. The oxygen and hydrogen functional
groups provide sites where molecules of water and other polar substances or
easily polarizable gases and vapors are adsorbed (Smisek and Cerny, 1970;
Hassler, 1974).
80
However, O and H contents of the samples were slightly higher than typical
values. For hazelnut shell based products oxygen content values were in the
range of 14-16%. O content of hazelnut husk based activated carbons was in the
range of 12.4-22.6 %. As acid concentration increased oxygen content of the
products was decreased. As carbonization temperature increased O contents of
the products increased. The lowest O value was obtained from HH 60.4 as
12.4%. The hydrogen content of all the products was decreased with increasing
carbonization temperature. For hazelnut shell based activated carbons H content
decreased with increasing acid concentration. For hazelnut husk based ones the
highest H content was for HH 60.4 and the lowest value was found for HH 30.4
as 2.6% and 1.8%, respectively. Since phosphoric acid (H3PO4) was used as
activating agent and it contained hydrogen and oxygen groups in its structure,
these high O and H content values could be obtained. Most probably, the high
oxygen content of the products was also because of phosphor content of the
acid. In the stated percentages of oxygen, phosphor content might be hidden
since oxygen contents were found by adding C, H, N and ash contents and
subtracting from 100%. For a typical activated carbon the recommended oxygen
content is around 5 % and the hydrogen content is 1 % (Faust and Aly, 1983).
6.3.3. Nitrogen Content
For a typical activated carbon, nitrogen content is less than 1 %. For the
products obtained from hazelnut shell by chemical activation have nitrogen
contents in small amounts which are less than 1 percent (Figure 6.22). On the
other hand, hazelnut husk based products have nitrogen slightly higher than the
typical value. During carbonization in nitrogen atmosphere, small amount of
nitrogen can be chemisorbed (Smisek and Cerny, 1970;).

81
6.3.4. Ash content
A good activated carbon must have low ash content. A small increase in ash
content causes a decrease in adsorptive properties of activated carbon. The raw
hazelnut shell and hazelnut husk have ash content of about 0.4% and 5.8%,
respectively (Table 5.1).
The typical ash content of activated carbons is around 5-6 %. However, all the
products had lower ash content than the typical activated carbons in the range of
0.8-3.4 %. Moreover, the ash content of the carbonized materials is expected to
be high compared with the raw material values.
6.4. TGA of Impregnated Hazelnut Shells and Hazelnut Husks
TGA experiments were carried out to obtain the yield values for selected
products. It was not possible to obtain the yield values from the experiments
which were done with the experimental set-up since after the carbonization was
completed products were immediately taken to a flask and mixed with distilled
water to prevent interaction with the air. Yield values of raw hazelnut shell and
husk were obtained during preliminary experiments by carbonization at 400 ºC.
TGA experiments were done at same experimental conditions like carbonization
time and temperature, particle size, N2 flow rate, impregnation ratio and heating
rate. Yield values of samples for different carbonization temperatures and acid
concentrations are given in Table 6.1.

82
Table 6.1 Yield Values (%) of Selected Products and Raw Materials
Name Yield%
HS 40.4 51.5
HS 50.4 49.4
HS 60.4 47.0
HS 60.5 43.9
HH 40.4 54.3
HH 50.4 56.5
HH 60.4 56.8
HH 60.5 43.2
Raw HS (400 ºC) 31
Raw HH (400 ºC) 34
As it is seen from the table, yield values of phosphoric acid impregnated samples
are higher than that of raw materials for the same temperature. Yield values are
decreasing with the increasing carbonization temperature. Hazelnut shell based
products gave yield values of 47-51.5% at 400 ºC while yields of samples
produced from hazelnut husk were higher, in the range of 54.3-56.8%. As the
carbonization temperature was increased to 500 ºC yields were decreased to
43.2-43.9% for both kinds of products. For HS series, increasing acid
concentration decreased the yield values while in HH series yield values were
increased with increasing acid concentration. Compared with the literature
values, products have acceptable yields. Addition of phosphoric acid to the raw
materials effects the depolymerization reactions (as indicated in Chapter 4 and
Section 2.2.2.1) during the carbonization. Phosphoric acid (H3PO4) restricts the
formation of tar (Section 2.2.2.1) by its dehydration effect and volatile materials
do not evacuate from the structure. Therefore, yield values of acid impregnated
samples increase with respect to raw samples. TGA figures of the acid
impregnated samples are given in Appendix E.

83
For a comparison of probable feasibility of hazelnut shell and husk, based on raw
materials and phosphoric acid used during the experiments, a material balance
was done. Table 6.2 shows the data for HS 40.4 and HH 40.4 samples. 1 gram of
hazelnut shell was mixed with 2 ml phosphoric acid solution (40 wt.%),
weighting 2.5 g. The weight increase of HS 40 series (impregnated and
subsequently dried samples) was 23% (Table 5.2). Weight of input sample was
calculated as 1.23 g. Since the yield of HS 40.4 was obtained as 51.5 % (TGA
method), the output weight was found as 0.633 g. Similarly, 1 gram of hazelnut
husk resulted in 1.69 gram of activated carbon by using 6.25 g H3PO4 (40 wt.%)
solution.
Table 6.2 Material Balance on Activated Carbon Production
(basis: 1 g raw material)
Raw material H3PO4 (40%)
volume (ml)
H3PO4 (40%)
weight (g)
Carbonization
input (g)
Carbonization
output (g)
Hazelnut shell 2 2.5 1.23 0.633
Hazelnut Husk 5 6.25 3.12 1.69
Comparison of HS 40.4 and HH 40.4, on the basis of 1 g. raw material, showed
that hazelnut husk gave higher amounts of activated carbon from 1 gram of
husk. Obtaining product weight less than the raw material weight consumed for
that process can be expected. But, when the decomposition of the material
during carbonization resulting in leaving of gases and tarry substances from the
carbonized sample is considered, obtaining a product weighting higher than the
amount of raw material is interesting as in the case of hazelnut husk. Also,
considering the availability of the raw materials, since hazelnut shell is used
mainly for heating purposes in The Black Sea Region, hazelnut husk might be
cheaply obtained in great amounts. On the other hand, weight of phosphoric acid
84
used for HH 40.4 production was 2.5 times higher than that of used for HS 40.4.
This high consumption of phosphoric acid might increase the unit cost of
HH 40.4.
Although the material balance was mainly based on the carbonization step, the
importance of washing step after carbonization should not be ruled out. It might
be more meaningful to determine yield considering the whole production process
instead of only carbonization. But during the experiments final activated carbon
amounts could not be measured after the removal of acid, since this step caused
loss of products to some extent. So, although hazelnut husk based activated
carbon production consumed higher amounts of acid, washing step might
remove the impregnated acid and lower the unit cost. On the other hand, after
washing step the product weight might not change significantly with respect to
the carbonization output amount indicating that the unexpected high amount of
carbonization output for husk was not a cause of free phosphoric acid. At that
point the phosphor content of the products appears to be important.

85
CHAPTER VII
CONCLUSIONS
From the results of this work, it is concluded that hazelnut shells and hazelnut
husks can be used as raw materials for the production of activated carbon by
using H3PO4 as the activating agent. N2 and CO2 adsorption / desorption
isotherms show that activated carbons obtained from hazelnut shell have a
certain degree of porosity, located mainly in micro size of pores while hazelnut
husk based activated carbons are mainly mesoporous.
Novelties of this work are the use of phosphoric acid (H3PO4) as the activating
agent for hazelnut shell during carbonization and using hazelnut husk for
activated carbon production as the starting material. Results showed that,
pretreatment of the raw materials with H3PO4 solution before carbonization
increased the values of surface area of the activated carbons produced at
relatively low temperatures. The product obtained from 60% H3PO4 impregnated
hazelnut shell gave the highest surface area value 596 m2/g at carbonization
temperature of 400oC. On the other hand, hazelnut husk based products gave
much higher surface areas (in the range of 705-1565 m2/g) for 300, 400 and
500 ºC carbonization temperatures.
Phosphoric acid concentration showed appreciable effects on the properties of
activated carbons. By increasing acid concentration from 30% to 60% higher
surface area activated carbons were obtained from hazelnut shell. For activated
carbons produced from hazelnut husk, 40% phosphoric acid impregnated sample

86
gave the highest surface area 1565 m2/g while further increasing the acid
concentration decreased the surface areas of the products.

87
CHAPTER VIII
RECOMMENDATIONS
Activated carbon has many industrial applications depending on its porous
structure and adsorption capacity. To increase the BET surface area value of the
activated carbons produced from hazelnut shell and hazelnut husk, it is
recommended to carry out experiments with different experimental parameters.
Some of the most critical parameters are the impregnation ratio, heating rate,
carbonization temperature and carbonization time. Increasing phosphoric acid
concentration to 70% or 80% for hazelnut shell might give higher BET surface
areas but probably tend to decrease after a maximum point. To obtain
microporous activated carbon from hazelnut husk the carbonization temperature
should be kept low (300 ºC).
The experiments should be performed in a fluidized bed furnace. The preliminary
experiments showed that a decrease in the weight of raw material placed in the
tube in furnace resulted in higher surface area products. Using fluidized bed will
probably result in a more effective carbonization. Also, to have idea about the
effective surface areas of the products adsorption of organic materials from
solutions may be performed. For further characterization of the products
phosphor contents should be investigated to have an idea on surface chemistry.
Also, particle size distribution of the products should be determined.

88
REFERENCES
1. Agrawal, R.K. and Mc Cluskey, R.J., "The Low Pressure Pyrolysis of Newsprint", J. of AppI. Polv. Sci., Vol. 27, pp.367-382. (1983) 2. Agrawal, R.K., "Kinetics of Reactions Involved in Pyrolysis of Cellulose I.
The Three Reaction Model", Can. J. of Chem. Eng., Vol. 66, pp.403-412. (1988a)
3. Agrawal, R.K., "Kinetics of Reactions Involved in Pyrolysis of Cellulose II.
The Modified Kilzer-Broido Model", Can. J. of Chem. Eng., Vol. 66, pp.413-418. (1988b)
4. Ahmedna, M., Marshall, W.E., Rao, R.M., “Surface Properties of Granular
Activated Carbons from Agricultural by-products and Their Effects on Raw Sugar Decolorization”, Bioresource Tech., 71, pp. 103-112. (2000)
5. Arol, A.I., Yalcin, M., “Gold Cyanide Adsorption Characteristics of
Activated Carbon of Non-Coconut Shell Origin”, Hydrometallurgy, 63, pp. 201-206. (2002)
6. Aygün, A., Yenisoy-Karakaş, S., Duman, I., “Production of Granular
Activated Carbon from Fruit Stones and Nutshells and Evaluation of Their Physical, Chemical and Adsorption Properties”, Microporous and Mesoporous Materials, 66, pp. 189-195. (2003)
7. Baçaoui, A., Yaacoubi, A., Dahbi, A., Bennouna, C., Phan Tan Luu, R., Maldonado- Hodar, F.J., Rivera-Utrilla, J. and Moreno-Castilla, C., ”Optimization of Conditions for the Preparation of Activated Carbons from Olive-Waste Cakes”, Carbon Vol. 39, pp.425-432. (2001) 8. Balcı, S., PhD Dissertation, METU, Ankara (1992) 9. Balcı, S., Doğu, T. And Yücel, H., “Characterization of Activated Carbon Produced from Almond Shell and Hazelnut Shell”, J. Chem. Tech. Biotechnol. Vol.60, pp.419-426. (1994) 10. Barrett, E. P., Joyner, L. G. and Halenda, P. P., “The Determination of Pore Volume and Area Distribution in Porous Substances. I. Computations from Nitrogen Isotherms”, J. Am. Chem. Soc., Vol. 73, pp.373-380. (1951) 11. Bevla, F. R., Rico, D. P. and Gomis, A. F. M., “ Activated Carbon from
Almond Shells. Chemical Activation. 1. Activating Reagent Selection and Variables Influence”, Ind. Eng. Chem. Prod. Res. Dev. Vol. 23, pp.266-269. (1984a)
89
12. Bevla, F. R., Rico, D. P. and Gomis, A. F. M., “ Activated Carbon from Almond Shells. Chemical Activation. 2. ZnCl2 Activation Temperature Influence”, Ind. Eng. Chem. Prod. Res. Dev. Vol. 23, pp.269-271. (1984b)
13. Broekhoff, J. C. P. and Linsen, B. G., Physical and Chemical Aspects of Adsorbents and Catalysts, ed. B. G. Linsen, Academic Press, New York. (1970) 14. Browning, B. L., The Chemistry of Wood, Interscience Pub., New York, London. (1963) 15. Brunauer, S., Demming, L. S., Demming, W. S. and Teller, “On a Theory
of the van der Waals Adsorption of Gases” E., J. Am. Chem. Soc., Vol. 62, pp. 1723-1732. (1940)
16. Cimino, G., Passerini, A., Toscano, G., “Removal of Toxic Cations and
Cr(VI) from Aqueous Solution by Hazelnut Shell”, Wat. Res., Vol. 34, No. 11, pp. 2955-2962. (2000)
17. Cookson, J. T., Carbon Adsorption Handbook. (Edited by Cheremisinoff, P. N. and Ellerbusch, F.) pp.241-279, Ann Arbor Sci., Michigan. (1980) 18. De Boer, J.H., “The Structure and Properties of Porous Materials”, ed. D.J.
Everett, Butterworths, London, pp. 86 (1958) 19. Demirbaş, E., Kobya, M., Öncel, S, Şencan, S., “Removal of Ni(II) from
Aqueous Solution by Adsorption onto Hazelnut Shell Activated Carbon: Equilibrium Studies”, Bioresource Tech., 84, pp. 291-293. (2002)
20. Dubinin, M. M., “On Methods for Estimating Micropore Parameters of Carbon Adsorbents”, Carbon, Vol. 26, pp.97-110. (1988) 21. Faust, S. D. and Aly, O. M., Chemistry of Water Treatment, Butter Wort Pub., Woburn. (1983) 22. Franklin, R. E., “Crystallite Growth in Graphitizing and Nongraphitizing
Carbons”, Proc. Roy. Soc. (London) A 209, 196-218. (1951) 23. Girgis, B. S. and Daifullah, A. A., “Removal of Some Substituted Phenols
by Activated Carbon Obtained from Agricultural Waste”, Wat. Res. Vol. 32, pp.1169-1177, (1998)
24. Girgis, B.S., Abdel-Nasser, A., El-Hendawy, “Porosity Development in
Activated Carbons Obtained from Date Pits under Chemical Activation with Phosphoric Acid”, Microporous and Mesoporous Materials, 52, pp. 105-117. (2002)
25. Gregg, S. J. and Sing, K.S.W., Adsorption, Surface and Porosity, New York Academic Press. (1967)
90
26. Halsey, G. D., J. Chem. Phys., "Physical adsorption on nonuniform surfaces", Vol. 16, pp.931. (1948)
27. Hassler, J. W., Purification with Activated Carbon, Chem. Pub. Co., New York. (1974) 28. Holden, M. J., “Manufacture and Uses of Activated Carbon”, Eff. and Water Treat. J. Vol. 22, pp.27-31. (1982) 29. Hu, Z., Srinivasan, M. P. and Yaming Ni, “Novel Activation Process for Preparing Highly Microporous and Mesoporous Activated Carbons”, Carbon Vol. 39, pp.877-886. (2001) 30. Kirk-Othmer, Encyclopedia of Chemical Technology, John Wiley and Sons Inc. (2003) 31. Köksal, A.İ., “Inventory of hazelnut research, germplasm and references”,
REU Technical Series - 56, 2000 32. Lozano-Castello, D., Lillo-Rodenas, M.A., Cazorla-Amoros, D., Linares-
Solano, A., “Preparation of Activated Carbons from Spanish Anthracite, I. Activation by KOH”, Carbon, 39, pp. 741-749. (2001)
33. Martin, A. E., Chemistry of Coal Utilization, 2nd Supp. Vol., John Wiley and Sons Inc. (1981) 34. Micromeritics ASAP 2000, User Manual, 1993 35. Orr, C. and Dalla, V. J. M., Fine Particle Measurement, Mc Millian, New York. (1959) 36. Polanyi, M., “Theories of the adsorption of gases. A general survey and
some additional remarks”, Trans. Faraday Soc., Vol.28, pp.316. (1932)
37. Reinoso, R. F., Martinez, M. J. M., Sabio, M. M., “A Comparison of the Porous Texture of Two CO2 Activated Botanic Materials”, Carbon, Vol. 23 pp.19-24. (1985) 38. Roberts, A. F., “A Review of A Kinetic Data for the Pyrolysis of Wood and Related Substances”, Comb. And Flame, Vol. 14, pp.261-272. (1970) 39. Rodriguez Reinoso, F., Controlled Gasification of Carbon and Pore
Structure Development, Fundamental Issues in Control of Carbon Gasification Reactivity, pp. 533-571. (1991)
40. Rodriguez-Reinoso, F., “An Overview of Methods for the Characterization
of Activated Carbons”, Pure and Appl. Chem. Vol. 61, No.11, pp.1859-1866. (1989)

91
41. Rodriguez-Reinoso, F., Lopez-Gonzalez, J. DE D., Berenguer, C., “Activated carbons from Almond Shells-I, Preparation and Characterization by Nitrogen Adsorption”, Carbon, Vol. 20, No.6, pp.513-518. (1982)
42. Ruthven, D. M., Principle of Adsorption and Adsorption Process, John Wiley and Sons, New York, (1984) 43. Sánchez,A. R., Elguézabal, A. A. and Saenz, L. L. T., “CO2 Activation of
Char from Quercus Agrifolia Wood Waste”, Carbon, Vol. 39, pp.1367-1377. (2001)
44. Schewenker, Jr. R. P. and Pascu, E., “Pyrolytic Degradation Products of
Cellulose”, Chem. Eng. Data Ser.2, No.1, pp.83-88. (1957) 45. Şenel, G. İ., PhD Dissertation, METU, Ankara (1994) 46. Smisek, M. And Cerny, S., Active Carbon Manufacture, Properties and Aplications, Elsevier Pub., Comp., New York. (1970) 47. Solano, L. A., Gonzalez, L. J. de D., Sabio, M. M., “Active Carbons from Almond Shells as Adsorbents in Gas and Liquid Phases”, J. Chem. Tech. Biotech. Vol. 30, pp.65-72. (1980) 48. Toles, C. A., Marshall, W. E. and Johns, M. M., “Granular Activated Carbons from Nutshells for the Uptake of Metals and Organic Compounds”, Carbon, Vol.35, No.9, pp.1407-1414. (1997) 49. Toles, C. A., Marshall, W. E., Johns, M. M., Wartelle, L. H. and McAloon A., “Acid-Activated Carbons from Almond Shells: Physical, Chemical and Adsorptive Properties and Estimated Cost of Production”, Bioresource Technology, Vol. 71, Issue 1, pp.87-92. (2000)
50. TS 6879, Turkish Standards Institution (TSE). Activated Carbon Determination of Total Ash Content
51. TS 5896, Turkish Standards Institution (TSE). Activated Carbon
Determination of pH value. 52. Wartelle, L.H., Marshall, W.E., Toles, C.A., Johns, M.M., “Comparison of
Nutshell Granular Activated Carbons to Commercial Adsorbents for the Purge-and-Trap Gas Chromatographic Analysis of Volatile Organic Compounds”, Journal of Chromatography A, 879, pp. 169-175. (2000)
53. Wigmans, T., Carbon and Coal Gasification. (Edited by Figueriedo, J. L. and Moulijn, J. A.,), pp.559-601, Martinus Nijhoff Pub., Lancaster. (1985) 54. Wigmans, T., “Industrial Aspects of Production and Use of Activated
Carbons”, Carbon, Vol. 27, pp. 13-22. (1989)

92
55. Wolff, W. F., “A Model of Active Carbon”, J. Phys. Chem. Vol. 63, pp.653- 659. (1959) 56. Yağşi, N. U., M.Sc. Dissertation, METU, Ankara (2004) 57. Yun, C.H., Park, Y.H., Park, C.R., “Effects of Pre-carbonization on Porosity
Development of Activated Carbons from Rice Straw”, Carbon, 39, pp. 559-567. (2001)

APPENDIX A
ANALYSIS OF N2 SORPTION DATA
A.1. Analysis of Mesopores
Adsorption studies reading to measurements of pore sizes and pore size
distributions generally make use of the Kelvin equation A.1 which relates the
equilibrium vapor pressure of a curved surface such as that of a liquid in a
capillary or pore, to the equilibrium pressure of the same liquid on a plane
surface (Gregg and Sing, 1982).
RTrVmolCos
PoP
p
θγ2ln −= (A.1)
where P is the equilibrium vapor pressure of the liquid contained in a narrow
pore of radius rp and Po is the equilibrium pressure of the same liquid at a plane
surface. The terms γ and Vmol are surface tension and molar volume of the
liquid, respectively. θ is the contact (wetting) angle with which the liquid meets
the pore wall.
If the transfer of dn moles of vapor in equilibrium with the bulk liquid at pressure
Po into a pore where the equilibrium pressure P is considered, this process
consists of three steps: evaporation from the bulk liquid, expansion of the vapor
from Po to P and condensation into the pore. The first and third of these steps
93

are equilibrium processes and are therefore accompanied by a zero free energy
change, whereas the free energy change for the second step is described by
dnPoPRTdG ⎟⎟
⎠
⎞⎜⎜⎝
⎛⎟⎠⎞
⎜⎝⎛= ln (A.2)
When the adsorbate condenses in the pore
( )dSCosdG θγ−= (A.3)
where dS is the change in the film-vapor interfacial area and θ is the wetting
angle which is taken to be zero since the liquid is assumed to wet completely the
adsorbed film. Equations A.2 and A.3, when combined
( )PoPRTdSdn
/lnγ−
= (A.4)
The volume of liquid adsorbate which condenses in a pore of volume Vp is given
by
VmoldndVp = (A.5)
Substituting equation A.4 into A.5 gives
( )PoPRTVmol
dSdVp
/lnγ−
= (A.6)
The ratio of volume to area within a pore depends upon the geometry. When the
shapes of the pores are highly irregular or consisting of a mixture of regular
geometries, the volume to area ratio can be too complex to express
mathematically. In these cases, or in the absence of specific knowledge of the
94

pore geometry, the assumption of cylindrical pores is usually made. Since the
ratio of volume to area for cylinders is r/2, the equation A.6 gives the Kelvin
equation;
rRTVmol
PoP γ2ln −
=⎟⎠⎞
⎜⎝⎛
(A.7)
For nitrogen as the adsorbate at its normal boiling point of -195.6oC, the Kelvin
equation can be written as
( )( ) ( )PPKKmolergx
cmA
molcm
cmerg
r
o
o
k
/log303.27710314.8
106.3485.82
7
83
2
⎟⎠⎞
⎜⎝⎛
⎟⎟⎠
⎞⎜⎜⎝
⎛⎟⎟⎠
⎞⎜⎜⎝
⎛⎟⎠⎞
⎜⎝⎛
= (A.8)
where 8.85 erg/cm2 is the surface tension and 34.6 cm3 is the molar volume of
liquid nitrogen at -195.6oC. Then equation A.9 can be found as
( )PPr
ok /log
15.4= (A.9)
The term rk indicates the radius into which condensation occurs at the required
relative pressure. This radius, called the Kelvin radius or the critical radius, is not
the actual pore radius since some adsorption has already occurred on the pore
wall prior to condensation, leaving a center core or radius rk. Alternatively,
during desorption, an adsorbed film remains on the pore wall when evaporation
of the center core takes place. If the depth of the film when condensation or
evaporation occurs is t, then the actual pore radius rp is given by
rp=rk+t (A.10)
95

This equation can be used to calculate rp but some means of evaluating t is
required if the pore radius is to be determined. Using the assumption that the
adsorbed film depth in a pore is the same as that on a plane surface for any
value of relative pressure, one can write
τ⎟⎟⎠
⎞⎜⎜⎝
⎛=
m
a
WW
t (A.11)
Where Wa and Wm are, respectively, the quantity adsorbed at a particular
relative pressure and the weight corresponding to the BET monolayer. Essentially
equation A.11 asserts that the thickness of the adsorbed film is simply the
number of layers times the thickness τ of one layer regardless of whether the
film is in a pore or on a plane surface. The t value of τ can be calculated by
considering the area S and volume Vmol occupied by one mole of liquid nitrogen if
it were spread over a surface to the depth of one molecular layer
( ) A
molx
molA
AxS
V mol 54.311002.62.16
106.34
232
324
=
⎟⎠⎞
⎜⎝⎛
⎟⎟⎠
⎞⎜⎜⎝
⎛==τ (A.12)
On nonporous surfaces it has been shown that when the quantity Wa/Wm is
plotted versus P/Po the data all approximately fit a common type II curve above
a relative pressure of 0.3. The common curve is described closely by Halsey,
(1948) equation which for nitrogen can be written as
( )
3/1
/log303.2554.3 ⎟⎟
⎠
⎞⎜⎜⎝
⎛=
PPt
o
(A.13)
The thickness of the adsorbed layer which is calculated for a particular relative
96

pressure from the above equation which becomes thicker and thicker with
successive increase in pressure, so that the measured quantity of gas adsorbed
in a step is composed of a quantity equivalent to the liquid cores formed in that
step plus the quantity adsorbed by the pore walls of pores whose cores have
been formed in that and previous steps. Barrett Joyner and Halenda developed
the method (BJH) which incorporates these ideas. The algorithm used on the
ASAP 2000; the N2 adsorption apparatus used in the present work, is an
implementation of the BJH method. According to this method, ∆Vgas, the
incremental volume: the change in adsorbed volume between two successive
P/Po values can be determined by subtracting the successive values. The ∆Vgas
then can be converted to ∆Vliq by multiplying by the liquid molar volume for
nitrogen at standard temperature and pressure. This is given by
( )( ) ( )( ) ( )31054.1/6.34
/22414/ −∆=−
∆=∆ xVmolcc
STPmolccgccV
V gasgas
liq (A.14)
The actual pore volume was evaluated by
∑∆+=∆ StrV KAVEliq2π (A.15)
In this equation rKAVE is the average Kelvin radius and the term ∆t ΣS is the
product of the film area and the increase in the film depth, and since,
(A.16) LrV PAVEp2π=
where L is the pore length, by combining the equations, A.15 and A.16
( )([ ]42
10 −∑∆−∆⎟⎟⎠
⎞⎜⎜⎝
⎛= StV
rrV liq
KAVE
PAVEp ) (cc) (A.17)
The surface area of the pore walls can be calculated from the pore volume by
97
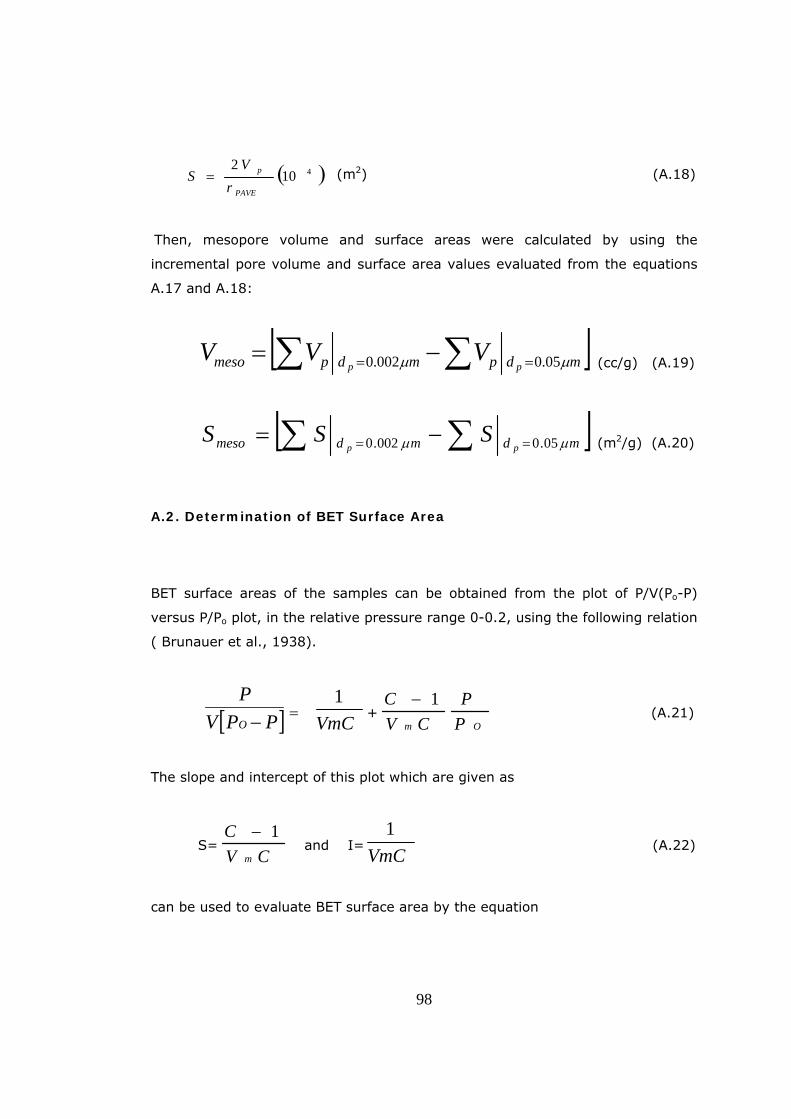
( 4102
PAVE
p
rV
S = ) (m2) (A.18)
Then, mesopore volume and surface areas were calculated by using the
incremental pore volume and surface area values evaluated from the equations
A.17 and A.18:
[ ]∑ ∑ == −= mdpmdpmeso ppVVV µµ 05.0002.0 (cc/g) (A.19)
[ ]∑ ∑ == −= mdmdmeso ppSSS µµ 05.0002.0 (m2/g) (A.20)
A.2. Determination of BET Surface Area
BET surface areas of the samples can be obtained from the plot of P/V(Po-P)
versus P/Po plot, in the relative pressure range 0-0.2, using the following relation
( Brunauer et al., 1938).
[ ]PPVPO − = VmC
1+
Om PP
CVC 1−
(A.21)
The slope and intercept of this plot which are given as
S=CV
Cm
1− and I= VmC
1 (A.22)
can be used to evaluate BET surface area by the equation
98

( ) ( )( )[ ]( )( ) ( )( ) ( )( )( )[ ]STPccgISmnmSTPmolcm
molxnmCSAS N
BET −+−=
//10/22414/110023.6
22183
2322
(A.23)
where CSAN2 is the cross sectional area of a nitrogen molecule.
A.3. Sample Calculation
Sample Code HH 40.4 (Carbonization Temperature=400oC, Hazelnut Husk
impregnated with 40% H3PO4 solution)
A.3.1. Calculation of Mesopore Volume and Area
Cumulative Mesopore Volume up to dp=20 oA (2 nm)=0.845617 cc/g
Cumulative Mesopore Volume up to dp=500 oA (50 nm)=0.020593 cc/g
Replacing these quantities into equation B.19:
Vmeso= 0,845617- 0.020593=0,825024 cc/g
Cumulative Pore Surface Area up to dp=20 oA (2 nm)= 979.2653 m2/g
Cumulative Pore Surface Area up to dp=500 oA (50 nm)= 0.896396 m2/g
Replacing these quantities into equation A.20:
Smeso= 979.2653 - 0.896396 = 978.3689 m2/g
99
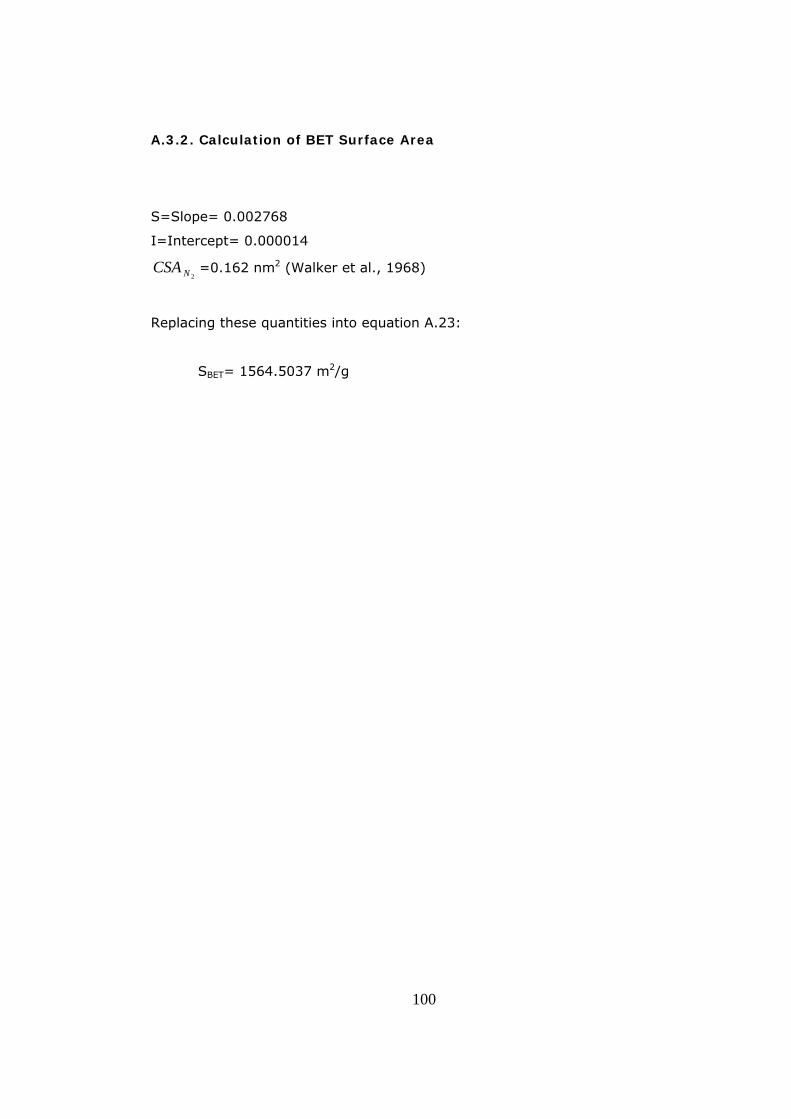
A.3.2. Calculation of BET Surface Area
S=Slope= 0.002768
I=Intercept= 0.000014
2NCSA =0.162 nm2 (Walker et al., 1968)
Replacing these quantities into equation A.23:
SBET= 1564.5037 m2/g
100
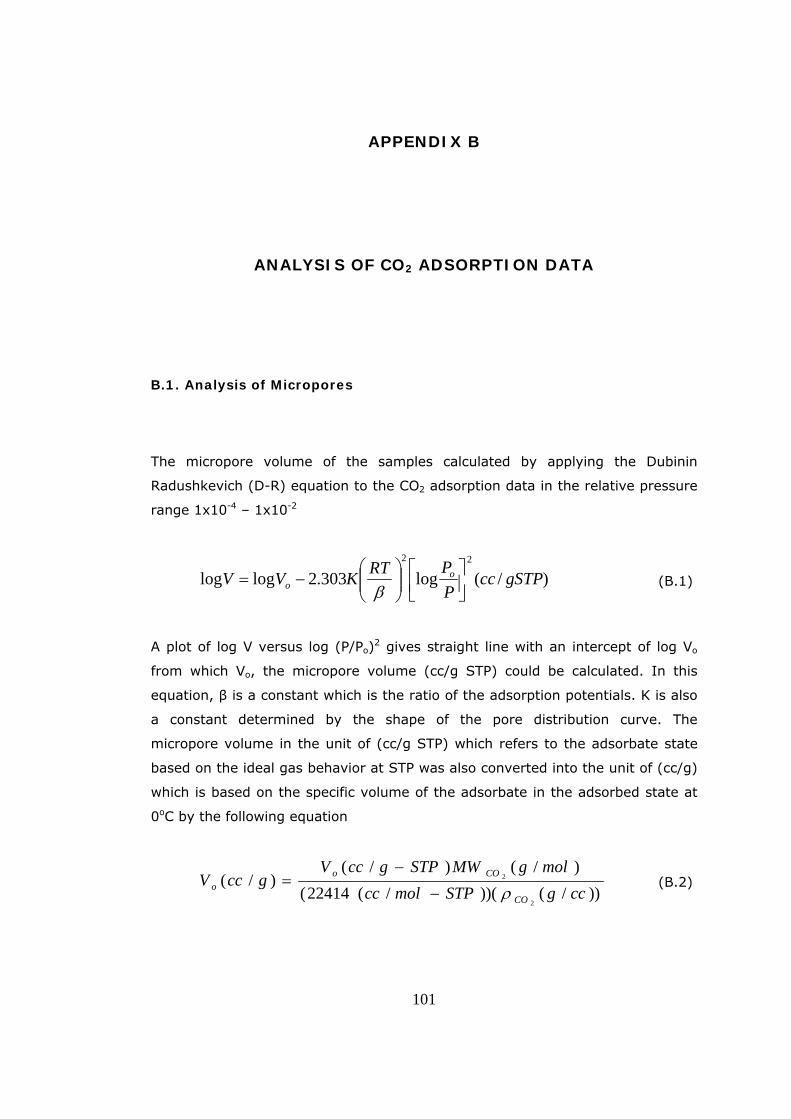
APPENDIX B
ANALYSIS OF CO2 ADSORPTION DATA
B.1. Analysis of Micropores
The micropore volume of the samples calculated by applying the Dubinin
Radushkevich (D-R) equation to the CO2 adsorption data in the relative pressure
range 1x10⁻⁴ – 1x10⁻²
)/(log303.2loglog22
gSTPccPPRTKVV o
o ⎥⎦⎤
⎢⎣⎡
⎟⎟⎠
⎞⎜⎜⎝
⎛−=
β (B.1)
A plot of log V versus log (P/Po)2 gives straight line with an intercept of log Vo
from which Vo, the micropore volume (cc/g STP) could be calculated. In this
equation, β is a constant which is the ratio of the adsorption potentials. K is also
a constant determined by the shape of the pore distribution curve. The
micropore volume in the unit of (cc/g STP) which refers to the adsorbate state
based on the ideal gas behavior at STP was also converted into the unit of (cc/g)
which is based on the specific volume of the adsorbate in the adsorbed state at
0oC by the following equation
))/())(/(22414(
)/()/()/(
2
2
ccgSTPmolccmolgMWSTPgccV
gccVCO
COoo ρ−
−= (B.2)
101

where ρ is the density of the CO2 molecule. Micropore surface area or so called
D-R surface area was then evaluated by
( ) ( )
( )( )2218
232
/10224141002.6)/(
mnmccxSTPgccVnm
S oDR
−=
σ (B.3)
where σ is the cross sectional area of a CO2 molecule.
B.2. Sample Calculation
Sample Code: HH 30.4 (Carbonization Temperature=400oC, Hazelnut Husk
impregnated with 30% H3PO4 solution)
Micropore volume (cc/g STP) directly obtained from the ASAP 2000M; Micropore
Analysis unit which processed the collected CO2 adsorption data. In these
calculations;
Saturation pressure of CO2 =26142.000 mm Hg at 0oC (Micromeritics ASAP
2000, User Manual, Appendix C, 1993)
Absolute Pressure Range= 7.24243- 901.43604 mm Hg
Corresponding Relative Pressure Range= 2.77x10⁻⁴- 3.44x10⁻²
Vmicro= 158.6431 cc/g STP
Corresponding micropore volume in the units of cc/g was evaluated by taking
Density of CO2 at 0oC=1.181 g/cc (Micromeritics ASAP 2000, User Manual,
Appendix C, 1993) and replacing into equation B.2:
Vmicro= 0.472 cc/g
102

103
Micropore surface area (D-R surface area) obtained by taking
Cross Sectional Area of CO2 molecule =0.17 nm2 (Micromeritics ASAP 2000, User
Manual, Appendix C, 1993)
Replacing into equation B.3
SD-R= 724 m2/g
APPENDIX C
ANALYSIS OF HELIUM PYCNOMETER DATA
True densities of the samples were determined by helium displacement method.
A commercial He Pycnometer apparatus was used to measure true densities of
the activated carbons.
Assume that both VCELL and VEXP are at ambient pressure Pa, are at ambient
temperature Ta, and that the valve is then closed. VCELL is then charged to an
elevated pressure P1. The mass balance equation across the sample cell, VCELL is
( ) aCSAMPCELL RTnVVP =−1 (C.1)
where
nC= the number of moles of gas in the sample cell,
R= the gas constant, and
Ta= the ambient temperature
The mass equation for the expansion volume is
(C.2) aEEXPa RTnVP =
where,
nE= the number of moles of gas in the expansion volume.
104

When the valve is opened, the pressure will fall to an intermediate value, P2, and
the mass balance equation becomes
( ) aEaCEXPSAMPCELL RTnRTnVVVP +=+−2 (C.3)
Substituting from equations (C.1) and (C.2) into (C.3)
EXPa
SAMPCELL VPPPP
VV12
2
−−
=− (C.4)
If we rearrange this equation,
( )( ) 1
2
1 −−−
−=
a
a
EXPCELLSAMP
PPPP
VVV (C.5)
Since P1, P2 and Pa are expressed in equations (C.1) through (C.5) as absolute
pressures and equation (C.5) is arranged so that Pa is subtracted from both P1
and P2 before use, new P1g and P2g may be redefined as gauge pressures
P1g = P1-Pa (C.6)
P2g = P2-Pa (C.7)
And equation (C.5) rewritten as
1
2
1 −−=
g
g
EXPCELLSAMP
PPVVV (C.8)
This equation (C.8) then becomes the working equation for the pycnometer.
105

106
APPENDIX D
TABULATED FORM OF CHEMICAL COMPOSITIONS OF
ACTIVATED CARBONS
Table D.1 Chemical Compositions of Activated Carbons and Raw Materials
name C(%) H(%) N(%) O(%) ash(%)
HS 40.4 79.2 2.4 0.8 15.2 2.4
HS 40.5 82.6 1.9 0.9
HS 50.4 81.3 2.4 0.8 13.9 1.6
HS 50.5 80.8 1.8 0.8
HS 60.4 83.1 2.2 0.8
HS 60.5 80.7 1.7 0.7 16.1 0.8
HH 60.3 76.9 2.6 1.7
HH 60.4 80.4 2.6 1.5 12.4 3.1
HH 60.5 70.3 1.9 2.3 22.6 2.9
HH 50.4 77.2 1.9 1.4 16.1 3.4
HH 40.4 78.2 2.0 1.5
HH 30.4 77.5 1.8 1.8
raw HS 49.4 6.3 0.3 43.6 0.4
raw HH 42.7 5.2 0.9 45.4 5.8

APPENDIX E
TGA RESULTS
Figure E.1 TGA Result of 40% H3PO4 Impregnated Hazelnut Shell at 400 ºC (HS 40.4)
107

Figure E.2 TGA Result of 50% H3PO4 Impregnated Hazelnut Shell at 400 ºC (HS 50.4)
Figure E.3 TGA Result of 60% H3PO4 Impregnated Hazelnut Shell at 500 ºC (HS 60.5)
108
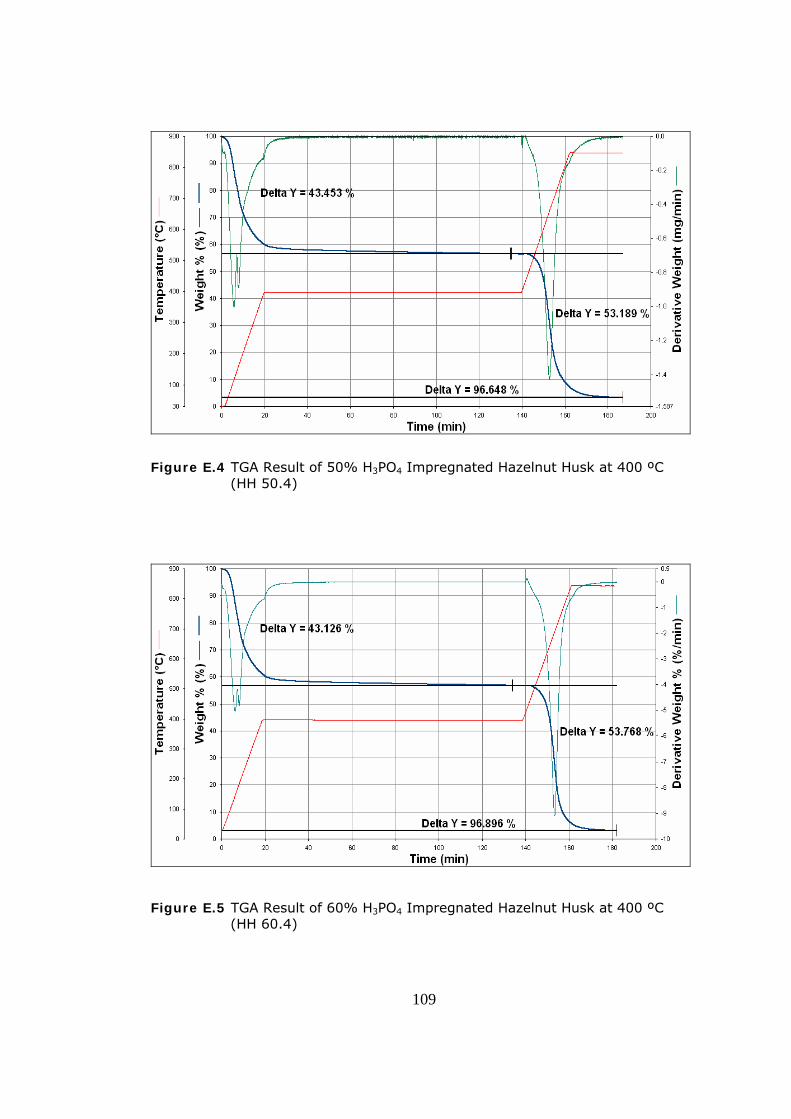
Figure E.4 TGA Result of 50% H3PO4 Impregnated Hazelnut Husk at 400 ºC (HH 50.4)
Figure E.5 TGA Result of 60% H3PO4 Impregnated Hazelnut Husk at 400 ºC (HH 60.4)
109

Figure E.6 TGA Result of 60% H3PO4 Impregnated Hazelnut Husk at 500 ºC (HH 60.5)
110