Embed Size (px)
Citation preview

FINAL ENVIRONMENTAL ASSESSMENT
PARADISE FOSSIL PLANT UNITS 1 AND 2 MERCURY AND AIR TOXICS STANDARDS COMPLIANCE
PROJECT Muhlenberg County, Kentucky
Prepared by: TENNESSEE VALLEY AUTHORITY
Knoxville, Tennessee
November 2013
To request further information, contact:
Charles P. Nicholson NEPA Interface
Tennessee Valley Authority 400 West Summit Hill Drive, WT 11D Knoxville, Tennessee 37902–1499
E–mail: [email protected]

Table of Contents
Final Environmental Assessment i
Table of Contents
1.0 PURPOSE AND NEED FOR ACTION ..................................................................................... 1
1.1. Introduction ............................................................................................................................... 1 1.2. Purpose and Need .................................................................................................................... 1 1.3. Location and Description .......................................................................................................... 2
1.3.1. Paradise Fossil Plant ......................................................................................................... 2 1.3.2. Existing Coal Generation and Support Facilities ............................................................... 2
1.4. Related Environmental Reviews and Initiatives ....................................................................... 5 1.5. Scope of the Environmental Assessment ................................................................................. 5 1.6. Public and Agency Involvement ............................................................................................... 6 1.7. Necessary Permits or Licenses ................................................................................................ 6
2.0 ALTERNATIVES ....................................................................................................................... 9
2.1. Summary of Alternatives .......................................................................................................... 9 2.1.1. Alternative A – No Action Alternative ................................................................................. 9 2.1.2. Alternative B – Install and Operate Pulse Jet Fabric Filter Systems ................................. 9 2.1.3. Alternative C – Construct and Operate Combustion Turbine/Combined
Cycle Plant ...................................................................................................................... 11 2.2. Detailed Description of TVA’s Action Alternatives .................................................................. 11
2.2.1. Alternative B – Install and Operate Pulse Jet Fabric Filter Systems ............................... 11 2.2.1.1. Hydrated Lime Injection ............................................................................................. 14 2.2.1.2. Fly Ash Management ................................................................................................. 14 2.2.1.3. Transmission and Electrical System Components .................................................... 14 2.2.1.4. Construction Activities ............................................................................................... 14
2.2.2. Alternative C – Construct and Operate Combustion Turbine/Combined Cycle Plant ...................................................................................................................... 17
2.2.2.1. Emission Monitoring and Controls ............................................................................. 18 2.2.2.2. Natural Gas and Fuel Oil Supply, Delivery and Storage ........................................... 18 2.2.2.3. Transmission and Electrical System Components .................................................... 20 2.2.2.4. Construction Activities ............................................................................................... 20
2.3. Alternatives Considered but Eliminated from Detailed Analysis ............................................ 21 2.3.1. Emission Control Alternatives .......................................................................................... 21
2.3.1.1. Wet Electrostatic Precipitators .................................................................................. 21 2.3.1.2. Dry Electrostatic Precipitators ................................................................................... 23
2.3.2. Biomass Conversion for PAF Units 1 and 2 .................................................................... 23 2.3.3. Generation Replacement by Transmission Upgrades ..................................................... 23 2.3.4. Generation Replacement by Increased Efficiency ........................................................... 24 2.3.5. Generation Replacement with Wind and Solar Renewable Energy
Sources ........................................................................................................................... 24 2.3.6. Natural Gas Pipeline Corridor Alternatives ...................................................................... 24 2.3.7. Fly Ash Management Alternatives ................................................................................... 24
2.4. Comparison of Alternatives .................................................................................................... 25 2.5. Preferred Alternative ............................................................................................................... 27 2.6. Summary of Mitigation Measures and BMPs ......................................................................... 28
3.0 AFFECTED ENVIRONMENT AND ENVIRONMENTAL CONSEQUENCES ........................ 30
3.1. Air Quality ............................................................................................................................... 30 3.1.1. Affected Environment ....................................................................................................... 30 3.1.2. Environmental Consequences ......................................................................................... 30

Paradise Units 1 and 2
ii Final Environmental Assessment
3.1.2.1. Alternative A – No Action .......................................................................................... 30 3.1.2.2. Alternative B – Install and Operate Pulse Jet Fabric Filter Systems ........................ 30 3.1.2.3. Alternative C – Construct and Operate Combustion
Turbine/Combined Cycle Plant ................................................................................. 31 3.1.2.4. Cumulative Affects .................................................................................................... 34 3.1.2.5. Mitigation Measures and BMPs ................................................................................ 35
3.2. Climate Change ..................................................................................................................... 35 3.2.1. Affected Environment ...................................................................................................... 35 3.2.2. Environmental Consequences......................................................................................... 35
3.2.2.1. Alternative A – No Action .......................................................................................... 35 3.2.2.2. Alternative B – Install and Operate Pulse Jet Fabric Filter Systems ........................ 36 3.2.2.3. Alternative C – Construct and Operate Combustion
Turbine/Combined Cycle Plant ................................................................................. 36 3.2.2.4. Cumulative Affects .................................................................................................... 37 3.2.2.5. Mitigation Measures and BMPs ................................................................................ 37
3.3. Vegetation .............................................................................................................................. 37 3.3.1. Affected Environment ...................................................................................................... 37 3.3.2. Environmental Consequences......................................................................................... 39
3.3.2.1. Alternative A – No Action .......................................................................................... 39 3.3.2.2. Alternative B – Install and Operate Pulse Jet Fabric Filter Systems ........................ 39 3.3.2.3. Alternative C – Construct and Operate Combustion
Turbine/Combined Cycle Plant ................................................................................. 39 3.3.2.4. Cumulative Impacts ................................................................................................... 41 3.3.2.5. Mitigation Measures and BMPs ................................................................................ 41
3.4. Wildlife .................................................................................................................................... 41 3.4.1. Affected Environment ...................................................................................................... 41 3.4.2. Environmental Consequences......................................................................................... 42
3.4.2.1. Alternative A – No Action .......................................................................................... 42 3.4.2.2. Alternative B – Install and Operate Pulse Jet Fabric Filter Systems ........................ 42 3.4.2.3. Alternative C – Construct and Operate Combustion
Turbine/Combined Cycle Plant ................................................................................. 42 3.4.2.4. Cumulative Impacts ................................................................................................... 43 3.4.2.5. Mitigation Measures and BMPs ................................................................................ 43
3.5. Threatened and Endangered Species ................................................................................... 43 3.5.1. Affected Environment ...................................................................................................... 43 3.5.2. Environmental Consequences......................................................................................... 49
3.5.2.1. Alternative A – No Action .......................................................................................... 49 3.5.2.2. Alternative B – Install and Operate Pulse Jet Fabric Filter Systems ........................ 49 3.5.2.3. Alternative C – Construct and Operate Combustion
Turbine/Combined Cycle Plant ................................................................................. 50 3.5.2.4. Cumulative Impacts ................................................................................................... 50 3.5.2.5. Mitigation Measures and BMPs ................................................................................ 51
3.6. Aquatic Ecology ..................................................................................................................... 51 3.6.1. Affected Environment ...................................................................................................... 51 3.6.2. Environmental Consequences......................................................................................... 52
3.6.2.1. Alternative A – No Action .......................................................................................... 52 3.6.2.2. Alternative B – Install and Operate Pulse Jet Fabric Filter Systems ........................ 52 3.6.2.3. Alternative C – Construct and Operate Combustion
Turbine/Combined Cycle Plant ................................................................................. 52 3.6.2.4. Cumulative Impacts ................................................................................................... 52 3.6.2.5. Mitigation Measures and BMPs ................................................................................ 53
3.7. Wetlands ................................................................................................................................ 53
Table of Contents
Final Environmental Assessment iii
3.7.1. Affected Environment ....................................................................................................... 53 3.7.2. Environmental Consequences ......................................................................................... 54
3.7.2.1. Alternative A – No Action ........................................................................................... 54 3.7.2.2. Alternative B – Install and Operate Pulse Jet Fabric Filter Systems ......................... 54 3.7.2.3. Alternative C – Construct and Operate Combustion
Turbine/Combined Cycle Plant .................................................................................. 54 3.7.2.4. Cumulative Impacts ................................................................................................... 55 3.7.2.5. Mitigation Measures and BMPs ................................................................................. 55
3.8. Natural Areas, Parks and Recreation ..................................................................................... 55 3.8.1. Affected Environment ....................................................................................................... 55
3.8.1.1. Alternative A – No Action ........................................................................................... 56 3.8.1.2. Alternative B – Install and Operate Pulse Jet Fabric Filter Systems ......................... 56 3.8.1.3. Alternative C – Construct and Operate Combustion
Turbine/Combined Cycle Plant .................................................................................. 56 3.8.2. Cumulative Effects ........................................................................................................... 56
3.8.2.1. Mitigation Measures and BMPs ................................................................................. 57 3.9. Groundwater and Geology ..................................................................................................... 57
3.9.1. Affected Environment ....................................................................................................... 57 3.9.2. Environmental Consequences ......................................................................................... 58
3.9.2.1. Alternative A – No Action ........................................................................................... 58 3.9.2.2. Alternative B – Install and Operate Pulse Jet Fabric Filter Systems ......................... 58 3.9.2.3. Alternative C – Construct and Operate Combustion
Turbine/Combined Cycle Plant .................................................................................. 59 3.9.2.4. Cumulative Affects ..................................................................................................... 59 3.9.2.5. Mitigation Measures and BMPs ................................................................................. 59
3.10. Surface Water ......................................................................................................................... 59 3.10.1. Affected Environment ....................................................................................................... 59 3.10.2. Environmental Consequences ......................................................................................... 61
3.10.2.1. Alternative A – No Action ........................................................................................... 61 3.10.2.2. Alternative B – Install and Operate Pulse Jet Fabric Filter Systems ......................... 62 3.10.2.3. Alternative C – Construct and Operate Combustion
Turbine/Combined Cycle Plant .................................................................................. 67 3.11. Floodplains ............................................................................................................................. 75
3.11.1. Affected Environment ....................................................................................................... 75 3.11.2. Environmental Consequences ......................................................................................... 75
3.11.2.1. Alternative A – No Action ........................................................................................... 75 3.11.2.2. Alternative B – Install and Operate Pulse Jet Fabric Filter Systems ......................... 75 3.11.2.3. Alternative C – Construct and Operate Combustion
Turbine/Combined Cycle Plant .................................................................................. 76 3.11.3. Cumulative Impacts .......................................................................................................... 76 3.11.4. Mitigation Measures and BMPs ....................................................................................... 76
3.12. Cultural and Historic Resources ............................................................................................. 76 3.12.1. Affected Environment ....................................................................................................... 76 3.12.2. Environmental Consequences ......................................................................................... 80
3.12.2.1. Alternative A – No Action ........................................................................................... 80 3.12.2.2. Alternative B – Install and Operate Pulse Jet Fabric Filter Systems ......................... 80 3.12.2.3. Alternative C – Construct and Operate Combustion
Turbine/Combined Cycle Plant .................................................................................. 80 3.12.2.4. Cumulative Affects ..................................................................................................... 81 3.12.2.5. Mitigation Measures and BMPs ................................................................................. 81
3.13. Hazardous Waste ................................................................................................................... 81 3.13.1. Affected Environment ....................................................................................................... 81
Paradise Units 1 and 2
iv Final Environmental Assessment
3.13.2. Environmental Consequences......................................................................................... 82 3.13.2.1. Alternative A – No Action .......................................................................................... 82 3.13.2.2. Alternative B – Install and Operate Pulse Jet Fabric Filter Systems ........................ 82 3.13.2.3. Alternative C – Construct and Operate Combustion
Turbine/Combined Cycle Plant ................................................................................. 82 3.13.2.4. Cumulative Effects .................................................................................................... 82 3.13.2.5. Mitigation Measures and BMPs ................................................................................ 83
3.14. Solid Waste ............................................................................................................................ 83 3.14.1. Affected Environment ...................................................................................................... 83 3.14.2. Environmental Consequences......................................................................................... 84
3.14.2.1. Alternative A – No Action .......................................................................................... 84 3.14.2.2. Alternative B – Install and Operate Pulse Jet Fabric Filter Systems ........................ 84 3.14.2.3. Alternative C – Construct and Operate Combustion
Turbine/Combined Cycle Plant ................................................................................. 85 3.14.2.4. Cumulative Effects .................................................................................................... 85 3.14.2.5. Mitigation Measures and BMPs ................................................................................ 85
3.15. Land Use and Prime Farmland .............................................................................................. 86 3.15.1. Affected Environment ...................................................................................................... 86 3.15.2. Environmental Consequences......................................................................................... 86
3.15.2.1. Alternative A – No Action .......................................................................................... 86 3.15.2.2. Alternative B – Install and Operate Pulse Jet Fabric Filter Systems ........................ 86 3.15.2.3. Alternative C – Construct and Operate Combustion
Turbine/Combined Cycle Plant ................................................................................. 87 3.15.2.4. Cumulative Effects .................................................................................................... 87 3.15.2.5. Mitigation Measures and BMPs ................................................................................ 87
3.16. Transportation ........................................................................................................................ 87 3.16.1. Affected Environment ...................................................................................................... 87 3.16.2. Environmental Consequences......................................................................................... 90
3.16.2.1. Alternative A – No Action .......................................................................................... 90 3.16.2.2. Alternative B – Install and Operate Pulse Jet Fabric Filter Systems ........................ 90 3.16.2.3. Alternative C – Construct and Operate Combustion
Turbine/Combined Cycle Plant ................................................................................. 91 3.16.2.4. Cumulative Effects .................................................................................................... 91 3.16.2.5. Mitigation Measures and BMPs ................................................................................ 92
3.17. Noise ...................................................................................................................................... 92 3.17.1. Affected Environment ...................................................................................................... 92 3.17.2. Environmental Consequences......................................................................................... 94
3.17.2.1. Alternative A – No Action .......................................................................................... 94 3.17.2.2. Alternative B – Install and Operate Pulse Jet Fabric Filter Systems ........................ 94 3.17.2.3. Alternative C – Construct and Operate Combustion
Turbine/Combined Cycle Plant ................................................................................. 96 3.17.2.4. Cumulative Effects .................................................................................................... 97 3.17.2.5. Mitigation Measures and BMPs ................................................................................ 98
3.18. Visual Resources ................................................................................................................... 98 3.18.1. Affected Environment ...................................................................................................... 98 3.18.2. Environmental Consequences......................................................................................... 98
3.18.2.1. Alternative A – No Action .......................................................................................... 98 3.18.2.2. Alternative B – Install and Operate Pulse Jet Fabric Filter Systems ........................ 99 3.18.2.3. Alternative C – Construct and Operate Combustion
Turbine/Combined Cycle Plant ................................................................................. 99 3.18.2.4. Cumulative Effects .................................................................................................. 100 3.18.2.5. Mitigation Measures and BMPs .............................................................................. 100
Table of Contents
Final Environmental Assessment v
3.19. Socioeconomics and Environmental Justice ........................................................................ 100 3.19.1. Affected Environment ..................................................................................................... 100 3.19.2. Environmental Consequences ....................................................................................... 104
3.19.2.1. Alternative A – No Action ......................................................................................... 104 3.19.2.2. Alternative B – Install and Operate Pulse Jet Fabric Filter Systems ....................... 104 3.19.2.3. Alternative C – Construct and Operate Combustion
Turbine/Combined Cycle Plant ................................................................................ 105 3.19.2.4. Cumulative Effects ................................................................................................... 106 3.19.2.5. Mitigation Measures and BMPs ............................................................................... 107
4.0 LITERATURE CITED ........................................................................................................... 109
5.0 LIST OF PREPARERS ......................................................................................................... 115
5.1. Contributors – Project Management ..................................................................................... 115 5.2. Contributors – Resource Specialists .................................................................................... 115
6.0 ENVIRONMENTAL ASSESSMENT RECIPIENTS .............................................................. 119
6.1. Federal Agencies Receiving Notification and EA (Hard Copy, CD, or Electronic) ............................................................................................................................. 119
6.2. Federally Recognized Tribes Receiving Notification (Email Notice of Availability) ............................................................................................................................ 119
6.3. State Agencies Receiving Notification and EA (Hard Copy, CD, or Electronic) ................... 119 6.4. Other Organizations Receiving Notification and EA (Hard Copy, CD, or
Electronic) ............................................................................................................................. 119
List of Tables
Table 2–1. Comparison of Alternatives by Resource Area ............................................................ 25 Table 3–1. Potential PAF CT / CC Plant Operating Scenarios1 ..................................................... 33 Table 3–2. Potential Operating Scenarios for CT / CC Plant Auxiliary Equipment1 ....................... 33 Table 3–3. Comparison of Actual Units 1 and 2 Emissions and Future Potential CT
/CC Plant Emissions in Tons/Year ............................................................................... 34 Table 3–4. Land Use/ Land Cover Within Potential Pipeline Corridors .......................................... 38 Table 3–5. Results of Cost Path Analyses for Low Cost and High Cost Potential
Pipeline Routes in Corridors C1 and C2....................................................................... 40 Table 3–6. Federally and State-listed Plants Reported in the PAF Project Area ........................... 44 Table 3–7. Federally and State-listed Terrestrial Animals Within the PAF Area ............................ 45 Table 3–8. Federally– and State–listed Aquatic Animals in the PAF Project Area ........................ 48 Table 3–9. Percentage of Wetlands within the Potential Gas Pipeline Corridors .......................... 54 Table 3–10. Cost Path Analysis of Wetland Impacts Based on Area of Woody and
Emergent Herbaceous Wetlands Within Each Corridor ............................................... 55 Table 3–11. Current Average Annual Daily Process Inflows to the Peabody Fly Ash
Pond by Source ............................................................................................................ 60 Table 3–12. Combined Impact of Units 1 and 2 Fly Ash Sluice Total Mixed
Concentration Estimates .............................................................................................. 65 Table 3–13. Estimated Pollutant Concentrations Discharged to the Proposed CT/CC
Plant Process Pond ...................................................................................................... 72 Table 3–14 Previous Cultural Resource Investigations within 1 Mile of the PAF
Reservation ................................................................................................................... 77
Paradise Units 1 and 2
vi Final Environmental Assessment
Table 3–15 Previously Recorded Cultural Resource Sites within 1 Mile of the PAF Reservation .................................................................................................................. 78
Table 3–16. Annual Average Daily Traffic on Roads in the Vicinity of Paradise Fossil Plant ................................................................................................................... 88
Table 3–17. Typical Noise Levels .................................................................................................... 93 Table 3–18. Typical Construction Equipment Noise Levels ............................................................. 95 Table 3–19. Equipment Evaluated Sound Pressure Levels ............................................................. 96 Table 3–20. Past, Current, and Projected Populations .................................................................. 100 Table 3–21. Total Employment, Unemployment, and Per Capita Income ..................................... 101 Table 3–22 Racial and Ethnic Characteristics of the Labor Market Counties ............................... 103 Table 3–23. Comparison of Poverty Status for PAF Region .......................................................... 104
List of Figures
Figure 1–1. Paradise Fossil Plant Regional Location ....................................................................... 3 Figure 1–2. Paradise Fossil Plant Boundary and Existing Facilities ................................................. 4 Figure 2–1. Location of Proposed PJFF Systems ........................................................................... 10 Figure 2–2. Location of Proposed CT/CC Plant .............................................................................. 12 Figure 2–3. Typical Pulse Jet Fabric Filter System Design ............................................................. 13 Figure 2–4. Construction Laydown Areas for Proposed PJFF Equipment ..................................... 16 Figure 2–5. Typical CC Plant Configuration .................................................................................... 18 Figure 2–6. Gas Pipeline Corridor Options for Proposed CT/CC Plant .......................................... 19 Figure 2–7. Construction Laydown Areas for Proposed CT/CC Plant ............................................ 22 Figure 3–1 Road Transportation Network in the Vicinity of Paradise Fossil Plant ......................... 89
List of Appendices
APPENDIX A. NEPA COMPLIANCE PROCESS OVERVIEW ....................................................... 121
APPENDIX B. REGULATORY AGENCY CORRESPONDENCE .................................................. 123
APPENDIX C. PUBLIC AND AGENCY COMMENTS RECEIVED ON DRAFT EA AND TVA’S RESPONSE TO COMMENTS ......................................................................... 131
Acronyms and Abbreviations
Final Environmental Assessment vii
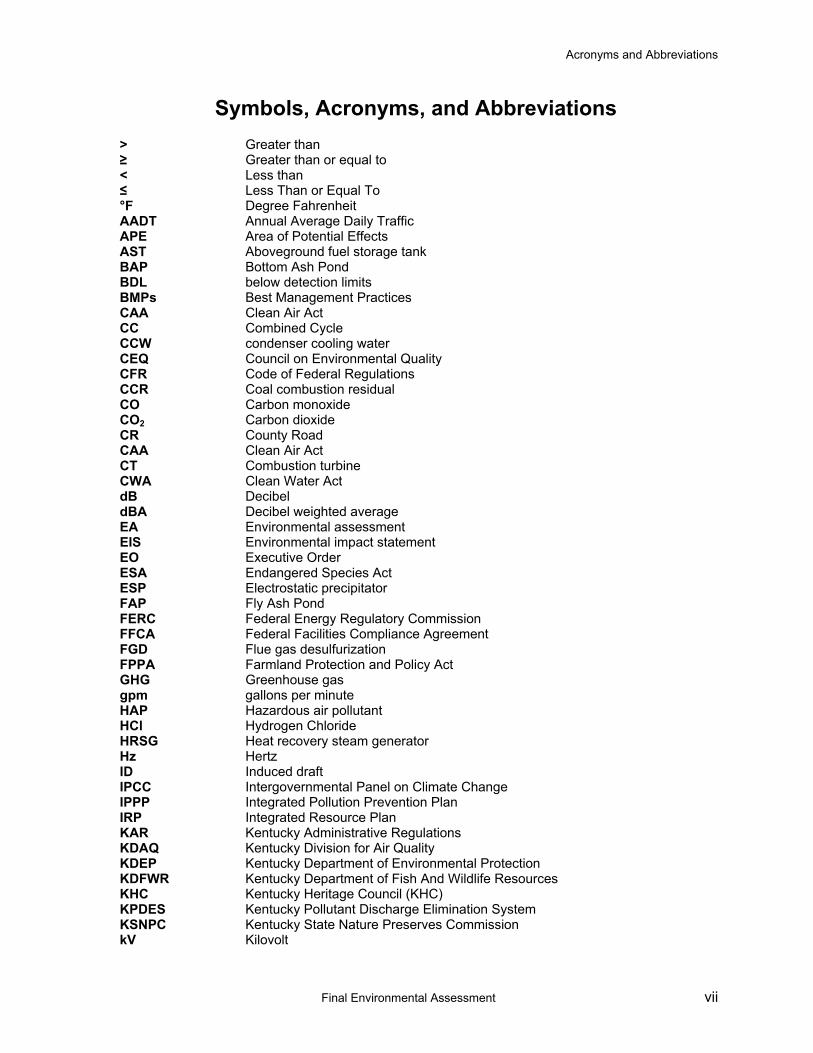
Symbols, Acronyms, and Abbreviations
> Greater than ≥ Greater than or equal to < Less than ≤ Less Than or Equal To °F Degree Fahrenheit AADT Annual Average Daily Traffic APE Area of Potential Effects AST Aboveground fuel storage tank BAP Bottom Ash Pond BDL below detection limits BMPs Best Management Practices CAA Clean Air Act CC Combined Cycle CCW condenser cooling water CEQ Council on Environmental Quality CFR Code of Federal Regulations CCR Coal combustion residual CO Carbon monoxide CO2 Carbon dioxide CR County Road CAA Clean Air Act CT Combustion turbine CWA Clean Water Act dB Decibel dBA Decibel weighted average EA Environmental assessment EIS Environmental impact statement EO Executive Order ESA Endangered Species Act ESP Electrostatic precipitator FAP Fly Ash Pond FERC Federal Energy Regulatory Commission FFCA Federal Facilities Compliance Agreement FGD Flue gas desulfurization FPPA Farmland Protection and Policy Act GHG Greenhouse gas gpm gallons per minute HAP Hazardous air pollutant HCl Hydrogen Chloride HRSG Heat recovery steam generator Hz Hertz ID Induced draft IPCC Intergovernmental Panel on Climate Change IPPP Integrated Pollution Prevention Plan IRP Integrated Resource Plan KAR Kentucky Administrative Regulations KDAQ Kentucky Division for Air Quality KDEP Kentucky Department of Environmental Protection KDFWR Kentucky Department of Fish And Wildlife Resources KHC Kentucky Heritage Council (KHC) KPDES Kentucky Pollutant Discharge Elimination System KSNPC Kentucky State Nature Preserves Commission kV Kilovolt

Paradise Units 1 and 2
viii Final Environmental Assessment
Symbols, Acronyms, and Abbreviations
KYTC Kentucky Transportation Cabinet lb pound lb/mmBtu pounds per million British thermal units lb/TBtu pounds per trillion British thermal units Ldn Day–night average sound level Leq Equivalent sound level LULC land use/land cover MATS Mercury And Air Toxics Standards MCL Maximum Contaminant Level mg/L milligrams per liter MGD million gallons per day mmBtu Million British thermal units MOA Memorandum of Agreement msl mean sea level mty million tons per year MW Megawatt MWh Megawatt–hour NWI National Wetland Inventory NAAQS National Ambient Air Quality Standards NCLD National Land Cover Database NEPA National Environmental Policy Act NESHAP National Emission Standards for Hazardous Air Pollutants NHPA National Historic Preservation Act NLCD National Land Cover Database NRHP National Register of Historic Places NO2 Nitrogen dioxide NOx Nitrogen oxides O3 Ozone OSA Office of State Archaeology PAF Paradise Fossil Plant PJFF Pulse jet fabric filter PM Particulate matter PM2.5 Particulate matter having a diameter of less than or equal to 2.5 microns PM10 Particulate matter having a diameter of less than or equal to 10 microns PSD Prevention of significant deterioration RCRA Resource Conservation and Recovery Act ROW Right–of–way RMP Risk Management Plan SC Simple cycle SCR Selective catalytic reduction SHPO State Historic Preservation Officer SO2 Sulfur dioxide SO3 Sulfur trioxide SPCC Spill Prevention Control and Countermeasures SR State Route SSC scrubber sludge complex s.u. standard units SWPPP Storm Water Pollution Prevention Plan TL transmission line TPY tons per year TVA Tennessee Valley Authority USACE U.S. Army Corps of Engineers USDA U.S. Department of Agriculture

Acronyms and Abbreviations
Final Environmental Assessment ix
Symbols, Acronyms, and Abbreviations
USDOT U.S. Department of Transportation USEPA U.S. Environmental Protection Agency USFWS U.S. Fish And Wildlife Service VOC volatile organic compound WET whole effluent toxicity WMA Wildlife Management Area

Chapter 1 – Purpose and Need
Final Environmental Assessment 1
CHAPTER 1
1.0 PURPOSE AND NEED FOR ACTION
1.1. Introduction
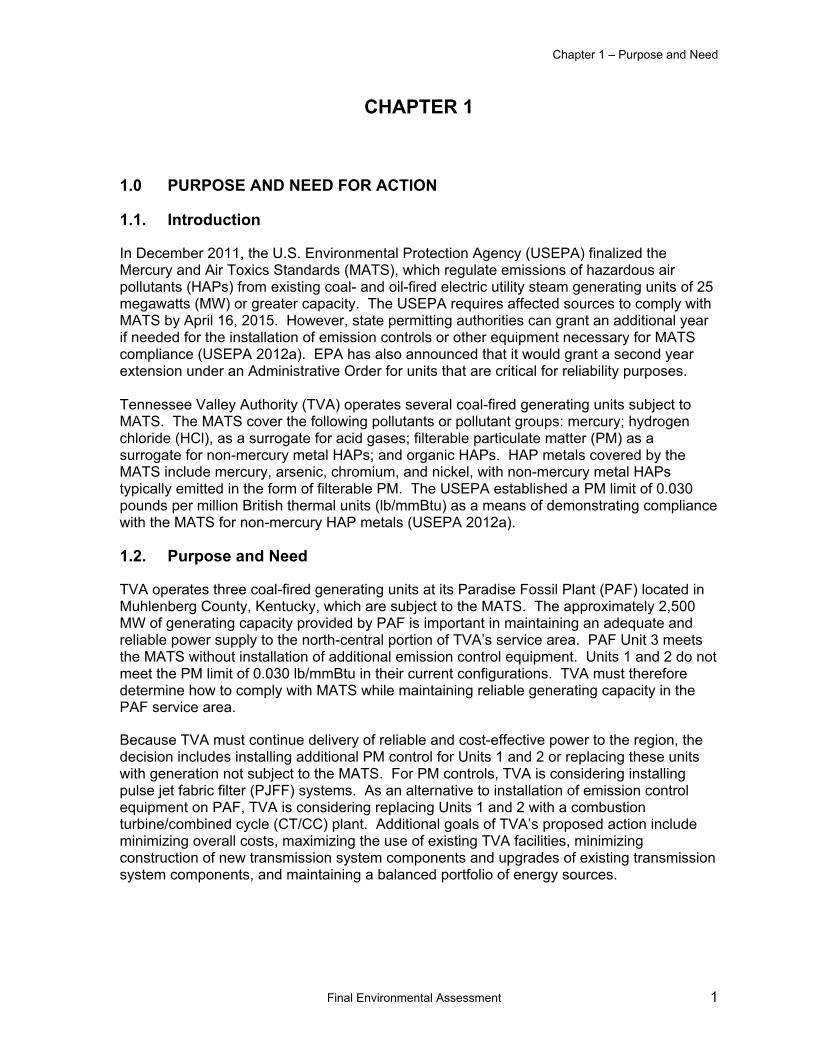
In December 2011, the U.S. Environmental Protection Agency (USEPA) finalized the Mercury and Air Toxics Standards (MATS), which regulate emissions of hazardous air pollutants (HAPs) from existing coal- and oil-fired electric utility steam generating units of 25 megawatts (MW) or greater capacity. The USEPA requires affected sources to comply with MATS by April 16, 2015. However, state permitting authorities can grant an additional year if needed for the installation of emission controls or other equipment necessary for MATS compliance (USEPA 2012a). EPA has also announced that it would grant a second year extension under an Administrative Order for units that are critical for reliability purposes. Tennessee Valley Authority (TVA) operates several coal-fired generating units subject to MATS. The MATS cover the following pollutants or pollutant groups: mercury; hydrogen chloride (HCl), as a surrogate for acid gases; filterable particulate matter (PM) as a surrogate for non-mercury metal HAPs; and organic HAPs. HAP metals covered by the MATS include mercury, arsenic, chromium, and nickel, with non-mercury metal HAPs typically emitted in the form of filterable PM. The USEPA established a PM limit of 0.030 pounds per million British thermal units (lb/mmBtu) as a means of demonstrating compliance with the MATS for non-mercury HAP metals (USEPA 2012a).
1.2. Purpose and Need
TVA operates three coal-fired generating units at its Paradise Fossil Plant (PAF) located in Muhlenberg County, Kentucky, which are subject to the MATS. The approximately 2,500 MW of generating capacity provided by PAF is important in maintaining an adequate and reliable power supply to the north-central portion of TVA’s service area. PAF Unit 3 meets the MATS without installation of additional emission control equipment. Units 1 and 2 do not meet the PM limit of 0.030 lb/mmBtu in their current configurations. TVA must therefore determine how to comply with MATS while maintaining reliable generating capacity in the PAF service area.
Because TVA must continue delivery of reliable and cost-effective power to the region, the decision includes installing additional PM control for Units 1 and 2 or replacing these units with generation not subject to the MATS. For PM controls, TVA is considering installing pulse jet fabric filter (PJFF) systems. As an alternative to installation of emission control equipment on PAF, TVA is considering replacing Units 1 and 2 with a combustion turbine/combined cycle (CT/CC) plant. Additional goals of TVA’s proposed action include minimizing overall costs, maximizing the use of existing TVA facilities, minimizing construction of new transmission system components and upgrades of existing transmission system components, and maintaining a balanced portfolio of energy sources.
Paradise Units 1 and 2
2 Final Environmental Assessment
1.3. Location and Description
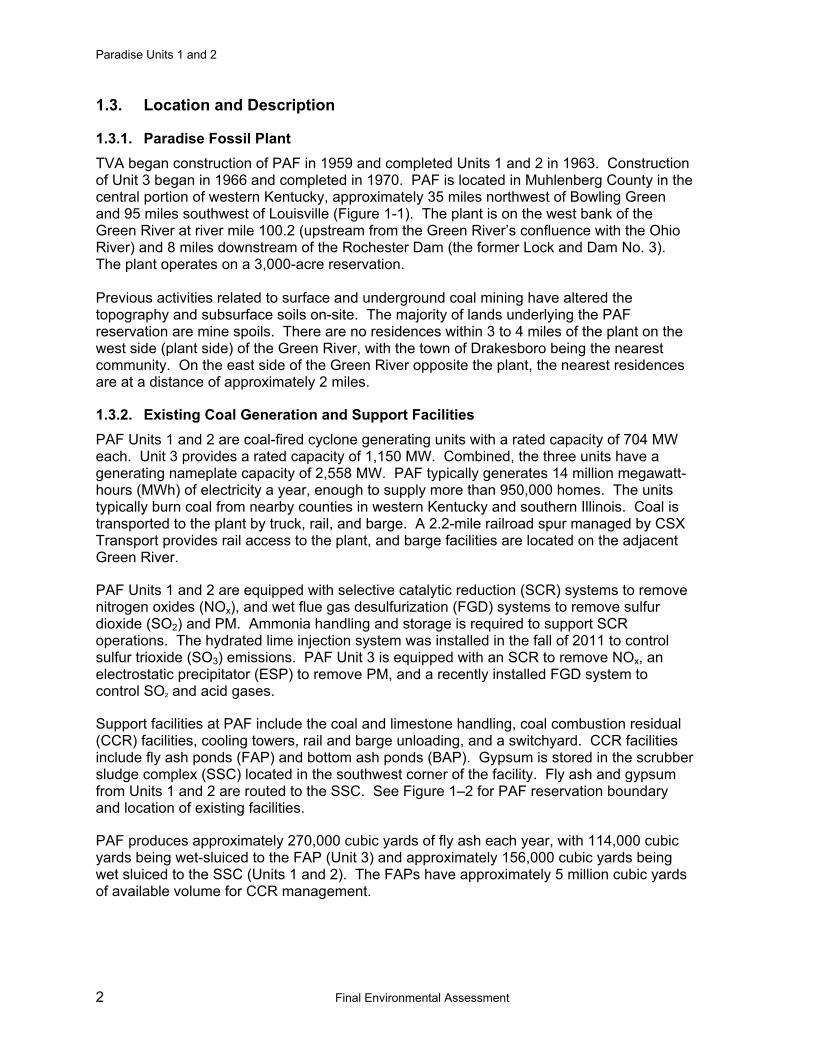
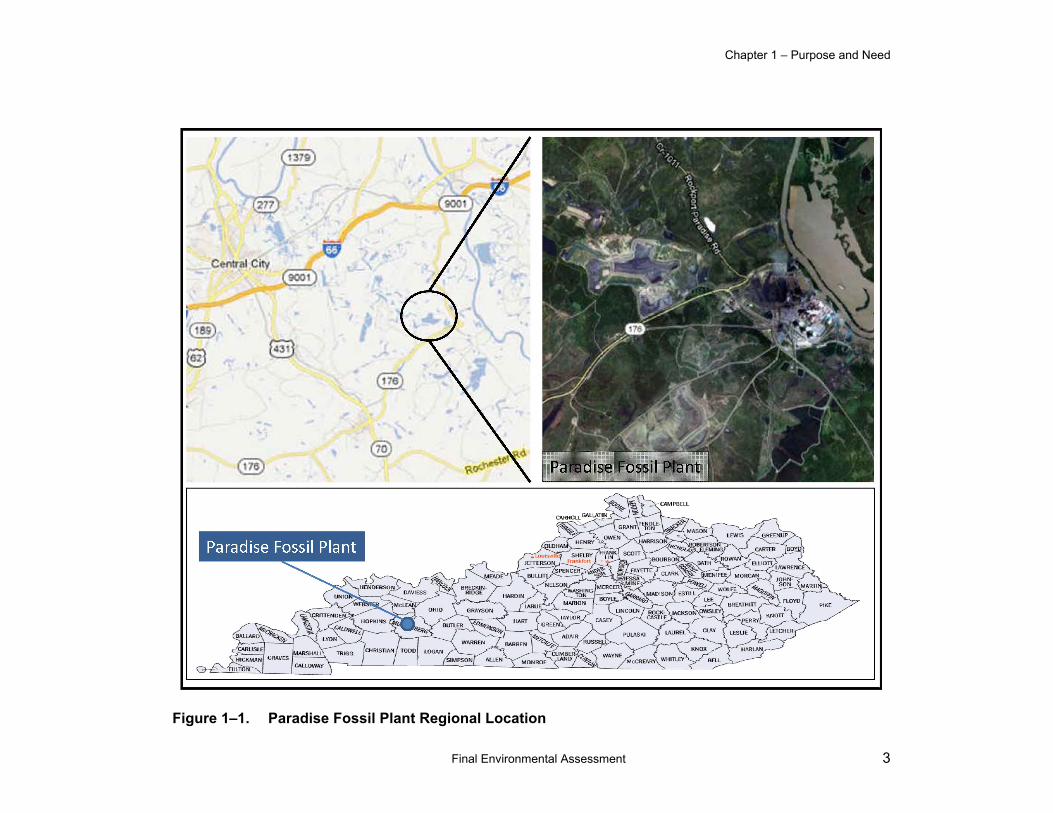
1.3.1. Paradise Fossil Plant TVA began construction of PAF in 1959 and completed Units 1 and 2 in 1963. Construction of Unit 3 began in 1966 and completed in 1970. PAF is located in Muhlenberg County in the central portion of western Kentucky, approximately 35 miles northwest of Bowling Green and 95 miles southwest of Louisville (Figure 1-1). The plant is on the west bank of the Green River at river mile 100.2 (upstream from the Green River’s confluence with the Ohio River) and 8 miles downstream of the Rochester Dam (the former Lock and Dam No. 3). The plant operates on a 3,000-acre reservation. Previous activities related to surface and underground coal mining have altered the topography and subsurface soils on-site. The majority of lands underlying the PAF reservation are mine spoils. There are no residences within 3 to 4 miles of the plant on the west side (plant side) of the Green River, with the town of Drakesboro being the nearest community. On the east side of the Green River opposite the plant, the nearest residences are at a distance of approximately 2 miles.
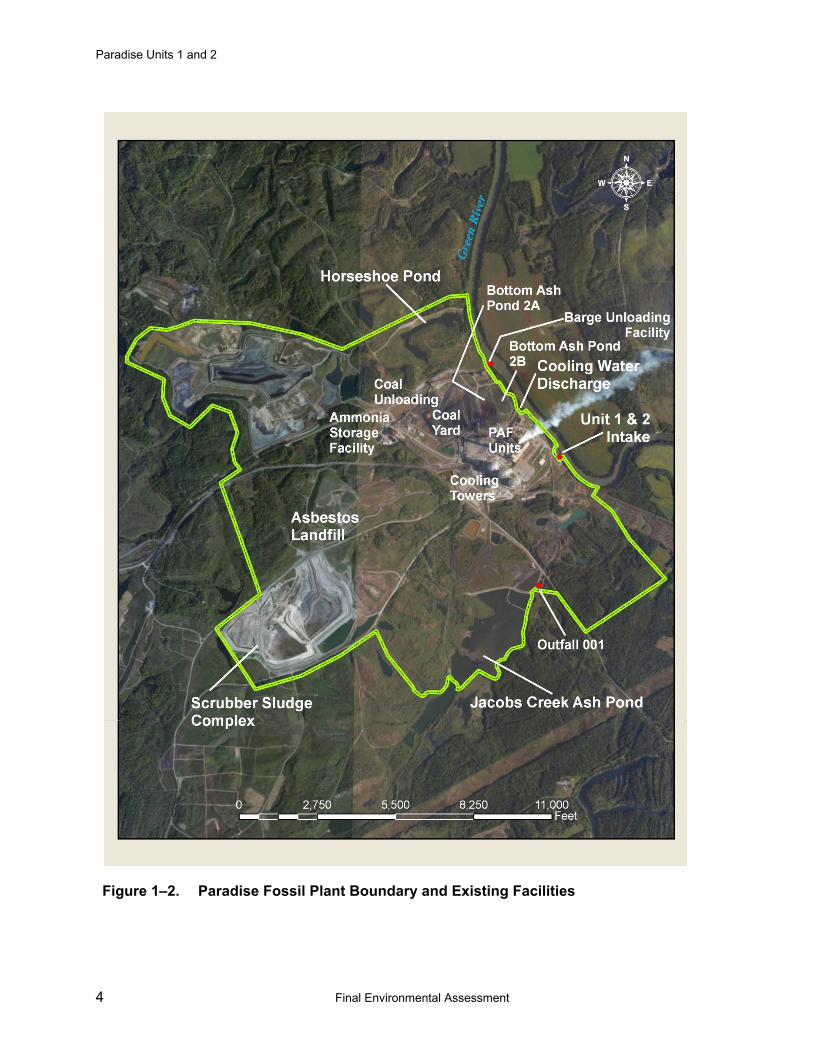
1.3.2. Existing Coal Generation and Support Facilities PAF Units 1 and 2 are coal-fired cyclone generating units with a rated capacity of 704 MW each. Unit 3 provides a rated capacity of 1,150 MW. Combined, the three units have a generating nameplate capacity of 2,558 MW. PAF typically generates 14 million megawatt-hours (MWh) of electricity a year, enough to supply more than 950,000 homes. The units typically burn coal from nearby counties in western Kentucky and southern Illinois. Coal is transported to the plant by truck, rail, and barge. A 2.2-mile railroad spur managed by CSX Transport provides rail access to the plant, and barge facilities are located on the adjacent Green River.
PAF Units 1 and 2 are equipped with selective catalytic reduction (SCR) systems to remove nitrogen oxides (NOx), and wet flue gas desulfurization (FGD) systems to remove sulfur dioxide (SO2) and PM. Ammonia handling and storage is required to support SCR operations. The hydrated lime injection system was installed in the fall of 2011 to control sulfur trioxide (SO3) emissions. PAF Unit 3 is equipped with an SCR to remove NOx, an electrostatic precipitator (ESP) to remove PM, and a recently installed FGD system to control SO2 and acid gases.
Support facilities at PAF include the coal and limestone handling, coal combustion residual (CCR) facilities, cooling towers, rail and barge unloading, and a switchyard. CCR facilities include fly ash ponds (FAP) and bottom ash ponds (BAP). Gypsum is stored in the scrubber sludge complex (SSC) located in the southwest corner of the facility. Fly ash and gypsum from Units 1 and 2 are routed to the SSC. See Figure 1–2 for PAF reservation boundary and location of existing facilities.
PAF produces approximately 270,000 cubic yards of fly ash each year, with 114,000 cubic yards being wet-sluiced to the FAP (Unit 3) and approximately 156,000 cubic yards being wet sluiced to the SSC (Units 1 and 2). The FAPs have approximately 5 million cubic yards of available volume for CCR management.
Chapter 1 – Purpose and Need
Final Environmental Assessment 3
Figure 1–1. Paradise Fossil Plant Regional Location
Paradise Units 1 and 2
4 Final Environmental Assessment
Figure 1–2. Paradise Fossil Plant Boundary and Existing Facilities
Chapter 1 – Purpose and Need
Final Environmental Assessment 5
1.4. Related Environmental Reviews and Initiatives
In 2011, TVA completed an Integrated Resource Plan (IRP) to detail how it would meet demands for electric power in its service area for the next 20 years while fulfilling its mission of providing low-cost reliable power, environmental stewardship, and economic development (TVA 2011a). TVA released the accompanying IRP environmental impact statement (EIS) in March 2011 (TVA 2011b). This environmental assessment (EA) tiers from the 2011 IRP EIS and analyzes the potential impacts of implementing requirements to meet MATS at PAF. Previously completed environmental reviews relevant to this EA are summarized below:
• Environmental Impact Statement and Record of Decision, TVA’s Integrated Resource Plan, April 2011 (TVA 2011b).
• Environmental Assessment and Finding of No Significant Impact, John Sevier Fossil Plant, Addition of Gas-Fired Combustion Turbine /combined Cycle Generating Capacity and Associated Gas Pipeline, March 2010 (TVA 2010).
• Environmental Assessment, Installation of Flue Gas Desulfurization System on Paradise Fossil Plant Unit 3, Muhlenberg County, Kentucky, March 2003 (TVA 2003).
• Environmental Assessment and Finding of No Significant Impact, Paradise Fossil Plant Units 1, 2, and 3 Selective Catalytic Reduction Systems for Nitrogen Oxide Control, November 1999 (TVA 1999).
In addition to the above reviews, TVA’s systemwide initiative for managing CCR has been considered in this EA. TVA’s Board passed a resolution in 2009 to address operations and standards related to management of CCR including fly ash and scrubber waste. TVA subsequently developed a CCR management plan to convert TVA’s wet CCR facilities to dry operations (TVA 2009a). This plan is being implemented through individual projects for individual fossil plants and applicable National Environmental Policy Act (NEPA) reviews. For PAF, CCR would continue to be wet sluiced until equipment and facilities for dry handling and storage of CCR and closure plans for the surface impoundments were designed and implemented. TVA will conduct the necessary environmental reviews during the planning of these future actions.
1.5. Scope of the Environmental Assessment
The geographic scope of this analysis includes the 15-acre site for the new PJFF systems for controlling Units 1 and 2, the approximately 50-acre site for the new CT/CC plant on the PAF reservation, and approximately 50 acres of construction laydown areas for both alternatives. The scope also includes potential natural gas pipeline corridors within which a gas pipeline(s) may be located by the gas supplier. TVA prepared this EA to comply with the NEPA and regulations promulgated by the Council on Environmental Quality (CEQ) and TVA for implementing NEPA. See Appendix A for more information on the NEPA compliance process for this proposed action. Through internal scoping of the proposed action, TVA determined the resources below potentially impacted by the alternatives considered.
Paradise Units 1 and 2
6 Final Environmental Assessment
• Air Quality and Climate Change • Groundwater and Geology
• Surface Water and Floodplains • Biological Resources (Vegetation, Wildlife, Threatened and Endangered Species, Aquatic Ecology, Wetlands)
• Natural Areas, Parks and Recreation
• Land Use and Prime Farmland
• Cultural and Historic Resources • Transportation
• Socioeconomics and Environmental Justice
• Hazardous Waste
• Solid Waste • Visual Resources and Noise
TVA’s action would satisfy the requirements of Executive Order (EO) 11988 (Floodplains Management), EO 11990 (Protection of Wetlands), and EO 13112 (Invasive Species) and applicable laws including the National Historic Preservation Act of 1966 (NHPA), Endangered Species Act of 1973 (ESA), Clean Water Act of 1972 (CWA), and Clean Air Act (CAA) Amendments of 1990.
1.6. Public and Agency Involvement
TVA’s public and agency involvement includes publication of a notice of availability and a 30-day public review of the draft EA. The availability of the draft EA was announced in newspapers that serve the Muhlenberg County area: Bowling Green Daily News, Central City Leader News, and Central City Times Argus. Copies of the draft EA were made available in the Central City Public Library. The draft EA was also posted on TVA’s website. TVA’s agency involvement includes circulation of the draft EA to local, state, and federal agencies and federally recognized tribes as part of the review. Chapter 6 provides a list of agencies, tribes, and organizations notified of the availability of the draft EA.
TVA received 304 comments on the draft EA. The majority of these comments were short, one or two sentence statements supporting the continued use of coal to generate electricity. Fifty-nine comments were form letters stating a preference for Alternative B, which would result in the installation of the pulse jet fabric filter systems on PAF Units 1 and 2 and their continued long-term coal-fired operation. Appendix C contains the comments on the draft EA and TVA’s responses to those comments.
This Final EA includes discussion and a preliminary review of a natural gas pipeline(s) that would be a necessary component of the new CT/CC plant. The final route of the pipeline(s) will be subject to Federal Energy Regulatory Commission (FERC) jurisdiction and additional review of it would be undertaken by FERC. In accordance with its NEPA procedures, FERC would invite public participation in this review process. TVA would be a cooperating or participating agency in the FERC NEPA review.
1.7. Necessary Permits or Licenses
TVA would obtain all necessary permits, licenses, and approvals required for the alternative selected. TVA anticipates the following may be required for implementing either of the build alternatives:
Chapter 1 – Purpose and Need
Final Environmental Assessment 7
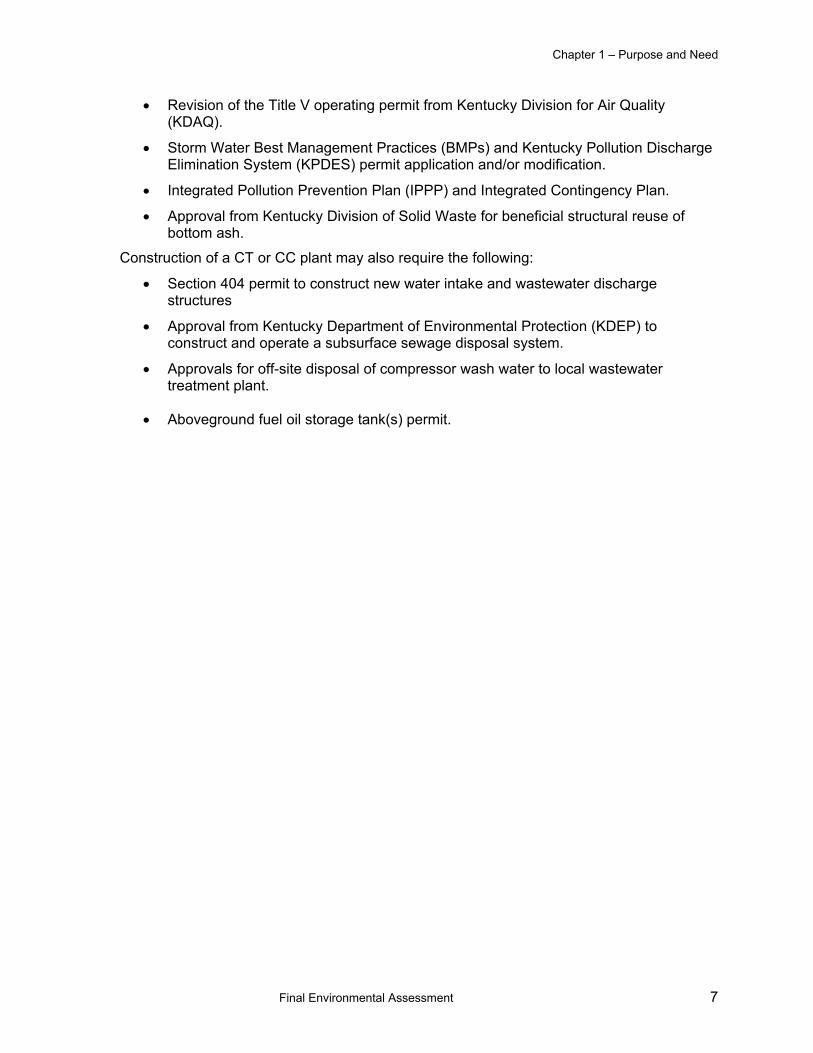
• Revision of the Title V operating permit from Kentucky Division for Air Quality (KDAQ).
• Storm Water Best Management Practices (BMPs) and Kentucky Pollution Discharge Elimination System (KPDES) permit application and/or modification.
• Integrated Pollution Prevention Plan (IPPP) and Integrated Contingency Plan.
• Approval from Kentucky Division of Solid Waste for beneficial structural reuse of bottom ash.
Construction of a CT or CC plant may also require the following:
• Section 404 permit to construct new water intake and wastewater discharge structures
• Approval from Kentucky Department of Environmental Protection (KDEP) to construct and operate a subsurface sewage disposal system.
• Approvals for off-site disposal of compressor wash water to local wastewater treatment plant.
• Aboveground fuel oil storage tank(s) permit.

Chapter 2 – Alternatives
Final Environmental Assessment 9
CHAPTER 2
2.0 ALTERNATIVES
TVA has determined that two action alternatives meet the purpose and need of the proposed action. The alternatives evaluated in this EA include No Action (Alternative A), Install and Operate Pulse Jet Fabric Filter Systems (PJFF) (Alternative B), and Construct and Operate Combustion Turbine/Combined Cycle Plant (Alternative C).
2.1. Summary of Alternatives
2.1.1. Alternative A – No Action Alternative Under Alternative A, PAF would continue operation of Units 1 and 2 to maintain the required power generating capacity in the region and would not install the emission controls necessary to comply with MATS. Although TVA would not operate a facility out of compliance, TVA has chosen to characterize the continued operation of Units 1 and 2 without installing the additional emissions controls as the No Action Alternative in order to provide a benchmark to compare the environmental effects of the proposed action alternatives. This alternative does not meet the purpose and need of TVA’s proposed action.
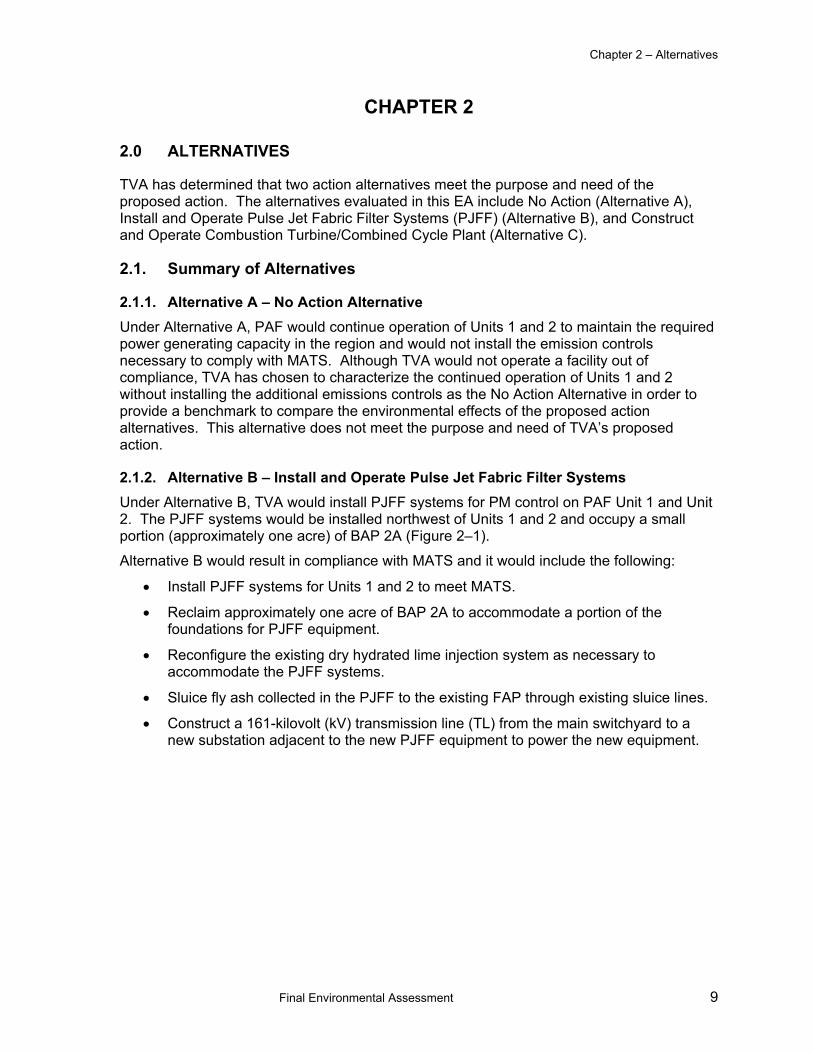
2.1.2. Alternative B – Install and Operate Pulse Jet Fabric Filter Systems Under Alternative B, TVA would install PJFF systems for PM control on PAF Unit 1 and Unit 2. The PJFF systems would be installed northwest of Units 1 and 2 and occupy a small portion (approximately one acre) of BAP 2A (Figure 2–1).
Alternative B would result in compliance with MATS and it would include the following:
• Install PJFF systems for Units 1 and 2 to meet MATS.
• Reclaim approximately one acre of BAP 2A to accommodate a portion of the foundations for PJFF equipment.
• Reconfigure the existing dry hydrated lime injection system as necessary to accommodate the PJFF systems.
• Sluice fly ash collected in the PJFF to the existing FAP through existing sluice lines.
• Construct a 161-kilovolt (kV) transmission line (TL) from the main switchyard to a new substation adjacent to the new PJFF equipment to power the new equipment.
Paradise Units 1 and 2
10 Final Environmental Assessment
Figure 2–1. Location of Proposed PJFF Systems

Chapter 2 – Alternatives
Final Environmental Assessment 11
2.1.3. Alternative C – Construct and Operate Combustion Turbine/Combined Cycle Plant
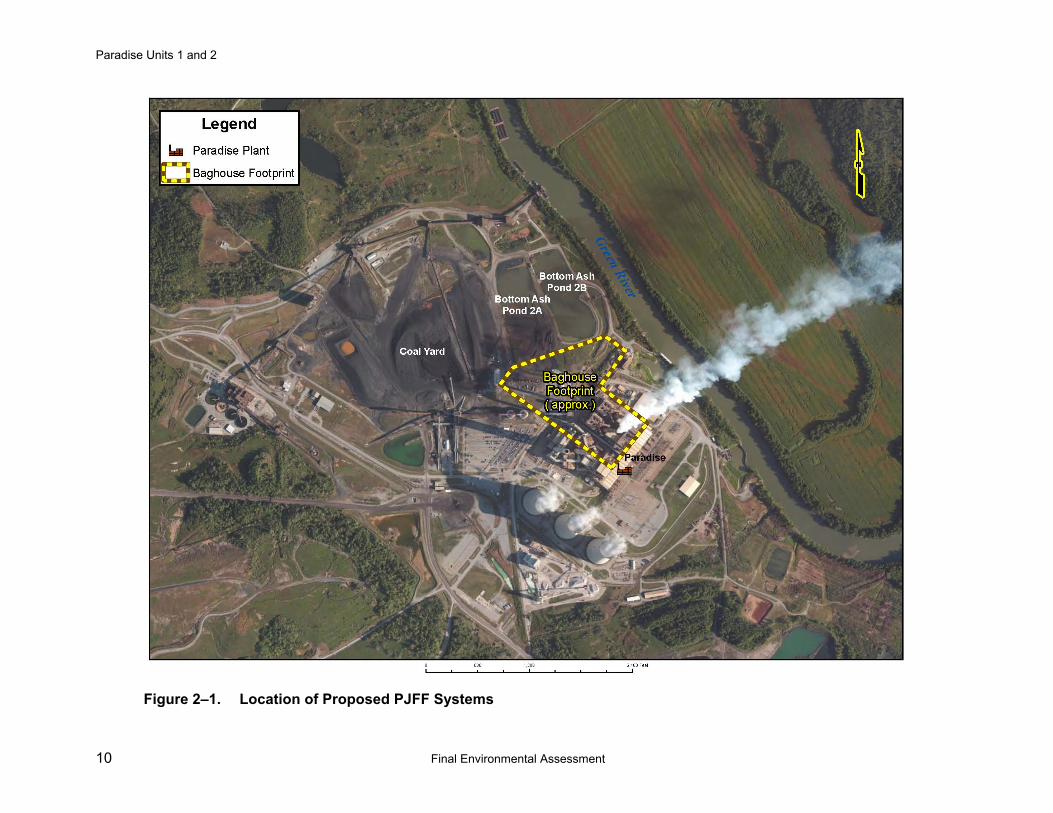
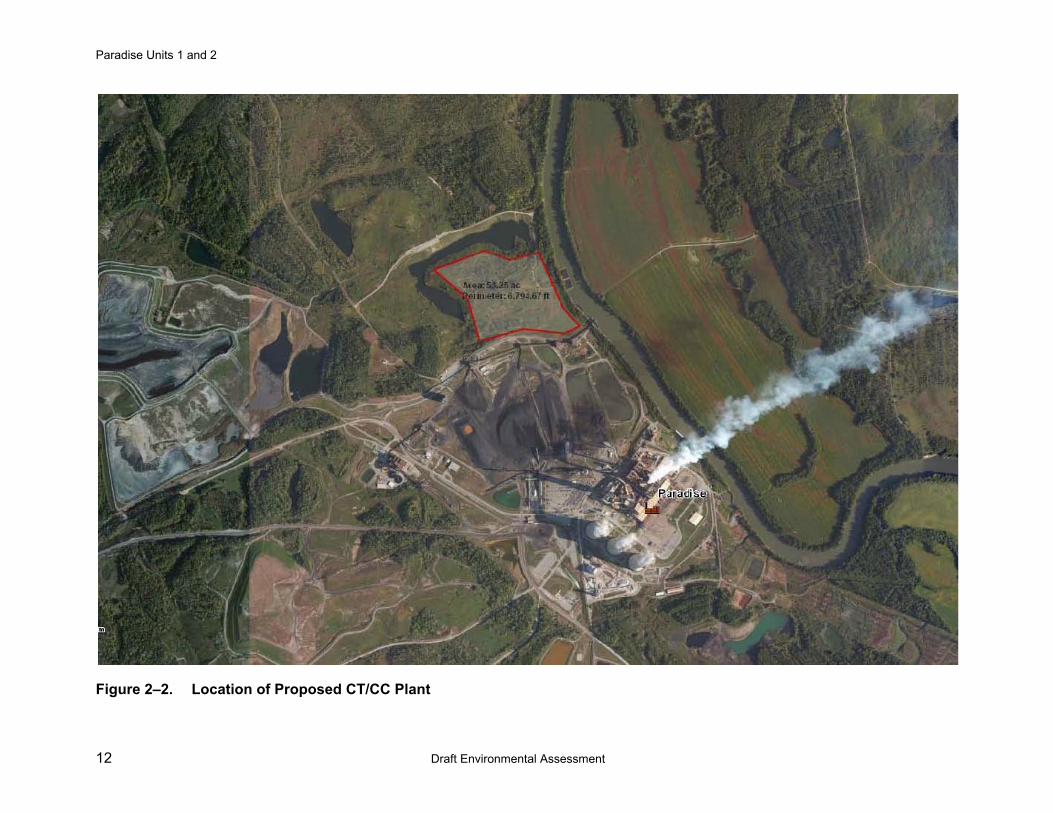
Alternative C includes construction and operation of a new CT/CC plant with a summer generating capacity of up to approximately 1,025 MW when operated in combined cycle mode. This alternative also includes associated gas pipeline(s). The CT/CC plant would be located just north of the existing coal pile and to the west of the Green River on an approximately 50–acre site (Figure 2–2). Alternative C would include the following:
• Install three or four natural gas-fired CT generators each with a capacity of approximately 200 MW.
• Construct 161-kV transmission line(s) from the main switchyard to a new switchyard at the CT/CC plant.
• Construct natural gas pipeline(s) to connect the plant to interstate gas pipeline(s).
• Install auxiliary boiler to provide start-up steam for PAF Unit 3.
• Install pond to hold storm water flows from the site.
• Obtain potable water service from existing public water supply for operational use.
• Install tanks to store fuel oil, service water, and demineralized water.
• Should fuel oil be selected for use as the back-up fuel supply, install fuel oil storage tanks and unloading station for tanker trucks.
Plant components specific to CC operation include the following:
• Install three heat recovery steam generators (HRSG) and one steam turbine generator to utilize waste heat from three of the combustion turbines.
• Install a water–cooled condenser and a mechanical-draft cooling tower .
• Install auxiliary boilers to provide start-up steam for the CC plant.
• Install primary water intake structure in the Green River; potential secondary water intake from existing BAP 2A for makeup water required for operation of CC-specific equipment.
• Install pond for processing discharged wastewater flows from CC operation.
• Install SCR systems.
• Install aqueous ammonia handling and storage equipment.
Alternative C would result in the retirement of PAF coal-fired Units 1 and 2. Long-term actions related to retirement, such as the potential demolition of the units, are outside the scope of this EA and will be addressed by TVA in the future should Alternative C be implemented.
2.2. Detailed Description of TVA’s Action Alternatives
2.2.1. Alternative B – Install and Operate Pulse Jet Fabric Filter Systems TVA would construct individual PJFF systems for Units 1 and 2 to reduce PM emissions to achieve the MATS. The PJFF systems would be designed to achieve an emission rate for PM of no more than 0.030 lb/mmBtu at the stack outlet. The PJFF system technology
Paradise Units 1 and 2
12 Draft Environmental Assessment
Figure 2–2. Location of Proposed CT/CC Plant
Chapter 2 – Alternatives
Final Environmental Assessment 13
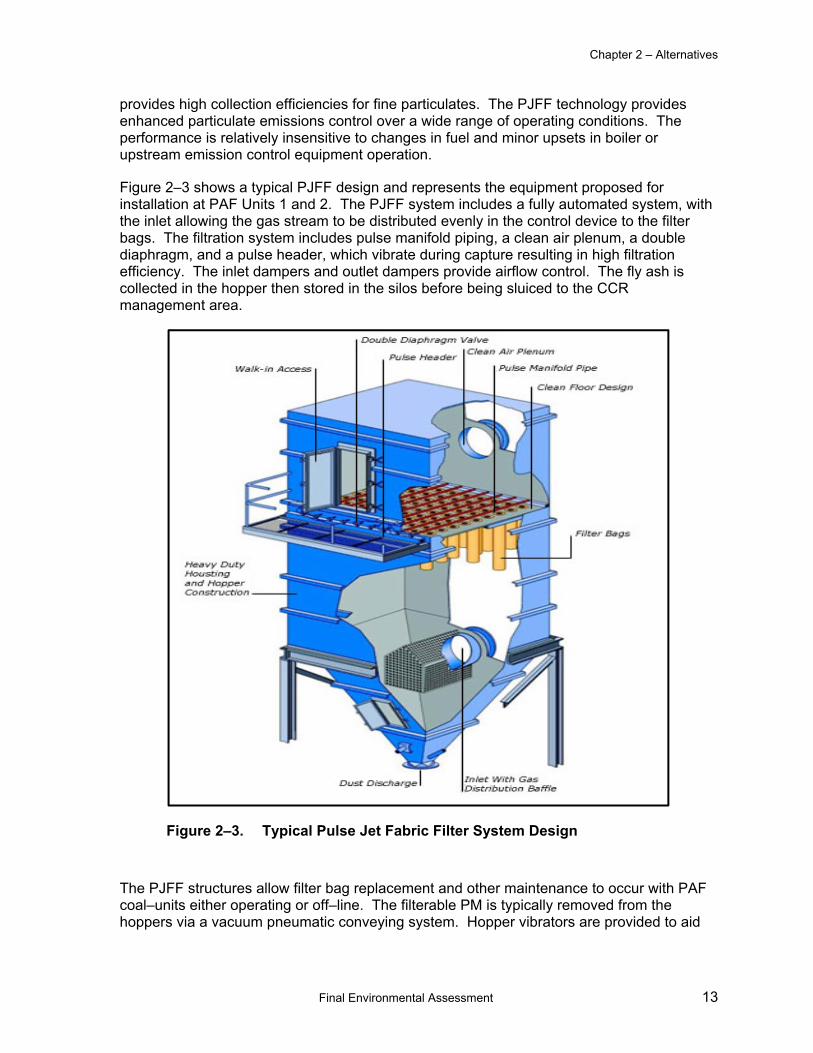
provides high collection efficiencies for fine particulates. The PJFF technology provides enhanced particulate emissions control over a wide range of operating conditions. The performance is relatively insensitive to changes in fuel and minor upsets in boiler or upstream emission control equipment operation.
Figure 2–3 shows a typical PJFF design and represents the equipment proposed for installation at PAF Units 1 and 2. The PJFF system includes a fully automated system, with the inlet allowing the gas stream to be distributed evenly in the control device to the filter bags. The filtration system includes pulse manifold piping, a clean air plenum, a double diaphragm, and a pulse header, which vibrate during capture resulting in high filtration efficiency. The inlet dampers and outlet dampers provide airflow control. The fly ash is collected in the hopper then stored in the silos before being sluiced to the CCR management area.
Figure 2–3. Typical Pulse Jet Fabric Filter System Design
The PJFF structures allow filter bag replacement and other maintenance to occur with PAF coal–units either operating or off–line. The filterable PM is typically removed from the hoppers via a vacuum pneumatic conveying system. Hopper vibrators are provided to aid
Paradise Units 1 and 2
14 Final Environmental Assessment
the material discharge at each hopper. PJFF equipment would primarily be constructed of carbon steel.
2.2.1.1. Hydrated Lime Injection A component of Alternative B includes upgrading the existing hydrated lime system to inject lime at a more efficient location to protect the PJFF systems from damage by sulfuric acid from the coal ash. Most of the solids produced in the system would be collected in the PJFF systems. Following the completion of the PJFF systems, the lime injection system would be run continuously during unit operations, resulting in an approximately 15 percent increase in the hydrated lime requirements, to 4,000 lb/hr.
2.2.1.2. Fly Ash Management The two PJFF systems would collect approximately 156,000 cubic yards of fly ash annually. The existing on–site sluice system would be upgraded to convey this fly ash to the FAP. These upgrades include piping and associated equipment. New piping would be installed from the PJFF hoppers to the fly ash storage silos to connect the silos to the on-site sluice system.
A hydrovator vacuum and associated equipment would be installed at the storage silos to transport the fly ash via the sluice piping. The hydrovator vacuum operates by using a high–pressure water jet to create pressure to move the ash. Alternatively, hydrovators could be added below the fly ash hoppers at the PJFFs to remove and sluice the ash to the FAP using the existing on-site sluice system.
2.2.1.3. Transmission and Electrical System Components TVA would construct and operate two new 161-kV TL(s) and a 161-kV substation to provide power to operate the new PJFF control systems. Two new bays with three new gas breakers (with associated switches, metering, relaying, protection, and communication equipment) would likely be constructed in the current PAF switchyard. The new TL would likely be constructed with double and single steel–pole structures with varying heights which depend on the terrain and existing obstacles on the reservation. The new TL structures would either be on concrete foundations or direct-buried with spoil and gravel backfill.
The 161-kV substation would be located immediately east of the Unit 2 PJFF system and south of BAP 2B. All unit substation transformers would be oil filled; therefore, concrete foundations and an oil containment system would be included. The transmission routes and new substation would be within the PAF reservation. If this alternative is selected, TVA will conduct any additional level environmental review necessary to assess the impacts of the transmission system components after the final TL routes are identified.
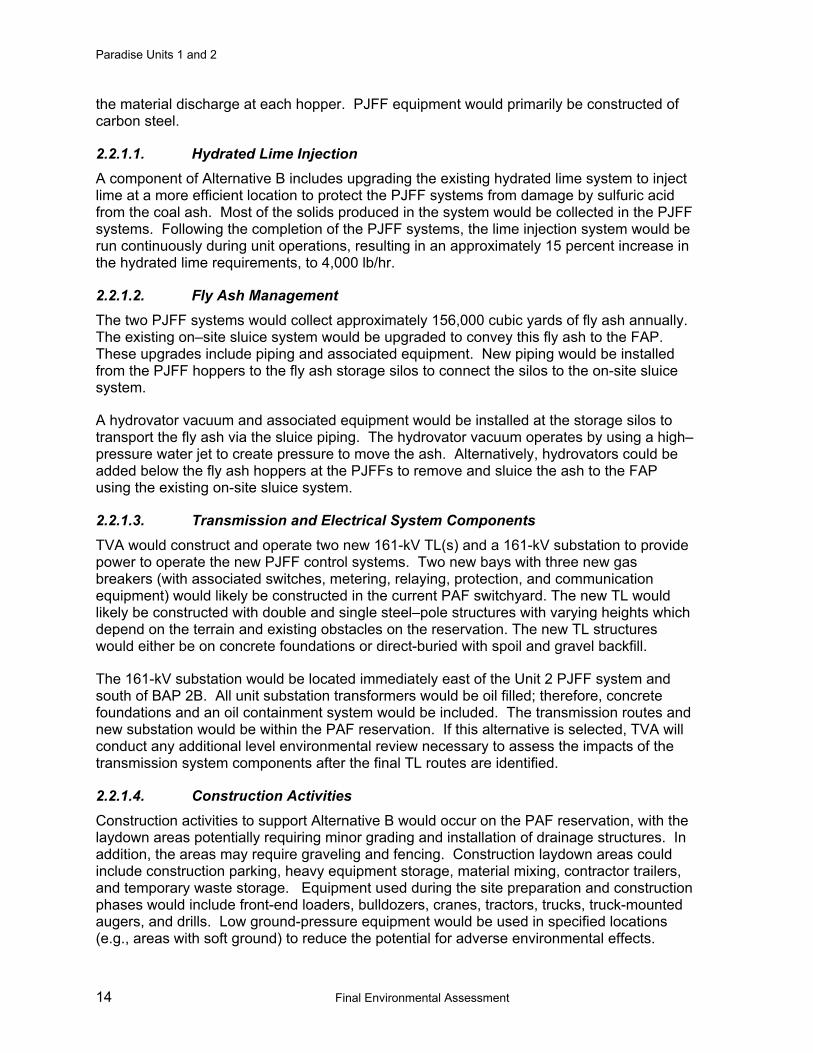
2.2.1.4. Construction Activities Construction activities to support Alternative B would occur on the PAF reservation, with the laydown areas potentially requiring minor grading and installation of drainage structures. In addition, the areas may require graveling and fencing. Construction laydown areas could include construction parking, heavy equipment storage, material mixing, contractor trailers, and temporary waste storage. Equipment used during the site preparation and construction phases would include front-end loaders, bulldozers, cranes, tractors, trucks, truck-mounted augers, and drills. Low ground-pressure equipment would be used in specified locations (e.g., areas with soft ground) to reduce the potential for adverse environmental effects.

Chapter 2 – Alternatives
Final Environmental Assessment 15
Construction materials and equipment would be delivered to the site and stored in designated laydown areas (see Figure 2–4). Initially, the PJFF site would be prepared by grading, excavation and fill, and installation/relocation of underground utility lines. The grading work includes subsurface preparation, installation of drainage features for areas used for construction activities, and final grading. In order to install the proposed Unit 2 PJFF and associated facilities, the existing PAF supply maintenance shop (i.e., Quonset hut) would be demolished and activities currently performed at this location would be relocated to another maintenance facility on–site at PAF.
TVA would reconfigure the existing BAP 2A to provide adequate area for the PJFF systems. The reconfiguration would include approximately one acre of the south end of the pond with bottom ash beneficially reused as structural fill. The existing bottom ash sluicing pipes would be extended to the reconfigured BAP 2A. Changes to current bottom ash collection and handling would be made as necessary to continue to meet the current KPDES limits.
Excavation required beyond the initial rough grading primarily includes excavation for foundations, belowgrade utilities, oil/water separator gravity line, access roads, and transformer pads. Belowgrade pipes would have adequate bedding and backfilling materials consisting of lean concrete or compacted, clean, granular borrow material (i.e., gravel or sand) brought in from offsite suppliers.
Construction would require approximately 50 acres of temporary disturbance for employee parking and equipment placement. Approximately 15 acres of surface disturbance would occur within the existing footprint of the facility during various construction phases. Transport of major equipment, including generators, to the PAF site and temporary access roads would be required for site preparation, construction, and maintenance of the proposed equipment and facilities. Roads within the PAF reservation would be maintained during the construction process. Any temporary off–site access roads for construction would be designed in accordance with relevant requirements.
Construction of the PJFF systems and associated facilities would occur over about 18 months. During this period, an average workforce of about 500 people would be onsite, with a peak onsite employment of about 600 workers. A temporary gravel parking lot would be constructed on the PAF reservation to provide adequate parking for construction staff. Trailers used for material storage and office space would be parked on the site. Following completion of construction activities, unused materials, trailers, and construction debris would be removed from the site.
Paradise Units 1 and 2
16 Final Environmental Assessment
Figure 2–4. Construction Laydown Areas for Proposed PJFF Equipment
Chapter 2 – Alternatives
Final Environmental Assessment 17
2.2.2. Alternative C – Construct and Operate Combustion Turbine/Combined Cycle Plant
Under the Action Alternative C, TVA would construct and operate a new natural gas-fueled CT/CC plant on the PAF reservation. The plant design would include the installation of three HRSGs, a steam turbine generator, and other components necessary to operate the plant in CC mode with a summer net capacity of approximately 1,025 MW. Alternative C includes the construction and operation of a new gas pipeline(s) connecting the plant to an existing gas pipeline(s) with adequate capacity to supply the plant. The new pipeline(s) would be constructed and operated by a commercial supplier. In order to have a back-up fuel source, there would either be two gas pipelines constructed to the plant or one pipeline and on-site fuel oil storage and handling facilities.
The major CT/CC plant components include three or four CT generators with inlet evaporative cooling, three HRSGs, one steam-turbine generator, one natural gas-fired auxiliary boiler, three natural gas-fired dew-point gas heaters, one multiple-cell mechanical draft cooling tower, one diesel engine–driven emergency firewater pump, two fuel-oil storage tanks, and a water-cooled condenser. Three of the CTs would be connected to the HRSGs and the other CC-specific plant components. The fourth CT would be configured to operate independently of the CC-specific components. The environmental analyses in Chapter 3 describe the greatest potential impacts from the various configurations and operating modes.
In addition to the major equipment systems, the proposed CT/CC facility includes plant equipment and systems such as natural gas metering and handling systems; instrumentation and control systems; water treatment, storage, and handling systems; transformers; and administration and warehouse/maintenance buildings. A typical CC plant configuration is provided in Figure 2–5.
Water treatment equipment would be required to support the CC plant. The CT plant would require potable water obtained from the existing public supply. Up to about 100 gallons per minute (gpm) would be used for evaporative cooling when burning natural gas. Up to 1,000 gpm would be required for NOx control when burning fuel oil. CC plant operation would require larger quantities of water, which would be withdrawn from the Green River or existing surface ponds on-site at PAF. The raw water intake for CC operation would average 3,000 gpm or 4.3 million gallons per day (MGD). The Green River is the preferred process water source for CC operation with the secondary water source being the existing ponds on-site at PAF. Plant compressor wash water would be collected and disposed off site at an approved wastewater treatment facility.

Paradise Units 1 and 2
18 Final Environmental Assessment
Figure 2–5. Typical CC Plant Configuration
2.2.2.1. Emission Monitoring and Controls Operating the CT/CC plant would require emission monitoring and controls. Reduction of NOx emissions from CTs would be achieved through dry low-NOx combustion and low-NOx burners. The CC plant would use an SCR system located within the HRSG for additional NOx reduction. The SCR system would use 19.5 percent aqueous ammonia which would be received and stored independent of the ammonia used at the PAF coal-fired units . Reduction of carbon monoxide (CO) would be achieved using a catalyst. The new exhaust stack(s) would be equipped with continuous emissions monitoring systems for CO, NOx, and oxygen.
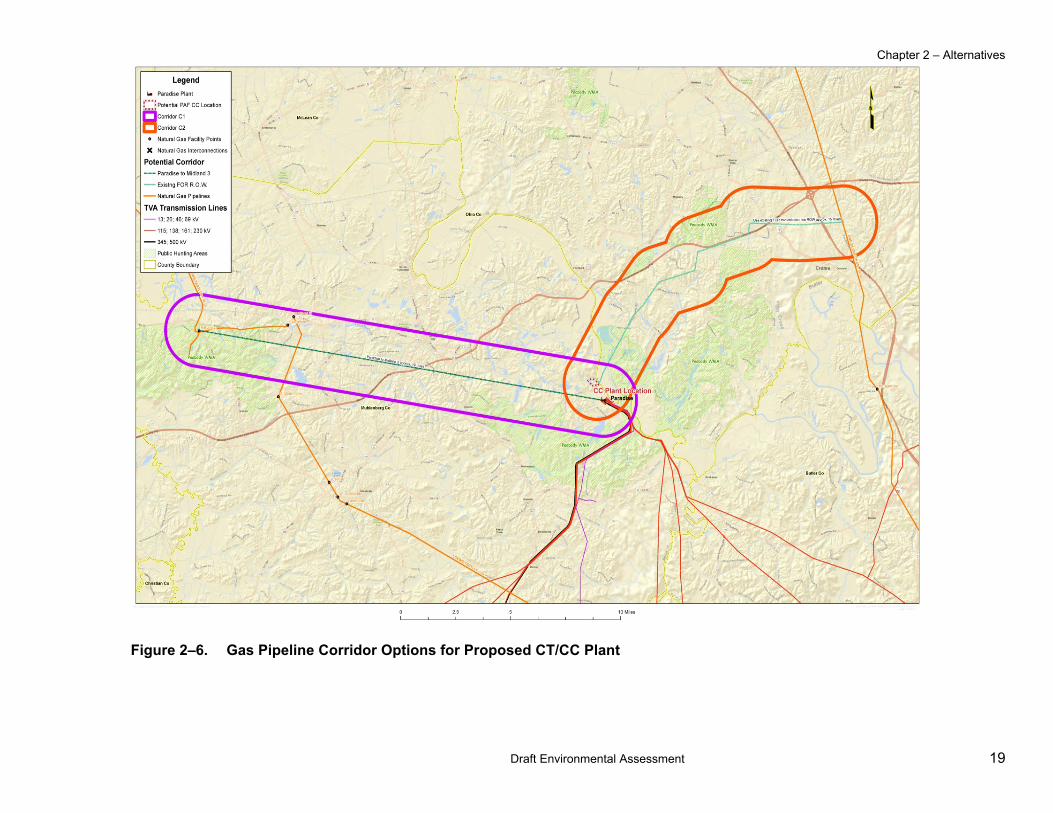
2.2.2.2. Natural Gas and Fuel Oil Supply, Delivery and Storage Operation of the proposed CT/CC facility would require the construction and operation of a new natural gas lateral line and, depending on the option selected, could require upgrades to existing pipelines. Preliminary estimates indicate as much as 200 million standard cubic feet per day of natural gas would be needed for future CC plant operation. This demand would require a lateral pipeline up to 24 inches in diameter at up to 1,200 pounds per square inch of pressure. Based in part on information provided by potential gas suppliers, two potential pipeline corridors are being evaluated, Corridors C1 and C2 (Figure 2–6). Corridor C1 would include an approximately 20-mile lateral pipeline running west of the plant. Corridor C2 would include a 10- to 16-mile lateral pipeline running northeast of the plant.
Chapter 2 – Alternatives
Draft Environmental Assessment 19
Figure 2–6. Gas Pipeline Corridor Options for Proposed CT/CC Plant
Paradise Units 1 and 2
20 Final Environmental Assessment
Typical pipeline construction practices and activities are designed to meet standards set by U.S. Department of Transportation’s (USDOT) Office of Pipeline Safety and are contained in Title 49 of the Code of Federal Regulations, Part 192 (49 CFR 190–199). Normal pipe wall thickness and details of pipeline construction would be selected to provide maximum safety and to comply with the USDOT construction requirements. The pipeline(s) would be constructed using the “cut and fill” method. A 100–foot wide right-of-way (ROW) would initially be cleared of vegetation. Trenching equipment would then excavate a trench of sufficient depth to bury the pipeline at least three feet below grade. Sections of pipe would be delivered to the ROW by truck, aligned, welded together, and placed in the trench. The trench would be backfilled with the stockpiled material and the site revegetated. A cleared 50-foot wide ROW would be maintained to facilitate future access for inspection and maintenance. Underground boring would be used to construct the pipeline at major highway, river, and major stream crossings.
TVA is considering a redundant fuel supply for the CT/CC plant. This would consist of a second gas pipeline connecting to an interstate gas pipeline or the ability to fuel the combustion turbines with fuel oil. The fuel oil option would require CTs configured for dual fuel, construction of onsite aboveground fuel oil storage tanks (ASTs) with a capacity of approximately 5 million gallons. Fuel oil would be trucked to the site, with the initial tank fill requiring approximately 650 tanker trucks trips. Due to the high reliability of interstate gas pipelines, use of backup fuel would seldom be required. For this reason, annual truck trips for delivery of additional fuel oil would be minimal.
2.2.2.3. Transmission and Electrical System Components TVA would construct and operate two new 161-kV TL(s) and a 161-kV substation associated with the new CT/CC plant on site at PAF. Two new bays with three new gas breakers (with associated switches, metering, relaying, protection, and communication equipment) would likely be constructed in the current PAF switchyard. The route of the new TLs would be located on the PAF reservation on the west wide of the Green River between the existing switchyard and the CT/CC plant location. The new TL would likely be constructed with double and single steel-pole structures with varying heights which depend on the terrain and existing obstacles on the reservation. The new TL structures would either be on concrete foundations or direct-buried with spoil and gravel backfill.
All unit substation transformers would be oil filled; therefore, concrete foundations and an oil containment system would be included. The transmission routes and new substation would be within the PAF reservation. If this alternative is selected, TVA will conduct any additional level environmental review necessary to assess the impacts of the transmission system components after the final TL routes are identified.
2.2.2.4. Construction Activities With the exception of the natural gas supply pipeline(s), construction activities associated with the CT/CC plant would occur on the PAF reservation and would be generally similar to those of the Alternative B PJFF systems and related facilities. The plant at full CC buildout would occupy about 50 acres and an additional 50 acres would be used for equipment laydown and mobilization (Figure 2–7). The laydown areas and construction activities may require installation of drainage structures, such as culverts, as the plant site is bordered by areas prone to flooding (see Section 3.11). Subsurface piles would be installed to support foundations for plant components, as required.
Chapter 2 – Alternatives
Final Environmental Assessment 21
Project materials and equipment would be delivered to the site by truck primarily, with larger component delivered and placed in project laydown areas until used. Transport of some large components may be by barge, utilizing the existing barge unloading facility and heavy–duty trucks to move components onsite. Transport of some major equipment, including generators, to the PAF site may require temporary access roads. Roads within the PAF reservation would be maintained during the construction process. Any temporary access roads for construction off-site would be designed in accordance with USDOT and relevant local requirements.
Site preparation work for the proposed CT/CC plant and associated equipment would begin in 2014. Actual plant construction would begin in 2015 and the plant would begin commercial operation in CC mode as early as the second quarter of 2017. During this period, 400–700 workers would normally be employed onsite.
2.3. Alternatives Considered but Eliminated from Detailed Analysis
This section discusses alternatives to TVA’s proposed action that were considered but eliminated from detailed analysis in this EA. During the scoping of this project and the development of Alternatives A through C, several other potential alternatives were considered. These included alternative methods of controlling PM emissions from PAF Units 1 and 2, as well as other sources of energy identified in TVA’s IRP (2011). These alternatives were determined not to be technically or economically practical or feasible.
2.3.1. Emission Control Alternatives
2.3.1.1. Wet Electrostatic Precipitators TVA considered construction and operation of wet ESPs for PM control to comply with MATS for PAF Units 1 and 2. Wet ESP devices are employed on gas streams that include oily and sticky particulates or gas streams that must be cooled to saturation in order to condense aerosols that were present in the gas phase. The wet ESP uses a water flushing system to remove the particles from the collecting surface. Either the gas stream is saturated before entering the collection area or the collecting surface is continually wetted to prevent agglomerations from forming. TVA considered locating a wet ESP due northeast of the existing Unit 1 and the other wet ESP west of the existing Unit 2. The wet ESP system would tie in to the existing on–site sluicing system to transport the collected wet fly ash to the FAP.
Because the device only collects wet CCR, TVA would need to dewater the collected wet fly ash after the future PAF wet–to–dry CCR management conversion project is implemented. Site and access restrictions would limit construction approaches. This alternative would not be a feasible option compared to Alternative B based on cost and inconsistency with TVA’s long–term goals for wet–to–dry conversion. Compared to PJFF systems, both the capital and operation and maintenance costs of wet ESPs are higher and the wet ESP efficiency is less reliable. The alternative of using wet ESPs for PM control was eliminated from further analysis because of the higher capital and operation and maintenance cost, lower reliability, and inconsistency with TVA’s long–term goal for wet–to–dry conversion of CCR management.

Paradise Units 1 and 2
22 Final Environmental Assessment
Figure 2–7. Construction Laydown Areas for Proposed CT/CC Plant
Chapter 2 – Alternatives
Final Environmental Assessment 23
2.3.1.2. Dry Electrostatic Precipitators TVA considered using dry ESPs to comply with MATS for PAF Units 1 and 2. Dry ESPs can collect and transport the PM in a dry condition. The collected dry fly ash would be transported to the FAPs using the existing on–site sluicing system. Similar to the wet ESP alternative considered, this alternative would not be a feasible option as compared to PJFF systems based on cost; the capital cost of dry ESPs is considerably higher with a similar PM control efficiency as Alternative B. The alternative of using dry ESPs for PM control was eliminated from further analysis because the cost to achieve the requisite PM control efficiency is considerably higher than the PJFF systems.
2.3.2. Biomass Conversion for PAF Units 1 and 2 TVA has considered the option of repowering various coal–fired units to fire 100 percent renewable biomass in lieu of installing emission control equipment or retiring those units, but found this option to be infeasible based on technical and economic considerations. Converting one unit designed to burn coal to burn 100 percent biomass will reduce the capacity of that unit by 35 to 50 percent. Depending on the regional load requirements, new capacity could be needed to make up for the loss in generation. Since biomass has a lower heating value (i.e., less heat released during the combustion of a given amount of fuel) than coal, 12 to 14 million tons of green biomass (at 50 percent moisture by weight) per year would be required for the generating capacity provided by Alternative B or C. There would not be a sufficient supply of acceptable biomass within a reasonable distance of PAF to support the long–term operation of these units. Based on a study conducted for the Shawnee Fossil Plant, the biomass could cost 20 to 50 percent more than coal for an equivalent amount of heat output. It is estimated it will cost $1000 to $3000 per kilowatt to convert PAF Units 1 and 2 to fire 100 percent biomass. This is the cost for boiler modifications, environmental controls, and new fuel (biomass) handling equipment. Thus, upon examining the biomass option for PAF Units 1 and 2, TVA determined that it is not a feasible option at this time because of its high capital and operating cost and the difficulty of ensuring an adequate and reliable fuel supply. Due to its technical and economic infeasibility, this alternative was eliminated from TVA's detailed analysis.
2.3.3. Generation Replacement by Transmission Upgrades TVA evaluated upgrading its transmission system in order to address voltage and equipment overloading problems associated with loss of the generating capacity currently provided by PAF Units 1 and 2. These units are connected to and provide crucial support to the 161-kV transmission system and reliability in a wide area of Kentucky and north-central Tennessee. This evaluation was based on transmission planning standards (TPL 001-004) established by the North American Electric Reliability Corporation. The results of this evaluation showed that TVA would have to construct a new, lengthy 500-kV TL, upgrade other 161-kV lines, and construct new 500-kV substations. They have a very long lead time, typically six to eight years or more depending on the length of the new TL, to complete necessary environmental and siting studies, acquire sufficient land rights from individuals and businesses, and complete construction. Until these projects were completed, TVA would have to continue to operate PAF Units 1 and 2 beyond the dates allowed by MATS. A transmission system upgrade alternative would not meet the needs addressed by the proposed action. This potential alternative was eliminated from TVA's detailed analysis based on the time required for completing the transmission upgrades.

Paradise Units 1 and 2
24 Final Environmental Assessment
2.3.4. Generation Replacement by Increased Efficiency TVA’s IRP and EIS recognized the opportunity for increasing energy efficiency on the TVA system and TVA is actively increasing its energy efficiency programs. These programs help reduce demand across the TVA system. TVA cannot, however, be assured that the energy savings from these programs in the southwestern Kentucky area would be sufficient and reliable to meet regional generation needs. While TVA will continue to increase its energy efficiency programs, the results of such programs are not a resource equivalent to the energy that would be generated under Alternative B or C. Accordingly, TVA has decided that energy efficiency programs are not a feasible alternative.
2.3.5. Generation Replacement with Wind and Solar Renewable Energy Sources Renewable energy resources, such as wind or solar photovoltaic (PV) power plants, built at the PAF site could not provide sufficient generating capacity. The utility industry considers these renewable energy resources to be “non-dispatchable,” meaning that system operators cannot count on such generation being available when called upon to meet energy or transmission support needs. PAF Units 1 and 2 play a major role in servicing the energy needs of west-central Kentucky and one or more combustion turbines and/or an energy storage technology (e.g. batteries, capacitor. etc) would be needed to provide power and grid support during periods when adequate solar energy or wind power is available for these systems. Although the capital cost of utility-scale solar PV and wind energy projects has decreased in recent years, they would still be more expensive than the retrofits planned for PAF Units 1 and 2, and the cost of back-up power sources would need to be included. In addition, a significant amount of land (on the order of tens to hundreds of thousands of acres), would be needed for a wind and solar PV plant(s) large enough to replace the generation and net dependable capacity of PAF Units 1 and 2. Because of these issues, this alternative was eliminated from TVA's detailed analysis, as it was deemed infeasible.
2.3.6. Natural Gas Pipeline Corridor Alternatives For Alternative C, TVA initially evaluated several potential natural gas pipeline corridors to assure adequate and reliable gas delivery to support CT/CC plant operations. The corridors were drawn by TVA staff with guidance from potential gas suppliers. In some cases, corridors were eliminated from detailed consideration based on inability of obtaining supplier connection within a reasonable distance to PAF. Corridors were also eliminated if they contained high potential for environmental or physical constraints. For example, a corridor was eliminated if significant physical constraints existed (i.e., high percentage of developed areas, lack of adequate ROW, geophysical constraints). Likewise, a corridor was eliminated if it contained a high percentage of high quality natural resources, i.e., wildlife management areas, threatened and endangered species, wetlands, historic properties, that could be adversely impacted.
2.3.7. Fly Ash Management Alternatives Under Alternative B, the fly ash collected in the PJFFs would be wet-sluiced to the existing on-site fly ash for long-term management. TVA considered alternatives to this ash management that included both on-site disposal and off-site disposal. Because of the geography and historical use of the site, any new on-site landfill would require soil and structural evaluation prior to applying for a solid waste permit. This evaluation and permitting process would require a timeframe that would not support the MATS compliance deadline. Any on-site solid waste landfill effort would require independent NEPA evaluation. Off-site landfill disposal was considered as a contingency plan that could be
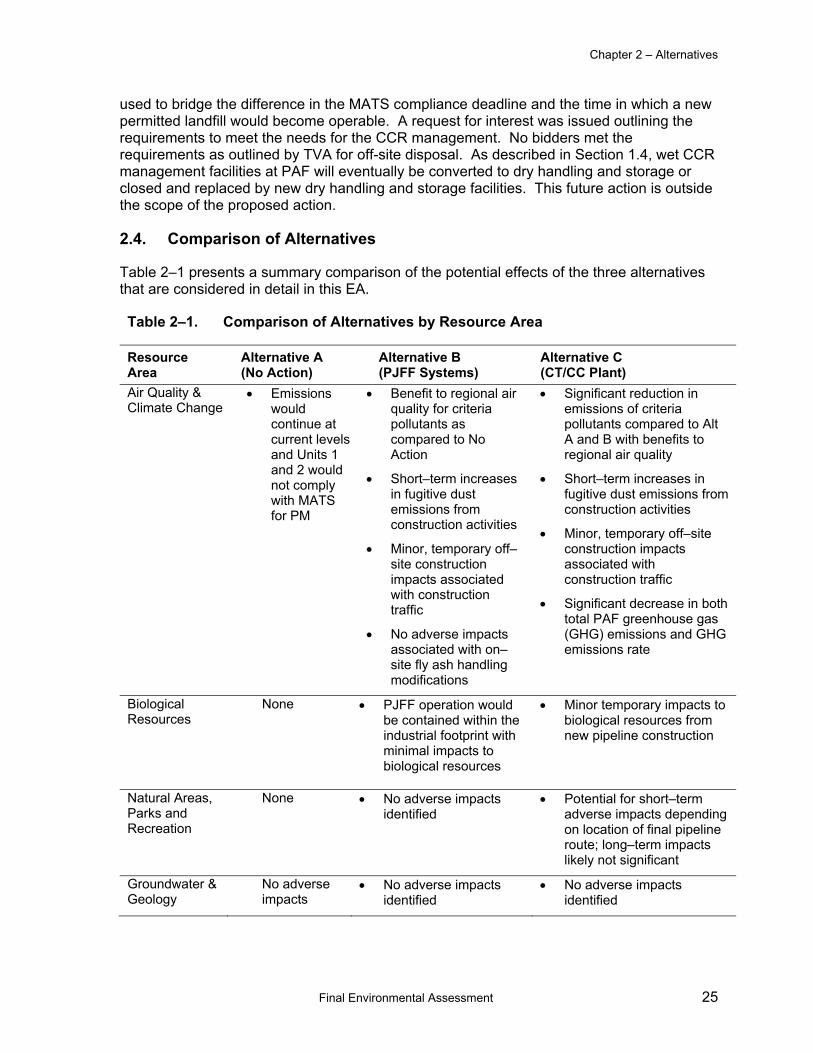
Chapter 2 – Alternatives
Final Environmental Assessment 25
used to bridge the difference in the MATS compliance deadline and the time in which a new permitted landfill would become operable. A request for interest was issued outlining the requirements to meet the needs for the CCR management. No bidders met the requirements as outlined by TVA for off-site disposal. As described in Section 1.4, wet CCR management facilities at PAF will eventually be converted to dry handling and storage or closed and replaced by new dry handling and storage facilities. This future action is outside the scope of the proposed action.
2.4. Comparison of Alternatives
Table 2–1 presents a summary comparison of the potential effects of the three alternatives that are considered in detail in this EA.
Table 2–1. Comparison of Alternatives by Resource Area
Resource Area
Alternative A (No Action)
Alternative B (PJFF Systems)
Alternative C (CT/CC Plant)
Air Quality & Climate Change
• Emissions would continue at current levels and Units 1 and 2 would not comply with MATS for PM
• Benefit to regional air quality for criteria pollutants as compared to No Action
• Short–term increases in fugitive dust emissions from construction activities
• Minor, temporary off–site construction impacts associated with construction traffic
• No adverse impacts associated with on–site fly ash handling modifications
• Significant reduction in emissions of criteria pollutants compared to Alt A and B with benefits to regional air quality
• Short–term increases in fugitive dust emissions from construction activities
• Minor, temporary off–site construction impacts associated with construction traffic
• Significant decrease in both total PAF greenhouse gas (GHG) emissions and GHG emissions rate
Biological Resources
None • PJFF operation would be contained within the industrial footprint with minimal impacts to biological resources
• Minor temporary impacts to biological resources from new pipeline construction
Natural Areas, Parks and Recreation
None • No adverse impacts identified
• Potential for short–term adverse impacts depending on location of final pipeline route; long–term impacts likely not significant
Groundwater & Geology
No adverse impacts
• No adverse impacts identified
• No adverse impacts identified
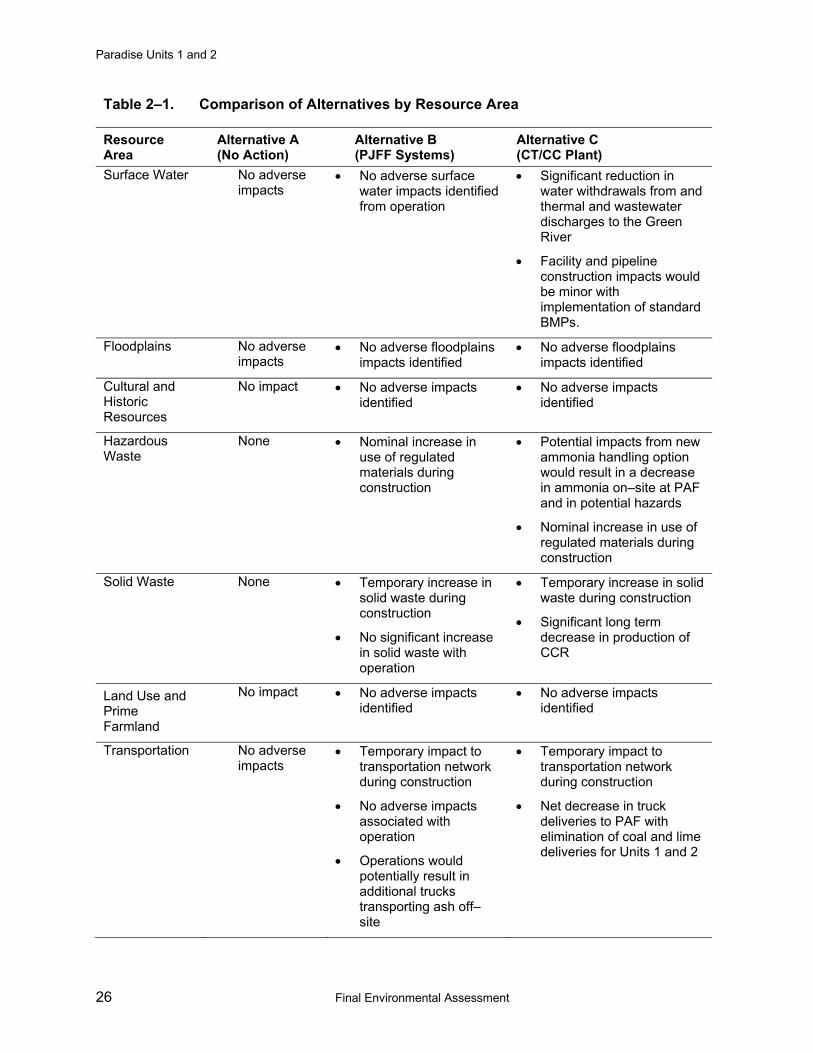
Paradise Units 1 and 2
26 Final Environmental Assessment
Table 2–1. Comparison of Alternatives by Resource Area
Resource Area
Alternative A (No Action)
Alternative B (PJFF Systems)
Alternative C (CT/CC Plant)
Surface Water
No adverse impacts
• No adverse surface water impacts identified from operation
• Significant reduction in water withdrawals from and thermal and wastewater discharges to the Green River
• Facility and pipeline construction impacts would be minor with implementation of standard BMPs.
Floodplains No adverse impacts
• No adverse floodplains impacts identified
• No adverse floodplains impacts identified
Cultural and Historic Resources
No impact • No adverse impacts identified
• No adverse impacts identified
Hazardous Waste
None • Nominal increase in use of regulated materials during construction
• Potential impacts from new ammonia handling option would result in a decrease in ammonia on–site at PAF and in potential hazards
• Nominal increase in use of regulated materials during construction
Solid Waste None • Temporary increase in solid waste during construction
• No significant increase in solid waste with operation
• Temporary increase in solid waste during construction
• Significant long term decrease in production of CCR
Land Use and Prime Farmland
No impact • No adverse impacts identified
• No adverse impacts identified
Transportation No adverse impacts
• Temporary impact to transportation network during construction
• No adverse impacts associated with operation
• Operations would potentially result in additional trucks transporting ash off–site
• Temporary impact to transportation network during construction
• Net decrease in truck deliveries to PAF with elimination of coal and lime deliveries for Units 1 and 2
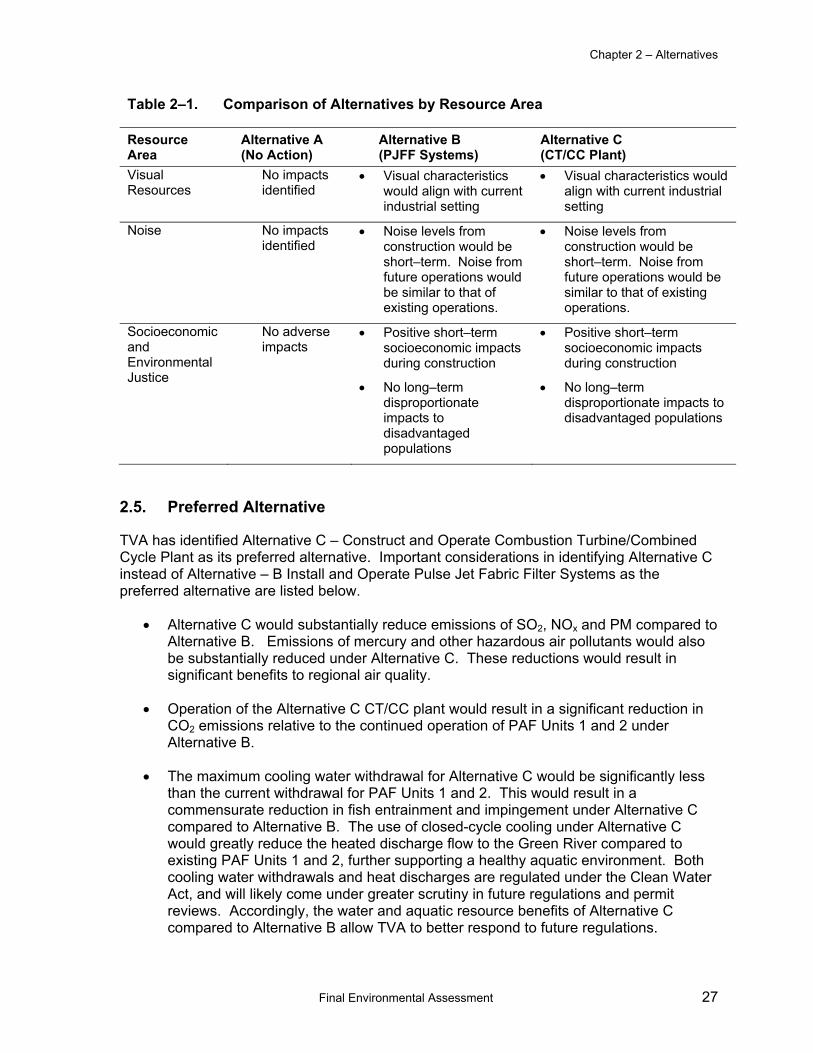
Chapter 2 – Alternatives
Final Environmental Assessment 27
Table 2–1. Comparison of Alternatives by Resource Area
Resource Area
Alternative A (No Action)
Alternative B (PJFF Systems)
Alternative C (CT/CC Plant)
Visual Resources
No impacts identified
• Visual characteristics would align with current industrial setting
• Visual characteristics would align with current industrial setting
Noise No impacts identified
• Noise levels from construction would be short–term. Noise from future operations would be similar to that of existing operations.
• Noise levels from construction would be short–term. Noise from future operations would be similar to that of existing operations.
Socioeconomic and Environmental Justice
No adverse impacts
• Positive short–term socioeconomic impacts during construction
• No long–term disproportionate impacts to disadvantaged populations
• Positive short–term socioeconomic impacts during construction
• No long–term disproportionate impacts to disadvantaged populations
2.5. Preferred Alternative
TVA has identified Alternative C – Construct and Operate Combustion Turbine/Combined Cycle Plant as its preferred alternative. Important considerations in identifying Alternative C instead of Alternative – B Install and Operate Pulse Jet Fabric Filter Systems as the preferred alternative are listed below.
• Alternative C would substantially reduce emissions of SO2, NOx and PM compared to Alternative B. Emissions of mercury and other hazardous air pollutants would also be substantially reduced under Alternative C. These reductions would result in significant benefits to regional air quality.
• Operation of the Alternative C CT/CC plant would result in a significant reduction in CO2 emissions relative to the continued operation of PAF Units 1 and 2 under Alternative B.
• The maximum cooling water withdrawal for Alternative C would be significantly less than the current withdrawal for PAF Units 1 and 2. This would result in a commensurate reduction in fish entrainment and impingement under Alternative C compared to Alternative B. The use of closed-cycle cooling under Alternative C would greatly reduce the heated discharge flow to the Green River compared to existing PAF Units 1 and 2, further supporting a healthy aquatic environment. Both cooling water withdrawals and heat discharges are regulated under the Clean Water Act, and will likely come under greater scrutiny in future regulations and permit reviews. Accordingly, the water and aquatic resource benefits of Alternative C compared to Alternative B allow TVA to better respond to future regulations.
Paradise Units 1 and 2
28 Final Environmental Assessment
• On an annual basis, the three units at PAF generate approximately 270,000 cubic yards of fly ash, 350,000 cubic yards of bottom ash, and 900,000 cubic yards of gypsum, for a total of 1,520,000 cubic yards of combined CCR waste. The retirement of PAF Units 1 and 2 under Alternative C is expected to significantly reduce (by approximately 55 percent) the generation (and the resulting storage) of CCR. Moreover, avoiding generation of CCR as a result of the retirement of PAF Units 1 and 2 under Alternative C reduces TVA’s future expenditures for converting wet facilities to dry operations.
• On a kilowatt basis, the PJFF system at PAF Units 1 and 2 will cost substantially less that both the new CT plant and the new CC plant under Alternative C. Both coal-fired plants and CT/CC plants likely will have to make to additional environmental investments in the future, but the investments to meet regulations at coal plants are expected to be more as borne out by EPA’s recent rulemaking efforts for coal-fired plants under the Clean Air Act, Clean Water Act and the Resource Conservation and Recovery Act.
• TVA’s 2011 IRP and associated EIS evaluated a wide range of strategies and actions for meeting demand for electricity from the TVA system in the future. TVA adopted a planning direction to achieve a more balanced, diverse portfolio of energy resources on the TVA system. This includes relying more on energy resources that are cleaner than coal generation: nuclear and natural gas generation, renewable energy and energy efficiency. Alternative C advances this planning goal of achieving a more balanced and diversified portfolio. The selection of CT/CC as the preferred alternative is also influenced by TVA’s recent decision to install controls at its Gallatin Plant. Having preserved coal-fired generation capacity at Gallatin, TVA now has greater latitude to shift from coal to gas at PAF in the interest of maintaining a diverse portfolio.
Weighing all of these factors, and considering the cost of the respective projects and the comments received on the Draft EA, TVA has identified Alternative C as the preferred alternative.
2.6. Summary of Mitigation Measures and BMPs
Mitigation measures identified in Chapter 3 to avoid, minimize, or reduce adverse impacts to the environment are summarized below. TVA’s analysis of selected alternatives includes mitigation, as required, to assure no adverse effects. Project-specific BMPs are also identified.
• Title V operating permit conditions applicable to Alternative B or C would be implemented.
• Fugitive dust emissions from site preparation and construction would be controlled by wet suppression and BMPs.
• Project specific BMPs would be developed, as necessary, to ensure that all surface waters are protected from construction and operational impacts.
• Waste streams would be characterized to ensure permit limits would be met, as required.

Chapter 2 – Alternatives
Final Environmental Assessment 29
• To comply with EO 13112, disturbed areas would be revegetated with native or non–native, non–invasive plant species to avoid the introduction or spread of invasive species.
• TVA will coordinate with the Kentucky Transportation Cabinet (KYTC), the Muhlenberg County Road Department, and the Town of Drakesboro, to minimize potential effects to public roadways during construction.
• Directional borings will be conducted under streams or rivers (under a marked navigation channel or not) for the installation of pipelines.
Paradise Units 1 and 2
30 Final Environmental Assessment
CHAPTER 3
3.0 AFFECTED ENVIRONMENT AND ENVIRONMENTAL CONSEQUENCES
This chapter describes the baseline for the assessment of potential effects of the alternatives described in Chapter 2. This chapter also presents the anticipated environmental consequences to various resources from the adoption of Alternative A (No Action), Alternative B (Install and Operate Pulse Jet Fabric Filter Systems), and Alternative 3 (Construct and Operate Combustion Turbine/Combined Cycle Plant).
3.1. Air Quality
3.1.1. Affected Environment The Clean Air Act (CAA) regulates the discharge of air pollutants and, through its implementing regulations, establishes standards for the discharges of several “criteria” pollutants that are designed to protect the public health and welfare. The criteria pollutants are ozone, PM, CO, NOx, SO2, and lead. Muhlenberg County and adjacent counties are currently in compliance with these National Ambient Air Quality Standards. Current emissions from PAF Units 1 and 2 (see Table 3–3) of PM, CO, NOx, SO2, and volatile organic compounds (VOC), a precursor of ozone, meet applicable air quality standards.
Air quality in Muhlenberg County is protected by Air Quality Regulations found in Title 401, Chapters 50–68 of the Kentucky Administrative Regulations (KAR). Muhlenberg County is currently in attainment with ambient air quality standards referenced in Chapters 51 and 53. PAF Units 1 and 2 are permitted to operate under 401 KAR 52:020, which govern issuance of air operating permits for major sources known as Title V permits. Title V permits are comprehensive documents that encompass all air regulations to which a major source is subject.
The current PAF Title V permit allows Units 1 and 2 to emit PM up to 0.11 lb/mmBtu based on regulations in 401 KAR 61:015. The MATS reduce the allowable emission rate by 73 percent to 0.030 lb/mmBtu. Since 2011, the average filterable PM emission rates for PAF Units 1 and 2, as measured by quarterly stack tests, have averaged 0.06–0.07 lb/mmBtu.
3.1.2. Environmental Consequences
3.1.2.1. Alternative A – No Action Under Alternative A, TVA would continue PAF Unit 1 and 2 operations without implementing actions to reduce air emissions. Because no changes to operations are foreseen, air pollutant emissions would be unchanged. Consequently, air quality would not be affected. Alternative A, however, would affect PAF’s compliance with MATS. Specifically, the filterable PM emission rate of 0.030 lb/mmBtu would not be met with the existing pollution control equipment. No benefits to regional air quality would be realized under this alternative.
3.1.2.2. Alternative B – Install and Operate Pulse Jet Fabric Filter Systems Construction Impacts Construction activities associated with Alternative B would result in temporary fugitive air pollutant emissions. Vehicles and construction equipment traveling over unpaved roads and the construction site would result in the emission of fugitive dust. A large fraction of fugitive
Chapter 3 – Affected Environment and Environmental Consequences
Final Environmental Assessment 31
emissions from vehicle traffic in unpaved areas would also be deposited near the unpaved areas. The largest fraction (greater than 95 percent by weight) of fugitive dust emissions would be deposited within the construction site boundaries. The remaining fraction of the dust would be subject to transport beyond the property boundary.
Combustion of gasoline and diesel fuels to power the engines of vehicles and construction equipment would generate local emissions of PM, NOx, CO, VOC, and SO2 during the site preparation and construction period. Although specific construction equipment has not yet been determined, including sizes, numbers of vehicles, and the hours each piece of equipment would operate, the emissions for these operations would be small. For example, combustion emissions from a 200–horsepower diesel truck operating eight hours every day for three months would include less than one ton each of NOx, CO, and PM. Emissions of SO2 would be negligible because of the ultralow sulfur diesel fuel available on the market and low sulfur content in gasoline. This estimate assumes usage of emission factors from older vehicles that have not benefited from more stringent engine emission standards (USEPA 2004).
Overall, effects to air quality from construction–associated activities would be temporary and localized. Emissions would only affect the immediate project area and would have limited effects to off–site areas. These effects to air quality would not be adverse or long–term.
Operational Impacts Under Alternative B, PJFF systems would be installed on PAF Units 1 and 2 to reduce filterable PM emissions from current levels. The proposed PJFF air pollution controls on Units 1 and 2 would reduce average filterable PM emissions by more than 50 percent to meet the MATS for PM of 0.030 lb/mmBtu. The existing air pollution control equipment (SCR systems and wet scrubbers) on Units 1 and 2, together with the proposed PJFF systems, would achieve the emissions standards in MATS for mercury, acid gases, and filterable PM. Emissions of other criteria air pollutants would be relatively unchanged.
Fly ash collected in PJFF hoppers would be pneumatically conveyed to two fly ash storage silos. The estimated maximum total PM emissions from this fly ash transfer system would be approximately 1.5 tons per year. TVA would install piping to connect the existing ash sluicing system to the fly ash storage silos. There would be few or no fugitive emissions because the fly ash would be wet sluiced and pumped to the FAP. The approximately 1.5 tons per year PM emitted in the management of the fly ash handling system would be insignificant when compared to the major reduction in PM emissions from Units 1 and 2 resulting from installation of the PJFF systems.
Overall, PM emissions would be significantly reduced by installation and operation of the PJFF air pollution controls on Units 1 and 2. Emissions from these units after installation of the proposed controls would comply with MATS. The Title V operating air permit for PAF would be modified as required for implementation of Alternative B. The particulate control systems and the fly ash handling system would be operated in accordance with the Title V air permit.
3.1.2.3. Alternative C – Construct and Operate Combustion Turbine/Combined Cycle Plant Alternative C involves the replacement of the PAF coal-fired Units 1 and 2 with a CT/CC plant. For permitting purposes, the estimated emissions from the CT/CC plant will be netted

Paradise Units 1 and 2
32 Final Environmental Assessment
against the baseline emissions from Units 1 and 21. The proposed CT/CC plant would be subject to both federal and State of Kentucky air regulations. The standards and regulations that apply to the proposed plant include:
• New Source Performance Standards, which impose emission standards on new facilities (401 KAR, Chapter 60).
• National Emission Standards for Hazardous Air Pollutants (NESHAP), which regulate specific categories of HAPs emission sources (401 KAR, Chapter 63).
• PAF Title V operating permit.
The retirement of the two coal units would require the installation of two auxiliary boilers for the Unit 3 coal boiler. When originally built, Unit 3 had two auxiliary boilers that could each supply 225,000 pounds of steam per hour. Currently, steam from Units 1 and 2 is used for starting Unit 3. The new auxiliary boilers for Unit 3 would be at least equivalent in size to the original Unit 3 auxiliary boilers.
Construction Impacts Like Alternative B, the proposed construction of the CT/CC plant would have associated transient air pollutant emissions, primarily from land clearing, site preparation, and the operation of internal combustion engines.
Site preparation, paved road vehicular traffic, and facility construction result in the emission of fugitive dust during active construction periods. The proposed location is a developed industrial site (PAF) with a high proportion of disturbed area relative to a Greenfield site or even some Brownfield sites. Most (greater than 95 percent by weight) fugitive dust emissions would be deposited within the construction site boundaries. Emissions from open construction areas and roadways would be mitigated by spraying water on the roadways as needed to reduce fugitive dust emissions by as much as 95 percent.
Combustion of gasoline and diesel fuels by internal combustion engines (vehicles, generators, construction equipment, etc.) would generate local emissions of PM, NOx, CO, VOC, and SO2 during the site preparation and construction period. Even under unusually adverse conditions, these emissions would have, at most, a minor, transient impact on off–site air quality. Overall, the air quality impact of construction–related activities for the project would be minor and temporary in nature.
Operational Impacts The proposed CT/CC plant and associated gas pipeline(s) would provide TVA with a nominal peaking generation capacity of 800 MW when operating in simple cycle (CT-only) mode and an intermediate load summer generating capacity of 1,025 MW when operating in CC mode. Net emissions from the proposed operations are estimated not to exceed federal and state Prevention of Significant Deterioration (PSD) significant thresholds.
Gas Pipeline Impacts Potential air quality impacts would likely occur from fugitive dust generated as a direct result of the movement of construction equipment across the project area and removal and disposal, potentially by burning, of trees and brush from the pipeline ROW. Potential air quality impacts from construction of the proposed pipeline would be temporary and minimal, 1 Baseline Emissions (tons/yr) denote the highest rolling 24–month annual average emission period of the five years preceding the project [40 CFR 52.21(b)(48)(i)(c)].
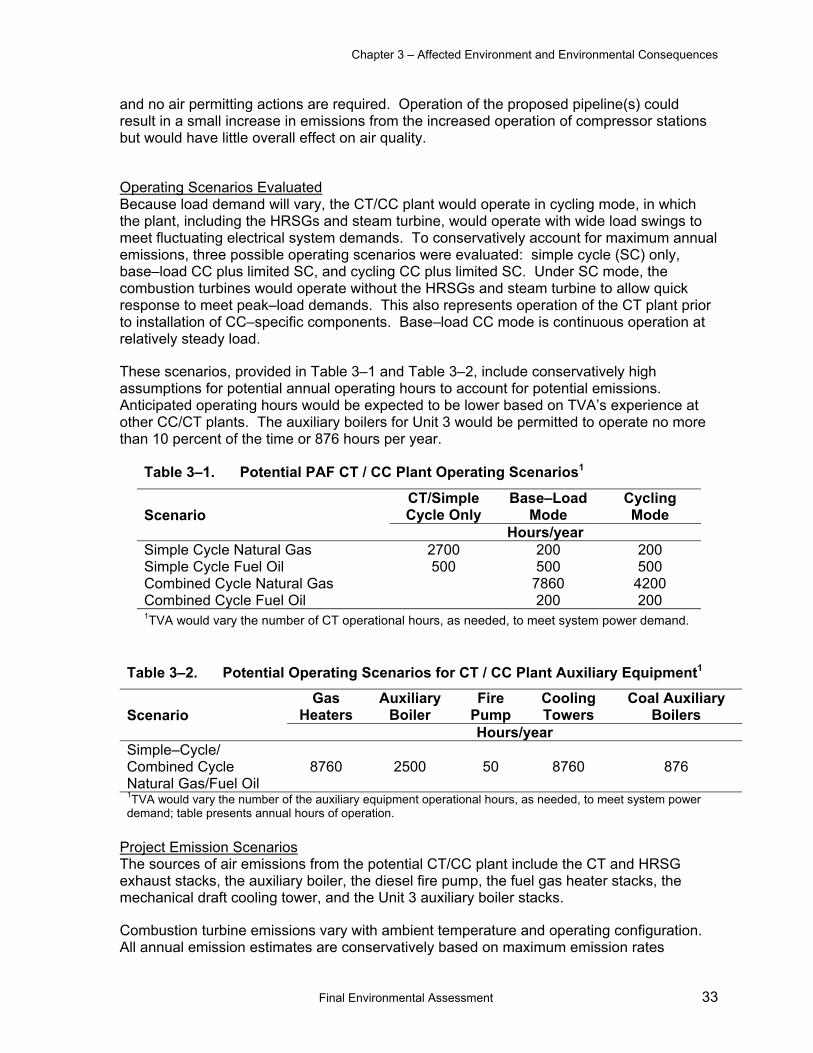
Chapter 3 – Affected Environment and Environmental Consequences
Final Environmental Assessment 33
and no air permitting actions are required. Operation of the proposed pipeline(s) could result in a small increase in emissions from the increased operation of compressor stations but would have little overall effect on air quality.
Operating Scenarios Evaluated Because load demand will vary, the CT/CC plant would operate in cycling mode, in which the plant, including the HRSGs and steam turbine, would operate with wide load swings to meet fluctuating electrical system demands. To conservatively account for maximum annual emissions, three possible operating scenarios were evaluated: simple cycle (SC) only, base–load CC plus limited SC, and cycling CC plus limited SC. Under SC mode, the combustion turbines would operate without the HRSGs and steam turbine to allow quick response to meet peak–load demands. This also represents operation of the CT plant prior to installation of CC–specific components. Base–load CC mode is continuous operation at relatively steady load.
These scenarios, provided in Table 3–1 and Table 3–2, include conservatively high assumptions for potential annual operating hours to account for potential emissions. Anticipated operating hours would be expected to be lower based on TVA’s experience at other CC/CT plants. The auxiliary boilers for Unit 3 would be permitted to operate no more than 10 percent of the time or 876 hours per year.
Table 3–1. Potential PAF CT / CC Plant Operating Scenarios1
Scenario CT/Simple Cycle Only
Base–Load Mode
Cycling Mode
Hours/year Simple Cycle Natural Gas 2700 200 200 Simple Cycle Fuel Oil 500 500 500 Combined Cycle Natural Gas 7860 4200 Combined Cycle Fuel Oil 200 200 1TVA would vary the number of CT operational hours, as needed, to meet system power demand.
Table 3–2. Potential Operating Scenarios for CT / CC Plant Auxiliary Equipment1
Scenario Gas
Heaters Auxiliary
Boiler Fire
Pump Cooling Towers
Coal Auxiliary Boilers
Hours/year Simple–Cycle/ Combined Cycle Natural Gas/Fuel Oil
8760 2500 50 8760 876
1TVA would vary the number of the auxiliary equipment operational hours, as needed, to meet system power demand; table presents annual hours of operation.
Project Emission Scenarios The sources of air emissions from the potential CT/CC plant include the CT and HRSG exhaust stacks, the auxiliary boiler, the diesel fire pump, the fuel gas heater stacks, the mechanical draft cooling tower, and the Unit 3 auxiliary boiler stacks.
Combustion turbine emissions vary with ambient temperature and operating configuration. All annual emission estimates are conservatively based on maximum emission rates
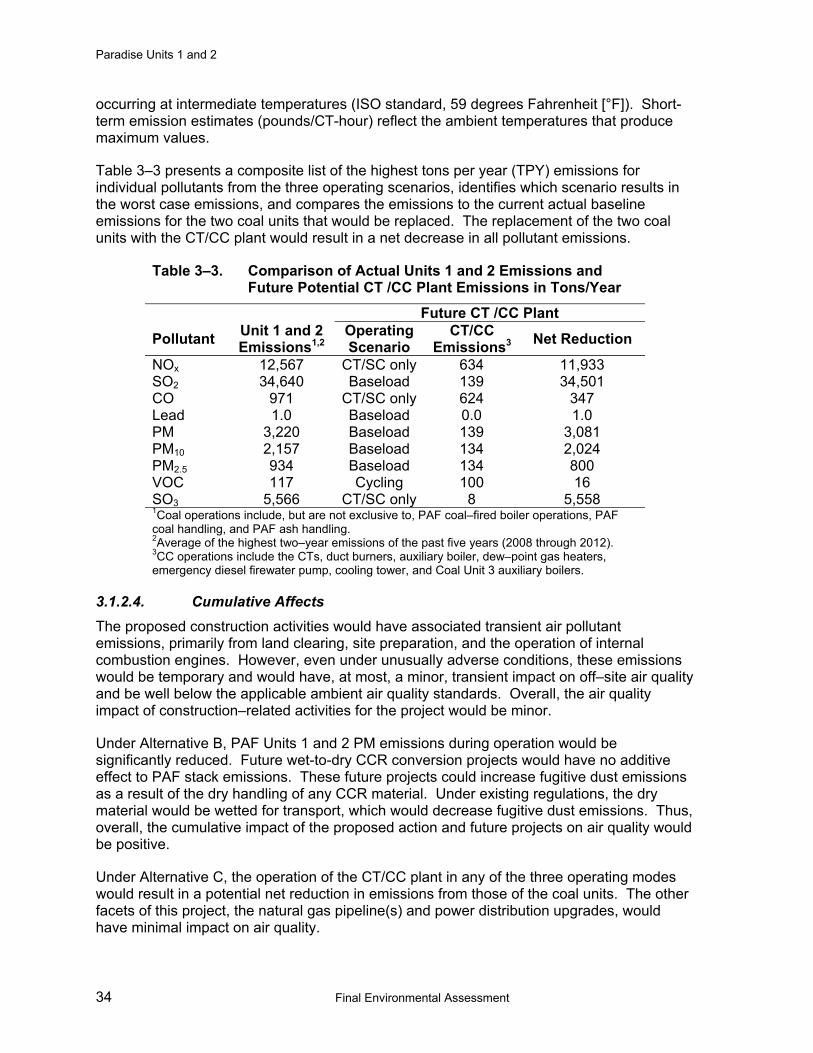
Paradise Units 1 and 2
34 Final Environmental Assessment
occurring at intermediate temperatures (ISO standard, 59 degrees Fahrenheit [°F]). Short-term emission estimates (pounds/CT-hour) reflect the ambient temperatures that produce maximum values.
Table 3–3 presents a composite list of the highest tons per year (TPY) emissions for individual pollutants from the three operating scenarios, identifies which scenario results in the worst case emissions, and compares the emissions to the current actual baseline emissions for the two coal units that would be replaced. The replacement of the two coal units with the CT/CC plant would result in a net decrease in all pollutant emissions.
Table 3–3. Comparison of Actual Units 1 and 2 Emissions and Future Potential CT /CC Plant Emissions in Tons/Year
Future CT /CC Plant
Pollutant Unit 1 and 2 Emissions1,2
Operating Scenario
CT/CC Emissions3 Net Reduction
NOx 12,567 CT/SC only 634 11,933 SO2 34,640 Baseload 139 34,501 CO 971 CT/SC only 624 347 Lead 1.0 Baseload 0.0 1.0 PM 3,220 Baseload 139 3,081 PM10 2,157 Baseload 134 2,024 PM2.5 934 Baseload 134 800 VOC 117 Cycling 100 16 SO3 5,566 CT/SC only 8 5,558 1Coal operations include, but are not exclusive to, PAF coal–fired boiler operations, PAF coal handling, and PAF ash handling. 2Average of the highest two–year emissions of the past five years (2008 through 2012). 3CC operations include the CTs, duct burners, auxiliary boiler, dew–point gas heaters, emergency diesel firewater pump, cooling tower, and Coal Unit 3 auxiliary boilers.
3.1.2.4. Cumulative Affects The proposed construction activities would have associated transient air pollutant emissions, primarily from land clearing, site preparation, and the operation of internal combustion engines. However, even under unusually adverse conditions, these emissions would be temporary and would have, at most, a minor, transient impact on off–site air quality and be well below the applicable ambient air quality standards. Overall, the air quality impact of construction–related activities for the project would be minor.
Under Alternative B, PAF Units 1 and 2 PM emissions during operation would be significantly reduced. Future wet-to-dry CCR conversion projects would have no additive effect to PAF stack emissions. These future projects could increase fugitive dust emissions as a result of the dry handling of any CCR material. Under existing regulations, the dry material would be wetted for transport, which would decrease fugitive dust emissions. Thus, overall, the cumulative impact of the proposed action and future projects on air quality would be positive.
Under Alternative C, the operation of the CT/CC plant in any of the three operating modes would result in a potential net reduction in emissions from those of the coal units. The other facets of this project, the natural gas pipeline(s) and power distribution upgrades, would have minimal impact on air quality.
Chapter 3 – Affected Environment and Environmental Consequences
Final Environmental Assessment 35
3.1.2.5. Mitigation Measures and BMPs Dust control by wet suppression will assure that fugitive PM emissions are minimized. BMPs will be implemented to reduce dust from being transported beyond the PAF property boundary, preventing off–site impacts to air quality during construction and operation of both alternatives. Under both Alternatives B and C, TVA would operate the plant under the conditions of the Title V operating permit. TVA has not identified the need for non–routine mitigation measures to further reduce emissions of air pollutants.
3.2. Climate Change
3.2.1. Affected Environment “Global climate change” is change in the global environment that may alter the capacity of the earth to sustain life (U.S. Global Change Research Act of 1990). These changes include long–term alterations in climate, land productivity, oceans or other water resources, atmospheric chemistry, and ecological systems.
In 2007, the United Nations Framework Convention on Climate Change, Intergovernmental Panel on Climate Change (IPCC) asserted that global surface temperatures have risen by 1.33°F ± 0.32°F over the last 100 years (1906 to 2005). The IPCC also concluded that the rate of warming over the last 50 years is almost double that over the last 100 years (IPCC 2007). Most of the observed increase in globally averaged temperatures since the mid-20th century is very likely because of the observed increases in concentrations of carbon dioxide (CO2) and other greenhouse gases (GHG) including methane (CH4) and nitrous oxide (NOx) (IPCC 2007).
The primary GHG emitted by human activity is CO2 produced by the combustion of coal and other fossil fuels. Coal- and gas-fired electric power plants, automobiles, and certain industrial processes are major sources of CO2 emitted in the United States (EIA 2013). Emissions of GHG are also affected by development activities associated with land or forest clearing, land use changes, and construction activities involving use of fossil fuel-powered equipment (e.g., bulldozers, loaders, haulers, trucks, generators). Forests and other vegetated landforms represent sinks of CO2. The CEQ has published draft guidance intended to assist Federal agencies in analyzing environmental effects of GHG emissions and climate change in NEPA documents. Federal agencies are advised to consider opportunities to reduce GHG emissions caused by their proposed actions and plan their actions to adapt to climate change impacts (CEQ 2010). Actions having annual direct emissions greater than 25,000 metric tons of CO2 equivalent GHG warrant discussion in the NEPA analysis.
From 2002 through 2011, annual direct CO2 emissions from PAF ranged from 13.63 to 16.35 million tons. Overall, they averaged 14.83 million tons per year during this period.
3.2.2. Environmental Consequences
3.2.2.1. Alternative A – No Action Under Alternative A, TVA would continue current operations without implementing activities to reduce particulate emissions at PAF. Because no foreseeable changes to operations or emissions would occur at PAF, no change to PAF emissions of GHG is anticipated. TVA
Paradise Units 1 and 2
36 Final Environmental Assessment
would continue to take other actions to reduce the GHG emissions rate of its generating fleet, as described in the IRP EIS (TVA 2011b).
3.2.2.2. Alternative B – Install and Operate Pulse Jet Fabric Filter Systems Construction Impacts GHG impacts from demolition and construction would be temporary and dependent on manmade factors (e.g., intensity of activity, control measures). Assuming that construction would involve combustion emissions representative of a 200-horsepower diesel truck, operating eight hours every day for three months, the annual GHG emissions would be approximately 2,500 tons. GHG emissions from construction–related activities for this project would not be significant.
Operational Impacts Alternative B would not increase direct GHG emissions because it would not affect the amount of coal burned by the two units. Operation of the proposed pollution control equipment would require electricity to power the fans used to push the flue gas through the PJFF baghouses systems and associated ductwork, and for related purposes. This would result in a slight reduction in the plant’s efficiency and thus a slight increase in the GHG emissions rate (i.e., the quantity of GHG emitted per unit of electricity generated). GHG emissions from operation of the PJFF systems and fly ash management system would be negligible.
3.2.2.3. Alternative C – Construct and Operate Combustion Turbine/Combined Cycle Plant Construction Impacts GHG impacts from construction would be temporary and dependent on manmade factors (similar to Alternative B). GHG emissions from construction–related activities for this project would not be significant.
Operational Impacts Alternative C would result in a significant reduction in CO2 emissions relative to the operation of the coal–fired Units 1 and 2 under the No Action Alternative and Alternative B. A coal–fired plant produces approximately 2,000 pounds of CO2 per MWh of generation, and a natural gas plant operating in combined cycle mode typically produces approximately 1,000 pounds of CO2 per MWh. Operation in simple cycle mode produces approximately 1,500 pounds of CO2 per MWh when burning natural gas and around 1,850 pounds CO2 per MWh when burning fuel oil. These CO2 emission rates are, respectively, 50, 43, 25, and 7.5 percent less than the CO2 emission rates of PAF Units 1 and 2.
On September 20, 2013, the EPA Administrator issued proposed New Source Performance Standards for new electric generating units, For CC units of the size and capacity considered under this alternative, the proposed CO2 emission standard is 1,000 pounds per megawatt–hour of generation. TVA would meet the applicable standards to be established by EPA in the final rule.

Chapter 3 – Affected Environment and Environmental Consequences
Final Environmental Assessment 37
Gas Pipeline Impacts Potential GHG impacts would potentially occur from operating construction equipment across the project area. Potential GHG impacts from construction of the proposed pipeline(s) would be temporary and minimal. Operation of the proposed pipeline(s) would result in emissions of CO2 from increased operation of compressor plants and emissions of small quantities of methane during gas extraction, processing, storage, and transport. These emissions are expected to be relatively small.
3.2.2.4. Cumulative Affects Alternatives A and B would result in little change in GHG emissions and consequently little change in the cumulative effects of GHG emissions. The GHG emission reductions forecast in TVA’s IRP EIS (TVA 2011b: Section 7.6.2) anticipated the continued operation of PAF Units 1 and 2, and TVA would continue to implement other actions to reduce its fleet-wide GHG emissions. The GHG emission reductions resulting from adoption of Alternative C would accelerate the fleet-wide GHG emission reductions forecast in the IRP EIS and have beneficial cumulative impacts.
3.2.2.5. Mitigation Measures and BMPs No BMPs or non–routine mitigation measures are proposed to reduce GHG emissions.
3.3. Vegetation
3.3.1. Affected Environment PAF and surrounding areas are located within the Green River–Southern Wabash Lowland, a subregion of the Interior River Valleys and Hills Ecoregion (Woods et al. 2002), and the Shawnee Hills section of the Western Mixed Mesophytic Forest Region (TVA 2003). Bottomland forests and oak-hickory forests were once common in these regions (Kentucky Department of Fish and Wildlife Resources [KDFWR] 2010). These communities are presently dominated by agriculture and have been affected by previous coal mining (KDFWR 2010). Though limited, areas of remaining old–growth forest as well as secondary forests vary in composition in relation to topography and soil moisture conditions. These forests include representatives of oak-hickory, beech-dominated, and mixed mesophytic communities (TVA 2003).
Most of the PAF reservation, including the sites of the PJFF facility and the CC /CT plant, either is devoid of native vegetation or consists of early successional habitats (i.e., stages of forest development) with grasses and non–native herbaceous plant. Scattered shrubs and small trees also occur on the CC /CT plant site. With the exception of the riparian zone along the Green River, no forested habitats occur within the proposed construction areas of the PJFF facility or the CC. No uncommon vegetation or otherwise sensitive plant communities have been identified within the corridors of the proposed transmission lines (TVA 1999, 2003, and 2004).
The vegetation in the two potential gas pipeline corridors was evaluated with land use/land cover (LULC) information obtained from the National Land Cover Database (NCLD) (Fry et al. 2011). Deciduous forest is the most prevalent land cover type in each corridor (Table 3–4). Large portions of each corridor, including about two-thirds of C1, have been disturbed by surface mining. Much of the grassland/herbaceous areas, and all of the evergreen forest, in the form of pine plantations, are on these mined areas.
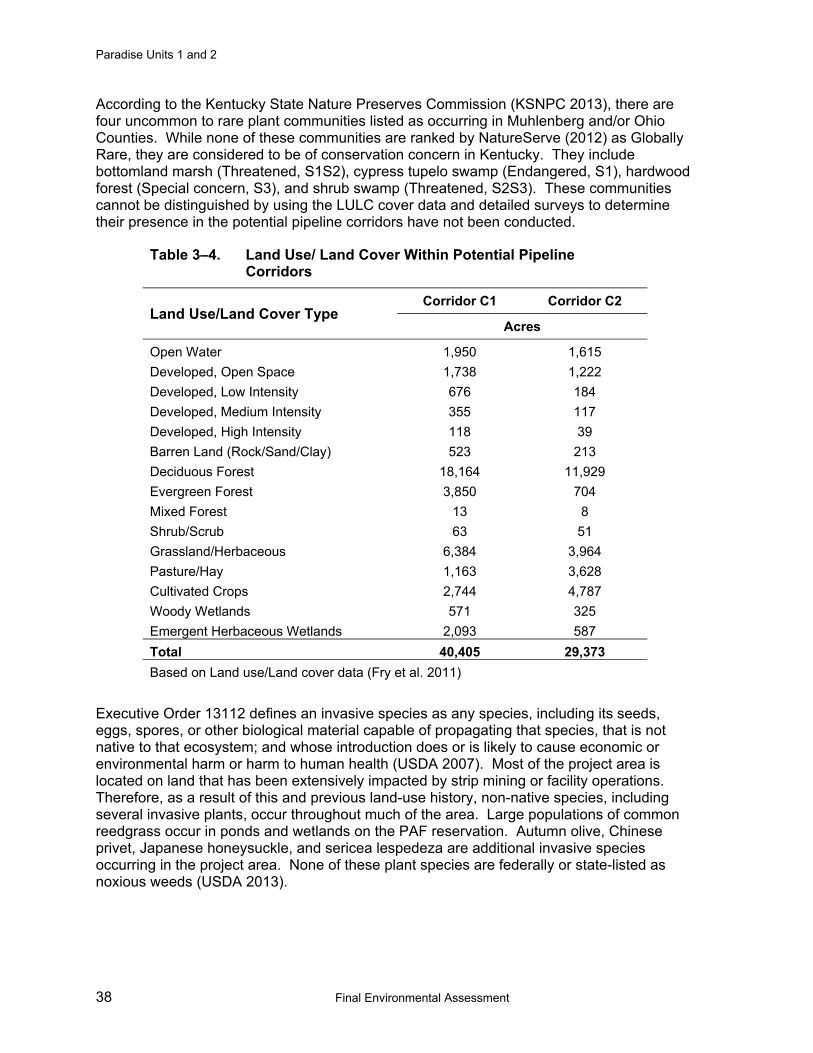
Paradise Units 1 and 2
38 Final Environmental Assessment
According to the Kentucky State Nature Preserves Commission (KSNPC 2013), there are four uncommon to rare plant communities listed as occurring in Muhlenberg and/or Ohio Counties. While none of these communities are ranked by NatureServe (2012) as Globally Rare, they are considered to be of conservation concern in Kentucky. They include bottomland marsh (Threatened, S1S2), cypress tupelo swamp (Endangered, S1), hardwood forest (Special concern, S3), and shrub swamp (Threatened, S2S3). These communities cannot be distinguished by using the LULC cover data and detailed surveys to determine their presence in the potential pipeline corridors have not been conducted.
Table 3–4. Land Use/ Land Cover Within Potential Pipeline Corridors
Land Use/Land Cover Type Corridor C1 Corridor C2
Acres
Open Water 1,950 1,615 Developed, Open Space 1,738 1,222 Developed, Low Intensity 676 184 Developed, Medium Intensity 355 117 Developed, High Intensity 118 39 Barren Land (Rock/Sand/Clay) 523 213 Deciduous Forest 18,164 11,929 Evergreen Forest 3,850 704 Mixed Forest 13 8 Shrub/Scrub 63 51 Grassland/Herbaceous 6,384 3,964 Pasture/Hay 1,163 3,628 Cultivated Crops 2,744 4,787 Woody Wetlands 571 325 Emergent Herbaceous Wetlands 2,093 587 Total 40,405 29,373 Based on Land use/Land cover data (Fry et al. 2011)
Executive Order 13112 defines an invasive species as any species, including its seeds, eggs, spores, or other biological material capable of propagating that species, that is not native to that ecosystem; and whose introduction does or is likely to cause economic or environmental harm or harm to human health (USDA 2007). Most of the project area is located on land that has been extensively impacted by strip mining or facility operations. Therefore, as a result of this and previous land-use history, non-native species, including several invasive plants, occur throughout much of the area. Large populations of common reedgrass occur in ponds and wetlands on the PAF reservation. Autumn olive, Chinese privet, Japanese honeysuckle, and sericea lespedeza are additional invasive species occurring in the project area. None of these plant species are federally or state-listed as noxious weeds (USDA 2013).
Chapter 3 – Affected Environment and Environmental Consequences
Final Environmental Assessment 39
3.3.2. Environmental Consequences
3.3.2.1. Alternative A – No Action Under Alternative A, TVA would not construct the PJFF systems or the CT/CC plant. No additional impacts to vegetation in the project area are expected under this alternative.
3.3.2.2. Alternative B – Install and Operate Pulse Jet Fabric Filter Systems Most of the PJFF facility site would be graded or otherwise disturbed during construction, removing most of the existing vegetation. In accordance with BMPs requirements described above, disturbed areas would be promptly revegetated to minimize erosion. To comply with EO 13112, native or non-native, non-invasive species would be used to revegetate disturbed areas to avoid the introduction or spread of invasive species. Because plant species in the project area are common and readily adaptable to disturbed areas, direct and indirect impacts to vegetation would be minimal.
3.3.2.3. Alternative C – Construct and Operate Combustion Turbine/Combined Cycle Plant Under Alternative C, TVA would construct a CT/CC plant and a natural gas supplier would construct a new gas pipeline(s) to bring fuel to this facility. The vegetation on the proposed plant site and laydown areas is composed of common, mostly early successional species. The long-term removal of much of the vegetation from the site would result in insignificant impacts. No additional impacts to vegetation on the PAF reservation would occur during operations. To comply with EO 13112, disturbed areas, including those areas around the new facility and along the pipeline route(s), would be revegetated with native or non–native, non–invasive species, to ensure that TVA does not introduce or spread invasive species.
Gas Pipeline Impacts Two potential corridors for the natural gas pipeline(s) serving the CT/CC plant have been identified. TVA staff used the Environmental Systems Research Institute ArcGIS Cost Path analysis tool to analyze the potential effects of the construction of a pipeline Corridor C1 and Corridor C2. The analysis used the LULC data cited above in Section 3.3.1. Each of the LULC types was assigned a weight on a 1–10 scale based on the ecological ‘cost’ of constructing a pipeline through the type. Higher costs (6–7) were assigned to Deciduous Forest, Evergreen Forest, Mixed Forest and Woody Wetlands, and to existing human infrastructure (Developed, Medium Intensity and Developed, High Intensity). The high cost ratings for forested types were based on their generally higher degree of alteration by pipeline construction, higher plant and animal diversity, longer replacement time after clearing, and potential suitability as habitat for the endangered Indiana bat. Lower costs (1–3) were assigned to LULC types that are previously disturbed (Developed, Open Space, Barren Land, Pasture/Hay, Cultivated Crops), or contain lower diversity of plants and animals (Shrub/Scrub, Grassland/Herbaceous). Open Water was assigned a value of 1 because all stream crossings (per the natural gas supply companies) would be constructed via directional boring. No costs greater than 7 were assigned, because none of the identified types within the study corridors appeared to have constraints that would preclude construction.
The Cost Path tool was used to create the low cost path, a 100–foot wide ROW route within each corridor that resulted in the greatest avoidance of high cost LULC types. The tool was also used to create a high cost path that resulted in the greatest use of high cost LULC types to show a worst–case route. The LULC data have a resolution of 30 m2.
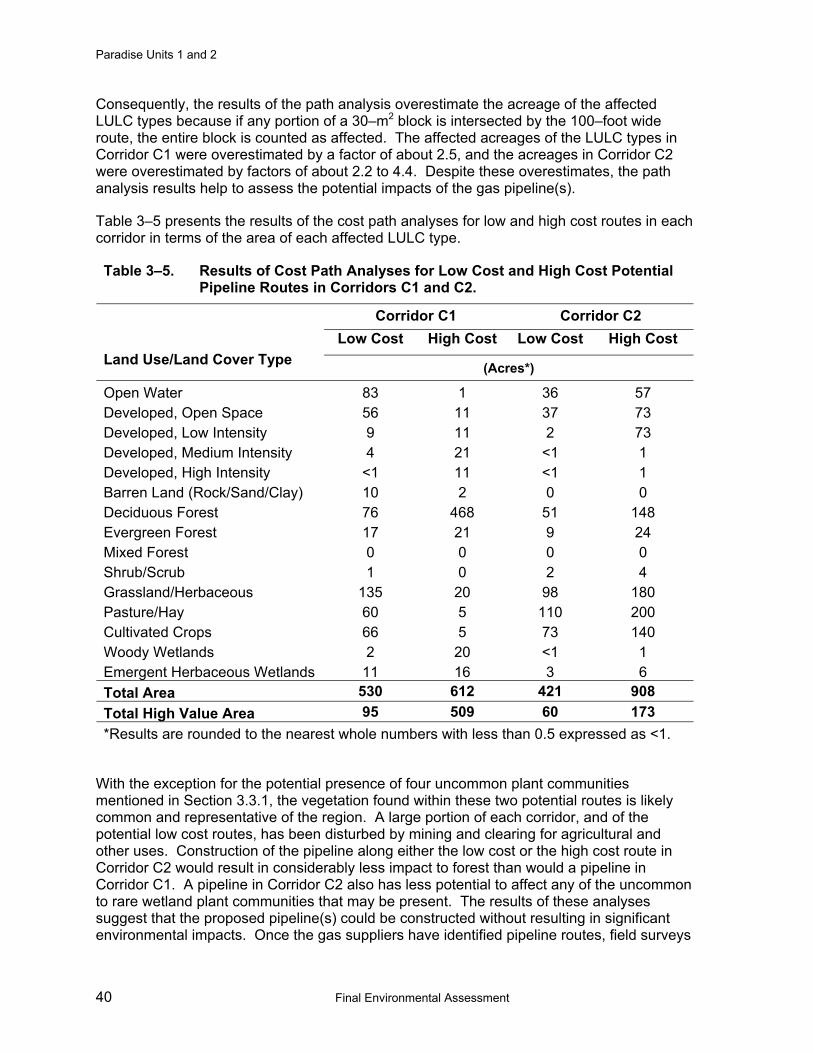
Paradise Units 1 and 2
40 Final Environmental Assessment
Consequently, the results of the path analysis overestimate the acreage of the affected LULC types because if any portion of a 30–m2 block is intersected by the 100–foot wide route, the entire block is counted as affected. The affected acreages of the LULC types in Corridor C1 were overestimated by a factor of about 2.5, and the acreages in Corridor C2 were overestimated by factors of about 2.2 to 4.4. Despite these overestimates, the path analysis results help to assess the potential impacts of the gas pipeline(s).
Table 3–5 presents the results of the cost path analyses for low and high cost routes in each corridor in terms of the area of each affected LULC type.
Table 3–5. Results of Cost Path Analyses for Low Cost and High Cost Potential Pipeline Routes in Corridors C1 and C2.
Land Use/Land Cover Type
Corridor C1 Corridor C2 Low Cost High Cost Low Cost High Cost
(Acres*)
Open Water 83 1 36 57 Developed, Open Space 56 11 37 73 Developed, Low Intensity 9 11 2 73 Developed, Medium Intensity 4 21 <1 1 Developed, High Intensity <1 11 <1 1 Barren Land (Rock/Sand/Clay) 10 2 0 0 Deciduous Forest 76 468 51 148 Evergreen Forest 17 21 9 24 Mixed Forest 0 0 0 0 Shrub/Scrub 1 0 2 4 Grassland/Herbaceous 135 20 98 180 Pasture/Hay 60 5 110 200 Cultivated Crops 66 5 73 140 Woody Wetlands 2 20 <1 1 Emergent Herbaceous Wetlands 11 16 3 6 Total Area 530 612 421 908 Total High Value Area 95 509 60 173 *Results are rounded to the nearest whole numbers with less than 0.5 expressed as <1.
With the exception for the potential presence of four uncommon plant communities mentioned in Section 3.3.1, the vegetation found within these two potential routes is likely common and representative of the region. A large portion of each corridor, and of the potential low cost routes, has been disturbed by mining and clearing for agricultural and other uses. Construction of the pipeline along either the low cost or the high cost route in Corridor C2 would result in considerably less impact to forest than would a pipeline in Corridor C1. A pipeline in Corridor C2 also has less potential to affect any of the uncommon to rare wetland plant communities that may be present. The results of these analyses suggest that the proposed pipeline(s) could be constructed without resulting in significant environmental impacts. Once the gas suppliers have identified pipeline routes, field surveys

Chapter 3 – Affected Environment and Environmental Consequences
Final Environmental Assessment 41
would be conducted to identify the presence of uncommon to rare plant communities, old growth forests, and other vegetation that could be adversely impacted by pipeline construction. The pipeline routes would be designed to minimize these potential impacts.
3.3.2.4. Cumulative Impacts Under the proposed actions, a minor cumulative impact from long–term loss of forested habitat would occur under Alternative C, but no significant cumulative impacts to the vegetation of the area are anticipated.
3.3.2.5. Mitigation Measures and BMPs To comply with EO 13112, disturbed areas would be revegetated with native or non–native, non–invasive annual plant species to ensure that TVA does not introduce or spread invasive species or noxious weeds.
3.4. Wildlife
3.4.1. Affected Environment Vegetation types in the project area are described above in Section 3.3.1. Because it has been heavily disturbed, the proposed PJFF facility site offers limited habitat for wildlife. Wildlife species present on the site include those typically associated with human presence such as the European starling, house sparrow, and rock pigeon. The more heavily vegetated CC /CT plant site supports a more diverse community of wildlife adapted to early successional habitats such as the eastern cottontail, white-tailed deer, striped skunk, white-footed mouse and other rodents, wild turkey, field sparrow, indigo bunting, red-winged blackbird, black rat snake, and northern black racer.
The ash ponds offer suitable habitat and foraging opportunities for water birds, amphibians, and mammals. Despite the continual disturbance of the ponds, wildlife using them includes black ducks, mallards, great blue herons, and beavers (TVA 2003, 2004). A great blue heron colony has been reported along the Green River a short distance upstream of PAF, but no colonies have been recorded on the PAF reservation (TVA 2003).
A large portion of each pipeline corridor (56 percent of Corridor C1, 40 percent of Corridor C2) is forested, predominantly by deciduous forest (see Table 3–4). Wildlife species present in these forested habitats likely include Acadian flycatcher, red-eyed and yellow-throated vireos, white-breasted nuthatch, wood thrush, northern parula and other warblers, eastern mole, long-tail weasel, red fox, eastern box turtle and northern ringneck snake.
Early successional habitats, including scrub/shrub, grassland, and farmland, make up about a third of the pipeline corridor surface lands. A large proportion of these areas not currently in agricultural production are on areas that were surface mined, and the resulting combination of extensive grasslands interspersed with numerous ponds and wetlands is an uncommon wildlife habitat type in the region. Although the wildlife populations on these early successional habitats are generally less diverse than those in forested habitats, they do include several relatively common species that have declining populations. Early successional habitats are important for the conservation of these species. Wildlife present in these habitats include northern bobwhite, white-eyed vireo, prairie warbler, field and grasshopper sparrow, dickcissel, and eastern meadowlark. The species listed above as occurring on the CT/CC plant site would also occur in these habitats. Uncommon and/or regionally rare species occurring in the grassland/pond areas include the northern harrier,
Paradise Units 1 and 2
42 Final Environmental Assessment
rough–legged hawk (in winter), short-eared owl, Bell’s vireo, and Henslow’s sparrow. Numerous ponds resulting from surface mining occur in the pipeline corridors. These provide habitat for many aquatic species including several species of waterfowl, black-crowned night heron, Blanchard’s cricket frog, gray tree frog, midland painted turtle, and red-eared slider.
Both pipeline corridors overlap units of the Peabody Wildlife Management Area (WMA). This WMA is largely on reclaimed surface-mined lands and is popular for hunting and for fishing in the numerous ponds and lakes. Habitat improvements carried out by the KDFWR have primarily focused on improving user access and enhancing game and fish populations.
No caves have been documented at PAF and none are known to occur within the project area. Should caves be identified during the pipeline routing process, they would be examined for use by wildlife, including threatened and endangered species.
3.4.2. Environmental Consequences
3.4.2.1. Alternative A – No Action Under Alternative A, the existing conditions and trends described for wildlife and their habitats are expected to continue.
3.4.2.2. Alternative B – Install and Operate Pulse Jet Fabric Filter Systems The proposed PJFF site is already used for industrial purposes and therefore provides little habitat for terrestrial wildlife. The existing habitats in the project area are common, heavily impacted by previous and ongoing industrial practices, and similar to the surrounding landscape. Any wildlife currently using the project area (primarily common, habituated species) would likely during construction; however, because they are widespread species present in low numbers, the impacts would be minimal. This alternative is not expected to result in significant direct or indirect impacts to terrestrial wildlife or their habitats.
3.4.2.3. Alternative C – Construct and Operate Combustion Turbine/Combined Cycle Plant Under implementation of Alternative C, a new CT/CC plant, an associated transmission line and natural gas pipeline(s) would be constructed. Their construction would displace most of the wildlife present on the plant site and within the cleared transmission line and gas pipeline ROWs. The impacts to wildlife from construction and operation of the CT/CC plant and TL would be minor, as these areas are relatively small and dominated by early successional habitats.
The results of the cost path analysis of the potential effects of constructing pipelines in Corridors C1 and C2 (see Section 3.3.2.3) show a greater potential for adverse impacts to wildlife using forested and wetland habitats in Corridor C1 than in Corridor C2. These habitats support diverse wildlife populations and would be more heavily impacted by pipeline construction than would the early successional shrub/scrub, grassland/herbaceous, and farmland habitats. Periodic clearing of the pipeline ROWs following the completion of construction would maintain them as early successional habitats. The maintenance of cleared pipeline route(s) through forested areas would also fragment the remaining adjacent forests, reducing its suitability for several species of area–dependent wildlife. Field studies to be conducted during the siting of the pipeline route(s) would identify additional areas of

Chapter 3 – Affected Environment and Environmental Consequences
Final Environmental Assessment 43
important wildlife habitat where impacts should be avoided or minimized. The overall impacts of pipeline construction would likely not be significant.
3.4.2.4. Cumulative Impacts Because Alternative B would have very few impacts on wildlife, it is unlikely to result in cumulative impacts. Alternative C would likely result in cumulative impacts to forest–dwelling wildlife in the area through the loss and fragmentation of habitat.
3.4.2.5. Mitigation Measures and BMPs BMPs or mitigation measures are not required to reduce impacts to wildlife.
3.5. Threatened and Endangered Species
3.5.1. Affected Environment Project area information on the occurrence of threatened and endangered species, as well as species of conservation concern, was assembled from TVA field studies and from records maintained by TVA, KSNPC (2012), Kentucky Natural Heritage Program (2009), KDFWR (2013), and U.S. Fish and Wildlife Service (USFWS) (2008 and ECOS database).
Plants Fourteen species of plants listed by the KSNPC as threatened, endangered, or species of special concern in Kentucky occur or have been reported to occur in Butler, Muhlenberg and Ohio Counties (Table 3–6). Of these 14 species, none have been found during several field surveys on the PAF reservation or reported within 5 miles of PAF. Two listed species are known to occur within or adjacent to the proposed pipeline corridors. Southern wild rice was observed within Corridor C1 and water hickory has been reported just outside Corridor C1. No plant species of conservation concern have been reported from Corridor C2. No field surveys of the pipeline corridors have been conducted. Based on the habitats present, additional populations of state-listed species could be present. No federally listed plants are known or likely to occur in the project area. No designated critical habitat for federally listed plants occurs in the project area.
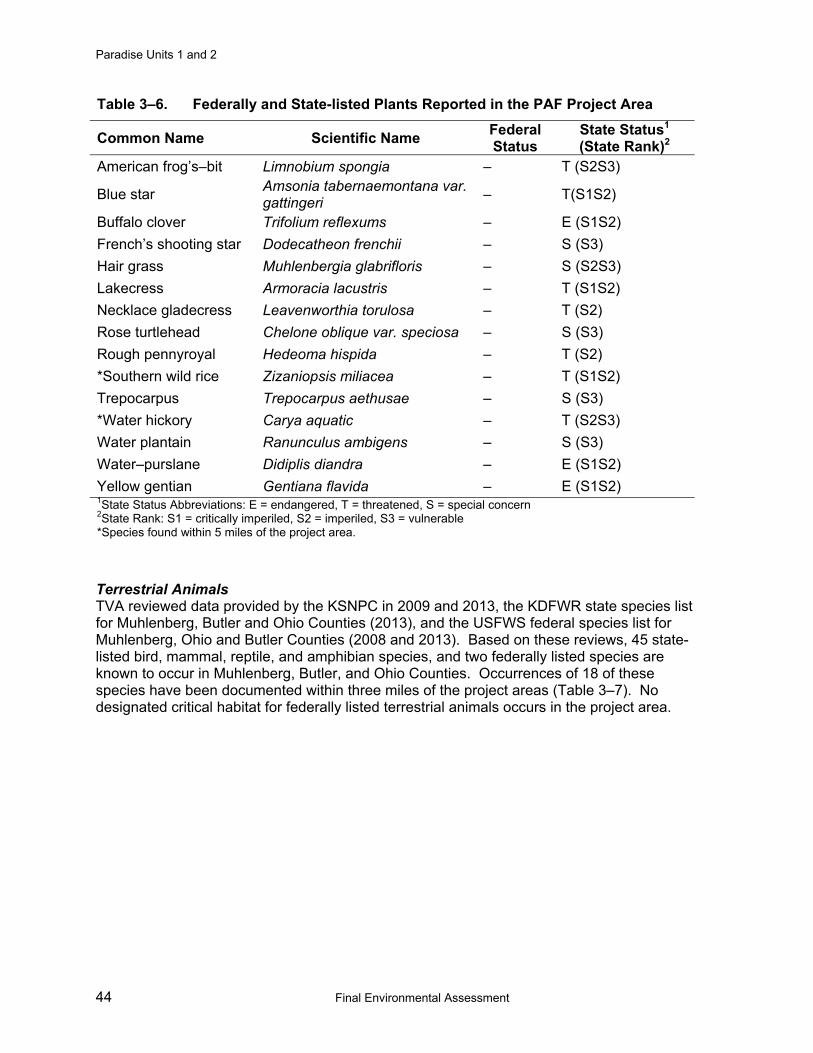
Paradise Units 1 and 2
44 Final Environmental Assessment
Table 3–6. Federally and State-listed Plants Reported in the PAF Project Area
Common Name Scientific Name Federal Status
State Status1 (State Rank)2
American frog’s–bit Limnobium spongia – T (S2S3)
Blue star Amsonia tabernaemontana var. gattingeri – T(S1S2)
Buffalo clover Trifolium reflexums – E (S1S2) French’s shooting star Dodecatheon frenchii – S (S3) Hair grass Muhlenbergia glabrifloris – S (S2S3) Lakecress Armoracia lacustris – T (S1S2) Necklace gladecress Leavenworthia torulosa – T (S2) Rose turtlehead Chelone oblique var. speciosa – S (S3) Rough pennyroyal Hedeoma hispida – T (S2) *Southern wild rice Zizaniopsis miliacea – T (S1S2) Trepocarpus Trepocarpus aethusae – S (S3) *Water hickory Carya aquatic – T (S2S3) Water plantain Ranunculus ambigens – S (S3) Water–purslane Didiplis diandra – E (S1S2) Yellow gentian Gentiana flavida – E (S1S2) 1State Status Abbreviations: E = endangered, T = threatened, S = special concern 2State Rank: S1 = critically imperiled, S2 = imperiled, S3 = vulnerable *Species found within 5 miles of the project area.
Terrestrial Animals TVA reviewed data provided by the KSNPC in 2009 and 2013, the KDFWR state species list for Muhlenberg, Butler and Ohio Counties (2013), and the USFWS federal species list for Muhlenberg, Ohio and Butler Counties (2008 and 2013). Based on these reviews, 45 state-listed bird, mammal, reptile, and amphibian species, and two federally listed species are known to occur in Muhlenberg, Butler, and Ohio Counties. Occurrences of 18 of these species have been documented within three miles of the project areas (Table 3–7). No designated critical habitat for federally listed terrestrial animals occurs in the project area.
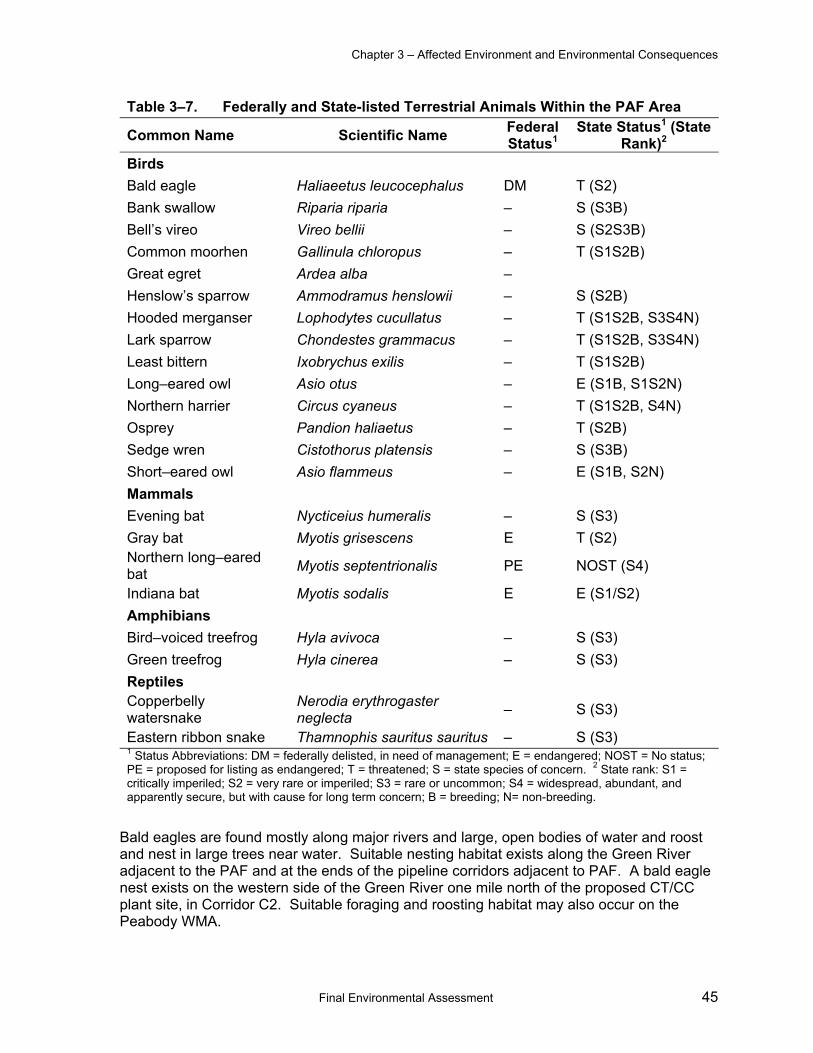
Chapter 3 – Affected Environment and Environmental Consequences
Final Environmental Assessment 45
Table 3–7. Federally and State-listed Terrestrial Animals Within the PAF Area
Common Name Scientific Name Federal Status1
State Status1 (State Rank)2
Birds Bald eagle Haliaeetus leucocephalus DM T (S2) Bank swallow Riparia riparia – S (S3B) Bell’s vireo Vireo bellii – S (S2S3B) Common moorhen Gallinula chloropus – T (S1S2B) Great egret Ardea alba – Henslow’s sparrow Ammodramus henslowii – S (S2B) Hooded merganser Lophodytes cucullatus – T (S1S2B, S3S4N) Lark sparrow Chondestes grammacus – T (S1S2B, S3S4N) Least bittern Ixobrychus exilis – T (S1S2B) Long–eared owl Asio otus – E (S1B, S1S2N) Northern harrier Circus cyaneus – T (S1S2B, S4N) Osprey Pandion haliaetus – T (S2B) Sedge wren Cistothorus platensis – S (S3B) Short–eared owl Asio flammeus – E (S1B, S2N) Mammals Evening bat Nycticeius humeralis – S (S3) Gray bat Myotis grisescens E T (S2) Northern long–eared bat Myotis septentrionalis PE NOST (S4)
Indiana bat Myotis sodalis E E (S1/S2) Amphibians Bird–voiced treefrog Hyla avivoca – S (S3) Green treefrog Hyla cinerea – S (S3) Reptiles Copperbelly watersnake
Nerodia erythrogaster neglecta – S (S3)
Eastern ribbon snake Thamnophis sauritus sauritus – S (S3) 1 Status Abbreviations: DM = federally delisted, in need of management; E = endangered; NOST = No status; PE = proposed for listing as endangered; T = threatened; S = state species of concern. 2 State rank: S1 = critically imperiled; S2 = very rare or imperiled; S3 = rare or uncommon; S4 = widespread, abundant, and apparently secure, but with cause for long term concern; B = breeding; N= non-breeding.
Bald eagles are found mostly along major rivers and large, open bodies of water and roost and nest in large trees near water. Suitable nesting habitat exists along the Green River adjacent to the PAF and at the ends of the pipeline corridors adjacent to PAF. A bald eagle nest exists on the western side of the Green River one mile north of the proposed CT/CC plant site, in Corridor C2. Suitable foraging and roosting habitat may also occur on the Peabody WMA.
Paradise Units 1 and 2
46 Final Environmental Assessment
Bank swallows nest in colonies such as burrows in vertical sand, dirt, or gravel banks, in open or partly open habitats. A colony with more than 100 nest burrows has existed for several years in a coal refuse pile in the southeast portion of the PAF reservation, just south of Reed Mineral Processing area (TVA 2004). Suitable nesting habitat for bank swallows is also available along the banks of the Green River near the PAF and pipeline Corridor C2.
The Bell’s vireo has been observed on reclaimed surface mines in Muhlenberg County, at the southeastern extent of its breeding range. Nest sites have been in large tracts of early successional habitat dominated by deciduous shrubs and small trees (Palmer-Ball 1996). Little suitable habitat for this species occurs on the PAF reservation. Bell’s vireo has been reported in the Peabody WMA within pipeline Corridor C1, and suitable habitat occurs elsewhere within both pipeline corridors.
Common moorhens and least bitterns typically inhabit marshes and the marshy borders of lakes and ponds with emergent aquatic vegetation, and are rare breeders in Kentucky (Palmer-Ball 1996). Little habitat for them occurs at the PAF ash ponds because of the limited aquatic vegetation. The numerous ponds in the pipeline corridors provide suitable habitat, especially in Corridor C1.
Henslow’s sparrows are very locally distributed summer residents across Kentucky. They are typically found in open habitats dominated by thick grassy vegetation with a residual layer of dead plant material such as fallow fields and reclaimed surface mines. This species occurs on the Peabody WMA (TVA 2003) and likely occurs within both pipeline corridors.
Hooded mergansers nest in tree cavities and nesting boxes at shallow-water sloughs and ponds in the lowland areas. While suitable nest habitat is not available on the PAF reservation, it exists in numerous locations on the pipeline corridors, especially in the waterfowl refuge part of Peabody WMA in Corridor C1.
Lark sparrows occur in open oak savannahs, cedar glades, or fields on the edge of woodlands. Two records of lark sparrows exist along pipeline Corridor C1 and suitable habitat is likely present at several locations in both corridors.
Long-eared owls are very rare imperiled breeders in Kentucky, where they are also rare winter residents. They utilize deciduous and coniferous forests with dense canopies for roosting and nesting and nearby open areas for foraging. The species has been reported in the Peabody WMA within Corridor C1; this area is considered key habitat for this species (KDFWR 2013).
Northern harriers and short-eared owls occupy similar habitats and have been documented nesting on surface mines reclaimed to grasslands and lacking trees. Suitable habitat for both occurs in the pipeline corridors. Large numbers of northern harriers winter in fields surrounding PAF. The harrier is more numerous and probably more widely distributed in Kentucky. Little suitable habitat for these species occurs at the proposed PJFF facility and CT/CC plant sites on the PAF reservation.
Osprey nest in large trees, utility poles, or similar structures over or adjacent to large water bodies (Palmer-Ball 1996). Nesting ospreys have been documented at PAF in the vicinity of the ash ponds. Another known nesting location exists east of PAF along pipeline Corridor C2. Suitable nesting habitat occurs in both pipeline corridors and along the Green River.
Chapter 3 – Affected Environment and Environmental Consequences
Final Environmental Assessment 47
Sedge wrens sporadically nest in Kentucky and occupy moist meadows of grasses and sedges and grassy margins of marshes and bogs. This habitat is uncommon but likely occurs in parts of the pipeline corridors.
Gray bats are associated year-round with caves, and from spring through fall disperse to forage along waterways (Tuttle 1976). The Green River adjacent to the PAF and pools of water at reclaimed mining sites provide suitable foraging habitat. This species has been captured along pipeline Corridor C1 in a reclaimed mining area just outside of the Peabody WMA. The closest known caves are greater than 10 miles from the project areas.
Potential habitat for Indiana bats has been identified by the USFWS in Muhlenberg, Ohio, and Butler Counties and the species has been documented in Muhlenberg County. Indiana bats hibernate in caves roost during the summer under the exfoliating bark of dead snags and living trees such as shagbark hickory and white oak. They forage over bodies of water and around the tops of trees along a forest edge or tree line. An Indiana bat was identified during an acoustic survey in 2011 at a reclaimed mining area 3.2 miles from the PAF Reservation along pipeline Corridor C1. The Green River and pools of water at reclaimed mining sites provide potentially suitable foraging habitat for this species. Suitable summer roost habitat is not present on the PJFF facility and CT/CC plant sites. Field surveys have not been conducted to determine the extent of suitable summer roosting habitat in the pipeline corridors. LULC data (see Section 3.3.1) and aerial photographs show that about 56 percent of Corridor C1 and 44 percent of Corridor C2 are forested and likely contain potential habitat for Indiana bats.
Evening bats and northern long-eared bats occur in Muhlenberg and Ohio counties. Both occupy crevices and hollows in mature trees during the summer, when the evening bat may also occupy buildings. Northern long-eared bats winter in caves and inactive mines; winter habitat for the evening bat is unknown. The evening bat has been reported along creeks in reclaimed mined areas on both pipeline corridors. Suitable roost habitat for the northern long-eared bat likely occurs on both pipeline corridors. Suitable roost habitat for these two species does not occur in the project area on the PAF reservation.
Bird-voiced treefrogs primarily inhabit swampy areas (Elliot et al. 2009) including large floodplain ponds, manmade ponds, and lakes that are near rivers or streams and in close proximity to forest. Suitable habitat for this species occurs at ponds and wetlands along both pipeline corridors, especially in the Peabody WMA in Corridor C1. Suitable habitat does not occur within the project area on the PAF reservation. The PAF ash ponds do not provide suitable breeding habitat for this species because of a lack of nearby forest vegetation and poor water quality. The green treefrog has similar habitat requirements and its distribution in the project area is likely similar to that of the bird–voiced treefrog.
Copperbelly watersnakes are associated with rivers and floodplains, large and small lakes and ponds, and other natural wetlands. This species has been observed on the northeastern boundary of the PAF reservation at a pond in a reclaimed mining area. It has also been observed on the Peabody WMA within pipeline Corridor C1. It likely occurs at additional ponds and wetlands in both pipeline corridors. Ash ponds on the PAF reservation may provide suitable habitat for this species. The eastern ribbon snake is semi-aquatic and lives in close proximity to streams, wetlands and ponds. It has been reported in a reclaimed mining area in pipeline Corridor C1 and could occur in other locations in both corridors.
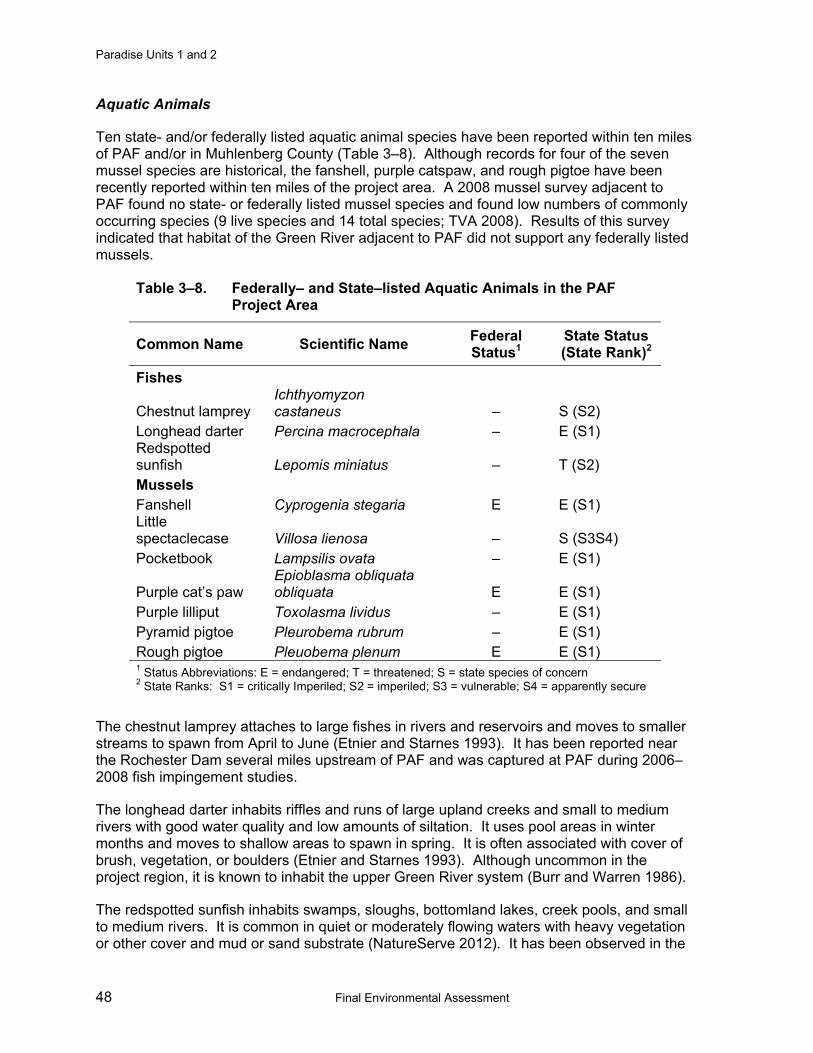
Paradise Units 1 and 2
48 Final Environmental Assessment
Aquatic Animals
Ten state- and/or federally listed aquatic animal species have been reported within ten miles of PAF and/or in Muhlenberg County (Table 3–8). Although records for four of the seven mussel species are historical, the fanshell, purple catspaw, and rough pigtoe have been recently reported within ten miles of the project area. A 2008 mussel survey adjacent to PAF found no state- or federally listed mussel species and found low numbers of commonly occurring species (9 live species and 14 total species; TVA 2008). Results of this survey indicated that habitat of the Green River adjacent to PAF did not support any federally listed mussels.
Table 3–8. Federally– and State–listed Aquatic Animals in the PAF Project Area
Common Name Scientific Name Federal Status1
State Status (State Rank)2
Fishes
Chestnut lamprey Ichthyomyzon castaneus – S (S2)
Longhead darter Percina macrocephala – E (S1) Redspotted sunfish Lepomis miniatus – T (S2) Mussels Fanshell Cyprogenia stegaria E E (S1) Little spectaclecase Villosa lienosa – S (S3S4) Pocketbook Lampsilis ovata – E (S1)
Purple cat’s paw Epioblasma obliquata obliquata E E (S1)
Purple lilliput Toxolasma lividus – E (S1) Pyramid pigtoe Pleurobema rubrum – E (S1) Rough pigtoe Pleuobema plenum E E (S1) 1 Status Abbreviations: E = endangered; T = threatened; S = state species of concern 2 State Ranks: S1 = critically Imperiled; S2 = imperiled; S3 = vulnerable; S4 = apparently secure
The chestnut lamprey attaches to large fishes in rivers and reservoirs and moves to smaller streams to spawn from April to June (Etnier and Starnes 1993). It has been reported near the Rochester Dam several miles upstream of PAF and was captured at PAF during 2006–2008 fish impingement studies.
The longhead darter inhabits riffles and runs of large upland creeks and small to medium rivers with good water quality and low amounts of siltation. It uses pool areas in winter months and moves to shallow areas to spawn in spring. It is often associated with cover of brush, vegetation, or boulders (Etnier and Starnes 1993). Although uncommon in the project region, it is known to inhabit the upper Green River system (Burr and Warren 1986).
The redspotted sunfish inhabits swamps, sloughs, bottomland lakes, creek pools, and small to medium rivers. It is common in quiet or moderately flowing waters with heavy vegetation or other cover and mud or sand substrate (NatureServe 2012). It has been observed in the
Chapter 3 – Affected Environment and Environmental Consequences
Final Environmental Assessment 49
Mud River upstream of PAF, and this species is likely to occur within portions of the Green River.
The pocketbook, pale lilliput, and pyramid pigtoe have all been historically reported in the Green River at the Rochester Dam upstream of PAF or further upstream. None of them are likely to occur in or near the project area.
The fanshell was once widely distributed but reproducing populations are presently only known in the Clinch River in Tennessee and Virginia and the Green and Licking Rivers in Kentucky (USFWS 1991). Non-reproducing populations or individuals persist in a few other rivers. It has been reported near Rochester Dam upstream of PAF. Typical fanshell habitat is gravel or cobble substrate in medium to large rivers (USFWS 1991).
In Kentucky, the little spectaclecase occurs throughout the Ohio River Valley, but is locally uncommon. It is typically found in slow-flowing, shallow, mud-bottomed streams and rivers (Parmalee and Bogan 1998).
Like the fanshell, the purple cat’s paw was once widespread. It is currently known to survive in only two river reaches as non–reproducing populations in the Cumberland River, Tennessee and Green River, Kentucky. The surviving populations in the Green River are threatened from degradation of water quality resulting from inadequate environmental controls at oil and gas exploration and production facilities, and from altered stream flows from upstream reservoirs (USFWS 1990). The purple cat’s paw has historically been observed in the Green River upstream of PAF near the Rochester Dam; there are no recent records from this area.
The rough pigtoe originally occurred in the Ohio, Cumberland, and Tennessee River drainages. It prefers medium to large rivers in sand and gravel substrates, and the host fish is unknown (Parmalee and Bogan 1998). Historically it occurred sporadically in the upper Green River system below Locks 4 and 5, but may be extirpated from this area.
3.5.2. Environmental Consequences
3.5.2.1. Alternative A – No Action Under Alternative A, TVA would not construct the PJFF facilities or the CT/CC plant and associated gas pipeline. Existing conditions and trends described for the endangered, threatened, and special concern species described in Section 3.5.1 are expected to continue.
3.5.2.2. Alternative B – Install and Operate Pulse Jet Fabric Filter Systems Under Alternative B, no direct or indirect impacts to listed species are expected as a result of implementing this alternative. Although several listed terrestrial animals have been reported or, based on the habitats present, could occur in the vicinity of the PJFF facility and its related components, none of these species are likely to be affected. Because of the limited effects on the Green River, none of the aquatic species known to occur or potentially occurring in the project area are likely to be affected.
Paradise Units 1 and 2
50 Final Environmental Assessment
3.5.2.3. Alternative C – Construct and Operate Combustion Turbine/Combined Cycle Plant None of the state-listed plants, terrestrial animals, or aquatic animals are expected to be adversely affected by the construction of the CT/CC plant or the connecting transmission lines. No federally listed species would be affected by these actions. Construction of the intake and discharge structures in the Green River would also not affect any federally listed species. The state-listed chestnut lamprey is unlikely to be adversely affected due to the greatly reduced volume of water withdrawn from the Green River. The reduced water withdrawal, relative to Alternatives A and B, could reduce the current minor impacts to this species.
Gas Pipeline Impacts Construction and operation of the natural gas pipeline(s) has the potential to affect several state-listed species, the federally listed Indiana bat, and the northern long-eared bat, which has been proposed for federal listing. Many of the state-listed species occur in early successional habitat that would be restored after pipeline construction or in wetland and riparian areas that would be minimally impacted. Suitable summer roost habitat for the Indiana and northern long-eared bats likely exists along both potential pipeline corridors. The forest cover types providing potential summer roost habitat (deciduous forest, mixed forest, woody wetlands) make up a large proportion of each corridor. As described in the cost path analysis results in Section 3.3.2.3, pipeline routes could be designed to minimize impacts to forested areas, while simultaneously minimizing impacts to developed areas. Even with these minimization efforts, potential summer roosting habitat for both bats would likely be removed from each corridor. The amount of affected forested habitat would be greater in Corridor C1 than in Corridor C2.
Once pipeline routes are proposed by the gas provider, field surveys would be conducted to better determine the presence and quantify the amount of suitable roosting habitat for the Indiana and northern long-eared bats. These surveys would follow applicable USFWS guidelines. In the event that suitable habitat is present, the potential impacts to the two bats would be addressed in consultation with USFWS as part of the FERC licensing process. Any impacts to the two bats that cannot be avoided would be subject to consultation (Indiana bat) or conference (northern long-eared bat) under Section 7 of the ESA. Appropriate mitigation measures would include clearing suitable forest habitat between November 15 and March 31 and could include mitigation payments to the Indiana Bat Conservation Fund. No adverse impacts to Indiana bat, northern long-eared bat, or gray bat foraging habitats, which are relatively common in the area, are anticipated.
Other than the chestnut lamprey, no state- or federally listed aquatic species are known or likely to occur in the affected project area of the Green River. The construction and operation of the water intake and discharge structure would not result in significant changes or impacts to surface waters or habitats of listed or other aquatic species. Impacts to any listed aquatic species in streams resulting from pipeline construction would be minimized by the use of directional boring techniques at major stream crossings.
3.5.2.4. Cumulative Impacts The implementation of either Alternative B or Alternative C with appropriate avoidance and mitigation measures is not expected to result in significant cumulative impacts on any state- or federally listed threatened or endangered species, species of conservation concern, or their habitats.

Chapter 3 – Affected Environment and Environmental Consequences
Final Environmental Assessment 51
3.5.2.5. Mitigation Measures and BMPs If bald eagles nests are found in an area of proposed action, appropriate avoidance and impact minimization measures would be implemented according to guidelines and regulations implementing the Bald and Golden Eagle Protection Act. Surveys would be conducted to identify the occurrence and habitats of listed species along proposed pipeline routes. These areas would be avoided to the extent possible. Where avoidance is not feasible, appropriate mitigation measures would be implemented as determined in consultation with USFWS.
3.6. Aquatic Ecology
3.6.1. Affected Environment PAF is adjacent to the Green River at river mile 100.5 (left bank) within the Jacobs Creek-Green River watershed approximately 8 miles downstream of the Rochester Dam (the former Lock and Dam #3). The Green River is a tributary of the Ohio River. It is considered the most biologically diverse branch of the Ohio River system with the greatest aquatic diversity occurring in a 100-mile section from the Green River Reservoir Dam through Mammoth Cave National Park to approximately river mile 190 (Kentucky Division of Conservation 2012). This stretch is many miles upstream of PAF.
TVA commissioned a biological survey in 1961 of the Green River near PAF to obtain information on the biological, chemical, and physical conditions of the river before PAF began operating. Results from the survey indicated that the algal flora growth was relatively low. Plankton was diverse in terms of species, sparse in terms of individuals per species, and considered healthy when compared to the control area. Invertebrates (other than protozoa and insects) collected indicated that sample stations below PAF did not support a balanced invertebrate fauna. Insect fauna was sparse and scattered likely because of unfavorable habitat conditions resulting from barge traffic and dredging activities in this reach of the Green River. Fish collections were too sparse and unrepresentative for valid conclusions. Chemistry and bacteriology results indicated that all characteristics or qualities determined were favorable to aquatic life (ANSP 1962). A 1965 follow up study determined that all of the stations sampled were somewhat poorer than in 1961. These results were most likely from high water temperatures and low dissolved oxygen in the summer months together with deposition of coal dust and heavy barge traffic (ANSP 1966).
TVA collected 43 fish species during impingement studies in 1974–1975 at PAF. Threadfin shad comprised 52 percent and gizzard shad comprised 44 percent of the impinged fish. Channel catfish and white crappie were the two next most abundant species impinged. More recent impingement studies conducted by TVA in 2006–2008 found gizzard shad was the dominant species followed by threadfin shad and freshwater drum. All other species comprised one percent or less of the total (TVA 2009b).
TVA sampled fish near PAF between Green River miles 98.4 and 105 in 2010 and 2011. In 2010, 596 individuals representing 36 species were collected with gizzard shad (56 percent), bluegill (5 percent), and spotted gar (4 percent) making up the top three most abundant species. In 2011, 1,952 individuals representing 51 species were collected with Mississippi silvery minnow (16 percent), bullhead minnow (3 percent) and bluegill (13 percent) making up the top three most abundant species.
Paradise Units 1 and 2
52 Final Environmental Assessment
A 2008 mussel survey (TVA 2008) of the Green River near the PAF coal unloading facility found very low densities of a small number of common mussel species.
A TVA bioassessment in 1998 on Jacobs Creek adjacent to PAF reported Index of Biotic Integrity scores of all sampling sites on Jacobs Creek as either “poor” or “fair” (TVA 1998).
3.6.2. Environmental Consequences
3.6.2.1. Alternative A – No Action Under Alternative A, there would be no additional construction and no new impacts to the Green River and Jacobs Creek would occur.
3.6.2.2. Alternative B – Install and Operate Pulse Jet Fabric Filter Systems The results of surveys of the Green River and Jacobs Creek show the presence of impacted aquatic communities with low diversity and dominated by common species. With the implementation of BMPs during construction and adherence to KPDES permit requirements, the construction and operation of the PJFF systems would have no adverse effects on aquatic ecology.
3.6.2.3. Alternative C – Construct and Operate Combustion Turbine/Combined Cycle Plant Construction of the CT/CC plant would have minimal impacts on aquatic ecology. Construction of the water intake and discharge would result in a minor disturbance to the Green River. The operation of the plant, with the associated retirement of PAF Units 1 and 2, would result in a great reduction in the volume of water withdrawals and discharges, both thermal and wastewater. This would result in beneficial impacts to aquatic ecology relative to the No Action Alternative and Alternative B. The use of appropriate BMPs and adherence to KPDES permit requirements would result in minimal direct or indirect adverse impacts to aquatic species and their habitats in the Green River.
Gas Pipeline Impacts The number of stream crossings within the pipeline corridors was estimated using ArcView GIS analysis of the National Land Cover Database (NLCD) and the National Hydrological Dataset. These data sources show that a pipeline in Corridor C1 would require 4 to 6 major stream crossings and numerous minor stream or wet–weather conveyance crossings. A pipeline in Corridor C2 would cross 5–6 major streams including the Green River, and numerous minor streams and wet–weather conveyances. Directional boring techniques would be used at major stream crossings and other major water bodies, including the Green River. Appropriate BMPs would be implemented where trenching is used for crossing small streams and wet–weather conveyances. With adherence to these measures, no adverse impacts to permanent streams or other water bodies, and to the aquatic life they contain, are anticipated.
3.6.2.4. Cumulative Impacts Under both action alternatives, impacts to aquatic resources are expected to be minor and would not result in adverse cumulative impacts. Alternative C would result in beneficial cumulative impacts to the Green River relative to the No Action Alternative and Alternative B.
Chapter 3 – Affected Environment and Environmental Consequences
Final Environmental Assessment 53
3.6.2.5. Mitigation Measures and BMPs Aside from the implementation of standard BMPs and the proposed use of directional boring techniques for pipeline crossings of major streams, TVA has not identified the need for mitigation measures to further reduce the potential impacts of the action alternatives on aquatic ecology.
3.7. Wetlands
3.7.1. Affected Environment Wetlands are those areas inundated by surface or groundwater such that vegetation adapted to saturated soil conditions is prevalent. Examples include swamps, marshes, bogs, and wet meadows. Wetlands are also found along the edges of most watercourses and impounded waters, both natural and manmade.
Wetlands are protected under Sections 404 and 401 of the CWA and by EO 11990. “Jurisdictional wetlands” are those that meet specific criteria established by the U.S. Army Corps of Engineers (USACE) (Environmental Laboratory 1987). In order to conduct specific activities in jurisdictional wetlands, a Section 404 Permit from the USACE is required. Section 401 gives states, including the KDEP Division of Water, the authority to certify whether activities requiring federal permits, including Section 404 permits, are in accordance with state water quality standards. EO 11990 requires all federal agencies to minimize the destruction, loss, or degradation of wetlands, and to preserve and enhance the natural and beneficial values of wetlands in carrying out the agency’s responsibilities.
PAF is located on the Green River in Muhlenberg County, Kentucky, in the Green River–Southern Wabash Lowlands Ecoregion. This region once had extensive areas of bottomland forests and wetlands, but agriculture and mining have reduced wetland area and altered wetland types within the region (Woods et al. 2002). Wetlands in this ecoregion comprise approximately 4.6 percent of the land cover (Loveland and Acevedo 2000). As discussed in Section 3.3.1, the KSNPC (2013) lists four types of wetland plant communities of conservation concern within Muhlenberg or Ohio Counties: bottomland marsh (Threatened, S1S2), cypress–tupelo swamp (Endangered, S1), hardwood forest (Special Concern, S3) and shrub swamp (Threatened, S2S3).
USFWS National Wetland Inventory (NWI) maps (USFWS 2012), aerial photography, LULC data (Fry et al. 2011), and results from previous site visits were used to identify wetlands within the project area.
NWI maps identified one wetland at the proposed PJFF facility site: the existing bottom ash pond. This ash pond is classified as L1UBHx (Lacustrine, Limnetic, Unconsolidated Bottom, Permanently Flooded, Excavated) in the NWI data. This code is used to identify artificially created mining pits containing water. This pond is an isolated feature with no hydrological connection to a traditional navigable waterway, and it is excluded from U.S. Army Corps of Engineers (USACE) jurisdiction based on the definition of Waters of the United States in regulations implementing Section 404 of the the CWA (33 CFR 328.3[a][8]). A narrow strip of forested wetlands occurs along the Green River adjacent to the project area.
The proposed CT/CC plant site is partially surrounded by excavated ponds totaling about 29 acres and, like the ash pond at the PJFF facility site, classified as L1UBHx. These are also excluded from USACE jurisdiction based on the definition of Waters of the United States.
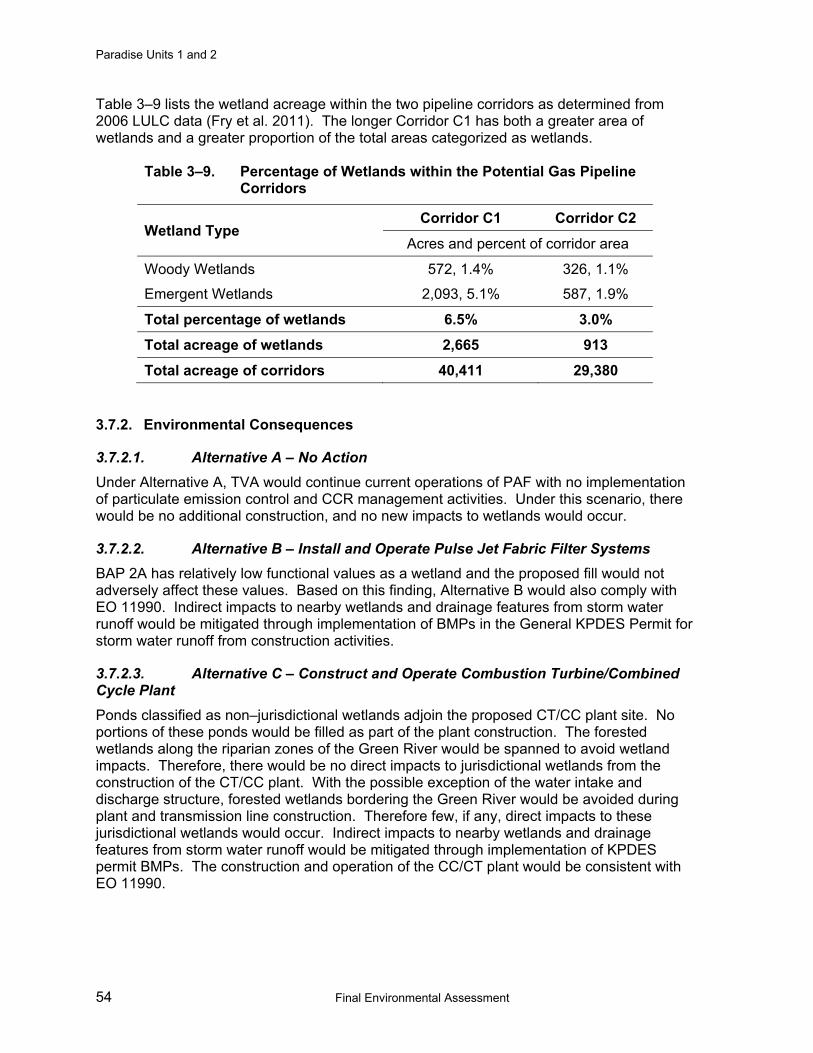
Paradise Units 1 and 2
54 Final Environmental Assessment
Table 3–9 lists the wetland acreage within the two pipeline corridors as determined from 2006 LULC data (Fry et al. 2011). The longer Corridor C1 has both a greater area of wetlands and a greater proportion of the total areas categorized as wetlands.
Table 3–9. Percentage of Wetlands within the Potential Gas Pipeline Corridors
Wetland Type Corridor C1 Corridor C2
Acres and percent of corridor area
Woody Wetlands 572, 1.4% 326, 1.1%
Emergent Wetlands 2,093, 5.1% 587, 1.9%
Total percentage of wetlands 6.5% 3.0%
Total acreage of wetlands 2,665 913
Total acreage of corridors 40,411 29,380
3.7.2. Environmental Consequences
3.7.2.1. Alternative A – No Action Under Alternative A, TVA would continue current operations of PAF with no implementation of particulate emission control and CCR management activities. Under this scenario, there would be no additional construction, and no new impacts to wetlands would occur.
3.7.2.2. Alternative B – Install and Operate Pulse Jet Fabric Filter Systems BAP 2A has relatively low functional values as a wetland and the proposed fill would not adversely affect these values. Based on this finding, Alternative B would also comply with EO 11990. Indirect impacts to nearby wetlands and drainage features from storm water runoff would be mitigated through implementation of BMPs in the General KPDES Permit for storm water runoff from construction activities.
3.7.2.3. Alternative C – Construct and Operate Combustion Turbine/Combined Cycle Plant Ponds classified as non–jurisdictional wetlands adjoin the proposed CT/CC plant site. No portions of these ponds would be filled as part of the plant construction. The forested wetlands along the riparian zones of the Green River would be spanned to avoid wetland impacts. Therefore, there would be no direct impacts to jurisdictional wetlands from the construction of the CT/CC plant. With the possible exception of the water intake and discharge structure, forested wetlands bordering the Green River would be avoided during plant and transmission line construction. Therefore few, if any, direct impacts to these jurisdictional wetlands would occur. Indirect impacts to nearby wetlands and drainage features from storm water runoff would be mitigated through implementation of KPDES permit BMPs. The construction and operation of the CC/CT plant would be consistent with EO 11990.
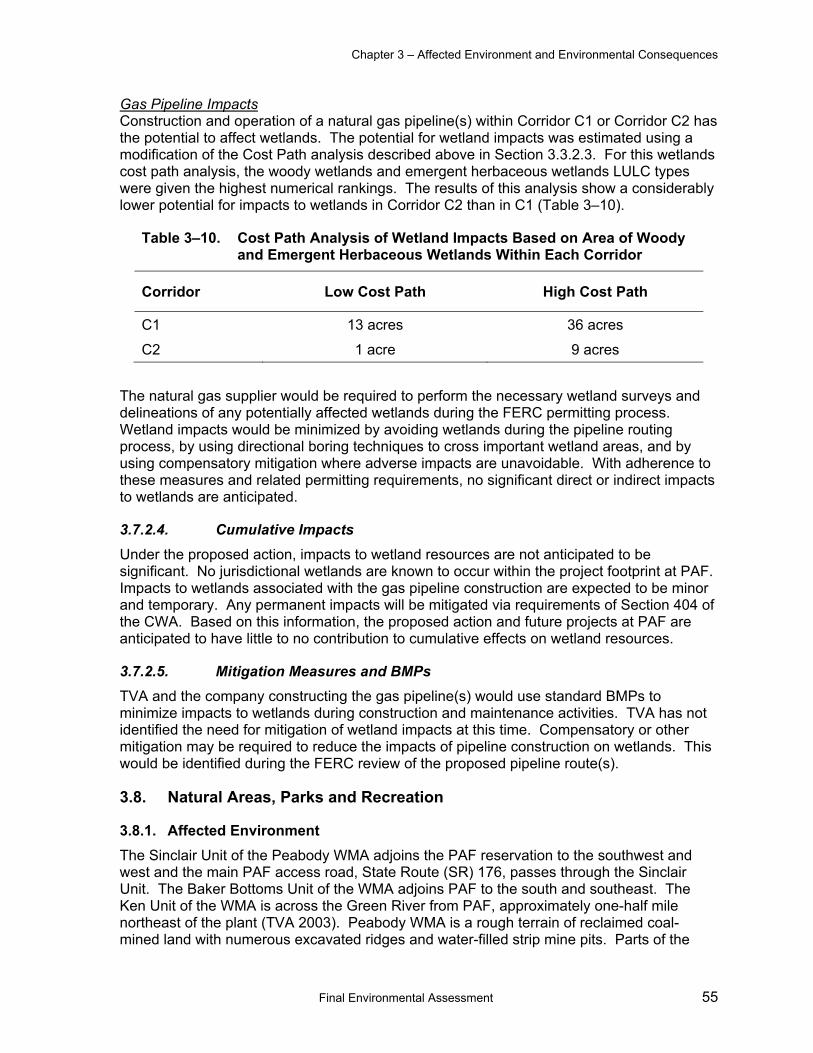
Chapter 3 – Affected Environment and Environmental Consequences
Final Environmental Assessment 55
Gas Pipeline Impacts Construction and operation of a natural gas pipeline(s) within Corridor C1 or Corridor C2 has the potential to affect wetlands. The potential for wetland impacts was estimated using a modification of the Cost Path analysis described above in Section 3.3.2.3. For this wetlands cost path analysis, the woody wetlands and emergent herbaceous wetlands LULC types were given the highest numerical rankings. The results of this analysis show a considerably lower potential for impacts to wetlands in Corridor C2 than in C1 (Table 3–10).
Table 3–10. Cost Path Analysis of Wetland Impacts Based on Area of Woody and Emergent Herbaceous Wetlands Within Each Corridor
Corridor Low Cost Path High Cost Path
C1 13 acres 36 acres
C2 1 acre 9 acres
The natural gas supplier would be required to perform the necessary wetland surveys and delineations of any potentially affected wetlands during the FERC permitting process. Wetland impacts would be minimized by avoiding wetlands during the pipeline routing process, by using directional boring techniques to cross important wetland areas, and by using compensatory mitigation where adverse impacts are unavoidable. With adherence to these measures and related permitting requirements, no significant direct or indirect impacts to wetlands are anticipated.
3.7.2.4. Cumulative Impacts Under the proposed action, impacts to wetland resources are not anticipated to be significant. No jurisdictional wetlands are known to occur within the project footprint at PAF. Impacts to wetlands associated with the gas pipeline construction are expected to be minor and temporary. Any permanent impacts will be mitigated via requirements of Section 404 of the CWA. Based on this information, the proposed action and future projects at PAF are anticipated to have little to no contribution to cumulative effects on wetland resources.
3.7.2.5. Mitigation Measures and BMPs TVA and the company constructing the gas pipeline(s) would use standard BMPs to minimize impacts to wetlands during construction and maintenance activities. TVA has not identified the need for mitigation of wetland impacts at this time. Compensatory or other mitigation may be required to reduce the impacts of pipeline construction on wetlands. This would be identified during the FERC review of the proposed pipeline route(s).
3.8. Natural Areas, Parks and Recreation
3.8.1. Affected Environment The Sinclair Unit of the Peabody WMA adjoins the PAF reservation to the southwest and west and the main PAF access road, State Route (SR) 176, passes through the Sinclair Unit. The Baker Bottoms Unit of the WMA adjoins PAF to the south and southeast. The Ken Unit of the WMA is across the Green River from PAF, approximately one-half mile northeast of the plant (TVA 2003). Peabody WMA is a rough terrain of reclaimed coal-mined land with numerous excavated ridges and water-filled strip mine pits. Parts of the

Paradise Units 1 and 2
56 Final Environmental Assessment
WMA are owned by KDFWR. Other parts are managed by KDFWR under lease agreements with the private landowners. The main public uses are fishing and hunting for deer, turkey, waterfowl, and small game, including quail. The Sinclair Unit contains a waterfowl refuge area encompassing Goose Lake immediately east of SR 176. It is a popular birding area for observing raptors and waterfowl during the winter and uncommon grassland species during the spring and summer. Horseback riding is popular on trails within the Ken Unit. Pipeline Corridor C1 passes through the Sinclair Unit and Corridor C2 passes through the Ken Unit.
The Wendell H. Ford Regional Training Center is crossed by pipeline Corridor C2. This Kentucky National Guard training facility encompasses 11,000 acres and much of it is open to hunting and fishing.
A public boat ramp is located on the west side of the Green River near the northern boundary of the PAF reservation close to the proposed CT/CC plant site. This boat ramp is accessible from SR 176 on the PAF reservation and from Rockport-Paradise road north of PAF.
3.8.1.1. Alternative A – No Action No impacts to natural areas, parks, and recreation would occur under this alternative.
3.8.1.2. Alternative B – Install and Operate Pulse Jet Fabric Filter Systems Due to the distance between the Peabody WMA and the PJFF site, construction and operation of the PJFF systems and associated facilities would have no direct and minimal indirect impacts on the nearby Peabody WMA or other natural areas. A small portion of the Peabody WMA would be indirectly affected by the increased construction traffic passing through it on SR 176. This traffic increase would be short–term and is unlikely to interfere with activities on the WMA.
3.8.1.3. Alternative C – Construct and Operate Combustion Turbine/Combined Cycle Plant Construction of the CT/CC plant and associated facilities, other than the natural gas pipeline(s), would have no direct or indirect impacts on the nearby Peabody WMA or other natural areas. Public use of the boat ramp near the plant site could be affected by increased construction traffic and noise; neither of which is expected to result in significant impacts.
Gas Pipeline Impacts A natural gas pipeline constructed in either Corridor C1 or Corridor C2 would cross part of the Peabody WMA. A pipeline in Corridor C2 would also cross the Wendell H. Ford Regional Training Center. The pipeline(s) would be routed in a manner to minimize adverse effects to the WMAs and the training center. The timing of the construction would also be coordinated with KDFWR to minimize construction during sensitive time periods such as the seasonal closure of the Goose Lake refuge area. While short–term impacts could be adverse, long–term impacts would likely be insignificant.
3.8.2. Cumulative Effects No cumulative effects are anticipated to natural areas or recreation within the region surrounding the Alternative B or C project areas. .

Chapter 3 – Affected Environment and Environmental Consequences
Final Environmental Assessment 57
3.8.2.1. Mitigation Measures and BMPs Construction of the natural gas pipeline through the Peabody WMA and the Wendell H. Ford Regional Training Center would be coordinated with the area managers to avoid, to the extent practicable, seasonally sensitive time periods. No other mitigation measures to minimize potential impacts to natural areas, parks, and recreation have been identified at this time.
3.9. Groundwater and Geology
3.9.1. Affected Environment PAF lies within the Shawnee section of the Interior Low Plateau Physiographic Province, and is underlain by Pennsylvanian-aged aquifers of the Carbondale Formation (Fenneman 1938). The Carbondale Formation consists of shale, coal, sandstone and limestone. The Carbondale is underlain by the Tradewater and Caseyville formations.
Horizontal groundwater gradients in the overburden generally follow surface topography with flow toward the Green River and Jacobs Creek. Groundwater movement in the underlying Carbondale formation occurs primarily through bedrock fractures and bedding planes (TVA 2003). The Carbondale receives recharge from the overburden and from lateral inflow along the western boundary of the reservation. Although horizontal groundwater gradients in the Carbondale formation are similar to those of the overburden, the groundwater potentiometric surface of the Carbondale averages about 5 feet lower than that of the overburden.
The availability of groundwater from bedrock sandstone in the Western Coal Field region varies widely (Maxwell and Devaul 1962). Prior to mining, the area was underlain by the three identifiable aquifers: the Lisman aquifer located near the surface (in the Sturgis formation), the Carbondale aquifer at an intermediate depth, and the Caseyville aquifer located more than 600 feet below the surface. Elsewhere in the region, usable groundwater is also found in the Tradewater Formation.
The Lisman is exposed in a part of the region, but has been largely removed by coal stripping and replaced by mining spoil in the upland areas. Where sandstone units of the Lisman or Carbondale aquifers are exposed at the surface, they receive direct infiltration and are susceptible to potential contamination. In undisturbed areas where the sandstone units are overlain by shale and coal beds, the sandstone is protected from direct recharge and less susceptible to potential contamination. Yields from the Lisman vary, but are generally suitable for domestic supplies.
The base of the spoil deposits is generally saturated, but the thickness of the saturated zone is highly variable. Perched water tables are common in the region. The Carbondale aquifer consists of about 50 feet of saturated sandstone.
Surface water serves as the primary source for public water supply in the region (USEPA 2012b). However at least 2,500 people in Muhlenberg County use private wells for domestic use. Previous studies by Starn et al. (1993) identified four wells within 2 miles of the plant reservation. These include one domestic well completed in the Sturgis formation. Three wells (two domestic and one industrial) were developed in the Carbondale. The two Carbondale domestic wells were reviewed in 2003 by TVA and found to no longer exist. The third Carbondale well is an industrial well upgradient of PAF. No new public drinking water sources have been located near the PAF (Kentucky Infrastructure Authority 2013).
Paradise Units 1 and 2
58 Final Environmental Assessment
Groundwater monitoring of the site occurs semiannually and results are reported to the Kentucky Division of Waste Management in the Semi-Annual Groundwater Report for the Residual Landfill and the FGD Pond Voluntary Monitoring Report. As of June 2013, the residual landfill had no maximum containment level (MCL) exceedances from the groundwater. Statistical exceedances of sodium, conductance, chloride, and total dissolved solids were reported and have been observed in the past. In June 2013, a statistical exceedance for boron was reported. Analytical results for the 2012 FGD Pond Voluntary Monitoring Report indicated that all constituent contaminants were below MCLs (TVA 2013a).
3.9.2. Environmental Consequences
3.9.2.1. Alternative A – No Action Under Alternative A, no additional direct or indirect effects to groundwater would occur. Alternative A includes continued operation the CCR ponds water treatment system. Because the operation would not include the addition of increased quantities of CCR or sluice water to the pond system, future impacts to groundwater are not expected to change. The continuing use of BMPs and adherence to site spill prevention control and countermeasures (SPCC) programs for the management and cleanup of oils, limit the likelihood that oil or chemicals would reach groundwater. Thus, there would be no additional effects to groundwater or geological resources along this existing line under Alternative A.
3.9.2.2. Alternative B – Install and Operate Pulse Jet Fabric Filter Systems Construction activities potentially affecting groundwater would be limited to excavations and a deep foundation system (anchored in the residuum and bedrock) associated with new structural foundations, construction of hydrated lime injection equipment, the construction of the new transmission line structures, and construction of materials handling and storage facilities. If needed, groundwater inflow would be controlled by short-term dewatering from the base of the excavation during foundation construction. Piles driven through ash or through the existing ash pond for system foundations present a risk of allowing contaminants into the groundwater. Appropriate construction BMPs would be used to mitigate this risk.
Minor excavations to support the sluice pipe, PJFF control systems, and associated construction would have no impact on groundwater. These excavations would not require groundwater control and would have no effect on offsite wells. No significant groundwater impacts associated with construction of the proposed facilities are anticipated. No operational impacts to groundwater from the proposed facilities are expected.
Operational impacts to groundwater would not change with the addition of the PJFF systems. CCR would continue in the near term to be sluiced to the Scrubber Sludge Complex (SSC) and Jacobs Creek Pond. The regional groundwater quality would not be impacted by the separate handling of fly ash. Although additional sluice water would be required to transport the fly ash from the PJFF system to the FAP, the quantity and quality of the CCR components would remain unchanged in the sluice water and the FAP. Any potential head loading of the additional sluice water would be mitigated by the large surface area of the FAP.
Chapter 3 – Affected Environment and Environmental Consequences
Final Environmental Assessment 59
3.9.2.3. Alternative C – Construct and Operate Combustion Turbine/Combined Cycle Plant Construction activities of the proposed CT/CC plant affecting groundwater would be limited to approximately 50 acres and would include installation of a deep foundation system, construction of the new transmission line structures, and construction of materials handling and storage facilities. If needed, groundwater inflow would be controlled by short-term dewatering from the base of the excavation during construction. No significant groundwater impacts associated with construction of the proposed CT/CC plant and associated facilities are anticipated.
No operational impacts to groundwater from the proposed facilities (including gas pipeline facilities) are expected. A gradual improvement of groundwater quality through attenuation may occur. The CT/CC plant would not produce CCRs, thus eliminating about two-thirds of the CCRs currently produced and managed on the PAF reservation.
3.9.2.4. Cumulative Affects No cumulative effects to groundwater would occur. The current use of BMPs and adherence to SPCC programs for the management and cleanup of oils, limit the likelihood that oil or chemicals would reach regional groundwater sources.
3.9.2.5. Mitigation Measures and BMPs The current use of BMPs and adherence to site SPCC would avoid contamination of groundwater. Appropriate construction BMPs would be used to mitigate risk of groundwater contamination during construction of deep foundations.
3.10. Surface Water
3.10.1. Affected Environment The Green River Basin contains approximately one–fourth of Kentucky’s land area and is the largest drainage basin in the state. Overall, water quality is good in the Green River Basin. However, according to the 2010 303(d) List of Waters for Kentucky, approximately 330 stream miles of the Green River are on the 303(d) list of impaired streams for pH, dissolved solids, and excessive fecal coliform bacteria (USACE 2011). Three segments of the Green River are listed on the state 303(d) report as “Fair,” meaning they only partially support their designated uses. None of these segments is near the PAF facility. The listed probable sources of pollutants are resource extraction, land disposal, and agriculture (KDEP 2011).
PAF withdraws water from the Green River for operational use as non-contact cooling water, boiler feed water, CCR sluice water, and equipment cleaning. The plant intake for Units 1 and 2 is located at river mile 100.6 and the intake for Unit 3 is located at river mile 100.3. An average of 337 MGD is withdrawn for cooling and operational purposes.
KPDES Permit No. KY0004201 authorizes the discharge of storm water and operational treated wastewater via permitted FAP Outfall 001, BAP Outfall 002, and condenser cooling water (CCW) Outfall 005. TVA is required under the KPDES Permit to meet pH, total suspended solids, oil and grease, free available chlorine, total residual chlorine, and chronic whole effluent toxicity (WET) limits in its various discharges to the Green River. An average of approximately 367 MGD is discharged to the river from the PAF operation. The KPDES
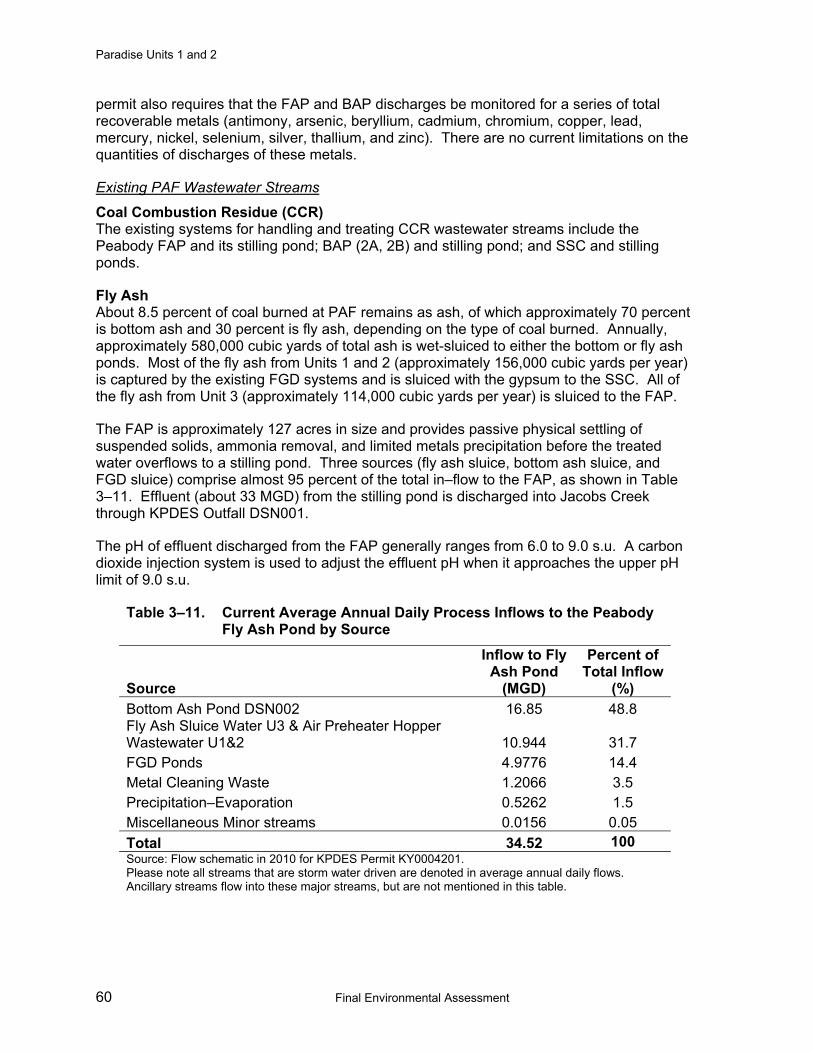
Paradise Units 1 and 2
60 Final Environmental Assessment
permit also requires that the FAP and BAP discharges be monitored for a series of total recoverable metals (antimony, arsenic, beryllium, cadmium, chromium, copper, lead, mercury, nickel, selenium, silver, thallium, and zinc). There are no current limitations on the quantities of discharges of these metals.
Existing PAF Wastewater Streams
Coal Combustion Residue (CCR) The existing systems for handling and treating CCR wastewater streams include the Peabody FAP and its stilling pond; BAP (2A, 2B) and stilling pond; and SSC and stilling ponds.
Fly Ash About 8.5 percent of coal burned at PAF remains as ash, of which approximately 70 percent is bottom ash and 30 percent is fly ash, depending on the type of coal burned. Annually, approximately 580,000 cubic yards of total ash is wet-sluiced to either the bottom or fly ash ponds. Most of the fly ash from Units 1 and 2 (approximately 156,000 cubic yards per year) is captured by the existing FGD systems and is sluiced with the gypsum to the SSC. All of the fly ash from Unit 3 (approximately 114,000 cubic yards per year) is sluiced to the FAP.
The FAP is approximately 127 acres in size and provides passive physical settling of suspended solids, ammonia removal, and limited metals precipitation before the treated water overflows to a stilling pond. Three sources (fly ash sluice, bottom ash sluice, and FGD sluice) comprise almost 95 percent of the total in–flow to the FAP, as shown in Table 3–11. Effluent (about 33 MGD) from the stilling pond is discharged into Jacobs Creek through KPDES Outfall DSN001.
The pH of effluent discharged from the FAP generally ranges from 6.0 to 9.0 s.u. A carbon dioxide injection system is used to adjust the effluent pH when it approaches the upper pH limit of 9.0 s.u.
Table 3–11. Current Average Annual Daily Process Inflows to the Peabody Fly Ash Pond by Source
Source
Inflow to Fly Ash Pond
(MGD)
Percent of Total Inflow
(%) Bottom Ash Pond DSN002 16.85 48.8 Fly Ash Sluice Water U3 & Air Preheater Hopper Wastewater U1&2 10.944 31.7 FGD Ponds 4.9776 14.4 Metal Cleaning Waste 1.2066 3.5 Precipitation–Evaporation 0.5262 1.5 Miscellaneous Minor streams 0.0156 0.05 Total 34.52 100 Source: Flow schematic in 2010 for KPDES Permit KY0004201. Please note all streams that are storm water driven are denoted in average annual daily flows. Ancillary streams flow into these major streams, but are not mentioned in this table.

Chapter 3 – Affected Environment and Environmental Consequences
Final Environmental Assessment 61
Bottom Ash Bottom ash collects in the bottom of the boiler. It is washed from the boiler bottoms with jets of water and sluiced to BAP 2A where suspended solids are settled. Much of the settled bottom ash or slag is reclaimed by Reed Mineral. Precipitation runoff from the coal storage area drains to three separate ponds (Reed Mineral Ponds) and is pumped to the BAPs. BAP 2A discharge flows through a culvert to BAP 2B for further settling. BAP 2B discharges into a stilling pond and the stilling pond discharges into the Green River through Outfall DSN002. A portion of the BAP stilling pond discharge (annual average of 16.85 MGD) is pumped to the FAP. The BAP discharge to the Green River has an average flow of 25.13 MGD.
Gypsum FGD scrubber sludge or gypsum from all units is generated from the lime slurry, PM captured in the FGD, and makeup water blowdown required to keep the FGD operation in equilibrium. Makeup water and the lime feed slurry comprise 3.15 MGD of the discharge of 4.98 MGD pumped to the SSC. Fly ash removal is performed by the FGD systems on Units 1 and 2. The SSC stilling pond discharges to the FAP through the SSC channel. Other operations and runoff from other areas contribute an additional 0.46 MGD to the SSC system inflow (TVA 2003).
PAF has SCRs on all three units. Some ammonia may slip through the SCRs. Most of the ammonia slip would be removed from the stack gases in the FGD scrubbers and become part of the FGD gypsum wastewater. PAF performs quarterly monitoring of the intake, BAP discharge, and FAP discharge for ammonia per an ammonia monitoring plan required by KPDES Permit KY0004201.
Storm Water The existing plant site storm water runoff is regulated under the KPDES Permit KY0004201. BMPs are used to ensure compliance with the permit conditions. Some plant storm water runoff is directed through the fly ash and the bottom ash pond systems discussed above, whereas other storm water runoff goes directly to the Green River or Jacobs Creek through permitted discharge points.
Sanitary Wastewater Treatment Most sanitary wastewater at PAF is treated on–site in a small, extended aeration package plant that discharges as Outfall DSN004 to Red Water Ditch #1. Red Water Ditch #1 then discharges to the BAP. DSN004 has limitations on 5-day carbonaceous biochemical oxygen demand and fecal coliform bacteria. The average annual flow from DSN004 is 0.02 MGD. Portable toilets are provided during outages, to facilitate an increased workforce (approximately 500 workers) and provide temporary sanitary facilities more conveniently located at job site.
3.10.2. Environmental Consequences
3.10.2.1. Alternative A – No Action Under Alternative A, TVA would continue current operations at PAF without implementing actions to further reduce air emissions. Because no changes to operations are foreseen, the chemical constituents of water discharges would be unchanged. Consequently, surface water would not be affected.

Paradise Units 1 and 2
62 Final Environmental Assessment
3.10.2.2. Alternative B – Install and Operate Pulse Jet Fabric Filter Systems Under Alternative B, TVA would install PJFF systems for PM control on PAF Units 1 and 2. The PJFF systems would be installed northwest of Units 1 and 2 and occupy a small portion of BAP 2A (Figure 2–1). Associated activities would include providing fly ash wet transport from the PJFF systems to the FAP and construction of an on-site 161-kV TL to provide power to the system.
Construction Impacts Wastewaters generated during construction of the proposed facilities may include construction storm water runoff, dewatering of work areas, sanitary wastewater, non-detergent equipment washings, dust control, and hydrostatic test discharges.
Storm Water Soil disturbances associated with construction and demolition activities could potentially result in adverse water quality impacts. Soil erosion and sedimentation can clog streams and threaten aquatic life. Activities where surface water could be impacted by storm water include:
• Reconfiguration (filling) of about one acre of BAP 2A for the structural base for the baghouse and associated facilities.
• Transmission line expansion from the main switchyard to a new switchyard adjacent to the new Unit 1 PJFF to power the new equipment.
• Preparation of equipment and spoils laydown areas.
The current KPDES permit would cover the site during construction and would require development of and adherence to both of project-specific and standard BMPs to minimize storm water impacts both in the plant and on the surrounding property. All proposed project activities would be conducted in a manner to ensure that waste materials are contained, and the introduction of pollution materials to the receiving waters would be minimized. Construction and maintenance activities would comply with appropriate state permit requirements and TVA internal requirements. In areas requiring chemical treatment for control of vegetation, only USEPA–registered herbicides would be used in accordance with label directions to prevent unacceptable aquatic impacts. As applicable, treatments would be in accordance with the KPDES Permit for Pesticide Application. Areas where soil is disturbed would be stabilized and vegetated with native or non–native, non–invasive grasses and mulched, or by other acceptable permanent stabilization methods following construction activities.
Sanitary Wastewater With an increased workforce, it would be necessary to make arrangements to provide additional restroom facilities. During the construction phase, temporary toilet facilities would be provided by a licensed vendor and sanitary wastewater would be disposed at an approved facility.
Equipment Washing and Dust Control Equipment washing and dust control discharges would be handled in accordance with the BMPs required by the site’s KPDES Permit KY0004201 to minimize construction impacts to surface waters.
Chapter 3 – Affected Environment and Environmental Consequences
Final Environmental Assessment 63
Hydrostatic Testing On–site hydrostatic testing will have the option to use potable or surface waters and would be covered under a KPDES Permit.
Operational Impacts The fly ash from PAF Units 1 and 2 would be carried in the flue gas stream exiting the boiler to the SCR system. From the SCR, the flue gas would pass through the air pre-heaters to the new baghouses, then through the induced draft (ID) fans and ultimately pass through the FGD facility. The new PJFF equipment would capture the fly ash from the flue gas stream. From the baghouse the fly ash would be pneumatically transported to the proposed fly ash storage silos and then would be wet sluiced to the FAP. Additionally, the existing hydrated lime injection system would be upgraded by adding additional storage silos and redundant injection lines.
Pulse Jet Fabric Filter Operation During operation of the proposed PJFF systems, the following wastewater streams could change:
• Addition of fly ash sluice water from Units 1 and 2 baghouses;
• FGD scrubber system wastewater;
• Surface water runoff from the proposed PJFF systems, duct work, and silo area; and
• Maintenance/clean-out washes associated with lime, PJFF systems, and fly ash storage system.
Fly Ash Sluice Stream The current fly ash for Units 1 and 2 is captured in the FGDs and then sluiced to the SSC, which drains into the FAP. With the installation of the PJFF systems, the fly ash would be carried to the baghouses in the flue gas stream. Hydroveyors (water jet venturi that pull a vacuum on the ash line to form ash sluice wastewater) would move the ash from the baghouse hopper to the ash silo, then sluiced to the FAP at a rate of approximately 3.02 MGD. The Units 1 and 2 fly ash sluice water will be added to the 10.94 MGD from Unit 3, for a total of 13.96 MGD of fly ash sluice water from all three units.
While overall fly ash mass in the wastewater would not increase with the installation of the PJFF system, there would be changes in the characteristics of the wastewater stream, including retention time, general chemistry, absorption, and alkalinity. Loading calculations were performed to evaluate the possible impacts of the altered fly ash wastewater steam. Samples of the existing Unit 3 fly ash wastewater stream were taken to characterize the metal concentrations in the proposed Units 1 and 2 fly ash sluice water. Green River intake samples and existing FAP samples were also analyzed to estimate the concentration of metals in the FAP discharge. These calculations conservatively include both the existing metal concentrations in the ash pond and the new fly ash sluice stream, thus potentially doubling the metal concentrations of the Units 1 and 2. Table 3–12 shows the results of the loading calculations; parameters of concern are highlighted.
This mass balance analysis represents the estimated maximum discharge concentrations from the FAP prior to assimilation in the receiving waters. Results of the analysis showed that the concentrations of the constituents of concern at Outfall 001 would be at or below the KDEP water quality criteria, except for cadmium and selenium. Cadmium and selenium are

Paradise Units 1 and 2
64 Final Environmental Assessment
currently monitored quarterly at the FAP discharge and results are reported to KDEP. No discharge limits for cadmium or selenium have been established in the site KPDES permit. Historic data shows that the discharge levels of cadmium have ranged from <0.0001 to 0.015 mg/L from 2000 to 2013. Historic data shows that the discharge levels of selenium have ranged from 0.001 to 0.039 mg/L from 2000 to 2013. Although some historic values are higher than the current water quality standards, WET test results have demonstrated that toxicity permit limits have been maintained and the FAP discharge is not toxic to aquatic organisms and habitats. Background samples of the Unit 3 fly ash wastewater stream showed concentrations of selenium below the detection limit. Therefore, the additional fly ash sluice streams from Units 1 and 2 would not significantly increase selenium concentrations in the FAP discharge at Outfall 001.
Several aspects of the project have the potential to possibly reduce selenium and cadmium levels in the FAP. The addition of the fly ash sluice streams from Units 1 and 2 increases the amount of wastewater entering the FAP and provides more assimilative capacity in the pond. Additionally, the removal of the Units 1 and 2 fly ash from the FGD slurry streams reduces the likelihood of entrained metals leaching out of the fly ash due to the FGD streams’ acidic nature.
The raw water demand would increase by approximately 3 MGD with the addition of the Units 1 and 2 sluice water. This change is less than one percent of the total raw water intake for the plant and would only increase the wastewater output of the ash pond by 8.7 percent.
TVA would continue to monitor the FAP and BAP discharges in accordance with the KPDES permit to confirm no significant impacts to the Jacobs Creek or the Green River are occurring from this action. Mitigation actions would be taken, if necessary, to ensure that discharges meet KPDES WET limits. Thus, the proposed PJFF systems should have no significant impact on the surface water quality of Jacobs Creek or the Green River.
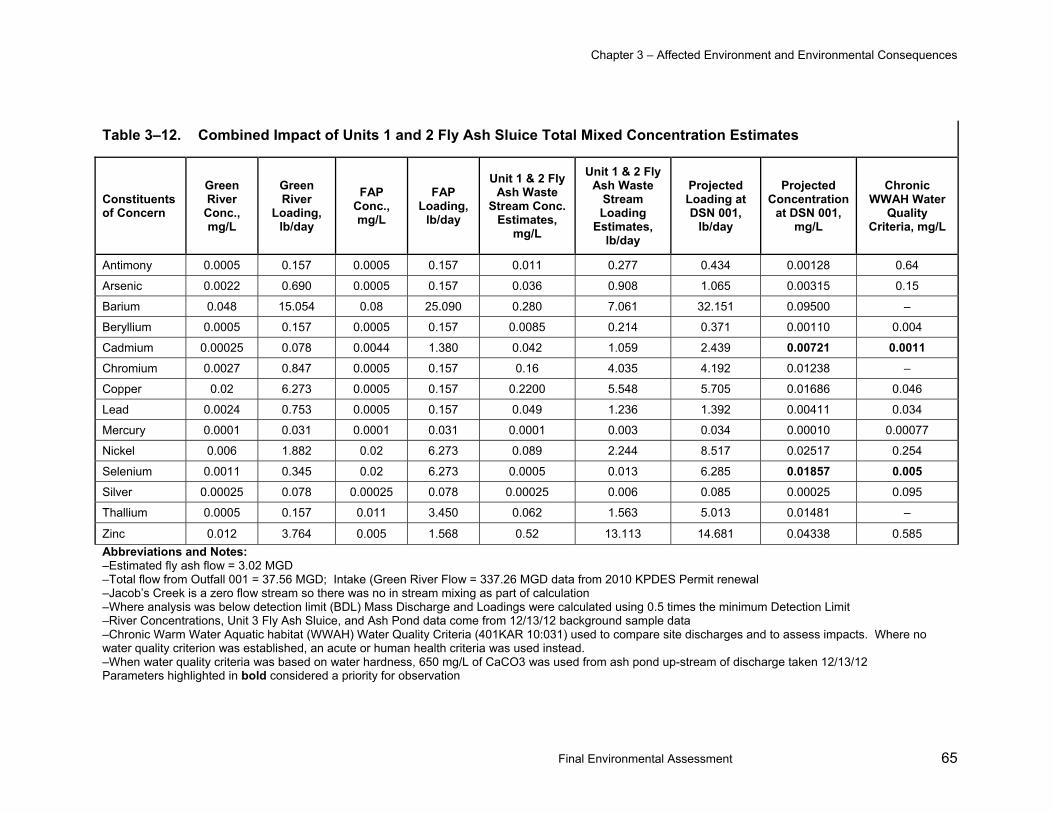
Chapter 3 – Affected Environment and Environmental Consequences
Final Environmental Assessment 65
Table 3–12. Combined Impact of Units 1 and 2 Fly Ash Sluice Total Mixed Concentration Estimates
Constituents of Concern
Green River
Conc., mg/L
Green River
Loading, lb/day
FAP Conc., mg/L
FAP Loading,
lb/day
Unit 1 & 2 Fly Ash Waste
Stream Conc. Estimates,
mg/L
Unit 1 & 2 Fly Ash Waste
Stream Loading
Estimates, lb/day
Projected Loading at DSN 001,
lb/day
Projected Concentration
at DSN 001, mg/L
Chronic WWAH Water
Quality Criteria, mg/L
Antimony 0.0005 0.157 0.0005 0.157 0.011 0.277 0.434 0.00128 0.64
Arsenic 0.0022 0.690 0.0005 0.157 0.036 0.908 1.065 0.00315 0.15
Barium 0.048 15.054 0.08 25.090 0.280 7.061 32.151 0.09500 –
Beryllium 0.0005 0.157 0.0005 0.157 0.0085 0.214 0.371 0.00110 0.004
Cadmium 0.00025 0.078 0.0044 1.380 0.042 1.059 2.439 0.00721 0.0011 Chromium 0.0027 0.847 0.0005 0.157 0.16 4.035 4.192 0.01238 –
Copper 0.02 6.273 0.0005 0.157 0.2200 5.548 5.705 0.01686 0.046
Lead 0.0024 0.753 0.0005 0.157 0.049 1.236 1.392 0.00411 0.034
Mercury 0.0001 0.031 0.0001 0.031 0.0001 0.003 0.034 0.00010 0.00077
Nickel 0.006 1.882 0.02 6.273 0.089 2.244 8.517 0.02517 0.254
Selenium 0.0011 0.345 0.02 6.273 0.0005 0.013 6.285 0.01857 0.005 Silver 0.00025 0.078 0.00025 0.078 0.00025 0.006 0.085 0.00025 0.095
Thallium 0.0005 0.157 0.011 3.450 0.062 1.563 5.013 0.01481 –
Zinc 0.012 3.764 0.005 1.568 0.52 13.113 14.681 0.04338 0.585 Abbreviations and Notes: –Estimated fly ash flow = 3.02 MGD –Total flow from Outfall 001 = 37.56 MGD; Intake (Green River Flow = 337.26 MGD data from 2010 KPDES Permit renewal –Jacob’s Creek is a zero flow stream so there was no in stream mixing as part of calculation –Where analysis was below detection limit (BDL) Mass Discharge and Loadings were calculated using 0.5 times the minimum Detection Limit –River Concentrations, Unit 3 Fly Ash Sluice, and Ash Pond data come from 12/13/12 background sample data –Chronic Warm Water Aquatic habitat (WWAH) Water Quality Criteria (401KAR 10:031) used to compare site discharges and to assess impacts. Where no water quality criterion was established, an acute or human health criteria was used instead. –When water quality criteria was based on water hardness, 650 mg/L of CaCO3 was used from ash pond up-stream of discharge taken 12/13/12 Parameters highlighted in bold considered a priority for observation
Paradise Units 1 and 2
66 Final Environmental Assessment
Units 1 and 2 FGD Wastewater Streams The current FGD wastewater streams are a combination of scrubber effluent and fly ash. The installation of the baghouse systems would separate these streams. This segregation would create more raw water demand (approximately 3.02 MGD), minimal additional potable water demand, and produce more wastewater discharge from the site. The potential for metal leaching from the fly ash in the acidic scrubber effluent would be reduced by the separation of fly ash and gypsum wastewater streams. Thus, Alternative B has the possibility to improve the water quality of the ash pond discharge. Additionally, the removal of the fly ash would reduce the solids content of this FGD wastewater stream, making the gypsum potentially marketable. The FGD wastewater characteristics would remain unchanged.
Storm Water The storm water streams changed by the operation of the proposed Alternative B would need to be evaluated for inclusion in the KPDES permit and assessed for potential surface water impacts.
Buildings, pavement, and other infrastructure prevent rain from percolating through the soil by providing an impervious cover. The proposed action would increase the impervious cover on the project area, thus altering and possibly increasing the concentrated storm water flow into storm drains, ditches, and streams.
All non–contact storm water from this site would be routed to one of the ash ponds. These storm water streams are expected to be precipitation–driven and intermittent. Non–contact storm water discharges would be permitted under the existing KPDES Permit, and are not expected to have any adverse impacts on water quality in Jacob’s Creek or the Green River.
Contact storm water in combination with storm water mixed with process water would be routed to the FAP and discharged to Jacobs Creek (Outfall DSN001). Contact storm water run-off could possibly originate from the baghouse systems, lime storage area, by–product silo area, truck wash, and the duct bridges. Contact storm water could contain small concentrations of ash or lime. Higher concentrations of potential pollutants would be expected in the beginning of the precipitation-driven, intermittent events. This storm water stream has the potential to impact ash pond pH and metals concentrations. Since these drainage areas are adjacent to the bottom ash ponds and the Green River, it would be necessary to ensure proper routing from these areas to the FAP is maintained. It may be necessary to implement design controls, a cleaning and maintenance plan, and the installation of appropriate BMPs on site to ensure these storm water streams are not discharged directly to the Green River. With proper implementation of these controls, only minor temporary impacts to local surface waters are expected.
Other Wastewater Streams The PJFF facilities would be dry systems, with no associated blow–down or outage wash water streams. The PJFF systems would not require outage washes; however, outage cleaning of the ductwork and ash removal could potentially be required. The ash removal would be performed in such a way that all vacuum truck hoses would be routed inside the duct from an access door that is not directly over surface waters. Additionally, a curtain may be needed to ensure that fine ash particles do not become airborne and reach water resources.
Chapter 3 – Affected Environment and Environmental Consequences
Final Environmental Assessment 67
3.10.2.3. Alternative C – Construct and Operate Combustion Turbine/Combined Cycle Plant Alternative C includes the construction and operation of an approximately 800–1,200 MW CT/CC plant and associated gas pipeline(s). The CT/CC plant would be located just north of the existing coal pile and to the west of the Green River on an approximately 50-acre site partially surrounded by ponds (Figure 2–2).
Construction Impacts Wastewaters generated during construction of the proposed facilities may include construction storm water runoff, dewatering of work areas, domestic sewage, non–detergent equipment washings, dust control, and hydrostatic test discharges. Storm Water Soil disturbances associated with construction and demolition activities could potentially result in adverse water quality impacts. Soil erosion and sedimentation can clog streams and threaten aquatic life. Activities where surface water could be impacted by storm water include:
• Preparation of laydown areas
• Construction of the CT/CC plant and associated facilities (ponds, intake structures, and water treatment system)
• On–site transmission line expansion
• Construction of auxiliary boilers
• Construction of AST, if needed
• Construction of natural gas pipeline(s)
The current KPDES permit would cover the site during construction and would require development of a project–specific BMP to minimize storm water impacts both in the plant and on the surrounding property. All proposed project activities would be conducted in a manner to ensure that waste materials are contained, and the introduction of pollution materials to the receiving waters would be minimized. In areas requiring chemical treatment, only USEPA–registered herbicides would be used in accordance with label directions to prevent unacceptable aquatic impacts. As applicable, treatments would be in accordance with the KPDES Permit for Pesticide Application. Where soil disturbance could occur, the area would be stabilized and vegetated with native or non-native, non-invasive grasses and mulched following construction activities.
The natural gas pipeline(s) would be constructed by ‘cut and fill’ with a 100-foot wide initial clearing of vegetation and a permanently cleared and maintained 50-foot right of way for future access to the pipe. All BMPs listed above would be used for aboveground work.
Underground boring would be used to construct the pipeline(s) at major highway, river, and major stream crossings. All water crossings by the gas pipelines (whether river or wetlands) would be by boring. Construction at water bodies would be conducted using either a “dry” crossing or “wet” crossing method. The pipeline system would be installed underground and all pipeline stream crossings would take place under the stream. The length of the crossing, the sensitivity of the area, existing conditions at the time of crossing, and permit requirements will determine the most appropriate measures to be used. Mobilization of
Paradise Units 1 and 2
68 Final Environmental Assessment
construction equipment, trench excavation, and backfilling would be performed in a manner that would minimize the potential for erosion and sedimentation within the water body channel. Erosion control measures would be implemented to confine water quality impacts within the immediate construction area and to minimize impacts to downstream areas.
With the implement of project BMPs, there should be no significant impacts to surface waters from construction of the pipeline(s).
Sanitary Wastewater With an increased workforce, it would be necessary to make arrangements to provide additional restroom facilities. During the construction phase, temporary toilet facilities would be provided by a licensed vendor and sanitary wastewater would be disposed at an approved facility.
Equipment Washing and Dust Control Equipment washing and dust control discharges would be handled in accordance with the BMPs required by the site’s KPDES Permit KY0004201 to minimize construction impacts to surface waters.
Hydrostatic Testing Hydrostatic testing is the last step in pipeline construction. This consists of running water, at pressures higher than will be needed for natural gas transportation, through the entire length of the pipe to ensure that the pipeline is strong enough, and absent of any leaks or fissures. The pipeline would be pressure tested in accordance with the pipeline vendors’ requirements to ensure its integrity for the intended service and operating pressures. The pipeline hydro testing water would normally be obtained from water sources crossed by the pipeline, including streams and available municipal supply lines. The pipeline contractor/owner would be responsible for obtaining the appropriate KDPES hydrostatic testing permit and performing testing within the requirements of the permit.
General hydrostatic testing (on-site or off-site) may have the option to use potable or surface waters and would be covered under a KDPES permit.
CT/CC Facility Operation Impacts The CT/CC facility would operate by compressing air and mixing it with natural gas. The natural gas would then be burned and the resultant hot air-fuel mixture would expand through turbine blades, making the three combustion turbine blades spin. The spinning turbines would drive the generator that converts the energy into electricity. For CC operation, a secondary HRSG would be used to produce additional electricity utilizing waste heat from the CT and improve the efficiency of the facility.
Raw water would be required to operate the CT/CC plant. Total maximum annual withdrawal is anticipated to be approximately 1,600 million gallons, or approximately 3,000 gallons per minute (gpm) for operations in CC mode. The anticipated maximum water usage at maximum power on a maximum temperature day would be 8.541 MGD. The maximum water consumption for the PAF CT/CC plant operations would be 95 percent less than the 168.63 MGD currently used to operate PAF Units 1 and 2.
TVA would use the Green River as the primary raw water source and is considering using existing bottom ash facilities (i.e., BAF 2A and 2B or existing PAF slag stilling pond) as a secondary raw water source to support CT/CC plant operations. All intake water utilized by
Chapter 3 – Affected Environment and Environmental Consequences
Final Environmental Assessment 69
the CC facility would be pretreated in a water treatment plant prior to use. Water treatment would consist of a filter press and clarifier to filter out suspended solids. Boiler make up water would require additional treatment provided by a demineralizer facility.
In the event of an emergency or if natural gas cannot be economically obtained, TVA is considering the use of fuel oil as a backup fuel to natural gas. The fuel oil would be stored in above-ground storage tanks (ASTs) on site. TVA would implement necessary measures to comply with applicable AST regulations, such as storage specifications, leak testing, spill containment, and requirements for hazardous substances. TVA currently complies with the state of Kentucky regulations that prohibit the discharge of pollutants into state waters and that provide for spill control plans that may affect AST owners and operators. TVA would install the ASTs in an appropriate location, and would adhere to containment, certification, and licenses requirements. TVA would consult with the appropriate local agencies, such as fire departments responsible for the administration and enforcement of the state fire code, about AST construction and management practices.
PAF CC Process Wastewater TVA would discontinue the operation of coal–fired Units 1 and 2 if the CT/CC plant alternative is selected. Discontinuing Units 1 and 2 operation, while continuing to operate Unit 3 and the CT/CC plant, would result in a significant reduction of CCR and FGD wastewater flows.
Bottom ash sluice flow at PAF averages 29.64 MGD. The BAP discharges are meeting all the requirements in the PAF KDPES permit and are not having a significant environmental impact on the Green River. Reducing these wastewater streams by approximately 15 MGD or by removing 242,219 dry tons per year to the BAP due to discontinued operation of Units 1 and 2 would reduce the metals loading and other parameters to the Green River. Likewise, removing approximately 80,740 dry tons of fly ash would reduce the metals loading and other parameters to Jacobs Creek and the Green River. Similar reduction in FGD constituent loading would also be anticipated.
TVA monitoring indicates that the heated water discharged from the operation of Units 1, 2, and 3 is not causing a significant impact to water quality or aquatic life. The proposed CC will discharge less heated water than the existing coal-fired Units 1 and 2. The CC cooling tower heated blowdown would be 1.367 MGD or less than 0.4 percent of the approximately 306 MGD of heated CCW discharge from the coal-fired Units 1 and 2. Therefore, Alternative C would result in significantly less heat loading discharged to the Green River.
The potential CC plant would include a HRSG. To prevent concentration of minerals in the HRSG, it would require a demineralized water feed and boiler blowdown to remove accumulating minerals. HRSG operation would require boiler feed water treatment chemicals. Cooling towers would be used to cool the steam cycle’s condenser water. Cooling towers produce continuous blowdown to remove excess minerals from the water. When in operation, the cooling towers would operate at 6 cycles of concentration.
Several ambient temperature cases ranging from -5 to 102 °F were evaluated to estimate the probable range of water requirements for the PAF CT/CC plant. In terms of water consumption and wastewater generation, the most conservative case would be three-turbine operations, 100 percent power, at an ambient temperature of 102 °F. For the worst case scenario with maximum power on a maximum temperature day (102 °F), the maximum average intake and cooling tower blowdown flows are expected to be 8.541 MGD and 1.367

Paradise Units 1 and 2
70 Final Environmental Assessment
MGD respectively. Based on TVA’s other CC facilities, this extreme case would be rare and likely only occur for a few days per year. At plant capacity factors of 40 or 60 percent, the raw water intake flows would still be high for short periods, but would drop significantly on a monthly and annual basis.
The primary wastewaters, which would be generated during proposed CT/CC plant operation, are cooling tower blowdown, solids from the raw water treatment system, reverse osmosis (RO) reject from the makeup demineralizer plant, and a combination of HRSG blowdown and evaporative cooler blowdown to the blowdown sump. The water treatment system dewatered sludge stream would be high in suspended solids. These solids would be analyzed and disposed of off-site in an approved facility. Compressor wash water would be collected and disposed of off-site at an approved wastewater treatment facility.
The cooling tower blowdown would be the only significant process wastewater directed to the process pond. The oil-water separator clear water discharge and miscellaneous drains would also be routed to the process pond, but would be negligible in comparison to the cooling tower blowdown. The concentrations of total dissolved solids, sulfates, and metals entering the process pond would remain consistent, independent of flows because the cooling tower blowdown would maintain a consistent 6 cycles of concentration.
A biocide may be dosed to the cooling towers intermittently to control biological slimes in the cooling towers. If and when a biocide is added to the cooling towers, cooling tower blowdown would be halted for approximately four hours to both provide maximum effectiveness for the biocide and to prevent discharge of any significant amount of biocide. This interruption of blowdown combined with the retention time in the process wastewater pond, should result in no significant impact from the biocides utilized in the cooling tower system.
According to design calculations for TVA’s John Sevier CC/CT site, the estimated ammonia concentrations that would be released to the process pond were zero. Therefore, no elevated ammonia concentrations are expected. However, because this waste stream would be evaluated for inclusion in the KPDES Permit KY000420, any ammonia issues would be identified and mitigated at that time. Additionally, the proposed CT/CC plant would discharge much less ammonia than the discharge from existing Units 1 and 2 resulting from ammonia slip. Therefore, no adverse impacts are anticipated from elevated ammonia concentrations from this plant
The primary constituents of the cooling tower blowdown would be those parameters present in the Green River water or the bottom ash pond, treated in the water treatment system to make service water, then concentrated six times in the cooling tower system. The estimated concentrations discharged to the proposed PAF CC process pond are listed in Table 3–13. This table is based on the conservative assumption that if a parameter was below detection limits (BDL) in the raw water, then the concentration in the treated service water would be one–half the detection limit.
As listed in Table 3–13, most of the parameters expected to be discharged to the process pond meet KDEP stream standards prior to mixing and assimilation in the river. The parameters of potential concern (highlighted in Table 3–13) are common minerals and solids that are concentrated in the water treatment systems, such as the RO Reject, the clarifier underflow, and the cooling tower blowdown. The potential parameters of concern include sulfates, total dissolved solids, hardness, and alkalinity. However, because these

Chapter 3 – Affected Environment and Environmental Consequences
Final Environmental Assessment 71
wastewaters would receive additional settling and neutralization in the proposed PAF CC process pond before they are discharged to the Green River there should be no significant impacts on the river.
Because of the conservative assumption that raw water parameters measured BDL could be present at levels as high as half the detection limit, the concentrations in Table 3–13 show some metals being discharged to the PAF CC process pond above the KDEP Chronic Warm Water Aquatic Habitat criteria. Further, these metals, including beryllium, cadmium, mercury, and thallium, are not added during the process. Rather, their presence in the discharge to the process pond and then in the discharge to the Green River reflects the “passing through” of the metals in the intake water. If the KPDES permit for the proposed PAF CT/CC plant contains requirements for WET testing, such testing would help confirm that the discharge of these metals is not toxic to aquatic organisms and habitats.
Total copper has been found in the raw water intake at concentrations ranging from 0.004 mg/l to 0.02 mg/L. Data indicate that approximately half the total copper is dissolved copper. Assuming that the particulate copper would be removed in the water treatment system, a value of 0.01 mg/L was utilized in the calculations in Table 3–13. No copper would be added by the CC processes. However, if the copper present in the raw water intake would be concentrated in the cooling tower system, the estimated copper concentration entering the process pond could be 0.0625 mg/L, which is greater than the standard of 0.0129 mg/L and the acute KPDES Warm Water Aquatic Habitat criteria of 0.02 mg/L. However, because of the alkalinity and hardness in the cooling tower blowdown, significant copper removal is expected to occur in this system or in the process pond.
Even if no copper would be removed, the relatively small flow of 1.367 MGD from the PAF CC process pond means that only 0.71 pounds per day of copper would be discharged from the process pond. The current copper concentration in the bottom ash discharge (25.96 MGD) is approximately 0.009 mg/L or approximately 1.95 pounds per day. Shutting down the coal–fired Units 1 and 2 could remove up to half of this copper or up to 0.97 pounds per day. Therefore, the copper present in the PAF CC process pond discharge should not have a significant impact on the Green River.
It is likely that the KPDES permit for the proposed PAF CC would contain requirements for WET. If the WET testing reveals any potential impacts, TVA would use an adaptive management approach to determine the source of the toxicity, and address the source with appropriate process modifications or wastewater treatment alternatives. Therefore, the expected process wastewaters should result in no significant impacts.
The proposed process pond would be monitored to determine that proper management and controls were in place to ensure the effluent had no significant impact to the receiving stream. If the additional alkalinity increases the process pond pH beyond 6.0–9.0 s.u., pH control measures, such as a CO2 system, might have to be used at the pond to control pH.
With the implementation of standard controls and BMPs, the impacts to surface water would be positive because of the elimination of the thermal and chemical constituent loadings from coal-fired Units 1 and 2. An additional benefit would be that the lower CC intake flow rates could reduce entrainment of aquatic organisms.
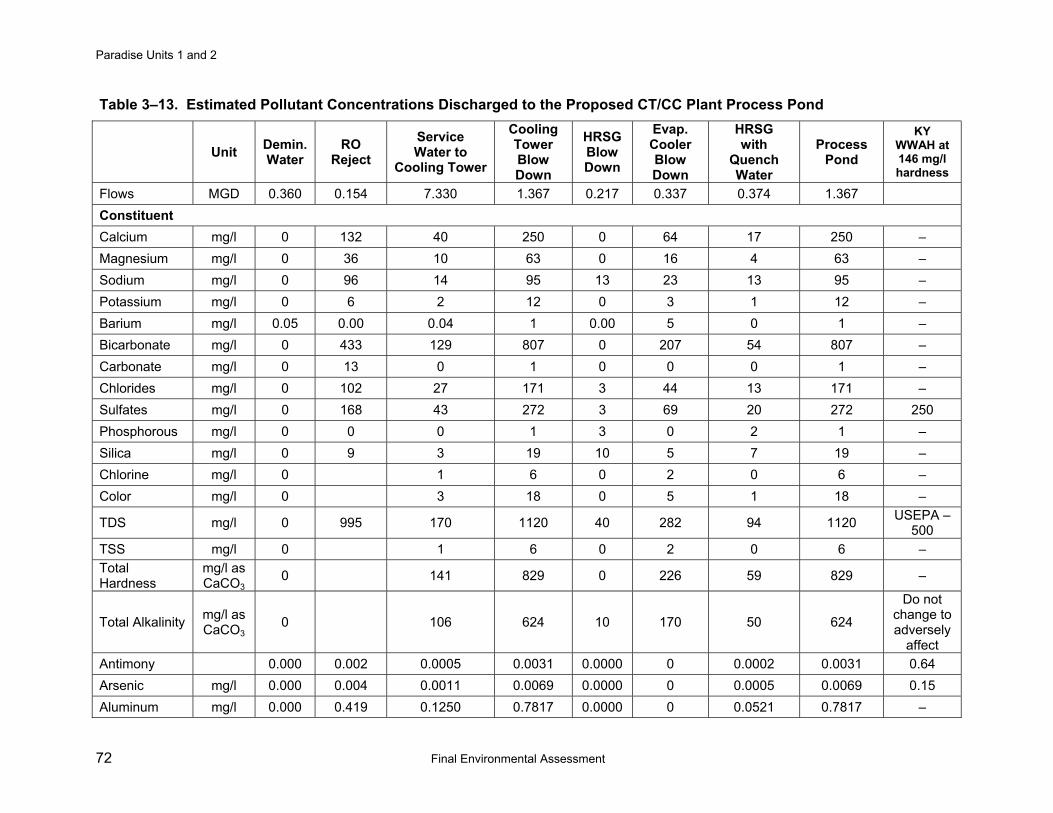
Paradise Units 1 and 2
72 Final Environmental Assessment
Table 3–13. Estimated Pollutant Concentrations Discharged to the Proposed CT/CC Plant Process Pond
Unit Demin. Water
RO Reject
Service Water to
Cooling Tower
Cooling Tower Blow Down
HRSG Blow Down
Evap. Cooler Blow Down
HRSG with
Quench Water
Process Pond
KY WWAH at 146 mg/l hardness
Flows MGD 0.360 0.154 7.330 1.367 0.217 0.337 0.374 1.367
Constituent Calcium mg/l 0 132 40 250 0 64 17 250 – Magnesium mg/l 0 36 10 63 0 16 4 63 – Sodium mg/l 0 96 14 95 13 23 13 95 – Potassium mg/l 0 6 2 12 0 3 1 12 – Barium mg/l 0.05 0.00 0.04 1 0.00 5 0 1 – Bicarbonate mg/l 0 433 129 807 0 207 54 807 – Carbonate mg/l 0 13 0 1 0 0 0 1 – Chlorides mg/l 0 102 27 171 3 44 13 171 – Sulfates mg/l 0 168 43 272 3 69 20 272 250 Phosphorous mg/l 0 0 0 1 3 0 2 1 – Silica mg/l 0 9 3 19 10 5 7 19 – Chlorine mg/l 0 1 6 0 2 0 6 – Color mg/l 0 3 18 0 5 1 18 –
TDS mg/l 0 995 170 1120 40 282 94 1120 USEPA – 500
TSS mg/l 0 1 6 0 2 0 6 – Total Hardness
mg/l as CaCO3
0 141 829 0 226 59 829 –
Total Alkalinity mg/l as CaCO3
0 106 624 10 170 50 624
Do not change to adversely
affect Antimony 0.000 0.002 0.0005 0.0031 0.0000 0 0.0002 0.0031 0.64 Arsenic mg/l 0.000 0.004 0.0011 0.0069 0.0000 0 0.0005 0.0069 0.15 Aluminum mg/l 0.000 0.419 0.1250 0.7817 0.0000 0 0.0521 0.7817 –
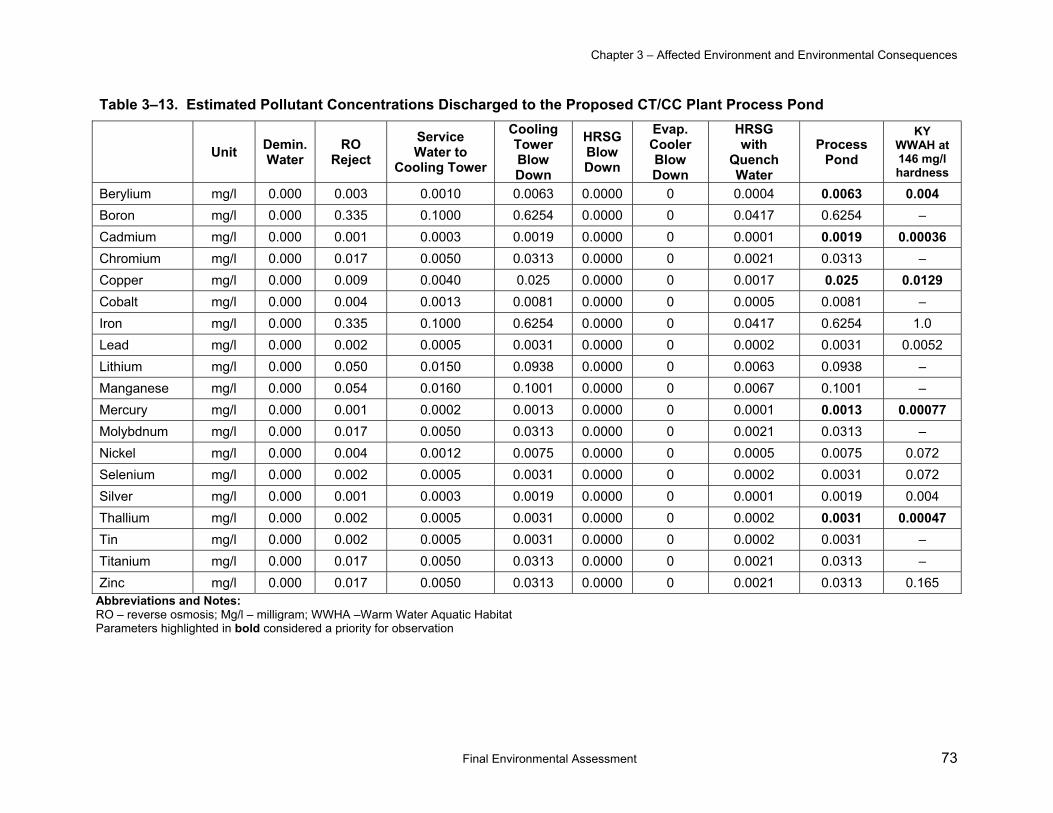
Chapter 3 – Affected Environment and Environmental Consequences
Final Environmental Assessment 73
Table 3–13. Estimated Pollutant Concentrations Discharged to the Proposed CT/CC Plant Process Pond
Unit Demin. Water
RO Reject
Service Water to
Cooling Tower
Cooling Tower Blow Down
HRSG Blow Down
Evap. Cooler Blow Down
HRSG with
Quench Water
Process Pond
KY WWAH at 146 mg/l hardness
Berylium mg/l 0.000 0.003 0.0010 0.0063 0.0000 0 0.0004 0.0063 0.004 Boron mg/l 0.000 0.335 0.1000 0.6254 0.0000 0 0.0417 0.6254 – Cadmium mg/l 0.000 0.001 0.0003 0.0019 0.0000 0 0.0001 0.0019 0.00036 Chromium mg/l 0.000 0.017 0.0050 0.0313 0.0000 0 0.0021 0.0313 – Copper mg/l 0.000 0.009 0.0040 0.025 0.0000 0 0.0017 0.025 0.0129 Cobalt mg/l 0.000 0.004 0.0013 0.0081 0.0000 0 0.0005 0.0081 – Iron mg/l 0.000 0.335 0.1000 0.6254 0.0000 0 0.0417 0.6254 1.0 Lead mg/l 0.000 0.002 0.0005 0.0031 0.0000 0 0.0002 0.0031 0.0052 Lithium mg/l 0.000 0.050 0.0150 0.0938 0.0000 0 0.0063 0.0938 – Manganese mg/l 0.000 0.054 0.0160 0.1001 0.0000 0 0.0067 0.1001 – Mercury mg/l 0.000 0.001 0.0002 0.0013 0.0000 0 0.0001 0.0013 0.00077 Molybdnum mg/l 0.000 0.017 0.0050 0.0313 0.0000 0 0.0021 0.0313 – Nickel mg/l 0.000 0.004 0.0012 0.0075 0.0000 0 0.0005 0.0075 0.072 Selenium mg/l 0.000 0.002 0.0005 0.0031 0.0000 0 0.0002 0.0031 0.072 Silver mg/l 0.000 0.001 0.0003 0.0019 0.0000 0 0.0001 0.0019 0.004 Thallium mg/l 0.000 0.002 0.0005 0.0031 0.0000 0 0.0002 0.0031 0.00047 Tin mg/l 0.000 0.002 0.0005 0.0031 0.0000 0 0.0002 0.0031 – Titanium mg/l 0.000 0.017 0.0050 0.0313 0.0000 0 0.0021 0.0313 – Zinc mg/l 0.000 0.017 0.0050 0.0313 0.0000 0 0.0021 0.0313 0.165
Abbreviations and Notes: RO – reverse osmosis; Mg/l – milligram; WWHA –Warm Water Aquatic Habitat Parameters highlighted in bold considered a priority for observation

Paradise Units 1 and 2
74 Final Environmental Assessment
Storm Water The storm water streams created by the operation of the proposed Alternative C would need to be evaluated for inclusion in the KPDES permit and assessed for potential surface water impacts.
The proposed action would increase the impervious cover on the project area, thus altering and possibly increasing the concentrated storm water flow into storm drains, ditches, and streams. After construction, storm water BMPs would continue to be implemented so that surface water runoff from impervious surfaces and industrial areas would be diverted to a retention pond(s) with a controlled rate(s) of release.
If fuel oil is stored on site, appropriate containment and SPCC requirements will be implemented. Storm water runoff from areas with potential oil leaks would be directed to an oil/water separator with subsequent discharge to the proposed process pond. Oil collected in the oil/water separator would be periodically removed and trucked offsite to an approved, waste oil recycling facility.
All non-contact storm water from this site would be routed to the process pond or directly to the Green River. These storm water streams are expected to be precipitation-driven and intermittent. Non-contact storm water discharges would be permitted under the existing KPDES Permit, and are not expected to have any adverse impacts on water quality in Jacobs Creek or the Green River.
Sanitary Wastewater During plant operations, workforce would be similar as currently at PAF. Sanitary sewage collection and discharge to a sewer/drainage field would be authorized under the appropriate KDEP permit.
Gas Pipeline Impacts The pipeline construction company would also obtain and comply with all conditions in KDEP’s 401 Certification and Construction Storm Water General Permit programs as they relate to this project. They would also obtain and comply with all conditions in KDEP’s Permit to Construct Along or Across a Stream as applicable. All waste streams from this process would need to be evaluated to ensure all permit limits would be met.
Cumulative Effects No cumulative impacts are anticipated; however, TVA plans to monitor discharges associated with this project in accordance with KPDES requirements to ensure the concentrations of metals and other parameters do not adversely impact water quality of surrounding surface waters. Mitigation measures would be identified, as needed, to ensure the discharges from the site have no significant impact on the receiving streams or outfalls.
Mitigation Measures/Best Management Practices The KPDES permit for PAF would be modified as required for the changes being proposed. A BMP would be developed and implemented to ensure that all surface waters are protected from construction and operational impacts. All stream crossings and any other construction activities would comply with the pipeline construction company’s existing BMPs to minimize any impacts. The pipeline construction company would also obtain and comply with all conditions in Corps of Engineers’ Section 404 permit and KDEP’s Section 401 Certification and Construction Storm Water General Permit as they relate to this project. They would also obtain and comply with all conditions in KDEP’s Permit to Construct Along or Across a
Chapter 3 – Affected Environment and Environmental Consequences
Final Environmental Assessment 75
Stream as applicable. Therefore, there should be no significant impacts to surface waters from construction of this pipeline.
3.11. Floodplains
3.11.1. Affected Environment Floodplains are those low-lying areas along streams and rivers that are subject to periodic flooding. An area subject to a 1 percent chance of flooding in any given year is normally considered to be in the 100-year floodplain. Likewise, the 500-year floodplain is that area subject to a 0.2 percent chance of flooding in any given year. As a federal agency, TVA is subject to the requirements of EO 11988 (Floodplain Management). The PAF is located adjacent to the Green River at river mile 100. Information provided by the USACE indicates that the 100-year floodplain at this location would be the area located below elevation 402.1 feet msl. The 500-year or “critical action floodplain” would be the area below elevation 404.9 feet msl. A “critical action” is defined in the Water Resource Council Floodplain Management Guidelines as any activity for which even a slight chance of flooding would be too great.
The proposed PAF CT/CC plant would be located directly west of river mile 99.5 on the northern portion of the reservation. Current 10-year floodplain information provided by the USACE indicates that this location would be below elevation 401.9 feet msl. The 500-year or “critical action floodplain” would be the area below elevation 404.7 feet msl.
3.11.2. Environmental Consequences As a federal agency, TVA is subject to the requirements of EO 11988. The objective of EO 11988 is “…to avoid to the extent possible the long- and short-term adverse impacts associated with the occupancy and modification of floodplains and to avoid direct and indirect support of floodplain development wherever there is a practicable alternative” (United States Water Resources Council 1978). The EO is not intended to prohibit floodplain development in all cases, but rather to create a consistent government policy against such development under most circumstances. The EO requires that agencies avoid the 100-year floodplain unless there is no practicable alternative.
3.11.2.1. Alternative A – No Action Under the No Action Alternative, TVA would not install the PJFF systems or construct the CT/CC plant. Therefore, there would be no direct, indirect, or cumulative impacts to floodplains because there would be no physical changes to the current conditions found within the local floodplains.
3.11.2.2. Alternative B – Install and Operate Pulse Jet Fabric Filter Systems Construction and operation of the proposed PJFF systems, including construction laydown areas, associated transmission components, and on–site CCR management areas, would not involve siting within the 100-year or 500-year floodplain, which would be consistent with EO 11988. The elevation of the powerhouse at PAF is 422 feet msl. Therefore, the facilities for which even a slight chance of flooding would be too great (pulse jet fabric filters, etc.) would be located well above the 500-year flood elevation.
Paradise Units 1 and 2
76 Final Environmental Assessment
3.11.2.3. Alternative C – Construct and Operate Combustion Turbine/Combined Cycle Plant Alternative C involves siting facilities on land which is not currently within the 100-year floodplain. Cut and fill operations would take place to establish the final plant grade between elevation 410 and 415 feet msl. Therefore, the CT/CC plant and associated facilities would be located well above the 500-year flood elevation. This would be consistent with EO 11988. A water intake would be constructed in the bottom ash pond and/or the Green River and an outfall would be constructed in the Green River. The Green River intake and outfall would be located within the 100-year floodplain. Consistent with EO 11988, these are considered to be repetitive actions in the 100-year floodplain. Gas Pipeline Impacts Based on current plans, the gas pipeline(s) would be constructed underground. Consistent with EO 11988, an underground gas pipeline is considered to be a repetitive action in the 100–year floodplain. Adverse floodplain impacts would be minimized because all stream crossings would be under the streambed and the area would be returned to pre-construction conditions after construction of the gas pipeline(s).
3.11.3. Cumulative Impacts There would be no cumulative floodplain/flood risk impacts resulting from either Alternative B or C. Most components would be located above the 100- and 500-year floodplain elevations. Although the water intake and outfall would be located in the 100-year floodplain, they are repetitive actions and would not support future development in the floodplain. The gas pipeline(s) would be constructed underground and the area would be returned to pre-construction conditions after completion of the pipeline.
3.11.4. Mitigation Measures and BMPs BMPs would be used during construction of the PJFF systems and/or CT/CC plant and associated facilities to minimize adverse effects to floodplains.
3.12. Cultural and Historic Resources
3.12.1. Affected Environment TVA is coordinating its National Historic Preservation Act (NHPA) Section 106 compliance process with this NEPA review of the proposed action. Under Section 106, agencies must consider the possible effects of their actions on historic properties, and must provide the Advisory Council on Historic Preservation an opportunity to comment. In 36 CFR Part 800.16, the area of potential effects (APE) is defined as the “geographic area or areas within which the undertaking may directly or indirectly cause alterations in the character or use of historic properties, if any such properties exist.” TVA determined the APE for historic properties for Alternative A (No Action) and Alternative B to be the site of the PJFF and its associated equipment and transmission components.
No Phase I cultural resources identification surveys have been carried out within the PAF reservation and no archaeological sites have been identified within this area. Excavation and grading during plant construction removed an estimated 175,000 cubic yards of “earth” and 1,300 cubic yards of rock, some of which was used as construction fill on site (TVA 1964:175). Because of this significant prior disturbance, the probability of intact native
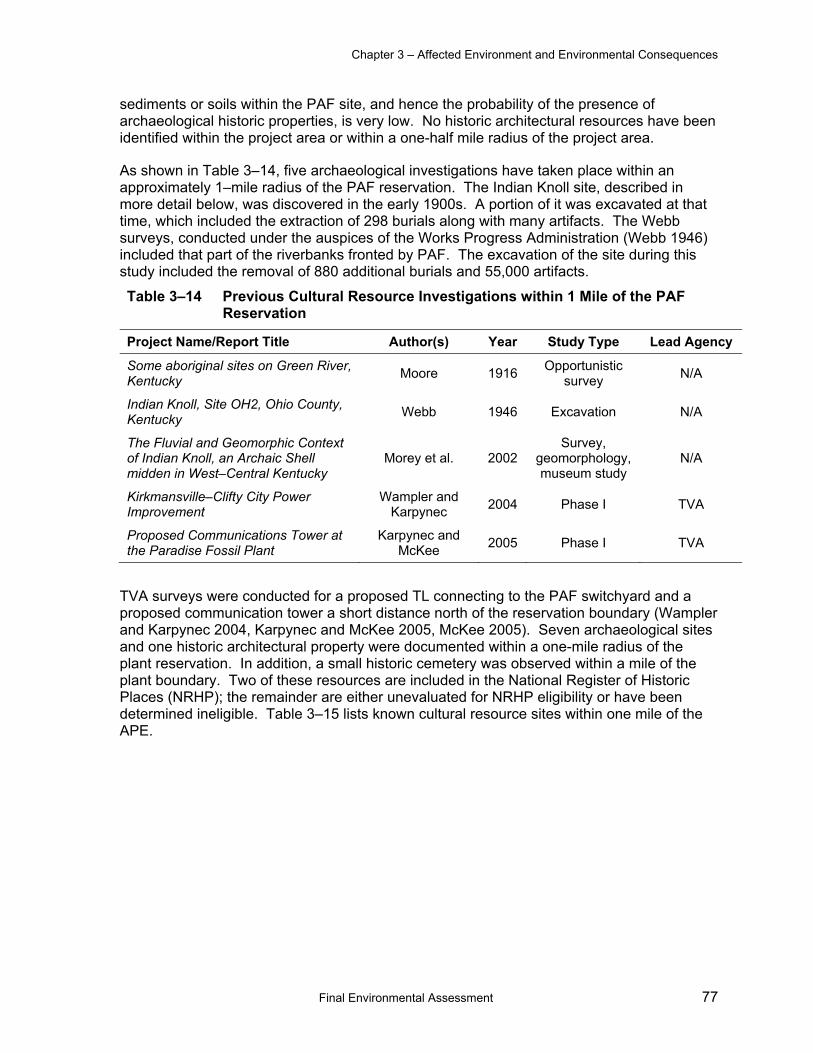
Chapter 3 – Affected Environment and Environmental Consequences
Final Environmental Assessment 77
sediments or soils within the PAF site, and hence the probability of the presence of archaeological historic properties, is very low. No historic architectural resources have been identified within the project area or within a one-half mile radius of the project area.
As shown in Table 3–14, five archaeological investigations have taken place within an approximately 1–mile radius of the PAF reservation. The Indian Knoll site, described in more detail below, was discovered in the early 1900s. A portion of it was excavated at that time, which included the extraction of 298 burials along with many artifacts. The Webb surveys, conducted under the auspices of the Works Progress Administration (Webb 1946) included that part of the riverbanks fronted by PAF. The excavation of the site during this study included the removal of 880 additional burials and 55,000 artifacts.
Table 3–14 Previous Cultural Resource Investigations within 1 Mile of the PAF Reservation
Project Name/Report Title Author(s) Year Study Type Lead Agency
Some aboriginal sites on Green River, Kentucky Moore 1916 Opportunistic
survey N/A
Indian Knoll, Site OH2, Ohio County, Kentucky Webb 1946 Excavation N/A
The Fluvial and Geomorphic Context of Indian Knoll, an Archaic Shell midden in West–Central Kentucky
Morey et al. 2002 Survey,
geomorphology, museum study
N/A
Kirkmansville–Clifty City Power Improvement
Wampler and Karpynec 2004 Phase I TVA
Proposed Communications Tower at the Paradise Fossil Plant
Karpynec and McKee 2005 Phase I TVA
TVA surveys were conducted for a proposed TL connecting to the PAF switchyard and a proposed communication tower a short distance north of the reservation boundary (Wampler and Karpynec 2004, Karpynec and McKee 2005, McKee 2005). Seven archaeological sites and one historic architectural property were documented within a one-mile radius of the plant reservation. In addition, a small historic cemetery was observed within a mile of the plant boundary. Two of these resources are included in the National Register of Historic Places (NRHP); the remainder are either unevaluated for NRHP eligibility or have been determined ineligible. Table 3–15 lists known cultural resource sites within one mile of the APE.
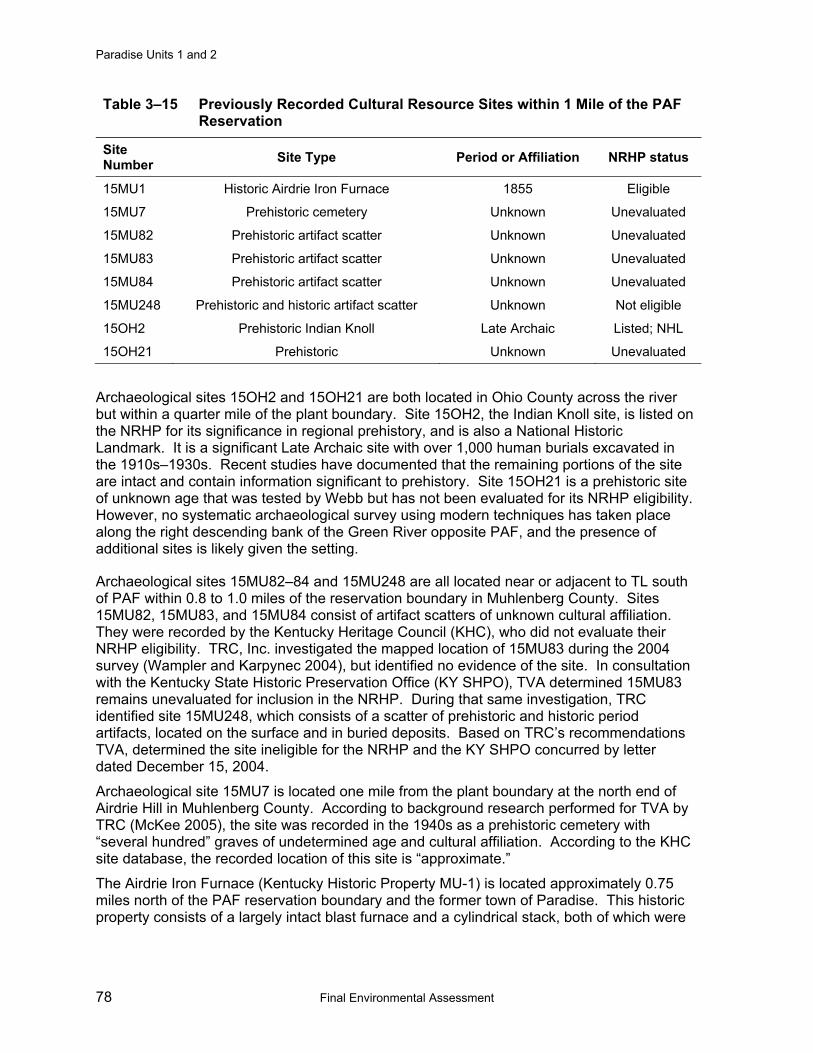
Paradise Units 1 and 2
78 Final Environmental Assessment
Table 3–15 Previously Recorded Cultural Resource Sites within 1 Mile of the PAF Reservation
Site Number Site Type Period or Affiliation NRHP status
15MU1 Historic Airdrie Iron Furnace 1855 Eligible
15MU7 Prehistoric cemetery Unknown Unevaluated
15MU82 Prehistoric artifact scatter Unknown Unevaluated
15MU83 Prehistoric artifact scatter Unknown Unevaluated
15MU84 Prehistoric artifact scatter Unknown Unevaluated
15MU248 Prehistoric and historic artifact scatter Unknown Not eligible
15OH2 Prehistoric Indian Knoll Late Archaic Listed; NHL
15OH21 Prehistoric Unknown Unevaluated
Archaeological sites 15OH2 and 15OH21 are both located in Ohio County across the river but within a quarter mile of the plant boundary. Site 15OH2, the Indian Knoll site, is listed on the NRHP for its significance in regional prehistory, and is also a National Historic Landmark. It is a significant Late Archaic site with over 1,000 human burials excavated in the 1910s–1930s. Recent studies have documented that the remaining portions of the site are intact and contain information significant to prehistory. Site 15OH21 is a prehistoric site of unknown age that was tested by Webb but has not been evaluated for its NRHP eligibility. However, no systematic archaeological survey using modern techniques has taken place along the right descending bank of the Green River opposite PAF, and the presence of additional sites is likely given the setting.
Archaeological sites 15MU82–84 and 15MU248 are all located near or adjacent to TL south of PAF within 0.8 to 1.0 miles of the reservation boundary in Muhlenberg County. Sites 15MU82, 15MU83, and 15MU84 consist of artifact scatters of unknown cultural affiliation. They were recorded by the Kentucky Heritage Council (KHC), who did not evaluate their NRHP eligibility. TRC, Inc. investigated the mapped location of 15MU83 during the 2004 survey (Wampler and Karpynec 2004), but identified no evidence of the site. In consultation with the Kentucky State Historic Preservation Office (KY SHPO), TVA determined 15MU83 remains unevaluated for inclusion in the NRHP. During that same investigation, TRC identified site 15MU248, which consists of a scatter of prehistoric and historic period artifacts, located on the surface and in buried deposits. Based on TRC’s recommendations TVA, determined the site ineligible for the NRHP and the KY SHPO concurred by letter dated December 15, 2004.
Archaeological site 15MU7 is located one mile from the plant boundary at the north end of Airdrie Hill in Muhlenberg County. According to background research performed for TVA by TRC (McKee 2005), the site was recorded in the 1940s as a prehistoric cemetery with “several hundred” graves of undetermined age and cultural affiliation. According to the KHC site database, the recorded location of this site is “approximate.”
The Airdrie Iron Furnace (Kentucky Historic Property MU-1) is located approximately 0.75 miles north of the PAF reservation boundary and the former town of Paradise. This historic property consists of a largely intact blast furnace and a cylindrical stack, both of which were
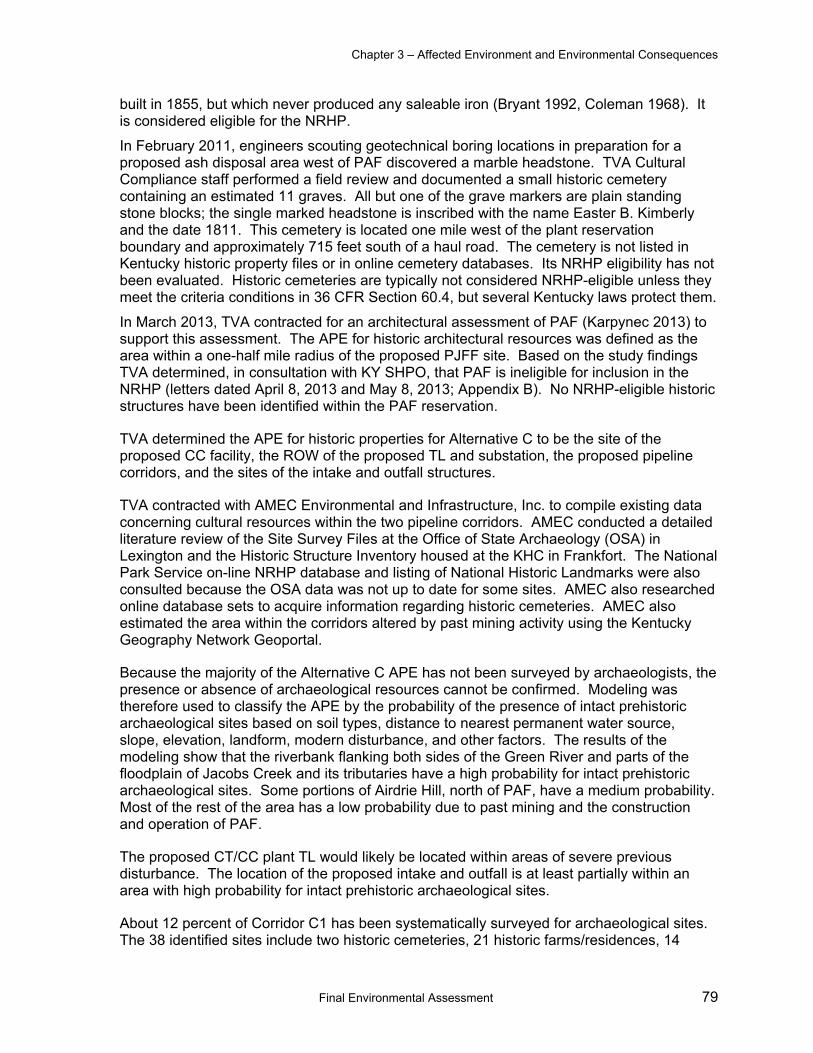
Chapter 3 – Affected Environment and Environmental Consequences
Final Environmental Assessment 79
built in 1855, but which never produced any saleable iron (Bryant 1992, Coleman 1968). It is considered eligible for the NRHP.
In February 2011, engineers scouting geotechnical boring locations in preparation for a proposed ash disposal area west of PAF discovered a marble headstone. TVA Cultural Compliance staff performed a field review and documented a small historic cemetery containing an estimated 11 graves. All but one of the grave markers are plain standing stone blocks; the single marked headstone is inscribed with the name Easter B. Kimberly and the date 1811. This cemetery is located one mile west of the plant reservation boundary and approximately 715 feet south of a haul road. The cemetery is not listed in Kentucky historic property files or in online cemetery databases. Its NRHP eligibility has not been evaluated. Historic cemeteries are typically not considered NRHP-eligible unless they meet the criteria conditions in 36 CFR Section 60.4, but several Kentucky laws protect them.
In March 2013, TVA contracted for an architectural assessment of PAF (Karpynec 2013) to support this assessment. The APE for historic architectural resources was defined as the area within a one-half mile radius of the proposed PJFF site. Based on the study findings TVA determined, in consultation with KY SHPO, that PAF is ineligible for inclusion in the NRHP (letters dated April 8, 2013 and May 8, 2013; Appendix B). No NRHP-eligible historic structures have been identified within the PAF reservation.
TVA determined the APE for historic properties for Alternative C to be the site of the proposed CC facility, the ROW of the proposed TL and substation, the proposed pipeline corridors, and the sites of the intake and outfall structures.
TVA contracted with AMEC Environmental and Infrastructure, Inc. to compile existing data concerning cultural resources within the two pipeline corridors. AMEC conducted a detailed literature review of the Site Survey Files at the Office of State Archaeology (OSA) in Lexington and the Historic Structure Inventory housed at the KHC in Frankfort. The National Park Service on-line NRHP database and listing of National Historic Landmarks were also consulted because the OSA data was not up to date for some sites. AMEC also researched online database sets to acquire information regarding historic cemeteries. AMEC also estimated the area within the corridors altered by past mining activity using the Kentucky Geography Network Geoportal.
Because the majority of the Alternative C APE has not been surveyed by archaeologists, the presence or absence of archaeological resources cannot be confirmed. Modeling was therefore used to classify the APE by the probability of the presence of intact prehistoric archaeological sites based on soil types, distance to nearest permanent water source, slope, elevation, landform, modern disturbance, and other factors. The results of the modeling show that the riverbank flanking both sides of the Green River and parts of the floodplain of Jacobs Creek and its tributaries have a high probability for intact prehistoric archaeological sites. Some portions of Airdrie Hill, north of PAF, have a medium probability. Most of the rest of the area has a low probability due to past mining and the construction and operation of PAF.
The proposed CT/CC plant TL would likely be located within areas of severe previous disturbance. The location of the proposed intake and outfall is at least partially within an area with high probability for intact prehistoric archaeological sites.
About 12 percent of Corridor C1 has been systematically surveyed for archaeological sites. The 38 identified sites include two historic cemeteries, 21 historic farms/residences, 14
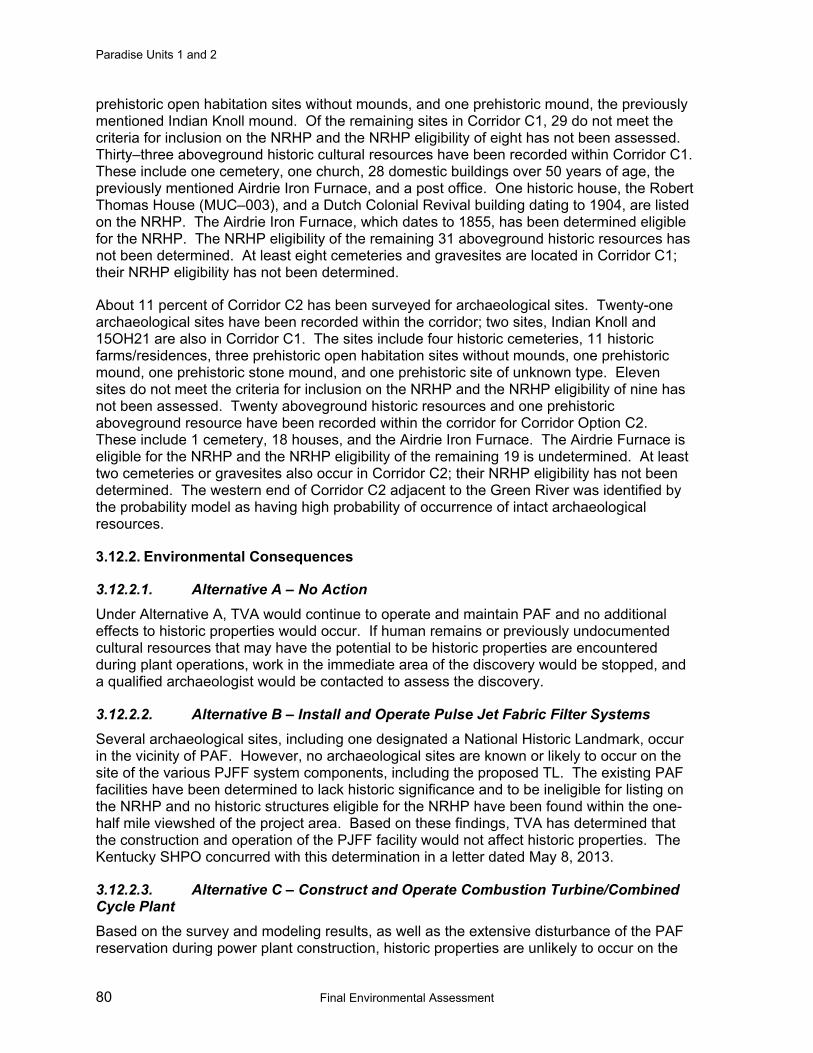
Paradise Units 1 and 2
80 Final Environmental Assessment
prehistoric open habitation sites without mounds, and one prehistoric mound, the previously mentioned Indian Knoll mound. Of the remaining sites in Corridor C1, 29 do not meet the criteria for inclusion on the NRHP and the NRHP eligibility of eight has not been assessed. Thirty–three aboveground historic cultural resources have been recorded within Corridor C1. These include one cemetery, one church, 28 domestic buildings over 50 years of age, the previously mentioned Airdrie Iron Furnace, and a post office. One historic house, the Robert Thomas House (MUC–003), and a Dutch Colonial Revival building dating to 1904, are listed on the NRHP. The Airdrie Iron Furnace, which dates to 1855, has been determined eligible for the NRHP. The NRHP eligibility of the remaining 31 aboveground historic resources has not been determined. At least eight cemeteries and gravesites are located in Corridor C1; their NRHP eligibility has not been determined.
About 11 percent of Corridor C2 has been surveyed for archaeological sites. Twenty-one archaeological sites have been recorded within the corridor; two sites, Indian Knoll and 15OH21 are also in Corridor C1. The sites include four historic cemeteries, 11 historic farms/residences, three prehistoric open habitation sites without mounds, one prehistoric mound, one prehistoric stone mound, and one prehistoric site of unknown type. Eleven sites do not meet the criteria for inclusion on the NRHP and the NRHP eligibility of nine has not been assessed. Twenty aboveground historic resources and one prehistoric aboveground resource have been recorded within the corridor for Corridor Option C2. These include 1 cemetery, 18 houses, and the Airdrie Iron Furnace. The Airdrie Furnace is eligible for the NRHP and the NRHP eligibility of the remaining 19 is undetermined. At least two cemeteries or gravesites also occur in Corridor C2; their NRHP eligibility has not been determined. The western end of Corridor C2 adjacent to the Green River was identified by the probability model as having high probability of occurrence of intact archaeological resources.
3.12.2. Environmental Consequences
3.12.2.1. Alternative A – No Action Under Alternative A, TVA would continue to operate and maintain PAF and no additional effects to historic properties would occur. If human remains or previously undocumented cultural resources that may have the potential to be historic properties are encountered during plant operations, work in the immediate area of the discovery would be stopped, and a qualified archaeologist would be contacted to assess the discovery.
3.12.2.2. Alternative B – Install and Operate Pulse Jet Fabric Filter Systems Several archaeological sites, including one designated a National Historic Landmark, occur in the vicinity of PAF. However, no archaeological sites are known or likely to occur on the site of the various PJFF system components, including the proposed TL. The existing PAF facilities have been determined to lack historic significance and to be ineligible for listing on the NRHP and no historic structures eligible for the NRHP have been found within the one-half mile viewshed of the project area. Based on these findings, TVA has determined that the construction and operation of the PJFF facility would not affect historic properties. The Kentucky SHPO concurred with this determination in a letter dated May 8, 2013.
3.12.2.3. Alternative C – Construct and Operate Combustion Turbine/Combined Cycle Plant Based on the survey and modeling results, as well as the extensive disturbance of the PAF reservation during power plant construction, historic properties are unlikely to occur on the
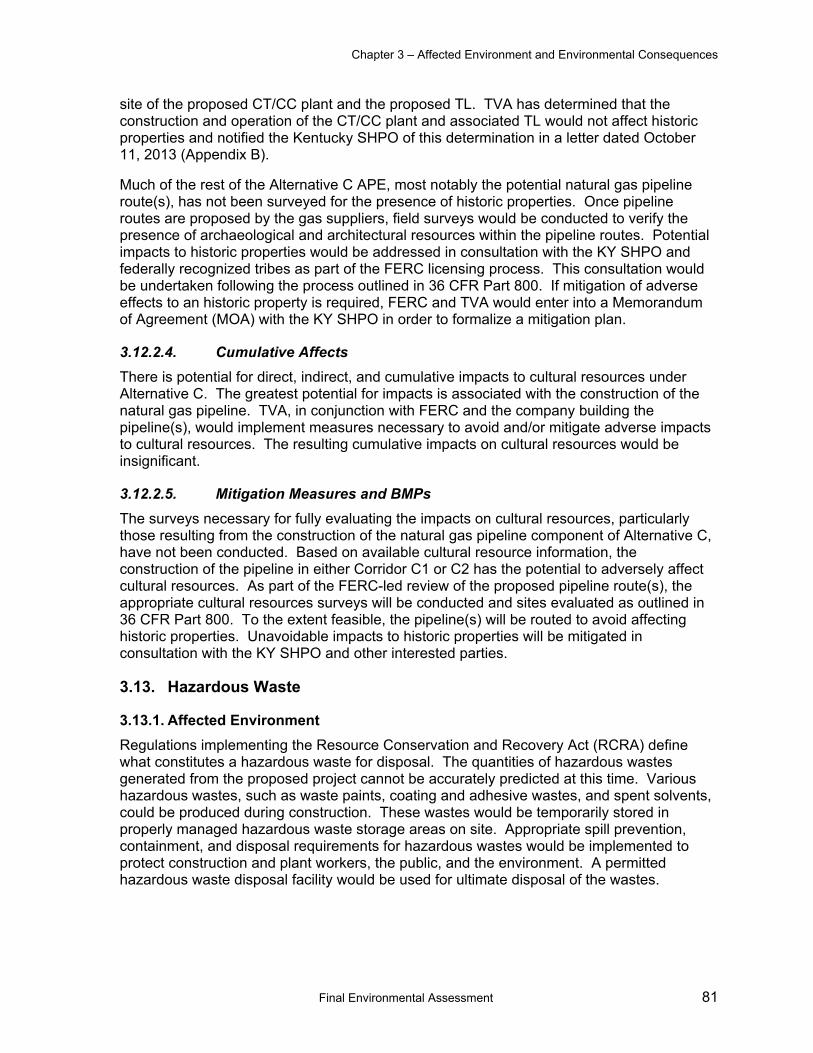
Chapter 3 – Affected Environment and Environmental Consequences
Final Environmental Assessment 81
site of the proposed CT/CC plant and the proposed TL. TVA has determined that the construction and operation of the CT/CC plant and associated TL would not affect historic properties and notified the Kentucky SHPO of this determination in a letter dated October 11, 2013 (Appendix B).
Much of the rest of the Alternative C APE, most notably the potential natural gas pipeline route(s), has not been surveyed for the presence of historic properties. Once pipeline routes are proposed by the gas suppliers, field surveys would be conducted to verify the presence of archaeological and architectural resources within the pipeline routes. Potential impacts to historic properties would be addressed in consultation with the KY SHPO and federally recognized tribes as part of the FERC licensing process. This consultation would be undertaken following the process outlined in 36 CFR Part 800. If mitigation of adverse effects to an historic property is required, FERC and TVA would enter into a Memorandum of Agreement (MOA) with the KY SHPO in order to formalize a mitigation plan.
3.12.2.4. Cumulative Affects There is potential for direct, indirect, and cumulative impacts to cultural resources under Alternative C. The greatest potential for impacts is associated with the construction of the natural gas pipeline. TVA, in conjunction with FERC and the company building the pipeline(s), would implement measures necessary to avoid and/or mitigate adverse impacts to cultural resources. The resulting cumulative impacts on cultural resources would be insignificant.
3.12.2.5. Mitigation Measures and BMPs The surveys necessary for fully evaluating the impacts on cultural resources, particularly those resulting from the construction of the natural gas pipeline component of Alternative C, have not been conducted. Based on available cultural resource information, the construction of the pipeline in either Corridor C1 or C2 has the potential to adversely affect cultural resources. As part of the FERC-led review of the proposed pipeline route(s), the appropriate cultural resources surveys will be conducted and sites evaluated as outlined in 36 CFR Part 800. To the extent feasible, the pipeline(s) will be routed to avoid affecting historic properties. Unavoidable impacts to historic properties will be mitigated in consultation with the KY SHPO and other interested parties.
3.13. Hazardous Waste
3.13.1. Affected Environment Regulations implementing the Resource Conservation and Recovery Act (RCRA) define what constitutes a hazardous waste for disposal. The quantities of hazardous wastes generated from the proposed project cannot be accurately predicted at this time. Various hazardous wastes, such as waste paints, coating and adhesive wastes, and spent solvents, could be produced during construction. These wastes would be temporarily stored in properly managed hazardous waste storage areas on site. Appropriate spill prevention, containment, and disposal requirements for hazardous wastes would be implemented to protect construction and plant workers, the public, and the environment. A permitted hazardous waste disposal facility would be used for ultimate disposal of the wastes.
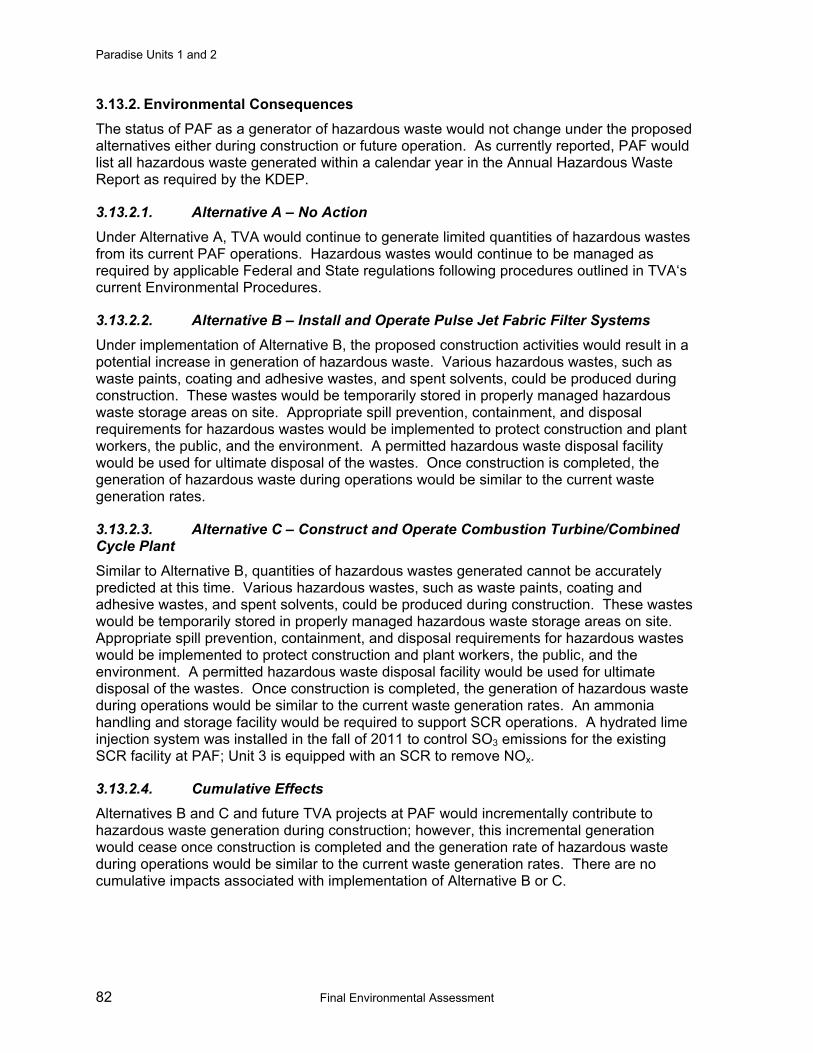
Paradise Units 1 and 2
82 Final Environmental Assessment
3.13.2. Environmental Consequences The status of PAF as a generator of hazardous waste would not change under the proposed alternatives either during construction or future operation. As currently reported, PAF would list all hazardous waste generated within a calendar year in the Annual Hazardous Waste Report as required by the KDEP.
3.13.2.1. Alternative A – No Action Under Alternative A, TVA would continue to generate limited quantities of hazardous wastes from its current PAF operations. Hazardous wastes would continue to be managed as required by applicable Federal and State regulations following procedures outlined in TVA‘s current Environmental Procedures.
3.13.2.2. Alternative B – Install and Operate Pulse Jet Fabric Filter Systems Under implementation of Alternative B, the proposed construction activities would result in a potential increase in generation of hazardous waste. Various hazardous wastes, such as waste paints, coating and adhesive wastes, and spent solvents, could be produced during construction. These wastes would be temporarily stored in properly managed hazardous waste storage areas on site. Appropriate spill prevention, containment, and disposal requirements for hazardous wastes would be implemented to protect construction and plant workers, the public, and the environment. A permitted hazardous waste disposal facility would be used for ultimate disposal of the wastes. Once construction is completed, the generation of hazardous waste during operations would be similar to the current waste generation rates.
3.13.2.3. Alternative C – Construct and Operate Combustion Turbine/Combined Cycle Plant Similar to Alternative B, quantities of hazardous wastes generated cannot be accurately predicted at this time. Various hazardous wastes, such as waste paints, coating and adhesive wastes, and spent solvents, could be produced during construction. These wastes would be temporarily stored in properly managed hazardous waste storage areas on site. Appropriate spill prevention, containment, and disposal requirements for hazardous wastes would be implemented to protect construction and plant workers, the public, and the environment. A permitted hazardous waste disposal facility would be used for ultimate disposal of the wastes. Once construction is completed, the generation of hazardous waste during operations would be similar to the current waste generation rates. An ammonia handling and storage facility would be required to support SCR operations. A hydrated lime injection system was installed in the fall of 2011 to control SO3 emissions for the existing SCR facility at PAF; Unit 3 is equipped with an SCR to remove NOx.
3.13.2.4. Cumulative Effects Alternatives B and C and future TVA projects at PAF would incrementally contribute to hazardous waste generation during construction; however, this incremental generation would cease once construction is completed and the generation rate of hazardous waste during operations would be similar to the current waste generation rates. There are no cumulative impacts associated with implementation of Alternative B or C.
Chapter 3 – Affected Environment and Environmental Consequences
Final Environmental Assessment 83
3.13.2.5. Mitigation Measures and BMPs With implementation of the TVA commitments and proposed mitigation measures, along with standard TVA procedures, no adverse effects associated with hazardous materials and wastes are anticipated. A Risk Management Plan (RMP) would be developed for the addition of new ammonia handling facilities required for SCR operations. No additional mitigation measures or BMPs would be required.
3.14. Solid Waste
Solid wastes produced at PAF include CCR and non–hazardous materials. The non–CCR wastes are disposed of at an approved solid waste facility or recycled. Hazardous wastes are described in Section 3.13.
3.14.1. Affected Environment This section addresses solid wastes, including CCR and non–hazardous solid waste. These wastes are described in the following subsections.
Coal Combustion Residuals The primary solid wastes produced by coal combustion at PAF are gypsum, fly ash, and bottom ash. These materials are formed from the non–combustible matter left behind from the combustion of coal and treatment of air pollutants, and include small amounts of unburned carbon. The properties of these wastes vary with the chemical composition of the coal, combustion conditions, and other factors.
Depending on the coal type, the average ash content of the coal burned for all three units at PAF is approximately 8.5 percent (TVA 2003). Of the total ash generated, approximately 70 percent is bottom ash and 30 percent is fly ash (TVA 2003). On an annual basis, the three units at PAF generate a total of approximately 270,000 cubic yards of fly ash, 350,000 cubic yards of bottom ash, and 900,000 cubic yards of gypsum slurry annually, for a total of 1,520,000 cubic yards of combined CCR waste.
Fly ash is composed of small, silt– and clay–sized, mostly spherical particles that are carried out of the boiler by the exhaust gas. Bottom ash is a coarse, black, glassy, granular material produced in cyclone furnaces when molten ash is cooled in water. Both fly ash and bottom ash are primarily composed of silica, aluminum oxide, and iron oxide (TVA 2011b). Synthetic gypsum is produced in FGD systems (scrubbers) by the interaction of sulfur in the flue gas with finely ground limestone and is primarily calcium sulfate.
All ash at PAF is currently handled/sluiced wet in aqueous solutions. Approximately 270,000 cubic yards of fly ash is produced each year from all three units. Of that, 270,000 cubic yards of fly ash, 114,000 cubic yards is wet–sluiced to FAP each year from Unit 3 and 156,000 cubic yards is wet sluiced to the Scrubber Sludge Complex from Units 1 and 2. Under current plant operations, the on–site ash handling system has approximately 20 years of available volume for CCR management. Currently, no dry ash stacking operations occur at PAF.
All CCR impoundments at PAF are operated in compliance with an active KPDES permit. Under Kentucky’s permit-by-rule for surface impoundments with a KPDES permit, 401 KAR 45:060, Section 1(4), the Kentucky Division of Waste Management grants TVA permission to operate the impoundments at PAF.
Paradise Units 1 and 2
84 Final Environmental Assessment
Wet fly ash does not currently have any commercial use and no fly ash generated at PAF is currently sold. Small amounts of fly ash have been reclaimed from the FAP or from dredge cells from time to time and used in dike construction at the ponds.
Non–Hazardous Solid Waste Wastes anticipated to be produced by the construction of the two PJFF systems at PAF include demolition debris, packing materials, scrap metals, and non–hazardous used oil and lubricants (TVA 2011b). Standard TVA procedures for handling non–hazardous wastes include minimizing their production, reuse and recycling, and, where these are not feasible, disposal in a permitted landfill (TVA 2011b). All non–hazardous waste from construction activities would be disposed of in accordance to applicable regulations and TVA’s procedures, which include recycling where possible.
3.14.2. Environmental Consequences
3.14.2.1. Alternative A – No Action Under implementation of Alternative A, the rates of solid waste generation would be similar to current conditions and waste management would continue in compliance with applicable regulations and standard TVA procedures. Existing TVA operations at PAF would continue and there would be no changes that would impact existing solid waste generation.
3.14.2.2. Alternative B – Install and Operate Pulse Jet Fabric Filter Systems Under implementation of Alternative B, solid wastes would continue to be managed in accordance with all federal, state, and local requirements.
Coal Combustion Residuals No changes to current bottom ash handling are proposed; however, TVA would reconfigure the existing BAP 2A to allow construction of the proposed Unit 2 PJFF. Under implementation of Alternative B, the fly ash would be managed using the existing on–site sluice lines. A new 400-foot long connection from the new PJFF equipment to the existing sluice lines would be constructed.
The current SSC has approximately seven years of additional volume for CCR management (i.e., storage capacity) at current production rates (TVA 2003). The separation of fly ash from gypsum slurry would create additional storage capacity for gypsum. Although none of the scrubber gypsum material from PAF has been marketed commercially, varying amounts have been used in construction and land reclamation projects on the plant site. These projects include the raising of SR 176 on the plant reservation, dike construction, and land reclamation on the coal wash refuse stacking areas southwest of the former coal wash plant at PAF (TVA 2003). Under implementation of Alternative B, no additional CCR would be generated and no new solid waste permits would be required. Therefore, no additional impacts are anticipated.
Non–Hazardous Solid Waste Construction of the PJFF systems and associated facilities would generate non-hazardous solid waste, including concrete, land clearing and stabilizing debris, metals, plastic, and wood. These activities would temporarily result in the generation of larger quantities of solid wastes compared to current conditions
Chapter 3 – Affected Environment and Environmental Consequences
Final Environmental Assessment 85
In order to install the Unit 2 PJFF system and associated facilities, the existing PAF supply maintenance shop Quonset hut would be demolished. This hut contains asbestos. Prior to removal of any asbestos, TVA would file a 10-day renovation notification with the State of Kentucky. Any asbestos waste resulting from removal of the hut would be properly managed and disposed of, in accordance with TVA procedures and applicable federal and state regulations. Wastes generated during construction of the proposed facilities would be managed by implementation of routine plant measures for proper handling and disposal of such wastes. Appropriate management of construction and land clearing debris, including recycling and reuse when possible, would limit any potential adverse impacts. Overall, sufficient landfill capacity exists to accommodate the additional solid waste generated as a result of the proposed construction activities. Generation of construction wastes would be short-term and temporary; therefore, impacts would be minimal. With implementation of standard TVA procedures, effects associated with construction wastes would be minimal. Non-CCR waste generation during operation and maintenance of the proposed new facilities would be similar to current conditions.
3.14.2.3. Alternative C – Construct and Operate Combustion Turbine/Combined Cycle Plant Under implementation of Alternative C, volumes of non–hazardous wastes would temporarily increase during construction of the proposed new facilities. Construction activities would generate non–hazardous solid waste, including concrete, land clearing and stabilizing debris, metals, plastic, and wood.
Coal Combustion Residuals No CCR would be produced by the CT/CC plant. The retirement of Units 1 and 2 would significantly reduce production of CCR (by approximately 55 percent), even though PAF Unit 3 would continue to operate. The CCR would continue to be wet sluiced until equipment and facilities for dry handling and storage of CCR and closure plans for the surface impoundments were designed and implemented. TVA will conduct the necessary environmental reviews during the planning of these future actions.
Non–Hazardous Solid Waste Construction activities would result in generation of larger quantities of solid wastes compared to current conditions. Generation of construction-related wastes would be temporary and limited to the construction period. The non-hazardous solid wastes resulting from implementation of Alternative C would be properly disposed of at approved solid waste facilities or recycled in compliance with applicable waste regulations.
3.14.2.4. Cumulative Effects PAF active ash ponds provide over 20 years of future volume, which supports the management needs for the ash collected by the proposed PJFF systems under Alternative B. The anticipated future wet–to–dry CCR conversion project would be designed to minimize any adverse impacts and no significant cumulative impacts are anticipated under Alternative B. Alternative C would result in a large reduction in solid waste generation at PAF, minimizing any potential for adverse cumulative impacts.
3.14.2.5. Mitigation Measures and BMPs With implementation of the TVA commitments and proposed mitigation measures, along with standard TVA procedures, no adverse effects associated with solid wastes are anticipated. No additional mitigation measures or BMPs would be required.

Paradise Units 1 and 2
86 Final Environmental Assessment
3.15. Land Use and Prime Farmland
3.15.1. Affected Environment The existing land uses on the 3,000–acre PAF reservation and much of the surrounding areas have been heavily impacted by industrial development and past coal mining activities. Current land use on the reservation is heavy industrial. Most of the area surrounding PAF is undeveloped open land consisting of reclaimed mine lands passively managed for wildlife habitat and forestry. The bottomlands along the Green River east of PAF are cropland.
The nearest residential areas on the west side of the Green River are about three miles from PAF. The nearest community is the town of Drakesboro, about five miles to the southwest. The nearest residences east of the Green River are about two miles from PAF. No residences exist along SR 176, which connects the plant to U.S. Highway 431 southwest of PAF at Drakesboro (TVA 2003).
The Farmland Protection and Policy Act (FPPA) was enacted in 1981 in order to minimize the loss of prime farmland and unique farmlands as a result of federal actions converting these lands to nonagricultural uses. Prime farmlands are defined as those that are most suitable for economically producing sustained high crop yields and are available for agricultural use. No prime farmland occurs on the PAF reservation (Natural Resources Conservation Service 2013). Approximately 8 percent of gas pipeline Corridor C1 is classified as prime farmland and an additional 11 percent would be classified as prime farmland if drained and/or protected from flooding during the growing season. The proportion of Corridor C2 classified as prime farmland is higher, 17 percent. An additional 16 percent of Corridor C2 would be classified as prime farmland if drained and/or protected from flooding.
3.15.2. Environmental Consequences Effects to land uses were assessed based on whether implementation of the alternative would be compatible with existing or planned land uses. Direct effects to land uses occur from displacement of existing land uses, changes in land use designations, or conflicts with existing or planned land uses. Indirect effects may occur because of disturbances to neighboring land uses, such as increased vehicular traffic on public roads, increased noise, and visual effects associated with project–related activities. Effects to public transportation are analyzed in Section 3.16 and noise effects are addressed in Section 3.17.
3.15.2.1. Alternative A – No Action Under Alternative A, the current industrial operations at PAF would continue and neither of the action alternatives would be implemented. There would be no changes to current land uses on the existing plant site. Therefore, no direct or indirect land use impacts are anticipated under Alternative A.
3.15.2.2. Alternative B – Install and Operate Pulse Jet Fabric Filter Systems Under implementation of Alternative B, the proposed PJFF systems would be constructed on a portion of the PAF reservation already devoted to industrial uses. This would not result in any change in land use on the PAF reservation and have no effect on land uses in the surrounding area. No prime farmland would be affected by Alternative B.

Chapter 3 – Affected Environment and Environmental Consequences
Final Environmental Assessment 87
3.15.2.3. Alternative C – Construct and Operate Combustion Turbine/Combined Cycle Plant Under Alternative C construction, operation, and maintenance of the CT/CC plant would result in minor and insignificant effects to existing land uses on the PAF reservation.
Gas Pipeline Impacts Construction of the gas pipeline(s) would affect land use through the long–term conversion of forested areas within the pipeline ROW to open land. The pipeline would be routed to minimize adverse effects on developed land uses such as residential and commercial areas. Both corridors contain prime farmland and the avoidance of prime farmland during siting of the pipeline route is probably not feasible. Construction of the pipeline(s) in areas of cropland and pasture, including prime farmland, would result in the short-term effects on these land uses, which would be restored following the completion of construction. Overall effects of Alternative C on land use and prime farmland would be insignificant following the completion of pipeline construction.
3.15.2.4. Cumulative Effects No direct or indirect effects to land use would occur with implementation of Alternative A. Consequently, no cumulative effects would occur under Alternative A.
Under Alternative B, cumulative effects to land use would be minor and insignificant because the facilities would be constructed on previously disturbed lands within the existing industrial plant site. Under Alternative C, the areas affected by the construction of the pipeline(s) would be restored following the completion of construction. Hence, the changes to land use resulting from pipeline construction would likely not result in significant adverse cumulative impacts.
3.15.2.5. Mitigation Measures and BMPs No mitigation measures or BMPs are proposed for land use effects because land use would not change and indirect effects would be minor and insignificant. Any conflicting land uses, e.g. densely populated areas, parks, public facilities, would be reconciled during gas pipeline siting and construction.
3.16. Transportation
3.16.1. Affected Environment The public transportation network providing access to PAF is similar to that described in previous EAs prepared by TVA (TVA 2003, TVA 2006). Transportation modes providing direct access to PAF include the area roadway network, rail, and barge transport on the Green River. The existing roadways around PAF are shown on Figure 3–1. The main roadways providing access to the PAF are SR 176, U.S. Highway 431, and SR 70. SR 176 provides access from PAF to U.S. Highway 431 near Drakesboro. These routes are two-lane highways with very smooth horizontal and vertical road alignment. Road shoulders are wide along most of SR 176; however, short portions of the road have no shoulder (TVA 2006). The Rockport Paradise Road (County Road [CR] 1011) runs north along the Green River from its connection point with SR 176 near the PAF to the Western Kentucky Parkway. Annual Average Daily Traffic (AADT) counts have increased since the late 1990s. Table 3–16 shows the AADT for US Highway 431, SR 176, and SR 70 near PAF. The most recent counts show U.S. Highway 431 north of SR 176 as the most heavily traveled highway in the
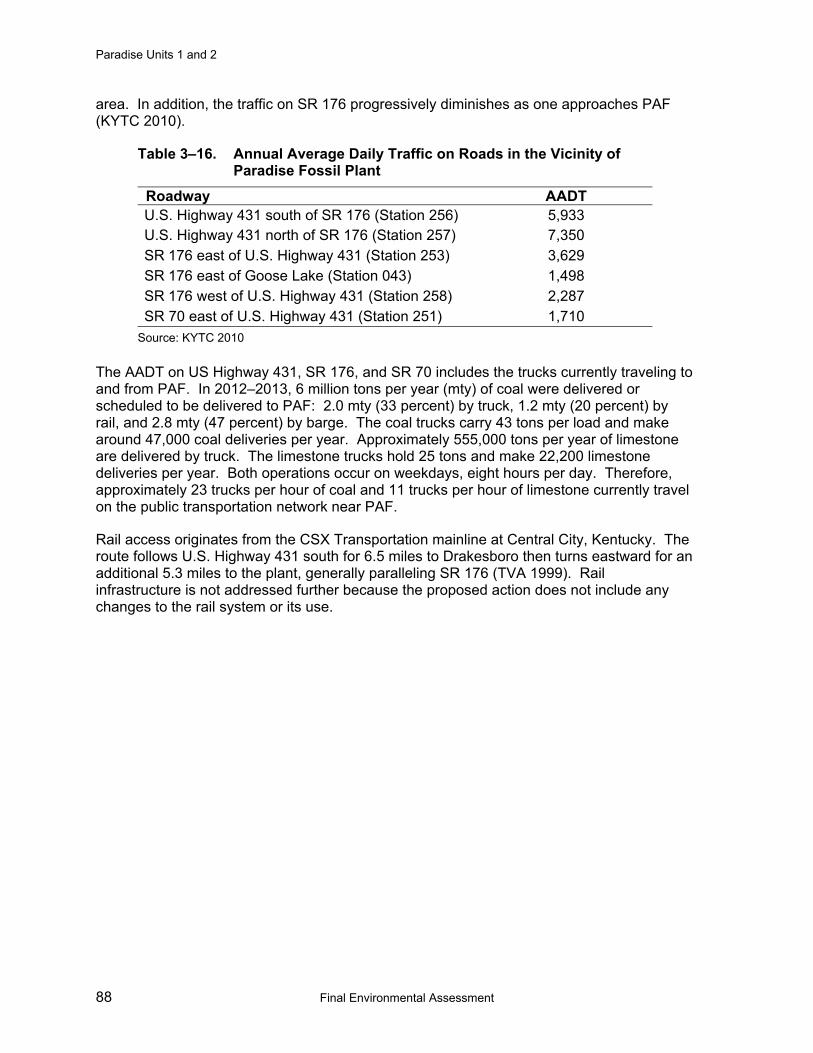
Paradise Units 1 and 2
88 Final Environmental Assessment
area. In addition, the traffic on SR 176 progressively diminishes as one approaches PAF (KYTC 2010).
Table 3–16. Annual Average Daily Traffic on Roads in the Vicinity of Paradise Fossil Plant
Roadway AADT U.S. Highway 431 south of SR 176 (Station 256) 5,933 U.S. Highway 431 north of SR 176 (Station 257) 7,350 SR 176 east of U.S. Highway 431 (Station 253) 3,629 SR 176 east of Goose Lake (Station 043) 1,498 SR 176 west of U.S. Highway 431 (Station 258) 2,287 SR 70 east of U.S. Highway 431 (Station 251) 1,710
Source: KYTC 2010 The AADT on US Highway 431, SR 176, and SR 70 includes the trucks currently traveling to and from PAF. In 2012–2013, 6 million tons per year (mty) of coal were delivered or scheduled to be delivered to PAF: 2.0 mty (33 percent) by truck, 1.2 mty (20 percent) by rail, and 2.8 mty (47 percent) by barge. The coal trucks carry 43 tons per load and make around 47,000 coal deliveries per year. Approximately 555,000 tons per year of limestone are delivered by truck. The limestone trucks hold 25 tons and make 22,200 limestone deliveries per year. Both operations occur on weekdays, eight hours per day. Therefore, approximately 23 trucks per hour of coal and 11 trucks per hour of limestone currently travel on the public transportation network near PAF.
Rail access originates from the CSX Transportation mainline at Central City, Kentucky. The route follows U.S. Highway 431 south for 6.5 miles to Drakesboro then turns eastward for an additional 5.3 miles to the plant, generally paralleling SR 176 (TVA 1999). Rail infrastructure is not addressed further because the proposed action does not include any changes to the rail system or its use.
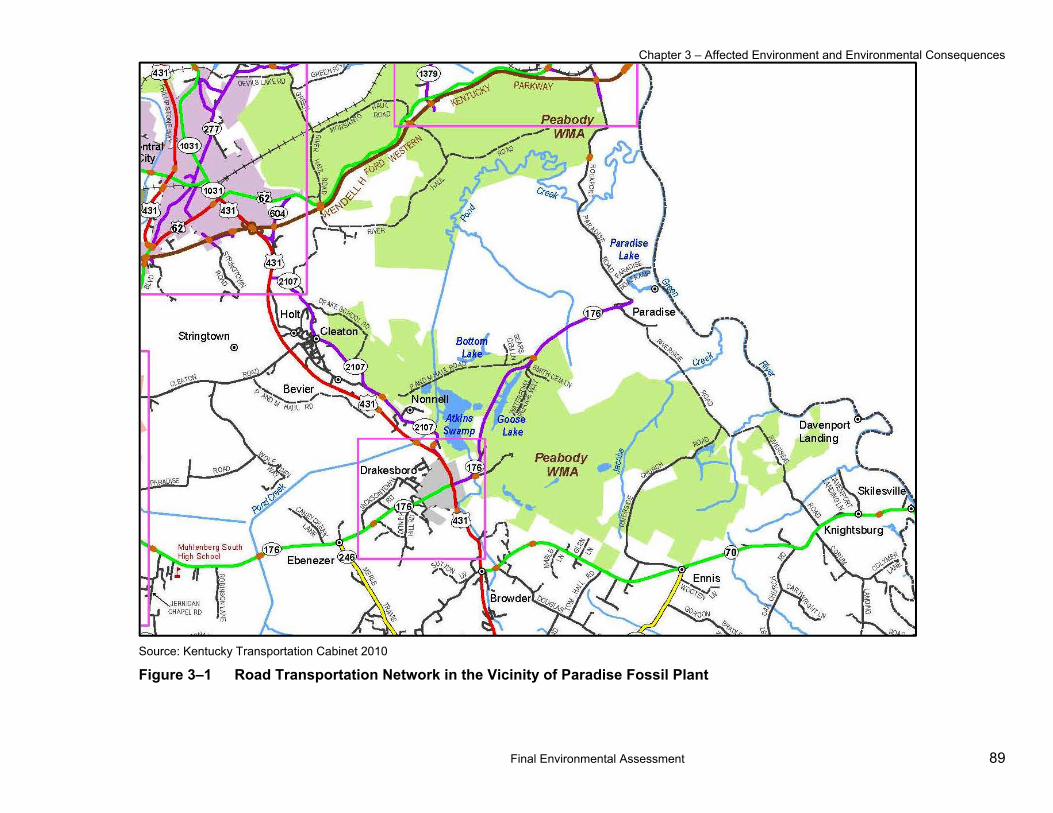
Chapter 3 – Affected Environment and Environmental Consequences
Final Environmental Assessment 89
Source: Kentucky Transportation Cabinet 2010
Figure 3–1 Road Transportation Network in the Vicinity of Paradise Fossil Plant

Paradise Units 1 and 2
90 Final Environmental Assessment
3.16.2. Environmental Consequences
3.16.2.1. Alternative A – No Action Under the No Action Alternative, there would be no changes in the existing transportation infrastructure. Highway traffic, as well as rail and barge transportation associated with the operation of PAF would remain similar to current levels. Therefore, there would be no direct or indirect effects to the public transportation network near PAF.
3.16.2.2. Alternative B – Install and Operate Pulse Jet Fabric Filter Systems Construction Under Alternative B, vehicular traffic on public roads near PAF would increase during construction because of construction workers and materials moving to and from the plant. Construction would require a temporary workforce of up to 500 people with occasional higher peak workforce numbers over the construction period. During outages, an additional 100 workers may be on site. A temporary gravel parking lot with approximately 660 spaces would be constructed on site to provide adequate parking for construction staff.
During the peak construction period, the additional daily commuters would result in a noticeable increase in traffic traveling along U.S. Highway 431, SR 176, SR 70, and CR 1011. Traffic arriving and departing the plant would travel both north and south on U.S. Highway 431. Because of increases in traffic during construction, morning and evening commuters on public roadways near PAF may experience congestion, especially during peak construction. Short–term travel delays may occur at the intersection of U.S. Highway 431 and SR 176. Disruptions to local traffic circulation would mostly occur in 15 or 20 minutes periods around the major shift changes.
Assuming no carpooling and one roundtrip to and from the plant site each day, construction worker traffic would potentially result in an increase of up to 33 percent over current traffic levels on SR 176 (east of U.S. Highway 431). Construction worker trips could also result in a 10 percent increase on U.S. Highway 431 south of SR 176 and an 8 percent increase on U.S. Highway 431 north of SR 176. The actual peak increases on U.S. Highway 431 would be lower because workers would likely arrive from points of origin both north and south of the intersection of U.S. Highway 431 and SR 176. Compared to existing conditions, the increased average daily traffic associated with Alternative B would represent a temporary and relatively small increase in the AADT on public roads. Therefore, the increase in commuter traffic during construction would not be significant.
Additional truck traffic would occur on the public roadways during construction for deliveries of construction material to the site. Truck traffic associated with the PJFF systems construction would be intermittent and infrequent throughout the construction period. There would likely be three to five additional trucks per day during the first several months to deliver equipment, materials, and supplies. Construction-related truck traffic would result in minimal effects on public roads near PAF. This conclusion is based on the determination that the road network has sufficient capacity to absorb three to five additional trucks per day. Delivery activities are not anticipated to result in a noticeable change in traffic on public roadways.
Under Alternative B, a new on-site road would be constructed and the existing on–site roads supporting construction activities would be upgraded, as required. The proposed new access road and construction laydown areas would be located within the PAF plant site.
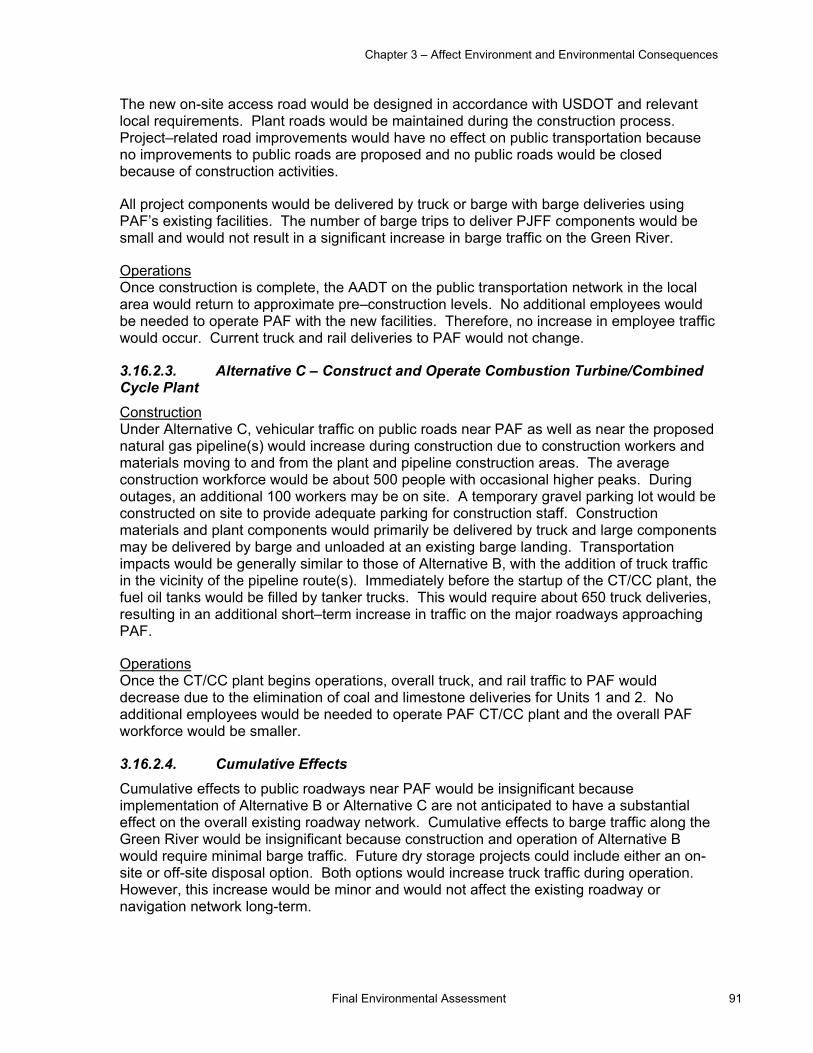
Chapter 3 – Affect Environment and Environmental Consequences
Final Environmental Assessment 91
The new on-site access road would be designed in accordance with USDOT and relevant local requirements. Plant roads would be maintained during the construction process. Project–related road improvements would have no effect on public transportation because no improvements to public roads are proposed and no public roads would be closed because of construction activities.
All project components would be delivered by truck or barge with barge deliveries using PAF’s existing facilities. The number of barge trips to deliver PJFF components would be small and would not result in a significant increase in barge traffic on the Green River.
Operations Once construction is complete, the AADT on the public transportation network in the local area would return to approximate pre–construction levels. No additional employees would be needed to operate PAF with the new facilities. Therefore, no increase in employee traffic would occur. Current truck and rail deliveries to PAF would not change.
3.16.2.3. Alternative C – Construct and Operate Combustion Turbine/Combined Cycle Plant Construction Under Alternative C, vehicular traffic on public roads near PAF as well as near the proposed natural gas pipeline(s) would increase during construction due to construction workers and materials moving to and from the plant and pipeline construction areas. The average construction workforce would be about 500 people with occasional higher peaks. During outages, an additional 100 workers may be on site. A temporary gravel parking lot would be constructed on site to provide adequate parking for construction staff. Construction materials and plant components would primarily be delivered by truck and large components may be delivered by barge and unloaded at an existing barge landing. Transportation impacts would be generally similar to those of Alternative B, with the addition of truck traffic in the vicinity of the pipeline route(s). Immediately before the startup of the CT/CC plant, the fuel oil tanks would be filled by tanker trucks. This would require about 650 truck deliveries, resulting in an additional short–term increase in traffic on the major roadways approaching PAF.
Operations Once the CT/CC plant begins operations, overall truck, and rail traffic to PAF would decrease due to the elimination of coal and limestone deliveries for Units 1 and 2. No additional employees would be needed to operate PAF CT/CC plant and the overall PAF workforce would be smaller.
3.16.2.4. Cumulative Effects Cumulative effects to public roadways near PAF would be insignificant because implementation of Alternative B or Alternative C are not anticipated to have a substantial effect on the overall existing roadway network. Cumulative effects to barge traffic along the Green River would be insignificant because construction and operation of Alternative B would require minimal barge traffic. Future dry storage projects could include either an on-site or off-site disposal option. Both options would increase truck traffic during operation. However, this increase would be minor and would not affect the existing roadway or navigation network long-term.
Paradise Units 1 and 2
92 Final Environmental Assessment
3.16.2.5. Mitigation Measures and BMPs The need to implement mitigation measures to minimize potential effects to public roadways would be identified through coordination with the KYTC, the Muhlenberg County Road Department, and the Town of Drakesboro. Some examples of potential mitigation that would serve to minimize traffic effects are flexible or staggered work schedules for construction employees and delivery of materials during nonpeak hours.
3.17. Noise
3.17.1. Affected Environment Sound is a physical disturbance in a medium, such as air, that is capable of being detected by the human ear. Sound waves in air are caused by variations in pressure above and below the static value of atmospheric pressure. Sound is measured in units of decibels (dB) on a logarithmic scale. The “pitch” (high or low) of the sound is a description of frequency, which is measured in Hertz (Hz). Most common environmental sounds are composed of a composite of frequencies. A normal human ear can usually detect sounds within frequencies from 20 Hz to about 20,000 Hz. However, humans are most sensitive to frequencies from 500 Hz to 4000 Hz.
Certain frequencies are given more “weight” during noise assessments because human hearing is not equally sensitive to all frequencies of sound. The dBA scale corresponds to the sensitivity range for human hearing. Noise levels capable of being heard by humans are measured in dBA. A noise level change of 3 dBA or less is barely perceptible to average human hearing. A 5-dBA change in noise level, however, is clearly noticeable. A 10-dBA change is perceived as a doubling or halving of noise loudness; whereas a 20-dBA change is considered a “dramatic change” in loudness. Table 3–17 provides typical instantaneous noise levels of common activities.
Sound from a source spreads out as it travels from the source, and the sound pressure level diminishes with distance. In addition to distance attenuation, the air absorbs sound energy; atmospheric effects (wind, temperature, precipitation) and terrain/vegetation effects also influence sound propagation and attenuation over large distances from the source. An individual’s sound exposure is determined by measurement of the noise that the individual experiences over a specified time interval. A continuous source of noise is rare for long periods and is typically not a characteristic of community noise. Community noise refers to outdoor noise near a community.
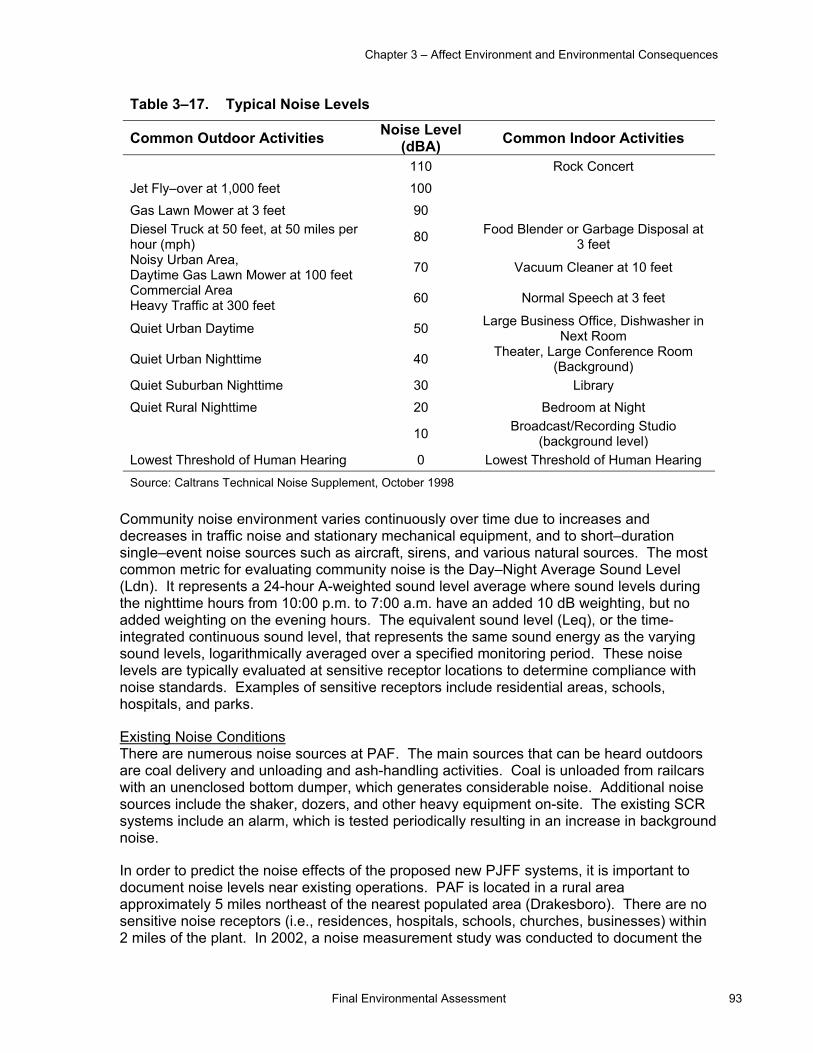
Chapter 3 – Affect Environment and Environmental Consequences
Final Environmental Assessment 93
Table 3–17. Typical Noise Levels
Common Outdoor Activities Noise Level (dBA) Common Indoor Activities
110 Rock Concert Jet Fly–over at 1,000 feet 100 Gas Lawn Mower at 3 feet 90 Diesel Truck at 50 feet, at 50 miles per hour (mph) 80 Food Blender or Garbage Disposal at
3 feet Noisy Urban Area, Daytime Gas Lawn Mower at 100 feet 70 Vacuum Cleaner at 10 feet
Commercial Area Heavy Traffic at 300 feet 60 Normal Speech at 3 feet
Quiet Urban Daytime 50 Large Business Office, Dishwasher in Next Room
Quiet Urban Nighttime 40 Theater, Large Conference Room (Background)
Quiet Suburban Nighttime 30 Library Quiet Rural Nighttime 20 Bedroom at Night
10 Broadcast/Recording Studio (background level)
Lowest Threshold of Human Hearing 0 Lowest Threshold of Human Hearing
Source: Caltrans Technical Noise Supplement, October 1998 Community noise environment varies continuously over time due to increases and decreases in traffic noise and stationary mechanical equipment, and to short–duration single–event noise sources such as aircraft, sirens, and various natural sources. The most common metric for evaluating community noise is the Day–Night Average Sound Level (Ldn). It represents a 24-hour A-weighted sound level average where sound levels during the nighttime hours from 10:00 p.m. to 7:00 a.m. have an added 10 dB weighting, but no added weighting on the evening hours. The equivalent sound level (Leq), or the time-integrated continuous sound level, that represents the same sound energy as the varying sound levels, logarithmically averaged over a specified monitoring period. These noise levels are typically evaluated at sensitive receptor locations to determine compliance with noise standards. Examples of sensitive receptors include residential areas, schools, hospitals, and parks.
Existing Noise Conditions There are numerous noise sources at PAF. The main sources that can be heard outdoors are coal delivery and unloading and ash-handling activities. Coal is unloaded from railcars with an unenclosed bottom dumper, which generates considerable noise. Additional noise sources include the shaker, dozers, and other heavy equipment on-site. The existing SCR systems include an alarm, which is tested periodically resulting in an increase in background noise.
In order to predict the noise effects of the proposed new PJFF systems, it is important to document noise levels near existing operations. PAF is located in a rural area approximately 5 miles northeast of the nearest populated area (Drakesboro). There are no sensitive noise receptors (i.e., residences, hospitals, schools, churches, businesses) within 2 miles of the plant. In 2002, a noise measurement study was conducted to document the
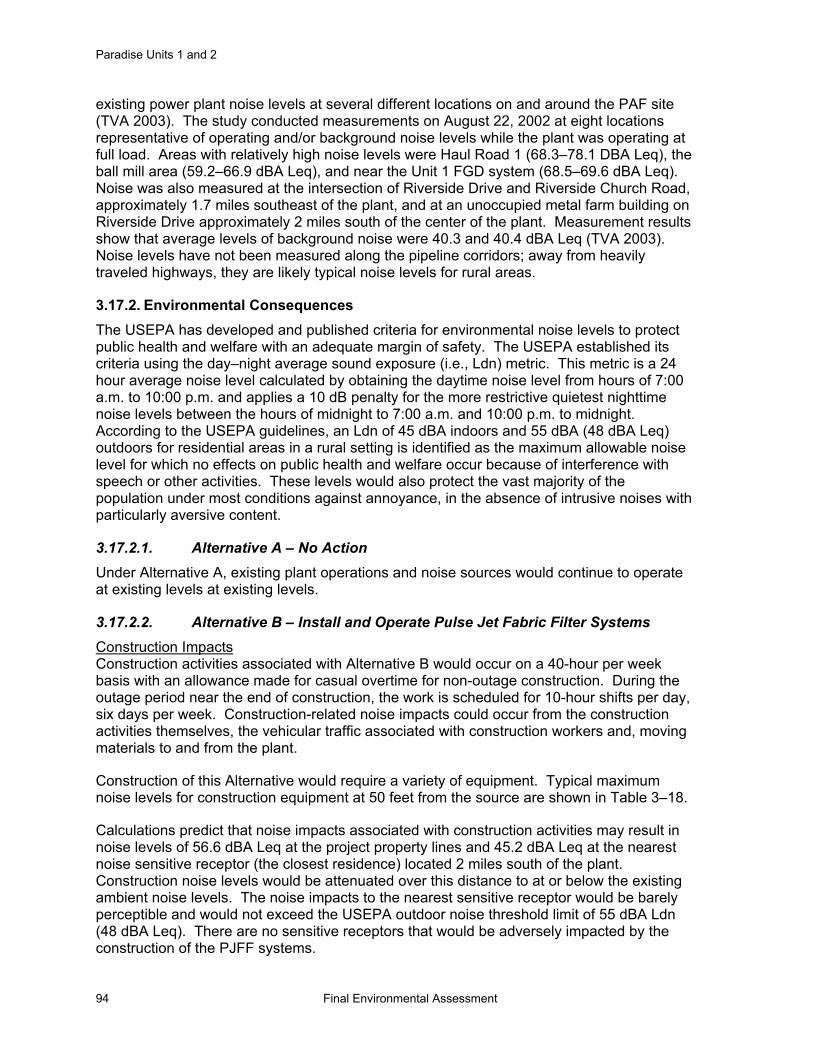
Paradise Units 1 and 2
94 Final Environmental Assessment
existing power plant noise levels at several different locations on and around the PAF site (TVA 2003). The study conducted measurements on August 22, 2002 at eight locations representative of operating and/or background noise levels while the plant was operating at full load. Areas with relatively high noise levels were Haul Road 1 (68.3–78.1 DBA Leq), the ball mill area (59.2–66.9 dBA Leq), and near the Unit 1 FGD system (68.5–69.6 dBA Leq). Noise was also measured at the intersection of Riverside Drive and Riverside Church Road, approximately 1.7 miles southeast of the plant, and at an unoccupied metal farm building on Riverside Drive approximately 2 miles south of the center of the plant. Measurement results show that average levels of background noise were 40.3 and 40.4 dBA Leq (TVA 2003). Noise levels have not been measured along the pipeline corridors; away from heavily traveled highways, they are likely typical noise levels for rural areas.
3.17.2. Environmental Consequences The USEPA has developed and published criteria for environmental noise levels to protect public health and welfare with an adequate margin of safety. The USEPA established its criteria using the day–night average sound exposure (i.e., Ldn) metric. This metric is a 24 hour average noise level calculated by obtaining the daytime noise level from hours of 7:00 a.m. to 10:00 p.m. and applies a 10 dB penalty for the more restrictive quietest nighttime noise levels between the hours of midnight to 7:00 a.m. and 10:00 p.m. to midnight. According to the USEPA guidelines, an Ldn of 45 dBA indoors and 55 dBA (48 dBA Leq) outdoors for residential areas in a rural setting is identified as the maximum allowable noise level for which no effects on public health and welfare occur because of interference with speech or other activities. These levels would also protect the vast majority of the population under most conditions against annoyance, in the absence of intrusive noises with particularly aversive content.
3.17.2.1. Alternative A – No Action Under Alternative A, existing plant operations and noise sources would continue to operate at existing levels at existing levels.
3.17.2.2. Alternative B – Install and Operate Pulse Jet Fabric Filter Systems Construction Impacts Construction activities associated with Alternative B would occur on a 40-hour per week basis with an allowance made for casual overtime for non-outage construction. During the outage period near the end of construction, the work is scheduled for 10-hour shifts per day, six days per week. Construction-related noise impacts could occur from the construction activities themselves, the vehicular traffic associated with construction workers and, moving materials to and from the plant.
Construction of this Alternative would require a variety of equipment. Typical maximum noise levels for construction equipment at 50 feet from the source are shown in Table 3–18.
Calculations predict that noise impacts associated with construction activities may result in noise levels of 56.6 dBA Leq at the project property lines and 45.2 dBA Leq at the nearest noise sensitive receptor (the closest residence) located 2 miles south of the plant. Construction noise levels would be attenuated over this distance to at or below the existing ambient noise levels. The noise impacts to the nearest sensitive receptor would be barely perceptible and would not exceed the USEPA outdoor noise threshold limit of 55 dBA Ldn (48 dBA Leq). There are no sensitive receptors that would be adversely impacted by the construction of the PJFF systems.
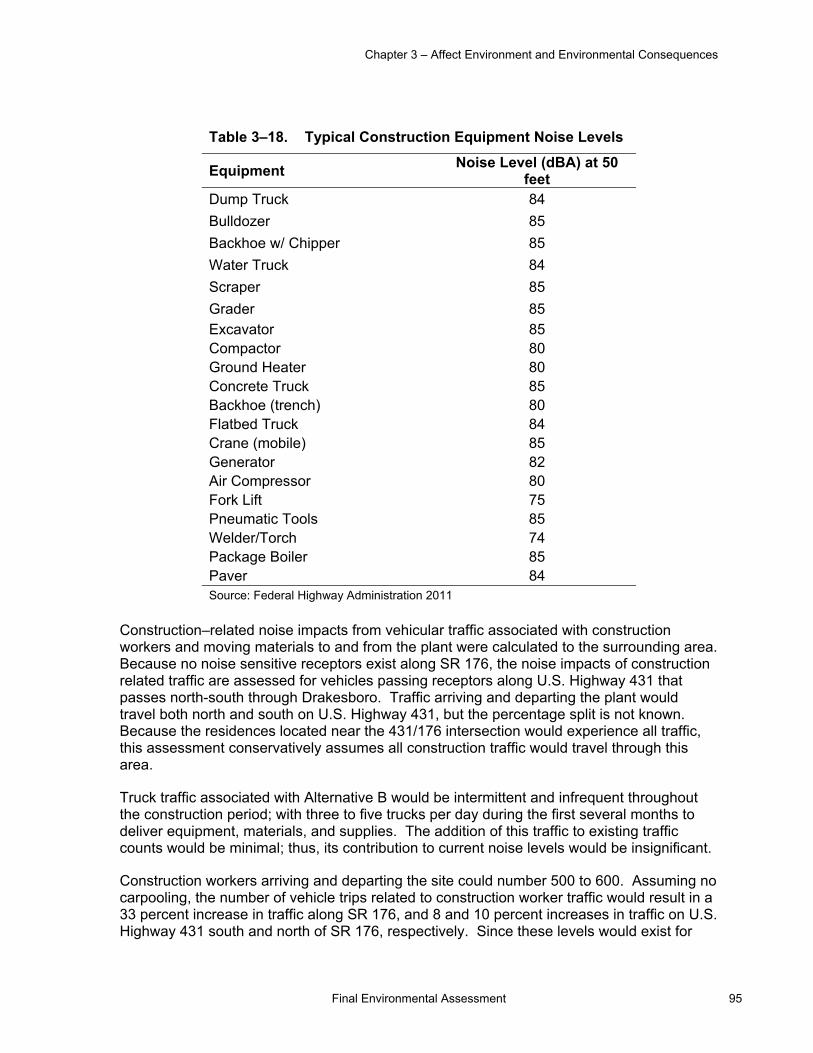
Chapter 3 – Affect Environment and Environmental Consequences
Final Environmental Assessment 95
Table 3–18. Typical Construction Equipment Noise Levels
Equipment Noise Level (dBA) at 50 feet
Dump Truck 84 Bulldozer 85 Backhoe w/ Chipper 85 Water Truck 84 Scraper 85 Grader 85 Excavator 85 Compactor 80 Ground Heater 80 Concrete Truck 85 Backhoe (trench) 80 Flatbed Truck 84 Crane (mobile) 85 Generator 82 Air Compressor 80 Fork Lift 75 Pneumatic Tools 85 Welder/Torch 74 Package Boiler 85 Paver 84 Source: Federal Highway Administration 2011
Construction–related noise impacts from vehicular traffic associated with construction workers and moving materials to and from the plant were calculated to the surrounding area. Because no noise sensitive receptors exist along SR 176, the noise impacts of construction related traffic are assessed for vehicles passing receptors along U.S. Highway 431 that passes north-south through Drakesboro. Traffic arriving and departing the plant would travel both north and south on U.S. Highway 431, but the percentage split is not known. Because the residences located near the 431/176 intersection would experience all traffic, this assessment conservatively assumes all construction traffic would travel through this area.
Truck traffic associated with Alternative B would be intermittent and infrequent throughout the construction period; with three to five trucks per day during the first several months to deliver equipment, materials, and supplies. The addition of this traffic to existing traffic counts would be minimal; thus, its contribution to current noise levels would be insignificant.
Construction workers arriving and departing the site could number 500 to 600. Assuming no carpooling, the number of vehicle trips related to construction worker traffic would result in a 33 percent increase in traffic along SR 176, and 8 and 10 percent increases in traffic on U.S. Highway 431 south and north of SR 176, respectively. Since these levels would exist for
Paradise Units 1 and 2
96 Final Environmental Assessment
only a few months and reflect predominantly automobile and small truck traffic, noise impacts to residents along U.S. Highway 431 would be minimal.
Operational Impacts Noise impacts produced by the operation of the proposed PJFF systems located at PAF Units 1 and 2 as well as the related operations were evaluated and compared to the existing plant noise environment at under full load operation with normal coal and limestone trucks deliveries. The noise impact levels were evaluated at the nearest noise sensitive receptor located 2 miles south of the plant. Noise levels for the evaluated equipment listed are provided in Table 3–19. The sound pressure level data were acquired from applicable equipment manufacturers and in–house noise measurement data for similar equipment.
Table 3–19. Equipment Evaluated Sound Pressure Levels
Equipment Type Quantity Sound Pressure Levels (dBA)
PJFF 2 85 @ 3 feeta Hopper 2 97 @ 3 feetb Pulse Valve 2 105 @ 3 feetb ID Fan 2 90 @ 3 feetb Silo Conveyor 2 80 @ 3 feetb Transformer 6 85 @ 5 feetb aNoise limit specifications which the vendor is required to meet in the field. bAssumed sound pressure levels based on similar equipment. No data was provided by the manufacturer.
Noise impacts at the nearest noise sensitive receptor located approximately 2 miles away resulting from the proposed PJFF systems and associated noise producing equipment including the fly ash handling systems were calculated by logarithmically adding all noise levels related to each of the noise producing equipment and projecting the composite noise levels to a 2–mile distance. These levels were then logarithmically added to the existing ambient noise levels at the nearest noise sensitive receptor to determine the comparative increase in the existing noise levels. Based on these calculations, noise level impacts resulting from the proposed PJFF systems and association facilities and operations would increase overall ambient noise levels at the nearest noise sensitive receptor by 0.1 dBA The noise level at the nearest sensitive receptor would be 21.5 dBA Leq, and the resulting noise impacts would be insignificant.
3.17.2.3. Alternative C – Construct and Operate Combustion Turbine/Combined Cycle Plant Construction Impacts Under Alternative C, construction activities would result in short-term impacts, i.e., no more than 18 months, with most of the work occur during the day on weekdays. However, construction activities could occur at night or on weekends, if necessary. Construction activities would increase traffic on roads near the plant, which would also increase intermittent noise at some nearby residences. During the first site preparation phase of construction, noise would be generated by compactors, front loaders, backhoes, graders, and trucks. The second phase would involve concrete mixers, cranes, pumps, generators,

Chapter 3 – Affect Environment and Environmental Consequences
Final Environmental Assessment 97
and compressors. Due to the temporary and intermittent nature of construction and the site’s rural location, noise from construction activities is not expected to cause adverse impacts. Construction noise impacts from Alternative C would be similar to Alternative B. The increase would be short-term during construction and would not result in an adverse impact to sensitive receptors.
Construction of the proposed pipeline(s) has the potential to create temporary noise pollution in the local construction area. Blasting activities and directional drilling under roads and streams can produce noise impacts above the USEPA outdoor noise threshold guideline of 55 dBA. Blasting would occur only during daylight hours; however, the directional drilling may require continuous work over a 24-hour period. If 24-hour drilling occurs, appropriate measures would be taken to mitigate noise impacts to sensitive receptors.
Operational Noise Impacts Predicted noise emissions from the operation of the proposed CT/CC facility were evaluated for both CT-only and CC modes. Noise emissions were estimated during 100 percent, full load capacity, under normal operating conditions. The following assumptions were used to estimate noise emissions:
• Noise emissions from each of the three gas turbine assemblies, including air inlets and gas turbines, were limited to 60 dBA at 400 feet.
• Noise emissions from each of the three HRSGs, including the exhaust stacks, were limited to 62 dBA at 400 feet.
• Noise emissions from t mechanical draft cooling tower were limited to 56 dBA at 400 feet.
• The steam turbine would be located inside an enclosure that limits noise emissions to 50 dBA at 400 feet.
• The steam turbine condenser and ancillary equipment would be located inside an enclosure that limits noise emissions to 50 dBA at 400 feet.
• Noise emissions from three boiler feed pumps were limited to 85 dBA at 3 feet.
• Noise emissions from the main transformer were limited to 85 dBA at 3 feet, and emissions from the auxiliary transformer were limited to 75 dBA at 3 feet.
• Noise emissions from the auxiliary boiler were limited to 85 dBA at 3 feet.
Changes in noise levels less than 3 dBA are generally barely perceptible to most listeners, while a 5–dBA change is generally considered noticeable by most people. The proposed CT/CC plant at PAF would increase noise levels as compared to typical background noise. The increase would not be noticeable when trains or coal unloading activities are occurring at PAF. Due to the distance to nearest residence at PAF, noise from the operating CT/CC plant is not anticipated to exceed USEPA recommended guideline of 55 dBA. Therefore, noise impacts during the operation of the Alternative C CT/CC plant would not be significant.
3.17.2.4. Cumulative Effects Construction traffic under both action alternatives would result in a short-term, minor cumulative noise impact on sensitive receptors. No noise-related cumulative impacts would result from facility operations under either action alternative.
Paradise Units 1 and 2
98 Final Environmental Assessment
3.17.2.5. Mitigation Measures and BMPs TVA will comply with Occupational Safety and Health Administration standards and TVA's standard practices to mitigate construction and operational noise. No non-routine noise mitigation measures would be required to further reduce construction or operation noise impacts.
3.18. Visual Resources
Visual resources are evaluated based on existing landscape character and scenic integrity. Landscape character is an overall visual and cultural impression of landscape attributes, while scenic integrity indicates the degree of intactness and wholeness of the landscape character (USDA 1995). These components can be influenced by distances of available views, sensitivity of viewing points, and human perceptions of landscape beauty/sense of place (scenic attractiveness).
3.18.1. Affected Environment The project area is located at PAF on the west side of the Green River near Central City, in western Kentucky. Parts of the 3,000-acre reservation are devoid of vegetation and most of it has been heavily disturbed by previous industrial activities.
The most dominant visual components of the site include two 600–foot high stacks, one 800-foot high stack, three cooling towers over 435 feet high, and connecting transmission lines. Other major visual components of the large–scale industrial site include the powerhouse buildings, emission control buildings and ducts, and the coal pile and coal handling facilities. The existing site features are shown on Figure 1–2.
Although mining operations have substantially altered the topography and appearance of much of the area surrounding the plant, the large-scale industrial facility provides a sharp visual contrast to the surrounding rural landscape (TVA 2003). Views of the project area include broadly horizontal buildings and industrial equipment. Predominate focal points include the existing smokestack and cooling towers and the plumes they emit. Views of the plumes are heavily influenced by seasonal variations in weather and atmospheric conditions and they are typically more visible during the winter. Scenic attractiveness of the area is minimal and scenic integrity ranges from low to very low.
3.18.2. Environmental Consequences The impacts to aesthetics and visual resources are evaluated based on changes between the existing landscape and the landscape character after alteration, identifying changes in the landscape character based on commonly held perceptions of landscape beauty and the aesthetic sense of place.
3.18.2.1. Alternative A – No Action Under Alternative A, new equipment would not be installed, resulting in no need for a change in current land use within the existing PAF boundary or along the Green River adjacent to the plant site. Landscape character and integrity would remain in its current state; therefore, there would be no impact to aesthetics and visual resources.
Chapter 3 – Affect Environment and Environmental Consequences
Final Environmental Assessment 99
3.18.2.2. Alternative B – Install and Operate Pulse Jet Fabric Filter Systems Temporary minor visual impacts of Alternative B would include an increase in traffic along adjacent local roads. New laydown and staging areas would be needed during construction, increasing the number of discordantly contrasting elements seen in the landscape around Paradise. Additional visual disruptions would occur with an increase in equipment at construction sites.
The proposed PJFF components, including the connecting transmission lines, would be visually similar to other industrial elements present in the current landscape. Each PJFF system would be roughly 200 feet by 200 feet and 100 feet in height. These new components would generally be absorbed by existing PAF components and would become visually subordinate to the overall landscape character associated with the plant site. Permanent impacts would include minor discernible alterations that would be viewed in the foreground of plant operations. In middle ground views, the new vertical components (silos) would be less distinguishable and may not be noticed by the casual viewer. In more distant views, the new silos would likely merge with the taller existing vertical components.
Overall, the construction, operation, and maintenance of the PJFF systems would have insignificant, negligible visual impacts for area residents, motorists, recreational users, and PAF employees and visitors. There may be some minor visual discord during the construction and subsequent post–construction maintenance period due to an increase in personnel and equipment and the use of laydown and materials storage areas. These minor visual obtrusions would be temporary until all areas have been restored using standard BMPs.
The PAF site would continue to be classified as having minimal scenic attractiveness and low to very low scenic integrity. The landscape character of this highly disturbed industrial site would be similar to existing. Therefore, visual impacts resulting from implementation of Alternative B would be negligible.
3.18.2.3. Alternative C – Construct and Operate Combustion Turbine/Combined Cycle Plant The new CT/CC plant would be constructed in a previously disturbed area partially surrounded by ponds on the northern portion of PAF’s reservation. In comparison with the Alternative B PJFF facilities, the CT/CC plant would include more discordantly contrasting elements seen in the landscape by employees, contractors, and visitors. Even so, these elements would be visually similar to other industrial structures seen in the landscape now, and the long-term visual impacts would be minor. The retirement of PAF Units 1 and 2 would reduce the highly visible plumes from the various stacks. The eventual likely dismantling of Units 1 and 2 components, although not part of the current proposed action, would further reduce some of the visual impacts of the existing facilities. The visual impacts resulting from construction activities would be similar to those of Alternative B.
The construction of the natural gas pipeline(s) would alter the visual character of parts of the routes by the long-term clearing of trees from wooded areas of the ROW(s). This long-term visual impact will be assessed in more detail once the pipeline route(s) are identified during the FERC licensing process. Additional short–term impacts would occur from during construction from the stockpiling of pipe, trenching and directional drilling, and the assembly of the pipeline. These visual impacts would be localized and temporary until construction activities are complete and the ROW revegetated.
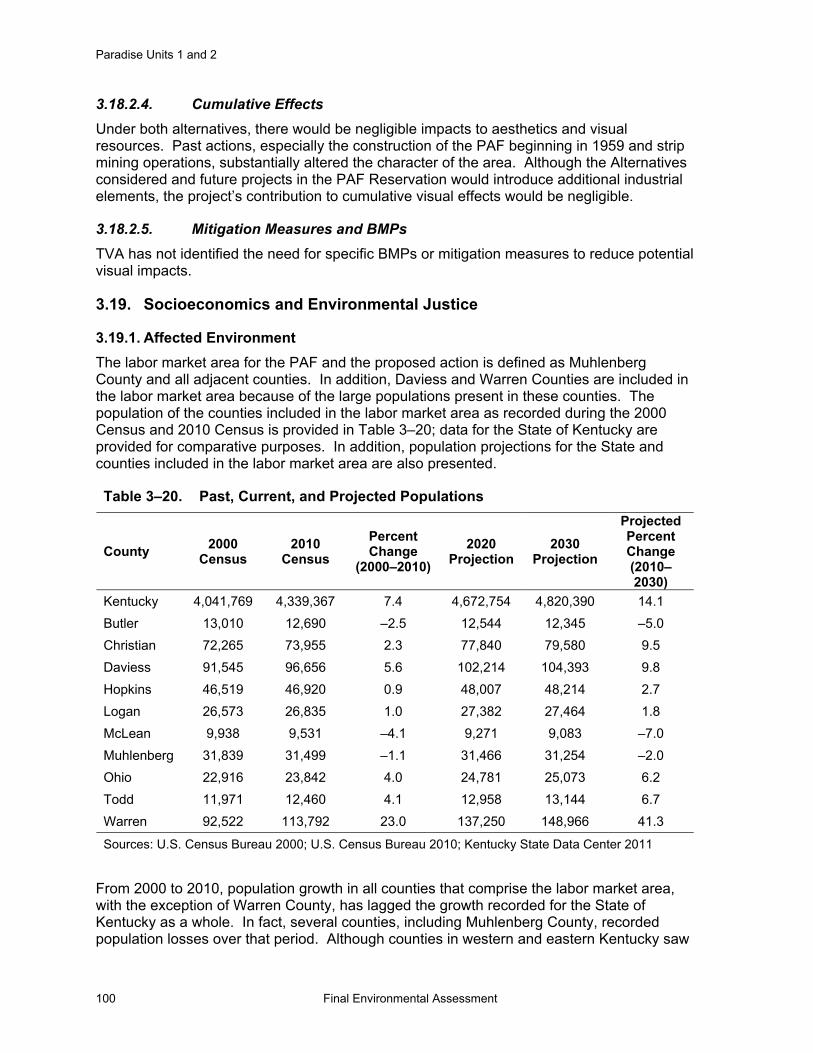
Paradise Units 1 and 2
100 Final Environmental Assessment
3.18.2.4. Cumulative Effects Under both alternatives, there would be negligible impacts to aesthetics and visual resources. Past actions, especially the construction of the PAF beginning in 1959 and strip mining operations, substantially altered the character of the area. Although the Alternatives considered and future projects in the PAF Reservation would introduce additional industrial elements, the project’s contribution to cumulative visual effects would be negligible.
3.18.2.5. Mitigation Measures and BMPs TVA has not identified the need for specific BMPs or mitigation measures to reduce potential visual impacts.
3.19. Socioeconomics and Environmental Justice
3.19.1. Affected Environment The labor market area for the PAF and the proposed action is defined as Muhlenberg County and all adjacent counties. In addition, Daviess and Warren Counties are included in the labor market area because of the large populations present in these counties. The population of the counties included in the labor market area as recorded during the 2000 Census and 2010 Census is provided in Table 3–20; data for the State of Kentucky are provided for comparative purposes. In addition, population projections for the State and counties included in the labor market area are also presented.
Table 3–20. Past, Current, and Projected Populations
County 2000 Census
2010 Census
Percent Change
(2000–2010) 2020
Projection 2030
Projection
Projected Percent Change (2010–2030)
Kentucky 4,041,769 4,339,367 7.4 4,672,754 4,820,390 14.1 Butler 13,010 12,690 –2.5 12,544 12,345 –5.0 Christian 72,265 73,955 2.3 77,840 79,580 9.5 Daviess 91,545 96,656 5.6 102,214 104,393 9.8 Hopkins 46,519 46,920 0.9 48,007 48,214 2.7 Logan 26,573 26,835 1.0 27,382 27,464 1.8 McLean 9,938 9,531 –4.1 9,271 9,083 –7.0 Muhlenberg 31,839 31,499 –1.1 31,466 31,254 –2.0 Ohio 22,916 23,842 4.0 24,781 25,073 6.2 Todd 11,971 12,460 4.1 12,958 13,144 6.7 Warren 92,522 113,792 23.0 137,250 148,966 41.3
Sources: U.S. Census Bureau 2000; U.S. Census Bureau 2010; Kentucky State Data Center 2011
From 2000 to 2010, population growth in all counties that comprise the labor market area, with the exception of Warren County, has lagged the growth recorded for the State of Kentucky as a whole. In fact, several counties, including Muhlenberg County, recorded population losses over that period. Although counties in western and eastern Kentucky saw

Chapter 3 – Affect Environment and Environmental Consequences
Final Environmental Assessment 101
slow or negative growth, the metropolitan areas of northern and central Kentucky grew faster than the U.S. as a whole (Kentucky State Data Center 2011). This basic pattern is projected to continue as shown in Table 3–20.
Three hundred seventy workers are currently employed at PAF, and their average annual salary is $74,000. Table 3–21 summarizes data on income and employment for the counties included in the PAF labor market area. The average unemployment rate for the labor market counties is 9.2 percent, which is generally equivalent to the statewide rate. Over the 2000–2012 period, unemployment in the labor market counties averaged 7.3 percent, slightly higher than the statewide average of 6.8 percent over the same period (Bureau of Labor Statistics 2012a). Unemployment in the State and all labor market counties rose considerably in the 2009–2010 period.
Per capita income in all labor market counties with the exception of Daviess County lags that of the State, with the greatest disparity seen in Butler County.
Table 3–21. Total Employment, Unemployment, and Per Capita Income
County Total Employment1
Numbers Unemployed2
Unemployment Rate (2011)2
Per Capita
Income3
Per Capita Income as a
Percentage of State Per Capita
Income4 Kentucky 2,369,859 196,981 9.5 33,989 Butler 4,439 595 10.6 26,519 78.0 Christian 73,088 3,091 11.7 32,061 94.3 Daviess 55,972 4,035 8.2 35,246 103.7 Hopkins 22,585 1,850 8 32,099 94.4 Logan 12,661 1,128 8.9 31,530 92.8 McLean 3,114 425 9.3 32,674 96.1 Muhlenberg 12,485 1,373 9.8 28,429 83.6 Ohio 10,321 1,016 8 29,387 86.5 Todd 4,488 508 9.2 27,761 81.7 Warren 70,744 4,876 8.3 32,025 94.2 1 Bureau of Economic Analysis 2012 2 Bureau of Labor Statistics 2012a 3,4 Bureau of Economic Analysis 2012
TVA makes tax equivalent payments to states and local governments where it sells electricity or has power properties. These payments are 5 percent of annual power sales revenues and are distributed among states based on both power sales and the value of power assets in each state. The payments are distributed with the states according to each states own formulas. For the 2012 fiscal year, TVA made a tax equivalent payment of $46,756,000 to the state of Kentucky. The state of Kentucky distributed $13,112,000 of this payment to Muhlenberg County. About $10 million of this was allocated for the county school district and the remainder for general county government purposes. Fiscal year 2013 tax equivalent payments to individual states have not yet been determined and will be somewhat lower than 2012 payments due to reduced power sales.

Paradise Units 1 and 2
102 Final Environmental Assessment
With the exception of Christian and Warren counties, a greater proportion of the population of the labor market counties identifies as white than is seen for the State of Kentucky or the United States overall (Table 3–22). Correspondingly, the minority populations in these counties are smaller in terms of proportion of the total population than is seen in the State of Kentucky as a whole or in the U.S. The larger minority population seen in Christian County is attributable to the presence of Fort Campbell, and the larger minority population seen in Warren County is attributable to the urbanized Bowling Green area and Western Kentucky University.
Though nominal, a greater proportion of the population of the State of Kentucky lives in poverty when compared with the United States as a whole (Table 3–23). With the exception of Daviess and McLean counties, a greater proportion of the population of the labor market counties lives in poverty compared with the State of Kentucky as a whole.
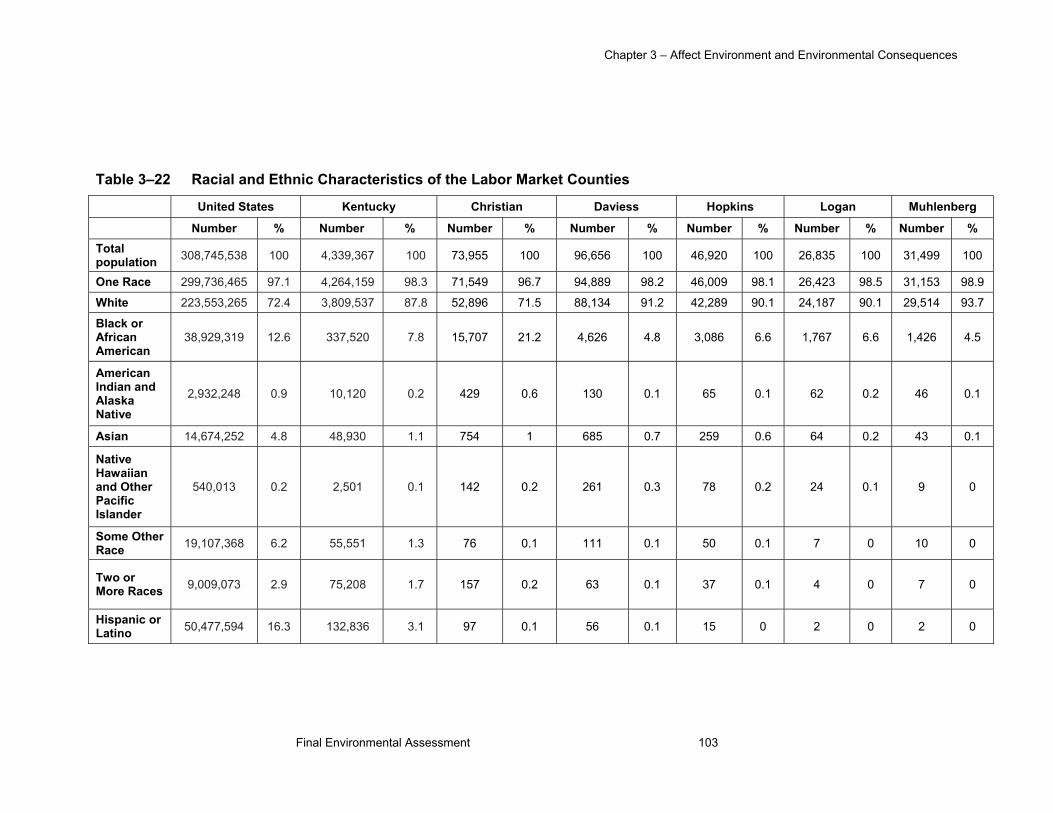
Chapter 3 – Affect Environment and Environmental Consequences
Final Environmental Assessment 103
Table 3–22 Racial and Ethnic Characteristics of the Labor Market Counties
United States Kentucky Christian Daviess Hopkins Logan Muhlenberg
Number % Number % Number % Number % Number % Number % Number % Total population 308,745,538 100 4,339,367 100 73,955 100 96,656 100 46,920 100 26,835 100 31,499 100
One Race 299,736,465 97.1 4,264,159 98.3 71,549 96.7 94,889 98.2 46,009 98.1 26,423 98.5 31,153 98.9
White 223,553,265 72.4 3,809,537 87.8 52,896 71.5 88,134 91.2 42,289 90.1 24,187 90.1 29,514 93.7
Black or African American
38,929,319 12.6 337,520 7.8 15,707 21.2 4,626 4.8 3,086 6.6 1,767 6.6 1,426 4.5
American Indian and Alaska Native
2,932,248 0.9 10,120 0.2 429 0.6 130 0.1 65 0.1 62 0.2 46 0.1
Asian 14,674,252 4.8 48,930 1.1 754 1 685 0.7 259 0.6 64 0.2 43 0.1
Native Hawaiian and Other Pacific Islander
540,013 0.2 2,501 0.1 142 0.2 261 0.3 78 0.2 24 0.1 9 0
Some Other Race 19,107,368 6.2 55,551 1.3 76 0.1 111 0.1 50 0.1 7 0 10 0
Two or More Races 9,009,073 2.9 75,208 1.7 157 0.2 63 0.1 37 0.1 4 0 7 0
Hispanic or Latino 50,477,594 16.3 132,836 3.1 97 0.1 56 0.1 15 0 2 0 2 0
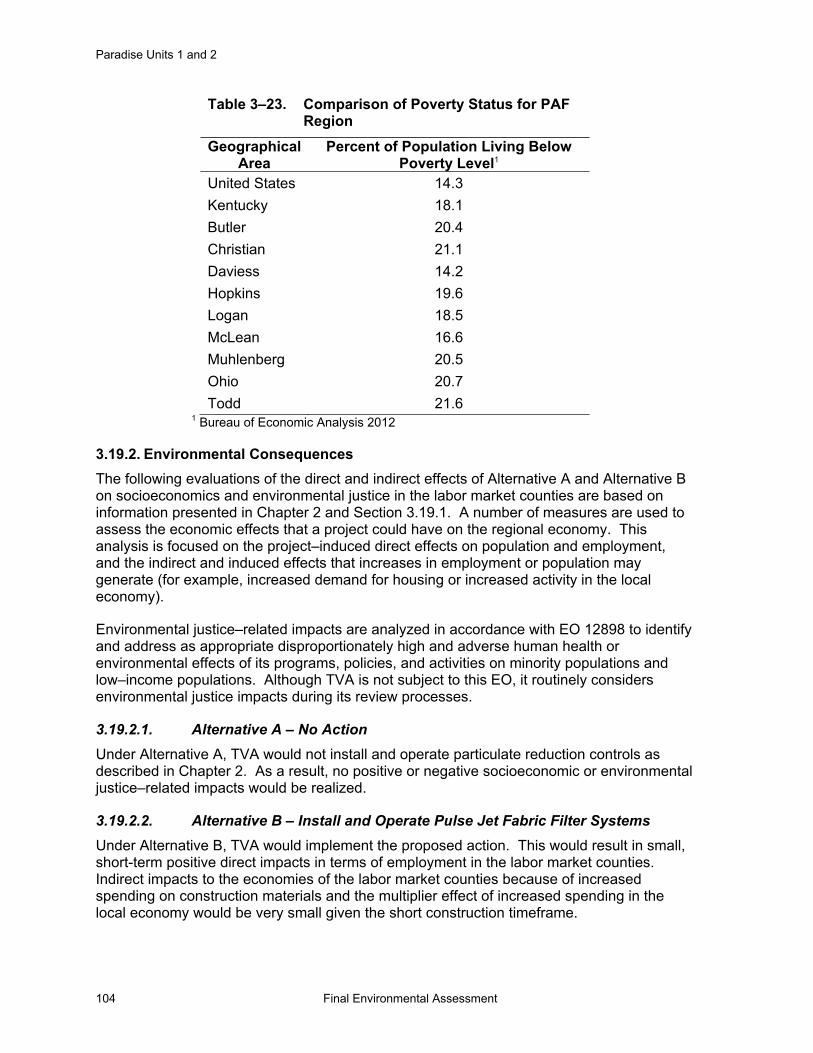
Paradise Units 1 and 2
104 Final Environmental Assessment
Table 3–23. Comparison of Poverty Status for PAF Region
Geographical Area
Percent of Population Living Below Poverty Level1
United States 14.3 Kentucky 18.1 Butler 20.4 Christian 21.1 Daviess 14.2 Hopkins 19.6 Logan 18.5 McLean 16.6 Muhlenberg 20.5 Ohio 20.7 Todd 21.6
1 Bureau of Economic Analysis 2012
3.19.2. Environmental Consequences The following evaluations of the direct and indirect effects of Alternative A and Alternative B on socioeconomics and environmental justice in the labor market counties are based on information presented in Chapter 2 and Section 3.19.1. A number of measures are used to assess the economic effects that a project could have on the regional economy. This analysis is focused on the project–induced direct effects on population and employment, and the indirect and induced effects that increases in employment or population may generate (for example, increased demand for housing or increased activity in the local economy).
Environmental justice–related impacts are analyzed in accordance with EO 12898 to identify and address as appropriate disproportionately high and adverse human health or environmental effects of its programs, policies, and activities on minority populations and low–income populations. Although TVA is not subject to this EO, it routinely considers environmental justice impacts during its review processes.
3.19.2.1. Alternative A – No Action Under Alternative A, TVA would not install and operate particulate reduction controls as described in Chapter 2. As a result, no positive or negative socioeconomic or environmental justice–related impacts would be realized.
3.19.2.2. Alternative B – Install and Operate Pulse Jet Fabric Filter Systems Under Alternative B, TVA would implement the proposed action. This would result in small, short-term positive direct impacts in terms of employment in the labor market counties. Indirect impacts to the economies of the labor market counties because of increased spending on construction materials and the multiplier effect of increased spending in the local economy would be very small given the short construction timeframe.
Chapter 3 – Affected Environment and Environmental Consequences
Final Environmental Assessment 105
As described in Chapter 2, construction of Alternative B would take approximately 18 months and would require a temporary workforce of approximately 600 people at the peak of construction; on average, 500 people would be engaged in construction of the proposed action. The average unemployment rate in the labor market counties ranges from approximately 8 to 12 percent (Table 3–21), which is equivalent to approximately 14,000 unemployed individuals on average per month. Many of these individuals are unlikely to possess the skills or experience necessary for construction of the infrastructure under Alternative B. Construction and Extraction Occupations; Installation, Maintenance, and Repair Occupations; and Transportation and Material Moving Occupations are among the top occupations in the labor market counties (Bureau of Labor Statistics 2012b).
Given the existing structure of the labor force in the labor market counties and the current unemployment rate, it is likely that predominantly local labor would be used for construction. This would result in a small, temporary direct positive impact to employment in the labor market counties. In addition, small, temporary indirect impacts to employment could be realized by suppliers of construction materials if they hire additional workers to meet the material demands of the project during construction. These direct and indirect impacts would be positive but short term and would not be significant.
As described above, it is projected that the construction workforce would predominantly be drawn from the labor market counties. This, in combination with the short construction timeframe, indicates that construction activities would not result in any permanent population increase in the labor market counties. Some portion of the construction workforce may elect to relocate temporarily within the labor market counties during the construction period, and some construction workers may be drawn to the region from outside the labor market counties. As there are a large number of housing units for rent in the labor market counties; the number of units for rent within Muhlenberg County alone could accommodate more than half of the projected construction workforce (US Census Bureau 2012). Therefore, no significant impacts to the local housing market would occur directly or indirectly because of construction activities.
No new permanent positions would be created to operate and maintain the infrastructure installed under Alternative B. As a result, long-term operation and maintenance of the infrastructure installed under Alternative B would not result directly or indirectly in an increase in population or employment and would have no associated direct or indirect effects. The existing labor and housing markets, and the demographic profile, of the labor market counties would be unaffected in the long term. There would be a small increase in TVA tax equivalent payments to the state of Kentucky and subsequently to Muhlenberg County due to the increased value of PAF Units 1 and 2 following installation of the PJFF systems.
3.19.2.3. Alternative C – Construct and Operate Combustion Turbine/Combined Cycle Plant There would be no significant environmental justice–related impacts under Alternative C. The PAF reservation would not be expanded to accommodate the CT/CC plant, and the area around the PAF is largely rural and not densely populated. As shown in Table 3–22, the percentage of the population identifying as non-White is smaller in all labor market counties than for the State of Kentucky as a whole, with the exception of Christian County and Warren County. The percentage of the population living below the poverty line is generally higher in the labor market counties than for the State of Kentucky as a whole.
Paradise Units 1 and 2
106 Final Environmental Assessment
However, due to the lack of significant environmental impacts as described in this Chapter, and the lack of identified concentrations of minority, Hispanic, or low–income populations in the labor market counties or in the areas near the PAF that may be impacted by activities under Alternative C, no disproportionate impacts to disadvantaged populations are projected.
The normal onsite construction workforce would range from 400 to 700 workers, with occasional higher peak workforces. The impacts of the construction workforce would generally be similar to that described above for Alternative B. Following the completion of construction and the retirements of PAF Units 1 and 2, employment at PAF would substantially decrease. Approximately 170 workers would be employed for operating Unit 3. Operation of the completed CT/CC plant would require 35-40 employees. Consequently, total future employment at PAF under Alternative C would be about 205–210 once the CT/CC plant is operating. This represents up to a 49 percent reduction in employment at PAF and a comparable reduction in the PAF payroll. While this decrease in employment represents less than 2 percent of total employment in Muhlenberg County, it would result in adverse economic impacts to the area.
All of the coal burned at PAF is recent years has been from Illinois Basin coalfields, and 83 percent of the coal burned in 2012 was mined in western Kentucky. In 2012, PAF Units 1 and 2 burned approximately 3.8 million tons of coal. Based on an average 2012 western Kentucky coal mine productivity of 3.73 tons/employee labor hour (Kentucky Energy and Environment Cabinet 2013), the mining of this coal would have provided employment for about 500 workers. About 410 of these workers were in Western Kentucky, where they make up 9 percent of regional coal mine employment. The mining of the limestone used in the Units 1 and 2 FGD systems provided additional employment. Unless the coal and limestone mines find other markets for their products, additional adverse economic impacts to the area would occur from the closure of these facilities.
Changes in TVA tax equivalent payments to the state of Kentucky and the state’s allocation to Muhlenberg County would likely be small. The value of the completed CT plant and potential CC plant would slightly increase payments to the state and subsequently to the county. This increase would be at least partially offset by the reduced value of PAF Units 1 and 2 once they are retired.
3.19.2.4. Cumulative Effects Under Alternative A, TVA would not install and operate particulate reduction controls as described in Chapter 2. As a result, no positive or negative socioeconomic- or environmental justice-related impacts would be realized. Therefore, there would be no contribution to a cumulative effect.
Under Alternative B and future TVA projects at PAF, socioeconomic impacts during construction would be positive but short-term and would not be significant; and no disproportionate impacts to disadvantaged populations are projected. Cumulative socioeconomic impacts during construction under Alternatives B and C, and during plant operation under Alternative B, would be minor and insignificant. Louisville Gas & Electric/Kentucky Utilities has announced the retirement of its Green River Station power plant, located within the same labor market area as PAF. Cumulative socioeconomic impacts of Alternative C, following the completion of construction and the retirement of PAF Units 1 and 2 would be adverse due to the substantially reduced employment at PAF and the related employment of those providing goods and services to PAF.

Chapter 3 – Affected Environment and Environmental Consequences
Final Environmental Assessment 107
3.19.2.5. Mitigation Measures and BMPs No potentially significant socioeconomic- or environmental justice-related impacts have been identified. Therefore, no mitigation measures are necessary, and no BMPs would need to be implemented.


Chapter 4 – Literature Cited
Final Environmental Assessment 109
CHAPTER 4
4.0 LITERATURE CITED
Academy of Natural Sciences of Philadelphia (ANSP). 1962. Green River Survey 1961 River Survey Report for the Tennessee Valley Authority. Philadelphia, Pennsylvania.
______. 1966. Green River Survey 1965 River Survey Report for the Tennessee Valley Authority. Philadelphia, Pennsylvania.
Bryant, Ron D. 1992. Muhlenberg County.: The Kentucky Encyclopedia, edited by John E. Kleber, pp. 659–660. The University Press of Kentucky, Lexington.
Bureau of Economic Analysis. 2012. Interactive Data – GDP & Personal Income. Available at: http://bea.gov/iTable/iTable.cfm?ReqID=70&step=1&isuri=1&acrdn=5.
Bureau of Labor Statistics. 2012a. Local Area Unemployment Statistics. Available at: http://data.bls.gov/pdq/querytool.jsp?survey=la.
______. 2012b. Occupational Employment Statistics. Data access through the Occupational Employment Statistics Query System. Available at: http://data.bls.gov/oes/.
Burr, B. M., and M. L. Warren, Jr. 1986. A distributional atlas of Kentucky fishes. Kentucky Nature Preserves Commission, Science and Technical Series 4:1–398.
Caltrans. 1998. A Technical Supplement to the Traffic Noise Analysis Protocol. California Department of Transportation Environmental Program, Environmental Engineering Noise, Air Quality, and Hazardous Waste Management Office. Available online at http://www.dot.ca.gov/hq/env/noise/pub/Technical%20Noise%20Supplement.pdf. (Accessed: February 15, 2013).
Coleman, J. W. 1968. Historic Kentucky. The Henry Clay Press, Lexington, Kentucky.
Council on Environmental Quality (CEQ). 2010. Draft NEPA Guidance on Consideration of the Effects of Climate Change and Greenhouse Gas Emissions. Council on Environmental Quality, Washington, DC.
Energy Information Administration (EIA). 2011. Energy Information Administration, Annual Energy Outlook 2011. DOE/EIA–03832011, Available online at: http://www.eia.gov/forecasts/aeo/electricitygeneration.cfm. (Accessed January 31, 2013).
_____. 2012. Today in Energy: Projected Retirements of Coal–Fired Power Plants. July 31, 2012. Available online at: http://www.eia.gov/todayinenergy/detail.cfm?id=7330. (Accessed March 20, 2013).
Environmental Laboratory. 1987. Corps of Engineers Wetlands Delineation Manual. Technical Report Y–87–1, U.S. Army Engineer Waterways Experiment Station, Vicksburg, MS. NTIS No. AD A176 912.
Paradise Units 1 and 2
110 Final Environmental Assessment
Etnier, D.A. and W. C. Starnes. 1993. The Fishes of Tennessee. University of Tennessee Press, Knoxville.
Federal Highway Administration. 2011. Highway Traffic Noise: Analysis and Abatement Guidance, December 2011.
Fenneman, N. M. 1938. Physiography of the eastern United States. McGraw–Hill, New York.
Fry, J., Xian, G., Jin, S., Dewitz, J., Homer, C., Yang, L., Barnes, C., Herold, N., and Wickham, J. 2011. Completion of the 2006 National Land Cover Database for the Conterminous United States, PE&RS, Vol. 77(9):858–864.
Intergovernmental Panel on Climate Change (IPCC). 2007. Climate Change 2007: The Physical Science Basis. Contribution of Working Group I to the Fourth Assessment Report of the IPCC.
Karpynec, T. and L. McKee. 2005. Phase I Architectural and Historical Survey for a Proposed Communications Tower at the Paradise Fossil Plant, Muhlenberg County, Kentucky. Final report prepared for Tennessee Valley Authority, Knoxville, TN by TRC, Inc., Nashville, Tennessee
Karpynec, T. 2013. Architectural Assessment of the Proposed Improvements to the TVA Paradise Fossil Plant. Final report prepared for Tennessee Valley Authority, Knoxville, Tennessee by Tennessee Valley Archaeological Research, Huntsville, Alabama.
______. 2011. Final 2010 Integrated Report to Congress on the Condition of Water Resources in Kentucky. Frankfort, KY. KDEP, Division of Water. Available at: http://water.ky.gov/waterquality/303d%20Lists/2010%20IR%20Volume%202–%20Final.pdf. (Accessed: March 15, 2013).
______. 2010. Kentucky’s Comprehensive Wildlife Conservation Strategy. Kentucky Department of Fish and Wildlife Resources, #1 Sportsman’s Lane, Frankfort, Kentucky 40601. Available at: http://fw.ky.gov/kfwis/stwg/.
______. 2013. Species Information: threatened, endangered, and candidate species for Muhlenberg County. Available at: http://fw.ky.gov/kfwis/speciesInfo/countyListSpecies.asp. (Accessed: January 24, 2013).
Kentucky Division of Conservation. 2012. Green River CREP. Division of Conservation, Frankfort, Kentucky. Available at: http://conservation.ky.gov/Pages/GreenRiverCREP.aspx. (Accessed: April 10, 2013).
Kentucky Energy and Environment Cabinet. 2013. Kentucky Coal Facts, 13th Edition. Available at http://energy.ky.gov/Coal%20Facts%20Library/Kentucky%20Coal%20Facts%20–%2013th%20Edition%20(2013).pdf. (Accessed October 7, 2013).
Chapter 4 – Literature Cited
Final Environmental Assessment 111
Kentucky Infrastructure Authority. 2013. Kentucky Water Mapping. Available at http://kygeonet.ky.gov/kia/dw/index.html. (Accessed: January 30, 2013).
Kentucky Natural Heritage Program. 2009. Terrestrial Zoology Records within 3 miles of Paradise Fossil Plant, Kentucky Natural Heritage Program Data.
Kentucky State Nature Preserve Commission (KSNPC). 2012. County Report of Endangered, Threatened, and Special Concern Plants, Animals, and Natural Communities of Kentucky. Kentucky State Nature Preserves Commission, Frankfort.
______. 2013. Rare plant communities in Kentucky Counties. Available at: http://naturepreserves.ky.gov/pubs/Pages/cntyreport.aspx. (Accessed 24 May 2013).
Kentucky State Data Center. 2011. Population Projections. Available at: http://ksdc.louisville.edu/index.php/kentucky–demographic–data/projections. (Accessed February 2013).
Kentucky Transportation Cabinet (KYTC) 2010. Traffic Station Counts. Available online: www.planning.kytc.ky.gov. (Accessed: February 8, 2013)
Maxwell, B.W., and Devaul, R.W. 1962. Reconnaissance of ground–water resources in the western coal field region, Kentucky. U.S. Geological Survey Water–Supply Paper 1599.
McKee, L. 2005. Phase I Archaeological Survey for a Proposed Communications Tower at the Paradise Fossil Plant, Muhlenberg County, Kentucky. Final report prepared for Tennessee Valley Authority, Knoxville, TN by TRC, Inc., Nashville, Tennessee.
Moore, C. B. 1916. Some aboriginal sits on Green River, Kentucky. J. Academy of Natural Sciences of Philadelphia (2nd Series) 16:431–487.
Morey, D. F., G. M. Crothers, J. K. Stein, J. P. Fenton, and N. P. Herrmann. 2002 The Fluvial and Geomorphic Context of Indian Knoll, an Archaic Shell Midden in West–Central Kentucky. Geoarchaeology 17:521–553.
NatureServe. 2012. NatureServe Explorer: An online encyclopedia of life [web application]. Version 7.1. NatureServe, Arlington, Virginia. Available at: http://www.natureserve.org/explorer/.
Palmer–Ball, B. L. 1996. The Kentucky Breeding Bird Atlas. The University Press of Kentucky, Lexington.
Parmalee, P. W. and A. E. Bogan. 1998. The Freshwater Mussels of Tennessee. University of Tennessee Press, Knoxville.
Natural Resources Conservation Service . 2013. Web Soil Survey. United States Department of Agriculture Natural Resources Conservation Service. Available at: http://websoilsurvey.nrcs.usda.gov/app/HomePage.htm. (Accessed: January 11, 2013)
Paradise Units 1 and 2
112 Final Environmental Assessment
Starn, J. J., R. W. Forbes, C. J. Taylor, and M. F. Rose. 1993. Geohydrology of parts of Muhlenberg, Ohio, Butler, McClean, Todd, and Logan Counties, Kentucky. U.S. Geological Survey WRI Report 93–4077.
Tennessee Valley Authority (TVA). 1964. The Paradise Steam Plant. A Report on the Planning, Design, Construction, Costs, and First Power Operations of the Initial Two–Unit Plant. Technical Report No. 37. Tennessee Valley Authority, Knoxville, Tennessee.
______. 1998. Jacobs Creek Bioassessment Report. Paradise Steam–Electric Plant. Tennessee Valley Authority Resource Group Water Management.
______. 1999. Final Environmental Assessment, Paradise Fossil Plant Units 1, 2, and 3, Selective Catalytic Reduction Systems for Nitrogen Oxide Control.
______. 2003. Final Environmental Assessment, Installation of Flue Gas Desulfurization System on Paradise Fossil Plant Unit 3, Muhlenberg County, Kentucky, March 2003. Available at: http://www.tva.gov/environment/reports/paradise/index.htm. (Accessed December 15, 2012).
______. 2004. Final Supplemental Environmental Assessment, Paradise Fossil Plant Disposal of Coal Wash Fines, Muhlenberg County, Kentucky.
______. 2006. Supplemental Environmental Assessment, Year–Round Operations of Selective Catalytic Reduction Systems for Nitrogen Oxide Control at Current Slip Rates Paradise Fossil Plant Units 1, 2, and 3. Available at: http://www.tva.gov/environment/reports/paradise3/index.htm.
______. 2008. Unionid Mussel and Habitat Survey of the Green River at a proposed dredge site near the Paradise Fossil Plant (Muhlenberg Co. and Ohio Co., KY), Unpublished Report, CEC No. 18747.
______. 2009a. TVA Coal Combustion Products Remediation Plan, Press Release available at: http://www.tva.gov/news/releases/julsep09/ccprp_other.htm. (Accessed April 8, 2013).
______. 2009b. Entrainment and Impingement of Fish at Paradise Fossil Plant During 2006 Through 2008. Biology and Water Resources, Tennessee Valley Authority.
______. 2010. Environmental Assessment and Finding of No Significant Impact, John Sevier Fossil Plant, Addition of Gas–Fired Combustion Turbine /combined Cycle Generating Capacity and Associated Gas Pipeline. Available at: http://www.tva.gov/environment/reports/johnsevier_ct/ea.pdf.
______. 2011a. TVA’s Integrated Resource Plan, TVA’s Environmental and Energy Future. Available at: http://www.tva.com/environment/reports/irp/index.htm. (Accessed April 17, 2013).
______. 2011b. Final Environmental Impact Statement and Record of Decision, TVA’s Integrated Resource Plan. Available online: http://www.tva.com/environment/reports/irp/index.htm.
Chapter 4 – Literature Cited
Final Environmental Assessment 113
______. 2013a. Paradise Fossil Plant, Residual Landfill Permit No. 089–00012–Semi–annual Groundwater and Surface Water Monitoring Report– Second Half 2012 Reporting and Flue Gas Desulfurization Pond Voluntary Monitoring.
Tuttle, M. D. 1976. Population ecology of the gray bat (Myotis grisescens): philopatry, timing, and patterns of movement, weight loss during migration, and seasonal adaptive strategies. Occasional Papers of the Museum of Natural History, University of Kansas, 54:1–38.
U.S. Army Corps of Engineers (USACE). 2011. Louisville District—Green River Charts, Chart No 43. Available at: http://www.lrl.usace.army.mil/optm/article.asp?id=133. (Accessed: April 17, 2013).
U.S. Census Bureau. 2000 Decadal Census. Available at: http://factfinder2.census.gov.
______. 2010 Decadal Census. Available at: http://factfinder2.census.gov.
U.S. Census Bureau. 2007–2011 American Community Survey. Available online: http://factfinder2.census.gov.
U.S. Department of Agriculture (USDA). 1995. Landscape Aesthetics: A Handbook for Scenery Management. USDA Agricultural Handbook Number 701.
_____. 2007. Invasive and Noxious Weeds. Available online: http://plants.usda.gov/java/noxiousDriver. (Accessed: November 15, 2012).
______. 2013. Kentucky State–listed Noxious Weeds. Available at: http://plants.usda.gov/java/noxious?rptType=State&statefips=21. (Accessed: January 24, 2013).
U.S. Environmental Protection Agency (USEPA). 2004. Emission Reference – USEPA Exhaust and Crankcase Emission Factors for Nonroad Engine Modeling–– Compression– Ignition. USEPA 420–P–04–009, Table A.2 Page A6.
______. 2012a. USEPA 40 CFR Parts 60 and 63, National Emission Standards for Hazardous Air Pollutants From Coal and Oil–Fired Electric Utility Steam Generating Units and Standards of Performance for Fossil–Fuel–Fired Electric Utility, Federal Register Vol. 77, No. 231 / Friday, November 30, 2012. Available at: http://www.gpo.gov/fdsys/pkg/FR–2012–11–30/pdf/2012–28729.pdf. (Accessed January 30, 2013).
_____. 2012b. Water: Local Drinking Water Information. Available at: http://www.epa.gov/safewater/dwinfo/index.html.
U.S. Fish and Wildlife Service (USFWS). 1990. Endangered Species status for the Purple Cat’s Paw Pearlymussel (Epioblasma obliquata obliquata). Federal Register, 55 (132): 28209–28213.
______. 1991. Fanshell (Cyprogenia stegaria (=C. irrorata)) Recovery Plan. U. S. Fish and Wildlife Service, Atlanta, Georgia.
Paradise Units 1 and 2
114 Final Environmental Assessment
______. 2008. List of Endangered, threatened, and candidate species in Muhlenberg County, Kentucky. Available at: http://www.fws.gov/frankfort/EndangeredSpecies.html. (Accessed: January 25, 2013).
______. 2012. National Wetlands Inventory. U.S. Department of the Interior, Fish and Wildlife Service, Washington, D.C. Available at: http://www.fws.gov/wetlands/. (Accessed January 18, 2013).
United States Water Resources Council. 1978. Floodplain Management Guidelines for Implementing EO 11988. 43 Federal Register 6030, February 10, 1978.
University of Kentucky, Community and Economic Development Initiative of Kentucky. 2011. Kentucky County Economic Profiles. Available at: http://www2.ca.uky.edu/CEDIK/data_profiles/economic. (Accessed April 15, 2013).
URS Energy and Construction, Inc. 2013. Geotechnical Engineering Report. Prepared for Tennessee Valley Authority Particulate Control Project Units 1 & 2, Paradise Fossil Plant, Drakesboro, Muhlenberg County, Kentucky.
Wampler, M. E. and T. Karpynec. 2004. Archaeological Survey for the Kirkmansville–Clifty City Power Improvement Project, Muhlenberg, Todd, and Christian Counties, Kentucky. Final report prepared for Tennessee Valley Authority, Knoxville, Tennessee by TRC, Inc., Nashville, Tennessee.
Webb, W. S. 1946. Indian Knoll, Site OH2, Ohio County, Kentucky. Anthropology and Archaeology 4(3), part 1:113–365.
Wiley F. H. and M. S., 1982. Potential Ground–water Quality Impacts at TVA Steam Plants. Tennessee Valley Authority, Office of Natural Resources and Water Resources Development Branch.
Woods, A.J., Omernik, J.M., Martin, W.H., Pond, G.J., Andrews, W.M., Call, S.M, Comstock, J.A., and Taylor, D.D. 2002. Ecoregions of Kentucky. U.S. Geological Survey, Reston, Virginia.
Chapter 5 – List of Preparers
Final Environmental Assessment 115
CHAPTER 5
5.0 LIST OF PREPARERS
5.1. Contributors – Project Management
Charles P. Nicholson, PhD (TVA) Education: Ph.D., Ecology and Evolutionary Biology; M.S., Wildlife
Management; B.S., Wildlife and Fisheries Science Experience: 34 years in Zoology, Endangered Species Studies, and NEPA
Compliance Involvement: NEPA Compliance, Document Preparation, Project
Management
Ashley Farless, PE, AICP (TVA) Education: BS Civil Engineering Experience: Professional Engineer and Certified Planner, 13 years in
NEPA Compliance Involvement: NEPA Project Review Cynthia R. Wren (TVA) Education: B.S., Environmental Science; B.S., Cultural Anthropology Experience: 21 years in Environmental Planning, Project Management,
NEPA Compliance, CEQA Compliance, and Air Quality Assessment
Involvement: Project Management, NEPA Compliance, Document Preparation
5.2. Contributors – Resource Specialists
John (Bo) T. Baxter (TVA) Compliance Education: M.S. and B.S., Zoology Experience: 23 years in Protected Aquatic Species Monitoring, Habitat
Assessment, and Recovery; 14 years in Environmental Review
Involvement: Aquatic Ecology/Threatened and Endangered Species
Michael F. Broder (TVA) Education: M.S. and B.S., Agricultural Engineering Experience: 33 years in Agricultural and Environmental Engineering Involvement: Air Quality
W. Nannette Brodie, CPG (TVA) Education: B.S., Environmental Science; B.S., Geology Experience: 17 years in Environmental Analyses, Surface Water Quality,
and Groundwater Hydrology Evaluations Involvement: Geology/Groundwater
Elizabeth Carrie Burton (TVA)
Paradise Units 1 and 2
116 Final Environmental Assessment
Education: M.S., Wildlife; B.S., Biology Experience: 2.5 years in Biological Surveys, and Environmental Reviews Involvement: Terrestrial Ecology and Threatened and Endangered Species
Stephen C. Cole (TVA) Education: Ph.D., Anthropology; M.A., Anthropology; B.A., Anthropology Experience: 12 years in Cultural Resource Management, 4 years teaching
Anthropology at University Involvement: Cultural and Historic Resources
Patricia B. Cox (TVA) Education: Ph.D., Botany (Plant Taxonomy and Anatomy); M.S. and B.S.,
Biology Experience: 32 years in Plant Taxonomy; 9 years in Rare Species
Monitoring, Environmental Assessment, and NEPA Compliance
Involvement: Threatened and Endangered Species Compliance, Invasive Plant Species, and Terrestrial Ecology
Andrea Crooks (TVA) Education: M.S., Materials Engineering Experience: 22 years in Project Management, Environmental Evaluations, Involvement: Project Development, NEPA Review
Melvin B. Dean (TVA) Education: A.S., Civil Engineering Technology Experience: 32 years in Mapping and Geographic Information System
Work Involvement: Geographic Information System Mapping Support
Kevin Fowler, INCE (ARCADIS) Education: B.A. Acoustics Experience: 8 years in Power Plants and Industrial Noise Involvement: Noise QA/QC
Andrew Henderson (TVA) Education: M.S. Fisheries (Conservation), B.S. Fisheries Experience: 10 years in Aquatic Species Conservation Involvement: Aquatic Ecology/Threatened and Endangered Species
Charles S. Howard (TVA) Education: M.S., Zoology; B.S., Biology Experience: 20 years in Aquatic Ecology Research, Impact Assessment,
and Endangered Species Conservation. Involvement: Aquatic Ecology and Endangered Species
Holly G. LeGrand (TVA) Education: M.S., Wildlife; B.S., Biology Experience: 8 years in Biological Surveys, Natural Resource Management,
and Environmental Reviews Involvement: Terrestrial Ecology and Threatened and Endangered Species
Chapter 5 – List of Preparers
Final Environmental Assessment 117
Anita E. Masters (TVA) Education: M.S., Biology/Fisheries; B.S., Wildlife Management Experience: 27 years in Project Management, NEPA Compliance, and
Community and Watershed Biological Assessments Involvement: NEPA Compliance QA/QC
Joseph Melton, PE (TVA) Education: B.S. Environmental Science Experience: 12 years Energy Delivery NEPA Support/Environmental Field
Support Involvement: NEPA Support and Siting Alternatives
Loretta McNamee (ARCADIS) Education: B.S., Biology Experience: 5 years in NEPA Compliance Involvement: Contractor Assistant Project Management, NEPA Compliance,
Document Preparation
Roger A. Milstead (TVA) Education: B.S., Civil Engineering Experience: 36 years in Floodplain and Environmental Evaluations Involvement: Floodplains
Conrad Mulligan (ARCADIS) Education: M.S. Economics, Marine Policy Experience: 17 years in strategic and infrastructure project planning and
impact assessment Involvement: Socioeconomics and Environmental Justice
W. Chett Peebles, RLA, ASLA (TVA) Education: Bachelor of Landscape Architecture Experience: 24 years in Site Planning, Design, and Scenic Resource
Management; 7 years in Architectural History and Historic Preservation
Involvement: Visual Resources
Craig Phillips (TVA) Education: M.S. and B.S., Wildlife and Fisheries Science Experience: 6 years Sampling and Hydrologic Determinations for Streams
and Wet–Weather Conveyances; 5 years in Environmental Reviews
Involvement: Aquatic Ecology and Threatened and Endangered Species
Kim Pilarski–Hall (TVA) Education: M.S., Geography, Minor Ecology Experience: 17 years in Wetlands Assessment and Delineation Involvement: Wetlands
Kwok–Choi P. Lee (TVA) Education: Ph.D., Chemical Engineer
Paradise Units 1 and 2
118 Final Environmental Assessment
Experience: 6 years in QA/QC, Data Management, and Document Review/Development; 14 year in Biomass–to–Chemical R&D and Project Developments.
Involvement: Technical Word Processing, NEPA Document QA/QC
David W. Robinson (TVA) Education: B.S., Geology Experience: 26 years in Environmental Permitting and NEPA Involvement: Technical Development and NEPA Review
Daniel T. Tibbs (TVA) Education: B.S., Mechanical Engineering Experience: 19 years in Power Plant Engineering, Maintenance Planning,
Project Management, and Construction Management Involvement: Project Development and Conceptual Design
A. Chevales Williams (TVA) Education: B.S., Environmental (Chemical) Engineering Experience: 10 years in Water Quality Monitoring and Compliance; 8 years
in NEPA Planning and Environmental Services Involvement: Surface Water and Industrial Wastewater
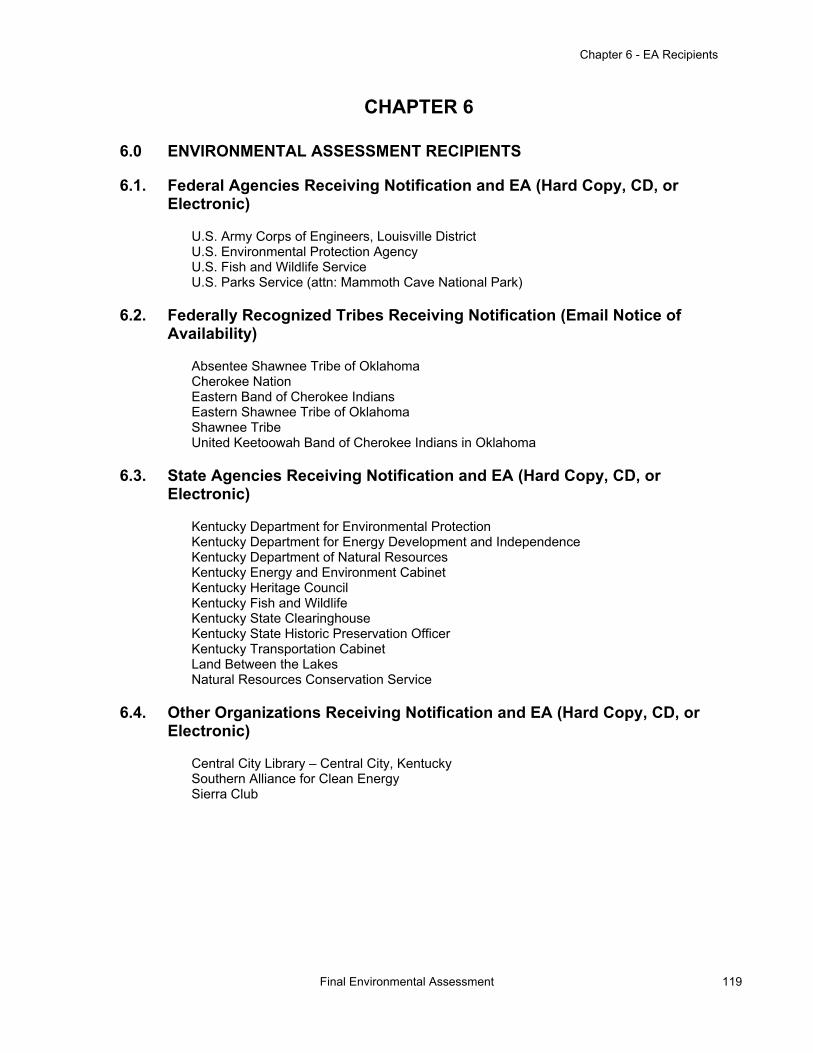
Chapter 6 - EA Recipients
Final Environmental Assessment 119
CHAPTER 6
6.0 ENVIRONMENTAL ASSESSMENT RECIPIENTS
6.1. Federal Agencies Receiving Notification and EA (Hard Copy, CD, or Electronic)
U.S. Army Corps of Engineers, Louisville District U.S. Environmental Protection Agency U.S. Fish and Wildlife Service U.S. Parks Service (attn: Mammoth Cave National Park)
6.2. Federally Recognized Tribes Receiving Notification (Email Notice of Availability)
Absentee Shawnee Tribe of Oklahoma Cherokee Nation Eastern Band of Cherokee Indians Eastern Shawnee Tribe of Oklahoma Shawnee Tribe United Keetoowah Band of Cherokee Indians in Oklahoma
6.3. State Agencies Receiving Notification and EA (Hard Copy, CD, or Electronic)
Kentucky Department for Environmental Protection Kentucky Department for Energy Development and Independence Kentucky Department of Natural Resources Kentucky Energy and Environment Cabinet Kentucky Heritage Council Kentucky Fish and Wildlife Kentucky State Clearinghouse Kentucky State Historic Preservation Officer Kentucky Transportation Cabinet Land Between the Lakes Natural Resources Conservation Service
6.4. Other Organizations Receiving Notification and EA (Hard Copy, CD, or Electronic)
Central City Library – Central City, Kentucky Southern Alliance for Clean Energy Sierra Club

Appendix A - NEPA Overview
Final Environmental Assessment 121
Appendix A - NEPA COMPLIANCE PROCESS OVERVIEW
The National Environmental Policy Act (NEPA) requires federal agencies, including the Tennessee Valley Authority (TVA), to consider the potential environmental impacts of actions they propose to take that will impact the physical environment before making a final decision to proceed. Specifically, NEPA requires the preparation of an Environmental Impact Statement (EIS) for a major action significantly impacting the quality of the human environment. The purpose of an EIS is to assess the potential environmental impacts of the proposed action and alert the federal agency decision maker and the public to those impacts before a final decision to proceed with the action is made. Regulations or procedures guide implementation of the statute.
TVA is subject to and complies with two sets of regulations or procedures that implement NEPA. These are the regulations promulgated by the Council on Environmental Quality (CEQ) at 40 C.F.R. parts 1500-1508 and TVA’s own NEPA procedures which supplement CEQ’s regulations. TVA’s NEPA procedures were adopted through a rulemaking process with public notice and opportunity for comment. TVA initially published its final NEPA procedures in the Federal Register in 1980 and later amended them after public notice and comment and republished them in the Federal Register in 1983. 48 Fed. Reg. 19,264 (Apr. 28, 1983). CEQ approved TVA’s initial and amended procedures. Internally, TVA’s “NEPA Interface” staff currently oversees TVA’s compliance with NEPA.
CEQ’s regulations and TVA’s NEPA procedures identify three levels of NEPA review. The most detailed and time-consuming level of review is an EIS. EISs are comprehensive, detailed documents often exceeding 300 pages exclusive of appendices and typically take 12 to 36 months or longer to complete. EIS processes provide opportunities for public comment, including a minimum mandatory 45-day comment period on draft EISs. Section 5.4 of TVA’s NEPA procedures provides that certain actions “normally” require an EIS including large water resource projects, major power generating facilities, and uranium mining and milling complexes. This refers to the construction of such facilities, not their continued operation. This section also requires the preparation of an EIS for “any major action, the environmental impact of which is expected to be highly controversial.” The controversy must be about the significance of environmental impacts, must have valid scientific underpinnings, and must be substantial. What is “substantial” requires consideration of the number of people raising legitimate environmental concerns in the context of the potentially affected population and whether other expert agencies have environmental concerns.
The lowest level of NEPA review applies to those actions determined to fall within one or more of the Categorical Exclusions (CEs) identified in TVA’s NEPA procedures. Section 5.2 of the procedures identifies 28 categories of actions that were predetermined during the rulemaking process normally to not result in significant environmental impacts and to not require an EIS. Neither CEQ’s regulations nor TVA’s procedures require that CEQ applicability determinations be documented. However, it is TVA’s practice to prepare a “Categorical Exclusion Checklist” to document its CE determinations for a number of its CEs. An opportunity for public comment on a CE is not required and TVA does not provide one.

Paradise Units 1 and 2
122 Final Environmental Assessment
The middle level of NEPA review is an Environmental Assessment (EA). EAs are more concise, less detailed documents than EISs, and can be as short as 10 to 15 pages. However, it is TVA’s practice to provide substantial information in its EAs, and TVA’s EAs often exceed 50 pages depending on the number of resources analyzed and the complexity of analyses. Neither CEQ’s regulations nor TVA’s NEPA procedures require public comment on draft EAs, but TVA normally provides a 30 day comment period. The purpose of an EA is to determine whether a proposed action that is not categorically excluded is a major action with significant impacts on the quality of the human environment. If it is, an EIS is required. If it is not, TVA concludes the EA process by issuing a Finding of No Significant Impact, allowing the TVA decision maker to decide whether to proceed with the action.
TVA prepared an EA for the emission control projects and associated facilities proposed at its Gallatin Fossil Plant. TVA released the draft EA to the public on October 17, 2012 and initially provided 30 days for comment. Notice of the availability of the EA was published in local newspapers and on TVA’s agency internet site. TVA extended the comment period by 14 days in response to requests from a number of individuals and environmental advocacy groups. TVA accepted comments from several environmental advocacy groups, including the Sierra Club, that were received after the close of the extended public comment period. TVA considered all substantive comments in the preparation of this EA.
The EA “tiers” from the “Final Environmental Impact Statement for TVA’s Integrated Resource Plan” (March 2011) (IRP EIS). Tiering is a process in CEQ’s regulations and TVA’s procedures that allows an agency to go from a broader NEPA review, typically an EIS, to a more site-specific NEPA review without readdressing the issues or repeating in detail the information and analyses in the broader review document. 40 C.F.R. §1508.28. TVA provided extensive opportunities for public participation during the preparation of the IRP EIS. These included public comment periods and webinars during which members of the public could ask questions about IRP analyses and make comments. TVA also assembled and regularly met with a group of interested individuals from a variety of organizations, including the Sierra Club and the Southern Alliance for Clean Energy, and provided them opportunities to review and comment on ongoing IRP analyses.
The IRP EIS contains analyses of the need for electricity from the TVA power system, different kinds of energy resources, and strategies for meeting projected future demand for electricity including continued operation or retirement of its coal-fired power plants, the addition of more renewable resources, and expanded use of energy efficiency programs. The IRP EIS summarizes TVA’s analyses of the environmental impacts of alternative strategies using different combinations of energy resources including air quality and solid waste impacts.

Appendix B - Agency Correspondence
Final Environmental Assessment 123
Appendix B – REGULATORY AGENCY CORRESPONDENCE
Paradise Units 1 and 2
124 Final Environmental Assessment

Appendix B - Agency Correspondence
Final Environmental Assessment 125

Paradise Units 1 and 2
126 Final Environmental Assessment
Appendix B - Agency Correspondence
Final Environmental Assessment 127

Paradise Units 1 and 2
128 Final Environmental Assessment
Appendix B - Agency Correspondence
Final Environmental Assessment 129

Paradise Units 1 and 2
130 Final Environmental Assessment
Appendix C - Response to Comments
Final Environmental Assessment 131
Appendix C - PUBLIC AND AGENCY COMMENTS RECEIVED ON DRAFT EA AND TVA’S RESPONSE TO COMMENTS
A. INTRODUCTION
A draft of this Final EA was released for comment on August 7, 2013; the comment period closed on September 9, 2013. The Draft EA was transmitted to state, federal, and local agencies and federally recognized tribes. It also was posted on TVA’s public NEPA review website. Notice of availability of the draft and the request for comments was published in newspapers serving the Paradise area. Email notifications of the availability of the Draft EA were sent to people who had previously requested notifications. TVA accepted comments through an electronic comment form on the project website, by mail, and by email.
TVA received 304 comments on the Draft EA; most of these favored Alternative B. About three-fourths of these comments were submitted through the web-based comment form. An additional 59 were form emails generated by the Kentucky Coal Association and the Count on Coal campaign. A few comments were received on subjects outside the scope of this EA, such as health insurance and pensions for retired miners. These are not included in this report. Many comments stated a general support for the continued use of coal to generate electricity; these were interpreted as supporting Alternative B, under which TVA would continue to generate electricity with the coal-fired Units 1 and 2. Comments were received from two federal agencies and no state agencies. A list of commenters and their affiliation is provided in Part C of this appendix. Comment letters from agencies are provided in Part D of this appendix.
TVA carefully reviewed all of the substantive comments that it received. Many of the individual comments were similar in substance. To avoid repetition, TVA grouped similar comments and produced one synthesized comment for each comment grouping. The commenters contributing to each synthesized comment are listed in Part B of this appendix. Because TVA tried to be careful and not lose comment nuances that were different, a number of synthesized comments still are similar and there is some overlap. The result of this analysis and synthesis process is the list of 84 individual comments to which TVA has provided responses in this appendix. This EA tiers from TVA’s 2011 Integrated Resource Plan (IRP) Environmental Impact Statement (EIS). For that EIS process, TVA provided numerous opportunities for public review and comment, including two written comment periods, five public meetings, and several webcasts during which participants could make comments and ask questions. TVA also established a review group consisting of various stakeholders including users and distributors of TVA electricity, state agencies, academia, the Department of Energy, and environmental advocacy groups (the Sierra Club and the Southern Alliance for Clean Energy). This review group met frequently throughout the IRP process with TVA staff preparing the IRP and EIS and provided comments on TVA’s analyses and results on an ongoing basis. Volume 2 of the IRP EIS contains the comments TVA received and TVA’s responses to them. The IRP EIS can be found at http://www.tva.com/environment/reports/irp/index.htm. The planning direction implemented through the IRP process anticipated the continued operation of PAF Units 1 and 2.
Paradise Units 1 and 2
132 Final Environmental Assessment
B. RESPONSES TO COMMENTS Air Quality Greenhouse Gases 1. The Draft EA fails to adequately analyze the climate change impacts of the two action alternatives, and particularly for Alternative B. Alternative B would lock in continued emissions of 9.5 million tons per year, with adverse impacts including losses to the cryosphere, rapid sea level rise, more extreme weather events, imperiled biodiversity, harm to the oceans, injury to human health, and reduced food security. The Draft EA does not analyze these or other incremental and cumulative impacts from the CO2 emissions. Nor does it describe how the proposed action would help achieve the President's recent commitments to reduce national CO2 emissions by 17% from 2005 levels by 2020. (Commenter: Angela Garrone) Response: Section 3.2.2 of the Final EA states that Alternative B would, in effect, lock in the current CO2 emissions from Paradise Units 1 and 2 for many years, and the adverse effects of these GHG emissions would continue. GHG emissions from Units 1 and 2 comprise a very small proportion of U.S. and global GHG emissions, and it is not possible to accurately describe their incremental environmental impacts. However, the cumulative impact of TVA's fleet-wide GHG emissions was assessed in the 2011 IRP EIS (see IRP EIS Section 7.6.2). This EA tiers off the 2011 IRP EIS. Programmatic impact statements, such as the IRP EIS, are particularly well suited for the assessment of cumulative impacts because they take into account the impact of a group of actions related to a program. TVA is aggressively reducing its system-wide GHG emissions as outlined in the 2011 IRP. Between 2005 and 2012, annual CO2 emissions decreased from 105 million tons to 84 million tons. This 20% decrease exceeds the cited President’s goal of a 17% decrease from 2005 to 2020. As described in the 2011 IRP, TVA anticipates further reductions in CO2 emissions from additional coal plant retirements, and increased generation from nuclear plants, renewable, and other lower GHG emitting sources. TVA's direct CO2 emissions would be reduced from 2011 levels by averages (of the various scenarios assessed in the IRP) of at least 25 percent by 2020 and 23 percent by 2028. 2. We can agree that CO2 emissions from gas-fired facilities are less than coal plants. However, CO2 is not the only greenhouse gas. In fact methane, which can be emitted at every level of natural gas usage from drilling, storage, transportation, and burning, has about 23 times the effect of trapping heat in our atmosphere. (Commenter: Jim Gooch) Response: Comment noted. TVA agrees that the relative heat-trapping ability or global warming potential of methane is much higher than that of CO2. Both Alternative B and Alternative C would result in the emission of methane from actions associated with providing fuel to the facilities. Under Alternative B, methane would be emitted during the mining of coal. Under Alternative C, methane would be emitted during the extraction, processing, storage, and transportation of natural gas. The volumes of these methane emissions vary depending on the type of fuel, extraction method, and other factors, and calculating them for a particular facility is difficult. Available life cycle analyses show lower overall greenhouse gas emissions, standardized to account for differing global warming potentials, for natural gas-fueled power plants than for coal-fired plants. For natural gas-fueled combined cycle plants, this difference is significant. Alternatives
Appendix C - Response to Comments
Final Environmental Assessment 133
Range of Alternatives 3. The Draft EA is deficient because it fails to evaluate the alternative of retrofitting one Paradise unit while retiring the other. This alternative would enable TVA to pursue a smaller amount of replacement energy and capacity, with less transmission grid additions and upgrades. The resulting environmental impacts would be considerably less than that of the retrofitting of both Units 1 and 2 under Alternative B. Given that the Draft EA does not state the amount of generating capacity that must be maintained in this part of the TVA system, a one unit retrofit alternative could be viable. (Commenter: Angela Garrone) Response: As described in the response to Comment 16, TVA determined that a minimum of about 800 MW of local generation is necessary to meet North American Electric Reliability Corporation (NERC) TPL standards. A one-unit retrofit fails to meet this minimum. NERC standards also require the maintenance of transmission system performance following the loss of bulk electric system elements (NERC Standards TPL 001-004). To comply with these rules, TVA plans to install a new 500-kV transmission line connecting to PAF. This line will be installed regardless of which alternative is selected for implementation. The construction and operation of this transmission line is outside the scope of this EA and will be the subject of a separate future EA or environmental impact statement. Should TVA retrofit only one unit and retire the other, TVA would have to construct considerably more transmission line capacity to meet NERC standards than would be necessary with the retrofit of both units or with equivalent generation from multiple gas-fueled units. The feasibility of meeting the power system need by construction of additional transmission line capacity to ensure required reliability is discussed in Final EA Section 2.3.3 and in responses to other comments in this appendix. Biological Resources Impacts on Fish and Wildlife 4. The EA should address the following:
1. Potential impacts of the project on aquatic resources as a result of reduced water temperatures, base flow, etc. 2. Potential dissolved oxygen fluctuations that might occur. 3. Potential impacts upon aquatic and terrestrial resources near the site, which might occur if fluctuations in water discharges and velocities are altered from existing conditions. 4. Potential impacts upon fish- and wildlife-related recreational activities. 5. Potential impacts upon fish and wildlife as a result of impingement on screens or entrainment in turbine systems. 6. Potential impacts upon upstream and downstream mobility of aquatic organisms, including fish. 7. Potential impacts upon existing or proposed fishing access facilities such as parking lots, walkways, and riprap structures. 8. Potential impacts upon fish and wildlife resources resulting from transmission corridor alignment and the project's footprint. (Commenters: Virgil Lee Andrews, Jr.)
Response: These potential impacts are evaluated in Section 3.3, 3.4, 3.6, and 3.8 of the EA. Under Alternative B, project construction activities would occur on a heavily disturbed site and there would be little impact on wildlife and no impact on fish- and wildlife-oriented recreational
Paradise Units 1 and 2
134 Final Environmental Assessment
activities. Changes in water intake, flow, and discharge rates, temperatures, and dissolved oxygen would be negligible and not noticeably affect aquatic resources. Under Alternative C, impacts to wildlife would likely be insignificant and the gas pipeline would be routed to minimize impacts to forested habitats and the nearby wildlife management areas. Pipeline routing would take potential natural resource impacts into consideration, and appropriate coordination with Federal and State resource management agencies would occur during the siting and permitting process. Impacts to aquatic resources would be beneficial due to the large reduction in water withdrawals and thermal discharges. Comments on Alternatives Prefer Alternative B 5. I support the retrofit of the Paradise Fossil Plant Units 1 and 2 as proposed in Alternative B. (Commenters: William Adams, Danny Adkins, Charles Anderson, Alan Ashley, Rick Ayers, Darrell W. Basham, Lena Brown, James Bullard, Robert Campbell, Todd Capps, Crystal Carlton, Paul Caudill, James Charles, Paris Charles, Bob Chiles , Jay Clark, Troy Clark , Franke Clemente, Paul Clouse, Darrel Cobb, Leann Coin, Gary Compton, Marvin Crowley, Marshall Curry, Jasie Curtis, Bill Davis, Tim Dean, Toby Dehay, Gayle Dingus, Pamm Dotson, Jim Durham, Shaun Dyer, Rocky East, Eric Elms, Kellie Eubanks, Eugene D. Ferrell, Ron Frazier, Mark Fredrick , Jim Gooch, Cathy Gregory, Marie Hargis, T. Hargis, Randy Harlan , Ashley Harris, Bryan Hayes, Ricky Hibbs, David Holt , Fred Howard, Brittiany Hudson , Bobby Isaac, Rodney James, Beth Johnson , Kyle Johnson, Rob Johnson, Donald Jones, Casey Larkins, Marsha Lovern, Alan Lutz, Bill Maggard , Vena Maggard, Debra Markwell, Dave McCarthy, Donald McElheny, Albon Meade, Craig Melton, Hilda Meredith, Robert Morris, Anthony Mullins, James Mullins, Perry Mullins, Judith O'Bryan, Teresa O'Daniel, Jim Oliver, Charles D. Payne, David Prewitt, John Reed, Beverly Reynolds, Vicki Rice, Jerrell Rich, Allan Robinson, Burnie Rose, Kenny Runyon, Vicki Sammons, Kenneth Schmidt, Charles Short, Delpher Short, Steven Short, Edward Sisk, Jarrid Slone, Ronnie Smith, Gary Southerland, Shiela Spears, David Stanley, Jessica and Justin Stanley, Lee Allen Stinnett, Lisa Stinson, Scotty Stone, Shannon Stone, Donald Sublett, Danny Thorp, Debbie Tompkins, Stephanie Townsell, Kelli Tucker, Daniel Tao, Duane Taylor, Jess Tobinson, Elizabeth Valenzuela, Steve Vance, Dennis Vaughn, Brenda Walker, Lynn Walker, Jr., Tommy & Anita Wilkerson, Debbie Wilson, Ronald Wilson, James Wiseman, James Wolff, David Woods, Robert Yerkes, Tina Yesh , Brent Yonts) Response: Comment noted. 6. Paradise Units 1 and 2 have proven to provide TVA with a reliable power supply, as evidenced by the Unit 2 record of 259 days of continuous operation, the industry record for cyclone-fired boilers. This surpasses the Unit 1 record of 255 days of continuous operation. (Commenter: Robert E. Murray, Gary Southerland) Response: Comment noted. The operating record of Units 1 and 2 is one of the factors considered by TVA in deciding which alternative to implement. 7. The MATS rules have been described as the most expensive that EPA has ever imposed on the electric industry. The installation of the PJFF systems under Alternative B would result in full compliance with MATS while continuing to provide the dispatchable power (as described in Draft EA Section 2.3.5) necessary to meet energy or
Appendix C - Response to Comments
Final Environmental Assessment 135
transmission support needs and helping TVA maintain a balanced portfolio of energy sources. (Commenters: Jim Gooch, Robert E. Murray, Charles D. Payne) Response: Comment noted. 8. TVA should follow the precedent it set by committing to install emission controls at its Gallatin Fossil Plant and decide to retrofit Paradise Units 1 and 2 for continued coal use. (Commenters: William Adams, Danny Adkins, Charles Anderson, Alan Ashley, Rick Ayers, Darrell W. Basham, Tony Bowling, Lena Brown, James Bullard, Robert Campbell, Paul Caudill, James Charles, Paris Charles, Gary Compton, Marvin Crowley, Jasie Curtis, Bill Davis, Tim Dean, Gayle Dingus, Pamm Dotson, Jim Durham, Shaun Dyer, Rocky East, Kellie Eubanks, Eugene D. Ferrell, Ron Frazier, Cathy Gregory, Randy Harlan , Ashley Harris, Bryan Hayes, Fred Howard, Rodney James, Kyle Johnson, Marsha Lovern, Alan Lutz, Bill Maggard, Vena Maggard, Dave McCarthy, Donald McElheny, Albon Meade, Craig Melton, Anthony Mullins, Perry Mullins, Robert E. Murray, Judith O'Bryan, Teresa O'Daniel, Jim Oliver, David Prewitt, Beverly Reynolds, Vicki Rice, Allan Robinson, Burnie Rose, Kenneth Schmidt, Jarrid Slone, Ronnie Smith, Daniel Tao, Duane Taylor, Jess Tobinson, Debbie Wilson, James Wolff, Robert Yerkes) Response: Comment noted. Each of TVA's coal-fired power plants has unique characteristics. Therefore the optimal long-range plan for one plant, such as Gallatin, may not be optimal for other plants. Cost of Power Fuel Cost Predictability 9. While the cost of natural gas is relatively low at present, it has historically been much more volatile than the cost of coal. Increased reliance on natural gas exposes TVA customers to a less predictable and likely higher cost of power. (Commenters: William Adams, Danny Adkins, Charles Anderson, Anthony Arnold, Alan Ashley, Rick Ayers, Darrell W. Basham, Lena Brown, James Bullard, Robert Campbell, Paul Caudill, James Charles, Paris Charles, Franke Clemente, Gary Compton, Marvin Crowley, Jasie Curtis, Bill Davis, Tim Dean, Gayle Dingus, Pamm Dotson, Jim Durham, Shaun Dyer, Rocky East, Kellie Eubanks, Eugene D. Ferrell, Ron Frazier, Jim Gooch, Cathy Gregory, T Hargis, Randy Harlan , Ashley Harris, Bryan Hayes, Fred Howard, Rodney James, Kyle Johnson, Marsha Lovern, Alan Lutz, Bill Maggard , Vena Maggard, Dave McCarthy, Donald McElheny, Albon Meade, Craig Melton, Anthony Mullins, Perry Mullins, Robert E. Murray, Judith O'Bryan, Teresa O'Daniel, Jim Oliver, David Prewitt, Beverly Reynolds, Jerry P. Rhoads, Vicki Rice, Allan Robinson, Burnie Rose, Kenneth Schmidt, Jarrid Slone, Ronnie Smith, Daniel Tao, Duane Taylor, Jess Tobinson, Debbie Wilson, James Wolff, Robert Yerkes, Brent Yonts) Response: Comment noted. Fuel price predictability is a very important factor considered by TVA in deciding which alternative to implement. Economic Development Impact to Local Economy
Paradise Units 1 and 2
136 Final Environmental Assessment
10. I advocate continued use of coal as this supports economic stability for the region. (Commenters: Holly Adams, Matt Adams, Jason Adamson, Dwight Allen, Matt Allen, Anonymous, Kenneth Ashby , Charlie Barber, Sonnie Bird, Percy Blake , William Bogar, Carl Boone , Cathy Bretz, John Bretz, Bob Bridges, Terry Brinkley, Rick Brothers, Buffie Brown, Matt Brown , Robert Brown , Fay Burden, Seth Burns, Connie Butler, Ronnie Butler, Mark Campbell, Mike Carlisle, Rex Chillds, Daryl Cobb, Staci Collinsworth, Loretta Curry, Jim Davis , Ronnie Drake Jr, Nicole Dunlap, Brenda East , Jason Ellis, C. B. Embry, Jr., James Faber, Max Farthing, Kevin Faughender, Ciccero Ford, Elisha French, Barbara Gentry, Andrew Goderwis, Eddie Gooch, Michael Gooch, Donald Graham, Kyle Green, Rita Groves, Donnie Guess , James Hackney, Robert Hackney, Glendale Hardison , Penny Hardison, John Harris, Christy Hayes, Bill Henderson, Charles Henderson, Molly Henderson, Wilma Henderson , Billy Herring , Janis Hill, Kendra Hook, Brent Huddleston, Helen Hunt, Sharon Iliohan, Elizabeth James, Danny Johnson, Chris Jones , Elon Jones, JIm Kacmar, Tim Kathalynas, Darren Kelley , Danny Key , Dave King, Jeff Kirby, Charles Kistner, Wayne Kittinger, Cindy Knight , Eddy Knight , Lori Lear, Doug Leasure, Chance Littlepage, Amber Long, Anthony Marsh , Billy Mason , Jeremy McClain, Mark McDowell, Brandy McLemore, Abby Mitchell, Angela Mitchell, Brian Mitchell, Everett Mitchell, Jenna Molnar , Kenya Morris, William Morse , Donna Mortvitz , Eugene & Teresa Mullins, Myrtle Murray, Carla Noe, Jan Offutt, Larry Offutt, Myra Offutt, Marci Oldham, Craig Parker, Jeff Patterson, Jimmy Pendley, Kathy Peyton , Brent Pigg, Tifffany Powell, Jarred Prowell, Kayla Prowell, Lindsey Prowell, Caroll Reynolds, Michael Ricci , Jamie Rolley, Kevin Ron, Ashton Rowley, John Rowley, Earl Schalk, Cassie Schneider, Allen Shelton, Jonathan Short, Eddie Simpson, Dana Sisk, Debbie Smith, Heather Smith, John Smith, Gary Southerland, Justin Stanley, Deborah Stiltner, Lee Allen Stinnett, Lisa Stinson, Scotty Stone, Donald Sublett, Palestine Thomas, Bob Utley, Brenda Walker, Tony Watkins, Patricia Webb-Arnett, Eric Wells , Richard Wells, Yvonne Whitfield, Lonnie Wilder, Tommy & Anita Wilkerson, Chris Williams , Maurcie Wilson, Randy Winn, Donna Woodcock, Tina Yesh , Salena Young) Response: Comment noted. Economic Impacts Economic Impact Analysis 11. Section 3.19 of the Draft EA considers the impacts of the alternatives on the Paradise labor market counties. It does not mention the negative effect each alternative would have on both the labor market counties and on the State of Kentucky. Alternative C would result in significant reductions in direct and indirect employment generated by coal in Kentucky. We urge TVA to consider this severe negative impact is its selection of the alternative for meeting the MATS standards. (Commenters: William Adams, Danny Adkins, Charles Anderson, Alan Ashley, Rick Ayers, Darrell W. Basham, Lena Brown, James Bullard, Robert Campbell, Paul Caudill, James Charles, Paris Charles, Gary Compton, Marvin Crowley, Jasie Curtis, Bill Davis, Tim Dean, Gayle Dingus, Pamm Dotson, Jim Durham, Shaun Dyer, Rocky East, Kellie Eubanks, Eugene D. Ferrell, Ron Frazier, Cathy Gregory, Randy Harlan , Ashley Harris, Bryan Hayes, Fred Howard, Rodney James, Kyle Johnson, Marsha Lovern, Alan Lutz, Bill Maggard , Vena Maggard, Dave McCarthy, Donald McElheny, Albon Meade, Craig Melton, Anthony Mullins, Perry Mullins, Judith O'Bryan, Teresa O'Daniel, Jim Oliver, David Prewitt, Beverly Reynolds, Vicki Rice, Allan Robinson, Burnie Rose, Kenneth Schmidt, Jarrid Slone, Ronnie Smith, Daniel Tao, Duane Taylor, Jess Tobinson, Debbie Wilson, James Wolff, Robert Yerkes)
Appendix C - Response to Comments
Final Environmental Assessment 137
Response: Section 3.19 of the Final EA has been revised to better describe the impacts of the alternatives on the regional labor market and employment. 12. The continued operation of Paradise Units 1 and 2 is very important to the economy of Kentucky. Direct and indirect employment generated by coal in Kentucky provides 89,350 jobs for a combined payroll of $5.5 billion. Paradise provides low-cost, coal-fueled electricity to 950,000 homes and businesses near the plant. Switching Units 1 and 2 to a combined cycle gas facility would negatively impact thousands of coal mining jobs in Kentucky. (Commenters: William Adams, Danny Adkins, Charles Anderson, Alan Ashley, Michele Austin, Rick Ayers, Melissa Ball , Darrell W. Basham, Percy Blake , Marianne Blanchard, Donna Brown , Lena Brown, James Bullard, Ronnie Butler, Robert Campbell, Paul Carlton, Tracy Carlton, Paul Caudill, James Charles, Paris Charles, Gary Compton, Fred Couch, Ronnie Cox , Olivia Crawford, Houston Crick, Marvin Crowley, Darel Curry, Jasie Curtis, Bill Davis, Tim Dean, Gayle Dingus, Pamm Dotson, Jim Durham, Shaun Dyer, Mark Earl, Rocky East, John Enyart, Kellie Eubanks, Eugene D. Ferrell, David Fitzpatrick, Robert Flynn , Carolyn Foster, Ron Frazier, Cathy Gregory, Randy Harlan , Ashley Harris, Bryan Hayes, Fred Howard, Bobby Isaac, Rodney James, Kyle Johnson, Marsha Lovern, Alan Lutz, Bill Maggard , Vena Maggard, Dave McCarthy, Donald McElheny, Albon Meade, Craig Melton, Anthony Mullins, Perry Mullins, Judith O'Bryan, Teresa O'Daniel, Jim Oliver, David Prewitt, Beverly Reynolds, Vicki Rice, Allan Robinson, Burnie Rose, Kenneth Schmidt, Jarrid Slone, Ronnie Smith, Daniel Tao, Duane Taylor, Jess Tobinson, Chris Williams, Debbie Wilson, Michael Wilson , James Wolff, Nick Woolton , Robert Yerkes) Response: Comment noted. Under both Alternatives B and C, Paradise Fossil Plant would continue to provide low-cost, reliable electricity to the region. Section 3.19 of the Final EA has been revised to better describe the impacts of the alternatives on coal-related employment in the region. In-Lieu of Tax Payments 13. Paradise Fossil Plant produces in excess of $13 million in-lieu-of-tax dollars for the Muhlenberg County government and school system. Alternative B would preserve this important source of revenue. (Commenters: Jerry P. Rhoads, Brent Yonts) Response: Comment noted. The Final EA has been revised to include a comparison of in-lieu-of-tax payments under the various alternatives. Endangered & Threatened Species Impact Analysis and Section 7 Consultation 14. The US Fish and Wildlife Service concurs with TVA's determination that Alternatives B and C would not likely adversely affect the gray bat, fanshell, purple cat's paw and rough pigtoe. The Service also agrees that pipeline construction under Alternative C could affect Indiana bats, and acknowledges TVA's commitment to consult with the Service on this impact and ensure that the action would fully comply with Section 7 of the Endangered Species Act. (Commenters: Virgil Lee Andrews, Jr.)

Paradise Units 1 and 2
138 Final Environmental Assessment
Response: Comment noted. Should TVA select Alternative C for implementation, TVA will consult with the Service on the potential impacts to Indiana bats. Fuel Supply Source of Fuel 15. The continued use of domestic coal is important to reduce dependence on foreign sources of fuels. (Commenters: Rob Gatlin, Marie Hargis, Dennis Johnson, Scott Rodgers, James Summers) Response: Comment noted. Under both Alternative B - retrofitting the coal-fired Units 1 and 2, and Alternative C - replacing the coal-fired units with a natural gas-fired plant, the fuels are likely to come from domestic sources for the foreseeable future. Need for Power Adequacy of Analysis 16. The purpose and need stated in the Draft EA is to “comply with MATS while maintaining reliable generating capacity in the PAF service territory” in order to maintain 'an adequate and reliable power supply to the north-central portion of TVA's service area.' The amount of generating capacity that must be maintained in the area, however, is not stated. Based on the alternatives presented, it is presumably 1,000 MW, the size of the Alternative C gas plant. By not stating the level of energy and capacity needed in PAF Units 1 and 2 were retired, it is not possible to determine whether smaller amounts of new replacement generation would meet the purpose and need with potentially lower costs and reduced environmental impacts. This omission is especially problematic given TVA's recent public announcement about lower energy demand forecasts and the loss of the large USEC facility demand from the same part of the PAF service territory. (Commenter: Angela Garrone) Response: TVA evaluated the amount of replacement generation necessary to meet the purpose and need if PAF Units 1 and 2 were retired. Based on NERC transmission planning (TPL) reliability standards, current demand, and projected load growth, TVA determined a minimum of about 800 MW of local generation is required. For at least the next few years, this generation would likely be operated in a cycling mode as described in Final EA Section 3.1. Although the closure of the large USEC facility has reduced TVA’s overall power demand, this reduction does not overcome the critical need for local generation at PAF due to the distance of USEC from PAF (over 100 miles) and the configuration of the transmission line connections between USEC and PAF. As stated in the response to Comment 3 above, should TVA decide to implement Alternative B, TVA would still need to upgrade both Units 1 and 2, despite the fact that the capacity of each of these units approaches 800 MW. NEPA Compliance/Adequacy NEPA Requirements 17. Another set of studies, analyses, or assumptions cited in the Draft EA for which no supporting documentation is provided is on the proposed ash and scrubber waste landfills. No information is provided on how they will be built, whether they will maintain
Appendix C - Response to Comments
Final Environmental Assessment 139
structural integrity, the adequacy of their leak detection and prevention systems, and related waste management questions. (Commenter: Angela Garrone) Response: As described in Sections 2.2.1.2 and 3.14 of the Final EA, under Alternative B TVA would wet-sluice the fly ash collected by the PJFFs to the existing on-site fly ash pond. TVA does not propose to construct and operate new ash or scrubber waste landfills as part of the proposed action and doing so in a timeframe that would support the MATS deadline would be difficult. As part of its long-term system-wide initiative for dry handling and storage of CCRs, TVA will convert wet CCR facilities to dry operations or close them and replace them with new dry handling and storage facilities. In developing the conversion schedule for the various coal plants, TVA considered the risk posed by the existing wet facilities. The plants with the highest risk were prioritized for conversion within the first 5 years. The PAF CCR facilities did not rank among those with the highest risk and will not be converted until after the proposed facilities are constructed and operating. See Section 2.3.7 of the Final EA for more information on alternatives to management of the fly ash collected by the Alternative B PJFF facilities. 18. The Draft EA also fails to provide supporting documentation for the transmission system studies referenced in Section 2.3.3 and other studies evaluating the transmission grid reliability impacts of retiring Units 1 and/or 2 or of the transmission grid additions or upgrades purportedly needed to allow for such unit requirements. (Commenter: Angela Garrone) Response: The pertinent results of these studies are included in Section 2.3.3 and other parts of the Final EA. 19. The Draft EA cites several studies, analyses, and assumptions for which no supporting documentation is provided. TVA must ensure that all relevant information on the costs of retrofitting and extending the life of each of Units 1 and 2, and the natural gas plant proposed in Alternative C is available for public review before preparing the EIS or a revised Draft EA. The costs should include capital costs, operating, maintenance and fuel costs, and a net present value for retrofitting versus retiring each of Units 1 and 2. (Commenter: Angela Garrone) Response: The Final EA compares the relative costs of the two action alternatives. While the costs of implementing the alternatives is an important factor in the decision-making, a provision in the Council of Environmental Quality’s (CEQ) regulations applying to impact statements cautions that “the merits and drawbacks of the various alternatives need not be displayed in a monetary cost benefit analysis and should not be when there are important qualitative considerations.” (40 CFR § 1502.23). For the proposed Paradise project, the important qualitative considerations in the decision-making include TVA’s obligations to: 1) meet the compliance deadlines in EPA’s MATS regulations in a timely manner, 2) adhere to the requirements in current and anticipated North American Reliability Council (NERC) regulations, and 3) provide reliable generation to its customers in the impacted region. The impending MATS deadlines constitute one consideration compelling TVA to adopt an alternative that is less economically attractive than might have been possible had the EPA provided more time to comply with the MACT regulations. Similarly, TVA anticipated changes to the NERC regulations may limit opportunities for cost reduction than might otherwise be the case. Likewise, the need to provide reliable generation in the area discourages the option of simply retiring the units without supplanting the lost generation. Without Units 1 and 2, or an
Paradise Units 1 and 2
140 Final Environmental Assessment
equivalent power source, TVA would not be able to reliably and safely serve area loads and also not be able to meet NERC reliability standards. TVA remains committed to providing low cost power to its customers. To this end, TVA has considered potential costs in comparison to benefits in planning future generation, as it did in preparing the 2011 IRP and associated EIS, from which this EA tiers. 20. The Draft EA does not include sufficient supporting studies or reports on the feasibility, availability, and/or cost of energy efficiency or renewable resources as part of an alternative to retrofitting and extending the life of Units 1 and/or 2. (Commenter: Angela Garrone) Response: As described in Sections 2.3.4 and 2.3.5 of the Final EA, TVA considered using energy efficiency and/or renewable resources as an alternative to the proposed action. While TVA remains committed to increasing energy efficiency throughout is service area, TVA has no assurances that an adequate amount of increased energy efficiency could be implemented in the area served by PAF Units 1 and 2 by the MATS compliance deadline. Similar timing and geographic area concerns apply to the use of renewable resources. Renewable energy resources would also be non-dispatchable and thus not provide TVA system operators the same ability to control their generation that would be provided by Alternative B or Alternative C. 21. The Draft EA is inadequate in that it dismisses energy alternatives, other than retrofitting Units 1 and 2 and replacing them with an on-site gas plant, from rigorous evaluation. These other energy alternatives include purchasing energy from existing sources such as the available and relatively close Wilson and Coleman plants or natural gas plants, transmission upgrades and other measures for addressing reliability such as demand response programs and/or converting PAF units into synchronous condensers, energy efficiency, and renewable resources. The Draft EA also fails to address combinations of these alternatives. (Commenter: Angela Garrone) Response: Big River Electric Cooperative’s Wilson plant and Louisville Gas & Electric/Kentucky Utilities’ Green River plants are 15-20 miles from Paradise. Purchasing power from either of these plants, or from natural gas plants, would require the construction of multiple long radial 161-kV transmission line connections to PAF. LGE/KU has announced the retirement of the Green River plant due to MATS compliance requirements, and it is questionable whether installing the necessary air pollution control equipment on this plant or on the Wilson Plant to meet MATS requirements would ultimately result in a lower cost supply of power to TVA. TVA evaluated converting PAF units into synchronous condensers consistent with the NERC TPL standards mentioned above. This option would not, by itself, eliminate the equipment overloads resulting from the loss of generating capacity currently supplied by PAF Units 1 and 2. Extensive transmission system upgrades would still be required. Other potential alternatives mentioned in the comment are discussed in Final EA Section 2.3. Based on the analyses of all the potential alternatives, including combinations of alternatives, TVA determined that none of them would provide the necessary dispatchable generation at a reasonable cost and reasonable time schedule. 22. The Purpose and Need identified in the Draft EA skews the analysis against alternatives that involve retiring and replacing Paradise Units 1 and 2. The Purpose and Need is stated as 'to comply with MATS while maintaining reliable generating capacity in the PAF service territory' in order to maintain 'an adequate and reliable power supply in the north-central portion of TVA's service area.' This should allow for a wide range of
Appendix C - Response to Comments
Final Environmental Assessment 141
alternatives, but these are restricted by the stated additional project goals that skew the analysis in favor of retrofitting Units 1 and 2. These goals include 'maximizing the use of existing TVA facilities' and 'minimizing construction of new transmission system components and upgrades of existing transmission system components.' (Commenter: Angela Garrone) Response: TVA disagrees with this assertion. The Purpose and Need, as well as the additional project goals, are in line with TVA's mission and vision of providing reliable, affordable electricity while being one of the nation's leading providers of low-cost and cleaner energy. Maximizing use of existing assets and minimizing transmission costs are vital to the overall goal of providing a reliable supply of electricity at affordable cost. Scope of Impact Assessment 23. A second future environmental regulation that the Draft EA fails to adequately consider is the pending standards addressing carbon pollution from modified, reconstructed, and existing power plants. The proposed standards are to be issued by June 1, 2014. The Final EA should address how these standards will affect the continued operation of Units 1 and 2 under Alternative B. (Commenter: Angela Garrone) Response: TVA considers the potential impacts of future regulations, such as those regulating carbon emissions from electric generating units (EGUs), in all decisions related to the generating fleet. However, it is premature to attempt to speculate what EPA might require for existing sources if it chooses to propose Emission Guidelines under Section 111(d) of the CAA. Any such proposal is at least a year away, and EPA has advised the regulated community not to infer from the recently proposed standards for CO2 emissions from new EGUs what might be included in a proposal for existing EGUs. The EPA Administrator indicated in public announcements at the time of the proposed standards for new EGUs that a future Emission Guideline for existing EGUs would not require installation of carbon capture and storage. The promulgation of any such Emission Guideline is the first step in the scheme outlined in CAA Section 111(d) as States are then required to adopt that guideline (or an equivalent guideline) in their State Implementation Plans (SIPs). Emission guidelines adopted in State SIPs would take into account the cost of measures deemed to best reduce emissions of CO2, considering the remaining use life of existing EGUs. Accordingly, TVA does not believe that requirements under a future Section 111(d) program would be so prohibitive as to jeopardize the continued operation of PAF Units 1 and 2 under Alternative B. 24. A third pending regulation that is not adequately addressed in the Draft EA is how coal ash will be regulated under the Resource Conservation and Recovery Act. Should EPA choose to regulate coal ash as a special waste, the existing ash storage facilities at Paradise, including those designated for disposal of the ash captured by Alternative B pollution controls, will be phased out. Should EPA regulate coal ash as a non-hazardous waste, the unlined ash impoundments will have to be lined. (Commenter: Angela Garrone) Response: EPA issued a proposed rule on June 21, 2010 for the handling and disposal of coal combustion residuals (CCR). Subsequently, EPA issued Notices of Data Availability in 2010 and 2013 that provided additional information on the CCR proposal. On June 7, 2013, EPA issued a proposed rule relating to the Effluent Limitations Guidelines (ELG) for the Steam Electric Power Generating category; this prompted EPA to seek comments on the potential
Paradise Units 1 and 2
142 Final Environmental Assessment
alignment of the proposed CCR rule and the proposed ELG. Thus, the development of a CCR rule is uncertain, making it difficult to predict the shape, form or criteria of any such future rule. As stated in Section 1.4 of the Final EA, TVA‘s own systemwide initiative for managing CCR has been considered in the assessment of the current proposed action. The TVA Board passed a resolution in 2009 to end wet management of CCR including fly ash and scrubber waste in a phased manner. The goal of that resolution is to modernize TVA’s facilities so that they are the safest and most thoroughly inspected impoundments in the industry. TVA subsequently developed a CCR management plan to convert TVA‘s wet CCR facilities to dry operations (TVA 2009a), based on a conversion schedule that considers the risk posed by the existing wet facilities. Because of their lower risk profile, PAF’s CCR ponds will be converted sometime after the PJFFs would installed under Alternative B. The CCR management plan is being implemented through individual projects at TVA’s fossil plants subject to applicable NEPA reviews. For PAF, CCR would continue to be wet sluiced until equipment and facilities for dry handling and storage of CCR and closure plans for the surface impoundments were designed and implemented. TVA will conduct the necessary environmental reviews during the planning of these future actions. These future actions to convert the wet CCR facilities at PAF would advance the goal of complying with a CCR rule finalized by EPA in the future. 25. The Draft EA fails to adequately consider the impacts of future environmental regulations on the continued operation of Units 1 and 2 under Alternative B. One of these is the replacement for the vacated Cross State Air Pollution Rule, which will require strict controls on emissions of SO2 and NOx in Kentucky. The replacement rule is expected to be at least as stringent as the vacated rule. (Commenter: Angela Garrone) Response: TVA considers the potential impacts of future regulations such as CSAPR in all decisions related to the generating fleet, including the current proposed action. TVA disagrees with the commenter’s assertion that CSAPR or its replacement will require additional controls on the units at PAF. All three units are currently equipped with wet FGD and SCR systems to reduce emissions of SO2 and NOx. TVA does not expect that further air pollution controls would be necessary at PAF to meet requirements under a future transport rule to implement the National Ambient Air Quality Standards. 26. The proposed action requires the preparation of an environmental impact statement because it is a 'major Federal action significantly affecting the human environment,' as stated in Council of Environmental Quality regulations for implementing the National Environmental Policy Act. The continued operation of Units 1 and 2 under Alternative B would produce significant amounts of air and water pollution and coal combustion waste. These pollutants include millions of tons of regulated air pollutants, including carbon dioxide, air toxins, and more than a dozen toxic metal water pollutants. The approximately 1.5 million cubic yards of coal combustion waste produced annually contains numerous toxins. (Commenter: Angela Garrone) Response: In accordance with NEPA, CEQ regulations implementing NEPA, and TVA's procedures for implementing NEPA, TVA has prepared this environmental assessment to evaluate the effects of the proposed action. As described in Chapter 3 of the Final EA, none of the anticipated effects of either Alternative B or Alternative C would be significant. Under TVA's preferred Alternative C - Construct and Operate Combustion Turbine/Combined Cycle Plant, impacts from air and water pollution and coal combustion waste would be significantly reduced compared to those resulting from the No Action Alternative and Alternative B.
Appendix C - Response to Comments
Final Environmental Assessment 143
27. TVA's NEPA Procedures state that an EIS is normally required for a “major power generating facility.” There is no question that the proposed Paradise project qualifies. Based on applicable Clean Air Act terms and definitions, Paradise is a “major power generating facility,” a “major stationary source,“ and a “major emitting facility.“ TVA's proposed action is a decision to operate a major power generating facility and, under TVA's NEPA Procedures, this decision requires preparation of an EIS. (Commenter: Angela Garrone) Response: TVA agrees that the Paradise Fossil Plant is a “major power generating facility,” or, in Clean Air Act terminology, a major emitting facility or major stationary source. Since the issuance of its NEPA Procedures, TVA has interpreted the cited statement about an EIS normally being required (Section 5.4.1) as applying to construction of a new major power generating facility, and not to maintenance and upgrades of existing major power generating facilities. TVA carefully evaluates proposed actions at its power generating facilities to determine the appropriate type of NEPA review based on criteria in the TVA NEPA Procedures and the CEQ NEPA Regulations. Permitting Permit Requirements 28. The Corps of Engineers exercises regulatory authority under Section 10 of the Rivers and Harbors Act of 1899 and Section 404 of the Clean Water Act. Construction activities that would result in the discharge of dredged and/or fill materials into jurisdictional waters, including wetlands, would require a Department of Army authorization prior to commencing the activity. (Commenter: Tre M. Barron) Response: Comment noted. The Final EA notes the activities that would require authorization from the Department of Army and TVA will apply for the necessary authorizations prior to commencing construction activities. Terrestrial Ecology-Animals Site Impacts 29. The US Fish and Wildlife Service has concerns regarding potential impacts to migratory birds, eagles, and particularly waterfowl and shorebirds that may forage or nest in and around the existing fly ash ponds and proposed stormwater/leachate ponds. Foraging and nesting in and around these industrial ponds is a concern due to the negative impacts from bioaccumulation and potential biomagnification of metals in these industrial fluids and sediments. To address these concerns, the Service recommends that TVA provide a Site Management Plan. This plan should describe in detail the quantity and quality of suitable avian nesting/foraging habitat associated with the facility along with committed conservation measures that TVA will implement to reduce the suitability of habitats on facility grounds near these ponds. We recommend that TVA monitor the avian use of the fly ash ponds. Should TVA find seasonal or resident avian usage, the Service requests to be notified to further assist TVA is modifying the plan to avoid any potential violation of the Migratory Bird Treaty Act or the Bald and Golden Eagle Protection Act. (Commenters: Virgil Lee Andrews, Jr.)

Paradise Units 1 and 2
144 Final Environmental Assessment
Response: Ash ponds at several TVA facilities are used by migratory birds, including waterfowl and shorebirds, as nesting, migratory stopover, and wintering habitat. TVA has conducted, and continues to conduct, monitoring of potential avian receptors of ash contaminants (primarily metals) as part of its response to the 2008 Kingston Fossil Plant ash spill. Monitoring indicates that while birds at several trophic levels in the surrounding community may be exposed to ash contaminants, and some differential uptake of metals has occurred in some species, no negative effects on survival or reproduction of monitored birds are evident. If an alternative which results in continued use of wet ash handling is chosen, TVA would comply with all applicable Federal requirements concerning these operations. Transportation Gas Pipeline Reliability 30. The reliability of natural gas pipelines is a concern to local residents and businesses. (Commenters: Anthony Arnold, William Bogar, Bobby Isaac) Response: In evaluating reliability of the proposed gas pipeline, TVA considers both physical reliability and contractual reliability. From a physical reliability point of view, interstate natural gas pipelines are subject to safety standards developed by the Department of Transportation, subject to a number of regulations including the Pipeline and Hazardous Materials Safety Act and regulatory oversight from the Federal Energy Regulatory Commission. Since the majority of gas pipeline infrastructure is buried, it is not subject to many of the environmental risks encountered by highway transportation or rail transportation. From a contractual reliability point of view, TVA would have firm contractual rights to move the gas to the plant. Further, both pipeline alternatives being considered would interconnect with TVA’s existing contractual gas network which includes the storage of TVA-owned gas in salt dome caverns to support its operations during critical periods such as severe cold weather. Water Quality Groundwater 31. The Draft EA does not meaningfully assess the different groundwater quality impacts of the three alternatives. TVA currently sluices bottom ash, fly ash, and scrubber sludge to onsite ash ponds, where the waste streams are mixed. Alternative A would have little or no impact on the magnitude of this waste stream. Under Alternative B, the groundwater impacts would continue largely unchanged. Alternative C would provide a substantial groundwater quality benefit relative to the other alternatives. TVA ash pond monitoring well data, obtained through Freedom of Information Act requests, shows that the ash and scrubber sludge ponds are contaminating groundwater. This data is largely ignored in the Draft EA. (Commenter: Angela Garrone) Response: Comment noted. TVA agrees with the statements in the comment on the nature of potential groundwater impacts. TVA will continue to monitor the groundwater under the guidance and regulations of the Kentucky Division of Waste Management. Wastewater Impacts Assessment 32. Paradise wastewaters currently receive only rudimentary treatment in unlined ponds and large quantities of toxics are discharged to the Green River. Alternative B would
Appendix C - Response to Comments
Final Environmental Assessment 145
increase the volume of pollutant discharges and alter their retention time, general chemistry, absorption and alkalinity. The analysis in the Draft EA shows that Alternative B will potentially increase concentrations of selenium and cadmium in violation of Kentucky water quality criteria. The Draft EA does little to quantify and fully characterize the Alternative B wastewater discharges, or to assess their actual impacts on the Green River. (Commenter: Angela Garrone) Response: The Unit 1 and 2 fly ash and wet scrubber (wFGD) effluent waste streams are currently combined. Under Alternative 2, fly ash would be segregated from this combined waste stream and sluiced to the fly ash pond. The quantity of fly ash would not noticeably change. The retention time of the pond and the general chemistry, absorption and alkalinity of the waste streams could change, but these changes are not expected to negatively impact the ability of the ponds to co-treat the altered waste streams. For example, the new sluice waste stream would have a lower solids content than the fly ash/wFGD stream and would settle relatively quickly. Additionally, the lower acidity of this sluice stream could reduce the leachate of metals from the ash and have the beneficial effect of reducing the concentrations of metals in the pond. Overall, TVA expects lower levels of contaminants in the discharge from the ash pond under Alternative B. The calculations used to evaluate operational impacts (Final EA Section 3.10.2.2) added the current metals concentrations and the corresponding loading of these constituents to the projected concentrations resulting from the future sluicing of the fly ash streams. This evaluation provides an overly conservative estimate because it accounts twice for the fly ash from Units 1 and 2, once as part of current operations and once as part of the future sluiced fly ash stream. Unfortunately, there is no way to accurately deduct the current loading from the combined fly ash stream, necessitating the use of the overly conservative methodology to evaluate concentrations of metals. The facility’s KPDES permit requires quarterly monitoring of whole effluent toxicity (WET) at Outfalls 001 and 002 discharges. Meeting the WET limits ensures that the discharge from these outfalls is not toxic. Thus, although the selenium and cadmium levels under Alternative B have the potential to exceed water quality standards, consistent compliance with WET standards will ensure that the discharge is not toxic. Experience over the last decade indicates that the WET limits have been consistently met even though individual metal concentrations were, on a few occasions, above the water quality criteria. Final EA Section 3.10.2.2 quantifies the waste water discharge impacts on the receiving stream. This assessment of impacts from changes in the discharge of Outfall 001 focused on Jacobs Creed because the KPDES permit limits discharges to this receiving stream. Since the discharge into Jacobs Creek was determined to be non-toxic, the discharge from Jacobs Creek (a zero flow stream) into the Green River would also be non-toxic. Overall, implementation of Alternative B is not expected to violate current KPDES permit requirements, increase the toxicity of the discharge stream, or adversely impact the water quality of the receiving streams or those further downstream. TVA would continue to monitor the ash pond discharges in accordance with the KPDES permit to confirm that no significant impacts to the Jacobs Creek or the Green River are occurring from this action. TVA would take mitigative actions, if necessary, to ensure that discharges meet KPDES WET limits. Thus, the operation of the proposed PJFF systems under Alternative B should have no significant impact on the surface water quality of Jacobs Creek or the Green River.

Paradise Units 1 and 2
146 Final Environmental Assessment
33. The wastewater impact assessment in the Draft EA shows that Alternative B would increase both raw water demand and wastewater output from the ash pond. In contrast, Alternative C would dramatically reduce water consumption from PAF operations, thermal discharges to the Green River, and entrainment of aquatic organisms. (Commenter: Angela Garrone) Response: Comment noted. The analyses in the Final EA describe the greatly reduced water-related impacts of Alternative C compared to Alternatives A and B.
Appendix C - Response to Comments
Final Environmental Assessment 147
C. INDEX OF COMMENTERS
Following is a list of the commenters, their affiliations, and the identification numbers of their comments. Adams, Holly, Dawson Springs, KY, 10 Adams, Matt, Jlok Corp., Sacramento, KY,
10 Adams, William, Frankfort, KY, 12 Adamson, Jason, Nortonville, KY, 10 Adkins, Danny, Lexington, KY, 5, 8, 9, 11,
12 Allen, Dwight, Nortonville, KY, 10 Allen, Matt, Madisonville, KY, 10 Anderson, Charles, Paris, KY, 5, 8, 9, 11,
12 Andrews, Jr., Virgil Lee, US Fish and
Wildlife Service, Frankfort, KY, 4, 14, 29
Anonymous, Madisonville, KY, 10 Arnold, Anthony, Russellville, KY, 9, 30 Ashby, Kenneth, Manitou, KY, 10 Ashley, Alan, Arch Coal Inc., Knott County
Complex, Kite, KY, 5, 8, 9, 11, 12 Austin, Michele, Madisonville, KY, 12 Ayers, Rick, London, KY, 5, 8, 9, 11, 12 Ball, Melissa, Manitou, KY, 12 Barber, Charlie, Erlington, KY, 10 Barron, Tre M., U.S. Army Corps of
Engineers, Newburgh, IN, 28 Basham, Darrell W., Greenville, KY, 5, 8,
9, 11, 12 Bird, Sonnie, Madisonville, KY, 10 Blake, Percy, Madisonville, KY, 10, 12 Blanchard, Marianne, Madisonville, KY,
12 Bogar, William, Sidney, KY, 10, 30 Boone, Carl, Madisonville, KY, 10 Bowling, Tony, CBC Engineers, Hazard,
KY, 8 Bradley, Dwight, Madisonville, KY, 10 Bretz, Cathy, Madisonville, KY, 10 Bretz, John, Madisonville, KY, 10 Bridges, Bob, Madisonville, KY, 10 Brinkley, Terry, Madisonville, KY, 10 Brothers, Rick, Central City, KY, 10 Brown, Buffie, Madisonville, KY, 10 Brown, Donna, Dixon, KY, 12 Brown, Lena, McDowell, KY, 5, 8, 9, 11,
12 Brown, Matt, Madisonville, KY, 10
Brown, Robert, Dixon, KY, 10 Bullard, James, Hardin, KY, 5, 8, 9, 11, 12 Burden, Fay, Madisonville, KY, 10 Burns, Seth, Newburg, IN, 10 Butler, Connie, Slaughters, KY, 10 Butler, Ronnie, Slaughters, KY, 10, 12 Campbell, Mark, Hanson, KY, 10 Campbell, Robert, Hazard, KY, 5, 8, 9, 11,
12 Capps, Todd, Madisonville, KY, 5 Carlisle, Mike, Madisonville, KY, 10 Carlton, Crystal, Madisonville, KY, 5 Carlton, Paul, Madisonville, KY, 12 Carlton, Tracy, Madisonville, KY, 12 Caudill, Paul, Worldwide Equipment Inc.,
Prestonsburg, KY, 5, 8, 9, 11, 12 Charles, James, Phelps, KY, 5, 8, 9, 11,
12 Charles, Paris, Alpha Natural Resources,
Pikeville, KY, 5, 8, 9, 11, 12 Chiles, Bob, Madisonville, KY, 5 Childs, Rex, Dixon, KY, 10 Clark, Jay, Friends Of Coal, Brandenburg,
KY, 5 Clark, Troy, Nortonville, KY, 5 Clemente, Franke, State College, PA, 5, 9 Clouse, Paul, Madisonville, KY, 5 Cobb, Darrel, Greenville, KY, 5 Cobb, Daryl, Humur, KY, 10 Coin, Leann, Greenville, KY, 5 Collinsworth, Staci, Madisonville, KY, 10 Compton, Gary, Henderson, KY, 5, 8, 9,
11, 12 Couch, Fred, Hazard, KY, 12 Cox, Ronnie, Dawson Springs, KY, 12 Crawford, Olivia, Madisonville, KY, 12 Crick, Houston, Manitou, KY, 12 Crowley, Marvin, Owensboro, KY, 5, 8, 9,
11, 12 Curry, Darel, Graham, KY, 12 Curry, Loretta, Graham, KY, 10 Curry, Marshall, Central City, KY, 5 Curtis, Jasie, Lexington, KY, 5, 8, 9, 11,
12 Davis, Bill, Madisonville, KY, 5, 8, 9, 11,
12
Paradise Units 1 and 2
148 Final Environmental Assessment
Davis, Jim, Central City, KY, 10 Dean, Tim, South Williamson, KY, 5, 8, 9,
11, 12 Dehay, Toby, White Plains, KY, 5 Dingus, Gayle, Martin, KY, 5, 8, 9, 11, 12 Dotson, Pamm, Williamsburg, KY, 5, 8, 9,
11, 12 Drake Jr, Ronnie, Greenville, KY, 10 Dunlap, Nicole, 10 Durham, Jim, Corbin, KY, 5, 8, 9, 11, 12 Dyer, Shaun, Somerset, KY, 5, 8, 9, 11,
12 Earl, Mark, Nebo, KY, 12 East, Brenda, Dawsons Springs, KY, 10 East, Rocky, David Stanley Consultants,
LLC, Harrisburg, IL5, 8, 9, 11, 12 Ellis, Jason, Madisonville, KY, 10 Elms, Eric, Morgantown, KY, 5 Embry, Jr., C. B., KY House of
Representatives, Morgantown, KY, 10 Enyart, John, Ashland, KY, 12 Eubanks, Kellie, Hardin, KY, 5, 8, 9, 11,
12 Faber, James, Madisonville, KY, 10 Farthing, Max, 10 Faughender, Kevin, Madisonville, KY, 10 Ferrell, Eugene D., Canada, KY, 5, 8, 9,
11, 12 Fitzpatrick, David, American Coal
Company, IL, 12 Flynn, Robert, Paducah, KY, 12 Ford, Ciccero, Providence, KY, 10, 12 Foster, Carolyn, Nortonville, KY, 12 Frazier, Ron, Baxter, KY, 5, 8, 9, 11, 12 Fredrick, Mark, Madisonville, KY, 5 French, Elisha, Madisonville, KY, 10 Garrone, Angela, Southern Alliance for
Clean Energy, Knoxville, TN, 1, 3, 16-27, 31-33
Gatlin, Rob, Alabama Coal, Madisonville, KY, 15
Gentry, Barbara, Providence, KY, 10 Goderwis, Andrew, Henderson, KY, 10 Gooch, Eddie, Providence, KY, 10 Gooch, Jim, Kentucky House of
Representatives, Frankfort, KY, 2, 5, 7, 9
Gooch, Michael, Providence, KY, 10 Graham, Donald, Louisville, KY, 10 Green, Kyle, Clay, KY, 10
Gregory, Cathy, Central City, KY, 5, 8, 9, 11, 12
Groves, Rita, Greenville, KY, 10 Guess, Donnie, Madisonville, KY, 10 Hackney, James, Providence, KY, 10 Hackney, Robert, Slaughters, KY, 10 Hardison, Glendale, Mullenburg, KY, 10 Hardison, Penny, Island, KY, 10 Hargis, Marie, Bowling Green, KY, 5, 15 Hargis, T, Bowling Green, KY, 5, 9 Harlan, Randy, United Central Industrial
Supply Co, Central City, KY, 5, 8, 9, 11, 12
Harris, Ashley, KY, 5, 8, 9, 11, 12 Harris, John, Madisonville, KY, 10 Hayes, Bryan, KY, 5, 8, 9, 11, 12 Hayes, Christy, Hanson, KY, 10 Henderson, Bill, Hanson, KY, 5 Henderson, Charles, Beaver Dam, KY, 10 Henderson, Molly, Beaver Dam, KY, 10 Henderson, Wilma, Hanson, KY, 10 Herring, Billy, White Plains, KY, 10 Hibbs, Ricky, Madisonville, KY, 5 Hill, Janis, Dixon, KY, 10 Holt, David, Morganfield, KY, 5 Hook, Kendra, White Plains, KY, 10 Howard, Fred, Kentucky Dental
Association, Harlan, KY, 5, 8, 9, 11, 12 Huddleston, Brent, Madisonville, KY, 10 Hudson, Brittiany, Morgantown, KY, 5 Hunt, Helen, Madisonville, KY, 10 Iliohan, Sharon, Madisonville, KY, 10 Isaac, Bobby, Louisa, KY, 5, 12, 30 James, Elizabeth, Madisonville, KY, 10 James, Rodney, Madisonville, KY, 5, 8, 9,
11, 12 Johnson, Beth, Owensboro, KY, 5 Johnson, Danny, Dawsons Springs, KY,
10 Johnson, Dennis, Lexington, KY, 15 Johnson, Kyle, Evarts, KY, 5, 8, 9, 11, 12 Johnson, Rob, Graham, KY, 5 Jones, Chris, Hanson, KY, 10 Jones, Donald, Bremen, KY, 5 Jones, Elon, Madisonville, KY, 10 Kacmar, Jim, Slaughters, KY, 10 Kathalynas, Tim, West Frankfort, KY, 10 Kelley, Darren, Providence, KY, 10 Key, Danny, Nebo, KY, 10 King, Dave, Madisonville, KY, 10 Kirby, Jeff, Greenville, KY, 10
Appendix C - Response to Comments
Final Environmental Assessment 149
Kistner, Charles, 10 Kittinger, Wayne, Greenville, KY, 10 Knight, Cindy, Dixon, KY, 10 Knight, Eddy, Sacramento, KY, 10 Larkins, Casey, White Plains, KY, 5 Lear, Lori, Nebo, KY, 10 Leasure, Doug, Madisonville, KY, 10 Littlepage, Chance, Madisonville, 10 Long, Amber, 10 Lovern, Marsha, Morganfield, KY, 5, 8, 9,
11, 12 Lutz, Alan, Madisonville, KY, 5, 8, 9, 11,
12 Maggard, Bill, Louisville, KY, 5, 8, 9, 11,
12 Maggard, Vena, Hazard, KY, 5, 8, 9, 11,
12 Markwell, Debra, Central City, KY, 5 Marsh, Anthony, Madisonville, KY, 10 Mason, Billy, 10 McCarthy, Dave, Harlan, KY, 5, 8, 9, 11,
12 McClain, Jeremy, Madisonville, KY, 10 McDowell, Mark, Manitou, KY, 10 McElheny, Donald, Abingdon, VA, 5, 8, 9,
11, 12 McLemore, Brandy, Nortonville, KY, 10 Meade, Albon, Prestonsburg, KY, 5, 8, 9,
11, 12 Melton, Craig, Hazard, KY, 5, 8, 9, 11, 12 Meredith, Hilda, Morgantown, KY, 5 Mitchell, Abby, Madisonville, KY, 5 Mitchell, Angela, Madisonville, KY, 10 Mitchell, Brian, Madisonville, KY, 10 Mitchell, Everett, Erlington, KY, 10 Molnar, Jenna, Louisville, KY, 10 Morris, Kenya, White Plains, KY, 10 Morris, Robert, Brandeis Machinery,
Owensville, KY, 10 Morse, William, Providence, KY, 10 Mortvitz, Donna, Madisonville, KY, 10 Mullins, Anthony, McCoy Elkhorn Coal
Corp., McDowell, KY, 5, 8, 9, 11, 12 Mullins, Eugene & Teresa, Hindman, KY,
10 Mullins, James, Alpha Natural Resources,
Hardy, KY, 5 Mullins, Perry, Virgie, KY, 5, 8, 9, 11, 12 Murray, Myrtle, Middlesboro, KY, 10 Murray, Robert E., Murray Energy
Corporation, St. Clairsville, OH, 6-9
Noe, Carla, Greenville, KY, 10 O'Bryan, Judith, Louisville, KY, 5, 8, 9, 11,
12 O'Daniel, Teresa, Martin County Coal
Corporation, Inez, KY, 5, 8, 9, 11, 12 Offutt, Jan, Hanson, KY, 10 Offutt, Larry, Hanson, KY, 10 Offutt, Myra, Earlington, KY, 10 Oldham, Marci, Madisonville, KY, 10 Oliver, Jim, Lexington, KY, 5, 8, 9, 11, 12 Parker, Craig, Madisonville, KY, 10 Patterson, Jeff, Armstrong Coal,
Madisonville, KY, 10 Payne, Charles D., 5, 7 Pendley, Jimmy, Madisonville, KY, 10 Pentacost, Arthur, Madisonville, KY, Peyton, Kathy, Manitou, KY, 10 Pigg, Brent, Farmington, MO, 10 Powell, Tifffany, Madisonville, KY, 10 Prewitt, David, Corbin, KY, 5, 8, 9, 11, 12 Prowell, Jarred, Dawsons Springs, KY, 10 Prowell, Kayla, Dawsons Springs, KY, 10 Prowell, Lindsey, Dawsons Springs, KY,
10 Reed, John, Alpha Natural Resources, 5 Reynolds, Beverly, Pikeville, KY, 5, 8, 9,
11, 12 Reynolds, Caroll, Madisonville, KY, 10 Rhoads, Jerry P., Kentucky State
Legislator, KY, 9, 13 Ricci, Michael, Lexington, KY, 10 Rice, Vicki, Oil Springs, KY, 5, 8, 9, 11, 12 Rich, Jerrell, Clay, KY, 5 Robinson, Allan, Manchester, KY, 5, 8, 9,
11, 12 Rodgers, Scott, 15 Rolley, Jamie, Graham, KY, 10 Ron, Kevin, Sturgis, KY, 10 Rose, Burnie, Alpha Natural Resources,
Norton, VA, 5, 8, 9, 11, 12 Rowley, Ashton, Sturgis, KY, 10 Rowley, John, Sturgis, KY, 10 Runyon, Kenny, James River Coal,
Kimper, KY, 5 Sammons, Vicki, Hazard, KY, 5 Schalk, Earl, Glasgow, KY, 10 Schmidt, Kenneth, Mountain Land
Services, Pikeville, KY, 5, 8, 9, 11, 12 Schneider, Cassie, Nebo, KY, 10 Shelton, Allen, Clayton, KY, 10 Short, Charles, Sturgis, KY, 5
Paradise Units 1 and 2
150 Final Environmental Assessment
Short, Delpher, Greenville, KY, 5 Short, Jonathan, Greenville, KY. 10 Short, Steven, Madisonville, KY, 10 Simpson, Eddy, Hartford, KY, 10 Sisk, Dana, Madisonville, KY, 10 Sisk, Edward, Madisonville, KY, 5 Slone, Jarrid, 5, 8, 9, 11, 12 Smith, Debbie, Robinson Creek, KY, 10 Smith, Heather, Greenville, KY, 10 Smith, John, Greenville, KY, 10 Smith, Ronnie, Harlan, KY, 5, 8, 9, 11, 12 Southerland, Gary, Morgantown, KY, 5, 6,
10 Spears, Sheila, Madisonville, KY, 5 Stanley, David, Greenville, KY, 5 Stanley, Jessica and Justin, Powderly,
KY, 5 Stanley, Justin, Armstrong Coal Co.,
Powderly, KY, 10 Stiltner, Deborah, Phelps High School,
Phelps, KY, 10 Stinnett, Lee Allen, Hartford, KY, 5, 10 Stinson, Lisa, Newburgh, IN, 5, 10 Stone, Scotty, Providence, KY, 5, 10 Stone, Shannon, Nortonville, KY, 5 Sublett, Donald, Catlettsburg, KY, 5, 10 Summers, James, Elsmere, KY, 15 Tao, Daniel, University of Kentucky,
Lexington, KY, 5, 8, 9, 11, 12 Taylor, Duane, Beaver Dam, KY, 5, 8, 9,
11, 12 Thomas, Palestine, Varney, KY, 10 Thorp, Danny, Madisonville, KY, 5 Tobinson, Jess, KY, 5, 8, 9, 11, 12 Tompkins, Debbie, White Plains, KY, 5 Townsell, Stephanie, Madisonville, KY, 5 Tucker, Kelli, Bremen, KY, 5 Utley, Bob, Nebo, KY, 10 Valenzuela, Elizabeth, Madisonville, KY, 5 Vance, Steve, Dixon, KY, 5 Vaughn, Dennis, Madisonville, KY, 5 Walker, Brenda, Dixon, KY, 5, 10 Walker Jr., Lynn, Dixon, KY, 5 Watkins, Tony, Benton, KY, 10 Webb-Arnett, Patricia, Hanson, KY, 10 Wells, Eric, Nortonville, KY, 10 Wells, Richard, Covington, KY, 10 Whitfield, Yvonne, Madisonville, KY, 10 Wilder, Lonnie, Pineville, KY, 10 Wilkerson, Tommy & Anita, Greenville,
KY, 5, 10
Williams, Chris, Dixon, KY, 10, 12 Wilson, Debbie, Manitou, KY, 5, 8, 9, 11,
12 Wilson, Maurcie, Madisonville, KY, 10 Wilson, Michael, Madisonville, KY, 12 Wilson, Ronald, Madisonville, KY, 5 Winn, Randy, Winn Energy, Calhoun, KY,
10 Wiseman, James, Pesco, Hazard, KY, 5 Wolff, James, Louisville, KY, 5, 8, 9, 11,
12 Woodcock, Donna, Somerset, KY, 10 Woods, David, Evansville, KY, 5 Woolton, Nick, Centertown, KY, 12 Yerkes, Robert, Whitmore Manufacturing,
Rockwall, TX, 5, 8, 9, 11, 12 Yesh, Tina, 5, 10 Yonts, Brent, KY General Assembly,
Greenville, KY, 5, 9, 13 Young, Salena, Robards, KY, 10

Appendix C - Response to Comments
Final Environmental Assessment 151
D. COMMENT LETTERS FROM FEDERAL AND STATE AGENCIES

Paradise Units 1 and 2
152 Final Environmental Assessment
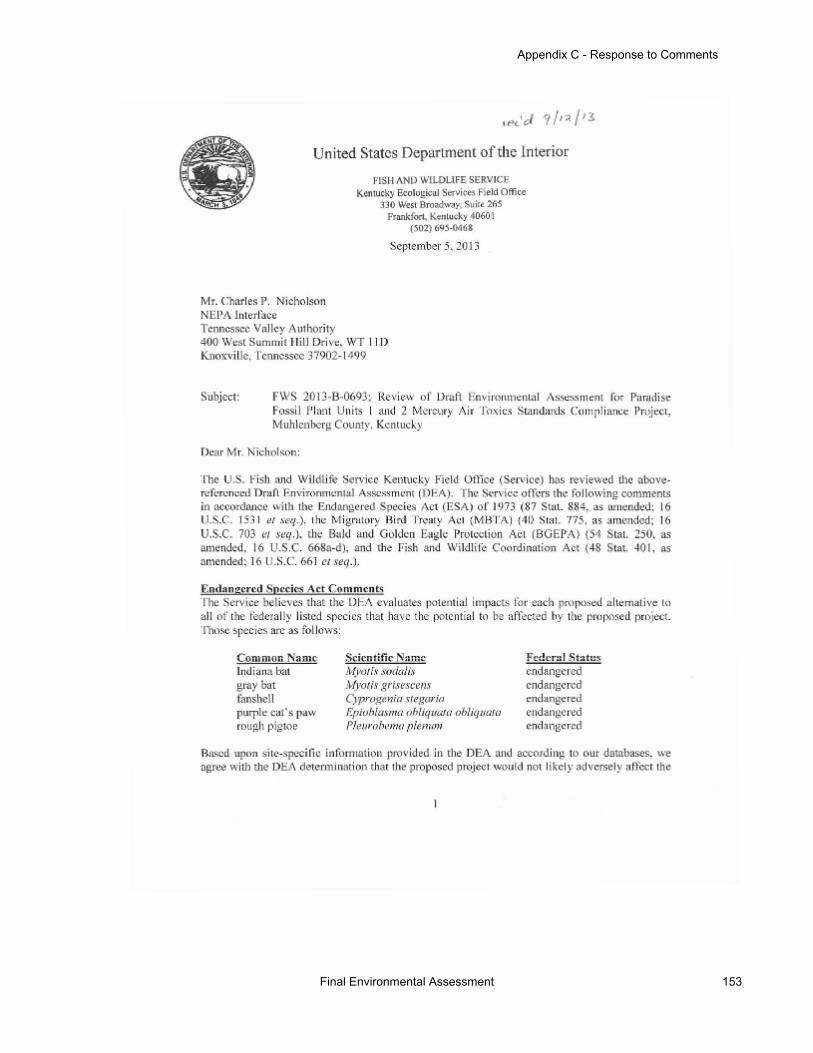
Appendix C - Response to Comments
Final Environmental Assessment 153

Paradise Units 1 and 2
154 Final Environmental Assessment
Appendix C - Response to Comments
Final Environmental Assessment 155