Embed Size (px)
Citation preview

MSc in Economics and Business Administration
Department of Marketing
Master Thesis Marketing Communication Management
Brand Management in the Energy Sector ‐a means‐end approach to identify and build sources to brand equity
in a B2B green energy context in Norway
Date of submission 18.09.2009
Student: Bjørnar Johansen
Signature:
Supervisor: Anders Due
Copenhagen Business School 2009

Brand Management in the Energy Sector 4
Brand Management in the Energy Sector 5
Executive Summary
By Bjørnar Johansen, September 2009
In the recent decade, deregulations in energy markets across Europe has opened previously
monopolistic environments and opened for free market competition. The Norwegian
Government has initiated a restructure process to convert from oil, gas and electricity over
to alternative energy sources. One of its targets is to increase bio‐energy production with 14
TWh within 2020. It has opened an attractive window of opportunity for private investors
and biomass heating plant suppliers.
An attractive biomass heating plant industry emerges within the water‐borne heat market in
Norway. It seems reasonable to classify the emerging industry as a B2B context. Thus,
branding principles adopted from B2B theories should apply well to the given industry. It
offers an opportunity for suppliers of heating plants to escape from pure price competition.
Consumers in the industry are affected by the perceived risk associated with biomass. They
must accept higher risk compared with solutions that run with oil, gas or electricity. It could
explain why common buying situations in the industry call for large and confusing buying
centers where members are made up from various companies. Four roles often make all
major decisions throughout the buying process; initiators, deciders, consultants and users.
The means‐end theory is applied to the industry in order to identify sources to brand equity.
By conducting research on respondents classified as decider or consultant, results indicate a
range of implications for brand management. First, respondents appear to be influenced by
more rational and more emotional factors. Second, results indicate deciders and consultants
are influenced by different underlying needs, values or motivations according to their role.
And last, while research identified expected sources to brand equity, it was not confirmed
that green branding initiatives influence their crucial decisions.
Data collected provide knowledge about the competitive frame of reference and positioning
guidelines. An analytical framework is constructed in order to discuss proper points‐of‐parity
and points‐of‐difference associations in the industry. Results indicate four relevant position
considerations in the industry. Given the B2B context, additional implications are discussed
by balancing top‐down and bottom‐up brand management activities.

Brand Management in the Energy Sector 6

Brand Management in the Energy Sector 7
Contents Executive Summary
Date of submission 18.09.2009 ........................................................................................................... 3
Student: Bjørnar Johansen .................................................................................................................. 3
Chapter 1 ‐ Introduction .......................................................................................................................... 9
1.2 Problem Identification ........................................................................................................... 10
1.3 Purpose of this Paper ............................................................................................................ 10
1.4 Problem Statement ............................................................................................................... 10
1.4.1 Research Questions ....................................................................................................... 11
1.5 Methodology ......................................................................................................................... 11
1.6 Limitations ............................................................................................................................. 12
Chapter 2 – Methodology and Theoretical Framework ........................................................................ 13
2.2 Data Collection ...................................................................................................................... 13
2.2.1 Validity & Reliability ...................................................................................................... 15
2.3 Theoretical Framework ......................................................................................................... 15
2.4 The Subject of Study ‐ Agder Biocom .................................................................................... 21
2.4.1 Segmentation according to Mw .................................................................................... 22
2.4.2 Segmentation according to the Customers ................................................................... 23
2.4.3 Agder Biocom’s main Strengths and Challenges ........................................................... 23
Chapter 3 ‐ Analysis of the External Environment ................................................................................ 25
3.2 Market Attractiveness ........................................................................................................... 25
3.2.1 DESTEP Analysis ............................................................................................................ 25
3.2.2 Competitive Analysis ..................................................................................................... 27
3.3 Investment in Branding ......................................................................................................... 31
3.4 Market Attractiveness and Multipliers in the Brand Value Chain ......................................... 33
Chapter 4 – Market Dynamics and Size of the Buying Center .............................................................. 35
4.2 Perceived Risk ........................................................................................................................ 35
4.3 Size of the Buying Center and the Buying Process ................................................................ 37
4.3.1 Roles in the Buying Center ............................................................................................ 38
4.3.2 The Buying Process ........................................................................................................ 40
4.4 Brand Relevance in the Biomass Heating Plant Industry ...................................................... 43
4.4.1 Brands and the Complexity of the Buying Situation...................................................... 43
4.4.2 Preliminary Conclusion .................................................................................................. 44
Chapter 5 – Means‐end Research and Analysis .................................................................................... 45

Brand Management in the Energy Sector 8
5.2 Research Purpose .................................................................................................................. 45
5.3 Analysis .................................................................................................................................. 47
5.3.1 Constructing the Hierarchical Value Map (HVM) .......................................................... 51
5.4 Discussion .............................................................................................................................. 55
5.5 Main Findings ........................................................................................................................ 58
5.6 Means‐end Theory and why the Gasification Technology does not sell ............................... 59
Chapter 6 ‐ Competitive Frame of Reference ....................................................................................... 61
6.2 Value Added Features ........................................................................................................... 61
6.3 Main Competitors .................................................................................................................. 61
6.4 Analysis .................................................................................................................................. 66
6.5 Discussion .............................................................................................................................. 66
6.6 Short term Product Differentiation vs. long term Brand Equity ........................................... 68
Chapter 7 – Gaining the Competitive Advantage .................................................................................. 69
7.2 Part 1 – Crafting the B2B Brand Positioning .......................................................................... 69
7.2.1 B2B Brand Positioning ................................................................................................... 70
7.2.2 Establish Category Membership .................................................................................... 70
7.2.3 Brand Positioning and Point‐of‐Difference Associations .............................................. 73
7.3 Part 2 – Establish a Brand Identity through B2B Brand Values ............................................. 77
7.3.1 B2B Brand Values, Roles and the Buying Process ......................................................... 78
7.4 Part 3 – Building the Brand from Bottom‐up ........................................................................ 81
7.4.1 Benefits Linked to Decision Makers .............................................................................. 83
7.5 Part 4 – The Brand Core and Branding Concepts .................................................................. 85
Chapter 8 ‐ Implications and Conclusion ........................................................................................... 87
8.2 Conclusion ............................................................................................................................. 88
References
Appendices 1 ‐ 8

Brand Management in the Energy Sector 9
Chapter 1 ‐ Introduction
Norway is historically associated for its pioneering adventures within the oil and gas energy
sector. Much have changed since the early days when oil was the primary energy source of
business in Norway. The Norwegian Government acknowledges the increased focus on
environmental issues and aims at the establishment of a healthy market for alternative
energy sources. Early observations indicate that the biomass heating plant industry grows
with a rapid pace of over 20 percent each year. Much due to favorable subsidies and
regulations set by the Government. The Norwegian Government has initiated a restructure
process to convert from oil, gas and electricity over to alternative energy sources. One of its
targets is to increase bio‐energy production with 14 TWh within 2020. This initiative has
opened an attractive window of opportunity for investors and biomass heating plant
suppliers. This paper deals with B2B branding and how strategic brand management could
help players in the biomass heating plant industry to reach its targets.
The notion of emotions and increased focus on branding in B2B markets has attracted both
academics and practitioners from vast different product categories. Many managers are
convinced that branding is a phenomenon confined only to consumer products and markets
(Kotler & Pfoertsch 2006 p.1). High tech products or commodities follow a strict rational
decision‐making process that only account for rational factors as price, service, quality, etc
(Aaker & Joachimsthaler 2000 p.22). Still, companies as Microsoft, IBM, FedEx, Boing and
Caterpillar confirm that many of the world’s leading brands are in fact B2B brands. Also,
several studies confirm that emotions and personal factors seem to play an important role in
organizational decision making (Sen et al 2008, Lynch & De Chernatony 2004, Maitlis &
Ozcelik 2004, Mudambi 2002).
Through a case study approach, alternative energy in Norway is explored through the lens of
brand management. This paper recognizes that no comprehensive B2B brand model exists
(Kuhn et al 2008). An analytical framework is presented in order to discuss findings in the
biomass heating plant industry.
Brand Management in the Energy Sector 10
1.2 Problem Identification The structure of energy markets is undergoing profound changes in many countries around
the world. In the recent decade, deregulations has opened previously monopolistic
environments and opened for free market competition (Weidmann 2005). At the same time,
end users have been given the opportunity to choose amongst a range of energy suppliers
with relative low switching costs. For end users, energy looks and feels the same regardless
of its supplier. Thus energy providers around Europe have attempted to position and
differentiate themselves by becoming more customer‐oriented. The promise of branding is
that energy brands with attributes more pleasing to consumers will be able to charge a
premium (Hartmann & Ibanez 2006). Germany has provided interesting business cases from
the residential down‐stream energy markets. Empirical evidences suggest branding can be
an effective tool to differentiate customer offerings. This paper sets out to explore the
energy value chain in order to better understand how branding applies to a selected industry
in the Norwegian up‐stream heat market.
1.3 Purpose of this Paper It is the aim of this paper to analyze the emerging bio‐energy market in Norway from the
lens of brand management. It includes analyzes in order to present the market structure and
how branding principles applies. Hence, a major purpose of this paper is to identify sources
to brand equity in the biomass heating plant industry. A second purpose is to provide an
updated view on the theoretical foundation for B2B brand management. It includes a critical
application of Keller’s CBBE model.
1.4 Problem Statement “Determine whether B2B brands can make a significant impact in the Norwegian biomass
heating plant industry and how Agder Biocom should position its brand in the given
industry.”
The problem identification has its root from the subject of study; Agder Biocom. Its
managers have neglected the external environment the business operates in. They do not
hold branding as an important solution to build its business even more profitable. Critics
claim price and technology alone determines decisions in the industry. It is a challenge this
Brand Management in the Energy Sector 11
author finds interesting after gaining crucial insight to the energy sector from an internship
with StatoilHydro during the summer of 2008. More detailed, this paper will deal with
research questions listed underneath.
1.4.1 Research Questions Part 1: How does branding principles apply to the biomass heating plant industry?
How do the macro trends influence the demand for bio‐energy?
How is the frame of competition?
How is the industry structured? What about risk?
How do industrial decision makers make key decisions in this industry?
How are brands relevant in the given industry?
How could brands influence the decision making process?
Part 2: How should Agder Biocom position a brand within the given industry?
What factors influence the choice of brand positioning in B2B markets?
How could Agder Biocom establish proper category membership?
What could be sources to brand equity?
How can Agder Biocom utilize branding principles in order to differentiate itself in the
biomass heating plant industry?
1.5 Methodology As stated by Andersen: “…a considerable part of the world, we as economics, sociologists
and psychologists study, is social constructed” (Andersen 2008 p.46). Because this paper
deals with social constructs, it will not produce theories and concepts that live up to the
ideals set by the scientific sciences. Still, it follows a set of guidelines set for social sciences in
order to better understand Agder Biocom and their environment as subject of study.
The thesis takes on an exploratory research methodology. Exploratory research, according to
Andersen “serves the purpose of exploring circumstances or phenomenon that are less
known or unknown” (Andersen 2008 p.22). Exploratory research design makes sense in this
particular case as the purpose is to gain preliminary insights into an emerging industry. Hair
et al also note that exploratory research designs have important uses in understanding and
Brand Management in the Energy Sector 12
resolving business problems, especially around preliminary explanations of marketplace or
customer behavior and decision processes (Hair et al 2006 p.173).
The thesis takes on a mix between deductive and inductive work processes. First part follows
more deductive work methods. Widely applied models as DESTEP and Porter’s five
competitive forces are applied in order to present the market and discuss the relevance of
branding. Second part is mainly made up by inductive work methods. Insights from empirical
and secondary data are discussed against several theories and concepts in order to better
understand the industry at hand. One important part is to discuss suitable recommendations
for Agder Biocom. It moves the methodology over to more practical orientations. The paper
thus meets formal guidelines set by the Marketing Communication Management program.
1.6 Limitations A biomass heating plant could apply to different usages. It could also provide electricity or
drying in certain industries. This paper is limited to the water‐driven heat market as it
represents the most attractive market to pursue at the moment.
The paper only deals with issues related to B2B, and not B2G. Municipalities and industrial
companies constitute the majority of the consumers in the heat market. After gaining insight
to the industry, both municipalities and private companies seem to follow similar buying
processes. It is thus argued that B2B and B2G be treated in similar way in the given industry.
Biomass heating plants face indirect competition from other alternative sources. It is
possible to produce similar end product from electricity, oil, gas or wind driven energy
sources. This paper will not discuss position related to indirect competitors. It is argued that
it is the bio‐energy industry as a whole that needs to address competition from alternative
sources. As such, addressing non‐customer stakeholders such as media or politicians will not
be dealt with extensively in this paper.
Research conducted is limited to qualitative design. It is a suited approach given the
exploratory design of this paper. It is suggested that quantitative analysis should be
conducted in order to validate findings. Limited resources and time do not allow further
research.
Agder Biocom is a start‐up company. It is assumed it has no established brand position or
any brand associations at the time of the research. For that reason, no strategic brand
analysis of Agder Biocom will be conducted.

Brand Management in the Energy Sector 13
Chapter 2 – Methodology and Theoretical Framework
Given the exploratory design of this paper, a single case study approach is selected in order
to provide the structure that allows answering the research questions. Yin (2003) argues that
case studies are preferred design when the investigator has little control over events and the
focus is on contemporary phenomenon within real‐life context. Thus, selecting Agder
Biocom as the critical unit, the case study approach should provide interesting insights to the
emerging bio‐energy market in Norway. Agder Biocom was selected because of its unique
gasification technology, its healthy financial investors and its staff’s competence. Yin (2003)
also argues that finding a critical case is more appropriate at generating valid results
compared with random sampling.
A frequent criticism of case study methodology is that its dependence on a single case
reduces its capability of providing a generalizing conclusion (Flyveberg 2006). The aim of this
paper is however not to generate new theory, but rather gain exploratory insights to an
emerging industry. Findings related to Agder Biocom should be valid for similar cases and
thus be of interest to business managers and academics working with energy brands in B2B
contexts.
Given the exploratory case study design, a set of guidelines are followed in order to
structure the work of this paper. As Yin (2003) argues fieldwork, and data collection may be
undertaken prior to definition of the research questions. A pilot study was conducted in
order to gain insights to the selected case and industry at hand. Findings from the pilot study
provided the framework and research questions for the main study in this paper.
2.2 Data Collection According to Yin data collected for single case studies are not restricted to one source in
order to examine a limited number of variables, but allows evidence from multiple sources
(Yin 2003). The following section presents how the different data was collected, and
analyzed in order to live up to the case study ideal of valid interpretations. Yin comments
about the importance that analysis show it relies on all the relevant evidences with no loose
ends (Yin 2003). Thus, it was selected multiple data collection methods in order to gain as
much insight as possible to the emerging bio‐energy market. The data collecting process
follows guidelines set by King et al (1994) in order to improve the data quality.

Brand Management in the Energy Sector 14
Secondary Data
Scientific papers & books
This paper did not succeed in finding previous similar studies within the given industry. An
extensive literature search on books and scientific papers from similar B2B settings was
conducted. Only peer evaluated articles and leading published books are included in the
paper. Four books form the basis in this paper. The first is written by Reynolds and Olson
(2001) “Understanding Consumer Decision‐making: The Means‐end Approach to Marketing
and Advertising Strategy.” As the authors point out, means‐end studies are often found in
different peripheral journals. The authors should be considered as pioneers within the
method and are somewhat positive towards it. Although the book deals with criticism
against the means‐end theory, the authors’ positive view could harm the objectivity when
considering the method. Similar critics could also be claimed towards Kotler & Pfoertsch
(2006) “B2B brand management”, Kotler & Keller (2006) “A framework for marketing
management” and Keller (2008) “Strategic brand management”. The books are made up by
combining mainly theories and case studies. The books offer little empirical evidence and
thus the conclusions in the book could be questioned. The books are chosen given their
practical approach to brand management and insights to B2B related considerations.
Theories applied in this paper stems from research in major American and European
markets. It should be critically adapted to the biomass heating plant in Norway. The
application of theories and models are discussed throughout the paper.
Reports and publications
Governmental institutions such as Enova, Regjeringen, Innovation Norway and NoBio have
produced several reports covering bio‐energy available for the public. The reports are
considered to be of high quality and reliable sources in this paper.
Web pages, brochures, etc
Data was collected in order to better understand the competitive frame of reference. While
the data offers insight to the competitive frame of reference, further research is suggested
in order to validate findings.

Brand Management in the Energy Sector 15
Primary Data
Interviews with selected people in the industry were conducted. A line is drawn between
informants and respondents. First part of the interview guide in appendix 2 was followed for
each informant. However, each informant was told to speak freely in order to elicit any
relevant information. Appendix 1 shows main findings from the expert interviews. The
informants are considered to be experts in the industry. An expert is defined as a person
who has knowledge about the biomass heating plant industry, in particular the 1‐2 Mw
segment.
6 respondents were used as the sampling unit in the means‐end research. Appendix 2 shows
the interview guide used for each informant and/or respondent.
2.2.1 Validity & Reliability Secondary data are collected from leading institutions and journals. Although their initial
purpose served another research agenda, they are considered to be of high quality and
reliable sources in this paper. Still, data are considered from the angel of the research
statement and could harm the reliability and validity.
Findings in this paper seem to fit with research carried out in similar B2B contexts. The
consistent findings enhance the reliability and validity.
Given the limited resources primary data was only collected from companies in the Southern
Norway and companies surrounding Oslo. Further, 3 consultants and 3 deciders within the
industry were classified as respondents. Adding more respondents to the research could
further enhance the validity and provide a stronger case. It is recommended that further
resources are made available to conduct a quantitative research in order to validate findings.
2.3 Theoretical Framework Chapter 3 ‐ Analysis of the External Environment
Kotler & Keller (2006) form the basis for the theoretical approach in chapter 3. According to
Kotler & Keller DESTEP analysis can be applied in order to understand macro trends and how
they influence future demand for a given market. It is applied in order to discuss future
demand for bio‐energy in Norway and possible barriers. Porter’s five competitive forces
model is applied to discuss the heating plant industry’s attractiveness. Findings from the two
classical models are then related to Keller’s brand value chain (Keller 2008 p.314). Findings

Brand Management in the Energy Sector 16
are related in order to discuss whether investments in brand should translate into
shareholder value or not in the given industry.
The DESTEP model and Porter’s five competitive forces model have been criticized for its
static nature and the lack of portraying how a range of markets influence each other. It is
argued that such weaknesses do not affect the application of the models, and is thus not of
relevance in this paper. More recent publications have criticized the models and the focus
on competition in a fixed market structure. It relates to what Chan and Mauborgne would
address as a red ocean strategy (Chan & Mauborgne 2005). According to them, fixed market
competition leads to fiercely competitive industries with zero‐sum conditions. Given the
growth of the market, the models are suggested to provide valid insights on how to generate
shareholder value for Agder Biocom’s owners. Blue ocean strategies make more sense when
industries are decreasing and hardly attractive.
Chapter 4 ‐ Analysis of the Industry Context Factors
Kotler & Pfoertsch (2006) guide the theoretical work in this paper. The purpose of the
chapter is to discuss the structure of the market. Theories according to Kotler & Pfoertsch
are applied when discussing the buying situation, the buying process, the buying center and
the role of branding. Insights to the industry were gained through secondary and primary
empirical data. Findings from the industry are discussed against the theoretical framework
applied.
Chapter 5 – Qualitative Research Method
Limitations regarding time and money are reasons to choose qualitative methods over
quantitative methods in this particular case. Also, qualitative methods provide an
opportunity to gain preliminary insights into organizational decision making. According to
Hair et al qualitative research methods have important uses in understanding and resolving
business problems (Hair et al 2006 p.173). Keller (2008 p.354) also comments that
qualitative research techniques can identify brand associations and sources of brand equity.
It fits with the exploratory nature of the research objective, as most qualitative research
designs follow an exploratory research approach (Hair et al 2006 p.174). The major
advantages of using qualitative research methods over quantitative research methods are

Brand Management in the Energy Sector 17
the richness of data, the economical ease of use and an opportunity to get first hand
experiences with customers (Hair et al 2006 p.174). The main disadvantages are small
samples sizes and the personal interpretation of the data. Qualitative research was chosen
over quantitative due to the nature of the industry. It should be classified as an immature
industry where little is known about the market structure, decision making and the buying
process.
Means‐end chain theory
The means‐end theory in marketing literature was introduced by Gutman (1982) and seeks
to understand purchase behavior as a means of satisfying different levels of needs. The
method is applied in this paper because it allows the researcher to gain preliminary insights
into business buying behavior in order to craft sustainable positioning statements. Means‐
end chain analysis presents a research method to link perceived product /service attributes
to benefits and customer values. Although the method is predominately used for brand or
product positioning issues in B2C markets (Reynolds & Gutman 1984), laddering has also
been applied to research in industrial markets (Reynolds & Olson 2001). Reynolds & Olson
(2001) explain how means‐end chain theory and laddering interviews have been used in
order to enhance understanding of buying behavior in industrial markets. They argue such
understanding is needed in order to achieve leverageable and sustainable competitive
advantage in business markets (Reynolds & Olson 2001 p. 319).
Means‐end theory is an umbrella concept. Reynolds & Olson (2001) have summarized the
most important principles about the means‐end theory and serves as presumptions in this
paper:
• Consumers seek alternatives that either provide positive consequences (benefits) or
avoid negative consequences (risks).
• Consequences can be functional (more immediate and rational) or psychological
(more personal, emotional and long term).
• Between two alternatives the consumer will choose the alternative most likely to
provide benefits or avoid risks related to his or her most important values.
Consequences and not product or service attributes are the consumer’s focal
concern.

Brand Management in the Energy Sector 18
In‐depth laddering interview
In‐depth interview is chosen over focus group because in‐depth methods are especially good
for learning more about the buyer and the buying processes in B2B markets (Block & Block
2005 p.87). More specifically laddering interview was chosen. Laddering interview is an
effective method to evaluate and draw implications about the means‐end theory (Reynolds
& Gutman 1984). The laddering interview is a tailored interviewing format using primarily a
series of probes by asking questions as “why is that important to you?” It provides a guide
for conducting interviews, and also for analyzing data. According to Wansink (2003) the
laddering method has its most interesting application for identifying sources to brand equity
and designing positioning strategies. Or as Wansink puts it: “Laddering can tap into the set of
meanings and associations that differentiate the product (brand) from the competition”
(p.116). The interview guide used in this paper can be seen in appendix 2. Results from the
study are analyzed and discussed in chapter 5.
Limitations
Some researchers claim means‐end chain theory and laddering have limitations with validity
and reliability due to the subjective interpretation of data (Reynolds & Olson 2001). As such,
the method calls for skilled interviewers (Reynolds & Gutman 1984). The lack of experience
by the interviewer could in this case influence the validity and reliability of findings. Another
limitation is that there is no formal agreement of what laddering is supposed to do (Grunert
& Grunert 1995). While academics agree on the concept means‐end chain theory, several
interpretations and laddering methods exist. Critics argue people in organizations are driven
only by rational organizational values, and not by emotional personal values. An overarching
claim of the means‐end theory is that people in organizations are driven by both.
Chapter 6 ‐ Frame of Competitive Reference
Kotler & Keller (2006) and Keller (2008) are selected in order to guide the work of addressing
the competition. Keller & Kotler (2006) is applied when discussing the value added features
of biomass heating plants through product and service differentiation amongst main
competitors. Keller’s theories is applied in order to discuss how points‐of‐parity and points‐
of‐difference association should be built and managed. Secondary data collected from web

Brand Management in the Energy Sector 19
pages, brochures and expert interviews are used in order to apply theories to the given
industry. The selected theories will be critically discussed were applied.
Chapter 7 – Gaining a competitive advantage
An analytical framework was constructed in order to present and discuss findings in this
paper. Some general considerations led to the development of the analytical framework.
First, this paper did not succeed at finding pervious methods suited for its research purpose
and the unit of analysis. Although several textbooks exist, no book is customized to fit the
situation at hand. Second, recent peer evaluated publications have brought some interesting
reflections not discussed in the books selected for this paper.
Keller & Webster (2004) have published an article that offers guidelines for branding in
industrial markets. Their work set the ground rules for the analytical framework presented in
figure 2.1. The framework pinpoints the importance of balancing a top‐down and bottom‐up
brand strategy activities in business markets. The framework structures the discussion on
how Agder Biocom could organize its business in order to gain an attractive positioning in
the biomass heating plant industry. Each of its components is discussed below.
Figure 2.1: Brand strategy and competitive advantage
Comments:
The first part
According to Kotler & Pfoertsch (2006 p.69) a holistic brand strategy should be reflected in
everything a company says and does. They further claim that the B2B branding strategy
(p.168) should always be built on brand positioning, brand value proposition, brand promise,
brand mission and brand architecture. This paper is preoccupied with brand positioning.
Kevin L. Keller’s CBBE model (2008 p.61) is applied in order to discuss proper positioning,
Decision makers / influencers Role 1 Role 2 Role 3 Role 4 Etc….
B2B brand values Value 1 Value 2 Value 3 Value 4 Etc….
Solution Benefit Stack Benefit 1 Benefit 2 Benefit 3 Benefit 4 Etc….
B2B brand positioning

Brand Management in the Energy Sector 20
points‐of‐parity and points‐of‐difference associations. The model is selected because of its
widely accepted application in B2C markets. The CBBE model has recently attracted
attention in B2B markets. In their book “B2B Brand Management”, Kotler & Pfoertsch has
devoted two pages to its application in business markets. The model will be critically applied
in the biomass heating plant industry in order to discuss sources to brand equity.
As demonstrated in figure 2.1, a B2B brand positioning should be relevant for all significant
decision makers in a given context. It thus offers a top‐down approach to branding.
The second part
The B2B brand values box is freely adopted from the work of Lynch & de Chernatony. Lynch
& de Chernatony have been cited in several leading books concerning B2B branding,
including “B2B Brand Management” by Kotler & Pfoertsch. In their paper “Winning hearts
and minds: business‐to‐business branding and the role of the salesperson” Lynch & de
Chernatony (2007 p.123) claim that effective communication of brand values are essential in
order to realize the potential of B2B brands. They make the distinction between functional
and emotional brand values and claim that B2B brands built solely around easily imitated
functional values will always be vulnerable to attack from competitors. The B2B brand values
box are applied to the given industry in order to discuss brand values relevant for significant
decision makers. It is also applied in order to discuss how Agder Biocom could organize its
business around a set of brand values in order to gain a distinct brand identity in the given
market place. As shown in figure 2.1, different members of the decision making unit are
persuaded by different values. Thus, a company should tailor its communication to each.
The third part
The solution benefit stack is adopted by the work of Narayandas. His work is widely adopted
in industrial markets, and he is included as a co‐writer in Anderson & Narus 2008 edition of
“Business market management”. Narayandas argues in his paper “Building loyalty in
Business markets” that “companies tend to apply consumer marketing solutions to business
markets willy‐nilly with poor results” (Narayandas 2005 p. 131). One of his main arguments is
that companies in business markets must use an approach that is based on benefits rather
than features. He argues brands are being perceived similar in business markets and
suggests benefits be classified into four categories; tangible/nontangible financial benefits
and tangible/nontangible nonfinancial benefits. The solution benefit stack is the result of
combining benefits that delivers superior value for the customers. The model is applied in
Brand Management in the Energy Sector 21
the given industry in order to better understand how Agder Biocom can attract customers.
Figure 2.1 shows how different members of the decision making unit seek different benefits.
It offers a bottom‐up approach to branding and suggests each buying situation is unique.
The analytical framework is constructed by comparing different leading theories and models
within business market management and brand management. Its application to the biomass
heating industry will be critically discussed when presented in chapter 7.
2.4 The Subject of Study ‐ Agder Biocom The subject of study is an experienced player within biomass heating plants in Norway. It is
located in the Southern part of Norway and has over 50 years of experience with biomass
heating plants. The history stems from a previous company called Saxlund. The name Agder
Biocom was established in 2002. It was later bought up by the Tratec Group in 2007 as part
of a major investment in bio‐energy. Agder Biocom makes an interesting case due its core
members. Jan Bjarne Wormli and Frode Alvsnes are considered two pioneers within the
biomass heating plant industry. They have patented a new technology that they claim has
the capability to outcompete existing solutions in the industry. Backed by the capital strong
Tratec Group, it has a strong business model and a great product. It has the proper
foundation to create and sustain a strong B2B brand.
The patented technology
Agder Biocom has a patented gasification solution that burns with different types of
biomass. Gasification is a method for extracting energy from different types of organic
materials. It is a known technology in industries such as waste management and gasification
of fossil fuels (coal). Although the technology has existed since the 70’s, no commercialized
solutions have existed for biomass heating plants. What gasification does, compared with
traditional combustions, is that it generates syngas1 out of biomass. It is a process that
extracts energy more efficient resulting in less energy waste compared with traditional
biomass combustions. Appendix 3 offers additional insights to the technolog.
1 Syngas is created when biomass is burned at 400 degrees Celsius. Traditional solutions burn biomass at around 800 degrees Celsius.
Brand Management in the Energy Sector 22
Benefits for the customers
Agder Biocom’s managers claim gasification is superior to existing combustion solutions on
several dimensions. Initial tests have shown several possible benefits for the customers:
It has lower investment costs. It generates less energy waste. The solution is compact thus it is easier to transport and more convenient to place. It needs less maintenance. It has longer operating hours before it needs replacement. It can be customized to fit each customer’s needs.
The offering
Agder Biocom is looking to offer a complete biomass heating plant for its potential
customers in the biomass heating plant industry. The gasification module is only one part of
a larger solution. A complete plant includes the biomass combustion, the gasification
module, a heating central and material handling. Appendix 3 shows a typical heating plant
ranging 1 – 2 Mw.
2.4.1 Segmentation according to Mw The biomass heating plant industry can be divided into four different segments according to
the size of MegaWatt (Mw). Mw is an indicator of the size of a heating plant or how much
power it generates. Plants that are capable of producing 1 Mw will typically support water‐
driven heating to midsized buildings such as schools, industry buildings and hospitals. It is
identified four segments ranging from 0,5 Mw to 10 Mw in the given industry. For a
complete segmentation list refer to appendix 4.
Initial tests done by Agder Biocom conclude that the gasification technology is too expensive
for smaller plants and cannot compete with traditional solutions producing under 1 Mw.
Traditional solution burn wood pallets or briquettes and dramatically lowers costs on the
heating plant in segments below 1 Mw. The cost structure changes in favor of gasification for
solutions above 1 Mw. Initial market analysis have identified a promising segment in the
heating plant industry between 1 Mw and 2 Mw. Solutions above 2Mw normally burn with
crushed wood that the gasification technology does not handle properly at the moment.
Thus it is argued that Agder Biocom should compete within the 1‐2 Mw segment.
Brand Management in the Energy Sector 23
2.4.2 Segmentation according to the Customers Within the 1‐2 Mw segment it is possible to target a selected group of customers. Customers
from several businesses are looking to buy bio‐energy solutions. It is possible to target
according to type of usage, size of the customer, geographical location, etc. It will not be
further elaborated on in this paper as it is an emerging industry where no attractive target is
identified yet. The target market is set to all customers in Norway looking to buy a biomass
heating plant ranging 1‐2 Mw.
2.4.3 Agder Biocom’s main Strengths and Challenges The gasification technology has attracted attention amongst players in the industry, but key
decision makers in industrial buying centers do not show same kind of enthusiasm. Initial
sales efforts indicate that focus on price and technology no longer provide sufficient
arguments. Competitors have differentiated their offerings to include product, ‐ and service
value‐added features. While Agder Biocom has several internal strengths and a great
product, it has not focused on the market and the lens of the customer. It is a well‐
established agreement that creating value for customers is an important source to
competitive advantage in business markets (Anderson & Narus 2006). The paper thus set out
to explore the external environment.

Brand Management in the Energy Sector 24

Brand Management in the Energy Sector 25
Chapter 3 ‐ Analysis of the External Environment
Data is collected from various reports, white papers and interviews with experts in the
marketplace. Previous studies on biomass markets in Norway conclude it is a lack of
information on market conditions such as process, production volumes, costs and trade
(Trømborg et al 2008). This insight led to a preliminary decision to base the research on
qualitative data.
3.2 Market Attractiveness Studies done by company Frost & Sullivan (2009;1) report that green energy industries have
grown rapidly the recent year and attracted quadrupling investments the last four years in
Europe. The growth is explained with fundamental factors as need for energy diversity and
environmental concerns combined with a record high oil price. Several European alliances
and Norwegian Governmental strategies seek to create competitive and healthy alternative
energy markes in Norway (St. meld. Nr 34 2006‐2007 p. 108‐111). Appendix 7 compares
energy for heat production according to the Nordic countries. It shows Norway has invested
less in bio‐energy compared with its neighbor countries. The Norwegian Government has
stated that biomass energy production shall increase from current 16 Twh to 30 Twh within
2020. To reach its targets, several initiatives are taken in order to develop competitive
supplier markets and end user markets.
3.2.1 DESTEP Analysis The value chain for the heat market can be seen as presented below in figure 3.1 and set the
point of departure for the analysis.
Figure 3.1: Heat market value chain Source: Freely adopted from Enova
Up‐stream market Biomass providers
and heating plant providers
Down‐stream market
End users and customers
Heat
Market

Brand Management in the Energy Sector 26
Comments:
Kotler & Keller (2006) address the importance of understanding how macro environmental
trends influence demand in a market. According to the authors, the macro environment can
be divided into six major components often referred to as DESTEP analysis.
A detailed DESTEP analysis covering the heat market value chain is presented in appendix 5.
One crucial finding across the value chain is the political will to use alternative energy.
According to Rolf Hermansen (interview 2009), Rune Valla (interview 2009) and Christian
Brennum (interview 2009) the political will is supported by the general public and opinion
leaders in Norway. Bio‐energy also provides economic incentives for private investors.
Combined, it seems these favorable trends will enhance future demand for bio‐energy as
suggested in various public reports. Identified factors that enhance the future demand for
bio‐energy include the following:
Municipalities in Norway need to convert to alternative energy sources within 2010, and
bio‐energy is the only realistic alternative (interview with Rolf Hermansen 2009). The
Norwegian Government has stated it will increase bio‐energy production with 14 Twh
within 2020 (st meld nr. 34 2006‐2007).
Public owned agencies such as Enova and Innovation Norway support funding for
investment costs to bio‐energy related investments. The agencies also offer competence,
‐ and advice services throughout the value chain.
Tekn 07 states that all new buildings in Norway need to address alternative energy
sources.
Reduced paper production has created a new business for farmers. Farmers used to send
their timber waste to the paper industry, but are now converting to create bio‐energy
companies throughout the value chain (interview with Sigbjørn Bråtane 2009).

Brand Management in the Energy Sector 27
Major Barriers in the Market
Due to an immature market with lack of experience, the market is not expected to grow into
a sustainable business before 2010 the earliest. Enova has identified some major barriers
listed below presented in the whitepaper “Ti år med røde tall” (2007).
End markets lack proper infrastructure for water‐borne heating systems
An immature market with lack of experience throughout the value chain
Low profitability
Low price on electricity
High investment costs
Comments:
The DESTEP analysis show favorable trends for bio‐energy in the heat market in Norway. It is
a considerable large, growing and attractive market, something early observations confirm.
Internal data presented by Tratec Group show an expected 20 percent yearly growth in the
market. It should be noted that these factors may change over time and should be updated
on regular basis in order to identify further opportunities and barriers in the market.
3.2.2 Competitive Analysis According to Keller & Kotler (2006) Porter’s five competitive forces is a widely apllied and
well‐tested model to determine an industry’s long‐term attractiveness. The model will be
applied and follows guidelines as presented by Keller & Kotler (2006) in order to discuss
whether or not the biomass heating plant industry is a favorable industry to compete in.
Bargaining Power of Suppliers – Very favorable
A complete heating plant consists of many components. According to Christian Brennum
(interview 2009) it seems that maturing supplier markets outside Norway have created
highly favorable conditions for the heating plant industry. Well tested and reliable suppliers
from Denmark, Finland, Sweden and Austria offer a range of components for biomass
heating plants in Norway (interview with Jan Bjarne Wormli 2009).

Brand Management in the Energy Sector 28
Bargaining Power of Buyers ‐ Favorable
As shown in appendix 4, it is expected that customers from various businesses are likely to
buy heating plants in the coming years. Customers such as energy providers, industrial
buyers and municipalities are looking to buy biomass heating plants. The diversified
structure of buyers should offer more favorable conditions for the heating plant industry.
Heating plants are highly differentiated and switching costs are high amongst buyers. Such
factors should lower the bargaining power of buyers thus making more favorable conditions
for heating plant suppliers.
Derived demand
Eventually the demand for biomass heating plants is driven by the derived demand from end
customers and the residential market (interview with Christian Brennum 2009). While it is
difficult to argue the effect on environmental concerns, it seems that the residential markets
support Governmental energy politics and thus support bio‐energy (interview with Rune
Valla 2009).
Current Competition in the Biomass Heating Plant Industry ‐ Unfavorable
Appendix 6 offers an overview over existing competitors in segments ranging 0,5 ‐ 10 Mw.
The numbers show the biomass heating plant industry is made up with many small players
were no competitor has a dominant position. It appears to be a highly competitive
environment where several aggressive players are looking to secure a healthy position. Two
identified factors should create a more competitive environment. Customers in the industry
seem to perceive little product or service differentiation amongst biomass heating plants
(interview with Christian Brennum 2009). Heating plants also have relative high investment
costs as will be demonstrated in chapter 4.
Comments:
Current rivalry amongst competitors could be explained by the industry’s immature life stage
(report Enova 2007). It supports the claim to classify the industry as emerging. Conditions in
the macro environment have created a window of opportunity for private investors in the
industry. Given the growth, it is expected that rivalry amongst competitors will change and
provide more favorable conditions on long term.

Brand Management in the Energy Sector 29
Threat of New Entrants – Unfavorable
In general, three factors attract new entrants to the biomass heating plant industry. First,
surrounding industries facing maturing markets sees bio‐energy as a new opportunity to
extend their business. Second, public agencies such as Enova offer funding for bio‐energy
initiatives in the industry. The funding carries a lot of investment costs, thus lowering entry
barriers for new entrants (interview with Sigbjørn Bråtane 2009). Third, the favorable sub‐
supplier conditions seem to make it easy for new entrants to import quality products and
claim to be a reliable supplier of biomass heating plants. Observations show three nearby
industries who are converting their solutions to include biomass heating plants. It interrupts
with the competitive environment for more traditional biomass heating plant suppliers.
Plumbers face maturing markets in different industries, and are turning towards alternative
energy as an increasingly attractive industry (Egeland 2009). Plumbers are already involved
in bio‐energy as they lay the piping needed for water‐borne heating. Companies such as
Askim & Mysen Rør and OSO hotwater offer solutions with biomass heating plants.
Fossil heating plant suppliers also offer biomass solutions (interview with Rolf Hermansen
2009). With experience from similar solutions within oil or gas, it seems convenient for fossil
heating plant suppliers to convert over to biomass (interview with Sigbjørn Bråtane 2009).
With decreasing trend for oil and gas, it is only reasonable to assume that such companies
seek new market opportunities. Companies such as RSM and MT Varme are previously oil or
gas providers who now also offer biomass alternatives.
Last, suppliers of farmer equipment are getting greener and look towards bio‐energy. As was
shown in the DESTEP analysis, farmers are becoming an important group that drives the
demand for bio‐energy. One example of such company offering biomass heating plants is Ole
Chr. Bye AS.
Comments:
The industry has experienced unserious players, and customers are somewhat reluctant to
try out new companies (interview with Lars Bugge 2009). Biomass heating plant technology
is considered as complicated, and needs certain expertise in order to deliver as promised.

Brand Management in the Energy Sector 30
Although entry barriers seem low, the industrial culture works as a barrier. As a result,
customers often demand references in order to make sure solutions are reliable (interview
with Rolf Hermansen 2009).
Threat of Substitutes – very Favorable
Bio‐energy competes with other energy‐sources, in particular oil, natural gas and electricity
(interview with Christian Brennum 2009). Prices on these substitutes directly relate to
demand for biomass heating plants (interview with Rune Valla 2009, Lars Bugge 2009, Rolf
Hermansen 2009. Expected higher prices and taxes on oil, natural gas and electricity create
very favorable conditions for biomass energy (interview with Rolf Hermansen 2009).
Solar power and wind power has attracted the interest of investors and politicians in
Norway. In current picture, solar and wind power are not defendable business projects.
Governmental and private initiatives suggest that the future includes solar and wind power
and could thus pose a significant threat in the future. In the coming years, it seems bio‐
energy is the only realistic green alternative (interview with Rolf Hermansen 2009, Rune
Valla 2009).
Conclusion Market Attractiveness:
High rivalry amongst current competitors in the industry combined with attractive conditions
for new entrants make this industry less attractive. It could explain an observation done by
the Tratec Group that the market profitability is only around 1% in the industry. It could lead
to fierce price competition. However, favorable conditions in the three other competitive
forces show an attractive industry on long‐term. Due to the early stage in the market life
cycle, one should expect high investment costs in order to secure a profitable future
position. Findings are summarized underneath in figure 3.2.

Brand Management in the Energy Sector 31
Figure 3.2: Competitive forces in the Biomass heating plant industry
3.3 Investment in Branding According to Kotler & Pfoertsch (2006 p. 20) there are differences between B2C markets and
B2B markets. Most branding theory is adopted from B2C settings and should be critically
adapted to the current industry. Kim et al (1998) argue the importance of brand equity in
B2B markets may vary according to product type and purchase situation. Some observations
from the industry are discussed before evaluating if branding could create value in the given
industry.
Market Dynamics
Critics in the industry claim that branding is not relevant due to the static nature of the
market (interview with Lars Bugge 2009). In the given industry, customers only buy biomass
heating central once every 20 years or so (interview with Lars Bugge 2009). In a study
performed by Rauyruen & Miller, customer satisfaction was found to influence both
attitudinal loyalty and behavioral loyalty in B2B markets (Rauyruen & Miller 2007 p.21). By
conducting research on small to medium enterprises (SME) in Australia they identified that
attitudinal loyalty provides positive word of mouth, recommending the service to others and
encourages others to use the service (Rauyruen & Miller 2007 p.22). Their argument is that
Competition amongst current biomass heating plant suppliers
Threat of new entrants such as plumbers, farmer equipment suppliers and gas/oil suppliers
Unfavorable
Unfavorable
FavorableVery favorable
Very favorable
Suppliers of heating plant components from maturing markets in Denmark, Finland, Sweden and Austria
Customers and future prospects in business areas such as energy companies, municipalities and industry
Threat of substitutes such as oil, gas, electricity, wind and solar energy

Brand Management in the Energy Sector 32
the importance of brand management and of portraying a good image of the organization as
a whole contributes to attitudinal loyalty in B2B markets (Rauyruen & Miller 2007 p.28).
While it is difficult to valid these findings in the given industry, several informants
acknowledged the importance of word‐of‐mouth. Thus, the attitudinal loyalty benefits
support investments in branding in the given industry.
Critics also claim it is impossible to escape from the price pressure in the given industry.
According to Keller (2008) B2B markets range on a continuum from high‐tech to
commodities depending on the product sold. Given the complexity of biomass heating
centrals, it is argued that the given industry should be classified more towards high tech
rather than a commodity market. In a study performed by Ruth Maria Stock, she found
empirical evidence supporting B2B managers could expect somewhat reduced price
sensitivity from highly satisfied customers (Stock 2005 p.78). By conducting study on various
salespeople in a B2B context, results indicated that: “….under the circumstance high
product/service complexity it is particularly realistic to expect reduced price sensitivity from
highly satisfied customers” (Stock 2005 p.78). It is difficult to validate these findings to the
given industry. But as commented by Lars Bugge (interview 2009) and Tormod Gevelt
(interview 2009), it is a culture phenomenon in the industry of sticking with known reliable
suppliers. While it was not expressed by the informants, it could indeed imply reduced price
sensitivity. The finding supports the argument to claim that a strong B2B brand could escape
from purely price competition in the given industry.
Another interrupting factor is the Governmental involvement within the industry (interview
Christian Brennum 2009). Large energy companies have been given conventions to control
markets in all major cities in Norway (interview with Rune Valla 2009). Different regulations
might interrupt with branding, but will not be treated in this paper. It is set as a limitation.
Brand Management in the Energy Sector 33
3.4 Market Attractiveness and Multipliers in the Brand Value Chain Keller explains brand value creation as a process consisting of various stages in his brand
value chain (Keller 2008 p.318). According to the brand value chain, the extent to which
value created in the minds of consumers translates into shareholder value depends on
certain factors in the marketplace. A favorable marketplace exists when competitors fail to
provide significant threat, when suppliers provide strong support and a considerable number
of profitable customers are attached to the brand (Keller 2008 p.321).
The DESTEP analysis show favorable trends that are likely to increase the demand for
biomass energy in the future. The competitive landscape identified a considerable large and
attractive group of customers that make up an attractive industry on long‐term. Although
the industry is immature with many small players competing for market shares, it is
reasonable to claim that the Norwegian biomass heating plant industry is an attractive
industry to build a B2B brand. Efforts done to build strong, favorable and unique associations
in the mind of the consumers should translate into active, loyal customers and eventually
shareholder value. The uncertainty lies in constant changing conditions in the market place
combined with own management of brands.

Brand Management in the Energy Sector 34
Brand Management in the Energy Sector 35
Chapter 4 – Market Dynamics and Size of the Buying Center
The purpose of this chapter is to present the structure of the biomass heating plant industry
segment 1‐2 Mw. Findings in this chapter will be applied at a later stage when discussing the
implication of brand management. According to Keller & Kotler (2006 p.107) the main
difference between B2C markets and B2B markets are the two types of customers. Thus, the
buying situation and the decision making process differ and have implications for branding.
4.2 Perceived Risk Customers looking for biomass heating plant solutions must accept higher risk compared
with oil, gas and electricity (interview with Sigbjørn Bråtane 2009). Compared with its
alternatives, converting to biomass solutions is similar to converting from driving a car to
driving a combat wagon (interview with Lars Bugge 2009). Keller & Pfoertsch (2006) claim a
strong brand reduces risk for its customers. According to Kapferer: “Brands reduce perceived
risk, and exist as soon as there is perceived risk (Kapferer 2008 p.20)”. Thus risk is addressed
explicitly in this section.
Unserious Offerings
The industry has experienced unserious suppliers who have not delivered as promised
(interview with Rune Valla 2009). It is somewhat easy to import biomass heating plants,
claim to be competent and promise a reliable solution. It takes a lot more in order to actually
deliver as working solution (interview with Rune Valla 2009). Unserious attempts have raised
claims against companies who seek to establish its position in the industry. Lars Bugge
(interview 2009) commented it is difficult to separate information about various suppliers
and identify the ones who are professional. It seems key decision makers in the industry
perceive risk because of the uncertainties of knowing whether or not one deals with a
professional supplier and what information to trust.
High Investment Costs
A biomass heating plant that produces 1 ‐ 2 Mw is a relative high investment in itself. The
plant is a multi‐million NKR investment. In addition, investment in water‐borne heating often
includes piping and proper infrastructure. The lack of water‐borne infrastructure was also
identified as a possible barrier in the DESTEP analysis in chapter 3. Figure 4.1 below

Brand Management in the Energy Sector 36
demonstrates how biomass has considerable higher investment costs compared with other
energy carriers.
Figure 4.1: Investment structure Source: Freely adopted from Lars Bugge (2009)
Comments:
The model does not portray actual differences in monetary terms, but it demonstrates how
bio‐energy competes with other sources of energy. Choosing bio‐energy is also choosing a
higher investment cost, thus accepting a higher short term financial risk (interview Lars
Bugge 2009). As the figure also shows, bio‐energy offers lower operating costs and thus a
more economic rational motive on long term. But consumers often confuse price and costs,
and more often than not focuses on acquisition costs (interview with Lars Bugge 2009).
Complications with Supply and Operations
Although several reports conclude the support of biomass, it is a perceived risk with reliable
supply. Not all areas in Norway are covered with reliable biomass supply. In addition,
previous solutions have not been able to burn biomass properly. It has caused several delays
in the production and irritation for users in the industry (interview with Siren Frigstad 2009).
Because each buying situation demand a tailored heating plant it is difficult to identify
solutions that offer both quality and reliability (interview with Sigbjørn Bråtane 2009).
It seems consumers in the industry are affected by the perceived risk associated with
biomass. It could explain why the buying process often becomes complex with large and
confusing buying centers (interview with Jan Bjarne Wormli 2009).
Energy carrier
= Net share costs =Operating costs = Investment costs
(Solar)Bio‐energyGas/oil Electricity
Total cost
Brand Management in the Energy Sector 37
4.3 Size of the Buying Center and the Buying Process Although each buy is unique, it seems two basic buying situations often occur in the given
industry for the segment 1‐2 Mw. The size of the buying center and the complication of the
buying process seem to vary accordingly. One interesting observation is that only in rare
situations do straight re‐buy occur in the industry (interview with Jan Bjarne Wormli 2009).
In most cases, one of the two situations as presented below occurs.
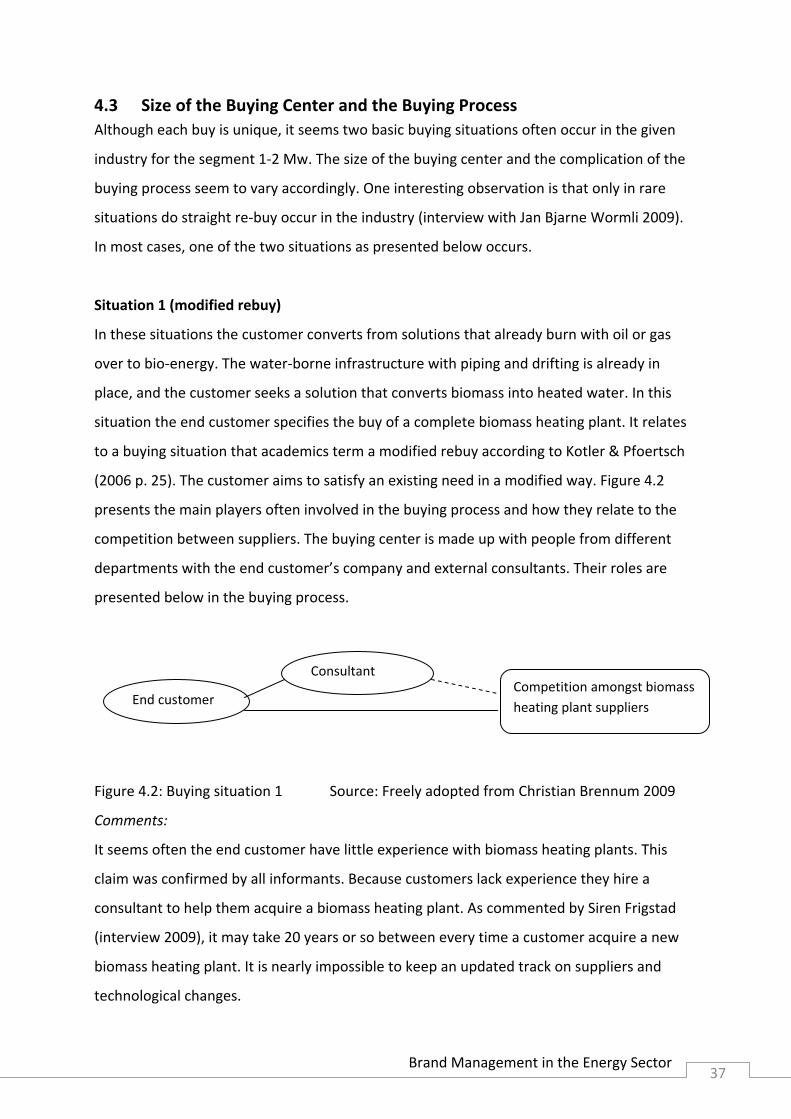
Situation 1 (modified rebuy)
In these situations the customer converts from solutions that already burn with oil or gas
over to bio‐energy. The water‐borne infrastructure with piping and drifting is already in
place, and the customer seeks a solution that converts biomass into heated water. In this
situation the end customer specifies the buy of a complete biomass heating plant. It relates
to a buying situation that academics term a modified rebuy according to Kotler & Pfoertsch
(2006 p. 25). The customer aims to satisfy an existing need in a modified way. Figure 4.2
presents the main players often involved in the buying process and how they relate to the
competition between suppliers. The buying center is made up with people from different
departments with the end customer’s company and external consultants. Their roles are
presented below in the buying process.
Figure 4.2: Buying situation 1 Source: Freely adopted from Christian Brennum 2009
Comments:
It seems often the end customer have little experience with biomass heating plants. This
claim was confirmed by all informants. Because customers lack experience they hire a
consultant to help them acquire a biomass heating plant. As commented by Siren Frigstad
(interview 2009), it may take 20 years or so between every time a customer acquire a new
biomass heating plant. It is nearly impossible to keep an updated track on suppliers and
technological changes.
End customer
Consultant Competition amongst biomass heating plant suppliers

Brand Management in the Energy Sector 38
Situation 2 (new task)
In these situations the end customer wants a complete heating solution. The end customer
needs someone to install and drift a biomass heating plant in order to generate heated
buildings (interview with Christian Brennum 2009). Academics term such situations as new
task according to Kotler & Pfoertsch (2006 p.25). The customer is confronted with a new
requirement for a service or a product. It complicates the work of identifying participants in
the buying center. Figure 4.3 below presents different players who are involved in the
buying process and how they relate to suppliers of heating plants.
Figure 4.3: Buying situation 2 Source: Freely adopted from Christian Brennum 2009
Comments:
A piping company is needed in order to perform the piping work under the ground and in
the buildings in new task situations. Further, an energy company is often needed in order to
run the productions and operations of the biomass heating plant. Most often a consultant is
hired in order to analyze the specific need and detail a product specification. The actual
buyer of the heating plant could be the end customer, the energy company or the piping
company according to their role in the buying process (interview with Christian Brennum
2009). In such situations it can be more difficult to identify the persons who make up the
buying center and how they influence the decision making process.
4.3.1 Roles in the Buying Center Interviews conducted identified four roles considered to be significant decision makers in
the industry. The four roles identified were mentioned by several informants. While it is
difficult to argue why these roles are most important, it will be elaborated on underneath.
End customer
Consultant
Energy Company
Piping company
Competition amongst biomass heating central suppliers

Brand Management in the Energy Sector 39
Initiators
Initiators often consist of either a person or a group of people who takes the initiative to buy
a biomass heating plant. As Siren Frigstad (interview 2009) commented such initiatives are
driven by environmental issues or political decisions set by the Governments. This claim is
consistent with findings in chapter 3 were the DESTEP analysis showed how Norwegian
municipalities need to address bio‐energy related investments. A similar claim was argued
by Rolf Hermansen (interview 2009). He explained how initiators are also driven by
economic motives. Converting to biomass solutions provide better economy in the long run.
It is difficult to present a profile on initiators. However, it seems initiators often hold higher
management‐, or higher political positions.
Deciders (project leaders)
Deciders may not hold the formal responsibility, but will often be the project leader in a
work group (interview with Siren Frigstad 2009, Tormod Gevelt 2009). Given this role, he or
she guides the process from start to end. Thus the decider seems to play a crucial role in the
buying process. Most decisions go via the decider. In the end, it is her or she that makes the
final decision on which solution to settle on (interview with Siren Frigstad 2009, Tormod
Gevelt 2009). Deciders seem to have higher education within engineering or economy. They
often hold higher management positions within technical departments.
Consultants (influencers)
All informants in this study pointed out the consultant as the main influencer in the buying
process. The consultant is hired on the background of his or her expertise with biomass
heating plants. While the scope of his or her work varies, the consultant seems to be
involved in earlier stages and have a major impact on later decisions in the buying process.
Thus, it could be argued that they play an equally crucial role as the deciders in the given
industry. Consultants identified in this paper seem to have master degrees within
engineering and hold consultancy positions in established consultancy firms.
Users
As presented above, biomass heating plants need additional work on drifting. It could
explain why users seem to have a significant role in the buying process. For users, it seems

Brand Management in the Energy Sector 40
that a heating plant should be easy to operate, offer reliable drift and easy solutions for
disposal and maintenance. Such claims were also supported by Tormod Gevelt (interview
2009) and Siren Frigstad (2009). Depending on the situation, users seem to be janitors,
technical personnel or the like that will be responsible for the actual drifting of the heating
plant.
According to Kotler & Pforetsch (2006) the buying center could consist of more roles than
the ones identified above. Such roles include approver, gatekeeper and buyer. Such roles
were not mentioned by informants in this paper. This could further support the argument
that the four suggested roles should be classified as most important decision makers in the
given industry. Based on the discussion above, it is reasonable to further classify deciders
(project leaders) and consultants as key decision makers in the given industry.
4.3.2 The Buying Process It should be noted that the following process is an ideal presentation of the buying process.
Each buying situation is different and the model should to be customized accordingly. Often,
companies in the industry seem to go through similar stages but weight each stage different
(interview with Christian Brennum 2009). The general buying process offers insights into
some typical stages, roles and activities in the given industry. It serves the purpose of
indentifying key decision makers and their roles in the buying process.
Stage 1: Problem Recognition and Decision on Biomass
It is often initiators that address the need for heated buildings. The need can be met in
several ways, thus making the application of the competitive forces model relevant. As
commented by all informants, initiators recognize the opportunity for cost reduction or
environmental benefits that bio‐energy offer. In addition, Governmental regulations
presented in chapter 3 often play a significant role for converting existing solutions to run
with bio‐energy. As commented by both Siren Frigstad (interview 2009) and Tormod Gevelt
(interview 2009) initiators often form a control group with the formal responsibility in the
buying process. However, the same informants pointed out that in reality such a group does
not have much power over decision. While the control group may have the authority to
overrule decisions at any stage of the buying process, it is only in rare situations it does so.
Brand Management in the Energy Sector 41
Stage 2: General Need Description
When the need is recognized, a group of people make up a working group. The working
group often includes users, deciders and influencers. Deciders are often technical engineers
or high level managers working for the buying company (interview with Tormod Gevelt
2009). As commented above, influencers are most often external consultants. Also included
are the users who will be responsible for drifting the solution. Depending on the situation, a
number of other roles and responsibilities might be included in the working group. The
working group discusses the general need description.
Stage 3: Product Specification
After initial talks, the control group defines the product specification. According to all
informants, this process is heavily influenced by consultants. It is a difficult task where the
customer often lacks experience with biomass heating plants or the motivation to define the
product specification. Still, the decider set some general guiding rules for what the company
needs. Often price, quality, reliability and references are made explicit as key criterion
(interview Sigbjørn Bråtane 2009). The list of product specification can extend to over 20
product specifications (Rolf Hermansen 2009). According to Governmental regulations it may
be obligatory to publish the offer on Doffin2.
Stage 4: Search for and Evaluation for Potential Suppliers
At this stage, mainly deciders and consultants in the control group search for potential
suppliers. As commented by several informants (interview with Siren Frigstad 2009, Tormod
Gevelt 2009, Lars Bugge 2009) work carried out in this stage is heavily influenced by
consultants. Consultants and in some cases the decider search for and evaluate potential
suppliers in the industry (Lars Bugge 2009). Quality marks as Seleca3 and various
certifications may guide their search (Christoffer Oustad 2009). However, it seems key
decision makers in the industry stick to known reliable solutions (interview with Lars Bugge
2009).
2 Doffin is an online Norwegian national database for public procurement. 3 Seleca is a certification for approved suppliers.

4 Bra
42
Stage 5
After re
consulta
Bugge 2
criteria,
supplier
Stage 6
Ultimat
Tormod
to weig
influenc
(intervie
but nee
price is
solution
Stage 7
Several
Tormod
relation
Thus, bu
with Lar
Summa
Figure 4
Decisiobuy bio
•In
nd Manage
: Proposal s
eceiving sup
ants often p
2009, Rolf H
, normally t
rs are reject
: Supplier E
ely it is the
d Gevelt 200
h different
ces this cho
ew with Lar
ed to make t
an importa
n weights m
and 8: Ord
informants
d Gevelt 200
nships with
uyer‐suppli
rs Bugge 20
arized
4.4: Crucial
n to omass
nitiators
ement in the
solicitation
pplier propo
play a majo
Hermansen
he number
ted in this s
Evaluation a
decider wh
09). Once th
criteria in o
ice, he or sh
rs Bugge 20
the final de
nt criterion
more (interv
der‐routine
s pointed ou
09, Siren Fri
existing cus
er relations
009).
stages in th
Detaispecif
•••
e Energy Se
and Analys
osals, evalua
r role of pre
2009, Chris
of proposa
stage.
and Selectio
ho makes th
he consulta
order to ma
he follow G
09). The de
cision in the
n, several inf
iew with To
Specificatio
ut the impo
igstad 2009
stomers are
ships are reg
he buying pr
l product fication
UsersConsultantsDeciders
ctor
sis
ation on eac
e‐qualifying
toffer Oust
als is reduce
on
he decision
nts have pr
ke the decis
overnment
ecider might
e end (inter
formants co
ormod Geve
on and Perf
ortance of re
9, Christoffe
e crucial in o
garded high
rocess and
Pre‐sup
ch proposal
g supplier pr
ad 2009). B
ed down to
(interview w
re‐qualified
sion. Althou
tal regulatio
t be influen
rview with S
ommented
elt 2009, Sir
formance R
eferences in
er Oustad 20
order to dem
hly importa
roles with d
‐qualify pliers (3‐5)
•Consultant
l is carried o
roposals (in
Based on dif
5‐3 supplie
with Siren F
suppliers, t
ugh the con
ons and nee
ced by initi
Siren Frigsta
the technic
ren Frigstad
Review
n the indust
009). Good
monstrate r
nt in the ind
decision pow
ts
Dsu
out. In this r
nterview wit
fferent deci
rs. Unqualif
Frigstad 200
the decider
nsultant ind
ed to stay ob
ators and u
ad 2009). W
cal ability of
d 2009).
try (intervie
working
reliable solu
dustry (inte
wer
ecide on one upplier
•Deciders (influenceby the other role
round,
th Lars
sion
fied
09,
needs
irectly
bjective
users,
While
f the
ew with
utions.
erview
ed
es)

Brand Management in the Energy Sector 43
Comments:
Figure 4.4 portrays which participants exercise most power according to different stages in
the buying process. Important decisions are made along each stage, and suppliers might be
rejected accordingly. It has several implications for brand management as will be discussed
in later chapters.
While data collected showed additional stages in the buying process, the general phases
seem to fit with the selected theory. According to Kotler & Pfoertsch (2006), it is commonly
accepted that a B2B buying process include eight phases. Such consistent finding contributes
to claim that the given industry structure fits with common accepted B2B theories.
4.4 Brand Relevance in the Biomass Heating Plant Industry According to Kotler & Pfoertsch (2006) a brand may be present in every influential
dimension affecting participants in the buying center. Although it is an interesting notion,
this chapter will elaborate on findings in order to evaluate the relevance of branding in the
given industry. Perceived risk and complex buying situations might be frustrating for
managers to analyze, but it offers one benefit; it offers an opportunity to differentiate a
brand.
4.4.1 Brands and the Complexity of the Buying Situation According to Kotler & Pfoertsch (2006 p.50) the brand relevance is high in the beginning of
the purchase process and decreases as it passes through stages. This claim could be related
to the buying situations identified above. Because the industry mainly operates with
modified rebuy or new task situations, it is reasonable to assume decision makers follow
several step of the buying process. It should according to Kotler & Pfoertsch indicate that
brands are relevant in the given industry. In contrast, Ulaga & Uggert (2006) present a study
that indicates brands are more relevant in later stages of the buying process. Their study
found that while cost considerations were most important for getting on the shortlist,
relationship benefits dominate in order to decide which supplier to name first among a set
of available suppliers (Ulaga & Uggert 2006 p.131). One explanation for the opposite claims
could be the research design of the study. Ulaga & Uggert conducted their study within a
particular B2B context for routinely purchased products. The study does not address
branding as a separate construct, but contrast cost consideration with service support and
personal interaction. Both theories presented by Kotler & Pfoersth, and the empirical

Brand Management in the Energy Sector 44
evidence suggested by Ulaga & Uggert support one claim. It is likely that brands are relevant
in all phases of the buying process in a B2B context. It seems the structure of the biomass
heating plant industry should be classified as a B3B context. Thus it supports the claim that
brands are relevant in the industry.
Appendix 8 offers additional insights to the structure of the industry and brand relevance. It
shows the industry rates medium on brand relevance according to context factors as
suggested by Kotler & Pfoertsch (2006). The model does not provide a final answer, but act
as a guide to determine the relevance of branding in a given market. Together the factors
provide information about whether or not investments in branding make sense or not. While
the model offers insights to the relevance of branding, it fails to incorporate risk as a
relevant context factor. It is thus likely that the brand relevance is higher due to the risk
profile in the given industry.
4.4.2 Preliminary Conclusion Based on the arguments presented above it is argued that brands appear to be relevant in
the biomass heating plant industry. According to Kotler & Pfoertsch (2006 p.47) strong
brands in B2B contexts offer similar benefits to the customers in B2C markets. However, one
should not expect the benefits are weighted in similar terms. According to Kotler & Pfoertsch
B2B brands have benefits related to reduced risk, information efficiency and image
dimensions for people involved in the buying center. According to Reynolds and Norton
(2001 p. 326) trusted brands may take the place of much complex decision making in
business markets.
Several informants (interview with Lars Bugge 2009, Christian Brennum 2009) rejected the
claim that brands provide image benefits for consumers in the biomass heating plant
industry. However, decision makers in the industry appear to be met with an overload of
information and find it hard to evaluate trusted sources (interview with Lars Bugge 2009). It
is thus argued that a strong B2B brand could stand out as a trust mark for decision makers in
the industry.
Empirical data analyzed in this part of the paper seem to be consistent with the theories
presented by Kotler & Pfoertsch. It supports the claim to classify the biomass heating plant
industry as a B2B context.

Brand Management in the Energy Sector 45
Chapter 5 – Means‐end Research and Analysis
“Company managers cannot sit around in their offices and reflect on how customers view
the world.”
Johnson & Gustafsson (2000 p.51)
5.2 Research Purpose The purpose of the research is to gain insights into key decision makers’ underlying personal
motives with respect to suppliers of biomass heating plants. The aim is to identify tangible
and intangible attributes and how they are linked with deeper lying associations or meanings
important to key decision makers. A second aim is to better understand the decision making
process.
Preliminary Interviews
According to Reynolds & Gutman (1988) it takes training and practice from the interviewer
in order to elicit valid answers. Although several theoretical guidelines exist on the laddering
interview, the interviewer needs to develop his or her own style in the end (Reynolds &
Gutman 1988). In order to overcome known barriers, five test‐interviews were conducted
during May 2009 using five students from CBS as test‐respondents. The initial interviews
helped the interviewer to tailor his approach and overcome some common start‐up barriers.
It also pointed out flaws with the initial interview guide and design.
Respondents
In total 16 targeted companies in Southern Norway and the Oslo area were contacted per
phone. Companies were selected after initial talks with Agder Biocom, Enova and NoBio in
order to identify key players in the 1 – 2 Mw segment. Six of the companies contacted did
not pass initial screening questions: “Has someone in your company recently been involved in
a buying process of a biomass heating plant ranging 1 ‐ 2 Mw?” and “Was your role either
decider(project leader) or consultant?”. Further four companies did not have the time to
meet within the suggested time period. In total six people from six different companies
passed the initial stages. Out of them three were classified as consultants and three were
classified as deciders (project leaders) who had recently been involved in a buying process.

Brand Management in the Energy Sector 46
Similar research studies suggest that adding additional respondents could elicit important
data and provide more valid results (Wansink 2003). Respondents in this research showed
similar answers indicating that the target market is made up by decision makers with similar
profiles. It is difficult to argue for a generalization to the entire population from the data
gathered from the sampling units. Although an increased number of respondents would
strengthen the validity of the findings, it is argued that the similarity across the selected
respondents provide sufficient data for this thesis.
The Interview Environment
Respondents were contacted per phone in advance and briefed about the issue at hand.
Also, an e‐mail was sent in order to inform about the thesis and its purpose. This was done in
order to strengthen the validity of the data. All interviews were conducted during June 2009
face‐to‐face at the respondents own offices. People make decisions in particular context and
laddering works best while respondents think of realistic occasions (Reynolds & Gutman
1988 p.16). By conducting the interview in their own work environment, respondents are
more likely to provide answers related with a personally meaningful context. All interviews
were conducted in Norwegian.
Laddering Method
The unit of analysis is suppliers of biomass heating plants. In this paper a supplier is defined
as the technical, economic, service and social benefits that a particular supplier delivers to a
customer. It is defined in a similar way Anderson & Narus (2006 p.136) define a brand in
industrial markets. The interview guide in appendix 2 was followed for each respondent. On
average each interview lasted 60 minutes in total. Throughout the interview the
respondents were reminded about his or her role in the buying process and the definition of
a supplier the way it is treated in this paper.
Similar studies use the same product, service or brand for each respondent (Wansink 2003,
Mentzer et al 1997). Given the emerging market where no market leader is identified, and
no experience is recorded with Agder Biocom, the respondents were asked to consider their
choice of supplier. It was not asked which supplier this was, only to let them think of which
one they chose in a recent purchase situation and why. As such, the brand in the evoked set

Brand Management in the Energy Sector 47
may vary across respondents. Comparing results with one brand or one supplier could
further enhance the design in order to validate findings.
5.3 Analysis The theoretical framework follows guidelines set by Reynolds & Gutman (1988), later
modified by Reynolds et al (2001). It offers guidelines to analyze and interpret data collected
from the conducted ladder interviews. Individual ladders from each respondent were
constructed after each interview. Ladders from all respondents are set together in order to
summarize findings for further discussion.
Summary Content Code
First part of the analysis gathers elements from individual ladders. Each individual laddering
interview are organized and summarized in two separate tables, one for findings related to
consultants and the other for deciders. This distinction offers the ability to summarize
findings by subgroup for later comparison (Reynolds & Gutman 1988 p. 19). Attributes in this
paper are defined as the technical, economic, service and social attributes of a supplier. The
list of attributes represents the most important attributes that the respondents evaluate a
preferred supplier on. Consequences are defined according to the presumption set in
chapter 2. Values are defined as the deeper, underlying needs, wants or motives that
consequences satisfy.

Brand Management in the Energy Sector 48
Attributes Consequences Values (1) Service (9) No hassel for our customer (25) Accomplishment (2) Ability to burn biomass properly
(10) Avoid break‐downs
(26) Better serve our customers
(3) Competence (11) Can handle variations (27) Peace of mind (4) Meets product specification
(12) The customer gets quality
(5) Reasonable price (13) Fits with the environment (6) Aesthetics (14) No hassels (7) Satisfy regulations (15) Know the supplier delivers as
promised
(8) References (16) Avoid confusing information (17) Reliable drift (18) Sophisticated image (19) Get a safe solution for my
customer
(20) Positive user experience (21)Our customer gets satisfied (22) I look professional (23) Secure growth for our business (24) I can trust the supplier Table 5.1: Summary content codes for consultants Comments:
Respondents were asked to think about their choice of supplier, and why they selected this
supplier. The list of attributes is randomly organized as the relative weight on each attribute
depends on the buying situation (interview with Christoffer Oustad 2009). The attributes
identified can be further organized into distinct categories according to how supplier is
defined in this paper. Some criteria cover several categories thus the boundaries should be
threatened as blurry. One early observation is the similarity in answers from the
respondents. All respondents classified as consultants mentioned similar attributes, thus
enhancing the validity of classifying respondents as consultants.
Technical attributes
Ability to burn biomass was highlighted in all interviews as an important decision criterion.
One thing is building a biomass heating central, another thing is making sure it burns
efficiently with crushed wood (interview with Rolf Hermansen 2009). Crushed wood may
consist of whole grains, chopped wood and wet leaves. It easily gets stuck in the feeding

Brand Management in the Energy Sector 49
mechanism or do not burn properly. It is important that the technical solution shows ability
to burn biomass properly without break downs (interview with Christoffer Oustad 2009).
Meet product specification relates to the uniqueness of each situation. All interviewed
consultants highlighted the ability to meet customer demands in a particular situation. It
takes both skills and competence in order to customize the technical solution to fit with each
situation (interview with Rolf Hermansen 2009).
Satisfy regulations were also mentioned by all respondents. The technical solution must
meet Governmental regulations according to pollution limits or else it will not be given
permission to build a biomass heating plant (interview with Rolf Hermansen 2009).
Aesthetics was only mentioned by Christoffer Oustad (interview 2009). Often the biomass
heating central are drifted close to schools, hospitals or other public buildings. As such, it is
important that the heating plant fits in current buildings and do not pose a threat to people
in the environment. Although it was not mentioned as aesthetics, Rolf Hermansen (interview
2009) also mentioned the importance of a safe solution.
Service attributes
Service was regarded an important criteria by all consultants. All respondents commented on
the importance of the supplier’s ability to install as promised and the ability to maintain and
repair solutions effectively.
Competence was also pointed out by all consultants. It seems that many suppliers can import
heating plants that will deliver on technical attributes, but in reality it is a difficult task that
needs experience and competent workers (interview with Rolf Hermansen 2009).
Economic attributes
Reasonable price was discussed extensively with all consultants. Reasonable price relates to
a price range which is considered important for heating centrals. It should not be to low
because price is associated with future problems. It is not uncommon that the cheapest
offer is rejected (interview with Rolf Hermansen 2009). Previous suppliers with low offers
have created a bad reputation in the industry (interview with Lars Bugge 2009). While price
is somewhat elastic, prices higher than 10‐15 percent are often rejected no matter how good
the technical solution is (interview with Lars Bugge 2009).

Brand Management in the Energy Sector 50
Reference
Reference relates to the technical, economic, service and social attributes of the supplier. It
was pointed out as a crucial criterion by all interviewed consultants. Reference reflects a
supplier who can show existing solutions that work, and have good working relationships in
the industry. It is a sum of the reputation in the industry and relates to how consultants trust
the supplier.
Deciders
Respondents classified as deciders portrayed similar, but fewer attributes they regard as
most important for making their decisions. It is summarized in table 5.2 below.
Attributes Consequences Values (1) Ability to burn biomass properly
(6) Avoid stressed employees (18) Peace of mind
(2) Meets product specification
(7) Fits with our routines
(3) Reasonable pricing (8) Know we get quality (4) References (9) Know they can deliver as
promised
(5) Service (10) Easy to resolve problems (11) Avoid break downs (13) Avoid additional problems (14) Better use of own
resources
(15) Better economy (16) I don’t need to worry (17) I can trust the supplier Figure 5.2: Summary content codes for deciders
Comments:
Also deciders showed similarity in their answers, and will briefly be discussed. The most
interesting finding is that similar attributes, only fewer make up the most important decision
criteria compared with consultants.
Technical attributes
Ability to burn biomass properly and meets product specification was mentioned by all
respondents classified as deciders. Because deciders often lack experience with the technical
attributes, their evaluation is influenced by users and consultants (interview with Siren
Frigstad 2009). Rune Valla (interview 2009) commented that ability to burn biomass is
Brand Management in the Energy Sector 51
important because it is more expensive to burn with back‐up solutions such as oil or gas if
the system breaks down. As a basic, all respondents mentioned that the heating plant must
deliver on their defined product specification.
Service attributes
Service relates to the supplier’s ability to install as promised and the ability to maintain and
repair solutions effectively (interview with Tormod Gevelt 2009). Such features was also
highlighted by Siren Frigstad (interview 2009), but not by Rune Valla (interview 2009).
Economic attributes
Reasonable pricing was also commented by all deciders. Rune Valla (interview 2009)
commented they rather have solutions that will work the next 15 years or so compared with
cheep solutions that won’t deliver as promised. Tormod Gevelt (interview 2009) also
commented they evaluate the technical ability before price. It was not mentioned any price
range by deciders, but all respondents indicated that price is a crucial decision criterion. As
commented by Tormod Gevelt (interview 2009), too low prices often indicate poor quality. A
proposal too low priced could indeed be rejected because it signals future drifting problems
(interview with Siren Frigstad 2009). If the solution however meets the technical demands,
price often becomes the crucial differentiator (interview with Tormod Gevelt 2009).
Reference
Reference was regarded important by all deciders. As with consultants, reference reflects a
supplier who can show to existing solutions that work, and have good working relationships
in the industry.
5.3.1 Constructing the Hierarchical Value Map (HVM) A hierarchical value map was constructed for each of the two subgroups consultants and
deciders. As the analysis moves on to more aggregate results, the two subgroups are
threatened as ideal types. The HVM’s were constructed using a cutoff approach. The cutoff
approach allows the researcher to evaluate several solutions and choose the one that
appears most informative with a set of stable relations (Reynolds & Gutman 1988 p.20). The
purpose is to portray how supplier attributes (A) are linked with consequences (C), benefits

5 Bra
52
(B) and
HCM co
Figure 5
Analysis
By climb
link with
map sho
and mo
required
For inst
the bus
accomp
to be a
solution
nd Manage
values (V) i
onstructed f
5.1: HVM fo
s of consult
bing up the
h more inta
ows how be
tivations. In
d in order t
ance, accor
iness and m
plishment. It
consequenc
ns that offer
ement in the
n the mind
for consulta
or consultan
tants
ladders of
angible bene
enefits for t
n turn, bene
o realize de
rding to the
make them l
t seems tha
ce of satisfi
r reliable dr
e Energy Se
s of the two
ants.
nts Dat
the HVM, o
efits and pe
the consulta
efits can be
esired benef
e HVM cons
look profess
at securing g
ed custome
rift and perc
ctor
o subgroups
ta source: L
one can see
ersonal valu
ants are link
traced to w
fits.
ultants sear
sional in ord
growth for t
ers. Satisfie
ceived custo
s for later d
adder inter
how more
ues in the m
ked with the
what specifi
rch for solu
der to expe
the busines
d customer
omer qualit
discussion. U
rviews with
tangible su
minds of the
eir underlyi
c supplier a
tions that s
erience a se
ss is perceiv
rs is further
ty. By going
Underneath
consultants
pplier attrib
consultant
ing need, va
attribute are
ecure grow
nse of
ved by consu
associated
g further do
h is the
s (2009)
butes
s. The
alues
e
wth for
ultants
with
wn the

Brand Management in the Energy Sector 53
ladders, it is possible to identify a range of supplier attributes associated with reliable drift
and quality. Supplier attributes related to reasonable price and meets product specifications
are associated with quality. Competence, service and ability to burn biomass are associated
with reliable drift. One example of a ladder could be: (A) meets product specification (A)
reasonable price – (C) customer gets quality – (C) customer gets satisfied – (B) Secure growth
for our business – (V) Accomplishment.
The theoretical chapter established some presumptions with the means‐end theory that will
be elaborated on. One presumption is that deeper values and benefits are already
established in the minds of the consultants. Consultants seek supplier attributes as means to
achieve their already established deeper benefits and values, not the other way around. If a
consultant for instance encounters an alternative that is overpriced, he or she does not link
proper consequences with desired end states and thus reject the solution over another
reasonable priced solution. A preferred supplier of biomass heating plants is a supplier who
successfully delivers on attributes that link with proper consequences and end states for
consultants. The HVM offer insights to the most important supplier attributes at the time
when the research was conducted and how consequences are linked with deeper benefits
and values in the minds of the consultants.
Three values were identified during in‐depth laddering interviews with consultants. It was
peace of mind, accomplishment and better serve our customers. Peace of mind was
mentioned by all respondents. It was expressed by Rolf Hermansen (interview 2009) that if a
consultant do not perceive they can trust the supplier, he or she run the risk of ending up as
the scapegoat if anything goes wrong. A sense of accomplishment was also mentioned by all
respondents. As expressed by Christoffer Oustad (interview 2009), finding elegant solutions
that the customer gets satisfied with are associates with doing a good job as a consultant. It
helps consultants getting in touch with other clients and makes them look professional.
Better serve our customers was also mentioned by all respondents. As commented by Lars
Bugge (2009), consultants are driven by satisfied customers. It is why the consultants are in
the business.

5 Bra
54
Decider
In sum,
consulta
Figure 5
Analysis
The HVM
consequ
further
consulta
Decider
along w
the pers
It could
mind. A
problem
nd Manage
rs
different su
ants. Findin
5.2: HVM fo
s of Decide
M portrays
uences, ben
enhancing
ants. For ins
rs associate
with referen
son who ne
explain wh
As Tormod G
ms. For them
ement in the
upplier attr
ngs presente
or deciders
rs
how decide
nefits and va
the validity
stance, pea
a trusted s
ces in order
eeds to deal
hy only one
Gevelt (inter
m it seems b
e Energy Se
ibutes link w
ed in the HV
ers in the gi
alues in the
y of findings
ace of mind
upplier with
r to avoid a
l with any p
value was i
rview 2009)
biomass hea
ctor
with variou
VM will be a
Data source
iven segme
eir mind. Re
s. The HVM
was found
h a supplier
dditional pr
problems oc
dentified a
) explained,
ating plants
s underlyin
applied at a
e: Ladder in
nt link supp
espondents
follows sam
to be linked
r who offers
roblems. It
ccurring wit
mongst all r
, deciders a
s are associ
g motives in
a later stage
nterviews w
plier attribu
showed sim
me principle
d with trust
s good serv
seems that
h the heatin
respondent
re seeking a
ated with a
n the minds
e.
with decider
tes with
milar answe
es as for
t in the supp
ice conditio
deciders ar
ng plant.
ts. It was pe
a solution t
dditional w
s of the
rs (2009)
ers thus
plier.
ons
re often
eace of
o their
work.

Brand Management in the Energy Sector 55
This was also confirmed in earlier chapters. Converting from other energy sources to
biomass is also accepting more work for the customer.
5.4 Discussion The means‐end theory has not received as much attention as other research methods in
industrial markets. This paper is built on a limited number of similar means‐end studies. In
order to validate findings, results are also compared with other research methods.
No study was found that employs laddering techniques on subgroups divided into
consultants and deciders as done in this paper. But, for instance Reynolds et al (2001 p.326)
separated between different subgroups as decision makers, influencers and deciders in their
research. Given the market structure in this paper, it is suggested that consultants play a
crucial role in the decision making process. It thus makes sense to threat consultants as a
separate sub‐group along with deciders.
Consequences identified by both consultants and deciders related to quality, reliability and
performance are consisted with findings from several publications and studies in industrial
markets (Lynch & De Chernatony 2007 p.124, Norton & Reynolds 2001 p.327, Michell et al
2001 p.421). It is interesting to note that these theorists claim such criteria to be generic or
minimum requirements and offer only limited potential for differentiation. While it is
difficult to argue similar claims in the biomass heating industry, consistent findings
demonstrate the validity and the application of means‐end theory in the given industry.
Values related to better serve the customer is consistent with research carried out by
Mentzer et al (1997). Mentzer et al applied means‐end theory and hierarchy value models in
a B2B logistic service context. In their study, they wanted to understand the values and
needs of channel members in an industry for military logistic services. Data was collected
after conducting focus group interviews with defense logistic agencies. They identified
values of quickly satisfying customer needs and responsibility to stakeholders, suggesting
that what defense logistic agencies really wanted was support in serving their stakeholders.
It is suggested that such values are similar to how consultants perceive better serve the
customer, thus enhancing the validity of the findings in this study.

Brand Management in the Energy Sector 56
Peace of mind is a common accepted value in B2B markets (Lynch & De Chernatony 2007
p.125). For instance, FedEx promises its customers peace of mind (Kotler & Pfoertsch 2006
p.177). In a more recent published book, Mark E. Parry argues that two common values are
relevant in business‐to‐business markets. Building on the means‐end theory Parry claim such
values relate to peace of mind and social recognition (Parry 2005 p.121). Peace of mind is a
value that is consistent with findings from both consultants and deciders in the biomass
heating plant industry. The consistent finding with Parry’s theories thus enhances the
validity of applying the means‐end theory in the given industry.
One interesting observation is that all respondents classified as consultants expressed the
sense of accomplishment. This value has not been identified in similar studies conducted in
business markets. One explanation could be the context this study was performed in. Given
the Norwegian language, it may translate to similar terms in other studies. As Parry (2005
p.121) argues social recognition is a common value in business markets. While social
recognition was not expressed by any respondents, it is similar to what consultants refer to
as getting in touch with other customers and looking professional. Thus the feeling of
accomplishment could be similar with Parry’s definition of social recognition. Further
research could validate or reject this finding.
Findings are not consistent with a major study presented by Wansink (2003). After applying
the means‐end theory and conducting 1200 laddering interviews Wansink (2003 p.114)
found seven personal values to be consistent across his research. These values are
accomplishment, belonging, self‐fulfillment, self‐esteem, family, satisfaction and security.
Expect from security, Wansink claim these values can be associated with social and self‐
actualization levels of Maslow’s hierarchy of needs. The inconsistent findings could be
explained by the difference between consumer and business markets. Wansink conducted
his research in consumer market with consumer brands. Based on this contrary finding, it is
reasonable to argue that different personal values seem to be relevant in the given industry
compared with a B2C context. It supports the argument to classify the biomass heating
industry as a B2B context.

Brand Management in the Energy Sector 57
Studies examined in this paper show that one country in particular stands out as a suited
country for comparison, Germany. Weidmann (2005) found some empirical evidence for
measuring brand equity in the German energy market consistent with findings in this paper.
He set out to investigate if it is possible to escape from pure price pressure by adopting
branding techniques. He used commercial enterprise customers in the German energy
market as sampling units and discusses implications for both B2B and B2C context. By
conducting causal analysis on data collected, he found that associations towards customer
orientation, price, competence, reliable supply and local attachment have impact on
customer retention. It could be argued that similar factors, except the importance of
localness was identified as important decision criteria amongst respondents in the biomass
heating industry in Norway. The consistent finding indicates the industry seems to be similar
with German energy markets. The German energy markets offer several interesting business
case studies to energy branding and could serve as important benchmarks.
Some preliminary insights to energy branding were however not confirmed by the research.
Much attention has been given to green customers and the effect of green branding in
energy markets. Wustenhagen & Bilharz (2006) reviewed existing literature on renewable
energy policy in Germany between 1973 and 2003. They claim that customers in liberated
energy markets may directly influence the way their power is made by demanding specific
products (Wüstenhagen & Bilharz 2006 p. 1689). Although the end product looks and feels
the same, according to the authors green power customers may not support unsustainable
energy sources. It offers an opportunity for energy providers to differentiate on green
energy and escape commodity competition. Similar claims have also been suggested by
several informants in the Norwegian bio‐energy market. For instance, initiators seem to be
driven by environmental concerns. Analysis in chapter 3 show that the political will for green
energy is supported throughout the heat market value chain.
The means‐end analysis does however not support that such considerations is important in
the biomass heating plant industry. It was not mentioned by any respondents that attributes
related to innovation, environmental concerns, localness or corporate social responsibility is
regarded as important decision criteria. In a study on energy brands, Hartmann and Ibanez
identified the impact of brand associations, satisfaction and switching costs on customer
loyalty in residential energy markets (Hartmann & Ibanez 2006). Their study suggests that

Brand Management in the Energy Sector 58
the attributes mentioned above might have a significant impact on the evaluation of energy
suppliers.
The failure to identify green energy attributes in this paper could be explained in several
ways. One explanation could be the research design in this paper. Research is limited to two
sub‐groups in the given industry. For instance, initiators in the industry seem to be driven by
environmental concerns. Further research conducted on additional sub‐groups could provide
more detailed descriptions on green branding in the heating plant industry.
Another explanation could be that while criteria related to green energy are relevant, they
are not considered important decision criteria. If so, it seems that green branding have little
effect on decision making in the biomass heating plant industry. Such claim is consistent with
Keller who reports that from a branding perspective, green marketing programs have not
been entirely successful (Keller 2008 p.479). It is considered as an unexpected finding in this
industry. As commented by Rolf Hermansen and Lars Bugge (interview 2009), it seems
economical benefits drive the future demand of biomass heating plants in Norway, and not
the environmental benefits.
5.5 Main Findings The research carried out shows interesting findings. First, the research supports the claim
that the given industry is structured as a B2B market. Research conducted in similar contexts
show similar results. Second, consultants and deciders in the industry appear to be
influenced by more rational and more emotional factors. They also seem to place more
importance on the companies behind the brands than brands themselves. Respondents
listed a range of supplier attributes rather than product features. Such finding is consistent
with theories claiming that in B2B context, it is buyers and sales staff that interacts, not
customers and brands as in consumer environments. Third, while green branding was
expected to influence their decisions, it was not supported by the research. While green
marketing might be relevant, it does not seem to influence the most important decisions in
the given industry. Last, deciders and consultants seem to be influenced by different
underlying needs, values or motivations according to their role.

Brand Management in the Energy Sector 59
5.6 Means‐end Theory and why the Gasification Technology does not sell Agder Biocom has not sold any plants during the writing of this thesis. The new technology
offers several possible customer benefits compared with existing solutions. Related to
means‐end chain theory it could be explained why it is difficult to sell the new technology.
Benefit and value associations are already established in the minds of the decision makers in
this industry. They already link a set of supplier attributes with desired end states. Such links
could be created long time back and be hard to change for any marketer or brand manager.
In order to do so, both ability and motivation is needed before decision makers alter the
perception in their minds. When decision makers do not embrace new features with the
gasification technology it could be explained that they do not link the technical attributes
with proper desired end states. For instance, research shows that deciders in this industry
are seeking solutions that offer them peace of mind. If a decider is not convinced the new
technology will offer them peace of mind, he or she is likely to reject the offer over an
alternative that offers peace of mind. It could indeed explain why pushing new technology to
the market no longer provides sufficient arguments to convince decision makers.

Brand Management in the Energy Sector 60

Brand Management in the Energy Sector 61
Chapter 6 ‐ Competitive Frame of Reference
Previous chapter offered insights from the customers view. According to Keller (2008) the
other crucial element of branding is to understand what competitors are doing in order to
establish proper points‐of‐parity and points‐of‐difference associations. Such statement is
consistent with Kotler & Keller’s claim of balancing customer and competitor orientations
(Kotler & Keller 2006 p.178).
6.2 Value Added Features An early decision is to pursue a differentiation strategy rather than cost‐leadership strategy
in the given segment. The main argument is that price communicates quality, and the
cheapest offer could indeed be rejected by key decision makers in the industry (interview
with Tormod Gevelt 2009). Decision makers in the industry seem to associate low price with
future drifting problems (interview with Rolf Hermansen 2009). It could explain why
competitors have differentiated their offerings.
The generic product the customer is really buying is heated water (interview with Jan Bjarne
Wormli 2009). If stripped from all its value added features, a biomass heating central offers
heated water for its customers. Kotler & Keller (2006 p.166) argue that differentiation is a
strategy to obtain a competitive advantage. They claim products and services can be
differentiated in a number of ways. It serves as basis for analyzing main competitors in the 1
– 2 Mw segment.
The main competitors are presented along with a short description on how they are seeking
to differentiate its product and service offerings. Also, desired associations describe how
each competitor seeks to position itself in the category.
6.3 Main Competitors Main competitors were identified after conducting interviews with informants. Informants
were asked to mention a list of preferred suppliers in the 1 ‐ 2 Mw segment. Later,
competitors were classified according to their focus on the 1 ‐ 2 Mw segment along with
their experience and references in Norway. It is difficult to provide valid data on market
shares. Early observations presented by the Tratec Group indicate that five main
competitors make up around 40% of the segment.

Brand Management in the Energy Sector 62
TPS 4
TPS is considered one of the largest players in the segment with around 11% market share. It
is located in Sweden and was formed in 1992. It has established a firm position in the
Norwegian market. TPS focuses its presentation on R&D initiatives.
Product differentiation
TPS offers a range of products. Most interesting is a factory built and transportable heating
plant. The unit can be delivered in sizes 150 Kw to 5 Mw. The heating plant is differentiated
with several features such as fuel handling system and PLC control system. It is a flexible
solution that can be customized to fit customer needs. TPS also claim the technology offers
quality, reliability and reparability for its customers. It highlights the ability to burn crashed
wood together with low maintain, ‐ and repair costs. The plant is build in container with
exterior that is adaptable to fit surrounding buildings, thus it is also differentiated on form
and style.
Service differentiation
TPS offers extensive commission and operator training with its offerings. Thus it seeks to
differentiate its service offerings. TPS also claim to have expertise in the installation and
delivery of biomass heating plants.
Desired associations
International experience
Technological expertise Quality products
Strong references or user profiles
R&D and being innovative Excellent customer service
Taking environmental initiatives
Adapts to customer needs Highly competent staff
Weiss5
Weiss is another major player located in Denmark with its 10 percent market share of the
total market. It communicates its unique technique along with its satisfied staff. The
technology is different from TPS as it puts more emphasize on building the plant on site.
Product differentiation
Weiss do not offer pre‐fabricated plants, but rather offer a range of products in order to
customize its offerings to each customer. Weiss delivers complete plants that can produce
4 Data collected from brochures and www.tps.se 5 Data collected from www.weiss‐as.dk
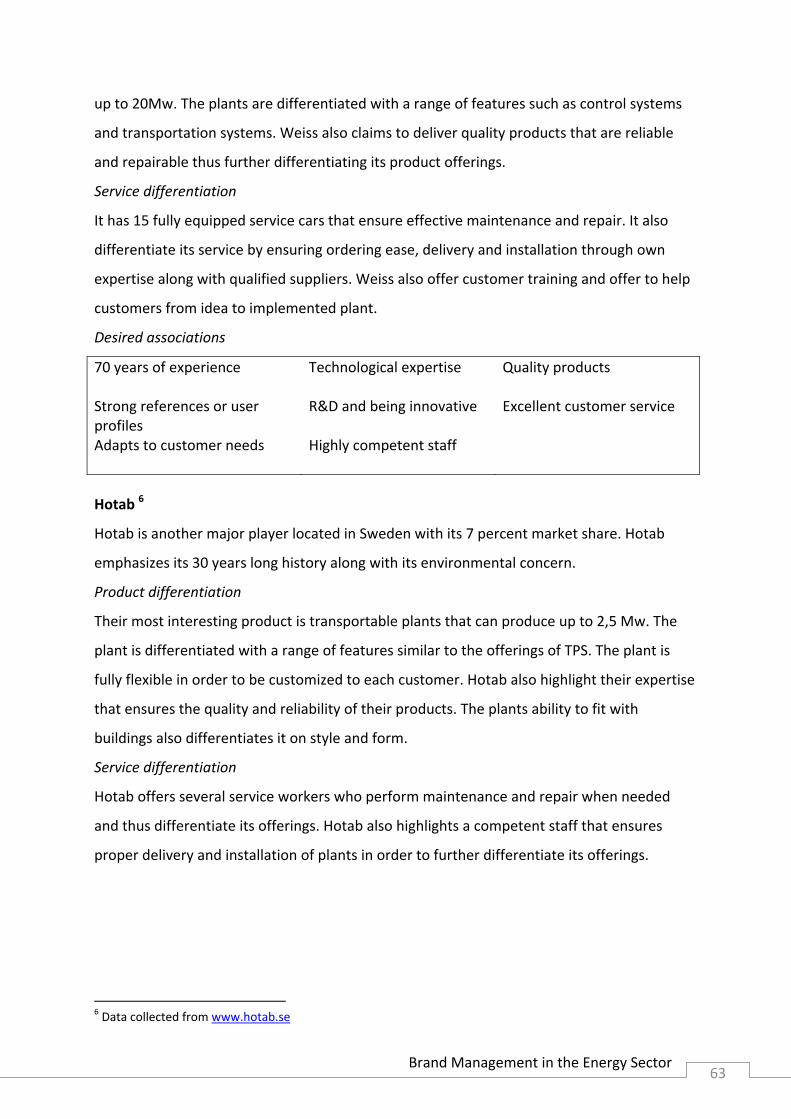
Brand Management in the Energy Sector 63
up to 20Mw. The plants are differentiated with a range of features such as control systems
and transportation systems. Weiss also claims to deliver quality products that are reliable
and repairable thus further differentiating its product offerings.
Service differentiation
It has 15 fully equipped service cars that ensure effective maintenance and repair. It also
differentiate its service by ensuring ordering ease, delivery and installation through own
expertise along with qualified suppliers. Weiss also offer customer training and offer to help
customers from idea to implemented plant.
Desired associations
70 years of experience
Technological expertise Quality products
Strong references or user profiles
R&D and being innovative Excellent customer service
Adapts to customer needs
Highly competent staff
Hotab 6
Hotab is another major player located in Sweden with its 7 percent market share. Hotab
emphasizes its 30 years long history along with its environmental concern.
Product differentiation
Their most interesting product is transportable plants that can produce up to 2,5 Mw. The
plant is differentiated with a range of features similar to the offerings of TPS. The plant is
fully flexible in order to be customized to each customer. Hotab also highlight their expertise
that ensures the quality and reliability of their products. The plants ability to fit with
buildings also differentiates it on style and form.
Service differentiation
Hotab offers several service workers who perform maintenance and repair when needed
and thus differentiate its offerings. Hotab also highlights a competent staff that ensures
proper delivery and installation of plants in order to further differentiate its offerings.
6 Data collected from www.hotab.se

Brand Management in the Energy Sector 64
Desired associations
30 years of experience
Technological expertise Quality products
Strong references or user profiles
R&D and being innovative Excellent customer service
Taking environmental initiatives
Adapts to customer needs Highly competent staff
STX Grenland Industri AS department of Bioenergy 7
STX is a company located in Norway. It is part of a bigger industrial group and claims to be a
leading supplier of biomass heating plants. STX focuses on its leading position along with its
leading competence and technology.
Product differentiation
STX offers pre‐fabricated plants placed on containers. SGP does not inform the capability of
the plants, but they can produce at least 1,25 Mw. It is possible to include several plants in
order to produce 2 Mw. The plants are differentiated with a range of features similar to the
ones of TPS and Hotab. STX claims the technological quality leads to reliable and durable
solutions thus further differentiating their products. The plants can be customized to each
customer’s demands and may be designed to fit with buildings. Thus it is differentiated on
customization, form and style.
Service differentiation
STX differentiates its service by offering extensive maintenance and repair deals. It also
differentiates on fast deliveries and simple installation along with customer training
programs.
Desired associations
Adapts to customer needs
Technological expertise Quality products
Strong references or user profiles
Highly competent staff Excellent customer service
Taking environmental initiatives
7 Data collected from brochures and www.stxgrenlandindustri.no

Brand Management in the Energy Sector 65
SGP8
SGP is located in Norway and offer plants producing up to 1,5 Mw. SGP focuses on being a
leading supplier with the longest operating history in Norway.
Product differentiation
SGP has a range of products in order to customize its offerings to each customer. It further
differentiates its products by offering a range of features similar to other suppliers. SGP uses
leading product from international sub‐suppliers in order differentiate products that offer
quality, reliability and durability.
Service differentiation
SGP differentiates its service offerings by introducing courses for customer training. Service
also includes personnel who ensure easy delivery and installation.
Desired associations
Taking environmental initiatives
Technological expertise Quality products
Strong references or user profiles
Adapts to customer needs Excellent customer service
Secondary Competitors
Secondary competitors may take the step up and become a main competitor. Secondary
competitors do not seem to focus on the given segment in Norway, but are considerable
large players in other segments in the industry. They should be monitored as they might
enter the competition in the 1 ‐ 2 Mw segment. Such competitors include Justsen, KMW
Energi, Enertech, Köb, Linka, Järnforsen, Eldab, Veå, Petrokraft and KLM.
Chapter 3 portrayed how new entrants and substitutes may pose a threat in the industry.
Such finding is consistent with Keller who warns not to define competition too narrowly
(Keller 2008 p.105). He argues that competition can occur at the benefit level rather than the
attribute level. For instance could a heating plant burn with oil or gas. Running a plant with
oil or gas involves less work and worries for the customers in the category. Competition on
such aggregate levels will not be elaborated on further in this paper. Data does not provide
sufficient information to address such issues.
8 Data collected from brochures, interview with Christian Brennum and www.sgp.no

Brand Management in the Energy Sector 66
6.4 Analysis The presentation of main competitors shows a number of interesting observations. By
comparing desired associations it is possible to comment on how competitors seek to
position themselves in the 1 – 2 Mw segment. Table 6.1 compares each desired association
according to the five main competitors.
TPS Weiss Hotab STX SGP Desired association International experience • Technological expertise • • • • • Quality products • • • • • Strong references or user profiles • • • • • R&D and being innovative • • • Excellent customer service • • • • • Taking environmental initiatives • • • • Adapts to customer needs • • • • • Highly competent staff • • • • Long history • • Table 6.1: Desired associations compared by main competitors
The table shows how members in the category seek to be perceived with similar
associations. Except on portraying a long history and international experience, no
associations seem to be unique to any competitor. It should be noted that these associations
are based on how members communicate their offerings. It does not offer insights into how
consumers associate competitors. Additional research could provide crucial insights.
The empirical data identified product or service differentiation as suggested by Kotler &
Keller. It enhances the application of their theories in the given industry.
6.5 Discussion In order to compete in the industry it seems the main competitors have developed a range
of value added features through product and service differentiation. It seems difficult to
further differentiate products or services in the given industry. Rather, members appear to
argue over who has the superior offerings on similar terms. Such conditions may indeed lead
to fierce price competition. It could explain why the industry experiences low profitability.

Brand Management in the Energy Sector 67
Keller makes the distinction between category points‐of‐parity and competitive points‐of‐
parity (2008 p.109). Table 6.1 shows that all members are seeking to portray an image of
having technological expertise, quality products, strong references or user profiles, excellent
customer service and adapts to customer needs. Hence these associations should be
considered as category points‐of‐parity associations. Most members also portray an image
of being innovative, having highly competent staff and taking environmental initiatives. It is
suggested these associations also be included as category points‐of‐parity associations.
The data collected offers less insight to competitive points‐of‐parity associations.
Competitive research should be conducted in order to better understand how consumers
perceive main competitors. In the end, it is not how each competitor tries to position itself;
it is how consumers associate their sum of offerings. TPS is the only company to focus on
international experience in its communication. It may be relevant in the minds of the
consumers, but research in this paper does not support it. It is similar with Weiss and Hotab
who seek to communicate their long history within biomass heating plants.
Based on the data collected no distinct market leader is identified, and it seems that few
initiatives have been done in order to build a distinct B2B brand in the industry. Rather it
seems that members in the industry are trying to compete on similar offerings and category
points‐of‐parity associations such as quality products, excellent customer service, innovative
image and environmental initiatives. This claim is also supported in chapter 3. Lars Bugge
(interview 2009) commented that it was difficult to sort out what information to trust in the
given industry. It seems all members claim to have superior offerings, a strong company
name and highly competent staff. It indicates that a strong B2B brand could differentiate
from competitors by building strong, favorable and unique associations in the minds of the
consumers.
Brand Management in the Energy Sector 68
6.6 Short term Product Differentiation vs. long term Brand Equity The new technology with gasification could provide Agder Biocom with a competitive
advantage. It seems to have some unique benefits for the customers. Agder Biocom could
differentiate its product offerings in a way that is difficult for competitors to copy. However,
on a long‐term perspective it is likely competitors copy the technology. This argument is well
supported by theorists who claim it is widely accepted that the technological development
make it easier for competitors to copy technological advantages, that consumers have
increased access to information about firms and products, and that these developments has
created a need amongst B2B firms to gain a sustainable competitive advantage. Analysis in
this chapter showed that no member seem to have a distinct position in the industry. Hence,
it is an unexplored opportunity to build strong, favourable and unique associations in minds
of the consumers in order to build brand equity. Such argument is consistent with Jensen &
Klastrup (2008) who has presented a B2B customer‐based brand equity model. Their
substantial argument is that B2B brands should and do include nonrational values (Jensen &
Klastrup 2008 p.127). Their findings conclude that differentiation should be the main area of
improvement. Efforts done to build B2B brands should be about improving and
communicating the brand’s uniqueness and advantages over other brands (Jensen &
Klastrup 2008 p.127). It relates to points‐of‐difference and will be discussed in next chapter.

Brand Management in the Energy Sector 69
Chapter 7 – Gaining the Competitive Advantage
Kotler & Pfoertsch argue that: “It is crucial to keep
a strategic perspective since positioning a brand is
not a tactical activity but rather a strategic
process aimed at creating a sustainable
competitive advantage” (Kotler & Pfoertsch p.
173). The purpose of this chapter is to present a
framework to discuss how Agder Biocom can
achieve a distinct brand position in the biomass
heating plant industry. It builds on the theoretical
model presented in chapter 2. The discussion will
be divided into four main parts as shown in figure 7.1 to the right. Kotler & Pfoertsch (2006)
argue that a B2B brand strategy should be based on the brand core, its values and
associations along with product and service offerings. These elements are related to each
other and need to be consistent in order to build a proper brand positioning strategy.
In a study conducted by Aspara & Tikkanen (2008) they found that companies in B2B
markets tend to move away from purely name or product focus and more towards identity,
employees and values. According to Aspara & Tikkanen (2008) customers in B2B markets
place more emphasizes on the company behind the brand than the brand itself. This finding
is persistent with the structure of the biomass heating plant industry. As argued in chapter 5
it seems respondents emphasize a range of supplier attributes, not only products or names.
Thus the remaining of this paper will emphasize the corporate B2B brand Agder Biocom.
7.2 Part 1 – Crafting the B2B Brand Positioning As presented in chapter 2, it is crucial to craft a brand positioning relevant for all significant
players in the decision making unit and decision making process. Chapter 4 included a
presentation of the main decision makers in the 1 – 2 Mw segment of the biomass heating
plant industry. It identified four distinctive roles: deciders, consultants, initiators and users.
Out of the four roles, consultants and deciders are considered to be key decision makers in
the industry. Thus, when crafting a brand positioning it should be perceived as relevant in
the minds of these decision makers. Consultants and deciders are emphasized in order to
demonstrate the application of the means‐end research in this paper.
Brand core
Brand associations
Product and services
Values
Figure 7.1: Brand Strategy
Source: Kotler & Pfoertsch (2006 p. 170)

Brand Management in the Energy Sector 70
7.2.1 B2B Brand Positioning While many
guidelines exist on
brand positioning,
the work in this
part is adopted
from Keller (2008)
and his CBBE
model. As Keller
puts it: “According
to the customer‐
based brand equity
model, deciding on
a positioning requires determining a frame of reference (by identifying the target market and
the nature of competition) and the ideal points of parity and points of difference brand
associations (Keller 2008 p.131).” The CBBE model presents the dynamic nature of brands
and is applied in order to identify sources of brand equity in the given industry. The model is
shown in figure 7.2. An overarching claim of the model is that a strong brand is built by
appealing to both the heads and hearts of consumers. Brand equity, as defined by Keller
(2008) occurs when a brand is known and has some strong, favorable and unique
associations in the minds of the consumers.
7.2.2 Establish Category Membership Significant decision makers in the given adopt a consideration set and evaluate suppliers on
a range of attributes. In chapter 6 it was argued that Agder Biocom must be associated with
points‐of‐parity associations in order to be perceived as a valid member of the biomass
heating plant industry. Thus, consumers in the target market should ideally associate Agder
Biocom with the following points‐of‐parity associations:
Resonance
Judgements Feelings
Performance Imagery
SalienceIdentity
Who are you?
Meaning What are you?
Response Who about you?
Relationships What about me and you?
Figure 7.2: Keller’s CBBE Model Source: Keller (2008 p.61)

Brand Management in the Energy Sector 71
Quality products and technological expertise.
Excellent customer service and ability to adapt to customer needs.
Competent workers and strong references in the industry.
Taking environmental initiatives and innovative performance
Comments:
These associations should be considered a minimum. Research conducted in this paper also
indicates that performance related associations such as price, product reliability, durability
and serviceability should be considered category points‐of‐parity associations. Many of
these dimensions were identified as competitor service and product differentiation, but for
the simplicity of this paper will not be further elaborated on. The set of these associations
are summarized as quality products/technological expertise and excellent customer
service/ability to adapt to customer needs.
It may also prove that imagery related associations such as user profiles, purchase and usage
situations, and personality and values could be relevant category point‐of‐party associations.
However, this paper only identified references in the industry along with competent workers
that summarize more imagery associations.
Taking environmental initiatives and innovative performance are two category points‐of‐
parity associations that have received attention from later published work. Category
members seem to believe that taking environmental initiatives and innovative performance
are important. This claim is not supported by respondents in the means‐end analysis. One
explanation could be that initiators and/or users consider such criteria as important. These
sub‐groups were not included in the research. Such claim is consistent with empirical data
presented in chapter 4. According to several informants, initiators in the industry are often
driven by environmental concerns. It should thus be included as a category point‐of‐parity
association along with innovative performance.
Implications for Agder Biocom
To establish a proper category membership has several implications for Agder Biocom. It
shifts the focus from a more inside‐out technological perspective and balances it with an
outside‐in customer and competitor perspective. Managers should not start to communicate

Brand Management in the Energy Sector 72
exaggerated marketing promises in order to establish proper category points‐of‐parity
associations. Such efforts are most likely to backfire and could seriously harm its business
reputation in the market place. Rather, managers are advised to invest and build up the
company’s infrastructure, competence and culture so it is able to differentiate its product
and service offerings to match those of the main competitors. It is related to the basic value
proposition it should be able to deliver on each time for its customers.
Consumers also need to perceive Agder Biocom with the category points‐of‐parity
associations identified above. This statement is supported by findings in chapter 4 and 5. Key
decision makers in the industry pre‐qualify suppliers. If consultants or other key decision
makers do not perceive that Agder Biocom is able to deliver on the category points‐of‐parity
associations, it should not expect to be considered as a valid member of the category and
thus be rejected in the evaluation phase of the buying process.
It seems category point‐of‐parity associations occur mainly on the supplier attributes level
according to the means‐end theory. Category members have done fewer attempts in order
to build deeper benefits or value links with the consumers. Such finding could imply that
competitors neglect emotional values and still focus mainly on more rational decision
criteria. Research conducted in this paper supports both emotional and rational decision
criteria are important in the given industry. Such claim supports the earlier statement that
there is an unexplored opportunity to build and manage sources to brand equity.
Although further competitive research is suggested, data collected in this paper did not
identify any relevant competitive point‐of‐parity associations. Agder Biocom’s managers do
not need to neglect competitive point‐of‐parity associations, but should rather monitor the
competitors’ actions.
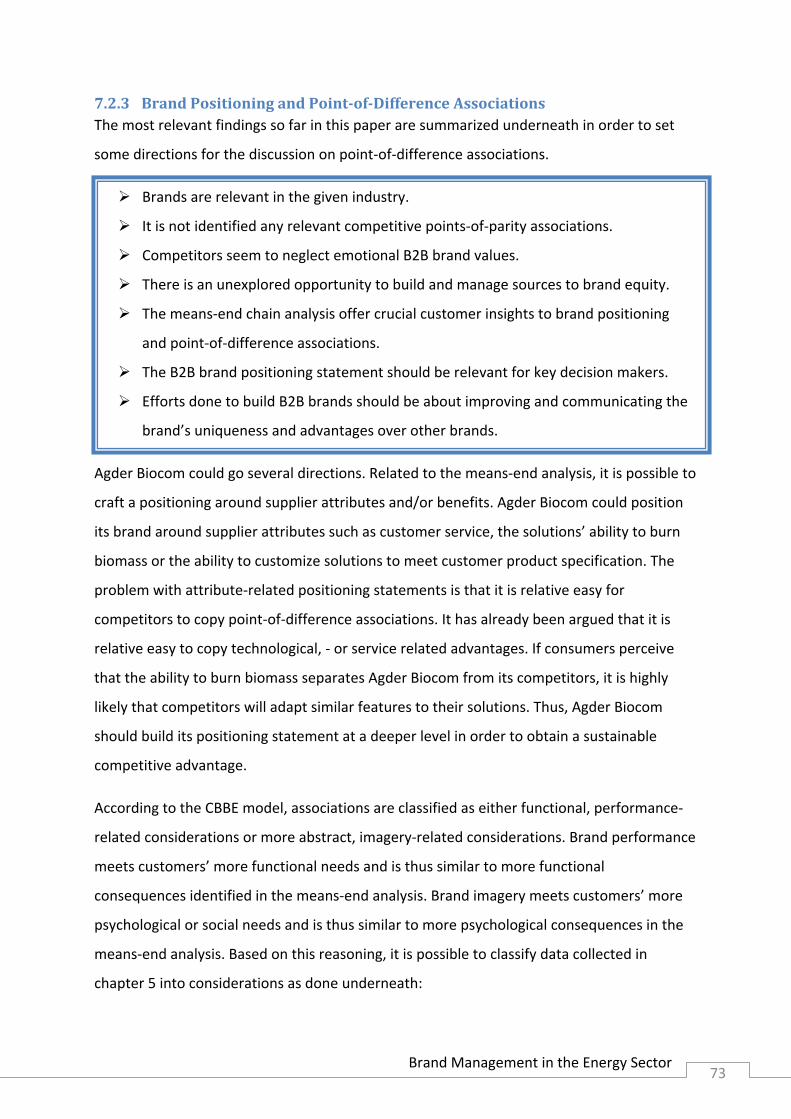
Brand Management in the Energy Sector 73
7.2.3 Brand Positioning and PointofDifference Associations The most relevant findings so far in this paper are summarized underneath in order to set
some directions for the discussion on point‐of‐difference associations.
Brands are relevant in the given industry.
It is not identified any relevant competitive points‐of‐parity associations.
Competitors seem to neglect emotional B2B brand values.
There is an unexplored opportunity to build and manage sources to brand equity.
The means‐end chain analysis offer crucial customer insights to brand positioning
and point‐of‐difference associations.
The B2B brand positioning statement should be relevant for key decision makers.
Efforts done to build B2B brands should be about improving and communicating the
brand’s uniqueness and advantages over other brands.
Agder Biocom could go several directions. Related to the means‐end analysis, it is possible to
craft a positioning around supplier attributes and/or benefits. Agder Biocom could position
its brand around supplier attributes such as customer service, the solutions’ ability to burn
biomass or the ability to customize solutions to meet customer product specification. The
problem with attribute‐related positioning statements is that it is relative easy for
competitors to copy point‐of‐difference associations. It has already been argued that it is
relative easy to copy technological, ‐ or service related advantages. If consumers perceive
that the ability to burn biomass separates Agder Biocom from its competitors, it is highly
likely that competitors will adapt similar features to their solutions. Thus, Agder Biocom
should build its positioning statement at a deeper level in order to obtain a sustainable
competitive advantage.
According to the CBBE model, associations are classified as either functional, performance‐
related considerations or more abstract, imagery‐related considerations. Brand performance
meets customers’ more functional needs and is thus similar to more functional
consequences identified in the means‐end analysis. Brand imagery meets customers’ more
psychological or social needs and is thus similar to more psychological consequences in the
means‐end analysis. Based on this reasoning, it is possible to classify data collected in
chapter 5 into considerations as done underneath:

Brand Management in the Energy Sector 74
Functional, brand performance related considerations
Quality – Reliability
Abstract, brand imagery‐related considerations
Peace of mind – Accomplishment – Better serve our customer – Trust
Comments:
Data are gathered from the means‐end analysis and transferred into more common
accepted considerations as identified above. It will be elaborated on underneath.
Quality is translated from what respondents consider as customer gets quality. From the
HVM it is possible to argue that attributes such as reasonable price and ability to meet
product specification could be associations that build this image in the minds of the
consumers.
Reliability refers to competence of the company and its solution’s ability to handle variations
and burn biomass properly. It also refers the supplier’s ability to handle any problems so the
customer avoids hassels. Associations based on such attributes could be built in order to
obtain an image of being reliable.
The work done by Keller & Webster (2004 p.399) suggest that brand imagery considerations
in B2B markets could be expertise, trustworthiness, ease of doing business and likeability. It
will thus guide the discussion on image related considerations.
It is suggested that peace of mind is similar to ease of doing business. It seems that
associations towards various benefits, consequence and attributes could achieve an image of
ease of doing business. For instance could deciders perceive ease of doing business with a
supplier that offers proper customer service and delivers as promised. Thus it should be
considered possible sources to brand equity.
Trust in the supplier is similar to trustworthiness. Deciders and consultants link
trustworthiness with a supplier’s service attributes and references. Associations built this
way could also be considered possible sources to brand equity.
Brand Management in the Energy Sector 75
Considerations related to better serve the customer and accomplishment are only valid in
the case of consultants. Because the brand positioning should be relevant for key decision
makers, these considerations should not be included as possible points‐of‐difference
associations.
Following the discussion above, it is left two more performance related considerations
(quality and reliability) and two more intangible imagery related considerations (ease of
doing business and trustworthiness). It is argued that in the given category, these
considerations are most suited for the purpose of building points‐of‐difference associations.
Implications for Agder Biocom
Agder Biocom’s mangers should decide on one of these considerations in order to build
unique points‐of‐difference associations. As commented by Kotler & Pfoertsch (p.173) “A
brand can only have one true position”. It is difficult to argue which one of the four
considerations is the best based on the research conducted in this paper. As argued earlier it
seems no competitive brand has a distinctive position, thus it should be possible to obtain
any of these positions for Agder Biocom in the given industry.
Managers must also consider which position its business is most likely to deliver on. It should
include an internal audit on the company’s culture, competence and stated objectives. While
this paper offers customer insights, it should be a balancing act between the company’s own
resources and the customers’ needs and wants. When it has decided on one position, it
should apply the principles behind the CBBE model in order to build and manage sources to
brand equity. It should identify attribute and benefits associations that are difficult for
competitors to copy. The means‐end chain analysis offer consumer insights as a foundation
to start building strong, favorable and unique associations in the minds of the consumers.
Summarized
According to Keller (2008) the sum of brand performance and brand imagery associations
make up the brand meaning, or what the consumers should think and feel about the brand.
Findings in this paper are presented in figure 7.3.

Brand Management in the Energy Sector 76
Resonance
Judgements Feelings
Performance Imagery
Salience
Figure 7.3: Points‐of‐parity and points‐of‐difference considerations
Comments:
The CBBE model offers a framework to continuously identify sources to brand equity. The
empirical data offers insights to the industry at time when research was conducted.
Changing customer needs and wants should be incorporated in a proper brand equity
measurement system. Managers should also recognize the importance of building a brand
through sequential steps as suggested in the CBBE model. It includes setting proper KPI’s for
brand awareness along with desired mental and behavioral responses from consumers in the
given industry. Mangers should design brand elements, marketing programs and leverage
secondary associations in order to achieve a proper level of brand awareness and salience,
and provide specific information about particular attributes or benefits it wants to be
associated with.
While the CBBE model is well applied in B2C settings, it should be critically applied to the
given industry. Kuhn et al (2008) applied the CBBE model in a B2B context using semi‐
structured interviews with senior buyers of technology of electronic tracking of waste
management. Their results suggest different types of feelings and imagery to those specified
by Keller may be required in business markets compared with consumer markets (Kuhn et al
p.44). More specific, their study did not find imagery associations such as history, personality
traits, heritage or experience relevant. The further found that the technology/system is
Points‐of‐parity Innovative performance Quality products Customer service
Points‐of‐parity Enviromental intiatives Competence (expertise) References
Points‐of‐difference Quality Reliability
Points‐of‐difference Ease of doing business Trustworthiness
Brand awareness amongst significant decision makers.

Brand Management in the Energy Sector 77
proven as the most important factor. Kuhn et al (2008) argue that organizational buyers
emphasize the selling organizations, including the corporate brand, credibility and staff. Such
finding seems to be consistent with the empirical data collected in this paper. The means‐
end analysis suggested that different set of values are relevant in this context compared
with consumer markets. Instead of Keller’s suggested imagery associations, it seems that key
decision makers highlight competence and references as most important associations in this
industry. It could be explained that key decision makers in the given industry place more
emphasis on the company behind the brand than the brands themselves. It contributes to
the argument to emphasize a corporate brand in the given industry.
Some authors question the CBBE model and its focus on the perspective of the customer
(Jones 2005, Burmann et al 2009). It could be argued that the CBBE model is reduced to
communicate brand values that are created elsewhere in the company. Delivering a strong
brand requires that the whole organization is working with the brand, not only marketing
communications. For instance, Burmann et al claim that the CBBE model fails to recognize
the internal source of brand equity (Burmann et al 2009). Employees create brand equity
from inside the company in interaction with customers. Jones (2005) further addresses non‐
consumer relations and their role in brand value creation. Especially he addresses the
relationships between businesses in B2B markets and other stakeholders, and how these
relationships create and co‐create brand value. Such arguments support the application of
the second part of the analytical framework presented in chapter 2. Agder Biocom should
identify and commit to a set of B2B brand values in order to stand out with a distinct identity
in the biomass heating plant industry.
7.3 Part 2 – Establish a Brand Identity through B2B Brand Values The second part acknowledges that the decision making unit is made up by individuals with
different needs and wants. Theorists from consumer behavior offer several ways to make
distinction on needs and values in consumer markets. For instance two widely applied
theories are Maslow’s needs of hierarchy and the distinction between utilitarian and
hedonistic needs (Solomon et al p. 90‐100). It is difficult to argue that same needs and values
are relevant in the given context of this paper. Instead, Lynch and de Chernatony (2007)
offer some interesting insight to business markets and B2B brand values. They claim that
“While functional brand values may dominate industrial purchase situations, different buying

Brand Management in the Energy Sector 78
centre participants may be influenced by emotional considerations such as trust, security and
peace of mind (2007 p.124).” By dividing B2B brand values into more functional and more
emotional considerations it is possible to identify the following values from various sources
collected in this paper:
Functional B2B brand values
Quality – Reliability – Service – Innovative performance
Emotional B2B brand values
Peace of mind – Accomplishment – Better serve our customer – Trust – Environmental
benefits ‐ Expertise
Comments:
Most of these values are adopted from the discussion above while considering points‐of‐
difference associations. Service and innovative performance are included as functional B2B
brand values because they are considered to be important point‐of‐parity associations.
Environmental concern and expertise are included as emotional B2B brand values because
they were also identified as important point‐of‐parity associations.
7.3.1 B2B Brand Values, Roles and the Buying Process Findings in this paper support that different roles appear to be motivated by different
underlying needs, values and motivations. While each person is unique in his or her role, the
use of ideals demonstrates how Agder Biocom can tailor its communication in order to
present the most persuasive arguments to each participant in the buying center. In real life
context, sellers should anticipate each participant in order to recognize when to emphasize
particular B2B brand values. It will be elaborated on according to the buying process and
roles as identified in chapter 4.
Stage 1 Problem recognition
Initiators often are the ones who recognize a problem or
need for heated buildings. At this stage they could decide on
different solutions such as biomass heating plant, oil driven
solutions or electricity. Compared with such alternatives,
Decision to buy biomass
Initiators

Brand Management in the Energy Sector 79
biomass offers both environmental benefits and economic benefits. The means‐end research
analysis did not include initiators, but informants in the industry suggest initiators are driven
by environmental and economic concern. Thus stressing these two values along with
persuasive arguments could shift the initiators’ decisions in favor of biomass and Agder
Biocom as the preferred supplier.
Stages 2 to 4, product specification and search of alternatives
A work group consisting of users, deciders and consultants is
often formed during these stages of the buying process.
Informants claim it is likely that users in the industry
emphasize a solution that is reliable and do not offer them
additional work. Thus, functional values such as quality,
reliability and service could be of relevance to them. Also, more emotional values such as
peace of mind and trust could reassure them that Agder Biocom is the most suited supplier.
The HVM that summarize deciders indicate that deeper more emotional values related to
peace of mind and trust influence their decisions. The HVM also portray how they seek
reliability, service and quality as more functional values.
Last, consultants seem to be influenced by deeper emotional values related to peace of
mind, accomplishment, better serve the customer, trust and expertise. In addition more
functional values such as reliability, quality and service seem to influence their decision
making.
During these stages, it does not appear that any important decisions are made. But providing
different members of the buying center with tailored arguments according to their
underlying motivations could ensure Agder Biocom become a part of their consideration set.
Stage 5, Proposal solicitation and analysis
It seems that consultants make crucial decisions during this
stage thus sales efforts should be prioritized towards them.
Rather than overloading consultants with possible benefits,
information and promotions it is suggested to sense and
comprehend their needs in order to emphasize particular brand values. The HVM offer
Establish consideration sets
Users Consultants Deciders
Prequalify suppliers (3‐5)
Consultants
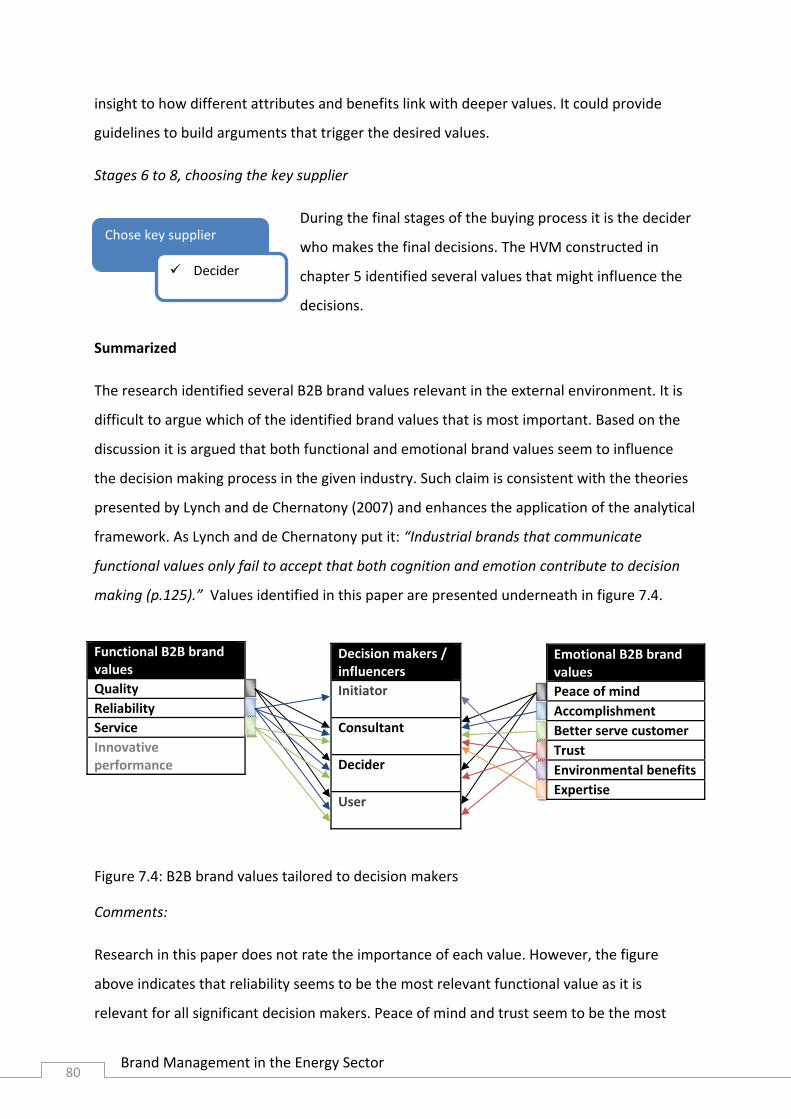
Brand Management in the Energy Sector 80
insight to how different attributes and benefits link with deeper values. It could provide
guidelines to build arguments that trigger the desired values.
Stages 6 to 8, choosing the key supplier
During the final stages of the buying process it is the decider
who makes the final decisions. The HVM constructed in
chapter 5 identified several values that might influence the
decisions.
Summarized
The research identified several B2B brand values relevant in the external environment. It is
difficult to argue which of the identified brand values that is most important. Based on the
discussion it is argued that both functional and emotional brand values seem to influence
the decision making process in the given industry. Such claim is consistent with the theories
presented by Lynch and de Chernatony (2007) and enhances the application of the analytical
framework. As Lynch and de Chernatony put it: “Industrial brands that communicate
functional values only fail to accept that both cognition and emotion contribute to decision
making (p.125).” Values identified in this paper are presented underneath in figure 7.4.
Figure 7.4: B2B brand values tailored to decision makers
Comments:
Research in this paper does not rate the importance of each value. However, the figure
above indicates that reliability seems to be the most relevant functional value as it is
relevant for all significant decision makers. Peace of mind and trust seem to be the most
Functional B2B brand values Quality Reliability Service Innovative performance
Decision makers / influencers Initiator Consultant Decider User
Emotional B2B brand values Peace of mind Accomplishment Better serve customer Trust Environmental benefits Expertise
Chose key supplier
Decider
Brand Management in the Energy Sector 81
relevant emotional brand values as these are relevant for three out of four significant
decision makers. Further research could declare which of the values that is most important
in the given industry.
Implication for Agder Biocom
The implication for Ager Biocom’s managers is to decide on which values it will commit to.
For creating B2B brand values is not about communication an external image, but rather
build a brand identity around a set of core values. As argued by Lynch and de Chernatony:
“Effective branding practice prescribes a limited number of core values for any organization
(usually no more than five) to ensure consistency of both internal and external brand
communication (p.125).” Research conducted in this paper offers insight to the external
environment that Agder Biocom operates in. Its managers should also identify a relevant set
of values built on the organization’s competencies and culture. Once it has decided on a set
of values, it should build up its organization so it enacts and empower them. Such
organization includes placing the brand at the heart of the business. Making sure it is treated
as a strategic asset consistent with the corporate strategy.
7.4 Part 3 – Building the Brand from Bottom‐up This part is added to the discussion as some academics claim top‐down branding in industrial
markets offer little to customers. As Narayandas puts it:”Companies start by asking the
vision question: what business are we in? Then they segment the business and deploy
branding strategies, communication tactics, and sales tools. That top‐down approach may
work well for consumer products, but in business markets, it leads companies astray,
hampering their efforts to acquire and retain customers (2005 p.131).” It is argued in this
paper that a balanced strategy of top‐down and bottom‐up brand management activities are
crucial in order to achieve a strong position in the given industry. This claim is also supported
by Keller and Webster (2004 p.400) who argue: “Both pairs of brand management activities
(top‐down and bottom‐up) can be complementary and mutually reinforcing.” While the first
two parts in this chapter consider more top‐down approach to brand management, this part
discusses the bottom‐up approach.
The means‐end analysis portrayed how key decision makers evaluate suppliers on economic,
technical, service and social attributes. This classification is consistent with Narayandas

Brand Management in the Energy Sector 82
typology of benefits (2006 p. 132). Thus the application of means‐end theory seems
appropriate for the purpose of discussing relevant customer benefits. Narayandas further
suggests grouping benefits into four categories. Hence supplier attributes identified in the
means‐end analysis in chapter 5 can be grouped into the following benefit categories:
Tangible financial benefits Ability to burn biomass properly Meets product specification Satisfy regulations Reasonable price
Nontangible financial benefits Service Solution reliability Product quality Aesthetics
Tangible nonfinancial benefits Competence References (reputation)
Nontangible nonfinancial benefits
Table 7.1: Supplier attributes identified as customer benefit categories Comments:
According to Narayandas (2005) tangible financial benefits have value that sellers can
communicate and buyers can verify. It is argued that in the given sellers can communicate
the value of burning biomass, price and demonstrate how their solution meets regulations
and the customer product specification.
Nontangible financial benefits are benefits with values sellers can communicate, but buyers
cannot easily validate. Service and aesthetics are supplier attributes that sellers can
communicate, but not so easily convert into monetary terms. Aesthetics relates to a solution
that fits with the environment. It may provide the customer with additional safety and
keeping a certain style to its buildings. Such benefits seem to be important for some decision
makers, but are not so easily translated into quantitative measures they can validate the
importance on. Solution reliability and product quality are classified as supplier attributes
although it is considered as consequences in the means‐end analysis. Here they are
converted into supplier attributes because they are commonly accepted as customer
benefits (Narayandas 2005 p.133). While a reliable solution and product quality offer a range
of benefits, it is more difficult to turn them into monetary terms that buyers can validate.
Thus it should be classified accordingly. For instance could a reliable solution lead to reduced
problems in the future and thus offer better economy for the customer. It is relative easy to
communicate, but more difficult for buyers to quantify. Such claim is also consistent with
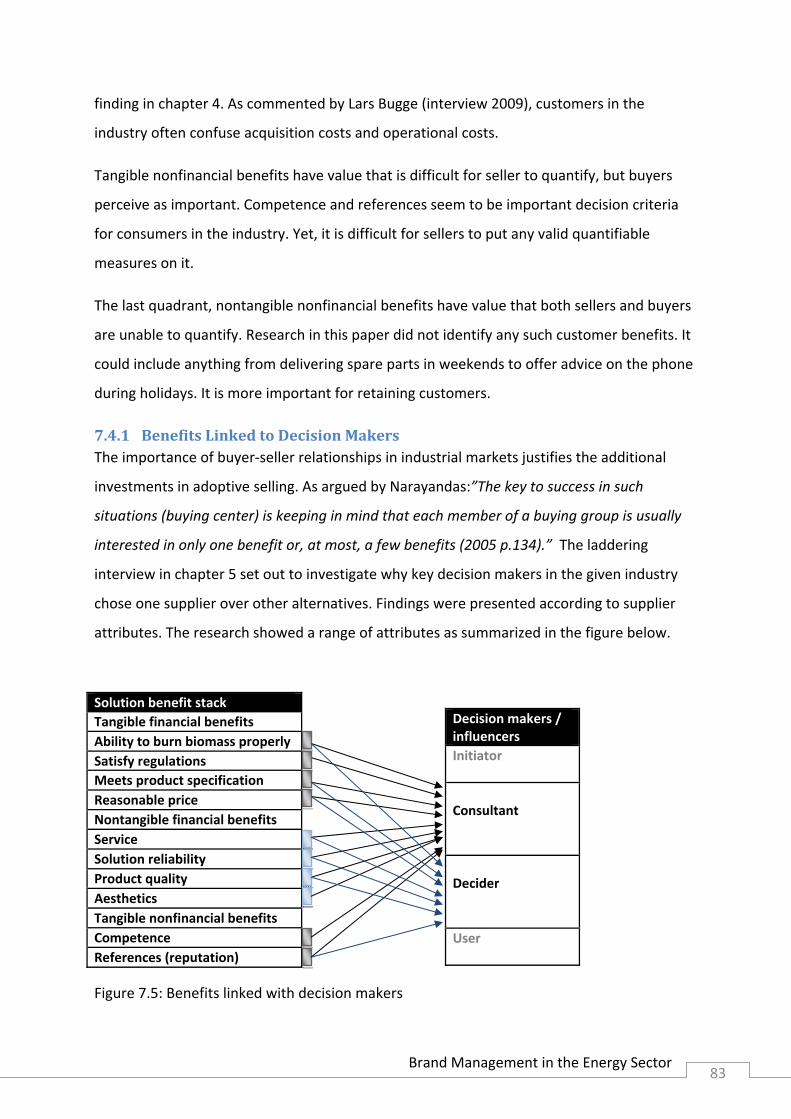
Brand Management in the Energy Sector 83
finding in chapter 4. As commented by Lars Bugge (interview 2009), customers in the
industry often confuse acquisition costs and operational costs.
Tangible nonfinancial benefits have value that is difficult for seller to quantify, but buyers
perceive as important. Competence and references seem to be important decision criteria
for consumers in the industry. Yet, it is difficult for sellers to put any valid quantifiable
measures on it.
The last quadrant, nontangible nonfinancial benefits have value that both sellers and buyers
are unable to quantify. Research in this paper did not identify any such customer benefits. It
could include anything from delivering spare parts in weekends to offer advice on the phone
during holidays. It is more important for retaining customers.
7.4.1 Benefits Linked to Decision Makers The importance of buyer‐seller relationships in industrial markets justifies the additional
investments in adoptive selling. As argued by Narayandas:”The key to success in such
situations (buying center) is keeping in mind that each member of a buying group is usually
interested in only one benefit or, at most, a few benefits (2005 p.134).” The laddering
interview in chapter 5 set out to investigate why key decision makers in the given industry
chose one supplier over other alternatives. Findings were presented according to supplier
attributes. The research showed a range of attributes as summarized in the figure below.
Figure 7.5: Benefits linked with decision makers
Solution benefit stack Tangible financial benefits Ability to burn biomass properly Satisfy regulations Meets product specification Reasonable price Nontangible financial benefits Service Solution reliability Product quality Aesthetics Tangible nonfinancial benefits Competence References (reputation)
Decision makers / influencers Initiator Consultant Decider User

Brand Management in the Energy Sector 84
Comments:
It is difficult to argue which benefit is most important for each decision maker. Further
research could determine which of the given attributes rate highest amongst each decision
maker. Or, trained sellers can anticipate the situation and enact on the benefits most suited
the individual. Research could also identify how initiators and users evaluate supplier
attributes. It is likely that benefits related to the users and initiators considerations are of
relevance in the given industry. For instance, the user is often a person who runs and
maintains the heating plant. It is likely he or she perceive benefits related to ease of
maintenance as relevant. As users and initiators are not classified as key decision makers in
this case, such considerations will not be further elaborated on in this paper.
Implication for Agder Biocom
The implication for Agder Biocom’s managers is to first organize its business so it is capable
of delivering on benefits as suggested above. It relates to a value proposition it must deliver
on each time if it wants to be perceived as a valid supplier. Further research could reveal the
relative importance of each benefit for customers in a defined target market. Second, it
should build arguments according to the benefit categories so their customers grasp the
value of their offerings. Analysis conducted by Agder Biocom shows that the gasification
technology has a range of possible benefits for the customer. The analysis is conducted from
the lens of the company. While the claims may prove to be valid, the benefits do not seem
to reflect the truly needs and wants of key decision makers in the industry. Instead of listing
up a range of possible benefits, it is suggested to provide decision makers with arguments
most likely to meet their needs and processes.
Chapter 4 portrayed how two common buying situations often seem to occur in the given
industry, but stresses that each situation is unique and should be treated accordingly. Such
finding seems to be consistent with the theory applied in this part, thus supporting the
importance of adopting a bottom‐up approach to branding. Research conducted in this
paper also supports the claim that decision making processes in the given industry are driven
by both rational and emotional criteria. Thus it supports the application of grouping benefits
into both tangible and intangible categories. Based on this, it seems Narayandas theories
apply well to the given industry.

Brand Management in the Energy Sector 85
7.5 Part 4 – The Brand Core and Branding Concepts A sound B2B brand strategy should involve a balancing act of making a consistent impression
throughout the organization. In strategy literature brands are often discussed as more
tactics stemming from the corporate strategy. It is limited to a tool for communicating value
already created by other processes in the company. Agder Biocom’s managers should
recognize the importance of the brand and consider it as one of the companies most
valuable asserts. Hence, the brand strategy should be crafted as an integrated part of the
corporate strategy. In order to become a brand‐driven organization, all efforts should be
rooted in what Kotler & Pfoertsch (2006 p.169) term the brand core. The brand core goes by
many names such as brand essence, core brand promise or brand mantra. As Keller
comments: “A brand mantra is an articulation of the “heart and soul” of the brand, a short,
three‐ to five‐word phrase that captures the irrefutable essence or spirit of the brand
positioning (2008 p.122).” It is difficult to argue what should make up the brand core or
brand mantra for Agder Biocom. This paper offers insights from the external environment it
operates in and could provide managers with directions on how to define their brand core.
Such considerations are beyond the scope of this assignment. It is highly recommended that
managers of Agder Biocom adopt branding principles, take command of their own brand and
complete the work of implementing a proper brand strategy.

Brand Management in the Energy Sector 86
Brand Management in the Energy Sector 87
Chapter 8 ‐ Implications and Conclusion
It seems the selected theories and models explained the biomass heating plant industry in a
way consistent with current knowledge about B2B markets. It supports to claim the industry
should be threatened as a B2B context where general B2B branding theories should apply
well. The explorative case study approach provided data on real‐life context and should offer
practical guidelines for Agder Biocom and its managers.
The paper also demonstrated the application of the means‐end method in a new context.
The application of means‐end analysis identified several sources to brand equity in the given
industry. By identifying sources to brand equity, it enhances the application of Keller’s CBBE
model in the industry. It is reasonable to assume that efforts done to create strong,
favorable and unique associations should transform into loyal, active consumers towards a
given brand in the biomass heating plant industry.
Another Perspective
Working with this paper offered interesting observations along the way. It could add
perspective to the subject of study. As the paper seems to move towards corporate
branding, it could be interesting to include theories from corporate communications. It could
provide insights to corporate branding and whether green marketing initiatives could
influence demand for biomass heating plants. Data collected in this paper concentrated on
the 1‐2 Mw segment in the biomass heating industry. A stakeholder analysis could further
identify sources to brand equity in order to build a distinctive identity at a broader level in
the marketplace. It would have several implications for Agder Biocom and its managers.

Brand Management in the Energy Sector 88
8.2 Conclusion The paper set out to explore alternative energy markets in Norway in order to discuss how
branding may provide companies with a sustainable competitive advantage. The thesis has
been written with the purpose of solving the problem statement proposed in the initial
phase of the project. It resulted in two major research questions with a range of sub
questions.
The first major research question focused on the structure of alternative energy markets in
Norway and led to the question: How does branding principles apply to the biomass heating
plant industry?
The framework applied in this paper showed favorable trends on factors that influence
future demand for bio‐energy in the heat market. Within this market it seems the emerging
biomass heating plant industry is attractive to compete in on long‐term. Implications for
branding were discussed in chapter 3 and 4. It has been argued several times the industry is
structured as a B2B context and should be threaten as such. Compared with other energy
sources, biomass heating plants incorporate additional risk as perceived by consumers in the
1 – 2 Mw segment. Given the high investment cost and a history with unserious offerings, it
is likely a strong brand could become a trust mark for decision makers in the industry.
Analysis identified four roles that make up the buying center in most buying situations.
Initiators, deciders (project leaders), consultants and users make the important decisions in
the buying process of heating plants. Out of them, deciders and consultants seem to have
most influence on decisions.
Means‐end chain analysis in chapter 5 confirms that key decision makers seem to be driven
by more rational and more emotional decision criteria. Different roles in the industry also
seem to be driven by different deeper underlying needs, values and motivations. While the
study indentified several sources to brand equity, it was not supported that green energy
initiatives have major influence on important decisions in the industry.
In order to provide practical use of the knowledge gained in the first part, a case study led to
the second major research question: How should Agder Biocom position a B2B brand within
the given industry?

Brand Management in the Energy Sector 89
It seems main competitors have differentiated heating plant offerings in the industry in a
number of ways. Competitor claim to be superior on similar supplier attributes where no
strong B2B brand was identified. It raised the claim that it is an unexplored opportunity to
build and manage brand equity in the industry.
Chapter 6 and 7 discussed how Agder Biocom should be perceived similar to a group of
established members in the 1‐2 Mw segment. It identified four possible considerations to
build unique points‐of‐difference associations in order to set out from the competition.
Given the B2B context it was argued Agder Biocom should build a distinct brand identity in
the market place. Analysis identified several functional and emotional B2B brand values
relevant from the consumer perspective. Last, the paper acknowledged the need of
balancing top‐down and bottom‐up branding activities in the industry. The basic product and
service offering should be tailored to satisfy different members of the buying center in each
unique buying situation. Research conducted in this paper does not provide sufficient
arguments to make to final recommendations, but provide sufficient data in order Agder
Biocom’s mangers to craft and implement a proper brand strategy.

Brand Management in the Energy Sector 90
Brand Management in the Energy Sector 91
References
Books
Aaker, D. A., & Joachimsthaler, E. (2000), “Brand Leadership”, The Free Press, New York, NY.
Andersen, Ib (2008), “Den skinbarlige virkelighed ‐ om vidensproduktion inden for samfundsvidenskaberne”, Samfundslitteratur, Denmark.
Anderson James, C., & Narus, James A. (2006) “Business Market Management: Understanding, Creating, and Delivering Value”, 2nd ed., Prentice Hall, Upper Saddle River, NJ.
Block, Martin P., & Block, Tamera S. (2005), “Business to Business Marketing Research”, Thomson South‐Western, US.
Hair, Joseph., Bush, Robert., & Ortinau, David (2006), “Marketing Research – Within a Changing Environment”, Int, ed., McGraw‐Hill Irwin, New York, NY.
Johnson, Michael D., & Anders Gustafsson (2000), “Improving Customer Satisfaction, Loyalty and Profit: An Integrated Measurement and Management System”, San Francisco: Jossey‐Bass.
Kapferer, J. N., (2008), ”The New Strategic Brand Management – Creating and sustaining brand equity long term”, 4th ed., Kogan Page, London and Philadelphia.
Keller, Kevin L. (2008), “Strategic Brand Management: Building, Measuring, and Managing Brand Equity”, 3rd ed., Prentice Hall, New York.
King, G., Keohane, R.O., & Sidney, V. (1994), “Designing Social Inquiry – Scientific Inference in Social Research”, Princeton University Press, Princeton, NJ.
Kotler, Philip, & Keller, Kevin L. (2006), ”A Framework for Marketing Management”, 4th ed., Prentice Hall, Upper Saddle River, NJ.
Kotler, Philip, & Pfoertsch, Waldemar (2006), ”B2B brand management”, Springer, Berlin.
Parry, Mark E. (2001), “Strategic marketing management: a means‐end approach”, McGraw‐ Hill executive MBA series, Two Penn Plaza, NY.
Reynolds, J.T., & Olson, C.O. (2001), “Understanding consumer decision making: The Means– End Approach to Marketing and Advertising Strategy”, Lawrence Erlbaum Associates inc., Mahwah, NJ.
Solomon, M., Bamossy, G., Askegaard, S., & Hogg, M.A. (2006), “Consumer Behaviour – A European Perspective”, 3rd ed., Prentice Hall, Europe.

Brand Management in the Energy Sector 92
Yin, R.K. (2003) “Case study research: Design and methods”, 3rd ed., Thousand Oaks, Calif.: Sage.
Scientific articles
Aspara, J., & Tikkanen, H (2008), “Adoption of corporate branding by managers: case of a Nordic business‐to‐business company”, Journal of Brand Management, Vol. 16 Issue 1/2, p80‐91.
Burmann, Christoph., Jost‐Benz, Marc., & Riley, Nicola. (2009), “Towards an identity‐based brand equity model”, Journal of Business Research, Vol. 62 Issue 3, p390‐397.
Flyvbjerg, Bent (2006), ”Five Misunderstandings About Case‐Study Research”, Qualitative Inquiry, Volume 12, Number 2, pp. 219‐245.
Grunert, K.G., & Grunert S.C (1995) “Measuring subjective meaning structures by the laddering method: Theoretical considerations and methodological problems.” International Journal of Research in Marketing, Volume 12, Issue 3, Pages 209‐225.
Gutman, J. (1982) “A means–end chain model based on consumer categorization processes”, Journal of Marketing, 46: 60–72.
Hartmann, Patrick., & Apaolaza Ibáñez, Vanessa (2007), “Managing customer loyalty in liberalized residential energy markets: the impact of energy branding”, Energy Policy, Vol. 35 Issue 4, p2661‐2672.
Jensen, Morten Bach., & Klastrup, Kim (2008), “Towards a B2B customer‐based brand equity model”, Journal of Targeting, Measurement & Analysis for Marketing, Mar2008, Vol. 16 Issue 2, p122‐128.
Jones, Richard (2005), “Finding Sources of Brand Value: Developing a Stakeholder Model of Brand Equity,” Journal of Brand Management, 13 (1), 10–32.
Kim, J., Reid, D., Plan, R., & Dahlstrom, R. (1998), “Examining the role of brand equity in business markets: A model, research proposition and managerial implications”, Journal of Business‐to‐Business marketing, vol. 5, no.3, pp. 65‐89.
Kim, W. Chan., & Mauborgne, Renée (2005), ”Blue ocean strategy: from theory to practice”, California Management Review, Vol. 47 Issue 3, p105‐121.
Kuhn, Kerri‐Ann L., Alpert, Frank., & Pope, Nigel K. Ll (2008), “An application of Keller's brand equity model in a B2B context”, Qualitative Market Research: An Internationa Journal, Vol. 11 Issue 1, p40‐58.
Lynch, J., & de Chernatony, L. (2004), “The power of emotion: Brand communication in business‐to‐business markets”, Journal of Brand Management, Vol. 11, No. 5, pp. 403 – 419.

Brand Management in the Energy Sector 93
Lynch, J., & De Chernatony, L. (2007), "Winning Hearts and Minds: Business‐to‐Business Branding and the Role of the Salesperson", Journal of Marketing Management, Vol. 23, no. 1/2, pp. 123‐135.
Maitlis, S., & Ozcelik, H. (2004), “Toxic decision processes: A study of emotion and organizational decision making”, Organizational Science, 15, 375–393.
Michell, P., King, J. & Reast, J. (2001), “Brand values related to industrial products’, Industrial Marketing Management, 30, pp. 415‐425.
Mudambi, S. (2002), “Branding importance in business‐to‐business markets three buyer clusters”, Industrial Marketing Management , Vol. 31 , No. 6 , pp. 525 – 533.
Narayandas, Das (2005), “Building loyalty in business markets”, Harvard Business Review, Vol. 83 Issue 9, p131‐139.
Rauyruen, P., & Miller, K. E., (2007), “Relationship quality as a predictor of B‐to‐B customer loyalty”, Journal of Business Research, Vol. 60, pp. 21 – 31.
Reynolds, TJ., & Gutman, J. (1988), “Laddering theory, method, analysis and interpretation”, Journal of Advertising Research, (Feb/March) 28:11–31.
Sen, S. Basligil., H. Sen, C. G., & BaraÇli, H. (2008), ”A framework for defining both qualitative and quantitative supplier selection criteria considering the buyer‐supplier integration strategies”, International Journal of Production Research, Vol. 46, Issue 7, p1825‐ 1845.
Stock, Ruth M. (2005), “Can Customer Satisfaction Decrease Price Sensitivity in Business‐to‐ Business Markets?” Journal of Business‐to‐Business Marketing, 12 (3), 59–87.
Trømborg, Erik., Bolkesjø, Torjus Folsland., & Solberg, Birger (2008), “Biomass market and trade in Norway: status and future prospects”, Biomass and Bioenergy, Volume 32, Issue 8, Pages 660‐671.
Ulaga, Wolfgang., & Andreas Eggert (2006), “Value‐Based Differentiation in Business Relationships: Gaining and Sustaining Key Supplier Status,” Journal of Marketing, 70 (January), 119–36.
Wansink, Brian (2003), “Using laddering to understand and leverage a brand's equity”, Qualitative Market Research: An International Journal, 2003, Vol. 6 Issue 2, p111‐118.
Webster, F. E., Jr. and Keller, K. L. (2004), “A roadmap for branding in industrial markets”, Journal of Brand Management, Vol.11, No. 5, pp. 388–402.
Wiedmann, Klaus‐Peter (2004), “Measuring Brand Equity for Organizing Brand Management in the Energy Sector: A Research Proposal and First Empirical Hints: Part I: The Development of a Theoretical Concept and a Research Programme”, Journal of Brand Management, 12 (2), 124‐40.

Brand Management in the Energy Sector 94
Wüstenhagen, Rolf., & Bilharz, Michael (2006), “Green energy market development in Germany: effective public policy and emerging customer demand”, Energy Policy, Vol. 34 Issue 13, pp. 1681‐1696.
Websites and URL’s
Bowman, Jo (2008), ”Climate Change: Green Branding ‐ Cashing in on the Eco‐Market”, (accessed May 2009), [http://www.wipo.int/wipo_magazine/en/2008/02/article_0003.html].
Egeland (2009), ”Vår grønne mulighet”, (accessed May 2009), [http://www.vvsforeningen.no/portal/page/portal/vvs/artikkel_blogg?element_id=5 13391]
Frost & Sullivan (2009;1), ”Green Energy Coverage”, (accessed May 2009), [http://www.frost.com/prod/servlet/subscription‐overview.pag?svcid=GETE].
Frost & Sullivan (2009;2), ”Impact of the Financial Crisis on the Renewable Energy Industry in Africa”, (accessed May 2009), [http://www.frost.com/prod/servlet/market‐insight‐ top.pag?Src=RSS&docid=162326223].
Trømborg & Solberg (2007), “Bioenergi krever satsing” (accessed May 2009), [http://www.nationen.no/meninger/Kronikk/article2508153.ece].
Valmot (2009), ”Mer bioenergi”, (accessed May 2009), [http://www.tu.no/innsikt/article207201.ece].
www.enova.no www.nobio.no www.doffin.no www.regjeringen.no www.tps.se www.weiss‐as.dk www.hotab.se www.sgp.no www.stxgrenlandindustri.no www.innovasjonnorge.no
Reports
Enova , ”Ti år med røde tall ‐ Barrierer for økt utbygging av lokale varmesentraler og nærvarmeanlegg”, Norsk Bioenergiforening, Norsk Varmepumpeforening and Norsk Petroleumsinstitutt 2007.
Regjeringen, “Strategi for økt utbygging av bioenergi”, Olje‐, og energidepartementet 2008.
Regjeringen, ” Bioenergi i Norge – potensialer,markeder og virkemidler”, Norsk institutt for skog og landskap, Østlandsforskning and Institutt for strategisk analyse 2007.
St. meld. Nr 34 (2006‐2007), ”Norsk Klimapolitikk”, Miljøverndepartementet 22. juni 2007.

Brand Management in the Energy Sector 95
Appendix 1 – Interviews with informants and respondents.
Informants
Name Main findings Jan Bjarne Wormli Sales manager, Agder Biocom
Technical insight to the gasification technology. Information about the market. Information about Agder Biocom and the Tratec Group. Each buy is unique. It is only in rare cases a straight re‐buy occurs.
Christian Brennum CEO, SGP Biovarme
Few customers wish to be in contact with heating plants, thus the establishment of drifting companies. In the beginning companies offered both equipment and drifting, but it seems to be an opposite trend now. Around 2‐3 Mw is dominated by foreign suppliers. The buying process depends on the situation. Often two common situations occur in the industry. In an immature industry, new entrants are seeking fortune and disrupt the competition. It leads to price competition. A lot of qualified foreign component suppliers. The industry seems to show a favorable trend. The political will is well supported. Insight to the competitive frame of reference.
Sigbjørn Bråtane CEO, Sveis og Montering AS
The company is known for its gas plants, but is now looking to establish its position in the biomass heating plant industry. Seems to be a trend for similar companies. The biomass industry attracts a lot of healthy investors. Foresters an important customer group. Technical insight to heating plants. Insight to the competitive frame of reference.
Siren Frigstad Head of technical department and project leader, Birkenes Kommune
Each project goes through several stages. Often a project and a control group guide the buying process. Important roles are initiators, consultants, project leaders and users. Initiators see environmental and economic benefits with bio‐energy. Users focus on reliable plants, easy to operate and maintain. Electricity generates high drifting costs in hospitals and schools. Norwegian municipalities are looking for a green profile.
Tormod Gevelt Head of technical department and project leader, BioVarme AS
Each project goes through several stages. Often a project and a control group guide the buying process. Plumbers and drifters often part of the buying process. Important roles are initiators, consultants, project leaders and users. Initiators see environmental and economic benefits with bio‐energy. Each major city in Norway is controlled by the biggest energy providers through convention. 1‐2 Mw segment normally operates with free competition amongst suppliers. Investment costs are higher for bio‐energy compared with oil and gas.
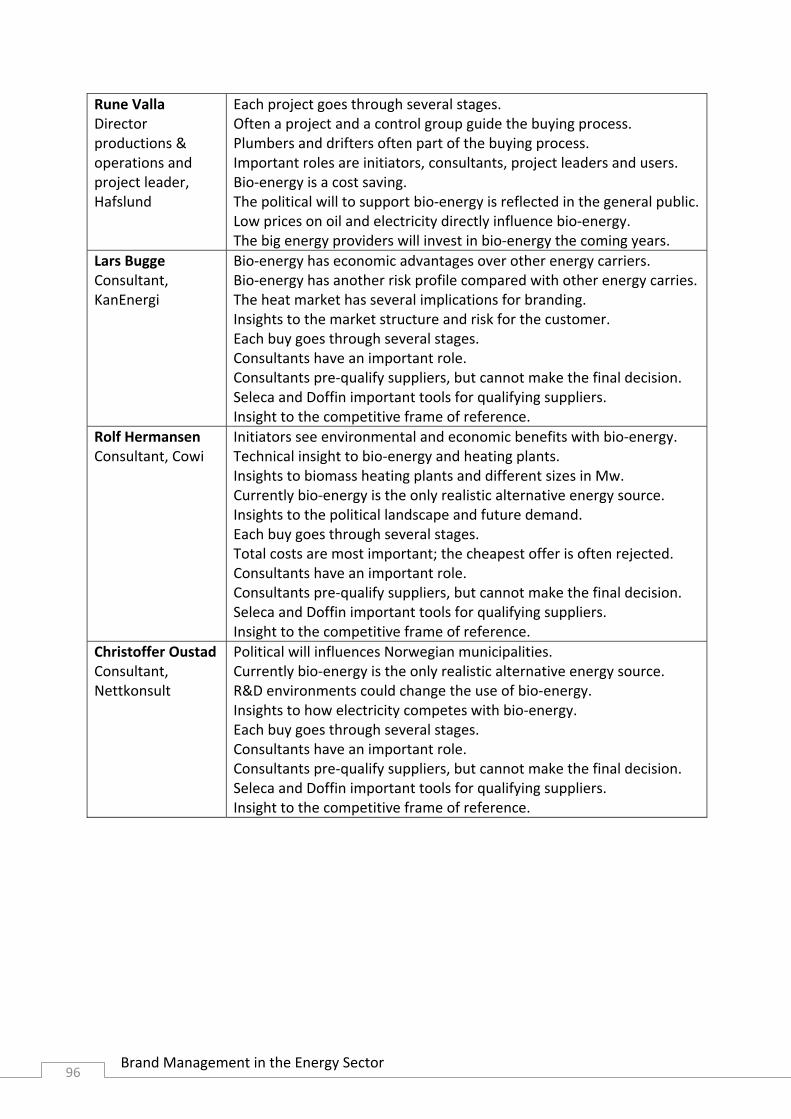
Brand Management in the Energy Sector 96
Rune Valla Director productions & operations and project leader, Hafslund
Each project goes through several stages. Often a project and a control group guide the buying process. Plumbers and drifters often part of the buying process. Important roles are initiators, consultants, project leaders and users. Bio‐energy is a cost saving. The political will to support bio‐energy is reflected in the general public.Low prices on oil and electricity directly influence bio‐energy. The big energy providers will invest in bio‐energy the coming years.
Lars Bugge Consultant, KanEnergi
Bio‐energy has economic advantages over other energy carriers. Bio‐energy has another risk profile compared with other energy carries.The heat market has several implications for branding. Insights to the market structure and risk for the customer. Each buy goes through several stages. Consultants have an important role. Consultants pre‐qualify suppliers, but cannot make the final decision. Seleca and Doffin important tools for qualifying suppliers. Insight to the competitive frame of reference.
Rolf Hermansen Consultant, Cowi
Initiators see environmental and economic benefits with bio‐energy. Technical insight to bio‐energy and heating plants. Insights to biomass heating plants and different sizes in Mw. Currently bio‐energy is the only realistic alternative energy source. Insights to the political landscape and future demand. Each buy goes through several stages. Total costs are most important; the cheapest offer is often rejected. Consultants have an important role. Consultants pre‐qualify suppliers, but cannot make the final decision. Seleca and Doffin important tools for qualifying suppliers. Insight to the competitive frame of reference.
Christoffer Oustad Consultant, Nettkonsult
Political will influences Norwegian municipalities. Currently bio‐energy is the only realistic alternative energy source. R&D environments could change the use of bio‐energy. Insights to how electricity competes with bio‐energy. Each buy goes through several stages. Consultants have an important role. Consultants pre‐qualify suppliers, but cannot make the final decision. Seleca and Doffin important tools for qualifying suppliers. Insight to the competitive frame of reference.

Brand Management in the Energy Sector 97
Respondents
Due to the respondents’ knowledge and experience in the industry, they are also used as informants in other parts of the paper.
Name Position Role given in this paper Siren Frigstad Head of technical department and
project leader, Birkenes Kommune Decider
Tormod Gevelt Head of technical department and project leader, Bio Varme AS
Decider
Rune Valla Director productions & operations and project leader, Hafslund
Decider
Lars Bugge Consultant, KanEnergi Consultant Rolf Hermansen Consultant, Cowi Consultant Christoffer Oustad Consultant, Nettkonsult Consultant

Brand Management in the Energy Sector 98
Appendix 2 ‐ Interview guide for informants and respondents
People classified as informants answer part 1, while people classified as respondents answer both part 1 and part 2. The original interview guide is translated from Norwegian.
Part 1
Could you briefly tell me about your background?
How does bio‐energy compete with other energy sources?
How do the general features of the biomass heating central?
How does the buying process occur in the given industry?
Who takes the initiative, and who makes the final decisions?
What is your role in the buying process?
What decisions do you influence or make?
Part 2
Think of a recent situation in which you participated in the buying process of a biomass heating central ranging 0.5 to 2 Mw.
What was your role in this process?
How did you separate suppliers from each other?
Think of the one supplier you recommended, why did you prefer the supplier?
Probe:
Why is that important to you?
Think of a situation where you lacked [attribute, consequence], why would you miss it?
In your role, why do you regard [attribute, consequence] as important?

Brand Management in the Energy Sector 99
Appendix 3 – The product and the technology
The pictures underneath illustrate a typical biomass heating plant capable of producing 1 – 2 Mw. It is also shown with feeding mechanism and container for biomass handling.
The picture underneath demonstrate how the gasification module enhances the performance of biomass combustions.
1. Gasification part
2. Patented gas burner
3. Feeding mekanism
4. Waste disposal
5. Heating system

Brand Management in the Energy Sector 100
Appendix 4 ‐ Market segments according to Mw size
Biomass heating plants can be divided into four segments as illustrated in the figure below:
0,5 – 1 Mw 1 – 2 Mw 2 – 5 Mw 5 – 10 Mw
Description Standardized
plants Low regulative
Flexible plants Tighter regulative
Flexible plants
Flexible plants Often needs special permit Highly regulative
Type of biomass
Wood pallets Wood briquettes 30–35 % moisture
Crushed wood Wood briquettes 35–40 % moisture
Crushed wood Waste Wood briquettes Straw
50 % moisture
Crushed wood Waste Wood briquettes 60 % moisture
Typical customers
Municipalities Schools, hospitals, etc
Municipalities Energy companies Industry Dairy Gardeners Nærvarmeanlegg
Energy companies Industry
Energy companies Industry Fjernvarmeanlegg
Biomass and moisture
Biomass is classified according to its type and level of moisture. Biomass could be waste, wood pallets/briquettes or crushed wood. Moisture determines the technology needed in order to burn biomass properly.

Brand Management in the Energy Sector 101
Appendix 5 ‐ DESTEP analysis
Data is collected from various public reports as listed in references. Analysis are based on qualitative data only.
Favorable trends in the sociocultural environment:
Increased public environmental concern ‐ every Norwegian municipality needs to develop a climate and environmental agenda by year 2010. It needs to address bio‐energy. Also, bio‐energy is a major issue on the political agenda of various parties.
Increased energy consumption – Norwegian energy consumption has grown with 40 percent the latest 30 years and shows an increasing trend.
Green energy marketing – green consumer segments show increased buying behavior.
Favorable trends in the regulatory environment:
Kyoto agreement – international CO2 regulations and taxes on oil, gas and electricity. Increased national environmental taxes on oil, gas and electricity. Enova supports bio‐energy investments with up to 30% through its heating programs. “Klimameldingen” offers reduced taxes for bio‐energy initiatives. Innovation Norway and Enova offer extensive competence, funding and advisory for start‐ups and experienced players in all stages of the supply chain of bio‐energy.
The Energy Law prescribes energy suppliers to inform municipalities about bio‐energy possibilities.
The Energy Law prescribes concessions for combustion solutions above 10MW.
Comment: The Government has a stated goal to increase current bio‐energy production with 14 TWh (14000 MW). A major restructure work from oil, gas and electricity are in action to transform Norway into an alternative energy nation. Favorable initiatives affect both supplier and end user markets.
Favorable trends the economic environment
Investor trends show willingness to invest in bio‐energy. Estimates indicate 20 percent increase in investments the coming years.
Higher prices are expected on competing energy sources as oil, gas and electricity. Governmental funding increases the buying power to Norwegian municipalities.
Comment: The recent economy crisis affects alternative energy industries in a global market place (whitepaper Frost & Sullivan 2009;2). Trends for the next couple of years show a

Brand Management in the Energy Sector 102
decreasing interest from investors to invest in alternative and renewable energy industries in Europe. This trend might also strike Norwegian investors and bio‐energy investments.
Favorable trends the environmental environment:
Oil and gas production show declining trends. Natural waterfalls for generating electricity are reaching its production limits. Bio‐energy can help to maintain a cultural landscape. Bioenergi i Norge concludes that it is sufficient natural resources to meet the increased biomass combustion market need for raw materials.
Comment: Although higher prices are expected on oil, gas and electricity, it has in fact shown the opposite trend the latest year. Current low prices on oil and electricity offers a challenge for biomass combustion providers as consumers are influenced by price on substitute energy sources.
Favorable trends the technological environment:
The Internet offers paper‐free solutions. As such, reduced paper production has created a new business for farmers. Farmers used to send their timber waste to the paper industry, but are now converting to create small bio‐energy companies.
Current heating solutions fueled by oil, gas or electricity needs upgrading to bio‐energy. Estimates show at least 17.000 oil combustions that can easily switch to biomass combustions.

Brand Management in the Energy Sector 103
Appendix 6 ‐ Competitors
An overview of the competitors dealing with biomass heating plants size 0,5 Mw to 10 Mw. Numbers are based on internal data presented by the Tratec Group according to 2007/8 observations.
Name Market share TPS 11% Weiss 10% KMW Energi 9% Enertech 7% Köb 7% Hotab 7% Justsen 6% Linka 6% Järnforsen 3% Eldab 3% Veå 3% Others such as Saxlund, KLM, Petrokraft, etc 29%

Brand Management in the Energy Sector 104
Appendix 7 ‐ Energy for heat production according to the Nordic countries
Norway Denmark Sweden Finland Noway Denmark Sweden Finland
Type of energy used for heat production Bio‐energy consumption 2007 (in Twh)
Fjernvarme Bio ElectricityGas Oil Biomass Crushed wood
StrawPeatOil

Brand Management in the Energy Sector 105
Appendix 8 – Context Factors in the Biomass Heating Plant Industry
Indicators (market with BioCom) are customized to fit the biomass heating plant industry.
Data is collected from discussions in chapter 3 and 4, and ranked according to guidelines set
by Kotler & Pfoertsch (2006).
High Brand Relevance Low
How is the structure of the suppliers in the market?
How many competitors are in the market?
How complex is the buying process?
How many deciders are involved in the buying process?
Is the application of the brand visible?
Monolitihic
Few
Very simple
Many
Clearly visible
Fragmented
Many
Very complex
Few
Not visible
BioCom
BioCom
BioCom
BioCom
BioCom


![Build Your Employer Brand Online - Fredrik Tukk [Energy Digital Summit 2015]](https://img.dokumen.tips/doc/110x75/5873f3ba1a28abb1528b5b6f/build-your-employer-brand-online-fredrik-tukk-energy-digital-summit-2015.jpg)


![CIRCOR Energy US Valve Brand Product Summary[1]](https://img.dokumen.tips/doc/110x75/55cf941a550346f57b9fa284/circor-energy-us-valve-brand-product-summary1.jpg)