Embed Size (px)
Citation preview


Contents
Contents Acronyms i
Preface vi
Introduction 1
Section I - Context 5
Economic Growth Indo-China Relationship Kargil Committee Report Inventory Obsolescence
Section II - India’s Defence Budget: Emerging
Trends and Patterns 13
Definitional Discrepancies Structure of the Defence Budget Methods, Sources and Limitations of the StudyTrends in India’s Defence Budget (2005-16)
Political Will, Macroeconomic Indicators and Defence Budgetary Growth
Political Will
Miscellaneous Indicators of Political Will Macroeconomic Indicators (2004-15)
Defence Spending as a Percentage of GDP Defence Allocation and Fiscal Deficit Defence Budget as a Percentage of the Union Government ExpenditureInflation Rates and Budget Increase Trends in Capital Budget (2005-15) Trends in Revenue Expenditure

Section III - Doctrinal Evolution, Budget Growth
and Equipment Modernisation 65
Army Modernisation and Budget Growth
BudgetDoctrinal EvolutionOrganisation, Commands and DeploymentsEquipment and Platforms
Naval Modernisation and Budget GrowthBudgetDoctrinal EvolutionPlatforms and Weapons
Destroyers, Frigates and Corvettes
Aircraft Carriers
Amphibious Vessels
Subsurface Fleet
Maritime AviationAir Force Modernisation and Budget Growth
BudgetDoctrinal EvolutionOrganisation, Commands and Deployments
Conclusion 111
Annexures 115
IPRI Publications 121

Figures
Figure 1: Percentage of Obsolete Inventory
Figure 2: Global Military Expenditures (2005-15)
Figure 3: World Military Expenditures (2015)
Figure 4: Global Defence Expenditure (2014-20)
Figure 5: India’s Defence Budget (2005-17)
Figure 6: Growth in Defence Budget over Actuals (2005-17)
Figure 7: Defence Budget Billion USD (MER)
Figure 8: Defence Budget as a Percentage of GDP
Figure 9: India’s Defence Expenditure (% of GDP)
Figure10: Covariance of GDP and Defence Growth Rates
Figure11: Defence as a Percentage of Union Gov. Expenditure
(2005-16)
Figure 12: Defence as a Percentage of Non-Plan Expenditures
(2000-16)
Figure 13: Inflation Rates and Impacts on India’s Defence Budget (2005-16)
Figure 14: CPI and Revenue Budget Growth Rate (2005-16)
Figure 15: WPI and Capital Budget Growth (2005-16)
Figure 16: India’s Capital Expenditure (2005-16)
Figure 17: India’s Major Defence Imports
Figure 18: Capital Expenditure (2005-14)
Figure 19: Indian Military’s Capital Expenditure (2005-15)
Figure 20: Services Share of Capital Expenditure
Figure 21: Major Exporters of Defence Equipment to India

Figure 22: Major Exporters of Defence Equipment to India
(2010-14)
Figure 23: Trends in Revenue Expenditure (2005-17)
Figure 24: Tri-Services Revenue Budget (2005-16)
Figure 25: Revenue Budget of Tri-Services
Figure 26: Share of P & A of the Armed Forces in Defence
Expenditure (2005-16)
Figure 27: Indian Army’s Budget (2005-16)
Figure 28: Head- to-Tail Ratio
Figure 29: Navy Budget Outlay (2005-16)
Figure 30: Capital Revenue Balance
Figure 31: Indian Naval Commands
Figure 32: Indian Air Force Capital Revenue Balance
Figure 33: Indian Air Force Budget Outlay
Figure 34: Air Campaigns and Support Operations
Figure 35: Fleet Combination of IAF
Figure 36a and b: Aircraft Fleet Composition
Tables
Table 1: Indian Defence Budget and Growth Rates (2005-16)
Table 2: Growth Rate of India’s Defence Budget and other Macroeconomic Indicators
Table 3: Conventional Deterrence and Force Modernisation
Table 4: India’s Air Fleet
i
Acronyms ACCCS Artillery Combat Command and Control System
ACDA Arms Control and Disarmament Agency
ADC&RS Air Defence Control & Reporting System
A&N Andaman and Nicobar
AEW Airborne Early Warning
AG Adjutant General
AIFV Armoured Infantry Fighting Vehicle
ALH Advanced Light Helicopter
ANC Andaman and Nicobar Command
ANURAG Advanced Numerical Research and Analysis Group
AoB Allocation of Business
AOC Army Ordnance Corps
APC Armoured Personnel Carrier
ARC Administrative Reforms Commission
ARF ASEAN Regional Forum
ARTRAC Army Training Command
ASAT Anti-Satellite Weapon
ASEAN Association of Southeast Asian Nations
ASTROIDS Army Strategic Operational Information Dissemination
System ASW Anti-Submarine Warfare
ATM Anti-Tank Missile
BEL Bharat Electronics Ltd.
BRO Border Roads Organisation
BSS Battlefield Surveillance System CAG Comptroller and Auditor General
CDS Chief of Defence Staff
CGE Central Government Expenditure

ii
CE Capital Expenditure
CIDSS Command Information Decision Support System
CII Confederation of Indian Industry
CNS Chief of Naval Staff
COFOG United Nations Classification of the Functions of
Government
CPI Consumer Price Index
CSD Cold Start Doctrine
DAC Defence Acquisition Council
DAD Defence Accounts Department
DDG Demands for Grants
DDP Department of Defence Production
DGMO Director General Military Operations
DGQA Directorate General of Quality Assurance
DPP Defence Procurement Procedure
DPSUs Defence Public Sector Undertakings
DRDO Defence Research and Development Organisation
DSE Defence Services Estimates
ECHS Ex-Servicemen Contributory Health Scheme
EEZ Exclusive Economic Zone
ELINT Electronic Intelligence System EU European Union
EWS Electronic Warfare System
FGFA Fifth Generation Fighter Aircraft
F-INSAS Future Infantry Soldier As a System FMCT Fissile Material Cut-off Treaty
FRBM Fiscal Responsibility and Budget Management
FRBMA Fiscal Responsibility and Budget Management Act
FYDP Five Year Defence Plan
FYP Five Year Plan

iii
GDP Gross Domestic Product
GNP Gross National Product
GoI Government of India
GWoT Global War on Terror
HAL Hindustan Aeronautics Ltd.
HDI Human Development Index
HQs Headquarters
IAF Indian Air Force
ICG Indian Coast Guard
IDS Integrated Defence Staff
IDSA Institute for Defence Studies and Analyses
IED Improvised Explosive Devices
IISS International Institute of Strategic Studies
IIT Indian Institute of Technology
IMF International Monetary Fund
ISRO Indian Space Research Organisation
IT Information Technology
J&K Jammu and Kashmir
JAKLI Jammu and Kashmir Light Infantry
KRC Kargil Review Committee
LACM Land-Attack Cruise Missiles LAOs Local Audit Officers
LCA Light Combat Aircraft
LCH Light Combat Helicopter
LCM Landing Craft Mechanised LoAC Line of Actual Control
LoC Line of Control
LPD Landing Platform Dock
LTIPP Long Term Integrated Perspective Plan
MBT Main Battle Tank

iv
MDL Masagon Dock Ltd.
MEA Ministry of External Affairs
MER Market Exchange Rates
MES Military Engineer Service
MHA Ministry of Home Affairs
MIC Military Industry Complex
MMRCA Medium Multi-Role Combat Aircraft
MoD Ministry of Defence
MoF Ministry of Finance
MoS Minister of State
MTCR Missile Technology Control Regime
NATO North Atlantic Treaty Organisation
NBC Nuclear, Biological and Chemical
NCC National Cadet Corps
NCO Network Centric Operations
NDA National Democratic Alliance
NSA National Security Advisor
NSAB National Security Advisory Board
NSG Nuclear Suppliers Group
OFs Ordnance Factories
P&A Pay and Allowances
PAC Public Accounts Committee
PCDA Principal Controller of Defence Accounts
PDS Proactive Defence Strategy PLA People’s Liberation Army (of China)
PM Prime Minister
PPP Purchasing Power Parity
PDS Proactive Defence Strategy PSUs Public Sector Undertakings
RAPIDs Reorganised Plains Infantry Divisions

v
R&D Research & Development
RE Revised Estimate
RE Revenue Expenditure
RFI Request for Information
RFP Request for Proposal
RM Raksha Mantri (Defence Minister)
RoA Radius of Action
RMA Revolution in Military Affairs
RR Rashtriya Rifles
SAARC South Asian Association for Regional Cooperation
SEZ Special Economic Zone
SIPRI Stockholm International Peace Research Institute
SRI Self-Reliance Index
ToT Transfer of Technology
TPCR Technology Perspective Capability Roadmap
UAV Unmanned Aerial Vehicle
WASO Winter Air Surveillance Operations
WPI Wholesale Price Index

Preface
vi
Preface
he rate of increase in India’s defence budget is threatening
Pakistan’s security. Conventional asymmetry between India
and Pakistan provided the latter with the rationale for
development of its nuclear weapons programme for defence
purposes. This is the basic assumption and an implied consequence
of emerging trends in India’s defence spending as discussed in this
monograph. Given the fundamentality of this issue to Pakistan’s
threat perception and defence preparations, it is ironic that an in-
depth discussion on this subject has not been done in published
sources. Pakistan’s perspective in the academic domain is wanting
which prompted IPRI to undertake this study.
The monograph argues that, regardless of the lacunas in Indian
defence establishment, slippages, bureaucratic hurdles and decision-
making problems, the gap between Indian and Pakistani defence
budgets is consequential. India is the biggest country in South Asia
and its defence budget is far more than that of its neighbours. Even
though China has been cited to be a primary security threat by
Indians on many occasions, approximately 70 per cent of its Armed
Forces are deployed against Pakistan. This makes Pakistan by
default the primary country against which Indian defence spending
takes place.
The monograph has three sections. Section I provides the
rationale and contextualises India’s defence spending by looking at
the country’s economic growth over the years, Indo-China
relationship, the Kargil Committee Report and inventory
obsolescence. Section II discusses the emerging trends and patterns,
including structure of the Indian defence budget. This section has
many charts, graphs, and statistics. India does not share enough
information on its defence spending publically to make accurate
T

Preface
vii
assessments, yet the data used here helps to outline major trends in
its defence spending. A country’s budget in itself cannot be
threatening unless it’s operationalised through defence preparations.
The third major section of the study discusses how the defence
equipment and doctrines have increased and evolved to solidify the
effects of India’s unchecked and burgeoning defence spending. In
the last two decades, the country’s defence outlook has completely
revamped. All three services (Army, Navy and the Air Force) have
launched new war doctrines, and this has also changed their defence
equipment acquisition and deployment patterns.
The author reviews various budget heads to analyse how each
one impacts the defence establishment differently. For example, the
comparison between trends in capital budget and acquisition and
investments has helped to highlight the prospective shape Indian
defence forces may take in the foreseeable future.
I hope this study will be a new addition to the scarce literature
on the subject and help scholars and researchers by providing
diverse data from myriad sources in addition to the unique and
objective analysis conducted.�
Brig. (R) Sohail Tirmizi, SI(M)
Acting President, IPRI


India’s Defence Budget and Armed Forces Modernisation: An Analysis
1
Introduction
ith the 2000 economic boom, India’s defence budget increased manifold. Interestingly, while this budget has continued to
decrease as a percentage of the Gross Domestic Product (GDP), it
has remained a somewhat constant percentage of its total Union Government
expenditure. There is no indication of fiscal pressures created as a result of its
military expenditure. Nevertheless, being a developing country, the
opportunity cost of India’s defence budget is very high. Theoretically, military allocations are aimed at meeting security
challenges and maintaining forces and capabilities to cater to envisaged
threats. However, they are also aimed at establishing a strong military force
to influence regional and extra regional countries and pursue national
interests abroad. After China, which is not strictly a South Asian state, India
is the biggest nation in its neighbourhood in terms of economic growth and
military capabilities. It is the seventh largest defence spender in the world,
with the geographic advantage of having physical boundaries with all South
Asian countries, while none of them share boundaries with each other.1 It has
border disputes with almost all its neighbours.
Both Pakistan and China are identified as the primary source of
concern by India’s defence establishment. It has fought four wars with Pakistan since the Partition in 1947 and one border war with China. Today,
India’s defence budget is three times bigger than that of Pakistan. The doctrinal and equipment modernisation of its forces are identified by Pakistan
as a source of regional strategic instability, and the latter’s nuclear capability aims to deter both nuclear and conventional threats from India. The rapidly
growing military capability of India is likely to weaken the conventional
deterrent of Pakistan, leading the latter to lower its nuclear threshold.2
Arguably, India maintains conventional superiority over Pakistan in
military terms and also vis-à-vis its immediate neighbourhood and its huge
defence budget is aimed at offsetting China’s military advantage. China is developing military infrastructure in the border regions with
India and is also becoming increasingly assertive in the Indian Ocean Region
(IOR). However, ‘two-thirds of India’s military strength is deployed against
1 Only Afghanistan, a recent entrant of the South Asian Association for Regional
Cooperation (SAARC), does not share a boundary with India. 2 Zulfqar Khan and Ahmad Khan, “The Strategic Impasse over India’s Doctrinal
Restructuring,” The Washington Quarterly 39, no.1 (2016): 139-157.
W

Sobia Saeed Paracha
2
Pakistan, even though it hardly possesses any conventional military threat to
India.’3 The analysis conducted in this study supports the argument that India
has not shifted its major budgetary allocations and its military posture
towards catering its threat perception from China.
Section I primarily discusses emerging trends in India’s military
budget, its various facets and comparison with global military spenders. The
remarkable growth in India’s defence budget can be attributed to economic growth, obsolete military inventory, demand for structural reforms in
procurement and policy as well as glorified aims of regional power projection
and becoming an important global actor. Resource allocation, as an important
metric of India’s political will for militarization, has been analysed in this
section. The analysis of military budgets and emerging trends is difficult due
to many structural and methodological reasons. First, there is the problem of
having a universal definition of what constitutes military expenditure. Lack
of transparency is a close second. Both transparency and absence of
methodology make the data on military expenditures less reliable. However,
different reputable data collectors on military budgets have devised ways to
compensate or downplay the problems associated with lack of transparency.
This section also provides the context and methodology for this study. It
highlights the difference between definitions of defence budget employed by
the Stockholm International Peace Research Institute (SIPRI), United Nations
(UN), North Atlantic Treaty Organisation (NATO) and that of the Indian
government. Most of the data in this study has been taken from official Indian
government sources like the Ministry of Defence (MoD), Ministry of Finance
(MoF), and Union budget documents etc. Standardisation of data was not
required since this study is not about comparative analysis between different
states.
In Section II, the structure of the budget and definitions of various
budget heads as they have been used in the government sources has been
discussed. India’s defence budget is mainly divided into two categories:
Capital Budget (for force modernisation and longtime investments), and
Revenue Expenditure (mainly for day-to-day expenses and for operational
readiness). The trajectories and emerging trends in these two heads have also
been analysed.
3 Balaji Chandramohan, “India’s Defence Budget, Strategic Orientation and Military
Modernisation” (paper, Future Directions International, Nedlands, 2014),
http://futuredirections.org.au/wp-content/uploads/2014/08/Indias_Defence_Budget_
Strategic_Orientation_and_Military_Modernisation_.pdf.

India’s Defence Budget and Armed Forces Modernisation: An Analysis
3
Section III discusses the modernisation programmes of the tri-services.
A doctrinal shift came in the Indian Army, Navy and Air Force during the
1990s. This shift was influenced by the nuclearisation of South Asia and
transformations in military affairs happening elsewhere. The phasing out of
obsolete technologies/equipment and modernising arsenal is helping
operationalise this doctrinal shift. India of today is much more assertive than
India of the 1990s, and this change is being backed by increasing military
capability. This section discusses evolution of new doctrines and explores
how modernisation programmes co-relate with India’s evolving military
doctrines.


India’s Defence Budget and Armed Forces Modernisation: An Analysis
5
SSection I: Context xternal security threats, inventory obsolescence, improving
economy and doctrinal evolution are the main drivers behind
India’s increasing defence expenditures. The Kargil conflict in 1999 also became a catalyst for the modernisation drive. In this regard, the
Kargil Review Committee was constituted by the Indian government in
1999 that highlighted weaknesses in the defence sector and provided
recommendations for improvement in all aspects of India’s defence policy and practice.
1
Economic Growth
The implications of defence expenditure are bi-directional. The
overwhelming literature on economic costs of defence expenditures does
not provide uniform results.2 It is argued that given the low Gross
Domestic Product (GDP) percentage allocated for defence, India’s economy is not unduly impacted by its defence spending. However, high
poverty levels and other negative socioeconomic indicators highlight that
the opportunity cost of defence can be very high for India. Since
independence, India’s economy has remained development oriented. Until
1962, India spent approximately 1.8 per cent of its GDP on defence,
which was drastically increased to 3.5 per cent in 1964. According to
SIPRI’s military expenditure database, since 1988, India’s defence budget
has remained under 3 per cent of its GDP.3 However, due to rapid growth
of its economy, the defence budget has risen sharply in nominal terms as
compared to the 1980s.
As pointed out in the beginning, one of the key drivers of an
increasing defence budget is India’s economic development. Traditionally, India has never overburdened its economy with military expenses. It is
argued that India even reduced its military expenditure to relieve pressures
1 Nuclear Weapons Archive, Kargil Review Committee Report, accessed August 2016,
http://nuclearweaponarchive.org/India/KargilRCB.html. 2 Benjamin E. Goldsmith, “Bearing the Defence Burden, 1886-1989: Why Spend More?”
Journal of Conflict Resolution 47, no. 5 (2003): 551-573,
doi: 10.1177/002200270 3254297. 3 SIPRI, Military Expenditure by Country as Percentage of Gross Domestic Product,
1988-2002 (Solna: Stockholm International Peace Research Institute, 2017),
https://www.sipri.org/sites/default/files/Milex-share-of-GDP.pdf.
E

Sobia Saeed Paracha
6
on its economy in the face of looming security threats.4 Since 1987, its
defence budget decreased continuously as a percentage of GDP from 3.5
per cent to around 2 per cent even though the security make-up of South
Asia changed completely for India with the threat of a de facto nuclear
Pakistan.5 The widening fiscal deficit in the 1990s constrained its military
budget and modernisation programmes despite the uncertain strategic
scenario and collapse of the Soviet Union. This is a recurring pattern of
defence spending even today, where some sections of the defence budget
are susceptible to cuts depending on India’s fiscal deficit situation. The section on political will discusses this in detail.
An improving economy with a GDP growth rate averaging 7-8 per
cent per annum enabled India to be taken more seriously as a major player
in the international arena. This helped India to practically diversify its
strategic goals in line with its historical aspirations of emerging as a major
global player. Naval expansion and modernisation is the most prominent
manifestation of this. India is investing heavily in long-range power
projection systems instead of land-based conventional systems.
Irrespective of its Cold Start Doctrine (CSD), most of the new acquisitions
are aimed mainly at achieving a decisive advantage over Pakistan and as a
credible deterrent against China.
Pakistan and internal insurgents groups are the immediate concerns
of India’s defence establishment. China is considered more of a strategic competitor in the long term, even though a humiliating defeat at the hands
of China in 1962 is treated as a trauma in the strategic memory of India.
The latter mobilised around 200,000 troops in the strategic valley of
Tawang in 1986 after the Sumdorong Chu incident. This, however, did not
replace Pakistan as the main concern of the India’s military establishment since the Indian Army’s only major goal is to plan and engage in war against Pakistan. Approximately 80 per cent of the Indian Army is
deployed on its western borders with Pakistan. Post-1971, India has had a
policy of maintaining a sizeable conventional edge over Pakistan mostly
in quantitative terms, which has created a security dilemma for the latter.
Pakistan’s response has rested on acquiring comparatively advanced technologies from the West, reliance on the doctrine of Offensive Defence
4 Ajai K. Rai, “Defence Budget 2000–01: Some Observations,” Strategic Analysis 24 no.
3 (2000): 841-845, doi:10.1080/09700160008455253. 5 IDSA, Asian Strategic Review: 1994-95 (New Delhi: Institute for Defence Studies and
Analyses, 1995), 59.

India’s Defence Budget and Armed Forces Modernisation: An Analysis
7
and taking advantage of its lean geographic shape for prompt
mobilisation. Pakistan’s qualitative advantage in 1990s was termed as ‘too
successful’ by prominent Indian security studies scholar Sumit Ganguly, as it contributed to India’s threat perceptions, regardless of its quantitative superiority over Pakistan.
6
Interestingly, India has the highest defence budget in South Asia.
Both the size of its Armed Forces and defence budget are three times the
size of Pakistan, and it overshadows the latter in terms of nuclear and
space technology. Pakistan blames India for disturbing the conventional
security balance in South Asia given the qualitative and quantitative
improvements in its military capability; and pushing Pakistan towards its
nuclear doctrine of full spectrum deterrence. Nevertheless, Indian
reactions after the 2008 Mumbai attacks demonstrated that India’s conventional superiority did not provide it with any credible options
against Pakistan except for resorting to rhetoric and blame shifting.7 This
study demonstrates that the capability matrix of India’s tri-services has
changed since 2008 which is likely to impact any future Indo-Pak conflict.
Indo-China Relationship
India’s relationship with China is characterised by both cooperation and
competition. China has gradually become India’s biggest trade partner with an annual trade of approximately INR 3566 billion (USD 54
billion).8 This figure was just USD 1.8 billion in 1997 and 7 billion in
2004 and 35 billion in 2008.9 However, the security concerns of India vis-
à-vis China have not waned despite rising economic interdependence of
the two countries. Nevertheless, the security concerns of India about
China are of relatively different nature than those vis-à-vis Pakistan. India
and China are competing to gain regional influence. India views China’s 6 Sumit Ganguly, Rahul Mukherji and Rajesh Rajagopalan, “India and South Asian
Security,” Defense and Peace Economics 10, no.4 (1999): 335-345,
doi:10.1080/10430719908404931. 7 Shashank Joshi, “India’s Military Instrument: A Doctrine Stillborn,” Journal of
Strategic Studies 36, no. 4 (2013): 31-41, doi:10.1080/01402390.2013.766598. 8 Ministry of Commerce and Industry, GoI, “Trade Statistics” (Government of India, n.d.);
Ministry of Commerce and Industry, GoI, “Trade Statistics for Imports” (Government of India, n.d.); Ministry of Commerce and Industry, GoI, “Trade Statistics for Exports” (Government of India, n.d.).
9 “China Emerges as India’s Top Trading Partner: Study,” Times of India, March 2, 2014,
http://timesofindia.indiatimes.com/business/india-business/China-emerges-as-Indias-
top-trading-partner-Study/articleshow/31268526.cms.

Sobia Saeed Paracha
8
strategic partnership with Pakistan as a means to encircle India. In terms
of military transfers, China is Pakistan’s biggest partner. This is viewed as an effort to erode India’s conventional superiority over Pakistan. Both China and India are locked in a vehement competition to gain influence
over SAARC countries for economic and strategic purposes.10
Expansion
plans of the Indian Navy and development of a new Naval command at
Port Blair are thought to be a response to China’s growing relations with the littoral Asia-Pacific and South Asian countries like Bangladesh,
Myanmar and Sri Lanka. People’s Liberation Army (PLA) modernisation
and assertiveness coupled with infrastructural development of the
bordering regions and minor border skirmishes have led India to raise a
new mountain strike corps. Completion of the new corps is dependent on
sufficient funding in the coming years.
A generally held view of the India observers concedes to the
analysis provided above. However, lately India has also been very vocal
of the immediate security threats it faces from China. The context for this
heightened threat perception is not clear in the literature consulted,
however, it is clear that it is based on worst-case scenario assumptions.11
This can have serious consequences of destabilising the strategic balance
in South Asia. Preparation for a two-front war automatically alters the
force balance between India and Pakistan, leaving the latter feeling
insecure with its existing conventional capability, increasing its reliance
on nuclear weapons for defence and driving the two states towards a
conventional arms race.
Kargil Committee Report
The Kargil Committee was constituted to assimilate the weaknesses of the
defence establishment that led to the Kargil Crisis and recommend policy
options to improve India’s operational preparedness. The Committee held over a hundred meetings with senior members of the government,
bureaucracy, and media persons and presented its report in February 2000.
10 Jonathan Holslag, “The Persistent Military Security Dilemma between China and India,”
Journal of Strategic Studies 32, no. 6 (2009): 811-840,
doi: 10.1080/014023 90903189592. 11 Ali Ahmed, “Ongoing Revision of Indian Army Doctrine” (comment, Institute for
Defence Studies and Analysis, New Delhi, January 6, 2010),
http://www.idsa.in/idsacomments/OngoingRevisionofIndianArmyDoctrine_aahmed_06
0110.

India’s Defence Budget and Armed Forces Modernisation: An Analysis
9
The main findings of the Committee pointed out that the infiltrations from
the Pakistani side came as a total surprise to the Army. The current and
previous Armed Forces leadership unanimously thought that logistically
any Pakistani operation in the Kargil heights was unsustainable, thus, it
would be foolish to conduct a mass scale operation in this area. The Indian
threat perception was limited to having heavy artillery exchange from
across the Line of Control (LoC) and limited infiltration of mujahideen (those engaged in jihad or holy war). In terms of modernisation, the
Committee’s emphasis was mainly on modernising the infantry and intelligence networks. The Indian military conducted Winter Air
Surveillance Operations (WASO) regularly, but they were not aimed at
detecting massive infiltration of military regulars, thus, it conducted
surveillance only in the valleys and not on the ridges. It was recommended
that India should develop modern surveillance capabilities especially
through space imagery. Induction of Unmanned Aerial Vehicles (UAVs)
in sectors other than plains was also recommended as imperative. It was
suggested that a more stable platform other than the Cheetah helicopters
should be used for WASO. Any helicopter-based surveillance system
should be equipped with thermal sensors. In a nutshell, the electronic
intelligence sector was found to be weak and needed to be developed.
According to Committee findings, intelligence gathering efforts also
needed to be streamlined. It was highlighted that at the organisational
level various intelligence gathering divisions should be integrated under
an integrated defence intelligence agency.
The Committee found that infantry soldiers were under a lot of
pressure due to lack of suitable equipment, weapons and even clothing.
Due to slow modernisation, battlefield efficiency and firepower was
suffering. For example, they noted that even though the new light rifles
(5.56 mm INSAS) had been authorised, most troops were still waiting to
be equipped with them. Also, the paramilitary forces in Kashmir were
very heavily reliant on the Army for counterinsurgency operations, which
the Committee concluded, was affecting the operational preparedness of
the Army. Thus, it recommended development of a long-term
counterinsurgency policy to relieve the Army of its counterinsurgency
role. Successive Indian Chiefs of Army Staff (COAS) and Director
Generals of Military Operations (DGMO) were of the opinion that due to
commitments in Sri Lanka, subsequent deployments in Punjab, the North

Sobia Saeed Paracha
10
East and Kashmir, and reduction in defence expenditures, India’s assumed conventional superiority over Pakistan was eroding.
The Committee also suggested technologically modernising the
Army and cutting down its numerical strength. It was felt that insurgents
in Kashmir had out-gunned the security forces. The helicopters used for
surveillance did not have sophisticated monitoring sensors. It was only
after Kargil that direction-finding equipment was procured. The general
sense of the report was that the Pakistan Army was technologically much
better equipped, while Indian procurements were bogged down sometimes
due to conflicting policies of indigenisation of technology. The
Committee recommended that the choice between ‘make or buy’ should not come at the price of combat readiness of Indian forces. It was also
observed that the security management framework was developed by Lord
Mountbatten and Lord Ismay and does not complement the actual security
needs of India vis-à-vis the regional environment. However, in the last
five decades political leadership and civil military leadership had become
stakeholders in the status quo rather than developing a better system
according to national needs.
Inventory Obsolescence
India has increased its capital budget threefold since 2005. This has
helped India become the leading importer of military equipment in the
world for the last several years. Inter-alia, obsolete defence equipment and
absence of indigenous development and manufacturing capability are two
key drivers of India’s extensive military shopping spree. A report published by the KPMG in 2014 highlighted the inadequacy of defence
manufacturing capability in India which has the indigenous capability to
produce only 30 per cent of its military hardware, while the rest is
procured through imports. The private sector’s participation is nominal and most of the military equipment/ weapons are manufactured by
ordnance factories or other Defence Public Sector Undertakings
(DPSUs).12
The ratio of obsolete weaponry of India was very high in the
late 1990s and early 2000s. The KPMG report highlighted that only 15 per
12 KPMG, Union Budget 2014: Defence Post Budget Sectoral Point of View, report
(Mumbai: Klynveld Peat Marwick Goerdeler, 2014),
https://www.kpmg.com/IN/en/services/Tax/unionbudget2014/Documents/KPMG-
Defence-PoV-2014.pdf.

India’s Defence Budget and Armed Forces Modernisation: An Analysis
11
cent of the military equipment of the Indian forces could be termed as
‘state of the art’ (Figure 1):
Figure-1 Percentage of Obsolete Inventory
Source: KPMG, Opportunities in the Indian Defence Sector: An Overview, report (Mumbai:
Klynveld Peat Marwick Goerdeler, 2010),
https://www.kpmg.com/ca/en/industry/industrialmarkets/documents/opportunities%20in%2
0the%20indian%20defence%20sector.pdf. Also quoted in Harsh V. Pant, ed., Handbook of Indian Defence Policy: Themes, Structures and Doctrines (New York: Routledge, 2016), 4-
14.
India is criticised for not investing in technologies that are of
immediate need to its forces.13
This may have also contributed to
obsolescence of its arsenal and low operational preparedness. India’s current defence acquisition is considered more political oriented than
strategic, and does not strictly correlate with its Armed Forces’ doctrines or strategic goals.
14 For example, in the case of acquisition of aircrafts,
India has increased its dependence on foreign suppliers’ provision of spare parts and enhanced pressure on its military preparedness. In the 1990s,
13 Stephen P. Cohen and Sunil Dasgupta, Arming without Aiming: India’s Military
Miltarization (Washington, D.C.: Brookings Press, 2010), 53-96,
https://www.brookings.edu/wp-
content/uploads/2012/04/0907_arming_without_aiming_powerpoint.pdf. 14 Harsh V. Pant, “Indian Defence Policy at a Crossroads,” Asia-Pacific Review 17, no.1
(2010): 124-144, doi: 10.1080/13439006.2010.482759; Joshi, “India’s Military Instrument: A Doctrine Stillborn.”

Sobia Saeed Paracha
12
flying hours of the IAF plunged and it resorted to cannibalisation to keep
its squadrons of MiGs operational.
In the mid-2000s, the Indian Army assessed that its ‘combat ratio’ vis-à-vis Pakistan had fallen to 1.22:1. The combat ratio is a capability
metric used by India to define its military edge over Pakistan. India
maintained a combat ratio of 1.75:1 in the mid-1970s. In order to increase
its combat advantage over Pakistan, the Indian Army desires to acquire a
wide range of equipment from modern artillery to electronic warfare
equipment. To this end, the Army also lobbied with the MoD to get extra
funds.15
15 International Institute for Strategic Studies, The Military Balance, 106, no. 1 (2006):
226.


India’s Defence Budget and Armed Forces Modernisation: An Analysis
13
SSection II India’s Defence Budget: Emerging
Trends and Patterns
Everything that can be counted does not necessarily count. Everything that
counts cannot necessarily be counted.
-Albert Einstein
Definitional Discrepancies
here are a number of international organisations that are involved
in collecting and analysing international defence expenditure data.
The UN receives information through the UN standardised
instrument for reporting military expenditures framework, which it
annually reports to the General Assembly.16
Also, the London-based
International Institute for Strategic Studies (IISS) publishes an annual
report titled The Military Balance which discusses international defence
expenditures along with force levels, weapons, equipment and technology
procurements and regional security analysis. SIPRI also publishes a
yearbook analysing global military capabilities and defence economics. In
addition to this, SIPRI also collects information on arms transfers. The
Congressional Research Service (CRS) of United States publishes an
annual report on international arms transfers. And lastly, the United
Nations Register of Conventional Arms is also an important source to
explore the declared arms deals and transfers by different states.
Most of these organisations employ the same methodology and
definitions as NATO, revised in 2004, and also loosely use the United
Nations Classification of the Functions of Government (COFOG) for
guidance.17
The NATO definition of military expenditure is:
16 UNODA, United Nations Report on Military Expenditures, report (New York: United
Nations Office for Disarmament Affairs, n.d.), accessed March 2016,
http://www.un-arm.org/MilEx/Background.aspx. 17 United Nations Statistics Division, “Detailed Structure and Explanatory Notes: COFOG
Code 02.1.0,” accessed March 2016,
http://unstats.un.org/unsd/cr/registry/regcs.asp?Cl=4&Lg=1&Co=02.1.0.
T

Sobia Saeed Paracha
14
The cash outlays of central or federal government to meet the
costs of national armed forces. The term armed forces include
strategic land, air, naval, command, administration and
support forces. It also includes other forces if they are trained,
structured and equipped to support armed forces and are
realistically deployable.18
The NATO definition includes government spending on:
….armed forces, including peacekeeping forces; defence
ministries and other government agencies engaged in defence
projects; paramilitary forces, when judged to be trained and
equipped for military operations; and military space
activities.19
It comprises of all current (revenue) and capital expenditure on civil
and military personnel, with retirement pensions of military personnel and
social services for personnel, operations and maintenance equipment,
technology procurement and military research and development.
However, it does not include the military aid in the defence expenditure of
the country that spends it. This point however, is irrelevant for India as the
Indian Union government is the only source of Indian defence
expenditures. The NATO definition does not include civil defence and
current expenditure for activities of previous military utility, such as for
veterans’ benefits, demobilisation, conversion and weapons dismantlement. Among others, NATO’s definition of military expenditure is used by SIPRI, IISS, the International Monetary Fund (IMF), World
Bank and relevant UN bodies/organisations.
The COFOG classifies expenses related to administration of
military defence affairs and services as defence expenditure. It includes
expenses incurred on the operations of land, sea, air and space forces and
capabilities, other auxiliary services like engineering, transportation,
intelligence, communication, maintenance and non-combatant support
personnel of the defence establishment.
Despite efforts made by the UN and NATO to develop a
standardised format and definition of defence budgets, different countries
use different definitions, criteria and budget heads for defence
18 IISS, The Military Balance 110, no. 1(2010): 12. 19 World Bank, “Data on Military Expenditure (% of GDP),” accessed August 2016,
http://data.worldbank.org/indicator/MS.MIL.XPND.GD.SS.

India’s Defence Budget and Armed Forces Modernisation: An Analysis
15
expenditures. There is a discrepancy in the defence budget data provided
by SIPRI, Military Balance by IISS and India’s official defence budget
which can be attributed to the different definition of defence expenditure
used by the Indian government. The official Indian budget statements
provided to the IMF do not include expenditure on paramilitary forces,
whose total strength is approximately a million. Both India and Pakistan
do not include military pensions or social service for the MoD personnel
in their official figures. This gives an understated view of the total defence
spending of each country.20
There are numerous problems with defence data including lack of
availability of information, problems of divergent definitions and
credibility of available information in open sources. Internationally, there
is also increasing evidence that significant amounts of defence
expenditure are not covered in the audits and accounts of developing
countries. This may be simply a result of the different national legal
requirements or attempts to hide the actual figures using mechanisms such
as double book-keeping, extra budgetary accounts, highly aggregated
budget categories, military assistance, and foreign exchange
manipulation.21
A study was conducted by Thomas Scheets in 1991 to
demonstrate the extent to which official figures may differ from the actual
expenditures. Additionally, the data provided by different data sources,
SIPRI, Arms Control and Disarmament Agency (ACDA), IISS, IMF and
World Bank, sometimes provide significantly different numbers. The
problem with these databases is not of reliability entirely, but differences
in methodology of data collection which is not publically available for
analysis in order to see what factors led to variation in the figures. One
extreme case was that of Argentina’s defence budget in 1982, where the
20 Shuja Nawaz and Mohan Guruswamy, “India and Pakistan: The Opportunity Cost of
Conflict” (Washington, D.C.: Atlantic Council, 2014),
http://www.atlanticcouncil.org/images/publications/India_and_Pakistan_Opportunity_C
ost_of_Conflict_web.pdf. 21 Nicole Ball, Third World Security Expenditure: A Statistical Compendium, report
(Stockholm: Swedish National Defence Research Institute, 1984). Also, J. Paul Dunne,
Sam Perlo-Freeman and Aylin Soydan, “Military Expenditure and Debt in South America,” Defence and Peace Economics 15, no. 2 (2004): 173-187, doi:
10.1080/1024269032000110540.

Sobia Saeed Paracha
16
IISS military expenditure figure and that published by the IMF differed by
1034%.22
Notwithstanding this stated inconsistency, this study has used the
official defence spending figures provided by the Indian government for
two reasons: 1) there is not a lot of data available other than the
governmental documents that provide a clearer and more extensive
breakdown of India’s defence budget; 2) the purpose of this study is to analyse the implications of an increasing defence budget for military
modernisation of India. Military modernisation budget is effectively
covered under the capital budget head. Also, regardless of the rudimentary
industrial, and Research and Development infrastructure in the defence
sector, the budgetary outlays also include the expenditures for DRDO and
ordnance factories. These two organisations if working efficiently in line
with their envisaged goals could also have implications for military
modernisation. One additional advantage of using official government
figures is that it provides a more nuanced understanding of the increasing
defence allocations by India.
Nuclear, missile and space capabilities are not accounted for in the
defence budget and are covered under separate heads. However, to
practically limit the scope of the study to conventional capabilities, it was
pertinent to analyse the official defence budget separately.
Structure of the Defence Budget
India’s defence budget is presented annually to the Lok Sabha (House of
the People)23
in March-April. Each financial year, eight demands for
grants are presented to the Lok Sabha related to defence and paramilitary
forces for voting:
Six of these cover the budgetary requirements for the Defence
Services also known as Defence Budget.
1. Demand No. 22, Defence Services – Army (including
NCC24
, Sainik Schools & DGQA25
, Rastriya Rifles, Military
Farms and ECHS).
22 J. Paul Dunne, “The Economic Effects of Military Expenditure in Developing
Countries” (paper, Economics Group, Middlesex University Business School, London, 2000), http://carecon.org.uk/Chula/MILLDCSnew.pdf.
23 Editor’s Note: Lower house of India’s bicameral Parliament. 24 National Cadet Corps. 25 Department of Defence Production.

India’s Defence Budget and Armed Forces Modernisation: An Analysis
17
2. Demand No. 23, Defence Services – Navy (including Joint
Staff)
3. Demand No. 24, Defence Services – Air Force
4. Demand No. 25, Defence Ordnance Factories
5. Demand No. 26, Defence Services – Research &
Development
6. Demand No. 27, Capital Outlay on Defence Services,
includes all services and departments other than those
covered by the Demands for Grants of MoD (Civil).26
The official Defence budget does not include Jammu & Kashmir
Light Infantry, Defence Accounts Department, civil expenditure of the
Ministry of Defence Secretariat, Coast Guard Organisation, Canteen
Stores Department, and Defence Estates Organisation, paramilitary forces,
and defence pensions. There are two separate Civil Demands for Grants of
the Ministry of Defence that provides funding for these - No. 20, Ministry
of Defence (Civil) and Demand; and No. 21, Defence Pensions. In
addition to this, the Ministry of Road Transport & Highways provides for
the expenses of the Border Roads Organisation.
Demand Grants No 22-26 cover the overall operating costs of the
three services and other departments. An allocation made through this
criterion is mentioned under the budgetary head of ‘Revenue Expenditures’ in all official budgetary documents and audit reports:
The Revenue expenditure includes expenditure on Pay &
Allowances, Transportation, Revenue Stores (like Ordnance
stores, supplies by Ordnance Factories, Rations, Petrol, Oil
and Lubricants, Spares, etc.), Revenue Works (which include
maintenance of Buildings, water and electricity charges, rents,
rates and taxes, etc.) and other miscellaneous expenditure.27
Funding related to military modernisation and building or
acquisition of durable assets and technologies for all services and
departments covered by the Demand for Grants 22-26 is provided in the
Demands for Grants 27. An allocation made through this criterion is
26 National Academy of Audit and Accounts, GoI, “Financial Aspects and Budgetary
Management,” presentation (Government of India, 2015), naaa.gov.in/wp-content/uploads/2015/10/IAA-presentation.ppt. 27 Ministry of Defence, GoI, Standing Committee on Defence, 15th Lok Sabha, Demands
for Grants (2010-2011), ninth report (Government of India, 2010).

Sobia Saeed Paracha
18
mentioned under the budgetary head of ‘Capital Expenditure’ in all official budgetary documents and audit reports. The capital expenditures
on civil Demands for Grants 20-21 of the MoD are not covered under this
budgetary head:
The Capital expenditure includes expenditure on the
acquisition of Land, Construction Works, Plant and
Machinery, Equipment, Tanks, Naval Vessels, Aircraft and
Aero-engines, Dockyards, etc.28
The Defence Accounts Department revised the Classification Hand
Book (CHB) in 2010, based on the structure of Budget and Accounts
accepted by the Comptroller and Auditor General of India. It is the basic
document for accounting of transactions on behalf of Defence Services.
There are five major heads for revenue receipts, Army, Navy, Air Force,
Ordnance Factories and DRDO. There is no subhead for capital outlays on
the receipts side. On the expenditure side the capital outlays are included
in addition to the aforementioned five major heads.29
For the three services, a major portion of the revenue budget
provides funds for personnel salaries. The rest of the budget provides
Transportation, Stores, Works and Other Expenditure. ‘Transportation’ includes costs incurred for transfer and transport of personnel as well as
major platforms like submarines, tanks, aircrafts etc. ‘Stores’ caters for the
procurement of small inventory items, spares, electrical equipment, fuel
and other lubricants, dockyard equipment, training equipment, armament
and weapons equipment, clothing and accommodation etc. ‘Works’ include maintenance of buildings and infrastructure, amenities, personnel
abroad, foreign trainers etc. Finally, ‘Other Equipment’ includes respective services headquarters, training of civilians, maintenance of
airfields, naval bases, dockyards, stationery etc.30
Furthermore, the
28 Ibid. 29 Ministry of Finance, GoI, “Statement I-Consolidated Fund of India, Revenue Account,
Receipts” (Government of India, 2017), http://indiabudget.nic.in/ub2017-
18/afs/afs1.pdf; Ministry of Finance, GoI, “Union Budget 2017-2018” (Government of India, n.d.), http://indiabudget.nic.in/; Ministry of Finance, GoI, “Statement I-Consolidated Fund of India, Capital Account, Disbursements” (Government of India, 2017), http://indiabudget.nic.in/ub2017-18/afs/afs4.pdf.
30 Controller General of Defence Accounts, Ministry of Defence, GoI, Classification Handbook of Defence Service (Government of India, 2010),
http://cgda.nic.in/accounts/code_heads/CHB-Latest.pdf; Controller General of Defence

India’s Defence Budget and Armed Forces Modernisation: An Analysis
19
revenue budget also includes the expenditure on the Ex-servicemen
Contributory Health Scheme (ECHS), Rashtriya Rifles (National Rifles)31
and military farms.32
The ‘Budget Estimate’ is actually the amount allocated to a ministry, fund or scheme in the budget papers for a given year. During a
financial year, some ministries spend more than appropriated and might
require more funds than were actually allocated to them under the ‘Budget Estimates’. The government through the Parliament’s approval allocates ‘supplementary’ budget in the monsoon or winter session, under the ‘Revised Estimates’ category for a given financial year. ‘Actual Expenditures’ are the closing expenses of a ministry or department varying upward or downward of the Budget Estimates and the Revised
Estimates. Actual Expenditures for the previous years are presented in the
budget papers only post-2009.33
India’s defence budget is prepared through incrementalism. Lately,
however, there has been a lot of debate to have an Outcome Budget
instead. Many ministries in India have been asked by the Finance Ministry
to adopt this, but the MoD is under no such obligation so far:
Incremental budgeting is the conventional budgeting method
according to which the budget is organised by using previous
year’s expenses and/or actual performance as a base, with incremental amounts then added for the following year. The
incremental amounts are adjusted for macroeconomic factors
like inflation, or planned increases in sales prices and costs
etc.34
Accounts, Ministry of Defence, GoI, Classification Handbook: Defence Services, Receipts & Charges (Government of India, 2014),
http://cgda.nic.in/accounts/code_heads/CLASSIFICATION%20HANDBOOK_2014.pdf. 31 Editor’s Note: The RR is a branch of the Indian Army under the authority of the
Ministry of Defence. It is a counterinsurgency force made up of soldiers deputed from
other parts of the Indian Army. 32 Ministry of Defence, GoI, “Notes on Demands for Grants, 2016-2017” (Government of
India, 2016), http://www.indiabudget.nic.in/ub2016-17/eb/sbe20.pdf. 33 Avinash Celestine, “How to Read the Union Budget” (New Delhi: PRS Legislative
Research, 2010), http://www.prsindia.org/administrator/uploads/general/1266553625_
Reading%20the%20budget-final.pdf. 34 Comparing Budgeting Techniques, accaglobal.com, last modified June 19, 2017,
http://www.accaglobal.com/ie/en/student/exam-support-resources/fundamentals-exams-
study-resources/f5/technical-articles/comparing-budgeting-techniques.html.

Sobia Saeed Paracha
20
Generally, each department’s administrative branch puts up 15-20
per cent increase over the previous years’ allocation in the Demand for Grants and submits it to the Finance Ministry in the form of a Statement
of Estimates. It contains the following details:
a. Actual figures for the last 3 years,
b. Sanctioned budget estimate for the current year,
c. Actuals of the current year upto that point of time,
d. Actuals for the corresponding period of the previous
year,
e. Revised estimate for the current year, and
f. Proposed estimate for the next financial year.35
The Ministry trims the amount demanded and allocates an amount
higher than previous year’s allocations and lower than the Demand for Grants.
36
To ensure structural and functional efficiency, an optimal Tooth-to-
Tail Ratio (TTR) 37
should be maintained. This roughly translates into
having a balance between acquisition of new weapons and platforms, and
their maintenance for operational preparedness. For this, India’s defence budget has two main components, namely ‘Capital Expenditure’ and ‘Revenue Expenditure’. Spending on the creation of assets or reduction of liabilities e.g. building a road, or paying back a loan or investing in long-
term usable equipment like submarines, tanks, artillery aircrafts etc. are
bracketed as ‘Capital Expenditures’. While spending on administrative costs or salaries etc. is termed as ‘Revenue Expenditure’. There are two additional classifications used to express budgetary allocations in general
– ‘Plan Expenditure’ and ‘Non-plan Expenditure’. ‘Plan Expenditure’ is the government spending on schemes and projects covered by the five-
year Plans which specify the programmes that different ministries will
fund and develop over the next five years. The Planning Commission
develops the five-year plan. The current Plan is 12th and runs from 2012-
17. Plan Expenditures have capital and revenue components. ‘Non-plan
35 Ministry of Defence, Controller of Defence Accounts Chennai, GoI, “Accounts Section
Workshop” (Government of India, n.d.), http://cdachennai.nic.in/manuals/studymaterial/accountsection.pdf. 36 Amiyar Kumar Ghosh, India’s Defence Budget and Expenditure Management in a
Wider Context (New Delhi: Lancer Publishers, 1996), 6. 37 Editor’s Note: T3R is a military term that refers to the amount of military personnel it
takes to supply and support (tail) each combat soldier (tooth).

India’s Defence Budget and Armed Forces Modernisation: An Analysis
21
Expenditures’ can be considered revenue expenditures of the government
as it covers the running expenditure of the government. These include
interest payments on government debt, expenditure on organs of the state
such as the Parliament and the judiciary and even spending on the
conservation of existing government establishments such as schools and
hospitals. Non-plan expenditure also has revenue and capital components.
Defence falls within the purview of ‘Non-Plan Expenditure’.38
Methods, Sources and Limitations of the Study
The data in this study has been collected through primary sources and
official Indian government documents. It is supplemented by data from
IDSA (Institute for Defence Studies and Analyses), IMF (International
Monetary Fund), IISS (International Institute of Strategic Studies) and
SIPRI (Stockholm International Peace Research Institute) etc. It is
indicated in the study where a secondary resource is used for analysing
budget amounts. Since there is a discrepancy in data due to different
methods and definitions used even by different departments within India,
the figures only provide common trends but not necessarily an exact
picture. Data provided in primary sources is also not uniform due to
differences in definitions, methods of analysis and limitations in accurate
data availability. For example, the Union budget documents and the
reports by the CAG distinguish between revenue and capital outlays,
while the annual reports of the Department of Defence provide total
figures of budgetary estimates and actuals for the three services, DRDO
and Ordnance Factories, which includes funding for all the demands for
grants, without separately providing figures for revenue and capital
expenditures. For the percentage of GDP, the annual figures published by
the Planning Commission of India in its online databases have been used
and to analyse the annual percentage of overall government expenditure
allocated for defence, the union expenditure budget document has been
used as a primary source.
This research measures the relationship between Actual defence
expenditures with macroeconomic indicators and Actual union
government expenditures of the budgeted years in retrospect, instead of
looking at projections of all the three parameters at the beginning of each
financial year as is commonly done in the general commentaries on
38 Celestine, “How to Read the Union Budget.”

Sobia Saeed Paracha
22
defence budget. Most defence budget analysis by Indian sources use the
latter methodology because these are conducted separately for each year
to analyse the implications of each budgetary allocation for defence
services. This is not a suitable method of measuring actual effects of an
increasing defence budget. The timeseries analysis in the present study
will provide a better picture of the progress on military modernisation and
operational preparedness of the Indian defence forces in terms of
budgetary allocations over a decade. However, actual expenditure
numbers were only published after 2009 and data is unavailable in a few
cases. In such instances, Revised Estimates are used instead and those are
indicated in the study.
Since this paper is limited only to India and is not a military
expenditure comparison between different states, standardisation of
different categories/ budgetary heads has not been done. The budgetary
figures mentioned in different sources use different numerical
systems/power notation to express the amounts allocated or spent. For the
convenience of analysis, these figures have been converted from ‘crore’ to billion. All amounts are expressed in Indian National Rupee, unless
otherwise mentioned in United States Dollar (USD). Wherever a currency
other than INR is mentioned, current and historical Market Exchange
Rates (MERs) have been acquired from OANDA Corporation’s website. Using MERs instead of Purchasing Power Parity (PPP) exchange
rates is also considered more reliable by SIPRI. It needs to be pointed out,
however, that PPP rates are statistical estimations and prone to marginal
errors. There is also limited utility in using the amount of budgetary
allocation for defence to analyse military utility and effectiveness because
they depend on various qualitative and quantitative factors such as prices,
industrial efficiency, military organisation and doctrines and capacity for
technological absorption etc.
The trends chalked out in the research have also not been adjusted
for inflation nor is a military deflator used. However, each year’s budget is incremental and rate of inflation is naturally considered as a factor that
influences budgetary increase or decrease. There is no reliable data
available for military deflators and is not used to analyse defence budgets
even by reputed databases like that of SIPRI and IISS.

India’s Defence Budget and Armed Forces Modernisation: An Analysis
23
Trends in India’s Defence Budget (2005-16)
According to SIPRI, India is one of the top-10 global spenders in the
defence sector. Its military expenditure has tripled since the 1980s and has
seen a growth rate of 41 per cent since 2005. Figure 2 and 3 help to
demonstrate trends in the military expenditure of India and also provide a
global context in terms of international expenditures:

Sobia Saeed Paracha
24
Figure-2 Global Military Expenditures (2005-15)39
Source: Data collated from SIPRI Military Expenditure Database (1988-2015).40
39 All figures taken from the SIPRI Military Expenditure Database (1988-2015), expressed
in USD Billion at constant 2014 exchange rates. 40 SIPRI, SIPRI Military Expenditure Database (Solna: Stockholm International Peace
Research Institute), accessed March 2016,
https://www.sipri.org/databases/milex. Data collated from SIPRI Military Expenditure Database (1988-2015).
USA Russia China SaudiArabia France UK India
2005 610 43 80 38 64.2 63.9 362006 619 47 92.58 43.2 64.5 64.3 35.72007 635 51 103.7 49.8 64.7 66.3 36.12008 682.9 56 113.5 48.9 64.1 69.3 412009 737 59.7 137.4 50.2 68.4 70.6 48.22010 757.9 65 144.3 52.3 65.3 69.1 48.42011 748 60.9 155.8 53 63.7 66.2 48.92012 706 75.3 169.3 60 62.8 63.4 48.72013 650 79 182.9 68.8 62.6 60.7 48.42014 609.9 84.6 199.6 80.7 63.6 59.1 50.92015 595 91 214.4 85.3 60.7 59.7 51.1
0
100
200
300
400
500
600
700
800
Billi
on U
SD

India’s Defence Budget and Armed Forces Modernisation: An Analysis
25
Figure-3 World Military Expenditures (2015)
Source: Data collated from SIPRI Military Expenditure Database (1988-2015).41
In 2015, India was the seventh biggest military spender of the world
with USD 51 bn defence budget. At the end of 2014, IHS Jane’s published its estimates for global defence budgetary growth by 2020 (Figure 4).
Defence budgets in general are trending in all the regions of the world
(Asia Pacific, Middle East, Russia, Europe and Latin America) and
decreasing in the North America.
41 Ibid.
US Russia China SaudiArabia France UK India
2015 595 91 214.4 85.3 60.7 59.7 51.1
0
100
200
300
400
500
600
700
Billi
on U
SD

Sobia Saeed Paracha
26
Figure-4 Global Defence Expenditure (2014-20)
Source: “Analysis: Five Key Global Defence Budget Trends for 2015,” IHS Jane’s Defence Weekly, December 16, 2014,
http://www.janes.com/article/47013/analysis-five-key-global-defence-budget-trends-for-
2015.
Table 1 shows the defence budget of India and growth rates on
actual expenditures from previous years. As discussed before, there is a
difference between the definitions of defence budgets provided by SIPRI
and the Indian budget papers. Indian defence services budget is actually a
subset of the SIPRI definition and useful in terms of specifying the
amount allocated for the development and maintenance of conventional
capability to counter external threats. Table 1 provides India’s defence budgets based on both mentioned definitions. There tends to be a
difference between the amount allocated and amount spent for defence,
each year. Since the government always has the amount actually spent
before formulating the new budget, growth over previous year’s actual expenditure is a better metric to analyse the government’s willingness to increase budgetary allocations.

India’s Defence Budget and Armed Forces Modernisation: An Analysis
27
Table-1 Indian Defence Budget and Growth Rates (2005-16)
Fiscal Year
Defence Budget GoI Definition
RE/ Actual Expenditures
INR
Growth in
Defence Budget
over Previous
Year Actuals*
Defence Budget SIPRI Definition42
INR USD (MER) INR USD
(MER)
2005-06 830 18.73 805.4898
RE 7.2 1035 23.36
2006-07 890 19.69 854.9464 10.4 1102 24.38
2007-08 960 23.88 916.8028 11.6 1190 29.6
2008-09 1056 22.9 1142.2328 15.1 1518 33
2009-10 1417.03 29.8 1417.8108 24.09 1993 42.04
2010-11 1473.44 32.31 1541.1671 3.9 2146 47.06
2011-12 1644.15 34.18 1709.1328 6.6 2373 49.33
2012-13 1934.07 35.81 1817.7578 13.1 2573 47.64
2013-14 2036.72 33.72 2034.9935 12 2846 47.11
2014-15 2240 35.98 2223.7 10 3118 50.08
2015-16 2467 40.3 2186.9 11 3100.79 49.81
Source: Data collated from various official Ministry of Finance budget documents
(2004-16).43 *Note: Growth rates calculated by the author.
42 The figures provided in Table 1 are different from those in Figure 5. The figures
provided in Table 1 are based on current USD exchange rates for each given year and
have been taken from Indian government’s budget documents. However, in Figure 5, the numbers are based on constant 2014 exchange rates.
43 Ministry of Finance, GoI, “Union Budget,” accessed March 2016, http://indiabudget.nic.in/; Ministry of Finance, GoI, “Economic Survey,” accessed
March 2016, http://indiabudget.gov.in/survey.asp.


India’s Defence Budget and Armed Forces Modernisation: An Analysis
29
It is clear from the tables and figures, that even though the defence
budget is incremental every year, the growth rate has fluctuated over the
past decade. Figure 6 shows a gradual increase from 15 per cent to a
staggering 24 per cent in 2009. The driving factor for this was the pay
raise promulgated by the Sixth Pay Commission. This is discussed in
detail in the following sections. After 2009, there was nominal growth in
India’s defence budget over the next two years followed by an average growth rate of 11.5 per cent for the next four years:
Figure-6
Growth in Defence Budget over Actuals (2005-17)
Source: Data points selected from Table 1.
Interestingly, the same budget expressed in USD at current year
exchange rates shows slightly different growth patterns (Figure 7). On
three occasions (2008, 2013 and 2016), the budget had negative growth
rate. Inter alia this has implications for the modernisation endeavors since
around 70 per cent of the capital budget is spent on importing arms.45
The
share of capital budget has increased dramatically since the mid-2000s
and hovers around 50 per cent of the total budget every year.
45 KPMG, Union Budget 2014: Defence Post-Budget Sectoral Point of View.
0
5
10
15
20
25
30

Sobia Saeed Paracha
30
Figure-7 Defence Budget Billion USD (MER)
Source: Data used from Table 1.
Political Will, Macroeconomic Indicators and Defence Budgetary Growth Political Will
Selection and maintenance of political aims is the most important
principle of national security and a basic driver of effective military
expenses. Political aims are selected by the political leadership and
maintained and attained by the defence establishment. In theory,
budgetary allocations shed light on the political aims, threat perceptions
and willingness to spend in certain areas, of the leadership.46
The study acknowledges that the concept of political will is very
complex for several reasons. It involves intent and motivation, which are
qualitative variables and are inherently an intangible phenomena. An
unbiased analysis of political will is not possible and is prone to
46 Vinay Kaushal, “Defence Budget: Constraints and Capability Building,” in Core
Concerns in Indian Defence and the Imperatives for Reforms, ed.Vinod Misra (New
Delhi: Pentagon Press, 2014).
05
1015202530354045
Defence Budget USD (MER)

India’s Defence Budget and Armed Forces Modernisation: An Analysis
31
manipulation and misrepresentation. Also, political intent exists on
multiple levels from individual to organisational and basic to systemic and
can be influenced by internal and external factors. A brief definition of
political will is ‘the commitment of actors to undertake actions to achieve a set of objectives.’ 47
National military expenditures help to analyse the military might
of a country, as they are an indicator of the national will to develop
military capabilities and also demonstrate the allocation of resources in
certain areas. Even though high budgets may not be strong indicators of
the military effectiveness of a state, they do reveal the size of the defence
infrastructure. Thus, the biggest military powers in the world, e.g. US,
Russia and China also have the biggest military budgets. Many respected
military databases use defence expenditures as an international measure of
military power.
This study does not employ a formal econometric model or
regression analysis of military spending and political will, since political
will is not a completely quantifiable phenomenon. As an affirmative
indicator of political will most of the military expenditure databases and
analysts have used financial resources committed to defence as a tangible
expression of prioritised political intent for militarisation. This study has
mainly used the covariance of defence spending with macroeconomic
growth indicators (GDP growth rate, inflation rate, fiscal deficit etc.) and
percentage share of defence budget in overall government expenditure as
positive indicators of political will. These indicators help to provide a
basic understanding of governmental priorities in the face of available
resources. A positive/negative relationship between allocation of funding
for defence with increasing economic growth would help to understand to
what lengths the Indian government is willing to go and what other sectors
it is willing to compromise for increasing military capacity. Such
indicators provide a macro level view, both of political priorities and of
capacity (in the basic sense of resource availability), but they do not help
extensively to demonstrate the complexities of political will. The role of
military industry in the development of a country’s economy is a basic indicator whether defence spending is a contributory or a burden for a
47 Derick W. Brinkerhoff, “Unpacking the Concept of Political Will to Confront
Corruption” (brief no.1, Chr Michelsen Institute, Bergen, 2010), http://www.cmi.no/publications/file/3699-unpacking-the-concept-of-political-will-
to.pdf.

Sobia Saeed Paracha
32
country’s economy. In a developing country like India, military spending is more of a burden due to an embryonic defence industry and import
oriented capital expenditures. Thus, the extent of burden the Indian
government is willing to bear would reflect in the percentage share of
defence spending in the total government budget and can be a viable
indicator of the government’s political will to militarise.
There can be various other factors that influence military spending
like external or internal security situation, power projection, defence
economy and so on. In order to stay within the scope of the study,
financial allocation is only analysed as a partial indicator of political will.
The political executive of a nation strives to achieve national security
through various means – of which military means is one. Various interest
groups and other constituencies lobby pressure on governments to adopt
different and sometimes contradictory courses of action. In some
scenarios, a high budgetary allocation in a certain area may be a result of
political leverage by a certain party or interest group instead of national
objectives. Thus, the structure of a defence budget and certain areas of
appropriations may often be a result of political, security, macro- and
microeconomic and other concerns that impact the fiscal process.
Miscellaneous Indicators of Political Will
From an outsider’s perspective, India’s defence budget is quite significant. However, within the country it is a hotly debated subject. The literature is
filled with criticism of the government for not allocating enough for
defence. Both the 15th and 16
th Lok Sabha Committees harshly criticised
the government for inadequate defence outlay and under-utilisation of the
allocated budgets. The data shows the difference between the demand of
drafts and amount allocated as quoted in the 20th Lok Sabha report of the
Standing Committee on Defence. The Committee observed that only
meager amounts were being allocated for new schemes and most of the
capital budget was consumed by committed liabilities. This was seen as
slowing down the pace of force modernisation. However, one expert
observed the Committee’s recommendations to be naïve.48
48 Amit Cowshish, “Standing Committee on Defence (16th Lok Sabha): Striking Old Notes
on Debut,” Journal of Defence Studies 9, no. 2 (2015): 9-19,
http://www.idsa.in/system/files/jds/jds_9_2_2015_AmitCowshish.pdf.

India’s Defence Budget and Armed Forces Modernisation: An Analysis
33
Historically, India has never overburdened its economy with military
expenditure, and the basic principal has been that a stronger economy will
lead to higher defence allocations. P. Chidambaram, the then Finance
Minister, while speaking at IDSA stated:
Defending and promoting national security stands on three
important pillars: human resources; science and technology;
and money. Money is also the pillar that supports the first two
pillars. Money comes out of growth.49
It is presumably thought that low allocations in defence are a result
of structural problems in the defence bureaucracy and general financial
constraints.50
Different governments since the 1990s have been trying to
cater with various decision-making and spending problems related to
defence. Policy initiatives like the Defence Procurement Procedure (DPP)
was announced in 2002, a Defence Offsets Policy was released in 2006, a
Long-Term Integrated Perspective Plan (LTIPP) in 2009 and a Defence
Production Policy in 2011. Eight different committees and task forces
were created to analyse various aspects of national defence. The DPP was
revised in 2005, 2006, 2008, 2009, 2011, 2013 and 2016.
Even though India imports 70 per cent of its defence equipment,
indigenisation of technologies and self-reliance have been the primary
goals of its defence policy. The DPP 2010 emphasised achieving higher
Self-Reliance Index in key technologies and manufacturing. It also
suggested creating a national technology fund to finance research in
universities and other institutions relevant to national security. Dr Kalam,
the then Scientific Advisor to the Defence Minister, headed a review
committee in 1995 to contemplate issues of uncertain supply of defence
equipment from the countries of the erstwhile Soviet Union. The
committee looked into options for India to raise the level of indigenous
content in defence equipment from existing 30 per cent to 70 per cent by
2005. Following systems identified for future use: ‘automated air defence; satellite-based navigation; air and space-based early warning; C4 I;
underwater sensors and weapons; medium and long-range guided missile
systems with launching capacity from multiple platforms; Unmanned Air
Vehicles (UAVs); stealth aircrafts; airborne electronic warning systems;
49 Kaushal, “Defence, Budget: Constraints and Capability Building,” 182. 50 Cowshish, “Standing Committee on Defence (16th Lok Sabha): Striking Old Notes on
Debut.”

Sobia Saeed Paracha
34
Electronic Counter Measure (ECM and ECCM); and very small aperture
terminals for satellite communication Global Positioning System
receivers.51
In 2001, the government constituted the Ajay Vikram Committee to
prevent stagnation in the middle ranks of the Army and make it a ‘lean and mean’ organisation. The National Democratic Alliance (NDA) government stated that the recommendations of the Committee would be
implemented and a restructuring of the officer-level cadre would be done.
However, the Army has instead expanded manpower rather than reducing
it.52
Absence of a National Security Objective and Strategy is thought to
be the basic reason behind the lack of focus on defence planning. The
government issues Operational Directives through the Defence Minister
that provide a starting point to the defence planners in India and qualify as
political directive of sorts instead of a formal White Paper. After the 12th
Five-Year Defence Plan (FYDP) (2012-17), MoD issued its Operational
Directives, which were stated by all the services to be a good enough basis
for preparing the plan. There are still discussions on the gaps existing
between the FYDPs and national security imperatives.53
In 2012, the Defence Acquisition Council approved both the FYDP
2012-17 and the Long-Term Integrated Perspective Plan (LTIPP) which is
a strategic document. It lays out government policy development of
capabilities according to the future operational requirements and the role
that the country will play within the region and outside. It is based on the
government’s assessment of possible cases of aggression and a means to direct long-term policy. Based on the recommendation of the LTIPP the
future force structures will be built.54
The MoD in response to a question
by the 15th Lok Sabha Standing Committee about long-term planning of
51 “Ajai Vikram Panel’s Proposals for Army to be Implemented,” Economic Times,
December 17, 2004, http://articles.economictimes.indiatimes.com/2004-12-
17/news/27379908_1_commanders-defence-secretary-army. 52 IISS, The Military Balance (Washington, D.C.: International Institute of Strategic
Studies), accessed August 2017, http://www.iiss.org/en/publications/military-s-balance. Data collated from The Military
Balance issues (2006-16). 53 Amit Cowshish, “Financial Management in Defence,” in Core Concerns in Indian
Defence and the Imperatives for Reforms, ed.Vinod Misra (New Delhi: Pentagon Press,
2014), 215. 54 “India’s Military Modernisation up to 2027 Gets Approval,” Defence Now, accessed
August 17, 2017, https://archive.is/9isKh.

India’s Defence Budget and Armed Forces Modernisation: An Analysis
35
force modernisation stated that a top-down revision of LTIPP is being
pursued by the government. The process, back in 2008-09, incorporated
views from three services, MoD, NSA and various other agencies. The
revised LTIPP would articulate the National Security Strategy, National
Military Strategy and National Military Objectives etc.55
Since the LTIPP is considered a strategic document, it would have
been more appropriate for it to be approved by senior political leadership
of the country than the DAC. The process was also criticised for not
taking into account the budgeting problems at the initial stages of devising
the Plan. Thus, it is generally expected that even the approved
programmes of the government get major re-adjustments primarily due to
fiscal realities considered beforehand.
Macroeconomic Indicators (2004-15)
The sheer volume of the defence budget speaks of the political motivation
of Indian leaders to spend on defence. However, since it does not exceed
2.5 per cent of the GDP, it is considered theoretically affordable. Since
1995, the defence budget had a steady growth of more than 5 per cent in
real terms.56
Summarised below is a year on year exposé from 2004-15 of
the macroeconomic indicators and corresponding defence spending
figures followed by major trends in the defence budget growth and some
exogenous influencers of defence funding.
2004: INR 770 billion was allocated for defence services expenditure in
2004-05 which was an increase of 21.6 per cent of the revised estimates of
2003-04.57
The GDP growth rate remained steady at 7.05 per cent and
fiscal deficit remained 3.9 per cent. With relatively stable macroeconomic
indicators, the defence budget stood at 2.5 per cent of the total GDP.58
55 Cowshish, “Financial Management in Defence,” 215. 56 Bhartendu Kumar Singh, “Debating Defence Expenditure” (New Delhi: Institute of
Peace and Conflict Studies, 2005), http://www.ipcs.org/article/india/debating-defence-
expenditure-1688.html. 57 Ministry of Finance, GoI, “Union Budget”; Ministry of Finance, GoI “Economic
Survey.” 58 Planning Commission, GoI, “GDP at Current/Constant Prices and % to respective GDP
at Market Prices,” October 28, 2011, http://planningcommission.nic.in/data/
datatable/data_2312/DatabookDec2014%2012.pdf. Macro indicators collated from the
Planning Commission of India’s data-sets.

Sobia Saeed Paracha
36
2005: In 2005-06, INR 830 billion was allocated for defence services
expenditure which was an increase of 7.2 per cent of the revised estimates
of 2003-04.59
The GDP growth rate was 9.48 per cent and fiscal deficit
remained -3.96 per cent. With relatively stable macroeconomic indicators,
the defence budget stood at 2.44 per cent of the total GDP.60
However, the
growth of 7.2 per cent was considered highly insufficient by the defence
planners to sustain the same level of military capability given the national
inflation and the military deflator. A steady growth of 10-12 per cent was
advocated to maintain the same level of budgetary support for defence.
Some critics also suggested that instead of the amount, the direction and
the orientation of the budget needed course correction.61
2006: The total funds allocated to the MoD for defence services were INR
890 billion.62
A rapidly growing economy, with the GDP growth rate of
9.5 helped to increase the defence budget by 7.2 per cent based on
previous years’ revised estimates. 2007: The defence budget in 2007-08 saw a growth of 11.6 per cent over
the previous years’ actual expenditure. INR 96 billion was earmarked for
defence services.63
It was 1.9 per cent of the GDP and 14.10 per cent of
the total government expenditure. With a growing economy, the
government’s resource base also expanded, however, this did not lead to a
higher allocation of funding as a percentage of government’s total expenditure. Furthermore, a cut of 5 per cent was imposed again in 2007-
08 due to the fiscal deficit of 2.54,64
which was lowest in the entire decade
being analysed in this study.
59 Ministry of Finance, GoI, “Union Budget”; Ministry of Finance, GoI “Economic
Survey.” 60 Planning Commission, GoI, “GDP at Current/Constant Prices and % to respective GDP
at Market Prices.” 61 Singh, “Debating Defence Expenditure.” 62 Ministry of Finance, GoI, “Union Budget”; Ministry of Finance, GoI, “Economic
Survey.” 63 Ibid. 64 Amit Cowshish, “A Perspective on Defence Planning in India,” Strategic Analysis 36,
no. 4 (2012): 680-686, doi: 10.1080/09700161.2012.689540.

India’s Defence Budget and Armed Forces Modernisation: An Analysis
37
2008: The defence budget for 2008-09 stood at INR 1056 billion with a
growth rate of 15.1 per cent on actuals.65
As a percentage of GDP, the
budget grew from 1.9 per cent to 2.3 per cent, and as a percentage of
overall government expenditure it grew to 13.5 per cent. With an inflation
rate of 9.1 per cent (CPI)66
the budget growth was unassuming. Revenues
shared 54.55 per cent of the budget and saw a growth of 5.1 per cent only.
The 5.1 per cent increase was less than sufficient viewing the inflation rate
at 9.1 CPI.67
2009: In view of the economic downturn, the total budget growth rate at
24.09 per cent was considered moderate by some, however, it remains the
biggest jump over the 2005-15 period. Initially, it was felt that economic
pressures had contributed to slowing down the flow of funds in capital
outlays because the growth over previous years’ budget estimates was
only 14.3 per cent. As the Armed Forces were on a major modernisation
drive since 2005 growth stagnation was not something the MoD was
looking for.68
Also, the share of capital expenditure had a negative growth
of 6.85 per cent points over the previous year and fell down to 38.6 per
cent of the total defence budget. Nonetheless, the budgetary allocations
later did not seem to be insufficient. The capital outlays in 2009-10 had a
staggering growth rate of 34.1 per cent over the previous year’s actual expenditure. The low inflation rate 3.6 (WPI)
69 should also have improved
the purchasing power of India while importing major equipment and
technologies.
2010: Defence services were allocated INR 1473.03 billion, which stood
at 12.99 per cent of the total government expenditure and fell down to
1.99 per cent of the GDP. The defence budget in 2010-11 had a growth
rate of 3.9 per cent only over the previous year’s actual expenditures.70
The macroeconomic indicators had improved since 2009. The GDP
65 Ministry of Finance, GoI, “Union Budget”; Ministry of Finance, GoI, “Economic
Survey.” 66 Consumer Price Index. 67 Planning Commission, GoI, “GDP at Current/Constant Prices and % to respective GDP
at Market Prices.” 68 L. Kumar Behera, “India’s Defence Offset Policy,” Strategic Analysis 33, no. 2 (2009):
242–253. 69 Wholesale Price Index. 70 Ministry of Finance, GoI, “Union Budget”; Ministry of Finance, GoI, “Economic
Survey.”

Sobia Saeed Paracha
38
growth rate increased from 8.5 to 8.9 per cent, inflation rate went down
from 12.99 to 10.5 (CPI) and fiscal deficit also decreased from 6.46 to 4.7
per cent.
2011-12: The total defence services budget in 2011-12 was INR 1644.15
billion71
; 2.05 per cent of the GDP and 12.94 per cent of the total central
government expenditure. With the lowest GDP growth rate (6.69) since
2003-04, high inflation (8.4) and fiscal deficit (5.7), the growth in defence
budget was low-moderate at 6.6 per cent of the actual expenditures from
2010.72
2013: When the budget was announced in March 2013 Indian defence
analysts were disappointed, as the budgetary allocation was increased at
the rate of 5 per cent.73
Economic slowdown was considered the primary
reason for low defence allocation. The GDP growth rate stagnated at 4.7,
rate of inflation remained 9.5 (CPI) and 7.5 (WPI). Fiscal deficit reduced
relatively from 4.9 in 2012-13 to 4.5 per cent of the GDP. At the GDP
growth rate of 4.7,74
the government’s revenue receipts must have come under sharp pressure, and should have forced it to reserve spending on
Non-plan Expenditures. However, a closer analysis of the military
spending in India shows a different picture. Even with economic
slowdown, allocation for defence services increased to INR 2036.72
billion with a growth rate of 12 per cent over 2012’s actual expenditures.
The growth rate was 14.1 per cent of the 2012 revised estimates (INR
1785 billion). Once again the percentage of GDP allocated for defence
increased to 2.25 and the percentage of total government allocation for
defence remained 12.8.
2014: A sum of 2240 billion was reserved for defence services
expenditure in 2014-15. This was an average growth of 10 per cent. The
economic situation had begun to improve. The GDP grew at 7.4 per cent
71 Ibid. 72 Planning Commission, GoI, “GDP at Current/Constant Prices and % to respective GDP
at Market Prices.” 73 Laxman K. Behera, “India’s Defence Budget 2013-14: A Bumpy Road Ahead”
(comment, Institute for Defence Studies and Analysis, New Delhi, 2013),
http://www.idsa.in/idsacomments/IndiasDefenceBudget2013-14_lkbehera_040313. 74 Planning Commission, GoI, “GDP at Current/Constant Prices and % to respective GDP
at Market Prices.”

India’s Defence Budget and Armed Forces Modernisation: An Analysis
39
and inflation rate decreased to 3.4 per cent (WPI). However, fiscal deficit
persistently remained above 4 per cent and the inflation rate in CPI terms
remained high at 10.9.75
2015: India announced a core budget of INR 2290 billion for defence
services expenditure in 2015-16. The defence budget grew at the rate of
2.9 per cent of the budget estimates of 2014-15.76
The government’s fiscal consolidation policies helped to reduce the fiscal deficit about 0.2 - 0.5 per
cent points. The fiscal deficit remained at 3.9 per cent of the GDP, while
the GDP growth rate till December 2015 was 7.8 per cent. Inflation rate at
6.4 was the lowest since 2008-09.77
Since the defence establishment of
India has generally been dissatisfied with the allocation of funding for
defence services, it is thought that the improving economic condition will
expand the resource base of the government and may result in further
growth of the defence budget. The 2015-16 defence budget was the first
full budget presented by Prime Minister U.B. Modi’s government. Interestingly, at 1.7 per cent of the GDP, the defence budget was the
lowest in the last decade. By some estimations, it was even the lowest
percentage of GDP since 1962.78
However, at 14.1 as a percentage of total
government expenditures, the defence budget was the highest since 2006-
07.79
Defence Spending as a Percentage of GDP
As mentioned before, the percentage share of a country’s defence budget in its real GDP is a rough indicator of the burden military expenditure is
putting on the economy by allocating a segment of national resources to
non-developmental expenditure. In the absence of a clear framework of
evaluating affordability of defence spending, a time-series or cross-
75 Ibid. 76 Ministry of Finance, GoI, “Union Budget”; Ministry of Finance, GoI “Economic
Survey.” 77 Planning Commission, GoI, “GDP at Current/Constant Prices and % to respective GDP
at Market Prices.” 78 Ajai Shukla, “Defence Allocation Down to about 1.65 % of GDP, Lowest since the 1962
China War,” Business Standard, March 1, 2016, http://www.business-
standard.com/budget/article/defence-allocation-down-to-about-1-65-of-gdp-lowest-
since-the-1962-china-war-116030100073_1.html. 79 Ministry of Finance, GoI, “Union Budget”; Ministry of Finance, GoI “Economic
Survey.”

Sobia Saeed Paracha
40
country comparison is done by SIPRI and IISS etc. as well. However, the
percentage share of GDP for defence has limited utility unless combined
with other qualitative and quantitative indicators for a holistic view.
Even though economic growth over the last decade has helped
increase India’s defence budget threefold in nominal terms, as is evident
from Figure 8, the GDP to defence spending ratio of India has remained
somewhat consistent instead of growing with an improving GDP. This can
be an important indicator of the significance of other sectors in the eyes of
political leadership than defence. There is no preset GDP percentage
allocated for defence in India. However, many defence analysts have
advocated for a constant 3 per cent of GDP to be allocated for defence.80
Fixing defence budget to a certain percentage of GDP may create
volatility in annual allocation for defence in relation to the performance of
the economy in any given year.81
80 Cowshish, “Standing Committee on Defence (16th Lok Sabha): Striking Old Notes on
Debut.” 81 Cowshish, “A Perspective on Defence Planning in India.”


Sobia Saeed Paracha
42
India’s defence expenditure to GDP ratio has continued to decline over the last 30 years and it has not increased beyond 2.5 per cent in the
last decade. This is generally considered a benign level of spending from
an economic perspective, especially for a country like India - the
numerical strength of whose military forces is more than a million. A
comparative GDP percentage for defence of other high defence spenders
in 2015 is provided in Table 2:
Figure-9
India’s Defence Expenditure (% of GDP)
Source: Ministry of Finance, GoI, “Union Budget”; Ministry of Finance, GoI, “Economic
Survey”; Planning Commission, GoI, “GDP at Current/Constant Prices and % to respective GDP at Market Prices.”

India’s Defence Budget and Armed Forces Modernisation: An Analysis
43
Figure-10 Covariance of GDP and Defence Growth Rates
Source: Data points from discussion above (Year on Year exposé).82
The data presented in the Figure 9 and 10 does not demonstrate a
correlation between GDP growth and subsequent increase in the defence
budget. The highest value for GDP percentage allocated for defence in the
last decade was 2.3 in 2008-09, when the corresponding growth rate was 9
per cent and increase in the defence budget was 15.1 per cent. While the
lowest GDP growth rate (4 per cent-2012-13) for the last decade did not
result in a dramatically smaller share of defence as a percentage of GDP,
at 1.9 per cent with the corresponding growth in defence budget at 13.1
per cent. Hike in the defence budget in 2009, due to the inclusion of the
Sixth Pay Commission’s recommendations in the budget might have been a one-time event which brought a 15 per cent increase in pays and
allowances (revenue expenditure) and an overall growth rate of 24 per
82 Ministry of Finance, GoI, “Union Budget”; Ministry of Finance, GoI “Economic
Survey”; Planning Commission, GoI, “GDP at Current/Constant Prices and % to
respective GDP at Market Prices.”
2005-06
2006-07
2007-08
2008-09
2009-10
2010-11
2011-12
2012-13
2013-14
2014-15
2015-16
Growth in DefenseBudget over Actuals 7.2 10.411.615.124.093.9 6.6 13.1 12 10 11
GDP Growth Rate 9.579.579.326.728.598.916.694.474.74 7.4 7.8
05
1015202530

Sobia Saeed Paracha
44
cent.83
After that, the highest share of GDP for defence (2.25) recorded
was in 2013-14 when the GDP growth rate remained 7 per cent and
subsequently fell to 1.7 per cent when the GDP growth rate increased to 8
per cent.
GDP per capita is also used by many international military
expenditure databases to understand the implications of change in income
for defence spending. Generally, rise in income means economic growth,
which may or may not lead to higher defence spending. Maisels and
Nissanke argue that, ‘higher income may lead to structural changes,
inequalities and hence conflict requiring higher military spending to
maintain internal control.’84 However, this study has employed the Indian
government’s definition for defence which excludes spending on internal security and paramilitary forces. Thus, the analysis does not present the
internal security situation of India and spending in that domain.
Defence Allocation and Fiscal Deficit
Another indicator of political motivation to spend on the military could be
effects of high fiscal deficit rates on defence spending. Table 2 shows a
comparison of trends in the fiscal deficit, growth in military expenditure
and percentage of defence in the overall government budget:
83 Amiya Kumar Ghosh, “Defence Planning in India at Crossroads,” in Core Concerns in
Indian Defence and the Imperatives for Reforms, ed. Vinod Misra (New Delhi: Pentagon
Press, 2014), 88. 84 Alfred Maisels and Machiko Nissanke, “The Determinants of Military Expenditures in
Developing Countries,” World Development 14, no. 9 (1986): 1125-1140.

India’s Defence Budget and Armed Forces Modernisation: An Analysis
45
Table-2 Growth Rate of India’s Defence Budget and other
Macroeconomic Indicators
Fiscal Year
Rate of Fiscal Deficit
Defence Growth Rate on Actuals
% of Gov. Expenditure
Rate of Inflation
GDP Growth
Rate
2005-06 3.96 7 15.6 4.2 9.5
2006-07 3.32 10 14.85 6.8 9.57
2007-08 2.54 12 12.39 6.2 9.32
2008-09 5.99 15 13.5 9.1 6.72
2009-10 6.46 24 13.8 12.3 8.59
2010-11 4.79 4 12.99 10.5 8.91
2011-12 5.7 7 12.94 8.4 6.69
2012-13 4.9 13 12.4 10.2 4.47
2013-14 4.5 12 12.8 9.5 4.74
2014-15 4.1 10 13.1 10.9 7.4
2015-16 3.9 3 14.1 6.4 7.8
Source: Based on data presented before and collated from the Ministry of Finance budgetary
documents (2005-16).85
There are multiple factors that affect the allocation for defence
services in the total union budget. For example, the Fiscal Responsibility
and Budget Management Act (FRBM Act 2003) obliged the government
to eliminate revenue deficit and reduce fiscal deficit to three per cent of
GDP by 31 March 2008. For this reason, the government even imposed a
five per cent cut on the non-salary heads of the revenue expenditure of the
defence services. Since the defence budget of India is incremental, it led
to a lower revised estimates and resultantly low budgetary estimates for
future budgetary allocations, even though the fiscal deficit was decreasing
and GDP growth rate was 9 per cent. In 2007-08, the fiscal deficit
decreased to an all-time low of 2.5 per cent resulting in a hike (19.7 per
cent) in defence budget growth in 2008-09 over the previous year’s actual
85 Ministry of Finance, GoI, “Union Budget”; Ministry of Finance, GoI “Economic
Survey”; Ministry of Finance, GoI, accessed August 2016, http://finmin.nic.in/.

Sobia Saeed Paracha
46
expenditures, a year before 2009-10 when the budget had to be increased
due to the Sixth Pay commission’s recommendations. The capital side of the budget was increased a staggering 27 per cent.
At other times, however, fiscal deficit was not the deciding factor
for defence allocation. The deficit in 2007-08 rose to 5.99 per cent, but
this did not make the government reduce the defence budget in 2009-10.
At that time, revenue budget increase was mandatory because of the Sixth
Pay Commission’s recommendations. It should be noted though that the
capital side also saw a growth of 34 per cent - an indicator of the
significance of defence. This should also be seen in the context of the
Mumbai attack that happened in 2008. In 2014-15, the situation was not
similar to 2006-07. The fiscal deficit had remained above 4 per cent for
six years, an indicator of the problems the government was facing in fiscal
management. Also, the GDP growth rate remained low at 4 and 5 per cent
for the previous two years. In comparison to 2006-07, the fiscal deficit did
not decrease significantly and the cut in defence budget (8.4 per cent from
10.99 per cent) was not very significant either. The government did not
impose a mandatory 10 per cent cut on the revenue budget as it did in
2012-13 and 2013-14. In 2015, the defence budget growth was just 3 per
cent and the fiscal deficit was 3.9 per cent. Under the revised goals of the
12th Plan and FRBM Act, fiscal deficit needs to be brought below 3 per
cent of the GDP.
Defence Budget as a Percentage of the Union Government Expenditure
A reliable metric to guage the significance of defence is the percentage
allocated to it in the overall governmental expenditure for a given year.
Figure 11 provides the trend of the total Indian government’s expenditure on defence. In the last decade, it has not increased more than 15 per cent:

India’s Defence Budget and Armed Forces Modernisation: An Analysis
47
Figure-11 Defence as a Percentage of Union Gov. Expenditure (2005-16)
Source: Data collated from Ministry of Finance website (2005- 16).86
Interestingly, the percentage of defence budget in the government’s total expenditure should have increased after 2010 as compared to the
period between 2005 and 2010 since the government’s resource base is shrinking in the wake of 13
th and 14
th Finance Commissions post-2010.
Under the recommendations of the 14th Finance Commission, the states’
share in the central government’s divisible pool of union taxes has been increased to 42 per cent. However, the percentage share of defence in the
government’s expenditure did not increase in proportion to this development. There must be other variables in the background to this
consequence and this does not effectively communicate a lack of will to
spend on defence, yet if the government had increased the budget it would
not have seemed a deviation from the past.
Approximately seventy five per cent of the ‘Non-Plan Expenditures’ of the total Indian government’s expenditure is constituted of interests, subsidies and defence expenditure. Defence, however, constitutes a small
portion of this expenditure. As shown in Figure 12, India’s defence budget has hovered around 20 per cent of its total non-plan expenditure since
2000:
86 Ibid.
15.6 14.85
12.39 13.5 13.8 12.99 12.94 12.4 12.8 13.1
14.1
02468
1012141618

Sobia Saeed Paracha
48
Figure-12 Defence as a Percentage of Non-Plan Expenditures (2000-16)
Source: Vinay Kaushal, “Defence Budget 2015-16: The Bad, the Worse and the Good” (comment, Institute for Defence Studies and Analyses, New Delhi, 2015),
http://www.idsa.in/idsacomments/DefenceBudget2015%2520-16_vkaushal_020315.
Inflation Rates and Budget Increase
Inflation rate is a very useful metric to analyse the actual significance of
any budgetary increase. Although the data in this study is nominal and not
corrected for inflation rates or military deflators, a brief analysis of the
implications of rising inflation rates on the budgetary growth rate has been
conducted. Inflation in both CPI and WPI terms is reflective of the effects
of inflation on the national budget. In general, India spends its entire
revenue budget on buying goods and services within the country (some
minor heads related to maintenance etc may use imported parts or
technologies); and roughly 70 per cent of its capital budget to import
weapons and related technologies. The inflation in CPI is thought to effect
revenue related items and inflation measured in WPI terms effects
imported items. Figure 13 demonstrates the correlation between capital
and revenue budget growth rate and rate of inflation in both WPI and CPI
terms.

India’s Defence Budget and Armed Forces Modernisation: An Analysis
49
Figure-13 Inflation Rates and Impacts on India’s Defence Budget
(2005-16)
Source: Data collated from the Ministry of Finance budgetary documents (2005-16).87
Sometimes price indices are used as a substitute to military
deflators. A price index takes a specific collection of identical goods at
two separate points in time, and measures the average change in price of
that collection of goods. Some of the common price indices used are
consumer price indexes, wholesale price index and general civilian price
index. These are non-military in nature and do not provide implications
specific to the defence sector. In fact, the influence of civilian price
variations may not be obvious on military items as it is tacitly assumed
that these indices can be used as military deflator surrogates. However,
civilian price indices are a compromise due to absence of reliable military
deflators. These are also used in this study to analyse the implications of
variation in purchasing power of the military influenced by inflation.
It is observed that military related domestic inflation has a
propensity to be higher than general inflation. Consequently, if defence
87 Ibid.
2005-06
2006-07
2007-08
2008-09
2009-10
2010-11
2011-12
2012-13
2013-14
2014-15
2015-16
Rate of Inflation CPI 4.2 6.8 6.2 9.1 12.3 10.5 8.4 10.2 9.5 10.9 6.4Rate of Inflation WPI 3.7 6.5 4.8 8 3.6 9.6 8.8 7.5 6 3.4Budget Growth rate 7.2 10.4 11.6 15.124.09 3.9 6.6 13.1 12 10 2.9
0
5
10
15
20
25
30
Rate of Inflation CPI Rate of Inflation WPI
Budget Growth rate

Sobia Saeed Paracha
50
budgets are adjusted considering general inflation only, the actual impact
of inflation will be much higher on defence budgets. This may not be
demonstrated clearly in the changing defence expenditures, especially in
the figures published in open sources, but a correlation of military budgets
with rate of inflation can be an indicator of the level of pressures a
defence budget incurs due to hostile macroeconomic situations. It also
exhibits the motivation of a political leadership to restrain or spend money
on defence in the face of economic pressures.88
For example, one analyst
writes that Indian military’s buying power has not increased with the increase in defence budgets due to five to ten per cent annual inflation in
defence equipment costs.89
Most Indian analysts use budgetary estimates or in some cases
revised estimates to review budgetary changes. Actual expenditures is a
better metric than both of them as it shows how much money the defence
establishment is able to absorb and then the budget is increased over that
amount. Indian government began declaring actual expenditures in 2009.
The growth rate of defence budget over budgetary estimates is generally
lower than the one measured over actual expenditures, as the MoD and the
three services end up spending less than the budget that is allocated. Since
this study has used growth rates based on actual expenditures an important
qualifier for the higher growth rates could be that if accurate data for
military deflator is available or the data provided here is corrected for
inflation, the growth in defence budget would not seem so astounding.
In general, India underwent an economic boom from 2005-09, when
the inflation rate was low, fiscal deficit was not very wide and GDP was
growing at an average 9 per cent. Subsequently, even though the budget
has nearly doubled in nominal terms, its actual worth might be less.
In fact, the remarkable increase in India’s defence budget is not reflected in its revenue expenditures, which for most years as Figure 14
presents have been lower than the rate of inflation. Among other things,
this holds great implications for the Indian military’s operational preparedness especially when non-salary portions of this budget have also
gone through recursive cuts after allocation. The data provided here uses
88 E.R. Fetterly, “Problems Inherent in the International Comparison of Defence
Expenditure,” Canadian Military Journal (2007),
http://www.journal.forces.gc.ca/vo8/no1/doc/fetterly-eng.pdf. 89 Ajai Shukla, “Needed-Defence Budgeting Structures,” Business Standard, March 2,
2015, http://www.business-standard.com/article/opinion/ajai-shukla-needed-defence-
budgeting-structures-115030201355_1.html.

India’s Defence Budget and Armed Forces Modernisation: An Analysis
51
growth of allocation over actual expenditures, which takes account of the
under-spending or over-spending problem and also the mandatory
financial cuts:
Figure-14 CPI and Revenue Budget Growth Rate (2005-16)
Source: Data collated from the Ministry of Finance budgetary documents (2005-16).90
90 Ministry of Finance, GoI, “Union Budget”; Ministry of Finance, GoI, “Economic
Survey”; Ministry of Finance, GoI, http://finmin.nic.in/. .
2005-06
2006-07
2007-08
2008-09
2009-10
2010-11
2011-12
2012-13
2013-14
2014-15
2015-16
Rate of Inflation CPI 4.2 6.8 6.2 9.1 12.3 10.5 8.4 10.2 9.5 10.9 6.4Revenue Budget
Growth Rate 11.6 6 4.5 5.1 8.7 23.3 3.4 10.5 5 7.2 8.3
0
5
10
15
20
25
Rate of Inflation CPI Revenue Budget Growth Rate

Sobia Saeed Paracha
52
Figure 15 indicates the growth rate of capital expenditure in comparison to
the inflation rate in WPI terms:
Figure-15
WPI and Capital Budget Growth (2005-16)
Source: Data collated from the Ministry of Finance budgetary documents (2005-16).91
The story on the capital side is the opposite. Figure 15 shows that
the general growth rate of capital expenditures has remained much higher
than WPI inflation which means every year the defence establishment has
received on average 17.4 per cent additional funding for modernisation
and related procurements, while the inflation rate on average has remained
6.19 per cent.
Trends in Capital Budget (2005-15)
The general capital expenditure of India since 2005 has increased
threefold in nominal terms from INR 334 billion to INR 946 billion, with
an average growth rate of 18 per cent. In total, INR 6016 billion (~ USD
91 Ibid.

India’s Defence Budget and Armed Forces Modernisation: An Analysis
53
104.8 billion) 92
were allocated for capital expenditure in nominal terms
between 2005-15:
Figure-16 India’s Capital Expenditure (2005-16)
Source: Data collated from the Ministry of Finance budgetary documents (2005-16).93
The literature on India’s defence commentary suggests that the country generally spends nearly 70 per cent of its annual allocated capital
budget on direct and indirect imports.94
As discussed in the section on
budget structure, the capital budget caters for ‘expenditure on land, construction works, plant and machinery, equipment, tanks, naval vessels,
aircraft and aero-engines, dockyards, etc.’ About 1/3 of the actual spending on capital acquisition remains big ticket items, some of which
were delivered to India in the timeframe covered by this study. The SIPRI
arms transfer database indicates that approximately ~USD 32 billion (at
constant 1990 exchange rate) worth big ticket items have been delivered
to India from 15 countries over the last ten years. In terms of major
defence equipment procured, approximately 90 per cent of the stated
acquisitions were aircrafts, armoured vehicles, ships and missiles.
92 OANDA-Historical Currency Converter, accessed March 2016. Based on the average
conversion rate of USD to INR (at 57.4) over the last ten years. 93 Ministry of Finance, GoI, “Union Budget”; Ministry of Finance, GoI “Economic
Survey”; Ministry of Finance, GoI, http://finmin.nic.in/. 94 KPMG, Opportunities in the Indian Defence Sector: An Overview.

Sobia Saeed Paracha
54
Approximately USD 19 billion was spent on the purchase of aircrafts of
different kinds, ~USD 3 billion for missiles and ~ USD 3.5 billion for
ships:
Figure-17
India’s Major Defence Imports
Source: Data collated from the SIPRI Military Expenditure Database (1988-2015).95
This roughly leaves ~USD 33 billion for indirect imports of items
and/or allocations for committed liabilities and ~USD 27 billion for the
acquisition of land, infrastructure and procurements of weapons etc. from
domestic suppliers. Between 2005-14, INR 427 billion (~USD 6.8 billion)
was surrendered to the MoF as unspent, since actual spending was ~USD
90 billion. Figure 18 shows the amount surrendered and actual amount
spent of the total capital outlay of the last decade:
95 SIPRI, SIPRI Military Expenditure Database.
57%
2%
11%
0%
3%
10%
1% %%%4%
12% Aircraft
Air defence systems
Armoured vehicles
Artillery
Engines
Missiles
Naval weapons
Sensors
Ships

India’s Defence Budget and Armed Forces Modernisation: An Analysis
55
Figure-18 Capital Expenditure (2005-14)
Source: Data collated from the Ministry of Finance budgetary documents (2005-16).96
Figure 19 provides the capital expenditures of the three services from
2005-15. Out of 6,016 billion, INR 5850 was allocated for the three
services. Historically, the biggest portion of the capital budget was spent
on buying arms and equipment for the Army. During the 1970s, the
average ratio for capital allocation between the three services was: Army
(41 per cent), Navy (42 per cent) and Air Force (17 per cent). However,
this trend has now changed substantially. Since 2001, the Air Force and
Navy have been allocated bigger share in the modernisation budget.97
96 Ministry of Finance, GoI, “Union Budget”; Ministry of Finance, GoI “Economic
Survey”; Ministry of Finance, GoI, http://finmin.nic.in/. 97 N. Neihsial, “Defence Budget as a Strategic Tool of National Security” (comment,
Institute of Defence Studies and Analysis, New Delhi, 2008),
http://www.idsa.in/idsastrategiccomments/DefenceBudgetasaStrategicToolofNationalSe
curity_AKumar_230607.
93%
7%
Actual Expenditure
Amount surrendered

Sobia Saeed Paracha
56
Figure-19 Indian Military’s Capital Expenditure (2005-15)
Source: Data gathered from the annual reports of the Ministry of Defence, India98 for fiscal years
from 2005 to 2015 and compared with data gathered from the official budget documents
from Ministry of Finance, India.99
98 Ministry of Defence, GoI, http://www.mod.nic.in/#; Ministry of Finance, GoI, “Union
Budget,” accessed March 2016, http://indiabudget.nic.in/. 99 Ibid.

India’s Defence Budget and Armed Forces Modernisation: An Analysis
57
Figure-20 Services Share of Capital Expenditure
Source: Data collated from the Ministry of Finance budgetary documents (2005-16).100
India has imported military equipment from at least 20 countries as
direct imports. However, Russia, US, UK and Israel are its major
suppliers. The cumulative data shows that Russia overshadows the other
14 states as the biggest supplier of weapons and related technology. US,
Israel and UK emerge as distant second, third and fourth biggest suppliers.
Figure 21 shows the four biggest suppliers of arms to India based on the
amount spent by India on defence imports:
100 Ibid.

Sobia Saeed Paracha
58
Figure-21 Major Exporters of Defence Equipment to India
Source: Data collated from SIPRI Military Expenditure Database (1988-2015).101
From 2010 onwards, India began to diversify its sources of military
equipment. The data is skewed heavily towards Russia for cumulative
spending between 2005-14, but data generated from 2010 till 2014 shows
that US share jumped 20 per cent points, while Russia’s share went down17 per cent points (Figure 22):
Figure-22 Major Exporters of Defence Equipment to India (2010-14)
Source: Data collated from SIPRI Military Expenditure Database (1988-2015).102
101 SIPRI, SIPRI Military Expenditure Database 102
Ibid.
21.103, 77%
2.683, 10%
2.198, 8%
1.307, 5%
Russia
US
Israel
UK
9.8, 60%
4.94, 30%
1.2, 7% 0.43, 3%
Russia
US
Israel
UK

India’s Defence Budget and Armed Forces Modernisation: An Analysis
59
Since the government’s decision to increase or decrease its defence funding is based on multiple economic and non-economic factors, the data
highlights the extent of burden the Indian governments have been ready to
put on the economy for defence expenditures.
Trends in Revenue Expenditure
The general revenue expenditure of India since 2005 has increased
threefold in nominal terms from INR 486 billion to INR 1521 billion with
an average growth rate of 19 per cent. In sum INR 10219 billion (~ USD
178 billion)103
were allocated for revenue expenditure in nominal terms
between 2005-15. As mentioned before, a major portion of the revenue
budget includes funds for pays and personnel allowances, while the rest
provides for transportation, stores, works and other expenditure.
103 OANDA-Historical Currency Converter, accessed March 2016.
https://www.oanda.com/fx-for-business/historical-rates. Based on the average
conversion rate of USD from OANDA Corp (2005-15).


India’s Defence Budget and Armed Forces Modernisation: An Analysis
61
As shown in Figure 23, there is difference in the amount allocated
and amount actually spent. Between 2005-16, a sum of INR 11704 billion
was allocated for the revenue heads of the three services by the MoF. The
actual spending was ~INR 11782 billion.
Figure-24 Tri-Services Revenue Budget (2005-16)
Source: Data collated from the Ministry of Finance budgetary documents (2005-16).105
Figure 24 shows the revenue expenditures between 2005-16: out of
the INR 10219 billion, 9377.6 was allocated to the three services. Figure
25 highlights the share of tri-services in the total revenue outlay:
105 Ibid.
2005-06
2006-07
2007-08
2008-09
2009-10
2010-11
2011-12
2012-13
2013-14
2014-15
2015-16
Army 278 312 340 362 586 573 643 781 818 927 1041Navy 52 60 69.6 74 83.2 93.2 106 125 122 140 155Airforce 84.6 90.4 102 108 143 152 159 177 183 205 230
0
200
400
600
800
1000
1200

Sobia Saeed Paracha
62
Figure-25 Revenue Budget of Tri-Services
Source: Data collated from the Ministry of Finance budgetary documents (2005-16).106
In terms of personnel, the Army consists 85 per cent of the defence
forces. 37 per cent of the total revenue budget is allocated for pays and
allowances (P&A) - a major chunk of which is spent by the Army. Figure
26 indicates the budget allocations for P&A over the years:
106 Ibid.
71%
12%
17%
Army Navy Airforce


Sobia Saeed Paracha
64
Growth in the P&A head has not been proportionate to growth in
the overall defence budget. Before the Sixth Pay Commission P&A
constituted approximately 25 per cent of the total defence budget, and
nearly 46 per cent of the total revenue budget. It rose to 33 per cent after
the Commission. In 2013-14, it constituted 61 per cent of the revenue
budget and 36 per cent of the total defence budget. With the Seventh Pay
Commission in 2016-17, the P&A budget head is bound to grow
disproportionately again. The increase in P&A is not just because of rising
salaries and allowances, but also due to expansion in the number of
personnel. It is thought that if this trend continues, P&A will soon
account for 75 per cent of the revenue budget leaving nominal funds for
other major heads, ultimately impacting operational preparedness of the
Indian Armed Forces.107
107 Ghosh, “Defence Planning in India at Crossroads,” 88.


India’s Defence Budget and Armed Forces Modernisation: An Analysis
65
SSection III Doctrinal Evolution, Budget Growth
and Equipment Modernisation
n the 1990s, liberalisation and economic growth enhanced the
strategic relevance of India internationally and also provided the space
for higher funds for defence. This helped boost confidence of the
Indian military. Around the same time, technology-led revolution in
military affairs was manifested in Operation Desert Storm108
which caught
the interest of many defence forces around the world. Furthermore, South
Asia became home to two nuclear states. These factors instigated the
Indian military to modify its doctrines and equipment according to the
evolving strategic dynamics of the region.
India has practically distanced itself from Gandhian Pacifism and
Nehruvian Practical Idealism.109
In terms of defence, its military doctrines
and capabilities reflect a much more assertive and aggressive India than
that of the 1990s. Nevertheless, India’s capability to wage its rhetorical ‘two-front’ war with China and Pakistan simultaneously has been
challenged by many national and international scholars and policy
analysts.110
It is a generally held view that there is a lack of strategic
vision and the vision to effectively utilise the massive military power that
India possesses vis-à-vis its goals of coercing its neighbours and to
achieve its objectives to emerge as a global power.
India’s security problems, threat perceptions and context for a massive defence budget have been discussed previously, this section
highlights the correlation of India’s decade long drive for weapons
modernisation with its threat perception, doctrine(s), and identified
strategic goals by the political leadership. The doctrinal evolution,
108 Editor’s Note: When Iraqi leader Saddam Hussein invaded neighbouring Kuwait in
early August 1990, and defied United Nations Security Council demands to withdraw
from there by mid-January 1991, the Persian Gulf War began with a massive US-led
air offensive known as Operation Desert Storm. 109 Sreeram S. Chaulia, “India’s Foreign Policy and the ‘Realist Alternative’ to the
Nehruvian Tradition,” International Politics 39 (2002): 215-234. 110 Walter C. Ladwig III, “Indian Military Modernisation and Conventional Deterrence in
South Asia,” Journal of Strategic Studies 38, no.5 (2015): 729-772, doi:
10.1080/01402390.2015.1014473.
I

Sobia Saeed Paracha
66
budgetary allocation and capability enhancement of each of the three
services is discussed separately.
Army Modernisation and Budget Growth
Budget
The Army’s modernisation plans are directed by its evolving ‘Proactive
Defence Strategy’ or the oft-mentioned Cold Start Doctrine, growing
Chinese assertiveness in the border regions and an obsolete arms
inventory. With the changing security environment and inbuilt structural
deficiencies many experts suggest that the Army in general needs to
develop a force capable of quick deployment with built-in speed, massive
firepower and information dominance. To this end, the Army needs to
invest in tanks, Armoured Infantry Fighting Vehicles (AIFVs), missiles,
artillery and radars. The following paragraphs analyse the Army’s budgetary allocations, deployment and arms procurement patterns over the
last decade in view of its doctrinal security evolution.
Indian military is approximately 85 per cent Army, 10 per cent Air
Force and five per cent Navy.111
Since the numerical strength of the Army
has increased gradually from 110000 to 1150900 in 2016. Its budget has
increased threefold from INR 427 billion in 2005 to INR 1306 billion. As
shown earlier, a major portion of the Army’s budget in particular is spent on P&A of the troops from the revenue head. The balance of
capital/revenue expenditure is heavily tilted towards revenue expenditure,
where 77 per cent of the total budgetary allocations to the Indian Army
since 2005 has been spent on meeting day-to-day operational needs and
salaries. The modernisation budget has hovered around INR 110-266
billion (USD 1.7- 4.2 billion), with a growth rate of 1.4 per cent.
111 Behera, “All about Pay and Perks: India’s Defence Budget 2016-17.”

India’s Defence Budget and Armed Forces Modernisation: An Analysis
67
Figure-27 Indian Army’s Budget (2005-16)
Source: Data collated from the Ministry of Finance budgetary documents (2005-16).112
Figure-28 Head- to-Tail Ratio
Source: Ibid.113
112 Ministry of Finance, GoI, “Union Budget”; Ministry of Finance, GoI, “Economic
Survey”; Ministry of Finance, GoI, http://finmin.nic.in/. 113
Ibid.

Sobia Saeed Paracha
68
Doctrinal Evolution
Even though the Army’s pre-emptive defence strategy began to take shape
after the failure of Operation Parakram, its drive to play a more dominant
role in defence policy vis-à-vis Pakistan is not new. There have been at
least three phases in the Indian Army’s doctrinal and subsequent technological modernisation efforts according to Stephen Cohen. The first
phase began with the expansion of Indian Army from ten to twenty five
divisions immediately after independence.114
The trend continued slowly,
however, the 1962 debacle gave further impetus to expand and modernise
the Army. Air Force and Navy were largely ignored, the Navy was treated
as a Cinderella sister.115
In the post-1971 scenario, the defence doctrine
shaped into defensive defence and deterrence by denial.116
The second phase was during the stint of General Krishnaswamy
Sundarji, who was arguably the most ambitious Army General of India.
He converted the defence doctrine from defensive defence to conventional
counter-offensive and deterrence by punishment.117
Given the changing
nature of warfare and Pakistan’s imminent nuclear capability, the Army
aimed to arrest restraint of the political decision-makers and decapitate
Pakistan’s nuclear capability. By utilising mechanised armoured forces, the Army envisaged to break Pakistan into two parts near the Rahim Yar
Khan sector. This also led to the first crisis between India and Pakistan,
namely Brasstacks exercise with a nuclear backdrop. To date, there is still
controversy over the actual aims of the exercise. Nevertheless, General
Sundarji’s doctrine and policy of rearmament was fully backed by the
political leadership. During the second phase of modernisation, India
procured new tanks, armoured vehicles, missiles, attack helicopters etc.
The Bofors howitzers bought during this period ultimately cost Prime
Minister Rajiv Gandhi the next election, when a senior cabinet colleague
alleged corruption.118
This remained India’s strategic doctrine in the
114 Cohen and Dasgupta, Arming without Aiming, 54. 115 James R. Holmes, Andrew C. Winner and Toshi Yoshihara, Indian Naval Strategy in
the Twenty-First Century (Routledge: New York, 2009), 66. 116 Ali Ahmed, “The Interface of Strategic and War Fighting Doctrines in the India–
Pakistan Context,” Strategic Analysis 33, no. 5 (2009): 701-715, doi:
10.1080/09700160903064521. 117 Ibid. 118 “Rajiv Gandhi Wanted Bofors Money to Run Congress: Ex-CBI Chief,” Times of India,
November 14, 2013, http://timesofindia.indiatimes.com/india/Rajiv-Gandhi-wanted-
Bofors-money-to-run-Congress-Ex-CBI-chief/articleshow/25720914.cms.

India’s Defence Budget and Armed Forces Modernisation: An Analysis
69
nineties; however, the established conventional superiority of the eighties
began to erode due to reductions in the subsequent defence budgets.119
The Twentieth Century in South Asia ended with the nuclearisation
of India and Pakistan and Kargil War. Although, the Indian forces were
caught off guard during the Kargil War in terms of intelligence and
availability of choices to effectively deal with the problem of sub-
conventional warfare without disturbing nuclear deterrence, yet the
possibility of conventional war under the nuclear overhang got credence.
Consequently, this initiated an internal debate for limited war against
Pakistan in India.
The New-Delhi based Institute for Defence Studies and Analyses
(IDSA) organised a national conference titled ‘Dynamics of Limited War: Parameters and Options’ in 2000. The country’s senior leadership spoke at the conference and highlighted the evolving thought that a limited war
was possible in the backdrop of nuclear weapons. The Defence Minister
stated:
India had understood the dynamics of limited war after it
declared its nuclear weapons status. Nuclear weapons did not
make war obsolete but simply imposed another dimension on
the way warfare could be conducted.
The Army Chief General VP Malik also said:
We were able to keep Kargil War limited primarily due to
nuclear as well as conventional deterrence…Strategy adopted for Kargil, including the Line of Control constraints, may not
be applicable in the next war.120
These statements were considered the first prominent indicators of
India’s changing defence doctrines from deterrence by punishment to offensive and preemptive warfare. These statements were considered ill-
informed and irresponsible by other Indian strategists given the vague
definition of ‘Limited War’ that highlighted South Asia as a nuclear flashpoint.
121 Nevertheless, the concept of ‘Limited Warfare’ began to get
119 Shankar Roychowdhury, “The Struggle for Modernisation,” in Officially at Peace,
(New Delhi: Viking, 2002), 256-315. 120 Swaran Singh, “Indian Debate on Limited War Doctrine,” Strategic Analysis 23, no. 12
(2000): 2179-2185, doi:10.1080/09700160008455190. 121 Ahmed, “The Interface of Strategic and War Fighting Doctrines in the India–Pakistan
Context.”

Sobia Saeed Paracha
70
traction in South Asia, with support from the political and military
leadership of India.122
In wake of the terrorist attacks on its Parliament in 2008, India
mobilised and deployed half a million troops on the Indo-Pak border for
about a year. The mobilisation time of about three weeks for the Indian
forces from their peacetime locations to the borders deprived them of the
element of surprise against Pakistani forces that were on their wartime
defensive positions a week before the Indian troops were fully deployed.
Later, the Operation was considered the most punishing mistake of the
Armed Forces.123
With 800 soldiers dead and a cumulative cost of USD 2
billion, a year later India ended its ill-conceived military maneuver. Many
Indian strategic analysts concluded that India failed to achieve its stated
objectives, and only gained partial and ineffective concessions from
Pakistan.124
However, the Indian Army continued to look for military
‘solutions’ to the problem of terrorism and sub-conventional warfare
through conventional capabilities.
Operation Parakaram was marred with discrepancies ranging from
lack of political aim125
to availability of a complementing doctrine for the
proscribed operations. The two major problems that accelerated Indian
Army’s doctrinal modernisation were: 1) Phenomenal time required to
mobilise the onerous troop formations from central India to the borders;
and 2) absence of choices of action below Pakistan’s nuclear threshold.126
Indian Army is generally divided into seven commands and two types of
corps based on their roles i.e Holding or Defensive Corps and Strike
Corps. The three Strike Corps are deployed in Mathura, Ambala and
122 V.R. Raghavan, “Limited War and Nuclear Escalation in South Asia,” The
Nonproliferation Review 8, no. 3 (2001): 82–98. 123 “Operation Parakram was the Most Punishing Mistake,” Rediff.com, November 4,
2011, http://www.rediff.com/news/slide-show/slide-show-1-nuclear-mindset-we-have-
is-a-false-sense-of-security-admiral-sushil-kumar/20111104.htm#1. 124 Ali Ahmed, “Cold Start: The Life Cycle of a Doctrine,” Comparative Strategy 31, no.
5 (2012): 453-468, doi: 10.1080/01495933.2012.731964; Joshi, “India’s Military Instrument: A Doctrine Stillborn”; Sumit Ganguly and Michael R. Kraig, “The 2001–2002 Indo-Pakistani Crisis: Exposing the Limits of Coercive Diplomacy,” Security Studies 14, no. 2 (2005): 290-324, doi:10.1080/09636410500232958.
125 K. Subrahmanyam, quoted in Anit Mukherjee, “The Absent Dialogue,” Seminar,
accessed March 2016,
http://www.india-seminar.com/2009/599/599_anit_mukherjee.htm; Gurmeet Kanwal,
“Lost Opportunities in Operation Parakram,” Indian Defence Review, December 13,
2011, http://www.indiandefencereview.com/spotlights/lost-opportunities-in-operation-
parakram/. 126 Pant, “Indian Defence Policy at a Crossroads.”

India’s Defence Budget and Armed Forces Modernisation: An Analysis
71
Bhopal in central India. The Holding Corps mainly comprise of Infantry
and Mountain Divisions and armoured and artillery brigades. Seven
defensive Holding Corps are deployed closer to the border with Pakistan
(Northern, Western and South-Western commands).
Under General Sundarji’s doctrine, mobile Strike Corps centered on mechanised and armoured infantry divisions were created, which were
called Reorganised Plains Infantry Divisions (RAPIDs). These Corps were
created for deep strikes within Pakistan.127
The Holding Corps deployed
against Pakistan have an optimum offensive potential to cater to
Pakistan’s defensive offense doctrine and ancillary penetrations. The
Holding Corps, however, require reinforcements from the three Strike
Corps in case of a war, which causes a firebreak and tedious deployment
process denies the element of surprise. Since the pre-nuclear Sundarji
Doctrine premised on war of attrition, holding territory and deep strikes
within Pakistan, it naturally crossed Pakistan’s nuclear threshold. Operation Parakram was launched without due consideration of this basic
factor. Even though both India and Pakistan were on an eyeball to eyeball
confrontation, Indian policy of deterrence by punishment or compellence
lacked credibility.
Two years later (April 2004), the Indian Army announced a new
war doctrine called the ‘Cold Start Doctrine (CSD)’ based on limited goals and timeframe. The doctrine envisaged reorganisation of the Indian
army into eight division sized Integrated Battle Groups from the existing
three Strike Corps and Pivot Corps by reinforcing the Holding Corps with
more firepower and armour.128
This reflected Indian Army’s desire to move towards maneuver warfare from the traditional attrition and
defensive warfare as directed by the changed strategic environment. The
fundamental concepts of Cold Start were lethality, mobility and surprise.
The T90 or upgraded T-72 tanks formations were envisioned to attack
with artillery fire and close air support.
With the new strategic environment, the Indian Army’s war aims needed to be updated. The CSD envisions shallow territorial gains mainly
for post-conflict political leverage.129
It envisages network-centric warfare
127 Cohen and Dasgupta, Arming without Aiming, 5. 128 Walter C. Ladwig III, “A Cold Start for Hot Wars?” International Security 32, no. 3
(2007/2008): 158–190. 129 Ladwig III, “A Cold Start for Hot Wars?”; Jasjit Singh, “A Security Strategy for the
21st Century,” in Comprehensive Security for an Emerging India, ed. Kapil Kak (New
Delhi: Knowledge World Publishers, 2010), 16.

Sobia Saeed Paracha
72
and joint operations with the Air Force.130
A few commenters have also
mentioned breaking the Pakistan Army’s war waging potential to be one of its strategic aims. Inclusion of this as an aim of CS would again render
the doctrine ineffective by crossing one of Pakistan’s vaguely defined nuclear red lines and challenge nuclear deterrence effectively bringing
nuclear weapons back into war plans.
One of the assumptions of CSD is that the long deployment times of
Indian Army provide the international community, especially the US to
mount diplomatic pressure on political leadership. The political
leadership’s acquiescence to international diplomatic pressures are the main obstructions to India’s lack of a military response to sub-
conventional threats emerging from Pakistan. Once India becomes capable
of mobilisation within 72-96 hours and has acquired the capability to
deliver a strategic surprise, its limited war agenda would become more
feasible as the international community would not have ample time to
respond. However, among other things, the nature of civil-military
relations and bureaucracy, defensive mindset of the political elite,131
and
cumbersome procurement process have diluted the momentum for a
doctrinal shift. So much so that it never received political approval and
eventually the Army Chief in 2010 stated:
I think that “Cold Start” is just a term bandied about by think-
tanks and media. It is neither a doctrine nor a military term in
our glossary. There is nothing called “Cold Start”. As part of
our overall strategy, we have a number of contingencies and
options, depending on what the aggressor does. In the recent
years, we have been improving our systems with respect to
mobilisation, but our basic military posture is defensive.132
The public version of the Army Doctrine 2004 never directly
mentioned Cold Start. Even ‘Limited War’ is mentioned just once in a diagram that discusses entire spectrum of conflict from nuclear to sub-
conventional. However, the doctrine discusses many benefits that swift
130 Ahmed, “Cold Start: The Life Cycle of a Doctrine.” 131 Stephen P. Cohen and Sunil Dasgupta, “The Drag on India’s Military Growth” (brief
no. 176, Brookings, Washington, D.C., 2010),
https://www.brookings.edu/research/the-drag-on-indias-military-growth/. 132 Chung Min Lee, Fault Lines in a Rising Asia (Washington, D.C.: Brookings Institution
Press, 2016), 273.

India’s Defence Budget and Armed Forces Modernisation: An Analysis
73
mobilisation could accrue for India in a conflict.133
At a background press
briefing for journalists, one source used the term ‘Cold Start’ to describe the new thinking on speedy mobilisation so as to allow early use of force
in a conflict. This is where the term got its credence.
According to Ali Ahmed, the public posturing for CSD has mainly
three aims: prepare public opinion; build pressure on Pakistan’s security apparatus by indicating a build-up of Indian resolve and provision to the
government, seen as unnecessarily diffident, with the option of military
response.134
How successful India has been in achieving these aims is
widely debated. The current Chief of Army Staff (COAS) Bipin Rawat,
however, has broken the norm of denying that such a doctrine exists. He
stated in an interview that:
The Cold Start Doctrine exists for conventional military
operations. Whether we have to conduct conventional
operations for such strikes is a decision well-thought through,
involving the government and the Cabinet Committee on
Security.135
This statement was criticised for India is generally thought to lack
capability in terms of equipment, technology and inter-organisational
synchronisation to execute the CSD.136
The Army raised a new South Western command in 2005 and some
of its offensive units like RAPIDs, armoured and mechanised brigades etc.
were forward deployed with the Holding Corps. Supporting infrastructure
for prospective IBGs built. However, over the last decade since Cold Start
was announced, a slow evolutionary process has been in place for
modernisation without any evidence of a paradigm shift from the Sundarji
Doctrine of the 1980s. Strike Corps are still included in the annual
exercises, there is no evidence of a shift towards delegative command and
133 “Indian Army Doctrine 2004,” Headquarters Army Training Command Shimla,
October 2004, accessed March 2016,
https://www.files.eths.ch/isn/157030/India%202004.pdf. 134 Ahmed, “Cold Start: The Life Cycle of a Doctrine.” 135 Sandeep Unithan, “We will Cross Again,” India Today, January 4, 2017,
http://indiatoday.intoday.in/story/lt-general-bipin-rawat-surgical-strikes-indian-
army/1/849662.html. 136 Vipin Narang and Walter C. Ladwig III, “Taking ‘Cold Start’ out of the Freezer?”
Hindu, January 11, 2017, http://www.thehindu.com/opinion/lead/Taking-
%E2%80%98Cold-Start%E2%80%99-out-of-the-freeser/article17019025.ece.

Sobia Saeed Paracha
74
control than was in place before. The age limit for tactical command is
reduced, but this has created a pressure in the management of higher
cadres. The Army is too big in size to be called lean and mean as
envisaged by the CSD. At least one observer suggests that Indian Army is
pushing for joint warfare, especially based on close coordination with the
IAF, but it will resist any change that will affect its leading role in future
wars.137
The IAF in principle supports the concept of joint operations.
Both its doctrines of 1996 and 2012 discuss joint operations, however,
IAF ‘is more apprehensive about the methodology that may be adopted for development of a joint doctrine rather than the philosophy behind
evolving a joint doctrine.’138 The IAF has strongly resisted the Army
version of ‘jointness’ and the officials unofficially stated that ‘the days are over when IAF could be treated as a high technology artillery
regiment.’139
In the 80s, the aim of Indian Army doctrine was to preempt an
imminent nuclear deterrent of Pakistan by dissecting the country into two
parts and embarrassing the Pakistani Armed Forces. The early 90s were
spent in recovering from external adventures in Sri Lanka, Maldives etc.
and adjusting to a greater involvement in counterinsurgency operations in
Kashmir and elsewhere. As mentioned before, the Indian forces were also
carefully observing the technology-driven revolution in military affairs
exercised by the US and advocated higher defence spending and force
modernisation. With the advent of nuclear weapons, the main aims of
Indian defence apparatus vis-à-vis Pakistan became even more limited in
scope i.e. to deter Pakistan from conducting sub-conventional warfare and
compel it to dismantle the alleged proxy war related infrastructure within
the country.
In the later part of the last decade, two-front warfare also began to
get traction in doctrinal thinking. An emerging Indo-US strategic
partnership to contain China’s rise culminated in the controversial India-
specific waiver from the Nuclear Suppliers’ Group (NSG) and India’s arms deals worth billions of dollars with the US. Chinese Foreign
137 Cohen and Dasgupta, Arming without Aiming, 66. 138 Vino Anand, “Evolution of a Joint Doctrine for Indian Armed Forces” (Institute for
Defence Studies and Analysis, New Delhi, 2000), http://www.idsa-india.org/an-jul-
600.html. 139 Sandeep Dikshit, “IAF Unhappy with War Doctrine,” Hindu, November 24, 2004,
www.thehindu.com/2004/11/25/stories/2004112503051200.htm; and Cohen and
Dasgupta, Arming without Aiming, 80.

India’s Defence Budget and Armed Forces Modernisation: An Analysis
75
Ministry termed this as an Asian NATO in the offing.140
The border
disputes between India and China have not been resolved, while the
border demarcation agreements signed between 1993-96 are yet to be
implemented. China’s growing assertiveness in the Indian Ocean and aggressive patrolling in the border regions along the McMahon Line has
diverted India’s attention to the possibility of two-front war with China
and Pakistan. In 2008, the Indian Defence Minister directed the Indian
forces to prepare for a two-front war. The two-front doctrine stipulates
developing in the medium- to long- term a conventional superiority over
Pakistan and a capability to deter and if necessary defend against Chinese
aggression simultaneously.141
To this end, India has begun plans for
raising one additional mobile mountain Strike Corps of 64000 soldiers
that can be deployed quickly against China both in the North-East and
North West.142
Organisation, Commands and Deployments
There have been structural changes in the formation of the Army. It raised
one additional Strike Corps (in 2015) and 2 Holding Corps (in 2009). A
major qualitative change has been brought about in terms of maneuver
warfare and mobility, where India raised another two RAPIDs in 2015.143
Each RAPID is constituted of two mechanised infantry brigades, one
armoured brigade, one artillery brigade, one recon and support battalion,
one engineering regiment, one signals regiment and dedicated aviation
units.144
After restricting the existing forces Indian Army has changed the
composition of mechanised forces. There was only one mechanised
brigade in each of the four RAPIDs in 2009, 25 battalions and eight
independent brigades for mechanised operations. In 2010, one additional
mechanised brigade was included in each RAPID and the eight
independent brigades were replaced with two independent mechanised
brigades. In 2005, Indian mechanised forces were composed of four
brigades and 25 battalions (~8 brigades), while in 2015, its mechanised
140 Francine R. Frankel, “The Breakout of China-India Strategic Rivalry in Asia and the
Indian Ocean,” Journal of International Affairs 64, no. 2 (2011): 1-17. 141 Ibid. 142 Ibid. 143 International Institute for Strategic Studies, The Military Balance (2015). 144 Bharat Rakshak, Indian Army & Land Forces, “Artillery: Field Formations,” October
12, 2006, http://www.bharat-rakshak.com/ARMY/weapons/artillery/231-Field-
Formations.html; and data collated from The Military Balance issues of 2005 to 2016.

Sobia Saeed Paracha
76
forces are constituted of 14 mechanised brigades. RAPIDs have relatively
smaller manpower than infantry divisions and are deployed with the
Holding Corps in Kota (Punjab) and Bekaner (Rajasthan) and Strike
Corps in Sagar (Madhya Pradesh) and Dehradun (Haryana). RAPIDS
provide sufficient fire power, armour and flexibility for offensive
operations. They have been trained and equipped to adapt in nuclear,
biological, chemical (NBC) environments.145
Four RAPIDs are deployed
with Strike or Holding Corps in the Southern, Western and South Western
Commands with operational direction towards Pakistan.
Technically, the basic difference between a Strike (offensive) and a
Holding (defensive) Corps is the proportion of armour and mechanised
forces in it. The Holding Corps deployed in the Southern, Western and
South-Western commands have armoured brigades and RAPIDs. While
the three Strike Corps are centred on one armoured division and an
infantry division and either a RAPID or a mountain division. All the
Holding Corps deployed in the Southern, South Western or Western
commands have sufficient armoured and/or RAPID units to conduct
offensive operations, which is a development in line with the CSD that
envisaged transforming Holding Corps into highly mobile pivot corps
with enhanced firepower. For example, X Corps is a Holding Corps,
however, it is constituted by two RAPIDs, an infantry division, an
armoured brigade and an engineering brigade. The RAPID also has one
armoured brigade. Thus, X Corps has three armoured brigades, which is
about the size of a division. With this amount of fire power and
mechanised infantry, X Corps is technically an offensive corps deployed
closer to the border with Pakistan at Bhatinda. Similarly, the IX corps
which is also a Holding Corps, has three armoured brigades deployed at
Yoi-Hemachal Pradesh. Indian Army has three armoured divisions and
five independent armoured brigades based on almost 59 tank regiments.146
In sum, India has 15-17 armoured brigades. Of which at least eight are
deployed closer to Pakistan’s borders along with the Holding Corps. The rest are deployed with the Strike Corps also poised towards Pakistan.
145 SASSI, Three-day International Workshop on Indian Military’s Cold Start Doctrine
and its Implications for Strategic Stability in South Asia, report (Islamabad: South
Asian Strategic Stability Institute, 2010), 109. 146 CASS-India, “Half-Track: Can it Challenge Rival Armies?” (New Delhi: Center for
Asian Strategic Studies), March 2016,
http://www.cassindia.com/inner_page.php?id=40&&task=military.

India’s Defence Budget and Armed Forces Modernisation: An Analysis
77
With Chinese PLA’s modernisation and development of the border infrastructure, India is also strengthening its military formations in the
North-East. Two new divisions were raised in 2011-12, in Sakhama,
Nagaland (56 Mtn Div) and Misamari, Assam (71 Mtn Div).147
India has
deployed three corps in the Eastern command, which are purely defensive
in nature constituted by mountain and infantry divisions. It has 12
mountain divisions; out of which ten are deployed in the eastern and north
eastern sectors headquartered at Tespur-Assam, Dimapur-Nagaland and
Sillugri-West Bengal. The Chinese border incursion into Ladakh region in
2013 was termed as the Kargil of Twenty First Century by Bharatiya
Janata Party (BJP) leaders.148
Indian interior ministry reported at least 336
incursions within Indian claimed territory on the Indo-Chinese border.149
As a consequence, India decided to raise a new mountain Strike Corps.
The XVII Mountain Corps was established in 2014 with its interim
headquarters at Ranchi-Jharkhand. In 2013, the UPA government cleared
plans for a China-specific offensive corps to be manned by 80-90,000
troops for which INR 640 billion is to be allocated over seven years.150
However, the BJP government in the defence budget of 2014 cast doubts
on the financial feasibility of the new Strike Corps. It is believed that the
Army is cannibalising and restructuring its existing assets to develop the
new corps.151
The development of Indian Navy into a blue water navy is
thought to be a better deterrent against China than a geographically
limited offensive mountain Strike Corps. The fate of the newly established
XVII corps is too soon to be predicted. However, given the financial
crunch, competing modernisation programmes and PLA’s potential to mobilise 30 divisions in Tibet,
152 building an effective deterrent against
China will be a tedious task for the Army.
147 Rohit Vats, “Indian Army Disposition in North-East,” VatsRohit Blog, August 2, 2012,
http://vatsrohit.blogspot.com/2012/08/indian-army-disposition-in-north-east.html. 148 “Chinese Incursion may Snowball into Kargil-like Situation: BJP,” Economic Times,
May 1, 2013, http://articles.economictimes.indiatimes.com/2013-05-01/news/
38958060_1_chinese-incursions-pakistan-jail-indian-territory. 149 “Why Border Stand-offs between India and China are Increasing,” BBC News,
September 26, 2014, http://www.bbc.com/news/world-asia-india-29373304. 150 Amit Saksena, “India: XVII Mountain Corps” (New Delhi: Institute for Peace and
Conflict Studies, 2014), http://www.ipcs.org/article/india/india-xvii-mountain-corps-
4573.html. 151 Rajat Pandit, “Fund Crunch Hits Army’s New Strike Corps,” Times of India, April 16,
2015, http://timesofindia.indiatimes.com/india/Fund-crunch-hits-Armys-new-strike-
corps/articleshow/46940064.cms. 152 Ibid.

Sobia Saeed Paracha
78
Equipment and Platforms
India’s tank inventory has seen a significant change over the decade. In 2005, India had 4168 tanks of which 3978 were Main Battle Tanks
(MBTs). Existing inventory of 330 T-90s were planned to be expanded to
replace the obsolete Vijayanta and T-55. An agreement was signed
between India and Russia to assemble T-90s in India in 2005. The current
MBT inventory of India has 900+ T-90s, while the phased out models
have been placed in reserves. It had 1925 T-72 in 2005, which has now
increased to 1950 and an additional 124 Arjuns, which makes the total
2974+.153
In 2010, Army Chief General Deepak Kapoor stated that the
night vision capability of Indian tanks was only 20 per cent.154
The current
inventory of the T-72s which is the backbone of the armoured corps is
almost three decades old, which has remained operational with overhauls
and upgrades. In collaboration with the Israeli firm Elop-Elbit,
approximately 450 T-72s have been upgraded with improved night vision
capability, while an additional 550 upgrades were to be completed in the
2015-16 timeframe.155
With the induction of 900+ T-90s and T-72
upgrades, night vision capability has been enhanced to a great extent. The
project to develop manufacturing capacity to make 100 T-90s annually
was sanctioned in 2003 at the cost of INR 1 billion. This project was
completed in 2009-10 by the Ordnance Factories Board. This would help
India to phase out the T-72s in its inventory in due course and develop its
armoury based on T-90s primarily.156
India plans to induct 1640 T-90s by
2020.157
Another INR 1 billion project was sanctioned to manufacture 30
Arjun MBTs per year. This project was completed in 2011 and 45 tanks
were delivered to the Army. However, 15 were returned later due to
153 International Institute of Strategic Studies, The Military Balance (2016): 250-255. 154 Tamir Eshel, “1,600 Indian T-72s Slated for Night Vision Upgrades,” Defense Update,
January 10, 2013,
http://defense-update.com/20130110_night_vision_for_1600_indian_t72s.html. 155 “The Secret of T-72 Main Battle Tank’s Improved Night Vision,” Hindu, February 19,
2015, http://www.thehindu.com/news/cities/bangalore/the-secret-of-t72-main-battle-
tanks-improved-night-vision/article6911932.ece. 156 Ministry of Defence, GoI, Standing Committee on Defence, 16th Lok Sabha, Demands
for Grants (2014-2015), second report (Government of India, 2014),
http://164.100.47.193/lsscommittee/Defence/16_Defence_2.pdf. 157 “T-90S Main Battle Tank, Russia,” Army-Technology.com, accessed May 2016,
http://www.army-technology.com/projects/t90/.

India’s Defence Budget and Armed Forces Modernisation: An Analysis
79
defects. Currently, India deploys 124 Arjun tanks, which shows that the
rate of 30 tanks per annum has been maintained.
Interestingly, Indian Armoured Infantry Fighting Vehicle (AIFV)
inventory has decreased by 250 units, which should be an essential
element of the mechanised forces. India mainly uses different models of
Russian BMP (Boyevaya Mashina Pekhoty) which are all amphibious and
some have been upgraded to adapt with an NBC environment.158
These
would be extremely useful to traverse the formidable canal system in the
bordering regions of Pakistan and overcome geographical hurdles for the
CSD/Proactive Defence Strategy. Even though some upgrades have been
made and half of the BMP-I inventory was phased out in 2010, the
original plan of the Army was to replace all the obsolete BMP-1
technology by the BMP-II for its mechanised infantry battalions by late
2000s. There still is an inventory of 350 BMP-I, while the number of
BMP-II has also slightly decreased. India is indigenously manufacturing
the BMP-II, however, the Standing Committee on defence has observed in
its different reports that the Ordnance Factory Board has faced difficulties
in meeting its targets vis-à-vis BMP-II manufacturing.159
Half of the APC
inventory that was placed in reserves was also phased out in 2010. India
now possesses 336+ APCs about the same configuration as 2005.160
This
inventory may not be sufficient for high intensity strikes by the
prospective IBGs in a limited time frame.
Instead of modernisation, the artillery has actually depreciated in
number (from 12675+ to 9702+) without any significant qualitative
improvement or up-gradation. Around 2655 towed guns have been phased
out, including 1115 towed guns of 75mm calibre, without any replacement
bringing the total number of towed guns down to 2970+ (1350+ 105mm,
520 122mm, 600 130mm and 500 155 mm). The number of self-propelled
guns has also decreased significantly from 150+ to 20+. Some
improvement has been made in the Multiple Rocket Launcher (MRL)
inventory. The total number has increased by 12 units by procuring
300mm Smerch from Russia.161
Since the Bofors scandal, there has been
no significant artillery procurement. India has not bought a single
158 FAS, “BMP-1 Fighting Vehicle” (Washington, D.C.: Federation of American
Scientists, 1999), http://fas.org/man/dod-101/sys/land/row/bmp-1.htm. 159 Ministry of Defence, GoI, Standing Committee on Defence, 16th Lok Sabha, Demands
for Grants (2014-2015). 160 Comparison of data in The Military Balance issues of 2005 to 2016. 161 Ibid.

Sobia Saeed Paracha
80
howitzer in the last 26 years.162
It has around 300 Bofors in its kitty, while
most of its inventory is obsolete. Tenders were floated for 1580 towed
guns, 100 tracked guns and 180 wheeled and self-propelled guns of
155mm/52-calibre. The deal for procurement was cancelled after trials.
Similarly, India selected the M777 of the BEA systems, but the deal was
cancelled on the final stages due to charges of bribery which also
coincided with the planned shutdown of the M777 facilities by BAE
system. An agreement was signed with the Soltam of Israel to upgrade
the Russian M-46 from 130mm to 155mm. After an initial upgrade of 180
guns, Soltam was also blacklisted and the upgrades were halted.163
The
artillery modernisation plans are marred with myriad such examples. The
expanding infantry formations, especially for maneuver warfare and the
newly established mountain Strike Corps would be made redundant due to
insufficient artillery.
For information dominance and network-centric warfare, India has
to digitise the battlefield and develop capabilities for Early Warning,
Information Sharing, Reconnaissance, Surveillance and Target
Acquisition. For tactical early warning and ISR, India has inducted
approximately 14 Nishant and 12 Searcher MKII since 2005. The air
defence capability has not improved from the 2005 level. The SAM
inventory has decreased by 200 units due to phasing out of 200 SA-9
Gaskins. However, the number of land radars has increased threefold from
12+ to 38+. These developments can only be qualified as tiny steps
towards the goal of information dominance and network-centric warfare.
Indian Army’s Directorate General of Information Systems deals with this important element of Non-Contact Warfare. The heart of the
system is Command Information Decision Support System (CIDSS)
which comprises of Tactical Command Control Communications and
Information System (Tac C3I). The Artillery Combat Command and
Control System (ACCCS), Battlefield Surveillance System (BSS), Air
Defence Control & Reporting System (ADC&RS), Electronic Warfare
System (EWS) and Electronic Intelligence System (ELINT). The Tac C3I
is to provide state of the art connectivity from the Corps HQ and below.
Upward connectivity from Corps HQ to Army HQ is to be provided by the
162 B. S. Pawar, “Artillery Modernisation: A Reality Check,” Indian Defence Review 29,
no.1 (2014), http://www.indiandefencereview.com/news/artillery-modernisation-a-
reality-check/. 163 “Artillery Modernisation,” Indian Defence Review 29, no. 2 (2014),
http://www.indiandefencereview.com/news/artillery-modernisation/.

India’s Defence Budget and Armed Forces Modernisation: An Analysis
81
Army Strategic Operational Information Dissemination System
(ASTROIDS).164
However, the unit and sub-unit level connectivity still needs
attention. The Future Infantry Soldier As a System (F-INSAS)165
plan
should also provide soldiers with sensors, platforms and weapons systems
to have more synergised operations. India launched the Operation Shakti
to induct tactical command and control elements within the artillery
regiments/battalions.166
About ‘40 per cent of the artillery units are now equipped with state of the art network systems.’167
Army aviation was established in 1986 and can be an invaluable
asset due to its inherent flexibility, swiftness and firepower for the
Proactive Defence Strategy (PDS). Also, it can perform airlift,
surveillance and reconnaissance. However, little attention has been paid to
modernise this arm in the last ten years. India has reduced the number of
its helicopter squadrons from 17 to 14. Nevertheless, the number of utility
helicopters available has increased from 150 to 260. It also has inducted
three Rudra light attack helicopters. The previously available 12 Lancer
light attack helicopters are still in service.
Naval Modernisation and Budget Growth
Budget
Indian Navy is about 4.3 per cent of the total Indian Armed Forces and its
total number personnel increased from 55000 in 2005 to 58350 in 2016. In
sum, the Navy was allocated around 2921 billion which is 17.4 per cent of
the total defence expenditure of India from 2005 to 2015 in nominal
terms. Its budget increased more than two-folds over the last decade from
164 P. K. Chakravorty, “Indian Army: Modernisation and Current Status,” India Strategic,
January 2015, http://www.indiastrategic.in/topstories3648_Indian_Army_
Modernisation_and_Current_Status.htm. 165 B. S. Chauhan, “F-Insas Programme: Future Infantry Soldier as a System - A Reality
Check,” Indian Defence Review 30, no. 2 (2015),
http://www.indiandefencereview.com/news/f-insas-programme-future-infantry-soldier-
as-a-system-a-reality-check/. There were reports in early 2016 that this programme has
now been abandoned. 166 Aditi Malhotra, “Indian Army and Space: Sky is not the Limit” (New Delhi: Center for
Land Warfare Studies, 2012), http://www.claws.in/773/indian-army-and-space-sky-is-
not-the-limit-aditi-malhotra. html#sthash.3UhPQyFb.dpuf. 167 Chakravorty, “Indian Army: Modernisation and Current Status.”

Sobia Saeed Paracha
82
161 billion to INR 405 billion. The annual growth rate of the Navy’s budget has hovered around 15-18 per cent.
Unlike the Army, Navy’s budget is tilted towards capital
expenditure. Given its small size, revenue budget of the navy has been
lower than the capital budget for all the years studied. In the past few
years, the actual growth in Navy’s budget can be attributed more to its capital expenditure as demonstrated by Figure 29:
Figure-29 Navy Budget Outlay (2005-16)
Source: Data collated from the Ministry of Finance budgetary documents (2005-16).168
Out of the total 2921 billion, only 1080 was allocated for revenue and the
remaining 1840 was available for capital expenditure. As compared to the
Army, the pressure on pays and allowances head is low which allows for a
larger allocation for fuel and maintenance, resulting in higher operational
preparedness:
168 Ministry of Finance, GoI, “Union Budget”; Ministry of Finance, GoI “Economic
Survey”; Ministry of Finance, GoI, http://finmin.nic.in/.
0
100
200
300
400
500
Revenue Capital Total

India’s Defence Budget and Armed Forces Modernisation: An Analysis
83
Figure-30 Navy’s Capital Revenue Balance
Source: Data collated from the Ministry of Finance budgetary documents (2005-16).169
The Navy stands much more prominently in the geostrategic
planning of India as compared to the 90s and before. India previously had
the eighth largest navy in the world which has grown to be the fifth largest
today. The Defence Acquisition Council estimated the minimum need for
fulfilling the envisaged goals of the Navy to develop a fleet of 140 ships.
Since 2005, as directed by its general threat perception and other related
goals provided by the various versions of the naval doctrines, India has
increased the number of its naval commands from two to four. In 2005,
India had only Eastern and Western Fleets headquartered at
Vishakhapatnam and Mumbai. A new southern Command was raised in
2005 in Kerala, headquartered at Kochi (Cochin) 660 miles south of
Mumbai, giving a big boost to India’s power projection plans in the South
Indian Ocean. The establishment of the Andaman and Nicobar command
in 2009 significantly extended India’s presence in East Asia right at the mouth of the Strait of Malacca. The following figure provides the
extended areas of influence provided by the Four Naval Commands:
169 Ibid.
63%
37% Capital
Revenue
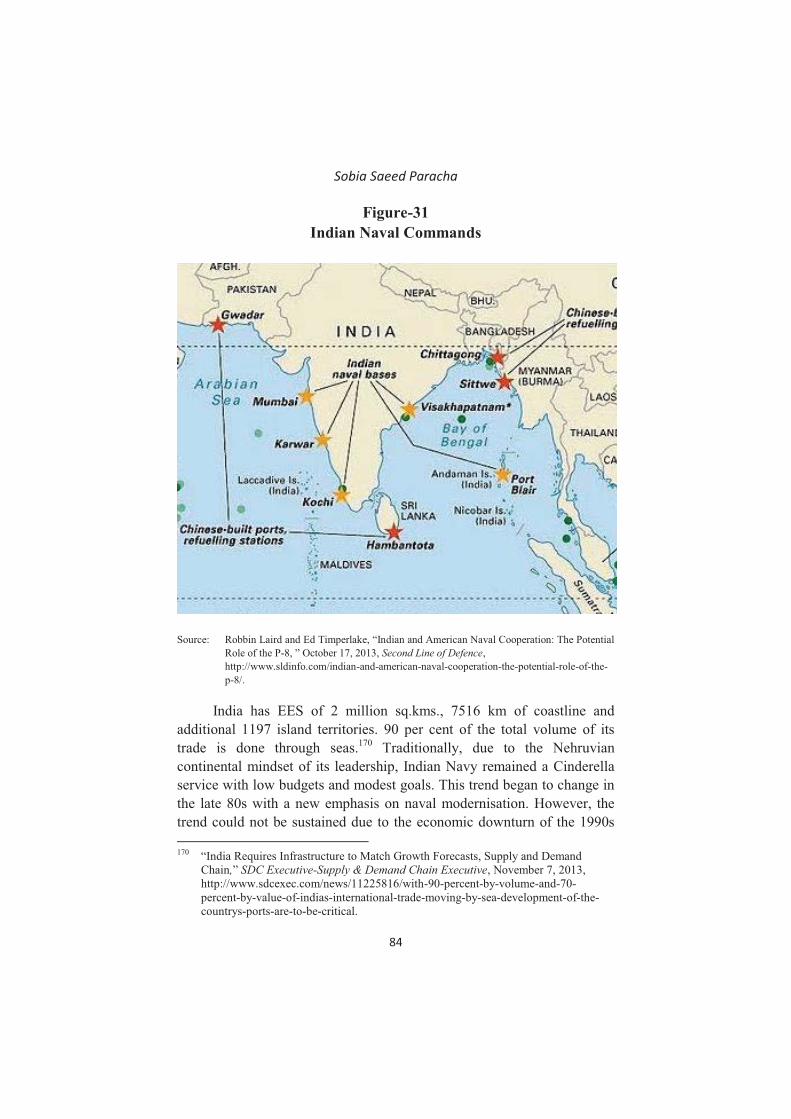
Sobia Saeed Paracha
84
Figure-31 Indian Naval Commands
Source: Robbin Laird and Ed Timperlake, “Indian and American Naval Cooperation: The Potential
Role of the P-8, ” October 17, 2013, Second Line of Defence,
http://www.sldinfo.com/indian-and-american-naval-cooperation-the-potential-role-of-the-
p-8/.
India has EES of 2 million sq.kms., 7516 km of coastline and
additional 1197 island territories. 90 per cent of the total volume of its
trade is done through seas.170
Traditionally, due to the Nehruvian
continental mindset of its leadership, Indian Navy remained a Cinderella
service with low budgets and modest goals. This trend began to change in
the late 80s with a new emphasis on naval modernisation. However, the
trend could not be sustained due to the economic downturn of the 1990s
170 “India Requires Infrastructure to Match Growth Forecasts, Supply and Demand
Chain,” SDC Executive-Supply & Demand Chain Executive, November 7, 2013,
http://www.sdcexec.com/news/11225816/with-90-percent-by-volume-and-70-
percent-by-value-of-indias-international-trade-moving-by-sea-development-of-the-
countrys-ports-are-to-be-critical.

India’s Defence Budget and Armed Forces Modernisation: An Analysis
85
and lack of a central political aim for the Indian Navy as concluded by the
renowned RAND study conducted by George Tanham in 1992.171
Doctrinal Evolution
In the later part of the 90s, all three services came up with their respective
doctrines. Indian Navy has published four major Doctrinal Statements
since 1998. Since 2004, Indian Naval policy documents had more
assertive and offensive overtones inspired by the ‘sea power framework’ of American Naval strategist Alfred Mahan. It sees itself as a
multidimensional force. Naval warfighting is but one of its several
roles.172
There are six basic principles of India’s Naval Strategy: increasing spending, expanding infrastructure, modernisation, active
maritime diplomacy, conducting naval exercises and deployment in IOR
(Indian Ocean Region) and Protecting SLOC.173
Additionally, the Indian Maritime Doctrine of 2009 adds six
important military roles for its Navy: 1) deterrence, 2) decisive military
victory, 3) maintaining territorial integrity, 4) protecting citizens and
offshore assets from seaborne threat, 5) influence battle on land, and 6)
protecting Sea Lines of Communication and related mercantile interests.
The Naval Doctrine emphasises investment in the development of forward
power projection capabilities and developing capabilities to influence
warfare on land. India currently has six LSTs (Landing Ship Tanks) and
capability to transport a brigade size force.174
These have been mainly
used for soft power projection and humanitarian missions.
In the beginning of the 1990s, India initiated its Look East Policy to
overcome its economic challenges. Over the years, Look East agenda has
been expanded to include security-related issues. Look East was
developed through a multipronged strategy to develop institutional
linkages for economic and defence engagement with countries like Japan,
Vietnam, Australia and Association of Southeast Asian
171 George K. Tanham, Indian Strategic Thought: An Interpretive Essay (Washington,
D.C.: Rand Corporation, 1992), accessed July 2016,
http://www.rand.org/content/dam/rand/pubs/reports/2007/R4207.pdf. 172 James R. Holmes, Andrew C. Winner, Toshi Yoshihara, Indian Naval Strategy in the
Twenty-First Century (New York: Routledge, 2009), 20. 173 Ibid. 174 Walter C. Ladwig III, “India and Military Power Projection: Will the Land of Gandhi
become a Conventional Great Power, Asian Survey 50, no. 6 (2010): 1162–1183,
http://users.ox.ac.uk/~mert1769/India%20Power%20Projection.pdf.

Sobia Saeed Paracha
86
Nations (ASEAN) countries.175
The driving factors of India’s naval modernisation are its look East Policy and growing Chinese assertiveness
in the IOR as much as a desire to project itself as a great power from
Straits of Malacca to the Gulf of Aden.
Plans to develop the biggest naval base of India go back to 1985,
when the foundation of Project Seabird was laid by the then Prime
Minister Rajiv Gandhi. The base was formally commissioned in 2005 at
Karwar, 300 km south of Mumbai after completion of phase one. The
project was envisaged to be developed in three phases. After completion
of the first phase, the base aimed to accommodate 11 warships and an
aircraft carrier.176
The second phase was completed in 2011, however, the
base’s Ship Lift and Transfer System could not carry platforms weighing more than 10000 tonne. Thus, aircraft carriers could not be docked on the
base.177
In 2015, the third phase of the project was inaugurated by
commissioning third naval establishment at Karwar. The INS Vajrakosh
would accommodate 50 warships and two aircraft carriers. Underground
pens for submarines are also being developed that will enhance their
stealth features.178
Among many others, power projection in the IOR is the most
ambitious goals advertised by various maritime strategy documents of
India. At the heart of the naval power projection lies the aim to influence
events on land as is also proclaimed in the Maritime Strategy Paper of
2007.179
At bare minimum, India needs aircraft carriers, supported by
advanced long-range surface fleet and submarines equipped with anti-ship
and Land-Attack Cruise Missiles (LACM) of optimum ranges, a strong
maritime surveillance network and patrol aircrafts, and preferably
175 Danielle Rajendram, “India’s New Asia-Pacific Policy: Modi Acts East” (Sydney:
Lowy Institute for International Policy, 2014),
http://www.lowyinstitute.org/files/indias-new-asia-pacific-strategy-modi-acts-east.pdf. 176 IISS, The Military Balance (2005). 177 G. M. Hiranandani, “Third Naval Base at Karwar,” Indian Defence Review, March 26,
2012, http://www.indiandefencereview.com/spotlights/third-naval-base-at-karwar/. 178 “Why INS Vajrakosh’s Commissioning is BIG Deal,” Rediff.com, September 10, 2015,
http://www.rediff.com/news/report/defence-news-why-ins-vajrakoshs-commissioning-
is-big-deal/20150910.htm. 179 Integrated Headquarters, Ministry of Defence (Navy), Freedom to Use the Seas:
India’s Maritime Military Strategy (New Delhi: Ministry of Defence, 2007),
https://www.indiannavy.nic.in/sites/default/files/Indian-Maritime-Doctrine-2009-
Updated-12Feb16.pdf.

India’s Defence Budget and Armed Forces Modernisation: An Analysis
87
amphibious landing ships. If long-range operations are envisaged, oilers
and hospital ships also should be a component of the fleet.180
Platforms and Weapons
Destroyers, Frigates and Corvettes
Indian Navy has spent huge sums on the modernisation of its surface fleet
and aviation, but the number of its principal surface combatants has
decreased from 54 in 2005 to 51 in 2016. More than half of the Indian
Navy surface fleet is more than 20 years old i.e. 32 out of the stated 51
platforms were inducted 20 years ago or in case of many, more than 30
years ago. However, qualitatively the fleet has notched up as all the
ageing corvette/frigates have been mainly replaced with destroyers or
guided missile frigates. The number of its destroyers has increased since
2005 from 8 to 12, with the induction of two Kolkata and three Shivalik
class destroyers. The Arnala, Nilgiri and Krishna class frigates have been
gradually phased out, while one Kamorta class and three more
technologically advanced Talwar II class frigates were inducted in 2013
and 2014. Similarly, 1 Vijay, 6 Vibhuti and 2 Veer class corvettes were
phased out. Another two Veer class have been modernised and pre-
designated as Prabal class corvettes.181
Some of the advanced platforms
added to the surface fleet are discussed below.
Under Project 15, three Delhi Class (Delhi, Meysore and Mumbai)
stealth destroyers were developed and integrated between 1997 and
2001.182
The project was initiated in 1977 and all the destroyers were built
indigenously by the Masagon Docks Limited based originally on a Soviet
design, but later on Western technologies were also incorporated. Project
15 A was approved in 2000 by the Cabinet Commission to develop 6800
tonne, Kolkata class (Kolkata, Kochi and Chennai) destroyers at a total
cost of INR 1.74 billion.183
It is an upgrade on Project 15. The Kolkata
180 Walter C. Ladwig III, “Military Power Projection in the Indian Context,” Journal of
the Centre for Land Warfare Studies (Winter 2009): 80-93,
http://www.claws.in/images/journals_doc/1399528848Walter%20Ladwig%20CJ%20
Winter%202009.pdf. 181 IISS, The Military Balance. Analysis of inventories provided in The Military Balance
between 1995 and 2016 as discussed. 182 Indian Navy, “Vikramaditya, Viraat, Delhi Class, Rajput Class, Kolkata Class,”
accessed July 2016, http://indiannavy.nic.in/content/vikramaditya-viraat-delhi-class-
rajput-class-kolkata-class. 183 IISS, The Military Balance (2015): 247-253.

Sobia Saeed Paracha
88
and Kochi class have already been inducted in the Navy and the third is
scheduled to be delivered. All the Kolkata class have been equipped with
the navalised version of BrahMos and have the capacity to carry two
Dhruv or Sea King multi-role helicopters. Also, the long-range SAM,
Barak-8/NG is jointly being developed by DRDO and Rafael IAI since
2006 and will be fitted on the Kolkata class after the current series of tests.
INS Kolkata has been deployed with the Western Fleet at Mumbai.184
The
Kolkata class is the largest (164 m) indigenously built ship in India, with a
range of 4500 nm and other specifications comparable to the ones
deployed by China and Japan.185
Project 15B to develop four upgraded
Kolkata II class destroyers with enhanced stealth features was
commissioned in 2011 to be delivered by 2017. The first
(Vishakhapatnam) was launched in 2015. The delivery date of the follow
on destroyers has been revised to 2024.186
Project 17 conceived in late 90s to indigenously build 12 Shivalik
class frigates and an additional seven frigates, possibly an upgrade of the
Shivalik Class, are to be built under Project 17A.187
Three stealth frigates
of Shivalik class (Shivalik, Satpura and Sahyadri) were built by the
Masagon docks at the initial cost of INR 8.1 billion. Production began in
2000. The first of the three frigates INS Shivalik entered service in 2010
and all three are in service currently. Shivalik is 143m long with a
displacement of 4500 tonne188
and is designated as a guided missile
destroyer by The Military Balance of IISS. All the Shivaliks are fitted
with Klub class anti-ship and BrahMos missiles with Barak-I air defence
system. Even though the Shivaliks were built indigenously, like the
Kolkata Class, it is also a combination of significant foreign and domestic
technologies. For example, one reason of delayed induction of the
Shivaliks was delayed clearance by the US government to install General
184 “PM Narendra Modi Inducts India’s Largest Indigenously Built Warship INS
Kolkata,” Economic Times, August 16, 2014,
http://articles.economictimes.indiatimes.com/2014-08-16/news/52873730_1_ins-
kolkata-kolkata-class-masagon-dockyards-limited. 185 IISS, The Military Balance (2016): 225. 186 “Project 15B Visakhapatnam-Class,” GlobalSecurity.org, accessed July 2016,
http://www.globalsecurity.org/military/world/india/d-project-15b.htm. 187 “India’s Project 17-A Stealth Frigates,” Defense Industry Daily, last modified February
23, 2015, http://www.defenseindustrydaily.com/india-issues-rfi-for-stealth-frigates-
02866/. 188 “Shivalik Class Frigates, India,” Naval Technology, accessed July 2016,
http://www.naval-technology.com/projects/shivalik-class-friga/.

India’s Defence Budget and Armed Forces Modernisation: An Analysis
89
Electric’s gas turbine engines on it.189 The cost of each Shivalik Class ship
was revised to be INR 26 billion (USD 650 million). In 2009, the Indian
Navy signed an agreement with the Masagon Docks and Garden Reach
Shipbuilders to develop seven additional Shivalik class frigates (Project
17-A) at a total cost of USD 9.2 billion.190
Three Talwar Class stealth frigates (Talwar, Trishul and Tabar)
were built by Russia and inducted with the Indian Navy between 2001 and
2004. All the three are equipped with ASW helicopters, Klub class anti-
ship missiles and Smerch 2 air defence system. In 2006, India signed a
deal with Yantar Shipyard to build additional three Talwar-II class frigates
(Teg, Tarkash and Trikand) last of which entered service in 2013. All the
Talwar-II are equipped with BrahMos supersonic cruise missiles.191
Aircraft Carriers
India currently has two air craft carriers in its fleet and has plans to induct
at least one more, a theoretical minimum requirement for developing a
Blue Water Navy. INS Vikramaditya is a 45000 tonne ex- Soviet Kiev
class air craft carrier, which entered service with the Soviet Navy in
1987.192
It has a complement of 12 MiG-29K and 6 KA-21 Helix A and
KA-31 Helix B ASW helicopters. An agreement was signed between
Russia and India to refurbish Admiral Gorshkov (INS Vikramditya) in
2004 at the cost of USD 974 million. In 2010, the cost of the aircraft
carrier was unilaterally revised to USD 2.3 billion by Russia. The delivery
was intended for 2008 originally, however, modernisation and repair
works was expanded beyond the scope of the original contract. This led to
delayed delivery in 2012, while some defects were pointed out during the
sea trials due to which entry into service was delayed till fall 2013.193
The
first dry docking and overhaul was planned for late 2016 by the
189 “Project 17 Shivalik Class Frigate,” GlobalSecurity.org, accessed July 2016,
http://www.globalsecurity.org/military/world/india/shivalik.htm. 190 Ibid. 191 “Talwar Class Guided Missile Frigate, India,” Naval Technology, accessed July 2016,
http://www.naval-technology.com/projects/talwarclassfrigate/. 192 “Admiral Gorshkov (Baku CVHG-103) Aircraft Carrier-Heavy Cruiser Ship,” accessed
July 2016,
http://www.militaryfactory.com/ships/detail.asp?ship_id=Admiral-Gorshkov-Baku-
CVHG103. 193 Ministry of Defence, GoI, Standing Committee on Defence, 16th Lok Sabha, Demands
for Grants (2014-15).

Sobia Saeed Paracha
90
indigenous/state owned ship building facilities.194
India’s second aircraft carrier INS Viraat was decommissioned in March 2017. Viraat was an ex
UK Hermes class aircraft carrier. It had a compliment of six Sea Harrier
Jets and Sea King ASW helicopters.195
After INS Viraat’s decommissioning, INS Vikramaditya is the Indian Navy’s only aircraft carrier until INS Vikrant comes on line.
The programme to indigenously build an aircraft carrier was
sanctioned in 2002. First launch of the ship was planned to be in 2010,
however, due to delay in provision of important prelaunch equipment like
gear boxes and 3 MW DG sets, the delivery date of the ship was revised to
2018 for sea trials.196
INS Vikrant is 262m long and displaces 40000
tonnes. It is a force multiplying platform which will be integrated into the
Navy’s network-centric operations. It has the capacity to station 30
aircrafts and the Navy plans to equip it with a mix of MiG 29K fulcrums
and Light Combat Aircraft (Tejas) which are underdevelopment
indigenously.197
In 2015, India’s plans to acquire a second Vikrant class aircraft carrier were widely reported. The IAC-2 (Indigenous Aircraft Carrier) is
christened INS Vishal, 300m long with displacement of 65000 tonnes.
The letter of request by the Navy suggests that the IAC will host 30-35
fixed-wing fighter aircrafts, 20 rotary wing aircrafts and will be propelled
by a nuclear reactor.198
If completed as envisaged Vikrant would be the
first non-Western carrier to field the catapult launched and arrest landing
system. There are chances of cooperation with the US Lockheed Martin
on this project viewing the undergoing broader strategic dialogue and US
194 Pranav Kulkarni “INS Vikramaditya Set for First Overhaul in September,” Indian
Express, December 8, 2015,
http://indianexpress.com/article/india/india-news-india/ins-vikramaditya-set-for-first-
overhaul-in-september/. 195 Vishnu Som, “The INS Viraat has Begun its Final Journey,” NDTV, January 20, 2016
http://www.ndtv.com/india-news/the-ins-viraat-has-begun-its-final-journey-1268077. 196 Ministry of Defence, GoI, Standing Committee on Defence, 16th Lok Sabha, Demands
for Grants (2014-2015). 197 “India Floats out its First Indigenous Aircraft Carrier INS Vikrant from Cochin,”
Defence Now, accessed July 2016, http://www.defencenow.com/news/449/india-
floats-out-its-first-indigenous-aircraft-carrier-ins-vikrant-from-cochin.html. 198 Sachary Keck, “India is Building Second Homegrown Aircraft Carrier,” The National
Interest Blog, July 20, 2015, http://nationalinterest.org/blog/the-buss/india-building-
second-homegrown-aircraft-carrier-13375.

India’s Defence Budget and Armed Forces Modernisation: An Analysis
91
growing interest in helping the Indian Navy tip the balance in the Indian
Ocean Region.199
Amphibious Vessels
For amphibious warfare, India has 10 ships including an INS Jalashwa, 4
Khumbir class and 5 Magar class. INS Jalashwa is an 8900 tonne, vintage
USS Trenton, Landing Platform Dock, which was first commissioned in
1971. It can carry around 1000 troops and 4 Landing Craft Mechanised
(LCM). India uses 4 LCM-8 with Jalashwa. Jalashwa was bought from the
US in 2007.200
INS Magar can carry around 15 MBTs and 500 troops.201
INS Khumbir are comparably very small landing ships that can carry 100
soldiers.202
Subsurface Fleet
India currently operates 14 diesel-electric submarines and one Akula Class
(INS Chakra; Russian Nerpa) nuclear-powered submarine. The backbone
of its naval fleet is its Russian Kilo class, Sindhughosh submarines; five of
which have been upgraded to be equipped with six Klub class cruise
missiles each. There are plans to equip the remaining five with the Klub
missiles too. India also deploys four Shishumar class German T-209/1500
midget subs, which were commissioned in 1986. All of them have
undergone refits and are deployed at Mumbai with the Western fleet. The
Shishumars make up the 10th submarine squadron of the Indian Navy.
203
Five tactical Kursura class (FSU Foxtrot) subs were phased out after
2005 and one of its Sindhughosh Kilo class sub (Sindhurakshak) sank in
its berth after catching fire due to accidental weapons detonations.204
More
199 Ankit Panda, “This US Technology could Give Indian Aircraft Carriers an Important
Edge,” Diplomat, April 6, 2015, http://thediplomat.com/2015/04/this-us-technology-
could-give-indian-aircraft-carriers-an-important-edge/. 200 Official Website of the US Navy, “Indian Navy Commissions INS Jalashwa at Naval
Station Norfolk,” June 22, 2007, http://www.navy.mil/submit/display.asp?story_id=30207.
201 IISS, The Military Balance (2016). 202 “L 22 Khumbhir Class (Sov Polnocny),” GlobalSecurity.org, accessed July 2016,
http://www.globalsecurity.org/military/world/india/l-kumbhir.htm. 203 NTI, “India Submarine Capabilities” (Washington, D.C.: Nuclear Threat Initiative,
2015), http://www.nti.org/analysis/articles/india-submarine-capabilities/. 204 Sruthijith Kurupichankandy and Rohit Chandavarkar, “Submarine INS Sindhurakshak
Sinks after Blasts; Shows Sub-Par Naval Abilities,” Economic Times, August 15, 2013,

Sobia Saeed Paracha
92
recently, the safety and reliability of India’s ageing submarine fleet has
been questioned by frequent major and minor accidents, which also led to
the resignation of the Naval Chief in 2014.205
In the wake of the ageing Shishumar class, there have been plans to
induct new diesel-electric submarines of French Scorpene class since the
late 90s (Project 75). However, an agreement was signed only in 2005 to
indigenously build six Scorpene class subs with France equipped with
Exocet missiles.206
The first submarine under this project was operational
by 2012. However, the project has been subjected to delays.207
The
Standing Committee of the 20th Lok Sabha noted that according to the
revised plan, first Scorpene will be delivered in September 2016 and will
be followed by an additional submarine every nine months after that. The
first submarine entered sea trials in May 2016 and second was launched in
early 2017. Also in 2007, the DAC approved Project 75-I that puts forth
plans to build six additional Scorpene class submarines partially in
Vishakhapatnam and Collaborator’s yard abroad.208 A tender is yet to be
floated for Project 75(I). India is also working on developing an
indigenous AIP (Air Independent Propulsion System) for its Scorpene
class subs. However, plans209
to equip, last two subs of the six Project 75
Scorpenes with indigenous AIP system have been shelved. one of the
reasons for not floating tenders for Project 75(I) was delays in the
development of indigenous AIP system as they were also marked to be
equipped with the indigenous AIP technology. This might help to expedite
the delayed acquisition process of the next 6 Scorpenes.210
http://articles.economictimes.indiatimes.com/2013-08-15/news/41413648_1_indian-
navy-navy-chief-indian-ocean. 205 Ankit Panda, “Indian Naval Chief Resigns Following Series of Accidents,” Diplomat,
February 28, 2014, http://thediplomat.com/2014/02/indian-naval-chief-resigns-
following-series-of-accidents/. 206 IISS, The Military Balance (2005). 207 Walter C. Ladwig III, “Drivers of Indian Naval Expansion,” in ed. Harsh V. Pant, The
Rise of Indian Navy, Internal Vulnerabilities (Burlington, VT: Asghate, 2012), 19-40. 208 Anil Jai Singh, “Whither Project 75(I)… and India’s Submarine Capability,” SP’s
Naval Forces, accessed July 2016,
http://www.spsnavalforces.com/story.asp?mid=40&id=7. 209 “Scorpene Submarine: Indigenous AIP will Increase Endurance of the Boats Being
Built,” Economic Times, July 19, 2015, accessed July 2016,
http://economictimes.indiatimes.com/news/defence/scorpene-submarine-indigenous-
aip-will-increase-endurance-of-the-boats-being-built/articleshow/48133011.cms. 210 Vivek Raghuvanshi, “Indian Navy not to Mount Homegrown AIP on Scorpene Subs,”
Defence News, October 26, 2016, http://www.defensenews.com/articles/indian-navy-
not-to-mount-homegrown-aip-on-scorpene-subs.

India’s Defence Budget and Armed Forces Modernisation: An Analysis
93
Maritime Aviation
The maritime aviation arm of the Navy has significantly expanded and
modernised since 2005. Indian Navy today has a fleet of 47 fighter
aircrafts as compared to 15 in 2005. All of its naval ground attack fighters
were the British Sea Harriers that were acquired along with the former
INS Viraat from UK. Five of the Sea Harriers were phased out and a
Squadron of 23 MiG-29 Fulcrums for its aircraft carriers and different
ASW aircrafts have been added. An agreement was signed between the
US and India to import eight P-8I Neptune for USD 2.2 billion from
Boeing in 2009. P-8I is an Indian variant of the US navy’s P-8A Poseidon.
Five of these have already been inducted in the Indian navy giving a
significant boost to its maritime ISR and long-range ASW capability.
Interestingly, the government or the Prime Minister have not
directly approved the Naval doctrines of India or its quest for Blue Water
Navy. The Indian government never articulated in the form of a strategic
document, its wishes to become a regional power or its willingness to
deploy force outside its territories.211
The Navy lacks ability to recover a
submarine from Blue Waters. Its efforts to recover the ill-fated
Sindhurakshak met serious challenges, even within a well-equipped
harbour. Indian Navy will need a great amount of logistic and
infrastructure support to be able to conduct operations in blue waters. For
the time being its main goal will have to be the protection of SLOC and
protection of its boundaries.
Air Force Modernisation and Budget Growth
Budget
In the last decade, the Air Force’s budget has increased twofold from INR 248.6 billion in 2005 to 567 billion in 2015-16. Air Force’s manpower was also reduced by 42000. Its total strength stood at 127200 in January
2016. Of the three services, IAF is the most capital (budget) intensive
service as shown in Figure 32:
211 Srinivasapuram Krishnaswamy, “India’s Defence Organisation: A Re-Orientation and
the Need for Change,” in Core Concerns in Indian Defence and the Imperatives for Reforms, ed. Vinod Misra (New Delhi: Pentagon Press, 2014), 5, 44.

Sobia Saeed Paracha
94
Figure-32 Indian Air Force Capital Revenue Balance
Source: Data collated from the Ministry of Finance budgetary documents (2005-16).212
Out of INR 4466 billion, only 1634 billion was allocated for
revenue and the remaining 2868.6 billion was available for capital
expenditure. Like the Navy, the pressure on pays and allowances head is
low which allows for a larger allocation for fuel and maintenance etc.
resulting in relatively higher operational preparedness (in monitory terms).
Figure 33 shows that there is a gradual increase in the revenue head, while
capital budget after 2009-10 has fluctuated:
212 Ministry of Finance, GoI, “Union Budget”; Ministry of Finance, GoI “Economic
Survey”; Ministry of Finance, GoI, http://finmin.nic.in/.
64%
36% Capital
Revenue

India’s Defence Budget and Armed Forces Modernisation: An Analysis
95
Figure-33 Indian Air Force Budget Outlay
Source: Data collated from the Ministry of Finance budgetary documents (2005-16).213
Doctrinal Evolution
In the pre-nuclearised phase, Indian IAF was thought to be a tactical air
defence force assuming only supportive roles in wars.214
Equipped with
state of the art aircrafts, the IAF’s potential to play a strategic role in the country’s defence policy was not recognised until mid-1990s. The IAF
had Mirage 2000s and Jaguars in its inventory which, essentially were
multirole aircrafts, yet it did not invest in complimentary electronic
warfare systems to convert them into strategic assets. The main roles
identified for IAF remained air defence and strike missions against
213 Ibid. 214 Zia ul Haque Shamsi, “Indian Air Force Modernisation Plan of 2020: Challenges for
Regional Air Forces Pakistan Air Force” (paper, Australian Government, Department of Defence, Canberra, 2012),
http://www.defence.gov.au/ADC/Publications/Commanders/2012/04_IAF%202020%20
AWC.pdf.
0
100
200
300
400
500
600
700
Capital Revenue Total

Sobia Saeed Paracha
96
Pakistan, close air support for the Indian Army, airlift, and strategic
reconnaissance.215
Its role became more pronounced in the post-nuclearisation scenario
since aircrafts were the primary resource available to India as a means of
delivery of nuclear weapons. All its prospective targets in Pakistan were
within the reach of its aircrafts and a conflict with China was also
imagined to be contained in certain physical boundaries. This empowered
the IAF to develop a proper doctrine and evolve into a moderate air
force.216
In 1995, the IAF came up with a declared doctrine that
emphasised air control and air superiority. It acknowledged deficiencies in
terms of force multipliers and depleting number of squadrons. The
underpinning motivation behind the doctrine was transition from tactical
to strategic operations.217
The doctrine highlighted the need for offensive
operations, strategic air defence, induction of force multipliers and
exploiting space as a continuation of the air medium.218
It advocated
qualitative improvement and modernisation that would also help to offset
the reduction in force levels by inducting aerial refueling, electronic
warfare and countermeasures, space based and modern command and
control technologies.219
With an imminent nuclear dimension to future combats, the Army
was envisioning small and swift wars with Pakistan, while the IAF’s doctrine emphasised deep strikes and strategic bombardment. Air Force’s new doctrine was criticised for its divergence from its previous roles as a
support arm for the Army as it was feared that joint operations would get
implicated.220
Later on, IAF had a limited but crucial role during the
Kargil War since the scope of operations was limited and horizontal
escalation was deliberately avoided. As opposed to the aforementioned
concerns vis-à-vis joint ops, the operations of Army and IAF were closely
coordinated.221
Besides this criticism, it can be argued that due to the
nature of air power it cannot be ignored from a limited war perspective.
The element of surprise is fundamental to a limited war and can influence
215 Tanham, Indian Strategic Thought: An Interpretive Essay. 216 Cohen and Dasgupta, Arming without Aiming, 77-96. 217 Raghavan, “Limited War and Nuclear Escalation in South Asia.” 218 Shamsi, “Indian Air Force Modernisation Plan of 2020: Challenges for Regional Air
Forces Pakistan Air Force.” 219 Tanham, Indian Strategic Thought: An Interpretive Essay. 220 Raghavan, “Limited War and Nuclear Escalation in South Asia.” 221 Benjamin S. Lambeth, “Airpower in India’s 1999 Kargil War,” Journal of Strategic
Studies 35, no.3 (2012): 289-316, doi: 10.1080/01402390.2012.665350.

India’s Defence Budget and Armed Forces Modernisation: An Analysis
97
the outcome of the war if the Air Force is suitably geared. With its
attributes of fire power and mobility that land or naval forces cannot
match, the Air Force can conduct surprise attacks. In case of a surprise
attack on itself, if the Air Force can maintain air superiority it can also
reverse tactical advantages of the adversary.
Controlled punitive strikes and surgical strikes became the buzzwords for
IAF operations against Pakistan in the next decade.222
In Table 3
renowned Indian strategist Jasjit Singh assesses the capacity of Indian
land, naval and air forces circa 2000 to ensure deterrence by denial and/or
punishment vis-à-vis Pakistan. Since then, the Air Force has been
modernised qualitatively and quantitatively to a much larger extent:
Table-3
Conventional Deterrence and Force Modernisation
Source: Singh, “Dynamics of Limited War.”
In 2012, the IAF released another doctrine document. The doctrine
talks about the concept of jointness and importance of joint operations
with other forces. IAF is criticised for planning in a limited scope and
redundant scenarios. In somewhat of a similar tone as CSD of the Army, it
is advocated that IAF should not be trying to deter a conventional attack
from Pakistan, for which Pakistan neither has the capability nor the desire.
The actual aim of the IAF should be to tackle Pakistan’s nuclear strategy and sub-conventional warfare under the nuclear over-hang.
223 Instead of
amassing superior forces, the doctrine of 2012 emphasised effects-based
operations inflicting strategic paralysis on the enemy. Nevertheless,
fielding a superior Air Force is important to avoid surprise and maintain
222 Singh, “Dynamics of Limited War.” 223 Ramesh V. Phadke, Air Power and National Security: Indian Air Force: Evolution,
Growth and Future (New Delhi: Pentagon Press, 2015), 163.
Service Deterrence by Denial
Deterrence by Punishment
Land Forces Yes No
Naval Forces Yes Limited
Air Forces Yes Yes

Sobia Saeed Paracha
98
favourable asymmetry. Electronic warfare equipment and other force
multipliers are a prerequisite for information dominance, battlefield
awareness and protection of friendly forces. The doctrine talks about
conducting independent and coordinated operations and building
capabilities for both. Strategic air campaign (bombing) and countering
enemy air campaign are the main independent goals of IAF. Counter-
surface force operations are basically tactical air support to friendly
forces. Figure 34 shows the main roles that IAF has recently identified for
itself in the basic doctrine of 2012:
Figure-34 Air Campaigns and Support Operations
Source: IAF, Basic Doctrine of the Indian Air Force 2012 (New Delhi: Indian Air Force,
2012), accessed July 2016,
http://indianairforce.nic.in/pdf/Basic%20Doctrine%20of%20the%20Indian%20
Air%20Force.pdf.
The three services now also think in terms of carrying out extra
regional operations, as much as guarding the territorial boundaries of the
country. In 2006, Air Chief Marshal Tayagi stated that:

India’s Defence Budget and Armed Forces Modernisation: An Analysis
99
The redrawn strategic boundaries of resurgent India could
extend from Gulf to the Straits of Malacca and from Central
Asian Republics to the Indian Ocean. The enlarged strategic
dimensions necessitate not only a radical change in our
strategic thinking but also accentuate the role of Aerospace
Power in the new security arena.224
Organisation, Commands and Deployments
The current number of fighter squadrons of IAF is in flux, as it is in the
middle of acquiring new aircrafts and phasing out ageing squadrons. India
had the lowest number of squadron aircrafts in 2009, when it phased out
its entire fleet of Mig-23s and new inductions were still in the pipeline.
There is a variation in the reported fighter squadrons currently deployed
by India between 31-37. Based purely on the number of aircraft per
squadron, theoretically, India currently possesses 37 squadrons.225
The
Military Balance reported the number of IAF fighter squadrons to be 36.
However, official sources have stated the current number of deployed
squadrons to be 31, while the sanctioned number is 42.226
For a possible two-front war with Pakistan and China, a minimum
of 45 squadrons is thought to be necessary. It has since 2005 invested
heavily in aircrafts of various kinds costing approximately 57 per cent of
the total defence imports which is around USD 16 billion. Most of this
money was spent by the IAF to induct state-of-the-art equipment and
platforms.
This has led to qualitative enhancement of the fleet by
induction of advanced aircrafts like the Su-30 MKI and phasing out of the
obsolete aircrafts like B(I) MK 58 Canberra, MiG-23 etc.
The total number of available combat capable aircrafts has risen by
123 from 758 in 2005 to 881 in 2016. However, in 2005 India had a bulk
of vintage aircrafts like the MiG-21 and Mig-23, while the current aircraft
composition of the fleet reflects an approximately 25 per cent point rise of
the Su-30 MKIs. This change is bringing a paradigm shift that was
envisaged by the leadership in the early 2000s. By the end of 12th Plan
224 Air Commodore Shashi Tayagi’s statement, quoted in “India to Protect Interests
beyond Border,” Dawn, August 24, 2006; Shamsi, “Indian Air Force Modernisation
Plan of 2020: Challenges for Regional Air Forces Pakistan Air Force.” 225 IISS, The Military Balance (2010). 226 Sudhi Ranjan Sen, “Indian Air Force has only 32 Squadrons - Lowest in a Decade,”
NDTV, February 26, 2016, http://www.ndtv.com/india-news/indian-air-force-has-only-
32-squadrons-lowest-in-a-decade-1281558.

Sobia Saeed Paracha
100
period (2012-17), IAF plans to have at least 40 per cent of its combat fleet
based on high-tech all-weather multirole platforms like FGFA (Fifth
Generation Fighter Aircraft), MMRCA (Medium Multi-Role Fighter
Aircraft) and upgraded Su-30MKI. This would further increase to 55 per
cent by the end of the 13th Plan and 65 per cent by the end of 14
th Plan.
227
The overall make-up of Indian combat capable aircrafts fleet along with
alternations in the last decade is provided in the figures below:
227 NAK Browne, “Air Power and the IAF’s Strategic Transformation” (speech, New
Delhi, September 23, 2013), Institute of Defence Studies and Analyses,
http://www.idsa.in/keyspeeches/AirPowerandtheIndianAirForce.


Sobia Saeed Paracha
102
Figure 36a: Aircraft Fleet Composition
Figure 36b: Aircraft Fleet Composition
Source: Data collated from various editions of The Military Balance (2005-16).
In 2005, IAF inducted its first batch of 30 Su-30 MKI Flankers out
of the 140 to be produced under license indigenously.228
In 2011-12, the
first two phases of the agreement were completed leading to the third and
fourth stage that involves domestic construction from raw material to
228 International Institute for Strategic Studies, The Miitary Balance (2016).
35%
13% 16%
10%
15%
6% 5%
Aircraft Composition of Fleet-2005
MiG-21
MiG-23
MiG-27
MiG-29
Jaguar
29%
16%
8% 13%
6%
28%
MiG-21
MiG-27
MiG-29
Jaguar
Mirage
Su-30 MKI

India’s Defence Budget and Armed Forces Modernisation: An Analysis
103
ensure technology absorption.229
Originally, the standard Su-30 MK were
imported from Russia, however, later Indian HAL entered in an agreement
with Irkutsk Aircraft Production Association to develop the upgraded
MKI versions, with thrust-vectoring engines and canard fore-planes.
Electronic systems from various countries are used in the MKI versions,
radars and ISRT sensors from Russia, heads up display and navigation
from Thales of France, electronic warfare system from Israel and some
Indian computers and related avionics.230
Between 2000 and 2005, India
developed only two squadrons of Su-30 MKI (42 MKI and 8 Su-30K).
Today, it forms the backbone of IAF’s multirole aircraft fleet with nine squadrons of MKI Flankers (~ 225 Su-30MKI).
231 India plans to induct
272 Su-30 MKIs by 2018.232
The Su-30 has an RoA (Radius of Action), much higher than in any
other aircraft that IAF has in its inventory and can carry up to 8,000 kg of
weapon load.233
This includes a range of air-to-surface missiles, including
Kh-29, Kh-3, Kh-59M and nuclear capable Nirbhay or BrahMos cruise
missiles and R-27R, R-73 and R-77 air-to-air missiles and other standoff
weapons. It has a maximum range of 3000 km without refueling and
8000km with air-to-air refueling.234
It is the most advanced aircraft
deployed so far in South Asia. More than three squadrons of the aircraft
have been deployed within 150 km from the border with Pakistan in Sirsa-
Haryana, Halwara-Punjab and Jodhpur-Rajasthan. Some squadrons have
also been deployed with Eastern command in Tespur and Chabua-Assam
along the borders with China, Bareilly-Uttar Pradesh and Pune-
Maharashtra.235
229 Ministry of Defence, GoI, Standing Committee on Defence, 16th Lok Sabha, Demands
for Grants. 230 For more details see, “India Ordered, Modernised, Perhaps Regrets Su-30MKIs,”
Defense Industry Daily, July 29, 2015, http://www.defenseindustrydaily.com/india-
ordering-modernising-su-30mkis-05852/ . 231 Analysis of the Indian Capabilities from The Military Balance issues of 2005 to 2016. 232 “India’s Eighth Sukhoi SU-30 Combat Jet Squadron by December,” Deccan Herald,
September 26, 2012, http://www.deccanherald.com/content/281231/indias-eighth-
sukhoi-su-30.html. 233 Phadke, Air Power and National Security: Indian Air Force, 155. 234 “Su-30MKI Multirole Fighter Aircraft, India,” Air Force Technology, accessed August
2016, http://www.airforce-technology.com/projects/su-30mki-multirole-fighter-
aircraft-india/. 235 “IAF’s Eighth Su-30 MKI Squadron to Come up by December near Indo-Pak Border
in Haryana,” Defence Now, accessed August 2016,
http://www.defencenow.com/news/933/iafs-eighth-su-30-mki-squadron-to-come-up-
by-december-near-indo-pak-border-in-haryana.html.

Sobia Saeed Paracha
104
The pilots flying hours dipped to 120 hours per year due to
unavailability of spares as a consequence of over dependence in Erstwhile
Soviet Union during the 1990s. IAF has been able to maintain 180 flying
hours per year since the last decade.236
For some time, India has been
striving to enhance the serviceability and operational preparedness of its
combat aircrafts. A recent agreement with Russia will allow it to get
spares within 30 days instead of twelve months for Su-30 MKI. This will
help to increase the availability of aircrafts by 75 per cent.237
60 of India’s MiG-29B were inducted between 1986 and 1996 and
all its MiG-21s (226) and MiG-27 (164) were inducted in the 1960s and
1970s. In 2005, it had about 74 MiG-29B fulcrums, which were planned
to be upgraded along with the refurbishment of its 40 MiG 27 and 125
MiG 21s.238
In 2012, India signed an agreement with RSK to upgrade its
MiG-29 Fulcrums to MiG-UPG standards with advanced radars and
cockpit avionics for USD 900 million.239
In 2013, India signed an
agreement with Russia to build a refit and maintenance centre for MiGs in
India for USD 40 million. This would allow quick and easy serviceability
of its aircrafts increasing their availability.240
It was recently reported that
India now plans to phase out three squadrons of its Mig-21 Bisons and
MiG-27 Flogger and replace them with one squadron of Su-30 MKI.241
It was expected that the indigenous Light Combat Aircraft (LCA)
Tejas, would gradually replace numerous MiG variants that need phasing
out. Even though the LCA made its first flight in February 2001, its Initial
Operational Clearance (IOC) was reached in December 2013. The
progress of the indigenous aircraft has been slow and marred by delays.
India currently has one Tejas Limited Series Production in its inventory.
40 LCA Tejas fighters have been ordered by the IAF that are now under
the process of manufacture at HAL.
236 Cohen and Dasgupta, Arming without Aiming, 79. 237 Manu Pubby, “India, Russia to Sign Pact on Spares for Su 30 Fleet, Availability could
Go up to 75%,” Economic Times, December 7, 2015,
http://economictimes.indiatimes.com/news/defence/india-russia-to-sign-pact-on-
spares-for-su-30-fleet-availability-could-go-up-to-75/articleshow/50075387.cms. 238 IISS, The Military Balance (2005): 236-240. 239 IISS, The Military Balance (2012): 243-247. 240 “India’s Fighter Modernisation: Add MiG-29s to the List,” Defence Industry Daily,
August 29, 2013, http://www.defenseindustrydaily.com/indias-fighter-modernisation-
add-mig29s-to-the-list-updated-01879/. 241 “Three MiG 21, MiG 27 Squadrons to be Phased out by IAF this Year,” Economic
Times, June 28, 2015, http://economictimes.indiatimes.com/news/defence/three-mig-
21-mig-27-squadrons-to-be-phased-out-by-iaf-this-year/articleshow/47849954.cms.

India’s Defence Budget and Armed Forces Modernisation: An Analysis
105
Since 2000, the IAF has been interested in replacing MiGs fleet
with an MRCA, instead of midlife upgrades. The MiGs have been
involved in multiple accidents since the 70s casting doubts on the safety
and reliability of these aircrafts. The first Request for Information was
issued in 2001 by IAF. In 2007, the government finally cleared to open
international bidding for the project to procure 126 MMRCA for USD 6.2
billion at that time (later the price increased to be USD 10 billion). The
original plan was to buy 18 ready to fly aircrafts and build the remaining
indigenously with 50 per cent off sets and transfer of technology. 242
Russia’s MiG-35(RAC MiG), Swedish JAS-39 (Gripen), Dassault Rafale
(France), American F-16 Falcon (Lockheed Martin), Boeing’s F/A-18
Super Hornet and EADS’ Eurofighter Typhoon were the main contenders. In 2012, French Dassault’s Rafale was selected and the company entered
into negotiations exclusively with the Indian government. The cost of each
aircraft is about USD 80 million and is expected to stay in service for 40
years.243
In 2013, the Standing Committee on defence noted the need for
INR 150 billion annually to continue the aircraft deal. In 2014, the deal
was put on hold due to lack of funds. In 2016, however, India signed an
agreement with the French government to buy 36 ready to fly Rafales with
50 per cent off-sets. However, the plan to build the remaining aircrafts
indigenously has been suspended. The delivery of the aircrafts is expected
in 2018.244
The Mig-21s operational life was extended due to absence of viable
options domestically and procurement delays. A similar path will be
chosen for the MiG-29, Jaguar and Mirage-2000, which have undergone
extensive upgrades in the last decade and all are slated for further
upgrades.245
For some time, the Su-30 MKI will be the mainstay of all
Indian combat related operations that are being procured in sizeable
numbers.
In the past ten years, India’s attack helicopter inventory has not changed much, however, the number of squadrons detailed with Mi-25
242 Press Information Bureau, GoI, “Request for Proposal for 126 Medium Multi-Role
Combat Aircraft Issued,” August 28 2007, http://pib.nic.in/newsite/erelease.aspx?relid=30522.
243 Cohen and Dasgupta, Arming without Aiming, 83. 244 “India Confirms Order for IAF’s Rafale Deal with France,” Economic Times, January
4, 2016, http://economictimes.indiatimes.com/news/defence/india-confirms-order-for-
iafs-rafale-deal-with-france/articleshow/50443377.cms. 245 Ramesh.V. Phadke, “Response Options: Future of Indian Air Power Vision 2020,”
Strategic Analysis 24, no.10 (2001): 1795-1812, doi: 10.1080/09700160108455321.

Sobia Saeed Paracha
106
and Mi-35 Hind have reduced to two from three.246
There has been a move
to induct Boeing AH-64 Apache since many years. An international tender
was floated in 2011 and then cancelled in 2012 to acquire 22 Apache
attack helicopters. In September 2015, India signed a deal with the US to
acquire 15 Chinook heavy-lift helicopters and 22 Apache attack
helicopters, worth USD 2.5 billion.247
Both the Mi-25 and Mi-35 are
multirole assault helicopters and not purely attack helicopters.248
Apache
is thought to be the most lethal helicopter, which has been tested in both
the Iraq and Afghanistan war. It can detect 256 moving targets and has an
all-weather 24x7 operability.249
Table 4 provides the list of aircrafts
available in India’s multirole/transport inventory and its helicopters:
Table-4 India’s Air Fleet
Year Mi-8 Mi-17 V Mi-17 Mi-26 Halo
SA-315B-Cheetah
SA 316B-Chetak
2005-06 43 0 100 10 60 0
2016-17 30 149 80 4 59 40
Source: Based on data collated from various issues of The Military Balance (2005-16).
India’s transportation aircraft inventory has been transformed, with reduction in the number of its ageing aircrafts like the HS-748 Avro, An-
32 and Do-228. On the other hand, it has inducted state-of-the-art heavy
246 Data collated from The Military Balance issues of 2005 to 2016. 247 Josy Joseph, “India Signs Deal with Boeing to Purchase Apache, Chinook
Helicopters,” Hindu, September 28, 2015,
http://www.thehindu.com/news/national/india-to-purchase-apache-chinook-
helicopters-from-us/article7698989.ece. 248 Manu Pubby, “Here is Why Apache and Chinook Helicopters are Game Changers for
India,”Economic Times, September 23, 2015,
http://economictimes.indiatimes.com/news/defence/here-is-why-apache-and-chinook-
helicopters-are-game-changers-for-india/articleshow/49067786.cms. 249 “IAF Selects Boeing’s Apache Longbow Combat Helicopter,” India Strategic,
October 2011,
http://www.indiastrategic.in/topstories1230_IAF_selects_Boeing_Apache.htm.

India’s Defence Budget and Armed Forces Modernisation: An Analysis
107
lifters like Boeing C-17A Globemaster-III and Lockheed Martin C-130 J
Super Hercules.
India signed the USD 1.1 billion deal with Lokheed Martin in 2008
to buy six C-130 J Hercules transport aircrafts meant for special
operations. The induction of the aircrafts began in 2011 and all six were
inducted in the inventory. One of the C-130 J crashed during a training
mission in 2014. This was the second crash of the J-model aircraft in the
world. The first batch of the six C-13 Js were deployed on the Hindon Air
Base, the largest airbase in Asia.250
India has also signed a deal with
Lockheed Martin to buy another six C-130 Js, to be delivered around
2020.251
To ensure higher operational readiness of its C-130 J fleet in the
Eastern and Western sectors, it is expected that India will deploy its new
crafts on the Panagarh airbase in West Bengal.252
The C-130 J at
Panagarh, will help to enhance mobility of the Mountain Strike Corps that
India is in the process of raising. As a subtle show of strength IAF landed
a C-130 J at the Daulat Beg Oldi airstrip in Laddakh. Daulat Beg oversees
the Karakoram Highway between Pakistan and China. Given the strategic
importance of its location, IAF is likely to develop the airfield to operate
fixed wing heavy and medium lift transport aircrafts.253
India also signed a USD 4.1 billion deal to acquire ten Boeing C-17
Globemaster III heavy lifters, first of which was delivered in 2013. It was
possible under the agreement for India to buy another six C-17s under the
deal signed in 2011. Due to lengthy procurement procedures, it could not
buy them before Boeing announced to close down the production line.
Boeing has only one more aircraft left to sell now.254
India remains the
biggest buyer of these aircrafts in the world. A C-17 Globemaster III can:
250 “Indian Air Force Investigates C-130J Crash,” Aviation Week, April 1, 2014,
http://aviationweek.com/military-government/indian-air-force-investigates-c-130j-
crash. 251 “India Buys C-130J-30 Hercules for Special Forces,” Defence Industry Daily, July 22,
2014,
http://www.defenseindustrydaily.com/india-to-purchase-6-c130j-hercules-for-special-
forces-02224/#. 252 “Panagarh: Six Facts about IAF’s Latest Hub for C-130J Super Hercules Planes,”
Economic Times, August 6, 2015,
http://economictimes.indiatimes.com/news/defence/panagarh-six-facts-about-iafs-
latest-hub-for-c-130j-super-hercules-planes/articleshow/48375234.cms. 253 B.K. Pandey, “Historic Landing by IAF C-130J at Daulat Beg Oldie,” SP’s Aviation,
no. 9 (2013), http://www.sps-aviation.com/story_issue.asp?Article=1297. 254 Manu Pubby, “IAF Clears Proposal to Buy Three C 17; Boeing Says only One Plane
Left to Sell,” Economic Times, August 17, 2015,

Sobia Saeed Paracha
108
Take off from a 7,600-ft. airfield, carry a payload of 160,000
pounds, fly 2,400 nautical miles, refuel while in flight
and land in 3,000 ft. or less on a small unpaved or paved
airfield in day or night. Drop a single 60,000-lb. payload, with
sequential load drops of 110,000 lb. and back up a two per
cent slope.255
India’s current fleet of C-17 provides it strategic airlift capability.
IAF currently fields five Early Warning Platforms, three IA-50EI and two
Embraer’s ERJ-145s. It plans to induct ten more Phalcon AWACS till
2020.256
The government signed a USD 1.1 billion deal with Russia and
Israel in 2004 to acquire three A-50 EI Early Warning aircrafts based on
the Israeli Phalcon AWACS mounted on the Russian Il-76 heavy lifter
aircraft. Three AWACs were delivered to India between 2009-11. In
March 2016, the Cabinet Committee on Security cleared a special budget
of USD 1.2 billion to purchase two additional Phalcon AWACS from
Israel and upgraded Il-76 transport Aircrafts from Uzbekistan.257
The
AWACS have significantly improved India’s early warning capability against cruise missile and other aerial threats. AWACS are a pivotal
technology for future war scenarios based on network- centric operations
of the IAF. It monitors huge swathes of airspace, can log radar
frequencies, intercept enemy communications, conduct ground
surveillance and help integrate command and control.
The EMB-145 is a joint venture between Brazil and India. Brazil’s Embraer provided the basic jets, mounted the radar and other electronic
systems on the jet and maintains the integration of various systems in the
aircrafts. The Indian DRDO has provided the radar. Two aircrafts are
under testing and have logged 200 sorties and more than 350 flying
http://economictimes.indiatimes.com/news/defence/iaf-clears-proposal-to-buy-three-
c-17-boeing-says-only-one-plane-left-to-sell/articleshow/48506624.cms. 255 “C-17 Globemaster III: Delivering India’s Military and Humanitarian Airlift
Capabilities,” Boeing India, accessed August 2016,
http://www.boeing.co.in/products-and-services/defense-space-and-security/boeing-
defense-space-and-security-in-india/C-17-Globemaster.page. 256 Gulshan Luthra, “India Developing AWACS: Boeing 767 or Airbus A330 will be the
Platform,” India Strategic, January 2014,
http://www.indiastrategic.in/topstories3153_India_developing_AWACS.htm. 257 Arie Egosi, “India Approves Funding for two more II-76 AEW Aircraft,” Flight
Global, March 11, 2016, https://www.flightglobal.com/news/articles/india-approves-
funding-for-two-more-il-76-aew-aircra-423026/.

India’s Defence Budget and Armed Forces Modernisation: An Analysis
109
hours.258
Another aircraft is under production presently as reported by the
IISS Military Balance.
258 “Surya’s Chariots: India’s AWACS Programmes,” Defence Industry Daily, March 3,
2016, http://www.defenseindustrydaily.com/indian-awacs-moving-forward-on-2-
fronts-04855/.


India’s Defence Budget and Armed Forces Modernisation: An Analysis
111
Conclusion
lthough the growth of India’s defence budget is remarkable, it is not unrestrained because of fiscal constraints rather than the
political aim to prevent militarisation of the South Asia region.
With a growing economy, India’s military is bound to expand with little consideration for the impact this can have on regional security. Despite
being situated in the middle of a relatively stable neighbourhood, India
today is a much more aggressive state than its founding principles of
‘Nehruvian Practical Idealism’ and ‘Gandhian Pacifism’. Its current force posture reflects a much more assertive India than that of the 1990s.
There is little doubt today that India’s significant defence budget is
helping expand its military might. This, however, does not settle the
debate on the effectiveness of the said military capability in terms of
achieving the strategic goals of the country. One of the reasons why
India’s military capability is not seen as successful is the absence of
strategic direction for the massive military it possesses. The ad-hocism of
its general strategic policy might be debatable in other arenas, but against
Pakistan the Indian Army has always pushed to create practical options of
deterrence, compellence and domination. Post-nuclearisation and Kargil
War, the Indian Army has relentlessly tried to adapt to sub-conventional
threats and the changing capability matrix of Pakistan mainly brought
about by the latter’s nuclear capability. Nevertheless, India still has a long
way to go, in terms of fighting a two-front war with Pakistan and China
simultaneously.
General Sundarji in the 1980s transformed the Indian Army’s war doctrine from defensive defense to conventional counter-offensive and
deterrence by punishment. The current Indian doctrine is a hybrid of both
Cold Start and Sundarji doctrine. The massive military modernisation
drive has brought it halfway to its quest for the capability to conduct
future wars with Pakistan under Proactive Defence or CSD. The CS
Doctrine is also debated, ‘as a parochial Army effort without the benefit of strong political direction.’259
259 Cohen and Dasgupta, Arming without Aiming, 56.
A

Sobia Saeed Paracha
112
The efforts of the Indian Army over a decade have not brought
about the envisaged doctrinal shift due to the nature of civil-military
relations and bureaucracy, defensive mindset of the political elite260
and
cumbersome international procurement processes.
Over a period of time, the Look East Policy of India has been
accentuated with security features. In terms of geo-strategic planning, the
Indian Navy is a fundamental force for India. The days of treating the
Navy as a Cinderella sister are over. Today, the Indian Navy is the fifth
largest in the world, while most of its force goals are still unmet. It does
not have half the number of surface combatants envisaged by the Defence
Acquisition Council. India is increasingly introducing big-ticket items to
its inventory instead of investing in a sustainable force posture, by
gradually expanding its naval assets with a healthy mix of capabilities. As
discussed, India needs to include stronger, maritime surveillance network
and patrol aircrafts, long-range surface platforms equipped with LACMs,
and subsurface fleet, along with the aircraft carriers, to build a Blue Water
Navy. The qualitative specifications of its aircraft carriers and submarines
are wanting if it envisages long-range operations. Increasing the number
of naval commands from two to four at key strategic locations like Cochi
and Andaman Islands are likely to enhance the Indian Navy’s reach beyond the region. It remains to be seen how well India can effectively
employ its expanding reach to achieve hard-core military goals. The
recent submarine accidents and response operations have exposed the
weakness of the Indian Navy. It has a long way to go before it becomes
the Blue Water Navy that it aims for. In the current scenario, its main goal
seems to be protection of its SLOC and protection of its boundaries.
The major push for doctrinal shift and aircraft modernisation came
from the nuclearisation of both India and Pakistan. The ageing fleet and
availability of higher resources helped to completely change the outlook
of the Indian Air Force and by acquiring a matrix of aircrafts it has, in the
last decade. Buying aircrafts is the single most important feature of India’s capital budget.
Like the Army, the IAF is also strategically oriented towards
Pakistan. The current strategic thinking in India vis-à-vis Pakistan is
directed towards conducting quick swift wars with limited aims. The
element of surprise is intrinsic to a limited wars strategy. The IAF is
geared towards achieving the capability to inflict strategic surprise over
260 Ibid.

India’s Defence Budget and Armed Forces Modernisation: An Analysis
113
Pakistan in the near future. IAF, in the India-Pakistan scenario, is the only
force that can achieve both deterrence by denial and deterrence by
punishment. Thus, minor changes in the air balance may bring about huge
dividends.
India’s defence spending although marred by discrepancies and mismanagements is the highest in the region. Even with all its
inefficiencies, this budget will help India become a dominating state in the
region. The strategic leverage that Indian military might provide it,
transcends the different futuristic scenarios contesting its effectiveness in
combat.�


India’s Defence Budget and Armed Forces Modernisation: An Analysis
115
ANNEXURES
Annex-1
India’s Macroeconomic Indicators (2005-16)
Fiscal Year Rate of Inflation GDP Growth Rate Fiscal Deficit
2005-06 4.2 9.51
3.96
2006-07 6.8 9.57 3.32
2007-08 6.2 9.32 2.54
2008-09 9.1 6.72 5.99
2009-10 12.3 8.59 6.46
2010-11 10.5 8.91 4.79
2011-12 8.4 6.69 5.70
2012-13 10.2 4.47 4.90
2013-14 9.52
4.74 4.5
2014-15 10.9 7.4 4.1
2015-16 6.43
7.84
3.9[
Source: Compiled from UNDP, World Bank, Goldman Sachs and Planning Commission of India
datasets.5
1 UNDP, “India Fact Sheet: Economic and Human Development Indicators” (New Delhi: United
Nations Development Program, n.d. ) accessed December 2015,
http://www.undp.org/content/dam/india/docs/india_factsheet_economic_n_hdi.pdf. 2 Planning Commission, GoI, accessed December 2016, http://planningcommission.gov.in/. Figures
collated from the Planning Commission of India’s website.3 World Bank, “World Development Indicators,” accessed April 2016,
http://databank.worldbank.org/data/reports.aspx?source=2&country=&series=FP.CPI.TOTL.ZG&period=. Figures available at WDI.
4 “2016 Macroeconomic Outlook,” Goldman Sachs, accessed April 2016,
http://www.goldmansachs.com/our-thinking/pages/outlook-2016/index.html#forecast. 5 Planning Commission, GoI, “GDP at Current/Constant Prices and % to respective GDP at Market
Prices,” October 28, 2011, http://planningcommission.nic.in/data/datatable/data_2312/DatabookDec2014%2012.pdf.


Sobia Saeed Paracha
118
Annex-4
India’s Armed Forces Budget Growth over
Actual Expenditure
Source: Data compiled by the author from the Ministry of Finance budgetary documents (2004-16).8 Growth rates calculated by the author.
8 Ministry of Finance, GoI, “Union Budget,” accessed March 2016,
http://indiabudget.nic.in/; Ministry of Finance, GoI, “Economic Survey,” accessed March 2016, http://indiabudget.gov.in/survey.asp.
Fiscal Year Army (%)
Navy(%)
Air Force (%)
DRDO (%)
2005-06 14.27 50.86 65.46 55.56
2006-07 7.25 15.62 14.40 3.22
2007-08 14.51 8.21 11.33 9.70
2008-09 7.47 22.80 27.68 6.23
2009-10 31.98 19.49 17.63 10.27
2010-11 -1.61 -5.42 23.39 15.80
2011-12 5.87 -6.90 21.04 1.08
2012-13 14.84 19.93 5.72 7.48
2013-14 8.26 22.81 13.86 8.33
2014-15 19.01 13.23 -6.06 40.70
2015-16 9.39 24.91 5.19 6.85

India’s Defence Budget and Armed Forces Modernisation: An Analysis
119
Annex-5
Percentage Allocated to India’s Tri-Services of
Total Defence Budget
Percentage of Total Budget
Fiscal Year
Army Navy Air Force Ordinance Factories
DRDO
2005-06 48.53 18.37 26.27 -0.15 6.45
2006-07 47.54 18.13 27.93 -0.22 6.12
2007-08 47.20 18.25 28.15 -0.21 6.13
2008-09 46.61 18.47 28.52 -0.16 6.14
2009-10 53.71 14.54 24.30 0.40 5.98
2010-11 50.23 14.56 27.46 0.69 6.66
2011-12 50.37 15.35 28.10 -0.47 6.23
2012-13 49.93 19.29 24.93 -0.07 5.50
2013-14 48.61 17.84 28.23 -0.25 5.21
2014-15 52.84 16.88 24.20 1.11 6.82
2015-16 57.05 17.69 24.76 1.59 6.27
Source: Data compiled by the author from the Ministry of Finance budgetary documents (2004-16).9 Growth rates calculated by the author.
9 Ibid.


121
IIPRI Publications IPRI Journal
The IPRI Journal is a biannual refereed journal enjoying wide
circulation in Pakistan and abroad. It is being published since 2001
and consists of research articles on strategic issues and events of
regional and international importance with relevance to Pakistan’s
national policies. Book reviews of latest publications on International
Relations and Political Science also feature in the Journal. The IPRI Journal is privileged to have been upgraded to category (X) in
Pakistan’s Social Science journals by the country’s Higher Education
Commission (HEC).
Journal of Current Affairs (JoCA)
The Institute started its second biannual refereed Journal in
November 2016 entitled the Journal of Current Affairs aimed to
encourage the research of young scholars and academics. Articles
consist of contemporary subject matters providing policy-makers and
other relevant stakeholders’ critical understanding of world politics,
foreign affairs and international security vis-à-vis Pakistan.
IPRI Books
The Institute organises annual national and international
conferences/seminars/workshops on critical thematic topics. The
papers presented and the proceedings of these events are published
in IPRI Books:
� Strengthening Peace and Cooperation in South Asia: Incentives and Constraints (2017)
� CPEC: Macro and Micro Economic Dividends for Pakistan and the Region (2017)
� Emerging Security Order in Asia Pacific: Impact on South Asia (2017)

122
� Evolving Situation in Afghanistan: Role of Major Powers and Regional Countries (2016)
� Policy Approaches of South Asian Countries: Impact on the Region (2016)
� Building Knowledge-Based Economy in Pakistan: Learning from Best Practices (2016)
� Solutions for Energy Crisis in Pakistan Volume II (2015) � Major Powers’ Interests in Indian Ocean: Challenges and
Options for Pakistan (2015) � Roadmap for Economic Growth of Pakistan (2015) � Pakistan’s Strategic Environment Post-2014 (2014)
� Future of Economic Cooperation in SAARC Countries (2014)
� SCO’s Role in Regional Stability and Prospects of its Expansion
(2013)
� Potential and Prospects of Pakistani Diaspora (2013)
� Rights of Religious Minorities in South Asia: Learning from Mutual Experiences (2013)
� Transition in Afghanistan: Post-Exit Scenarios (2013)
� Solutions for Energy Crisis in Pakistan (2013)
� Eighteenth Amendment Revisited (2012)
� Islam and State: Practice and Perceptions in Pakistan and the Contemporary Muslim World (2012)
� Stabilising Afghanistan Regional Perspectives and Prospects (2011)
� De-radicalisation and Engagement of Youth in Pakistan (2011)
� Balochistan: Rationalisation of Centre-Province Relations
(2010)
� Pakistan – India Peace Process: The Way Forward (2010)
� Regional Cooperation in Asia: Option for Pakistan (2009)
� Political Role of Religious Communities in Pakistan (2008)
� Pakistan and Changing Scenario: Regional and Global (2008)
� Quest for Energy Security in Asia (2007)
� Problems and Politics of Water Sharing and Management in Pakistan (2007)
� Ballistic Missiles and South Asian Security (2007)

IPRI Publications
123
� Political Violence and Terrorism in South Asia (2006)
� Problems and Politics of Federalism in Pakistan (2006)
� The Kashmir Imbroglio: Looking Towards the Future (2005)
� Tribal Areas of Pakistan: Challenges and Responses (2005)
� RAW: Global and Regional Ambitions (2005)
� Arms Race and Nuclear Developments in South Asia (2004)
� Conflict Resolution and Regional Cooperation in South Asia
(2004)
� The State of Migration and Multiculturalism in Pakistan, Report of National Seminar (2003)
Note: All IPRI publications are available online: http://www.ipripak.org.


![Defence in a Democracy - ETH Z · non-discrimination and gender relations; and defence labour relations. [Chapter 6] 11.6 Budgetary considerations. [Chapter 7] 11.7 Arms control and](https://img.dokumen.tips/doc/110x75/5e86f806c357a66924742db8/defence-in-a-democracy-eth-z-non-discrimination-and-gender-relations-and-defence.jpg)


