Embed Size (px)
Citation preview
F.J. Artola, Theory and Simulations of Disruptions Workshop
F.J. Artola1, K. Särkimäki1, M. Hoelzl1, A. Loarte2, M. Lehnen2, S. Pinches2
1Max Planck Institute for plasma physics, Boltzmannstr. 2, 85748 Garching, Germany
2ITER Organization, 13067 St Paul Lez Durance Cedex, France
Email: [email protected]
Complete 3D MHD simulations of ITER post-Themal Quench plasmas with realistic Lundquist numbers
1
Disclaimer ITER: ITER is the Nuclear Facility INB No. 174. This work physics processes during the plasma operation of the tokamak when disruptions take place; nevertheless the nuclear operator is not constrained by the results presented here. The views and opinions expressed herein do not necessarily reflect those of the ITER Organization.
Disclaimer EUROfusion:This work has been carried out within the framework of the EUROfusion Consortium and has received funding from the Euratom research and training program 2014-2018 and 2019-2020 under grant agreement No 633053. The views and opinions expressed herein do not necessarily reflect those of the European Commission.
F.J. Artola, Theory and Simulations of Disruptions Workshop Slide #2
Context
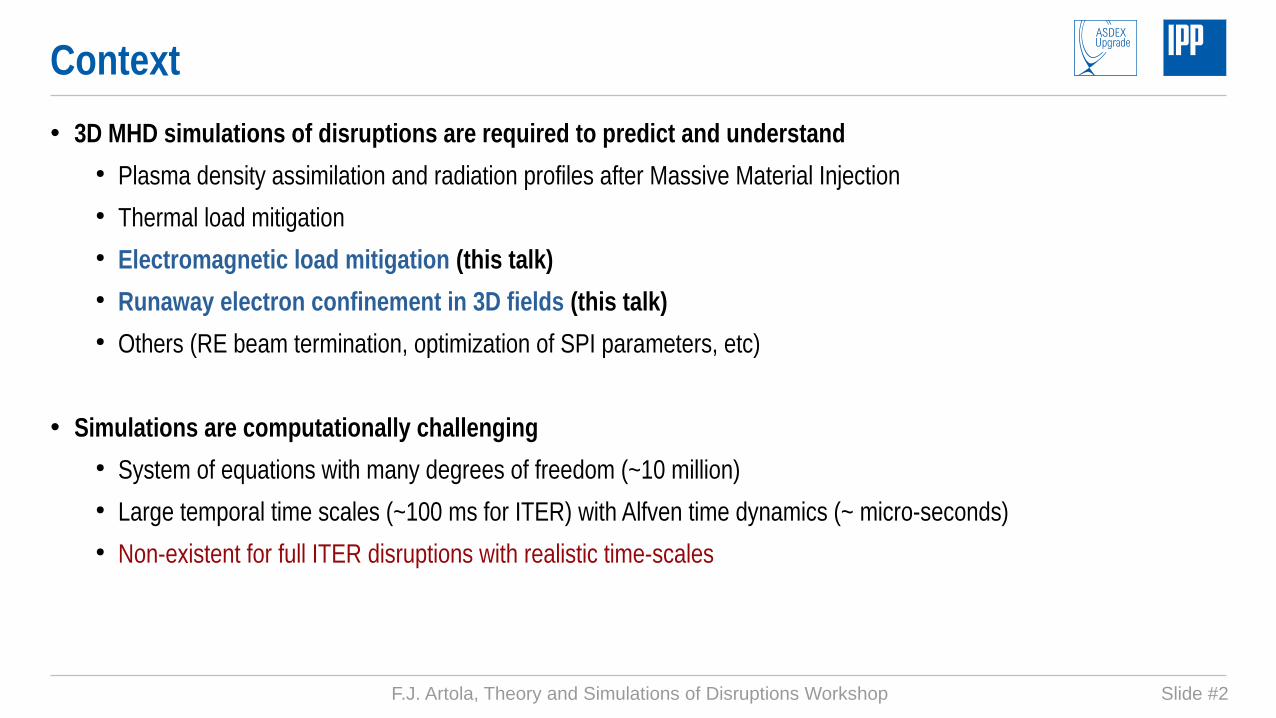
• 3D MHD simulations of disruptions are required to predict and understand● Plasma density assimilation and radiation profiles after Massive Material Injection● Thermal load mitigation● Electromagnetic load mitigation (this talk)● Runaway electron confinement in 3D fields (this talk)● Others (RE beam termination, optimization of SPI parameters, etc)
• Simulations are computationally challenging● System of equations with many degrees of freedom (~10 million)● Large temporal time scales (~100 ms for ITER) with Alfven time dynamics (~ micro-seconds)● Non-existent for full ITER disruptions with realistic time-scales
F.J. Artola, Theory and Simulations of Disruptions Workshop Slide #3
This talk
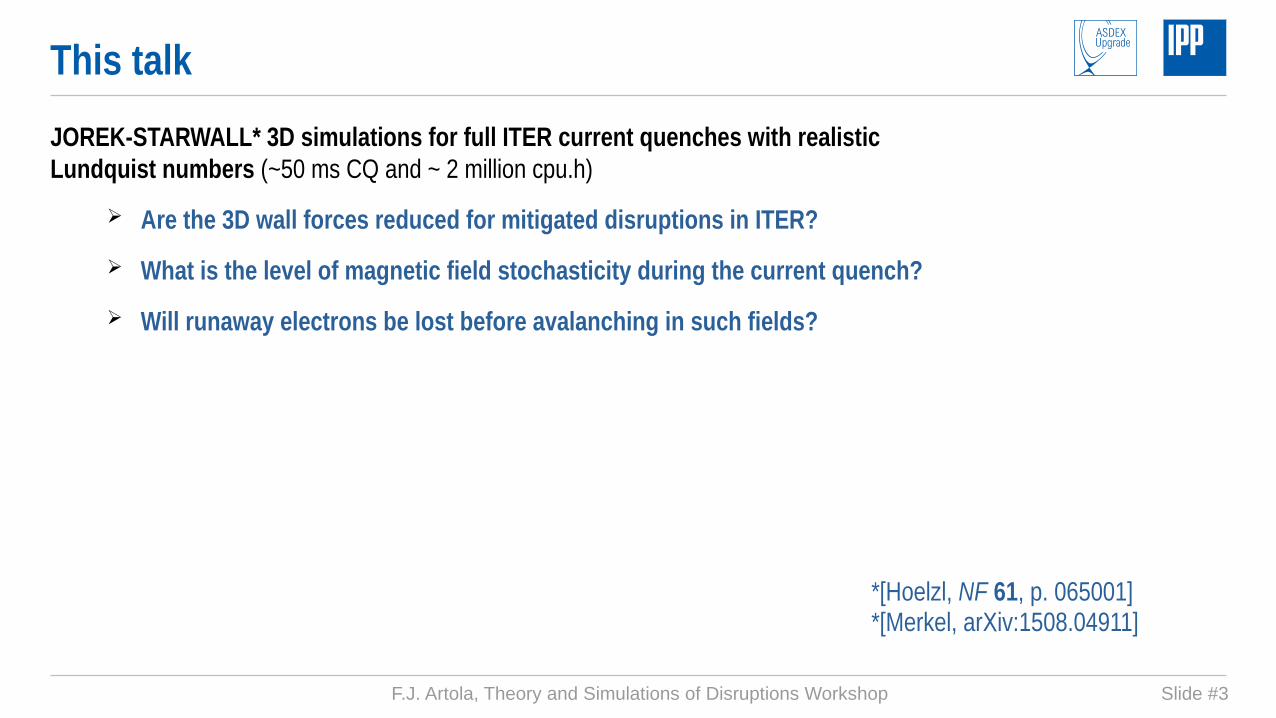
JOREK-STARWALL* 3D simulations for full ITER current quenches with realistic Lundquist numbers (~50 ms CQ and ~ 2 million cpu.h)
➢ Are the 3D wall forces reduced for mitigated disruptions in ITER?
➢ What is the level of magnetic field stochasticity during the current quench?
➢ Will runaway electrons be lost before avalanching in such fields?
*[Hoelzl, NF 61, p. 065001]*[Merkel, arXiv:1508.04911]
F.J. Artola, Theory and Simulations of Disruptions Workshop Slide #4
Motivation: Uncertain wall force extrapolations from JET
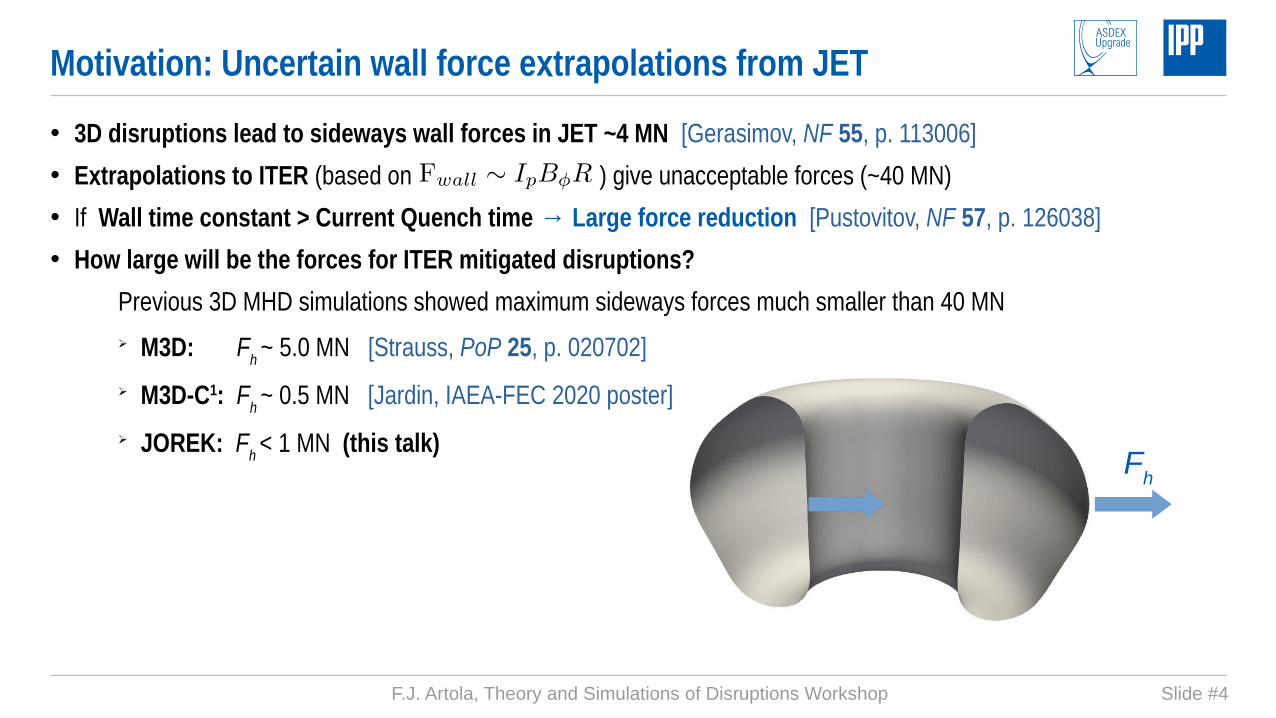
• 3D disruptions lead to sideways wall forces in JET ~4 MN [Gerasimov, NF 55, p. 113006]
• Extrapolations to ITER (based on ) give unacceptable forces (~40 MN)
• If Wall time constant > Current Quench time → Large force reduction [Pustovitov, NF 57, p. 126038]
• How large will be the forces for ITER mitigated disruptions?
Previous 3D MHD simulations showed maximum sideways forces much smaller than 40 MN➢ M3D: Fh ~ 5.0 MN [Strauss, PoP 25, p. 020702]➢ M3D-C1: Fh ~ 0.5 MN [Jardin, IAEA-FEC 2020 poster]➢ JOREK: Fh < 1 MN (this talk)
Fh

F.J. Artola, Theory and Simulations of Disruptions Workshop Slide #5
Motivation: Runaway electron (RE) confinement during the CQ
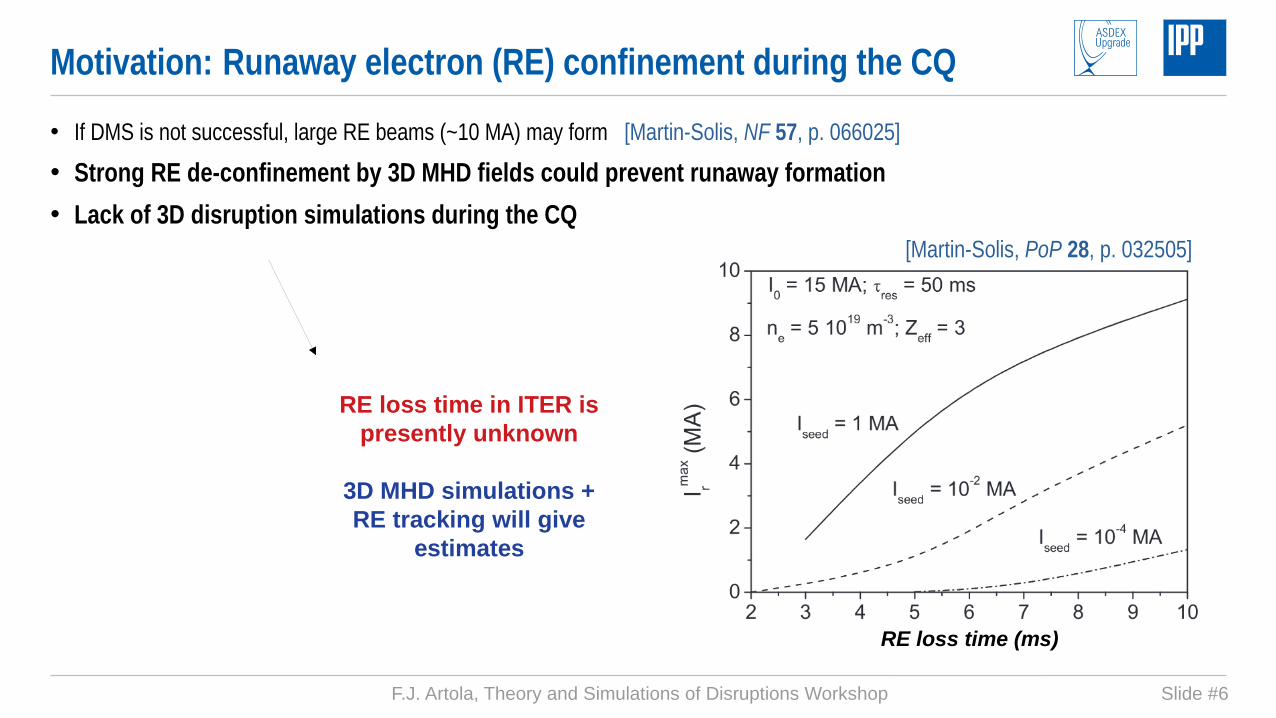
• If DMS is not successful, large RE beams (~10 MA) may form [Martin-Solis, NF 57, p. 066025]
• Strong RE de-confinement by 3D MHD fields could prevent runaway formation
• Lack of 3D disruption simulations during the CQ
RE loss time (ms)
[Martin-Solis, PoP 28, p. 032505]
F.J. Artola, Theory and Simulations of Disruptions Workshop Slide #6
• If DMS is not successful, large RE beams (~10 MA) may form [Martin-Solis, NF 57, p. 066025]
• Strong RE de-confinement by 3D MHD fields could prevent runaway formation
• Lack of 3D disruption simulations during the CQ
RE loss time (ms)
Motivation: Runaway electron (RE) confinement during the CQ
RE loss time in ITER is presently unknown
3D MHD simulations + RE tracking will give
estimates
[Martin-Solis, PoP 28, p. 032505]
F.J. Artola, Theory and Simulations of Disruptions Workshop Slide #7
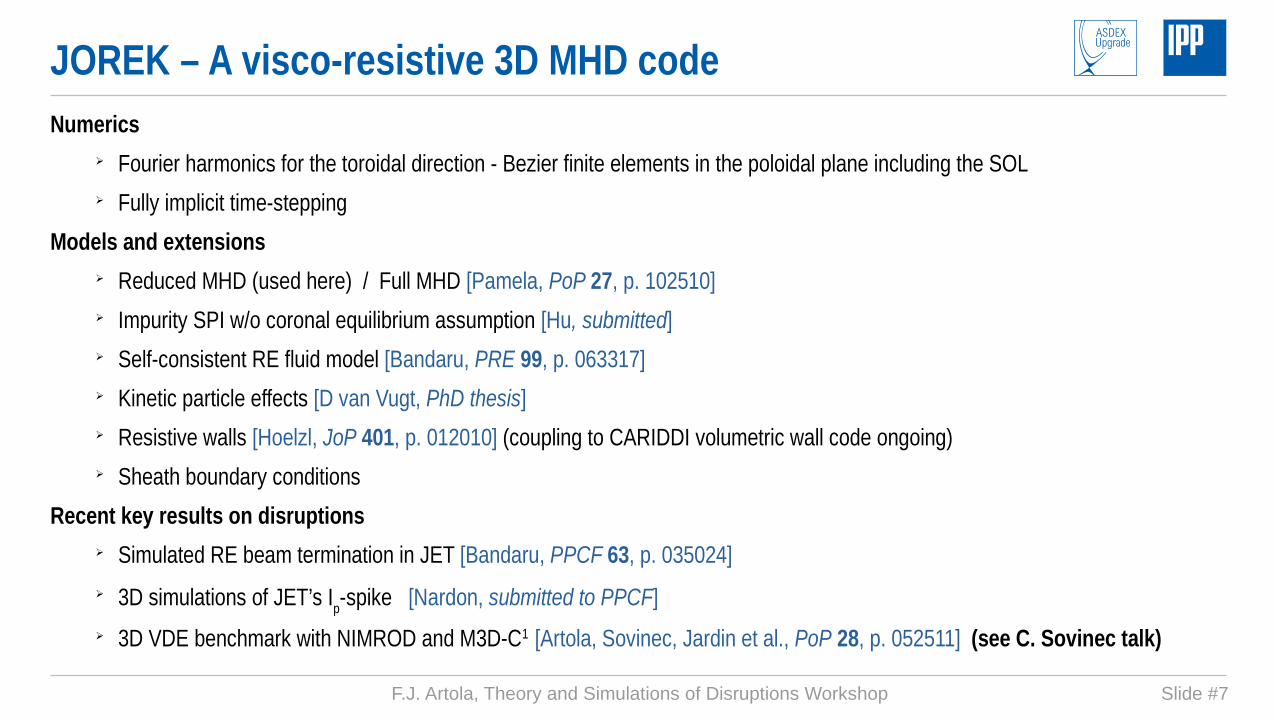
JOREK – A visco-resistive 3D MHD codeNumerics
➢ Fourier harmonics for the toroidal direction - Bezier finite elements in the poloidal plane including the SOL➢ Fully implicit time-stepping
Models and extensions➢ Reduced MHD (used here) / Full MHD [Pamela, PoP 27, p. 102510]➢ Impurity SPI w/o coronal equilibrium assumption [Hu, submitted]➢ Self-consistent RE fluid model [Bandaru, PRE 99, p. 063317]➢ Kinetic particle effects [D van Vugt, PhD thesis]➢ Resistive walls [Hoelzl, JoP 401, p. 012010] (coupling to CARIDDI volumetric wall code ongoing)➢ Sheath boundary conditions
Recent key results on disruptions➢ Simulated RE beam termination in JET [Bandaru, PPCF 63, p. 035024]➢ 3D simulations of JET’s Ip-spike [Nardon, submitted to PPCF]➢ 3D VDE benchmark with NIMROD and M3D-C1 [Artola, Sovinec, Jardin et al., PoP 28, p. 052511] (see C. Sovinec talk)
F.J. Artola, Theory and Simulations of Disruptions Workshop Slide #8
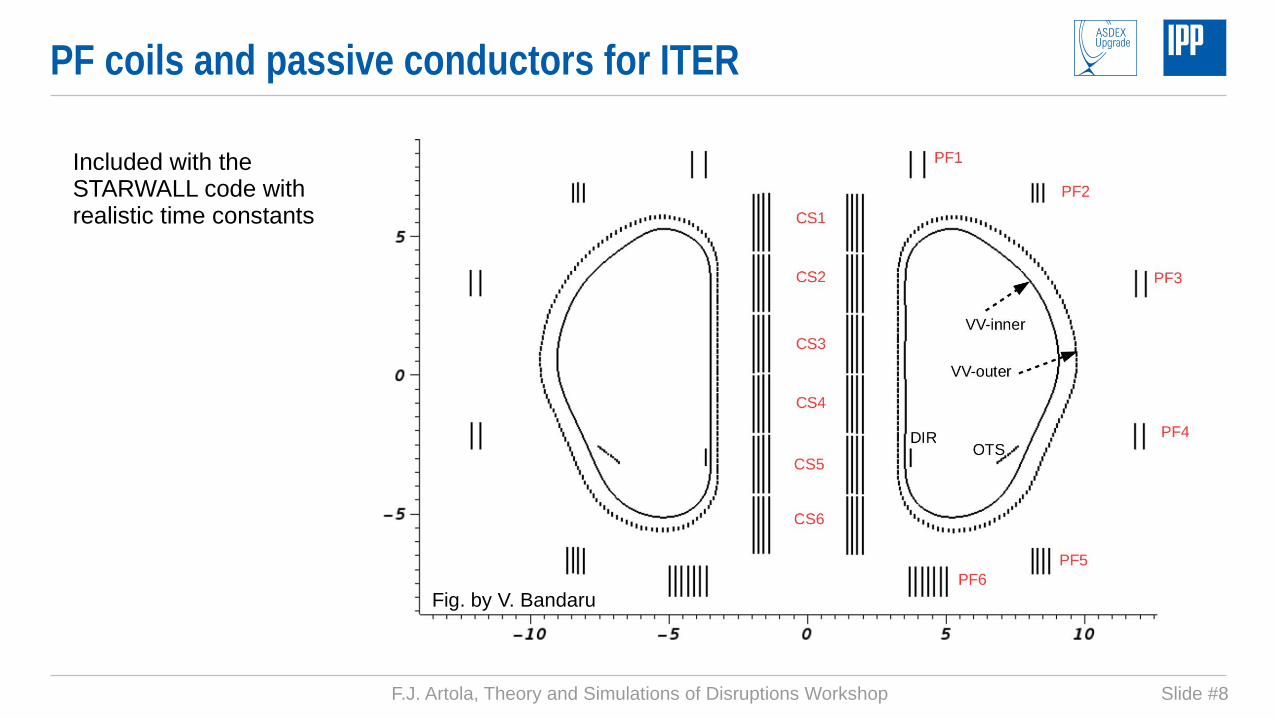
PF coils and passive conductors for ITER
Fig. by V. Bandaru
Included with the STARWALL code with realistic time constants
F.J. Artola, Theory and Simulations of Disruptions Workshop Slide #9
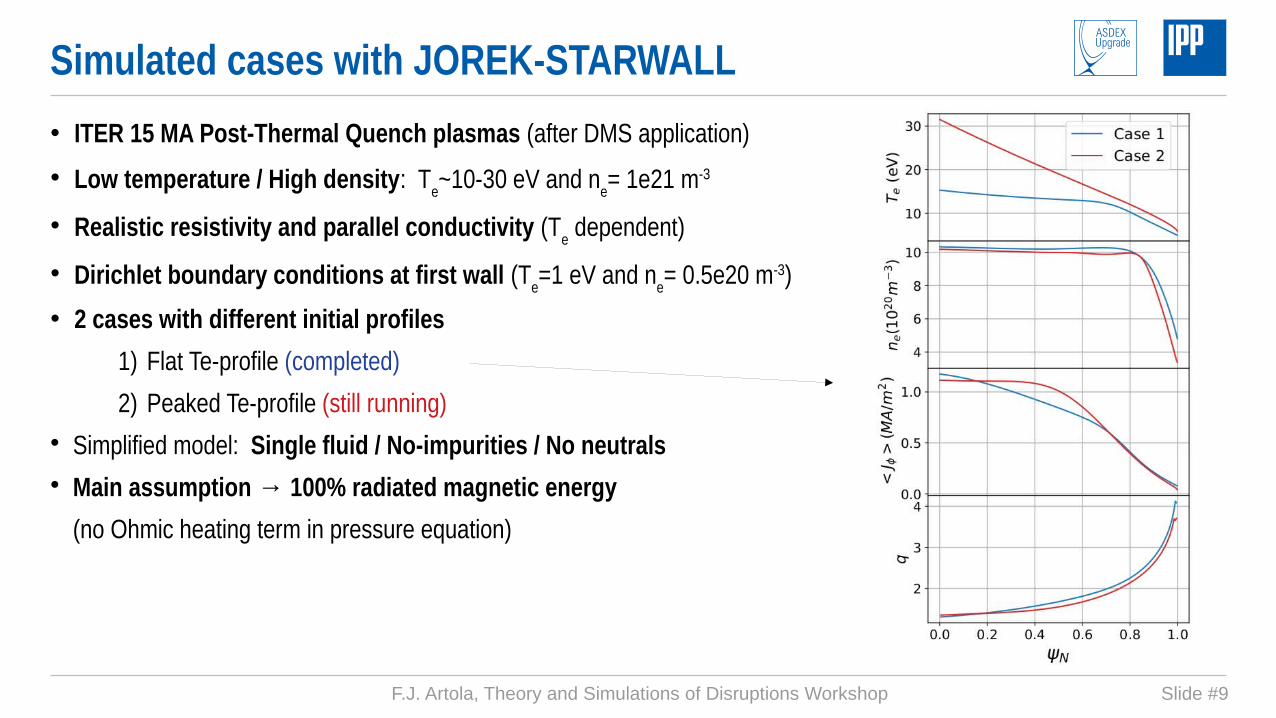
Simulated cases with JOREK-STARWALL
• ITER 15 MA Post-Thermal Quench plasmas (after DMS application)
• Low temperature / High density: Te~10-30 eV and ne= 1e21 m-3
• Realistic resistivity and parallel conductivity (Te dependent)
• Dirichlet boundary conditions at first wall (Te=1 eV and ne= 0.5e20 m-3)
• 2 cases with different initial profiles
1) Flat Te-profile (completed)
2) Peaked Te-profile (still running) Simplified model: Single fluid / No-impurities / No neutrals Main assumption → 100% radiated magnetic energy
(no Ohmic heating term in pressure equation)

F.J. Artola, Theory and Simulations of Disruptions Workshop Slide #10
Axisymmetric runs (case 1 .vs. case 2)
• Both cases show upward vertical motion in 2D
• Case 1: Initially flat Te
➢ q95 > 3 if Ip > 5 MA
• Case 2: Initially peaked Te
Slower Ip decay Smaller halo currents (due to larger Tcore/ Thalo)
q95 < 2 when Ip < 8 MA (potentially more MHD unstable)
Solid: total
Dashed: halo
F.J. Artola, Theory and Simulations of Disruptions Workshop Slide #11
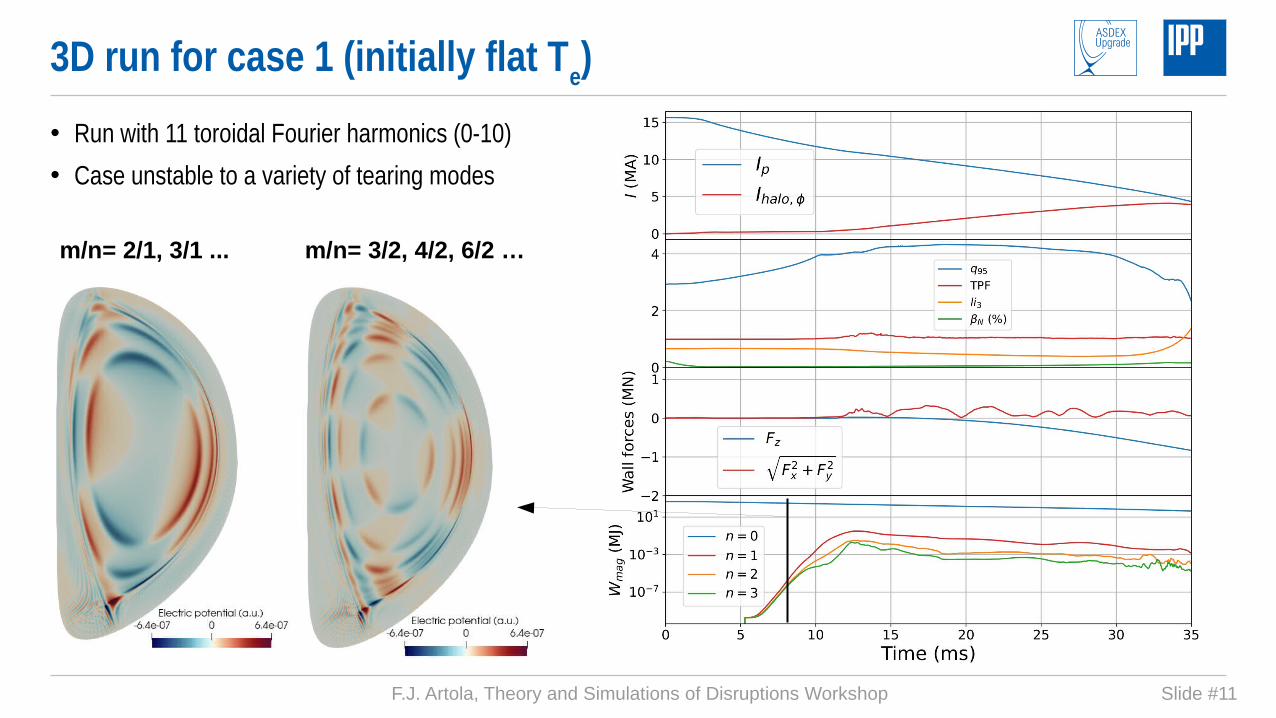
3D run for case 1 (initially flat Te)
• Run with 11 toroidal Fourier harmonics (0-10)
• Case unstable to a variety of tearing modes
m/n= 2/1, 3/1 ... m/n= 3/2, 4/2, 6/2 …
F.J. Artola, Theory and Simulations of Disruptions Workshop Slide #12
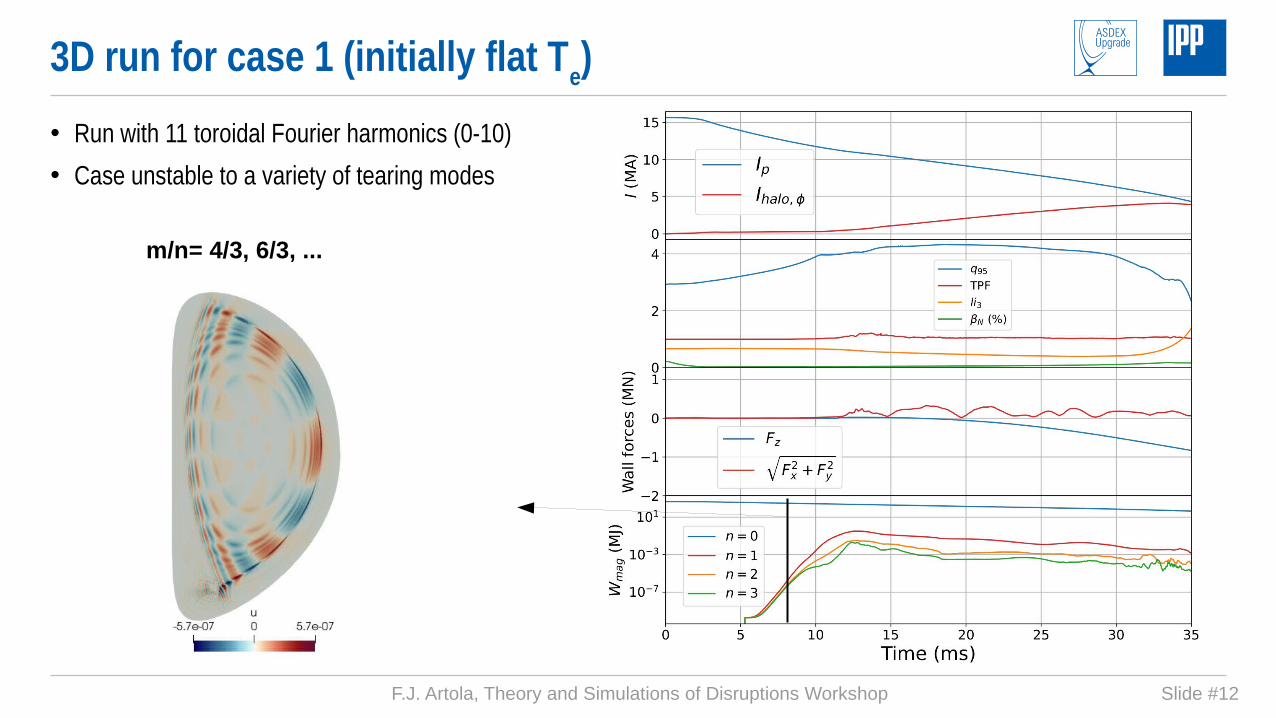
3D run for case 1 (initially flat Te)
• Run with 11 toroidal Fourier harmonics (0-10)
• Case unstable to a variety of tearing modes
m/n= 4/3, 6/3, ...
F.J. Artola, Theory and Simulations of Disruptions Workshop Slide #13
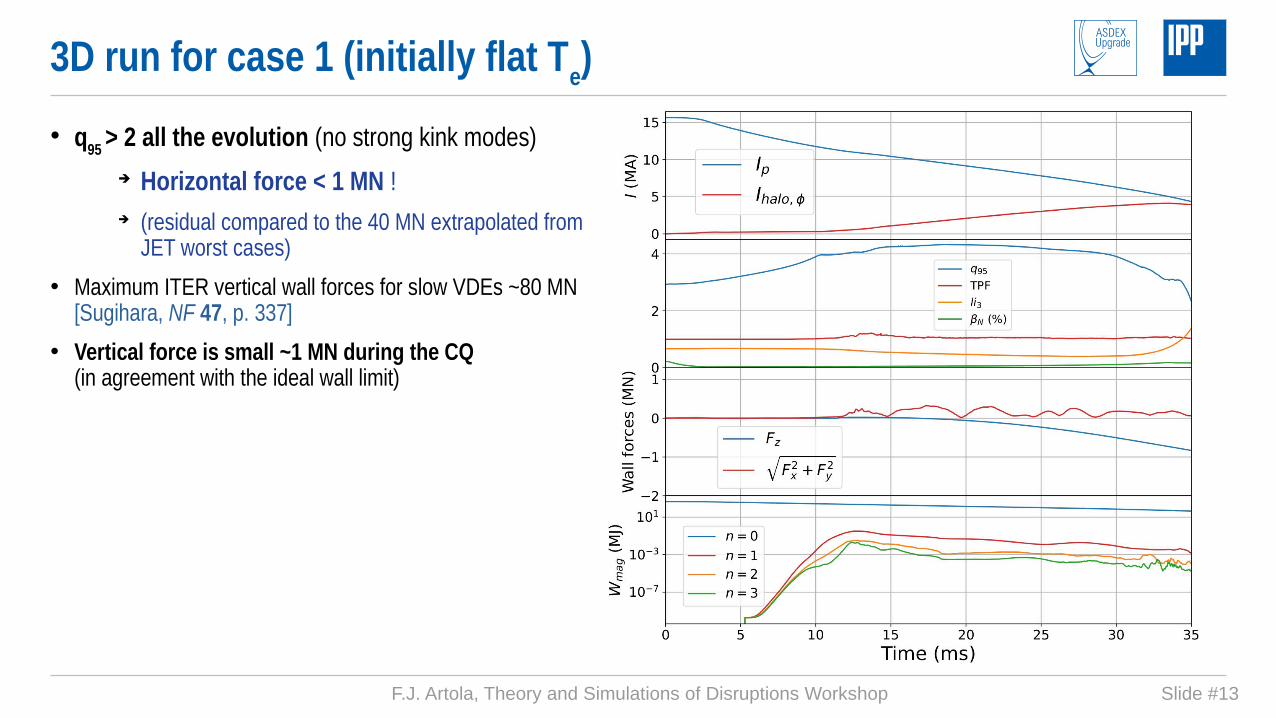
3D run for case 1 (initially flat Te)
• q95 > 2 all the evolution (no strong kink modes) Horizontal force < 1 MN ! (residual compared to the 40 MN extrapolated from
JET worst cases)
• Maximum ITER vertical wall forces for slow VDEs ~80 MN [Sugihara, NF 47, p. 337]
• Vertical force is small ~1 MN during the CQ (in agreement with the ideal wall limit)
F.J. Artola, Theory and Simulations of Disruptions Workshop Slide #14
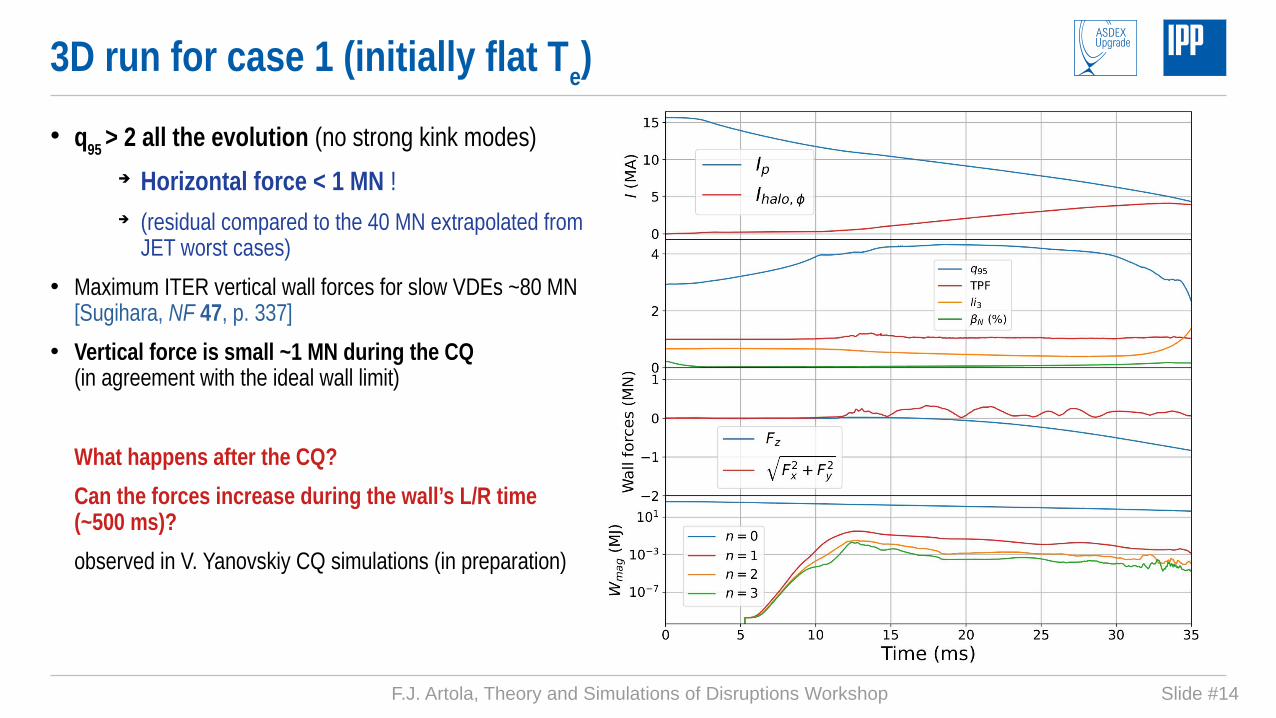
3D run for case 1 (initially flat Te)
• q95 > 2 all the evolution (no strong kink modes) Horizontal force < 1 MN ! (residual compared to the 40 MN extrapolated from
JET worst cases)
• Maximum ITER vertical wall forces for slow VDEs ~80 MN [Sugihara, NF 47, p. 337]
• Vertical force is small ~1 MN during the CQ (in agreement with the ideal wall limit)
What happens after the CQ?
Can the forces increase during the wall’s L/R time (~500 ms)?
observed in V. Yanovskiy CQ simulations (in preparation)
F.J. Artola, Theory and Simulations of Disruptions Workshop Slide #15
3D run for case 1 (initially flat Te)
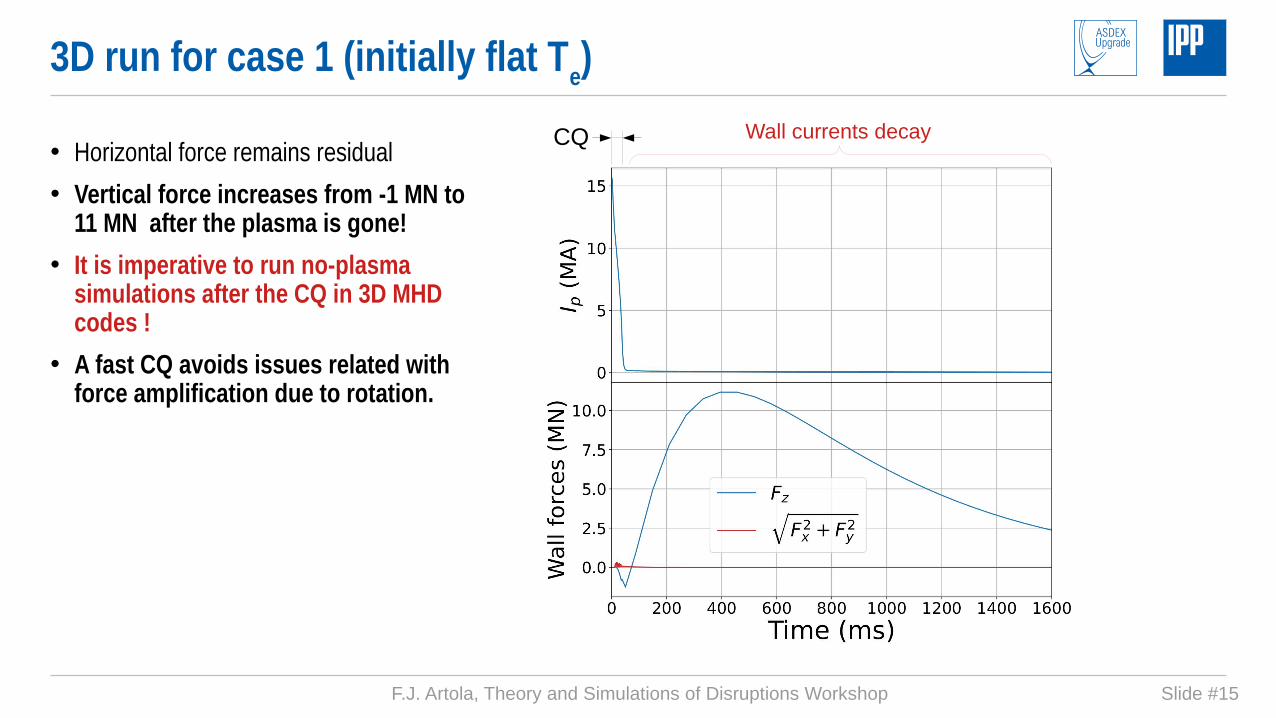
CQ Wall currents decay• Horizontal force remains residual
• Vertical force increases from -1 MN to 11 MN after the plasma is gone!
• It is imperative to run no-plasma simulations after the CQ in 3D MHD codes !
• A fast CQ avoids issues related with force amplification due to rotation.
F.J. Artola, Theory and Simulations of Disruptions Workshop Slide #16
3D run for case 1 (initially flat Te)
Why do we need to wait to the wall’s L/R time?
Wall force = - (Plasma + wall forces on the coils)
The coils only see plasma/wall field changes in the wall’s L/R time (due to wall shielding)
[Wesson, Tokamaks, 2011]
F.J. Artola, Theory and Simulations of Disruptions Workshop Slide #17
2D / 3D comparison run for case 1
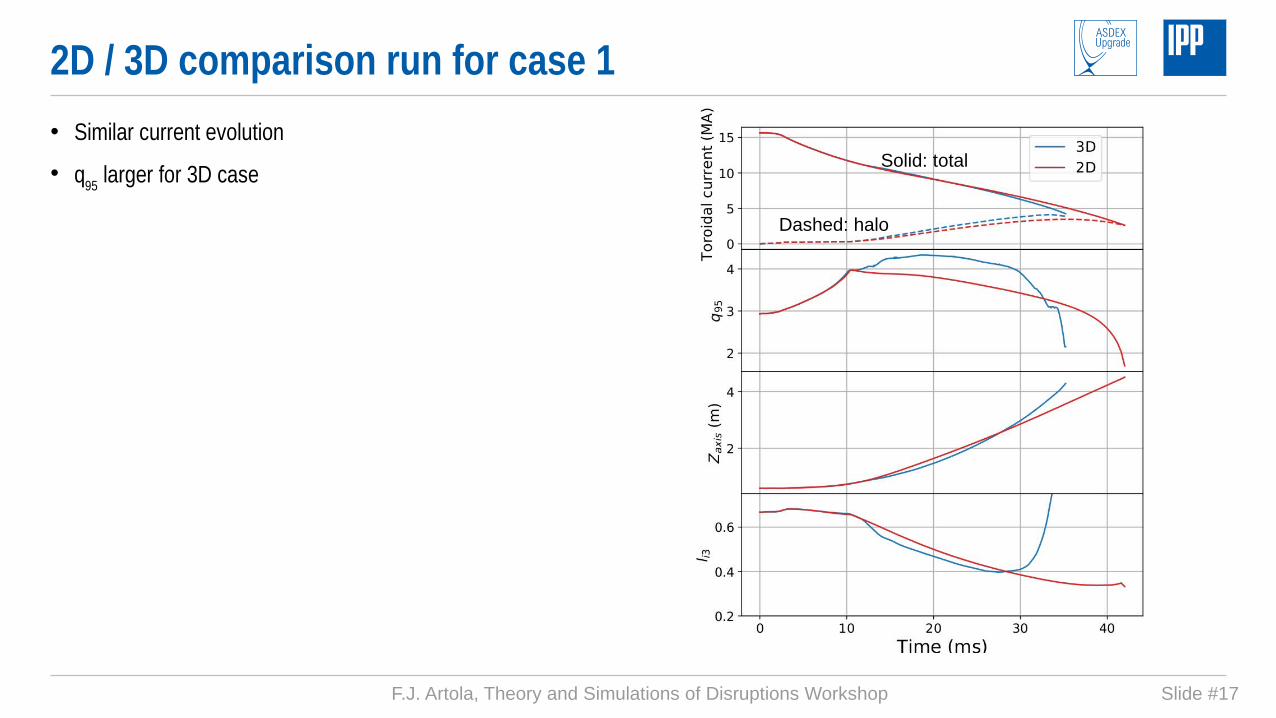
• Similar current evolution
• q95 larger for 3D caseSolid: total
Dashed: halo

F.J. Artola, Theory and Simulations of Disruptions Workshop Slide #18
3D run for case 1 (Poincare plots)
t = 5 ms t = 13 ms t = 18 ms t = 23 ms t = 28 ms
F.J. Artola, Theory and Simulations of Disruptions Workshop Slide #19
3D run for case 1 (RE confinement)
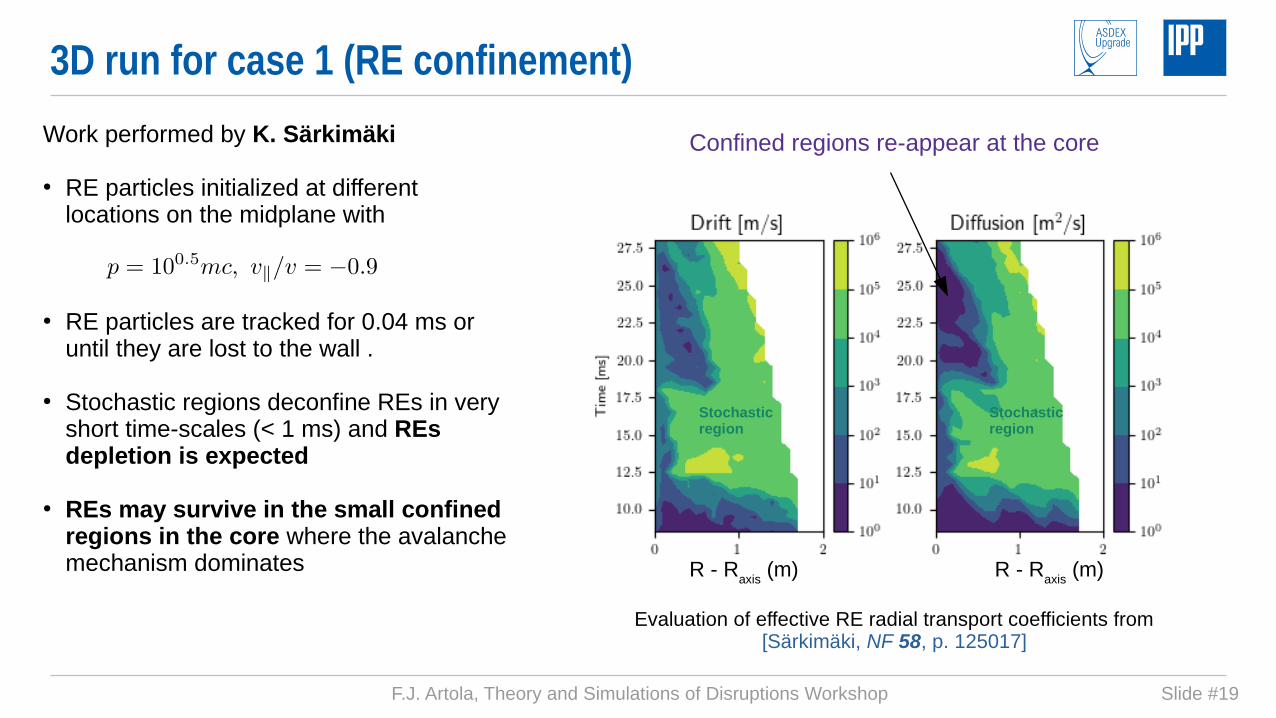
Work performed by K. Särkimäki
● RE particles initialized at different locations on the midplane with
● RE particles are tracked for 0.04 ms or until they are lost to the wall .
● Stochastic regions deconfine REs in very short time-scales (< 1 ms) and REs depletion is expected
● REs may survive in the small confined regions in the core where the avalanche mechanism dominates R - R
axis (m) R - R
axis (m)
Stochastic region
Stochastic region
Confined regions re-appear at the core
Evaluation of effective RE radial transport coefficients from [Särkimäki, NF 58, p. 125017]
F.J. Artola, Theory and Simulations of Disruptions Workshop Slide #20
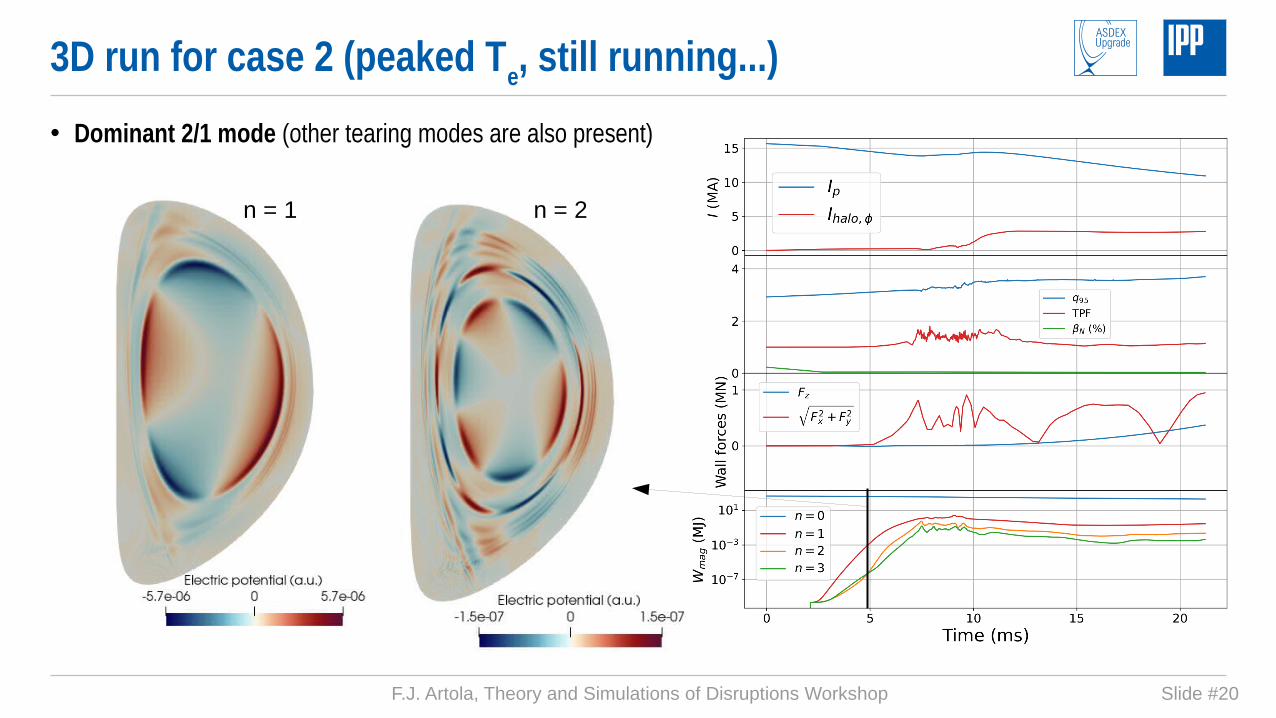
3D run for case 2 (peaked Te, still running...)
• Dominant 2/1 mode (other tearing modes are also present)
n = 1 n = 2
F.J. Artola, Theory and Simulations of Disruptions Workshop Slide #21
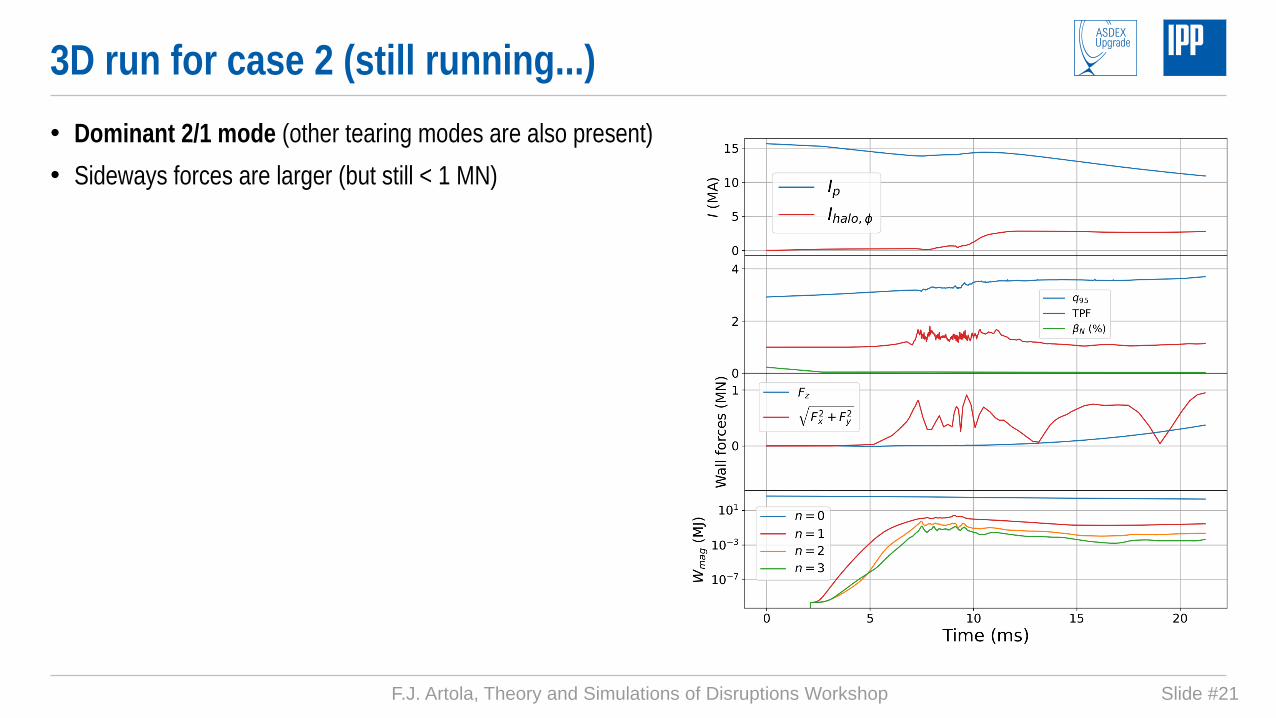
3D run for case 2 (still running...)
• Dominant 2/1 mode (other tearing modes are also present)
• Sideways forces are larger (but still < 1 MN)
F.J. Artola, Theory and Simulations of Disruptions Workshop Slide #22
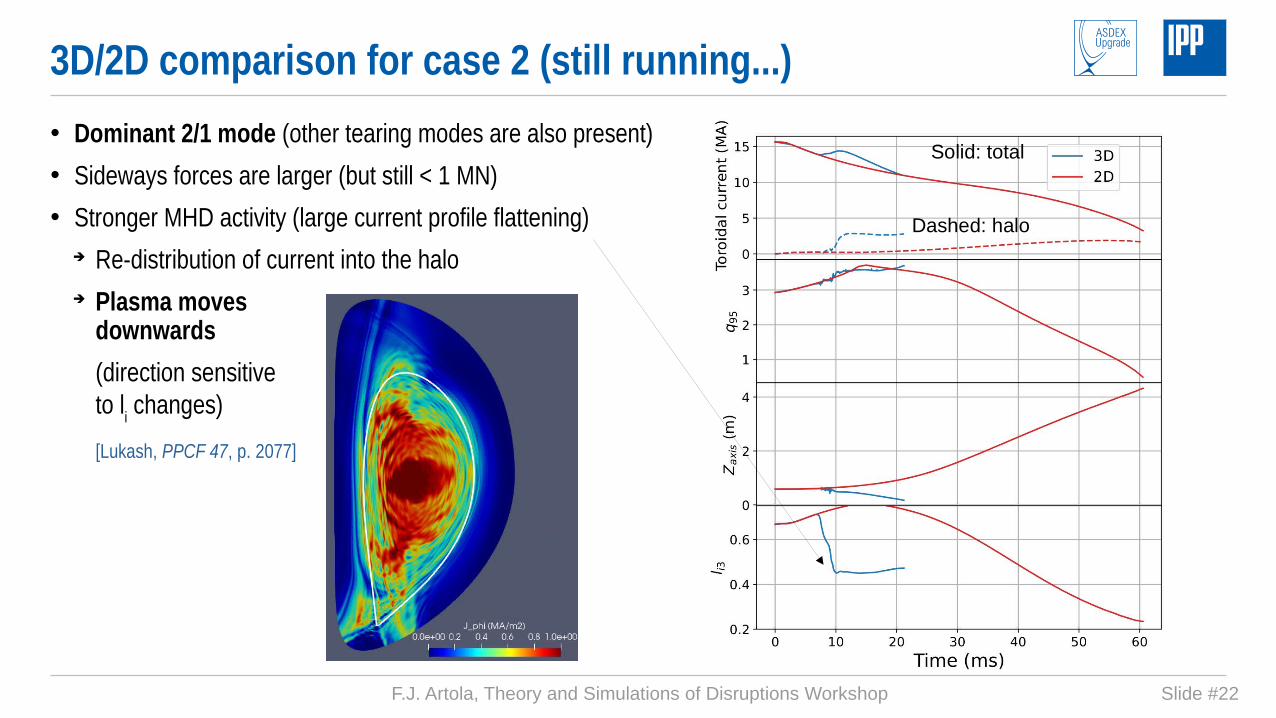
3D/2D comparison for case 2 (still running...)
• Dominant 2/1 mode (other tearing modes are also present)
• Sideways forces are larger (but still < 1 MN)
• Stronger MHD activity (large current profile flattening) Re-distribution of current into the halo Plasma moves
downwards
(direction sensitive to li changes)
[Lukash, PPCF 47, p. 2077]
Solid: total
Dashed: halo
F.J. Artola, Theory and Simulations of Disruptions Workshop Slide #23
A full 3D CQ simulation was performed with JOREK-STARWALL
Post-TQ ITER 15 MA (mitigated) disruption (Current quench time ~50 ms) Unstable to several tearing modes (2/1, 3/1, 3/2, 6/2 ...)
q95 > 2 during the evolution (no strong kink modes)
Small horizontal forces (<1 MN) compared to JET extrapolations (~40 MN) Maximum vertical forces of 11 MN
Forces can increase when the plasma is gone: Runs are required after the CQ!
A fast CQ in ITER avoids force amplification due to rotation
Significant field stochasticity observed but confined regions reform
REs quickly deconfined in stochastic regions, but could survive in small core regions
Effective RE radial transport coefficients computed (K. Särkimäki)
Conclusions
F.J. Artola, Theory and Simulations of Disruptions Workshop Slide #24
Complete and analyze case 2 (downward VDE) Use RE transport coefficients to predict RE beam current (V. Bandaru, K. Särkimäki) Repeat simulations with more advanced models (including Ohmic heating, impurity radiation, sheath BCs) Study influence of wall asymmetries
Future work