Embed Size (px)
Citation preview

COMPETITIVENESSINAZERBAIJANAssessingSectorialEconomicPolicies

COMPETITIVENESS IN
IN AZERBAIJANAssessing Sectorial
Economic Policies
Baku - 2014

Edited by Dr. Vugar Bayramov
Ziya Alili MSc, Rashad Hasanov MSc, Farhad Bayramov.
Competitiveness In Azerbaijan. Assessing Sectorial Economic
Policies. Baku, 2014, 64 page.
This Publication was printed with the support of Friedrich-Ebert-Stiftung.
The views expressed in this publication are not necessarily those of the Friedrich-Ebert-Stiftung.
Commercial use of all media published by the Friedrich-Ebert-Stiftung (FES) is not permitted without the written consent of the FES.
© Friedrich-Ebert-Stiftung
© Center for Economic & Social Development

About the researchers
Ziya Alili, MSc, CFA candidate, is an Azerbaijan-based economist-researcher at the CESD and Director of the CESD School of Euro-pean Studies. He earned his Bachelor of Science in FinancialManagement from Khazar University and his Master of Sciencein Risk Management from the University of Wales and the Lon-don School of Business and Finance. He has contributed to thispaper with his econometric modeling skills and research ex-pertise on Azerbaijan’s economy in the development of policyrecommendations. Alili has authored and co-authored the fol-lowing relevant research papers:
• EU-Azerbaijan relations: Current Challenges and Prospec-tive for Growth, 2013
• Accession to the Customs Union: Shaping the Strategy forAzerbaijan, 2013 (award-winning publication);
• Considering Accession to the Eurasian Economic Union: ForAzerbaijan, Disadvantages Outweigh Advantages, 2013;
• Measuring the non-hydrocarbon sector in Azerbaijan,2013;
• Azerbaijan’s exclusion from the Generalized Scheme ofPreferences of the European Union: Impact assessment forhazelnut and pomegranate juice exports, 2013.
• Estimating the impact of the global financial crisis to theeconomies of Azerbaijan, Armenia and Georgia, 2009(award-winning publication);
Rashad Hasanov, MSc, is an economist-researcher at the CESD.He earned his Master of Science in International Trade and De-velopment at the Azerbaijan Cooperation University, and has ex-tensive experience in researching Azerbaijan’s economy anddeveloping policy recommendations. His experience and in-deepknowledge of the economy of Azerbaijan was very beneficialwhile developing policy recommendations. He has authored sev-
FRIEDRICH-EBERT-STIFTUNG Regional Office for the South Caucasus
3

eral research papers, including:
• Measuring the non-hydrocarbon sector in Azerbaijan,2013;
• Mortgages in Azerbaijan: Policy recommendations for de-velopment, 2013
Farhad Bayramov is an economist-researcher at the CESD Schoolof European Studies. He is currently studying towards academicdegrees at the Azerbaijan State Economic University and at theDepartment of Public Finance at Istanbul University simultane-ously. Farhad was an Erasmus LLP exchange student at the Busi-ness Management School of the Queen’s University Belfast inthe United Kingdom. Farhad has also co-authored a CESD paperentitled» Mortgages in Azerbaijan: Policy recommendations fordevelopment«. His economic knowledge and background werequite beneficial while specifying the econometric tools and de-veloping policy recommendations.
Ackowledgements
The researchers are thankful to all of the supportive colleaguesof the Center for Economic and Social Development, and the stu-dents interning at the Center during the 2013 internship pro-gramme. Among them, the contributions of Ms. Rafiga
Hamzayeva, MA in International Relations and student of Eco-nomics at Baku State University; and Mr. Akif Rustamov, studentof Applied Social Sciences at SMK University in Lithuania, wherehe majors in International Business Management. His time as anErasmus student in Portugal deserves special attention.
The researchers are grateful to the experts for sharing their viewsand insights, which have helped them develop relevant and suit-able policy recommendations. Without these expert views, thiswould merely be an ordinary research paper calling for economicdiversification.
COMPETITIVENESS IN AZERBAIJAN ASSESSING SECTORIAL ECONOMIC POLICIES
Center for Economic & Social DevelopmentBetter Research, Better Reform, Better Policy
4

Contents
1. Introduction ..........................................................................71.1. Purpose of the study ..................................................71.2. Research questions ....................................................71.3. Researcher ..................................................................81.4. Structure of the paper ................................................9
2. Methodology ......................................................................102.1. General methodology ..............................................102.2. Measures for Economic Diversification ....................102.3. The Vector Autoregressive (VAR) model...................12
3. Diversification of Azerbaijan’s economy ............................173.1. Employment Diversification......................................173.2. GDP diversification....................................................19
4. Sectorial policies of Azerbaijan’s economy and theireconometric assessment:....................................................21
4.1. Banking sector ..........................................................214.1.1.Economic policy in Banking sector ..................23
4.2. IT and Telecommunications Sector ..........................254.2.1.Economic policy in IT and
Telecommunications sector ..............................274.3. Construction sector ..................................................31
4.3.1.Economic Policy in the Construction Sector ....354.4. Agriculture Sector ....................................................36
4.4.1.Economic Policy in Agriculture sector..............384.5. Tourism Sector ..........................................................40
4.5.1.Economic Policy in Tourism Sector ..................414.6. Industry Sector..........................................................43
4.6.1.Economic Policy in Industry Sector ..................464.7. Transport Sector ......................................................48
4.7.1.Economic Policy in Transport sector ................505.Conclusion and Recommendations ......................................53
5.1. Recommendations for diversification ......................576.Bibliography ........................................................................58
ZIYA ALILI RASHAD HASANOV FARHAD BAYRAMOV
FRIEDRICH-EBERT-STIFTUNG Regional Office for the South Caucasus
5

Figure 1 The shares of employment among economicsectors, %, 2003-2012 ............................................17
Figure 2 HHI of sectorial employment for 2010,2011 and 2012 ........................................................18
Figure 3 Ogive index of GDP diversification..........................19Figure 4 Average exchange rate of AZN-USD in CBAR ..........22Figure 5 Profitability of Azerbaijani banks ............................22Figure 6 Main macro indicators of ITC sector,
AZN million (at current prices) ................................25Figure 7 Volume of information and communication
services, current prices, AZN thousands ................26Figure 8 Telephone communication ....................................27Figure 9 Telephone communication (continued) ................28Figure 10 Share of sector in GDP, percent..............................32Figure 11 Selected indicators of the construction sector
(current prices, AZN thsd) ......................................32Figure 12 Volume of work carried out by construction
enterprises (percent) ..............................................34Figure 13 GDP in Agriculture sector, AZN millions..................36Figure 14 Employment in Agriculture ....................................37Figure 15 Purposes of tourist visits to Azerbaijan, number....40Figure 16 Employment rate in Tourism sector, % ..................41Figure 17 GDP for Industry sector ..........................................43Figure 18 Employment for Industry sector, numbers ............44Figure 19 Inflation rate for Industry sector, %........................45Figure 20 Investment to Industry sector, AZN millions ..........45Figure 21 Value Added in Transport sector ............................49Figure 22 Employment in Transport sector ............................50Figure 23 Turnover of goods in Transport sector, billion
tones per km ..........................................................51
COMPETITIVENESS IN AZERBAIJAN ASSESSING SECTORIAL ECONOMIC POLICIES
Center for Economic & Social DevelopmentBetter Research, Better Reform, Better Policy
6

1.Introduction
Sustainable growth through economic diversification is a typicalgoal of any economy in today’s world. It is a widely targeted andtackled problem in developing countries as well. According tothe Revenue Watch institute, many resource-rich countries de-pend heavily on cash flows generated by mining or oil produc-tion, which in turn jeopardizes sustainable growth. This is borneout by the lack of clear policy guidelines on diversification as wellas policymakers’ limited interest in the importance of diversifi-cation.
Accordingly, policymakers need studies on economic diversifica-tion and future economic challenges. A study encompassing theviews of the most prominent experts and government officialsbacked by econometric models is therefore extremely important.Thus, this study compiles and analyzes the views of experts andgovernment officials and backs them up with quantitative econo-metric modeling.
1.1.Purpose of the study
This study assesses economic diversification and cross-sectorcompetitiveness in Azerbaijan by employing extensive qualita-tive and quantitative methodologies. The paper will measure theextent to which Azerbaijan’s economy is labor- and GDP-diversi-fied or not. If it is not, we must ask what kind of policies can bedeveloped for sectorial diversification and economic develop-ment. This paper will further analyze the government’s fiscal andmonetary policies aimed at developing better, quantitativelybased recommendations.
1.2.Research questions
Throughout this research paper, the researchers will answer thefollowing questions:
ZIYA ALILI RASHAD HASANOV FARHAD BAYRAMOV
FRIEDRICH-EBERT-STIFTUNG Regional Office for the South Caucasus
7

1. To what extent is Azerbaijan’s economy diversified?2. What are the most successful policies of the govern-
ment of Azerbaijan in sectorial development?3. Do the government’s policies generate competitive-
ness in a given sector?4. How can future growth in different sectors be
achieved?
The first question measures the economic diversification of Azer-baijan in terms of distribution of GDP and employment acrosssectors. The Herfindahl-Hirschman Index (HHI) and Ogive indexare calculated over multiple years for the GDP and each year foremployment to analyze changes in their trends. The second andthird questions will be answered via views of experts and econo-metric models that have been widely used to assess sectorialmonetary and fiscal policies. This assessment will allow us to gen-erate policy recommendations for the future development ofeach sector. The fourth question will be answered by summariz-ing the experts’ views and the results of the model.
1.3.Researcher
The Center for Economic and Social Development (CESD) was setup to promote the research and analysis of domestic economicand social issues with the purpose of positively influencing pub-lic policy and decision-making processes. The CESD works withand establishes a bridge between the government and the vari-ous representatives of civil society. Moreover, the CESD is alsothe top think tank in the region of Caucasus and Central Asia, andone of the top domestic economic think tanks in the world ac-cording to University of Pennsylvania. Harvard University has alsodeemed the CESD’s research as a reliable source of informationby including the center in its official think tank directory.
COMPETITIVENESS IN AZERBAIJAN ASSESSING SECTORIAL ECONOMIC POLICIES
Center for Economic & Social DevelopmentBetter Research, Better Reform, Better Policy
8

1.4.Structure of the paper
The following section discusses the qualitative and quantitativemethodologies used in this paper and how the data wasprocessed. The next section discusses each industry’s historicalGDP trends, unemployment rates and other relevant macroeco-nomic factors sector by sector, followed by expert views andmodeling results. The section after that comprises policy notesfor sectorial development that have been developed by analyz-ing the government’s sectorial policies, surveying their views onsectorial developments and studying the results of the quantita-tive analysis.
ZIYA ALILI RASHAD HASANOV FARHAD BAYRAMOV
FRIEDRICH-EBERT-STIFTUNG Regional Office for the South Caucasus
9

2. Methodology
2.1. General methodology
This section explains the assumptions and limitations of the mod-els so readers can better understand the results. To analyze thediversification of economic sectors of Azerbaijan, the researchersused two approaches:
1.Qualitative approach
2.Quantitative approach
The qualitative approach sought answers to research questionsabout the economy using non-numerical information such as in-terviewing prominent experts. As a result, the lists of sectorialguidelines were prepared based on the interpretations and ob-servations of these experts regarding current conditions and fu-ture expectations. Experts included independent analysts andrepresentatives of government agencies. Government repre-sentatives were given special attention as they have firsthand in-formation on the government’s sectorial policies. Interviewingthese experts played a big role for the researchers while draftingsectorial proposals.
Details of the quantitative approaches are discussed in the nextparagraphs:
2.2. Measures for economic diversification
The researchers also used quantitative methodologies as a toolto check the experts’ arguments. Tools used to measure the di-versification of the economy were an especially important meas-ure. In order to analyze the concentration of economic activitiesin economic fields, including measuring economic diversificationand investigating the existence of oligopoly, the researchers ap-plied two methods:
COMPETITIVENESS IN AZERBAIJAN ASSESSING SECTORIAL ECONOMIC POLICIES
Center for Economic & Social DevelopmentBetter Research, Better Reform, Better Policy
10

• Herfindahl-Hirschman Index• Ogive index
The Herfindahl-Hirschman Index (HHI) is widely used not only tomeasure market concentration and examine the existence of anoligopoly in an industrial economy, but also to evaluate eco-nomic diversity and macroeconomic specialization. The index isdefined by following formula
where S is the sectorial share and N is the number of sectors.From this equation, we deduce that, if each industry has an equalemployment share, the equation will have the lowest degree,otherwise the higher degrees of the index will be observed if acountry is only specialized in one industry.
The Ogive index was first implemented by Tress (1938) in to de-termine the diversity of economic sectors. Then, other econo-mists, for example, Hackbart and Anderson (1975), and Attaranand Zwick (1987), also applied this method to measure the di-versity of a country’s entire economy:
OGV = N * Σi=1 (P
i- 1/N)
where:
- is the sectorial share of GDP in the total GDP;
N – is the total number of sectors in the economy
If the result of estimating the Ogive index approaches 0 (zero),
the diversity of the economy is high; otherwise the greater above0 the result is, the less diverse the economy.
ZIYA ALILI RASHAD HASANOV FARHAD BAYRAMOV
FRIEDRICH-EBERT-STIFTUNG Regional Office for the South Caucasus
11
N

2.3. The vector autoregressive (VAR) model
In addition to the HHI and Ogive indices, the researchers usedthe vector autoregression model (VAR) to assess the impact ofeconomic variables (particularly GDP) and investigate the effectsof economic shocks. According to the Bank of England (2013),the VAR is a dynamic system of equations that estimates the re-lationships among economic variables by determining the lineardependence among a multiple time series. In the model, we con-sider some endogenous variables together, and it calculates thesimultaneous equations explaining that each variable own laggedor past values and lagged values of all independent variables. Inthe early 1980s, the VAR was mainly developed as a modelingtool by Christopher Sims. To estimate the equations in the mod-els in advance, we have to make sure that the predetermined(exogenous) variables are only current in some equations. How-ever, Sims discovered a framework that called the traditional ap-proaches into question. Sims and his followers argued that ifthere was real simultaneity among a set of variables, the vari-ables should be used on an equal footing and we would not seeany disparities between endogenous and exogenous variables.In a univariate autoregression there is a single-equation and sin-gle-variable model where the present value of the variable is ex-plicated by its own lagged values. The VAR, which consists of ann-equation and n-variable linear model where all variables arein turn explained by their own lagged values, including the pres-ent and past values of the remaining n-1 variables. This is Sims’approach to the econometric model.
Estimating the VAR helps us analyze the influence of exogenousvariables such as government spending, refinancing rates, moneysupply, tax exemptions, subsidies to GDP and investment. Themovement of endogenous variables within VAR, which is the ef-fect of exogenous variables shock, can be used as an instrumentto investigate these shocks.
COMPETITIVENESS IN AZERBAIJAN ASSESSING SECTORIAL ECONOMIC POLICIES
Center for Economic & Social DevelopmentBetter Research, Better Reform, Better Policy
12

The model is best at answering questions such as:
• How do the past values of one indicator affect its currentvariable?
• How does the past value of one indicator affect the othervariable’s current/past values?
• What if the dependent affects independent variables and notthe other way around?
The VAR, however, has the following weaknesses:
• It is sensitive to Lucas’ critique, which argues that all modelsare subject to policy changes of governments, and that anyestimation generated based on historical data will have nofuture implications if governments change their policies in avery short time.
• Existence of many lags or variables can cause poor perform-ance when the VAR forecast model is calculated.
• VAR requires input figures to be normalized. The researcherschose a Johnson transformation to normalize the input data.
As discussed, the researchers have used the variables below asinput figures. It shall be noted that each variable was different indifferent sectors. And some sectors had no information in a cou-ple of given variables. Thus, the researchers dropped these vari-ables and generated the sectorial VAR equation without thefollowing factor:
• Sectorial GDP (endogenous variable)• Sectorial investment (endogenous variable).• Sectorial fiscal policy tools
○ Sectorial government spending (exogenous variable)○ Sectorial tax exemptions (exogenous dummy variable)
• Monetary policy○ M3, broader money supply in the economy, not in the
sector (exogenous variable)○ Refinancing rate in the economy as it is same for all sec-
tors (exogenous variable)
ZIYA ALILI RASHAD HASANOV FARHAD BAYRAMOV
FRIEDRICH-EBERT-STIFTUNG Regional Office for the South Caucasus
13
These variables are abbreviated in the model as follows:• Sectorial GDP GDP or T_GDP (T= Transformed1 GDP)• Sectorial investment Inv or T_Inv• Sectorial government spending GS or T_GS• Sectorial tax exemptions TaxE, dummy variable: 0:
no tax exemptions, 1: tax exemptions• M3 T_M3• Refinancing rate RR
Having monetary policy and sectorial fiscal policy indicators re-gressed with sectorial GDP and investments allows the re-searchers to argue whether a particular fiscal policy, such as taxexemptions in agriculture, has been creating or destroying GDP,or attracting investments to the sector or not.
As an output, the VAR model generates the following figures: theregression coefficients, standard error and tests for each vari-able pairs; R-squared, Adjusted R-squared, Sum of Residuals; F-statistics, Akaike Information Criterion (AIC), Schwarz Criterion(SC) and other figures for each sector.
Coefficients of variable pairs measure the degree of impact of aone-point change in independent variable in dependent one(s),e.g., a coefficient of four of investments and GDP pairs shall beinterpreted as a one-point change in dependent variable is re-flected in the four-point change in GDP, holding all other inde-pendent variables constant. The signature of the coefficientindicates whether the impact was positive or negative: a nega-tive (positive) coefficient of four would imply a one-point in-crease in investment, which will result in four-point decrease(increase) in GDP.
COMPETITIVENESS IN AZERBAIJAN ASSESSING SECTORIAL ECONOMIC POLICIES
Center for Economic & Social DevelopmentBetter Research, Better Reform, Better Policy
14
1Transformed in this sense is a short abbreviation for Johnson transformations of thedata. The GDP figures and other variables having “T_” abbreviation before theirvariable names were normalized accordingly to make the VAR eligible. It is re-quirement of VAR to have input data normalized.

The standard error of variable pairs measures the deviation inestimation of the calculated coefficient to correctly predict theactual figures. Although there is no benchmark to compare andinfer from the standard error, the lower error is the better re-gression equation.
T-test for variable pairs are the “t-calculated” values calculatedby the software on coefficients. T-figures are used for conduct-ing a hypothesis test on the statistical significance of the vari-ables independently. The hypotheses are:
• H0: Coefficient = 0 (or, coefficient is not statistically signifi-cant)
• Ha: Coefficient NOT EQUAL to 0 (or, coefficient is statisticallysignificant)
The R-squared figure defines the goodness of fit of the regressionline, i.e., how good at explaining the given data the estimatedline is. The closer to 1, the fitter and better the model is. AdjustedR-squared is introduced to prevent many independent variablesfrom inflating the R-squared figure. In contrast to the R-squaredfigure, the adjusted R-squared figure measures the true good-ness of fit in multiple regression analysis and its robustnessagainst multicollinearity issues.
The sum of residuals is used to define the goodness of fit: howmuch of the change in dependent variables is explained by in-dependent variables? The higher degree of explanation, the bet-ter the fit is. However, the figure is not the ratio, making it hardto measure the extent of the explanation.
F-statistics, the Akaike information criterion and the Schwarz cri-terion are the three measures to define the model specification.By model specification it is assumed the goodness of the modelin explaining the given data. Given two models, the model witha higher F-statistics and lower Akaike and Schwarz criterion aredefined as the best explanatory models. This was the decision-
ZIYA ALILI RASHAD HASANOV FARHAD BAYRAMOV
FRIEDRICH-EBERT-STIFTUNG Regional Office for the South Caucasus
15

making criterion in model specification. The model loweringAkaike and Schwarz values and maximizing the F-value was cho-sen for the analysis.
Having provided the necessary information to understand themethodology, we discuss the results in the next section, whichstarts with an analysis of economic diversification and is followedby an assessment of sectorial policies.
COMPETITIVENESS IN AZERBAIJAN ASSESSING SECTORIAL ECONOMIC POLICIES
Center for Economic & Social DevelopmentBetter Research, Better Reform, Better Policy
16
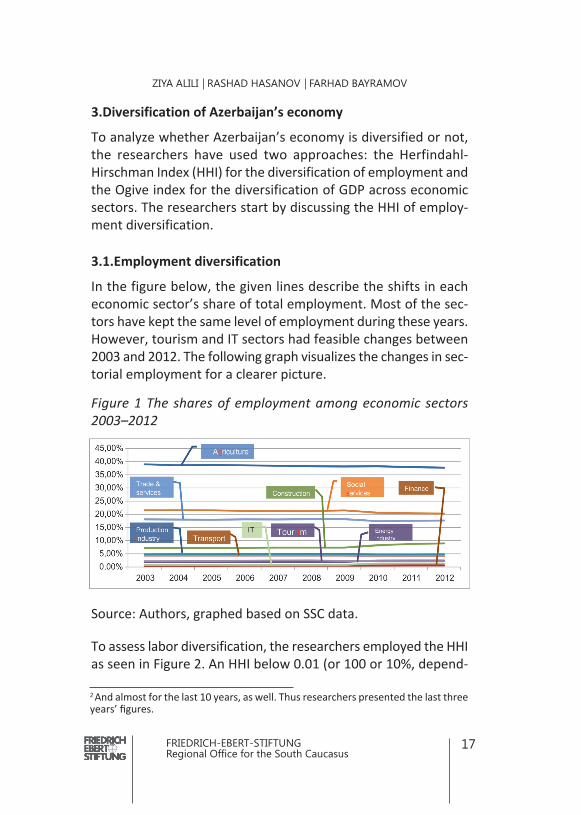
3.Diversification of Azerbaijan’s economy
To analyze whether Azerbaijan’s economy is diversified or not,the researchers have used two approaches: the Herfindahl-Hirschman Index (HHI) for the diversification of employment andthe Ogive index for the diversification of GDP across economicsectors. The researchers start by discussing the HHI of employ-ment diversification.
3.1.Employment diversification
In the figure below, the given lines describe the shifts in eacheconomic sector’s share of total employment. Most of the sec-tors have kept the same level of employment during these years.However, tourism and IT sectors had feasible changes between2003 and 2012. The following graph visualizes the changes in sec-torial employment for a clearer picture.
Figure 1 The shares of employment among economic sectors
2003–2012
Source: Authors, graphed based on SSC data.
To assess labor diversification, the researchers employed the HHIas seen in Figure 2. An HHI below 0.01 (or 100 or 10%, depend-
ZIYA ALILI RASHAD HASANOV FARHAD BAYRAMOV
FRIEDRICH-EBERT-STIFTUNG Regional Office for the South Caucasus
17
2 And almost for the last 10 years, as well. Thus researchers presented the last threeyears’ figures.
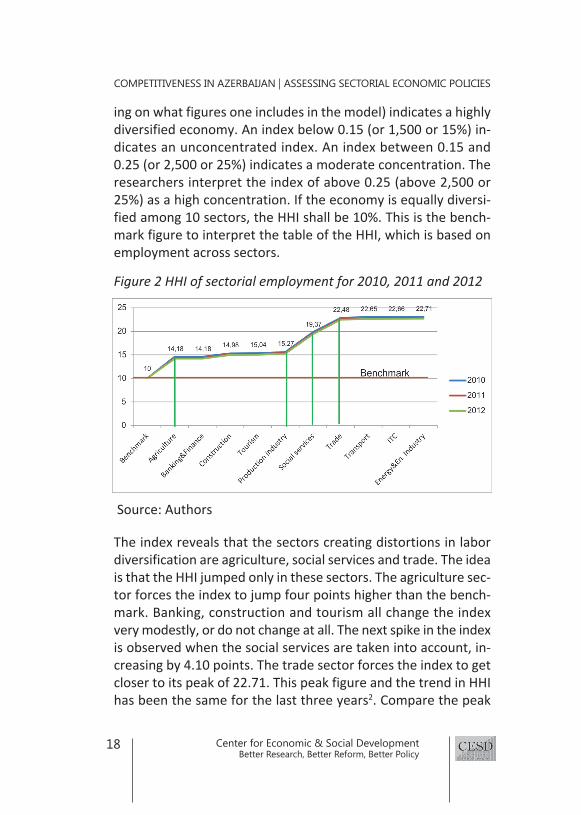
ing on what figures one includes in the model) indicates a highlydiversified economy. An index below 0.15 (or 1,500 or 15%) in-dicates an unconcentrated index. An index between 0.15 and0.25 (or 2,500 or 25%) indicates a moderate concentration. Theresearchers interpret the index of above 0.25 (above 2,500 or25%) as a high concentration. If the economy is equally diversi-fied among 10 sectors, the HHI shall be 10%. This is the bench-mark figure to interpret the table of the HHI, which is based onemployment across sectors.
Figure 2 HHI of sectorial employment for 2010, 2011 and 2012
Source: Authors
The index reveals that the sectors creating distortions in labordiversification are agriculture, social services and trade. The ideais that the HHI jumped only in these sectors. The agriculture sec-tor forces the index to jump four points higher than the bench-mark. Banking, construction and tourism all change the indexvery modestly, or do not change at all. The next spike in the indexis observed when the social services are taken into account, in-creasing by 4.10 points. The trade sector forces the index to getcloser to its peak of 22.71. This peak figure and the trend in HHIhas been the same for the last three years2. Compare the peak
COMPETITIVENESS IN AZERBAIJAN ASSESSING SECTORIAL ECONOMIC POLICIES
Center for Economic & Social DevelopmentBetter Research, Better Reform, Better Policy
18

(22.71) with the HHI of an equally shared economy: 10. Thus, interms of labor, Azerbaijan’s economy lacks diversification.
3.2.GDP diversification
As outlined in the methodology section, the Ogive index hasbeen chosen to analyze the GDP diversification of Azerbaijan.The index for Azerbaijan is given below. The researchers pre-ferred to present the index for only four years:
• Index for 2003, relatively diversified economy, prior topetrodollars
• Index of 2007–2008, the two top undiversified years• Index of 2012 for the idea on the last year’s diversification sit-
uation
The closer to 0, the better – i.e., more diversified – the index is.In our graph below, when the index touches zero, the economywill be fully diversified. Any deviations from zero would mean anon-diversified economy.
Figure 3 Ogive index of GDP diversification
Source: Authors
ZIYA ALILI RASHAD HASANOV FARHAD BAYRAMOV
FRIEDRICH-EBERT-STIFTUNG Regional Office for the South Caucasus
19

As the index shows, Azerbaijan’s economy is relatively diversi-fied without the tourism and energy and energy industry sectors.In all of the four chosen years, the index peaks when the energyand energy industry sector was included in the calculations. How-ever, in 2003, the energy and energy industry sector distortedthe economy less than in 2007 or 2008. Interestingly, in 2012,the energy and energy industry sector’s slope decreased, indi-cating a lesser dependency on the sector in 2012, compared to2007–2008. However, the index is still well above 0, signifying anon-diversified GDP.
These two indices show that Azerbaijan’s economy is diversifiedneither in terms of GDP nor employment. Thus, the researchersneed quantification of the sectorial policies for the developmentof policy recommendations. The section below discusses secto-rial economic policies and develops policy recommendationsgenerated based on discussion with prominent experts andmodel results. But first, the researchers provide sectorial devel-opment trends for a greater contextual understanding.
COMPETITIVENESS IN AZERBAIJAN ASSESSING SECTORIAL ECONOMIC POLICIES
Center for Economic & Social DevelopmentBetter Research, Better Reform, Better Policy
20

4.Sectorial policies of Azerbaijan’s economy and their econo-
metric assessment
This section first provides necessary background information onthe sectors of Azerbaijan’s economy and their historical devel-opments. This covers past sectorial GDPs, unemployment trendsand reforms until 2012. It then provides sectorial policies andthe results of the VAR model.
4.1.Banking sector
Azerbaijan’s finance system became independent in 1991, whenthe USSR dissolved. Since then the banking system has been two-tiered: comprising a central bank3 and retail banks. The centralbank controls the overall financial position of the banks in thesecond tier. The development of the banking system can be di-vided into two phases:
Phase 1: 1990 to the early 2000s. The National Bank of Azerbai-jan was established on 12 February 1992. At the time, the bank-ing sector in Azerbaijan was not very essential to the economy.It became important on 1 January 1994 when the manat wasmade the only legal tender in the country. However, inflationpeaked with the change of currency. During this period, Azer-baijan received special help from the World Bank and the IMF,which Azerbaijan joined on 18 September 1992. The deve lop -mental priority of this period was to nurture the number of pri-vate banks and internalize the banking sector. That’s why thegovernment tried to make the banking environment more com-petitive and extend public access to banking services.
Phase 2: 2005 to the present. At the beginning of 2005, inflationbegan to rise again and peaked at 16% in the first half of 2006 dueto the inflow of petrodollars, which forced the government to chan -ge the denomination of the manat on a scale of 1:5000, accordingto the Azerbaijan Today: The International Magazine (2013).
ZIYA ALILI RASHAD HASANOV FARHAD BAYRAMOV
FRIEDRICH-EBERT-STIFTUNG Regional Office for the South Caucasus
21
3“The National Bank of the Republic of Azerbaijan” till 18 March 2009
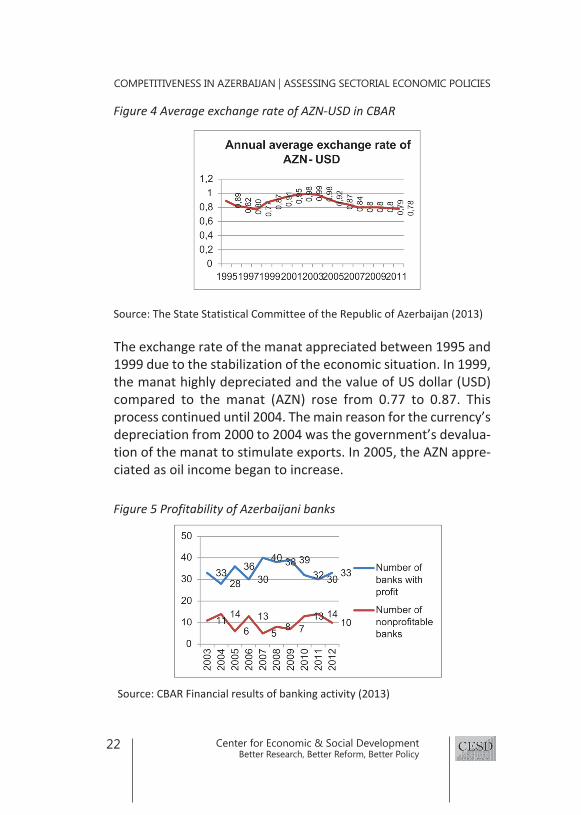
The exchange rate of the manat appreciated between 1995 and1999 due to the stabilization of the economic situation. In 1999,the manat highly depreciated and the value of US dollar (USD)compared to the manat (AZN) rose from 0.77 to 0.87. Thisprocess continued until 2004. The main reason for the currency’sdepreciation from 2000 to 2004 was the government’s devalua-tion of the manat to stimulate exports. In 2005, the AZN appre-ciated as oil income began to increase.
COMPETITIVENESS IN AZERBAIJAN ASSESSING SECTORIAL ECONOMIC POLICIES
Center for Economic & Social DevelopmentBetter Research, Better Reform, Better Policy
22
Figure 5 Profitability of Azerbaijani banks
Source: CBAR Financial results of banking activity (2013)
Figure 4 Average exchange rate of AZN-USD in CBAR
Source: The State Statistical Committee of the Republic of Azerbaijan (2013)

As we see in Figure 5, trends of banks with both profits and losseshave been fluctuating. As the total number of banks remainednearly the same (minimum 42; maximum 46; 43 for the lastyear), the two trends mirrored one another. The number ofbanks operating at a profit sharply increased in 2007 from 30 to40, and remained at nearly the same level until 2009. Althoughthe global financial crisis ne gatively impacted most of the world’sbanks at this time, in Azerbaijan, the number of banks operatingat a profit actually increased. The main reason for this was lim-ited capital mobilization, which generated a lot of profit in Azer-baijan from 2007 to 2009. Beginning in 2009, however, thenumber of profitable banks began to decrease as the number ofunprofitable ones increased because, although the crisis did notdirectly affect the financial sector in 2007, it began to harm othereconomic sectors. As a result, credit risks and non-performingloans increased, so the crisis’s negative impact on both the fi-nancial sector and the economy in general was delayed, becom-ing visible only after 2009. Beginning in 2011, the financial sectorbegan to recover.
4.1.1.Economic policy in the banking sector
The general VAR model for the sector is given with 2 lags, as 2lags maximized F value at 50.7844 by decreasing AIC and SC to0.622581 and 0.881147, respectively:
T_GDP = C(1,1)*T_GDP(-1) + C(1,2)*T_GDP(-2) + C(1,3) +C(1,4)*RR + C(1,5)*T_M3 + C(1,6)*TAXE
The VAR model with substituted coefficients.
T_GDP = 0.568148896688*T_GDP(-1) -0.00443824350922*T_GDP(-2) + 0.126261341789 -0.321022826504*RR + 0.35122148199*T_M3 -0.143291744594*TAXE
As the equation implies, the short-term economic policy (lag 1
ZIYA ALILI RASHAD HASANOV FARHAD BAYRAMOV
FRIEDRICH-EBERT-STIFTUNG Regional Office for the South Caucasus
23

or one quarter) in the sector is better reflected in the sectorialGDP than the six-month policy (lag 2 or two quarters). This is im-plied by the signs of first and second lags for the GDP coefficients+0.568148896688 and -0.00443824350922, respectively. More-over, the monetary policy of the government of Azerbaijan pos-itively affected the sector: the M3 coefficient is the highest valueamong exogenous variables with a value of 0.35122148199. Un-fortunately, the other tool of monetary policy, i.e., the refinanc-ing rate, almost had the same negative impact on the sectorialGDP. Interestingly, tax exemptions did not increase the GDP inthe sector. The model displays strong quality characters with R-squared, adj. R-squared and the sum of squared residuals figuresof 0.888081, 0.870594 and 3.023759, respectively.
The model confirms the results of interviews with experts duringthe research process: that the refinancing rate harms the GDP inthe banking sector. The independent experts who were inter-viewed took an alarming approach to the refinancing rate, argu-ing that it was too high to lower the loan rates for the sake ofsupporting entrepreneurship and the sectorial development. Onthe other hand, the central bank’s monetary policy fostersgrowth in the banking sector by an amount that is almost equalto the negative effect of the refinancing rate. On top of this, ex-perts revealed other factors not captured by the model:
• Lack of access to international financial markets hamperscompetition in financing sources and limits alternative fi-nancing.
• Banks are reluctant to develop: excluding a couple of retailbanks and financial institutions, most of them show no driveto create new products or innovations. This is borne out bythe lack of competition as well.
• According to a couple of the experts, having government in-tervention for lowered rates would only benefit the econ-omy as a whole.
COMPETITIVENESS IN AZERBAIJAN ASSESSING SECTORIAL ECONOMIC POLICIES
Center for Economic & Social DevelopmentBetter Research, Better Reform, Better Policy
24

4.2.The IT and telecommunications sector
The sector’s early development can be credited to the introduc-tion of the internet and the use of Azerbaijan’s national top-leveldomain “.az”. The private sector was the main driver in devel-oping the internet in the early years. This required a special li-cense, which was eliminated in 2000 to foster growth in thesector. Nearly 40 internet service providers have been operat-ing in the country since abolishing the license requirement. Threeof them are state agencies: Bakinternet, AzDataNet and AzTele-com. Figure 6 Main macro indicators of ITC sector, in millions of AZN
(at current prices) 4
The trend of value added by the IT and telecommunications sec-tor is upward. In 2005–2008, it increased sharply, but, at the be-ginning of 2009, a slowing of the growth rate can be observed.Gross and net operating surpluses increased in 2005–2009, fol-lowed by a gradual decrease in 2010, and then an upward trendin 2011–2012. Local and fixed capital investments decreased in
ZIYA ALILI RASHAD HASANOV FARHAD BAYRAMOV
FRIEDRICH-EBERT-STIFTUNG Regional Office for the South Caucasus
25
4No information about the amount of indicators in 2000 had been found during theinvestigation.

2009 due to the financial crisis. There is no information aboutthe amount of foreign investments made in 2009 and 2010, butgrowth was observed and the trend was upward in other years.
The proportion of the population employed in the IT and tele -communications sector remained nearly the same: around 1%between 2005 and 2009 (SSC, 2013). There was a slight increase to1.29% in 2010, but the percentage of workers remained stab le in2011.
Apart from macroeconomic indicators, we see a significant in-crease in the volume of IT and telecommunications services since2000:
The volume of telecommunications services has been increasingsince 2000 and, in 2011, the gross amount of services was nearlyeight times more than it was in 2000. The volume of IT serviceshad been increasing due to the growing volume of mobile com-munication services, which is the biggest part of tele com -munications services. But in 2010, there was a fall in the totalamount of services by nearly 22%. The main reason was the de-layed effect of the financial crisis on Azerbaijan’s economy. In2011, the indicator began to rise again, surpassing the 2009.
COMPETITIVENESS IN AZERBAIJAN ASSESSING SECTORIAL ECONOMIC POLICIES
Center for Economic & Social DevelopmentBetter Research, Better Reform, Better Policy
26
Figure 7 Volume of information and communications services, current
prices, in thousands of AZN
Source: The State Statistical Committee of the Republic of Azerbaijan (2013)

The numbers of ATS5 and landline telephones have only increasedsince 2000. Mobile telephone units have increased sharply, as well.In 2000, the total amount was 801,300, which rose to 9,396,500 in2011 – a more than 11-fold increase. If one considers the popula-tion in 2011, which was 9,111,100, it can be calculated that therewere 1.04 mobile numbers per person in the country. Put it dif-ferently, any given person often uses two or three mobile num-bers, one on each operator’s network. This is borne by theinefficiency of any single mobile operator for daily purposes.
As we see in Figure 9, the amount of trunk calls as well as local andinternational calls sharply increased in 2000-2005, but starting in2005, international calls, and local and trunk calls began decreas-ing sharply. The main reason for this is people using the internet,which is more comfortable and cheaper than telephone calls.
4.2.1.Economic policy in the IT and telecommunications sector
The government’s role in the development of the informationand communications technology (ICT) sector has been essential.In 2003–2012, the government carried out comprehensive and
ZIYA ALILI RASHAD HASANOV FARHAD BAYRAMOV
FRIEDRICH-EBERT-STIFTUNG Regional Office for the South Caucasus
27
Figure 8 Telephone communication
Source: The State Statistical Committee of the Republic of Azerbaijan (2013)
5Automated Telephone Stations

consistent actions in the ICT field. As a result, in many interna-tional reports, including the World Economic Forum’s The Global
Information Technology Report, Azerbaijan was listed among thetop 10 places in the world in the categories of “The success ofICT in support of the government” and “The importance of ICT inthe government’s vision of the future”. Moreover, Azerbaijanranked 56th among 144 countries in the same report’s networkreadiness index.
There were three main programs that played a significant role inthe development of the sector. The first program was establishedon 13 February 2007 when the President of Azerbaijan approvedthe State Program on Establishing Biometric Identification Systemin the Republic of Azerbaijan. This program was divided into twophases: the first phase (2007–2009) improved the legislativeframework in the area, and developed and adopted new norma-tive acts in biometric identification systems, actions to strengthenthe government’s control of migration processes, and improve-ments to the formation of information resources on individualiza-
COMPETITIVENESS IN AZERBAIJAN ASSESSING SECTORIAL ECONOMIC POLICIES
Center for Economic & Social DevelopmentBetter Research, Better Reform, Better Policy
28
Figure 9 Telephone communication (continued)
Source: The State Statistical Committee of the Republic of Azerbaijan (2013)

tion of documents for border crossing. The second phase (2010-2012) covered actions to expand and improve biometric tech-nologies (AR State Migration Service, 2013).
The second program was the State Program on Establishment andDevelopment of the Space Industry in the Republic of Azerbaijan,which was ordered by the president of Azerbaijan on 4 November2008. This program creates and develops the space industry,meets the needs of the state authorities for satellite communi-cations, provides for the growing radio and TV broadcasting needsof the population in the regions, increases the country’s interna-tional communication channels, and develops economic, social,scientific, cultural and security fields by the effective utilizationof outer space. Prospects for the development of this sector willbe created by enlarging the international cooperation in the spaceindustry, strengthening the potential of the space industry of theRepublic, developing space industry technologies, organizing newcommunications services, such as radio and TV broadcasting,earth remote sensing, hydrometeorology, meteorology, ecologi-cal monitoring, control of emergency situations, space investiga-tions, search and rescue programs, etc. (Presidential Admi nist- ra tion, 2013).
The final and main step is the establishment of »e-government«,or an activity implemented by government agencies through theuse of modern information technologies to provide informationand e-services to all residents of Azerbaijan, legal entities and in-dividuals, as well as foreign citizens and stateless persons. Themain objective of the newly established opportunities is to pro-vide services that will decrease the distance between civil ser-vants and citizens, i.e. to simplify these relations and make themtransparent. The widespread introduction of electronic servicesby government agencies, an increase in their number and qual-ity, and the development in citizens’ satisfaction with servicesare means by which the this goal can be achieved. Based on theinternational experience of arranging a more convenient way of
ZIYA ALILI RASHAD HASANOV FARHAD BAYRAMOV
FRIEDRICH-EBERT-STIFTUNG Regional Office for the South Caucasus
29
citizens and state authorities to communicate, e-government isbased on the »single window« principle.
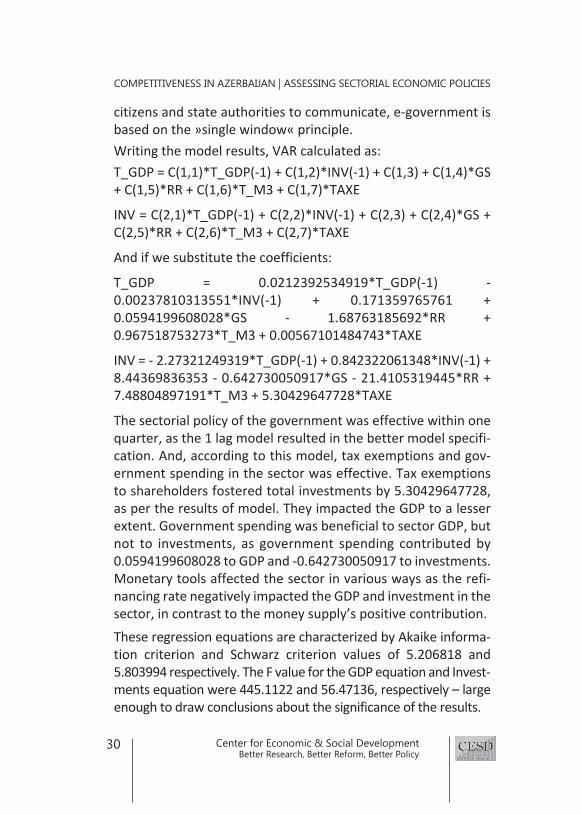
Writing the model results, VAR calculated as:
T_GDP = C(1,1)*T_GDP(-1) + C(1,2)*INV(-1) + C(1,3) + C(1,4)*GS+ C(1,5)*RR + C(1,6)*T_M3 + C(1,7)*TAXE
INV = C(2,1)*T_GDP(-1) + C(2,2)*INV(-1) + C(2,3) + C(2,4)*GS +C(2,5)*RR + C(2,6)*T_M3 + C(2,7)*TAXE
And if we substitute the coefficients:
T_GDP = 0.0212392534919*T_GDP(-1) -0.00237810313551*INV(-1) + 0.171359765761 +0.0594199608028*GS - 1.68763185692*RR +0.967518753273*T_M3 + 0.00567101484743*TAXE
INV = - 2.27321249319*T_GDP(-1) + 0.842322061348*INV(-1) +8.44369836353 - 0.642730050917*GS - 21.4105319445*RR +7.48804897191*T_M3 + 5.30429647728*TAXE
The sectorial policy of the government was effective within onequarter, as the 1 lag model resulted in the better model specifi-cation. And, according to this model, tax exemptions and gov-ernment spending in the sector was effective. Tax exemptionsto shareholders fostered total investments by 5.30429647728,as per the results of model. They impacted the GDP to a lesserextent. Government spending was beneficial to sector GDP, butnot to investments, as government spending contributed by0.0594199608028 to GDP and -0.642730050917 to investments.Monetary tools affected the sector in various ways as the refi-nancing rate negatively impacted the GDP and investment in thesector, in contrast to the money supply’s positive contribution.
These regression equations are characterized by Akaike informa-tion criterion and Schwarz criterion values of 5.206818 and5.803994 respectively. The F value for the GDP equation and Invest -ments equation were 445.1122 and 56.47136, respectively – largeenough to draw conclusions about the significance of the results.
COMPETITIVENESS IN AZERBAIJAN ASSESSING SECTORIAL ECONOMIC POLICIES
Center for Economic & Social DevelopmentBetter Research, Better Reform, Better Policy
30

According to experts, the government takes the largest share ofthe IT sector. Just three of 50 internet service providers (ISPs)are state-owned, yet these account for more than 40% of thesector’s GDP. This view is also supported by our model with itspositive correlation of government spending with sectorial GDP.Apart from this, experts believe that the current strategy is notenough to foster growth in the sector. In their view, the IT sec-tor needs to shift from services to production. Right now, Azer-baijan’s IT GDP is generated only by sales of its services. Expertsbelieve that IT cannot be labor consuming and a sector with di-versification potential in only IT services. In order to make thesector productive, labor consuming and GDP contributive sec-tor, IT needs to have its own factories to produce different elec-tric appliances and employ the graduates of local IT universitiesof Azerbaijan. According to independent experts, Azerbaijanshould not strive to compete with developed countries in thesatellite sector but rather should concentrate on building clus-ter infrastructure. In order to achieve this, prominent experts be-lieve that an independent supervisory entity should beestablished to lessen government influence and maintain enoughcontrol. Failure to establish this entity will result in further braindrain and loss of growth opportunities in the sector.
4.3.The construction sector
Construction is one of the sectors that has positively affected Azer-baijan’s economy. To review the past and current role of the con-struction sector in the economy, let us look at the statistical data.
As seen in the chart, the maximum amount of value added tothe GDP by the construction sector was observed in 2005. Afterthat, its share of GDP began to fall and reached its minimum in2007. Then it began to increase again and reached new height in2010. Although there was no decrease between 2007 and 2010,the construction sector was the worst hit by the global economiccrisis, facing a sudden lack of customers and capital, which nega-tively affected the main economic indicators of the sector. Others
ZIYA ALILI RASHAD HASANOV FARHAD BAYRAMOV
FRIEDRICH-EBERT-STIFTUNG Regional Office for the South Caucasus
31

sectors of the economy have not suffered as much as the construc-tion sector. As seen in Figure 11, the volume of work performed byconstruction enterprises had been increasing from 2000 to its peakin 2008, just before suffering from the financial crisis. But in 2010,the sector recovered with increases in both 2010 and 2011.
Figure 11 Selected indicators of the construction sector (current prices, in
thousands of AZN)6
Source: The State Statistical Committee of the Republic of Azerbaijan
(2013)
COMPETITIVENESS IN AZERBAIJAN ASSESSING SECTORIAL ECONOMIC POLICIES
Center for Economic & Social DevelopmentBetter Research, Better Reform, Better Policy
32
Figure 10 Share of sector GDP in percent
Source: The State Statistical Committee of the Republic of Azerbaijan (2013)
6 During the research there was no information about the amount of the necessary in-dicator in 2012

The volume of investment in construction had been increasingfrom 2000 to 2008, with the only observed decrease in 2009 dueto the overall decrease in economic activity. While in 2008 the in-vestment growth in construction services was 152% compared tothe previous year, in 2009 it was only 92%. In 2010 and 2011,however, the upward trend resumed. Investments in fixed capi-tal had also been increasing since 2000 and the decrease hadonly been observed in 2009. Investments in fixed capital are di-vided into two parts:
• Construction of objects in production • Construction of objects in the service sector
There is no exact information about their amount in 2000, but in2001 the proportion of investment was as follows: constructionof objects in production made up 72.5% and construction of ob-jects in service fields made up 27.5%. Due to the growing pro-duction sector, this proportion had been changing in favor of theconstruction of objects in production until 2004, when this sub-sector reached its maximum of 80.7% and the amount of invest-ment in the construction of objects in service fields was 19.3%.This proportion began to change in favor of the construction ofobjects in service fields in 2005 when the proportion of construc-tion of objects in production was 73.9% and the construction ofobjects in service fields 26.1%. As the former began to decrease,in 2011, the proportion of the construction of objects in produc-tion was 47.1% and the construction of objects in service fields52.9%. Year by year, the proportion had changed and now invest-ments in the construction of objects in service is a major sub-sec-tor that draws more and more investments each year.
Moreover, investment in construction and installation can alsobe divided according to domestic and foreign investments. In2000, the share of domestic investments was only 47.6% whilethe share of foreign investments was 52.4%. Then, the amountof foreign investments began to rise and hit its high in 2003: with
ZIYA ALILI RASHAD HASANOV FARHAD BAYRAMOV
FRIEDRICH-EBERT-STIFTUNG Regional Office for the South Caucasus
33
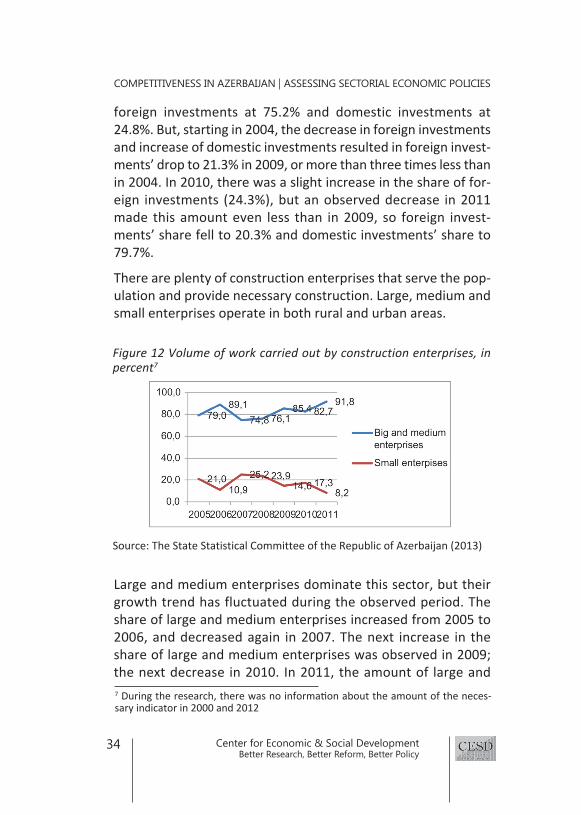
foreign investments at 75.2% and domestic investments at24.8%. But, starting in 2004, the decrease in foreign investmentsand increase of domestic investments resulted in foreign invest-ments’ drop to 21.3% in 2009, or more than three times less thanin 2004. In 2010, there was a slight increase in the share of for-eign investments (24.3%), but an observed decrease in 2011made this amount even less than in 2009, so foreign invest-ments’ share fell to 20.3% and domestic investments’ share to79.7%.
There are plenty of construction enterprises that serve the pop-ulation and provide necessary construction. Large, medium andsmall enterprises operate in both rural and urban areas.
Large and medium enterprises dominate this sector, but theirgrowth trend has fluctuated during the observed period. Theshare of large and medium enterprises increased from 2005 to2006, and decreased again in 2007. The next increase in theshare of large and medium enterprises was observed in 2009;the next decrease in 2010. In 2011, the amount of large and
COMPETITIVENESS IN AZERBAIJAN ASSESSING SECTORIAL ECONOMIC POLICIES
Center for Economic & Social DevelopmentBetter Research, Better Reform, Better Policy
34
7 During the research, there was no information about the amount of the neces-sary indicator in 2000 and 2012
Figure 12 Volume of work carried out by construction enterprises, in
percent7
Source: The State Statistical Committee of the Republic of Azerbaijan (2013)

medium enterprises reached its maximum: 91.8% of the sector.The opposite process was observed in the small enterprisestrend and, accordingly, in 2011, the trend of these enterprisesdropped to its minimum: 8.2% of the sector.
4.3.1. Economic policy in the construction sector
The equation of the VAR model for the construction sector isgiven with following equations:
T_GDP = C(1,1)*T_GDP(-4) + C(1,2) + C(1,3)*GS + C(1,4)*RR +C(1,5)*T_M3 + C(1,6)*TAXE
T_INV = C(1,1)*T_INV(-1) + C(1,2) + C(1,3)*GS + C(1,4)*RR +C(1,5)*T_M3 + C(1,6)*TAXE
Equations with substituted coefficients:
T_GDP = 0.399865214537*T_GDP(-4) - 0.588690407744 +0.000938985782972*GS + 3.30331439662*RR +0.232962854969*T_M3 + 0.0518696971713*TAXE
T_INV = - 0.00315704976078*T_INV(-1) - 0.633284957722 +0.00103569103213*GS + 1.06175495749*RR +0.578696222903*T_M3 + 0.0914668529147*TAXE
The quality figures for these tests are very robust with high sig-nificance implications. R-squared and adjusted R-squared figuresfor GDP and investment equations are {0.959687 and 0.952968}and {0.948795 and 0.941037}, respectively. The closeness ofthese figures implies a strong argument against a multi-collinearity problem. And these values themselves argue for astrong goodness of fit of the given model. The AIC, SC and F val-ues are {-0.057731; 0.206189; 142.8347} and {0.253052;0.508984; 122.2945} for the first and second equations. Thesefigures imply a high significance for regression results. The gov-ernment’s tax policy for entrepreneurs and spending in the sec-tor positively affected both investments and GDP in the sector.
ZIYA ALILI RASHAD HASANOV FARHAD BAYRAMOV
FRIEDRICH-EBERT-STIFTUNG Regional Office for the South Caucasus
35

The construction sector has very good potential for develop-ment. However, the actions to reveal this potential are veryweak. Thus, the economy is unable to exploit its full potential inthe sector. This problem is reflected in the high import costs ofraw materials in the construction sector. In other words, like theIT sector, the construction sector is also based on services thatare not labor consuming. The government of Azerbaijan canachieve large-scale employment and industrial growth by facili-tating local production of imported materials.
4.4.Agriculture Sector
Azerbaijan is one of the world’s oldest agricultural centers. Agri-culture is still the largest employer, making up 37.65% of thetotal workforce in Azerbaijan (Aras & Süleymanov, 2010). Agri-culture is the main sector in which the state creates initiativesfor poverty reduction and socio-economic development pro-grams. According to the State Statistical Committee, Azerbaijan’sagriculture sector has developed at a satisfactory pace in the last12 years. It is regarded as a socially strategic and labor-consum-ing sector, requiring special attention.
COMPETITIVENESS IN AZERBAIJAN ASSESSING SECTORIAL ECONOMIC POLICIES
Center for Economic & Social DevelopmentBetter Research, Better Reform, Better Policy
36
Figure 13 GDP in the agriculture sector in millions of AZN
Source: The State Statistical Committee of the Republic of Azerbaijan (2013)

That is why we can see progress on this chart between 2000 and2008. In 2009, GDP decreased due to the economic downturn.But from 2010 to 2012, the agricultural GDP gained ground.
The advantage of the agriculture sector is decreasing but is stillvery important.
In August 2004, the World Bank and the government of Azer-baijan approved the Investments to Agrarian Areas project. Ac-cording to this program, 78 new bank branches were to be builtin agrarian areas. It also affected the employment rate of agri-culture sector. As we can see on the chart, after 2005, the em-ployment rate rapidly increased.
According the Food and Agriculture Organization (FAO) of theUN, Azerbaijan has been much less affected by the global eco-nomic crisis than other countries in the region, but inflation ishigh and adversely affects the poor, with the poverty risk in-creasing with the size of the household. Income per capita forpeople living alone is twice as much as that for households with
ZIYA ALILI RASHAD HASANOV FARHAD BAYRAMOV
FRIEDRICH-EBERT-STIFTUNG Regional Office for the South Caucasus
37
Figure 14 Employment in agriculture
Source: The State Statistical Committee of the Republic of Azerbaijan (2013)

children. Based on the most recent data available on the preva-lence of undernourishment (2006–2008), Azerbaijan is classifiedby the FAO among countries with a very low level of hunger, i.e.,it has less than 5% undernourishment (FAO, 2011).
After 2009, several new state programs were adopted, such asthe State Program of Socio-Economic Development of the Re-gions of Azerbaijan (2009-2013), the State Program of PovertyReduction and Sustainable Development of the Republic of theAzerbaijan, the State Program of Ensuring Reliable Population inthe Republic of Azerbaijan in food provision (2008–2015).(Azerbaijan.az, 2013)
4.4.1.Economic policy in the agriculture sector
VAR model is given with the equations of
T_GDP = C(1,1)*T_GDP(-4) + C(1,2)*T_INV(-4) + C(1,3) +C(1,4)*T_SUBS + C(1,5)*T_M3 + C(1,6)*N_GOVTS +C(1,7)*N_TAXE + C(1,8)*N_RESR
and
T_INV = C(2,1)*T_GDP(-4) + C(2,2)*T_INV(-4) + C(2,3) +C(2,4)*T_SUBS + C(2,5)*T_M3 + C(2,6)*N_GOVTS +C(2,7)*N_TAXE + C(2,8)*N_RESR
And if we substitute the coefficients
T_GDP = 0.965321123637*T_GDP(-4) -0.00387223462725*T_INV(-4) - 0.156674186014 -0.0626043800329*T_SUBS + 0.0300216051326*T_M3 +0.00157285946848*GS + 0.0636174942792*N_TAXE +2.77435214417*RR
T_INV = 0.0830678718999*T_GDP(-4) -0.221876762856*T_INV(-4) - 0.357048015244 +0.670986838448*T_SUBS + 0.325002915455*T_M3 +0.00302615882777*GS - 0.123809766012* TAXE +1.71852030459*RR
COMPETITIVENESS IN AZERBAIJAN ASSESSING SECTORIAL ECONOMIC POLICIES
Center for Economic & Social DevelopmentBetter Research, Better Reform, Better Policy
38

The model specification had an interesting result: the agriculturesector was one of the rare sectors exhibiting long-term sectorialpolicy implications with a lag value of 4. In other words, the sec-torial policy was best reflected in the GDP and investments onlyafter four quarters. These regression equations exhibit qualitycharacteristics of very high F-statistic (174.1878 for GDP and48.2069 for investments), and very strong AIC and SC figures: -0.146877 for AIC and 0.55691 for SC. R-squared and adjusted R-squared for GDP in the sector were 0.977552 and 0.97194. Thesefigures for investments equation were 0.923382 and 0.904227,respectively.
According to the equations, subsidies negatively affected GDPbut positively affected investments. In other words, subsidies arenot reflected in the GDP figures of the sector. This conclusion isinferred from the negative coefficient of subsidies for GDP (-0.0626043800329) and a positive one for investments(0.670986838448). The government’s sectorial tax exemptionsand spending positively affected GDP as per the coefficients ofthese variables.
Experts believed that the profit margin was very low in this sec-tor, which affects everything – including, but not limited to, mo-tivation, competition, and export potential. This problem isexacerbated by a lack of reasonable access to capital and newtechnology. Illiteracy among farmers affects their export quantityand quality as well. Without an adequate understanding of agri-cultural products, farmers cultivate and grow items with low ex-port potential. In order to achieve GDP growth in this sector, thegovernment should immediately cut subsidies (which negativelyaffect sectorial GDP) and increase government investments inthe sector with even more tax exemptions provided to farmers.So farm farmers are exempted from paying all taxes but the taxon land. By minimizing trade intermediaries for agricultural ex-ports, the government could ensure that farmers maximize re-turns from production.
ZIYA ALILI RASHAD HASANOV FARHAD BAYRAMOV
FRIEDRICH-EBERT-STIFTUNG Regional Office for the South Caucasus
39

4.5.Tourism sector
Azerbaijan’s natural beauty, history, and archaeological artifactsdemonstrate the potential for its tourism sector. On top of this,Azerbaijan’s good climate – with nine out of 11 climatic zones –has attracted a lot of tourists. Also, the Caspian Sea coasts inKhachmaz and Lenkaran, and Astara’s tourism centers, havegained attention from tourists and increased potential for thetourism sector. According to the State Statistical Committee,tourists mostly visit Azerbaijan for recreational purposes, asshown in Figure 15 (State Statistic Commitee, 2013)
According to the Ministry of Tourism and Culture, this is due tothe widespread recreational and entertainment facilities in Azer-baijan. Tourists mostly come from countries in the Common-wealth of Independent States (CIS); European countries make uponly a small percentage of tourists. According to the Ministry ofTourism, the number of foreign guests increased to 1 million in2012. (Tourism, 2013)
COMPETITIVENESS IN AZERBAIJAN ASSESSING SECTORIAL ECONOMIC POLICIES
Center for Economic & Social DevelopmentBetter Research, Better Reform, Better Policy
40
Figure 15 Purposes of tourist visits to Azerbaijan in numbers
Source: State Statistics Committee (2013)

The adoption of the State Program on the Development ofTourism in the Republic of Azerbaijan for 2002-2005 created fa-vorable conditions for the development of tourism and inte-grated this sector with the international tourism market. Thisstate program also affected employment in the tourism sector,which increased fivefold between 2001 and 2005, as seen in Fig-ure 16. Also, this state program helped create investment op-portunities for Azerbaijan.
4.5.1. Economic policy in the tourism sector
On 27 August 2002, the state program on the Development ofTourism was approved. Moreover, the president approved thereform of the tourism sector, which focused on duty sharing inthe tourism sector. As per the results of this reform, the lengthof the license for tourism activities has been extended from twoto five years. The government’s tax revenues from the sector de-creased to 2.750 million AZN from 8 million AZN. And, thanks tothe amendments of the state program, the number of enter-prises in the tourism sector increased by 130.
ZIYA ALILI RASHAD HASANOV FARHAD BAYRAMOV
FRIEDRICH-EBERT-STIFTUNG Regional Office for the South Caucasus
41
Figure 16 Employment rate in tourism sector, in percent
Source: State Statistics Committee (2013)

According to the Azerbaijan Export and Investment PromotionFoundation (Azpromo), implementation of state programs in thesector has been investment efficient. The enormous potential ofAzerbaijan is another reason for investing in this sector, as itcould attract tourists from Iran, Russia and Central Asia. In addi-tion, Azerbaijan is located at geographically favorable locationbetween Europe and Asia.
The effects of this sector are quantified via the VAR model, whichis given with following model:
T_GDP = C(1,1)*T_GDP(-4) + C(1,2) + C(1,3)*GS + C(1,4)*RR +C(1,5)*T_M3 + C(1,6)*TAXE
With coefficients:
T_GDP = 0.363536156561*T_GDP(-4) + 0.0157295056967 +0.00503758131049*GS + 0.00784000322809*RR +0.667495120229*T_M3 + 0.235843115556*TAXE
The government’s fiscal policy positively contributed to the de-velopment of the sector. The same logic applies to the monetarypolicy. Among them, the largest implication was from monetarypolicies, specifically the money supply in the economy with thehighest coefficient of 0.667495120229. Despite this, tax exemp-tions had a huge contribution relative to the government spend-ing and refinancing rate, which is implied from its second largestcoefficient of 0.235843115556. Quality characteristics of thisequation make it one of the strongest equations in this research:a high F-statistic (330.2914) with low AIC and SC figures (-1.255862 and -0.991942).
One of the experts interviewed about the future prospects oftourism in Azerbaijan emphasized its natural beauty: »We justneed good management to benefit from this beauty.« When askedwhat »good management« meant, the expert interpreted it as es-tablishment of a competitive sector. Generally, experts outlinedthe following points for the future development of the sector:
• Development of winter tourism
COMPETITIVENESS IN AZERBAIJAN ASSESSING SECTORIAL ECONOMIC POLICIES
Center for Economic & Social DevelopmentBetter Research, Better Reform, Better Policy
42
• Local populations spend a substantial amount in neighbor-ing countries’ tourism centers because of the price: foreigntourism centers charge less for higher quality service.
• Azerbaijan’s visa policy is an obstacle to tourism; liberalizedvisa rules would support sectorial development.
4.6.The industry sector
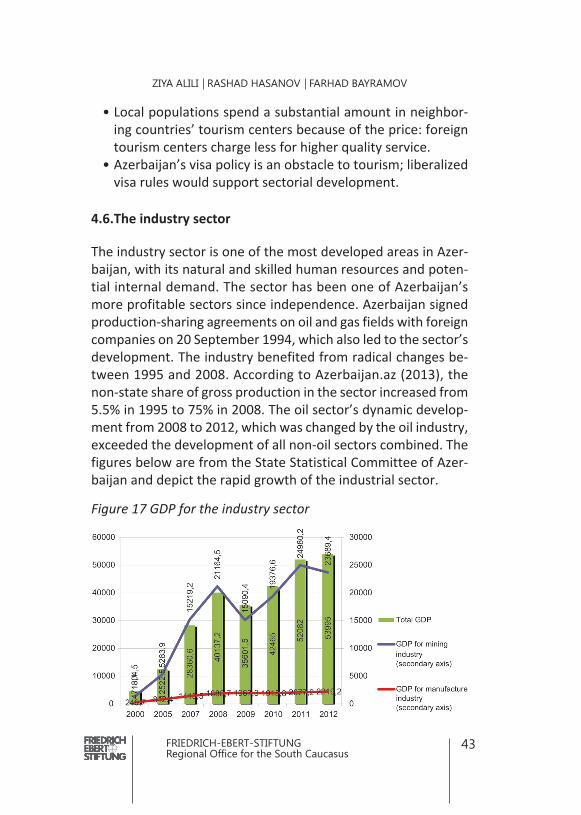
The industry sector is one of the most developed areas in Azer-baijan, with its natural and skilled human resources and poten-tial internal demand. The sector has been one of Azerbaijan’smore profitable sectors since independence. Azerbaijan signedproduction-sharing agreements on oil and gas fields with foreigncompanies on 20 September 1994, which also led to the sector’sdevelopment. The industry benefited from radical changes be-tween 1995 and 2008. According to Azerbaijan.az (2013), thenon-state share of gross production in the sector increased from5.5% in 1995 to 75% in 2008. The oil sector’s dynamic develop-ment from 2008 to 2012, which was changed by the oil industry,exceeded the development of all non-oil sectors combined. Thefigures below are from the State Statistical Committee of Azer-baijan and depict the rapid growth of the industrial sector.
Figure 17 GDP for the industry sector
ZIYA ALILI RASHAD HASANOV FARHAD BAYRAMOV
FRIEDRICH-EBERT-STIFTUNG Regional Office for the South Caucasus
43

From 2000 to 2008, Azerbaijan’s industrial sector saw serioussuccess. But between 2009 and 2010, the GDP decreased due tothe economic downturn. The analysis of the non-oil industry (asprovided in Figure 17) shows that, in 2010, the economy enjoyed6.2% growth in the sector. In 2011, non-oil industry was 5.7 bil-lion manats, an increase of 11.1%. And also, between 2011 and2012, non-oil industry grew 0.9%.
According to the International Labor Organization (2103), em-ployment in industry has declined sharply, from 23% in 1990 to9% in 2007. But, as seen in Figure 18, from 2009 to the present,the rate of industry employment increased 0.2% or by a total of5,000 jobs.
According to the State Statistical Committee (2013), inflation inthe industrial sector is reflected in Figure 19.
COMPETITIVENESS IN AZERBAIJAN ASSESSING SECTORIAL ECONOMIC POLICIES
Center for Economic & Social DevelopmentBetter Research, Better Reform, Better Policy
44
Figure 18 Employment for Industry sector, in whole numbers
Source: State Statistics Committee (2013)

Figure 19 Inflation rate for the industry sector, in percent
Source: State Statistical Committee of the Republic of Azerbaijan (2013)
As one can see, inflation in this sector was mainly pushed up bythe mining industry, as this indicator reflects rapidly changing oiland gas prices. Over the last 12 years, we can see that the peaklevel of inflation was in 2007. The rate then decreased until 2009,reflecting a drop in the world market. Inflation in the manufac-turing sector was almost constant for the last 12 years.
Next, we discuss investment in the sector.
ZIYA ALILI RASHAD HASANOV FARHAD BAYRAMOV
FRIEDRICH-EBERT-STIFTUNG Regional Office for the South Caucasus
45
Figure 20 Investments in the industry sector, in millions of AZN
Source: State Statistical Committee of the Republic of Azerbaijan (2013)
The mining industry seems more interesting to businessmenbased on the higher investment inflow to the subsector than themanufacturing industry. This interest is related to gas and oil pro-duction. But if we just look at the non-oil industry in 2010, wecan observe 12.2% growth in investments. According to the Min-istry of Economic Development (2012), between 2005 and 2010,the economy saw private investments directed to the non-oilsector as well. From 2010 to 2012, investments increased by41.2%. In addition to general private investments, private cor-porate investments are also growing: the sale of Garadagh Ce-ment to Holcim and BP is one of the bright examples.
4.6.1.Economic policy in the industry sector
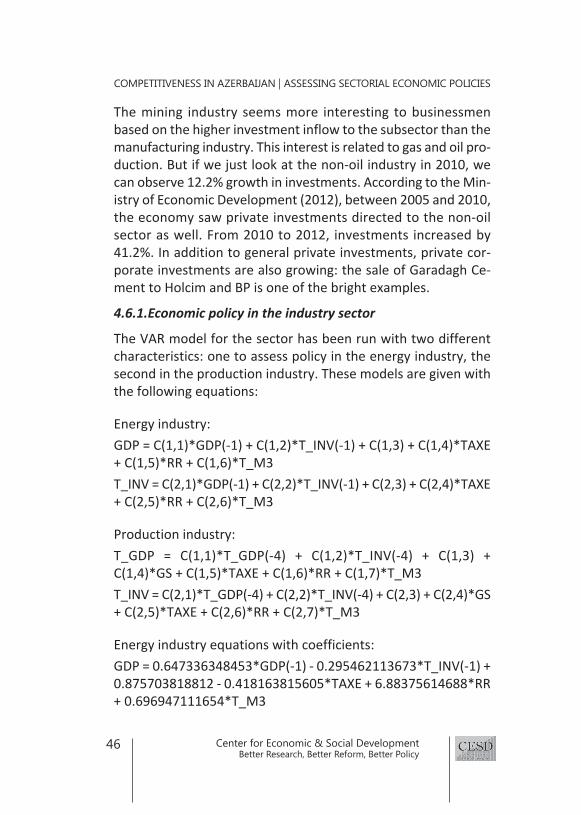
The VAR model for the sector has been run with two differentcharacteristics: one to assess policy in the energy industry, thesecond in the production industry. These models are given withthe following equations:
Energy industry:
GDP = C(1,1)*GDP(-1) + C(1,2)*T_INV(-1) + C(1,3) + C(1,4)*TAXE+ C(1,5)*RR + C(1,6)*T_M3
T_INV = C(2,1)*GDP(-1) + C(2,2)*T_INV(-1) + C(2,3) + C(2,4)*TAXE+ C(2,5)*RR + C(2,6)*T_M3
Production industry:
T_GDP = C(1,1)*T_GDP(-4) + C(1,2)*T_INV(-4) + C(1,3) +C(1,4)*GS + C(1,5)*TAXE + C(1,6)*RR + C(1,7)*T_M3
T_INV = C(2,1)*T_GDP(-4) + C(2,2)*T_INV(-4) + C(2,3) + C(2,4)*GS+ C(2,5)*TAXE + C(2,6)*RR + C(2,7)*T_M3
Energy industry equations with coefficients:
GDP = 0.647336348453*GDP(-1) - 0.295462113673*T_INV(-1) +0.875703818812 - 0.418163815605*TAXE + 6.88375614688*RR+ 0.696947111654*T_M3
COMPETITIVENESS IN AZERBAIJAN ASSESSING SECTORIAL ECONOMIC POLICIES
Center for Economic & Social DevelopmentBetter Research, Better Reform, Better Policy
46

T_INV = -0.00249026835331*GDP(-1) + 0.21179896571*T_INV(-1)- 1.05478608361 + 0.893997615246*TAXE + 10.4926184995*RR+ 0.601231702883*T_M3
Production industry:
T_GDP = 0.138349605908*T_GDP(-4) +0.000840335631469*T_INV(-4) - 1.2271216494 +0.504238455642*GS + 0.117947061606*TAXE +7.66232332211*RR + 0.0405942142149*T_M3
T_INV = 0.331625514703*T_GDP(-4) - 0.545305964281*T_INV(-4)- 1.05547291093 + 0.293261980213*GS +0.230496965203*TAXE + 6.90987203266*RR +0.971094179946*T_M3
Tax exemptions negatively affected sectorial GDP in the energyindustry, but positively affected investments. As per this equa-tion set, sectorial GDP and investment is best explained with a 1-quarter lag. Or the policy decisions are reflected in sectorial GDPafter 1 quarter, as per the model. The monetary policy’s effect onthe sector was positive. This is supported by the correlation ofsectorial GDP (i.e. petrodollar inflow) with the exchange rate andmoney supply policies of the central bank.
The quality of the figures for the energy industry equation, how-ever, gave some alarming results: R-squared and adj. R-squaredfigures for the GDP and investments equations were {0.8899150.873235} and {0.296467 0.189871}. Although figures for GDPshow satisfactory results, figures for investment display a multi-collinearity problem. Thus, one can rely on GDP figures, but noton the coefficients of the investment equation. On top this, theF-value for investments displays strong insignificance (2.781223).The F-value for the GDP, however, is significant (53.35342). De-spite this, AIC and SC figures imply a reliable model specificationwith values of 4.860982 and 5.372848, respectively.
The GDP of the production industry, as well as investment in the
ZIYA ALILI RASHAD HASANOV FARHAD BAYRAMOV
FRIEDRICH-EBERT-STIFTUNG Regional Office for the South Caucasus
47

sector, benefited from all government policies. Excluding the refi-nancing rate, government spending had the largest contribution tosectorial GDP. Tax exemptions benefited the sector to a lesser ex-tent than government spending. R-squared and adj. R-squared fig-ures for the GDP and investments equation were {0.865499;0.837671} and {0.971414; 0.9655}. All four figures imply strong sig-nificance of the results. This conclusion is backed with F-values of31.10186 and 164.2468 for GDP and Investment equations. AIC andSC figures are further arguments for strong statistical significance,with -0.016262 and 0.599551, respectively.
Experts believe that industry is the most important sector for de-velopment in the economy. However, this sector is presently in aprecarious situation: more than 80% of it is oil-dependent. Theseexperts compare the share of oil in industry in 1990 (4.8%) withthat of the 2010s. These experts believe this shift transformed thecountry into an exporter of raw materials. They believe that withthe same transport, insurance and other non-production relatedcosts, Azerbaijan can export more finished goods instead of rawmaterials at a substantially higher profit margin (measured by 4x).According to other experts, shifting from the mere sale of oil to thesale of oil products is beneficial for the following reasons:
• It is resource-efficient; the rate of depletion of current oil re-serves will be decreased
• It is more profitable (by a margin of 4x)• It will employ more people than the current oil industry
4.7.The transport sector
In recent years, the transport sector had the fastest-growing con-tribution to national GDP. The transport sector in Azerbaijan in-cludes air traffic, long-haul trucking, waterways and railroads. Morethan 22,000 km of roads, over 2,000 km of railroads as well as fiveinternational and two local airports contribute to this sector’s de-velopment. These facilities are managed and regulated by the Min-istry of Transportation. The Ministry was established on 5 August
COMPETITIVENESS IN AZERBAIJAN ASSESSING SECTORIAL ECONOMIC POLICIES
Center for Economic & Social DevelopmentBetter Research, Better Reform, Better Policy
48

1998 by Presidential Decree No. 743, which divided the sectorinto the following subsectors: railways, road transport and roads,air transport and airports, and maritime transport and ports. Ac-cording to the Ministry of Transportation (2013), Azerbaijan isinvolved in some big international projects, such as TRACECA, torevitalize the ancient Silk Road, the Baku-Tbilisi-Kars railway, etc.Transport routes for gas and oil production and pipelines, such asthe Baku–Tbilisi–Ceyhan, are regulated by the Ministry of Trans-portation as well. At the end of 2009, the Minister of Trans-portation signed a protocol with the Korean InternationalCooperation Agency for a feasibility study of the Baku Bay SeaBridge Project. The planned bridge would connect the Shykh andZig settlements of Baku. The value added by the transport sectoris as follows:
Figure 21 Value added in the transport sector
Source: State Statistical Committee of the Republic of Azerbaijan (2013)
As we observe in Figure 21, the value added by the transport sec-tor increased fivefold from 2000 to 2012. The main reason forthis rapid growth was the increase in public and private projectsin the sector. These projects increased employment in the sector,too.
ZIYA ALILI RASHAD HASANOV FARHAD BAYRAMOV
FRIEDRICH-EBERT-STIFTUNG Regional Office for the South Caucasus
49
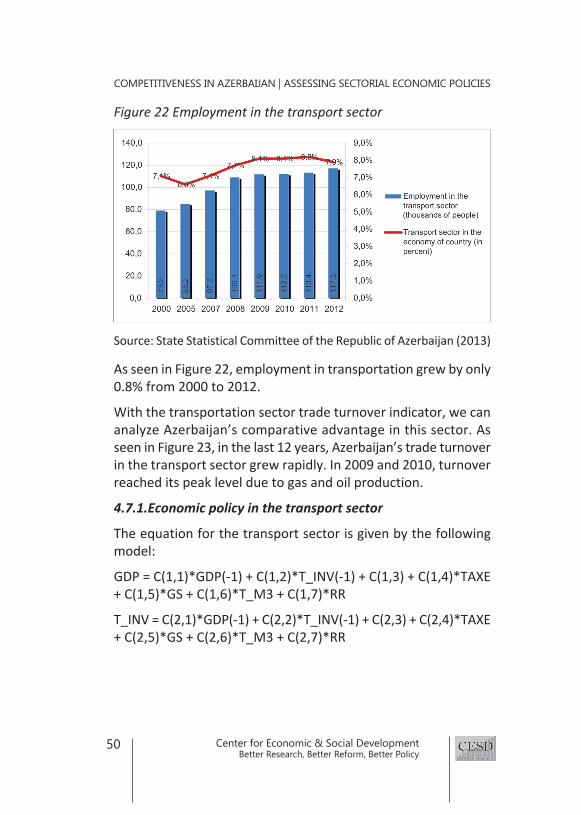
Figure 22 Employment in the transport sector
Source: State Statistical Committee of the Republic of Azerbaijan (2013)
As seen in Figure 22, employment in transportation grew by only0.8% from 2000 to 2012.
With the transportation sector trade turnover indicator, we cananalyze Azerbaijan’s comparative advantage in this sector. Asseen in Figure 23, in the last 12 years, Azerbaijan’s trade turnoverin the transport sector grew rapidly. In 2009 and 2010, turnoverreached its peak level due to gas and oil production.
4.7.1.Economic policy in the transport sector
The equation for the transport sector is given by the followingmodel:
GDP = C(1,1)*GDP(-1) + C(1,2)*T_INV(-1) + C(1,3) + C(1,4)*TAXE+ C(1,5)*GS + C(1,6)*T_M3 + C(1,7)*RR
T_INV = C(2,1)*GDP(-1) + C(2,2)*T_INV(-1) + C(2,3) + C(2,4)*TAXE+ C(2,5)*GS + C(2,6)*T_M3 + C(2,7)*RR
COMPETITIVENESS IN AZERBAIJAN ASSESSING SECTORIAL ECONOMIC POLICIES
Center for Economic & Social DevelopmentBetter Research, Better Reform, Better Policy
50

And if we substitute the coefficient into the model:
GDP = 0.806597758766*GDP(-1) + 6.86390380839*T_INV(-1) +120.715226744 - 36.2457105668*TAXE - 1.44292810957*GS +39.03473388*T_M3 - 16.5904897893*RR
T_INV = 0.000992955091305*GDP(-1) +0.257530485078*T_INV(-1) - 1.1656682823 +0.762481642943*TAXE + 0.0352142648769*GS +0.557211585274*T_M3 + 0.667124829002*RR
From the equations, one can infer that quarterly economic pol-icy proved better than others. Investments in the sector bene-fitted from all of the policies. However, GDP in the sectorsuffered from both fiscal and monetary policies. On the otherhand, goodness of fit figures for the sector implied robust re-sults. R-squared and adj. R-squared figures are {0.979244;0.975352} and {0.90726; 0.889873} for GDP and investmentequations, respectively. However, AIC and SC values tell a dif-ferent story than R-squared values: AIC (10.78806) and SC(11.38523) are high enough to conclude statistical insignificanceof the coefficients for the GDP equation.
Integrating experts’ opinions with the results of the model, one
ZIYA ALILI RASHAD HASANOV FARHAD BAYRAMOV
FRIEDRICH-EBERT-STIFTUNG Regional Office for the South Caucasus
51
Figure 23 Turnover of goods in Transport sector, billion tones per km
Source: State Statistical Committee of the Republic of Azerbaijan (2013)
can infer that projects and policies in the sector have contributedto the sectorial GDP. Experts believe that the currently under-taken projects, such as the Baku–Tbilisi–Kars railway, the Baku–Alat Seaport and the TransCaspian routes, will increase GDP. Ontop of this, there were ideas to cut subsidies to public transport,but not with a cost to customers. These experts promoted es-tablishing an adequate number of public transport companies toincrease efficiency and reduce cost and thus dependence on sub-sidies. Summing up the views of experts, we note the followingpoints:
• This is one of the sectors with unrevealed potential• Once completed, current projects will help the sector grow• To foster even more growth, the shadow sector should be
eliminated• Modernization of the sector occurs at a slow pace
COMPETITIVENESS IN AZERBAIJAN ASSESSING SECTORIAL ECONOMIC POLICIES
Center for Economic & Social DevelopmentBetter Research, Better Reform, Better Policy
52
5.Conclusion and recommendations
This paper studies Azerbaijan’s economic diversification and as-sesses sectorial fiscal and monetary policies from the perspectiveof GDP creation and investment attraction. For this purpose, theresearchers interviewed and compiled the views of independentexperts and government representatives, who are the only sourceof information regarding the government’s current and future sec-torial policies. To check these views against quantitative results,the researchers employed three quantitative measures, namely:the Herfindahl-Hirschman Index to measure labor diversification,the Ogive index to measure GDP diversification, and the VARmodel to test sectorial fiscal and monetary policies. Data for thesemodels were taken from the State Statistical Committee as wellas independent experts and different ministries.
As these methods showed, Azerbaijan’s economy is neither alabor-diversified nor a GDP-diversified economy. The HHI andOgive indices jumped when the agricultural and social servicessectors (in labor diversification) and the energy industry (for GDPdiversification) were introduced into the models. And the higherthe index is, the less diversified the economy.
The most notable results of the VAR model were:
• Subsidies are destroying the GDP in the agriculture sector.Either their distribution scheme should be changed to reflectfarmers’ productivity or they should be cut entirely. Themodel argues that the current method of distributing subsi-dies based on the area of cultivation is not the best methodto create GDP in the sector.
• The banking sector largely benefitted from the money supplyin the economy. However, the refinancing rate destroyedGDP in the sector. This yields one conclusion: the higher theinterest rates, the more it harms the GDP. Thus, rates shouldbe lowered.
• The IT and construction sectors are dependent on the gov-ernment’s fiscal policy: the government’s spending and taxexemptions added to GDP in both sectors .
• The production industry’s contribution to the GDP, not to
ZIYA ALILI RASHAD HASANOV FARHAD BAYRAMOV
FRIEDRICH-EBERT-STIFTUNG Regional Office for the South Caucasus
53

mention sectorial investment, benefitted from all of the gov-ernment’s policies; however, the energy industry was hurtby the government’s tax policy.
• The transport sector was also one of the sectors that largelybenefitted from all of the government’s sectorial policies.
The implications of the models are very close to those of the ex-perts who were interviewed. Their sectorial recommendationscould be summarized as follows:
Banking
• Lack of competition among banks impedes development inthe sector.
• The limited number of services offered by banks restricts in-come sources, which are driven almost only by interest income.
• Loan interest rates are high. As a result, funding in the economyshrinks, incentives for innovation decrease, cash flow con-straints become a regular problem, and profitability goes down.
• Banks have no presence in the international financial mar-kets, which prevents them from cheaper access to capital.
• Participation of banks with foreign capital constitutes a minorpart of the sector. Involving outstanding international banksin the sector would foster a competitive environment, en-hancing the range of services and foreign investment flow.
IT and communication
• The sector has developed by focusing on meeting internaldemand. Although recently satellite service has been addedto the sector, focusing only on internal demands impedesfurther development.
• The government’s share is large. As a result, it creates a mo-nopoly and, hence, an unfair market environment, and theprivate sector lags behind.
• The sector suffers from the lack of a skilled workforce. Al-though new training and education programs have been or-ganized, there is still a strong need for a qualified workforce.The quality of the local education system in this field is alsoquestionable.
• Actions taken to improve the sector are not enough. In fact,
COMPETITIVENESS IN AZERBAIJAN ASSESSING SECTORIAL ECONOMIC POLICIES
Center for Economic & Social DevelopmentBetter Research, Better Reform, Better Policy
54

the sector’s production ability has not formed. Service activi -ties are still the priority.
• In general, intersectional coordination and developmenttrends are weak. Workforce training, using this workforce inproduction sphere and exporting options are limited.
Construction
• The construction sector is focuses mainly on internal demandand its demand only derives from internal needs.
• Monopolistic tendencies in the sector are high, which resultsin a less competitive environment and price bubbles, whichhamper the growth of mid-sized enterprises, and createsnon-transparent turnover.
• Companies in the sector are more service-specialized. Thereis almost no production, except stone quarries and concreteplants. Most raw construction materials are imported fromRussia, Turkey, Ukraine, Spain, Italy and China.
• Prices in real estate markets do not reflect the true purchas-ing power of consumers, and this decreases development inthe sector. As a consequence, although there is enough roomfor development, the situation in the real estate market isfar from revealing this potential.
• A passive mortgage loan policy impedes growth in the con-struction sector.
• The sector is dependent on government investment.
Agriculture
• Profitability is low; suppliers try to buy products for cheaperprices and it results in less return for farmers and decreasedinnovation.
• Productivity is low, which also negatively affects profitability. • Scarce financial funds limit production potential.• Quality of land resources decreases year by year due to lack
of care and the saline content in the soil increases. • No specialized or scientific approaches are used during the
production process. Because traditional methods are morecommonly used in farming and cattle breeding, general pro-ductivity does not meet modern standards.
ZIYA ALILI RASHAD HASANOV FARHAD BAYRAMOV
FRIEDRICH-EBERT-STIFTUNG Regional Office for the South Caucasus
55
• Farmers have limited market access, so products are oftensold to intermediaries at less than fair market value.
• Export capability is so weak that it decreases incentives toproduce goods with competitive advantages.
• Quality is low, which negatively impacts export potential andcompetitiveness.
Tourism
• The country’s tourism potential is not fully realized. For ex-ample, winter tourism is underdeveloped, so citizens tend togo abroad for winter vacation.
• There is a narrow range of choices in the tourism sector, sopeople who prefer a diverse array of choices go abroad fortourism.
• The quality of service is so low that foreign tourists cannot beturned into repeat customers.
• There are problems with visa issues. Even with nearby coun-tries, such as Turkey and Iran, there is no visa-free regime. Ingeneral, bureaucratic barriers and inefficiency of organiza-tions within the sector restrict ease of travel to and withinthe country.
Transportation
• Although the country’s geographic location is advantageousfor developing the transportation sector, conditions in thissphere are not satisfactory. Corruption and high tariffs im-posed in the customs system diminish the country’s transitpotential, for example, by depressing the volume of shipping.
• In spite of substantial investment, the process of meeting in-ternational standards for transport infrastructure and de-signing modern transport systems has not been completed.As a result, multiple projects with the same purpose arefunded over and over again, constituting a major part ofbudget expenditures and yet producing limited progress.
Industry
• The sector’s dependence on oil has increased. While theshare of oil in the mining industry was 4.8% in 1990s, it isnow 80%.
COMPETITIVENESS IN AZERBAIJAN ASSESSING SECTORIAL ECONOMIC POLICIES
Center for Economic & Social DevelopmentBetter Research, Better Reform, Better Policy
56

• The country became a raw material producer and exporter,especially in the oil sector.
• The lack of final product exports is an inefficient use of re-sources. Oil reserves have started to decline and, after ashort time, income from oil will decrease and the oil fund willcome to an end.
5.1.Recommendations for diversification
Having discussed sectorial development potentials and prob-lems, the CESD proposes the following recommendations toachieve economic diversification:
• To establish competition in all sectors. Lack of competitiondecreases motivation for development, competition and in-novation in the economic sector. Competition in the privatesector is the only way of revealing true potential for all sec-tors in Azerbaijan
• To decrease the government’s participation in the economy,which should only be regulated for social security purposes.The rest should rely on the private sector
• To immediately suspend subsidies, as they are destroyingvalue in agriculture sector
• To eliminate trade intermediaries in the agriculture sector orthe achievement of fair treatment of farmers by these inter-mediaries
• To lower financing costs, which are sky-high in comparisonwith developed countries. On average, more than 20–25%of profit margins are decreased due to higher financing costs;High financing costs decreasing tax payments, as well
• To increase the presence of foreign financial capital, whichcan only help sectorial development
• To develop the IT industry and establish IT clusters• To concentrate less on satellite competition with developed
economies• To concentrate more on preventing possible IT brain drain• To establish the production of imported raw materials used
during construction• To establish winter tourism facilities
ZIYA ALILI RASHAD HASANOV FARHAD BAYRAMOV
FRIEDRICH-EBERT-STIFTUNG Regional Office for the South Caucasus
57

6.Bibliography
1. The State Statistical Committee of the Republic of Azerbai-jan, 2013. http://www.azstat.org/MESearch/search?depar-tament=22&lang=az. [Online] Available at: http://www.azstat.org/MESearch/search?de-partament=22&lang=az[Accessed 1 August 2013].
2. AR State Migration Service, 2013. AR State Migration Service.[Online] Available at: http://migration.gov.az/images/pdf/2df058a1b073d220af0aab3aac9ce0d3.pdf[Accessed 20 August 2013].
3. Aras, D. N. & Süleymanov, E., 2010. AZƏRBAYCAN İQTİSADİY -YATI. 1st ed. Baku: “Şərq-Qərb” Mətbəəsi.Azerbaijan Today The International Magazine, 2013.http://www.azerbaijantoday.az/. [Online] Available at: http://www.azerbaijantoday.az/ARCHIVE/21/economics4.html[Accessed 12 August 2013].
4. Azerbaijan.az, 2013. Azerbaijan Industry. [Online] Available at: http://www.azerbaijan.az/_Economy/_Industry/_industry_a.html[Accessed 8 August 2013].
5. Azerbaijan.az, 2013. ECONOMIC REFORMS. [Online] Available at: http://azerbaijan.az/portal/Economy/Reforms/reforms_e.html[Accessed 1 August 2013].
6. Azerbaijan.az, 2013. INDUSTRY SECTOR DEVELOPMENT PRI-ORITIES IN 2008-2011. [Online] Available at: http://www.azerbaijan.az/_Economy/_Industry/_industry_e.html[Accessed 8 August 2013].
7. Azerbaijan24.az, 2013. British Council: Azerbaijan tourismindustry lacks reception specialists for hotels and restau-
COMPETITIVENESS IN AZERBAIJAN ASSESSING SECTORIAL ECONOMIC POLICIES
Center for Economic & Social DevelopmentBetter Research, Better Reform, Better Policy
58

rants. [Online] Available at: http://azerbaijan24.com/component/con-tent/article/1-latest-news/272-british-council-azerbaijan-tourism-industry-lacks-reception-specialists-for-hotels-and-restaurants.html[Accessed 3 August 2013].
8. Bank of England, 2013. Economic models at the Bank ofEngland. [Online] Available at: www.bankofengland.co.uk[Accessed 15 09 2013].
9. CBAR Annual Report 2001, 2013. Central Bank of AzerbaijanRepublic Annual Report 2001. [Online] Available at: http://cbar.az/assets/319/2001_yekun.pdf[Accessed 15 August 2013].
10.CBAR Annual Report 2002, 2013. CBAR Annual Report 2002.[Online] Available at: http://cbar.az/assets/324/2002_yekun.pdf[Accessed 15 August 2013].
11.CBAR Annual Report 2003, 2013. CBAR Annual Report 2003.[Online] Available at: http://cbar.az/assets/331/2003_yekun.pdf[Accessed 15 August 2013].
12.CBAR Annual Report 2004, 2013. CBAR Annual Report 2004.[Online] Available at: http://cbar.az/assets/336/2004_yekun.pdf[Accessed 15 August 2013].
13.CBAR Annual Report 2005, 2013. CBAR Annual Report 2005.[Online] Available at: http://cbar.az/assets/340/2005_yekunlari.pdf[Accessed 15 August 2013].
14.CBAR Annual Report 2006, 2013. CBAR Annual Report 2006.[Online] Available at: http://cbar.az/assets/344/2006_il_yekun.pdf[Accessed 15 August 2013].
ZIYA ALILI RASHAD HASANOV FARHAD BAYRAMOV
FRIEDRICH-EBERT-STIFTUNG Regional Office for the South Caucasus
59

15.CBAR Annual Report 2007, 2013. CBAR Annual Report 2007.[Online] Available at: http://cbar.az/assets/348/2007_yekun.pdf[Accessed 15 August 2013].
16.CBAR Annual Report 2008, 2013. CBAR Annual Report 2008.[Online] Available at: http://cbar.az/assets/351/2008-illik_PS.hesabat-son-2.pdf[Accessed 15 August 2013].
17.CBAR Annual Report 2009, 2013. CBAR Annual Report 2009.[Online] Available at: http://cbar.az/assets/1163/Report_final_2009.pdf[Accessed 15 August 2013].
18.CBAR Annual Report 2010, 2013. CBAR Annual Report 2010.[Online] Available at: http://cbar.az/assets/1658/PSI_-_2010_illik.pdf[Accessed 15 August 2013].
19.CBAR Annual Report 2011, 2013. CBAR Annual Report 2011.[Online] Available at: http://cbar.az/assets/2028/2011-ci_ilin_yekunlar%C4%B1_%C3%BCzr%C9%99_pul_siyas%C9%99ti_icmal%C4%B1.pdf[Accessed 15 August 2013].
20.CBAR Financial results of banking activity, 2013. CBAR Finan -cial results of banking activity. [Online] Available at: http://cbar.az/assets/2341/Bank_fealiyyetinin_maliyye_neticeleri.pdf[Accessed 15 August 2013].
21.Central Bank of Azerbaijan Republic, 2013. http://cbar.az.[Online] Available at: /pages/monetary-policy/reviews/[Accessed 13 August 2013].
COMPETITIVENESS IN AZERBAIJAN ASSESSING SECTORIAL ECONOMIC POLICIES
Center for Economic & Social DevelopmentBetter Research, Better Reform, Better Policy
60
22.Central Bank of Azerbaijan Republic, 2013. Statistical bul-letin. [Online] Available at: http://cbar.az/pages/publications-researches/statistic-bulletin/[Accessed 1 August 2103].
23.Development, A. M. o. E., 2012. Development of non-oilsector. [Online] Available at: http://economy.gov.az/index.php?option=com_content&view=article&id=83:qeyri-neft-sektoru&catid=15:2010&lang=en[Accessed 10 August 2103].
24.FAO, 2011. Food Security and Agriculture Highlights. [Online] Available at:http://www.fao.org/fileadmin/user_upload/eufao-fsi4dm/docs/Azerbaijan_highlight_July_Sept_2011_-_FINAL.pdf[Accessed 1 August 2013].
25.International Labour Organisation, 2103. Decent WOrkCountryProfile Azerbaijan. [Online] Available at: http://www.ilo.org/wcmsp5/groups/public/---dgreports/---integration/documents/publication/wcms_175754.pdf[Accessed 7 August 2013].
26.Ministry of Agriculture, 2013. The history of the ministry.[Online] Available at: http://www.azerbaijan.az/_StatePower/_MinistersCabinet/ministersCabinet_08_e.html[Accessed 1 August 2013].
27.Ministry of Economic Development of the Republic of Azer-baijan, 2013. Ministry of Economic Development of the Re-public of Azerbaijan. [Online] Available at: http://economy.gov.az/index.php?option=com_content&view=article&id=1182:2013-qns&catid=110:eig-2013&lang=az[Accessed 21 July 2013].
ZIYA ALILI RASHAD HASANOV FARHAD BAYRAMOV
FRIEDRICH-EBERT-STIFTUNG Regional Office for the South Caucasus
61

28.Presidential Administration, 2013. State Program on Estab-lishment and Development of Space Industry in the Repub-lic of Azerbaijan. [Online] Available at: http://azercosmos.az/assets/Uploads/leg-doc-12/6spaceindustrystateprogram.pdf[Accessed 08 August 2013].
29.Republic, T. M. o. T. o. A., 2013. Ministry of Transportation.[Online] Available at: http://en.wikipedia.org/wiki/Ministry_of_Transportation_(Azerbaijan)[Accessed 11 August 2013].
30.SSC, 2013. Statistical Yearbook 2012. [Online] Available at: http://www.stat.gov.az/menu/6/statistical_yearbooks/source/SYA2012/[Accessed 25 July 2013].
31.State Statistic Commitee , 2013. Tourizm. [Online] Available at: http://www.azstat.org/MESearch/search?de-partament=23&lang=az[Accessed 2 August 2013].
32.State Statistical Committee of the Republic of Azerbaijan,2013. Industry. [Online] Available at: http://www.azstat.org/MESearch/details?lang=en&type=2&id=971&departament=14;http://www.azstat.org/MESearch/details?lang=en&type=2&id=207&departament=14[Accessed 7 August 2013].
33.State Statistical Committee of the Republic of Azerbaijan,2013. Labour Market ; Employment. [Online] Available at: http://www.stat.gov.az/source/labour/en/2.1en.xls[Accessed 8 August 2013].
34.State Statistical Committee of the Republic of Azerbaijan,2013. Main macro indicators of transport. [Online] Available at: http://www.azstat.org/MESearch/
COMPETITIVENESS IN AZERBAIJAN ASSESSING SECTORIAL ECONOMIC POLICIES
Center for Economic & Social DevelopmentBetter Research, Better Reform, Better Policy
62

details?lang=en&type=2&id=839&departament=22[Accessed 12 August 2013].
35.State Statistical Committee of the Republic of Azerbaijan,2013. nvestments directed to main capital of industry (inacting factual prices), million manat. [Online] Available at: http://www.azstat.org/MESearch/details?lang= en&type=2&id=467&departament=2[Accessed 8 August 2013].
36.State Statistical Committee of the Republic of Azerbaijan,2013. Share of generated value added in GDP by types ofeconomic activity(%). [Online] Available at: http://www.azstat.org/MESearch/details?lang=en&type=2&id=219&departament=14[Accessed 8 August 2013].
37.State Statistical Committee of the Republic of Azerbaijan,2013. State Statistical Committee of the Republic of Azer-baijan. [Online] Available at: http://www.stat.gov.az/source/transport/en/010_1-2en.xls[Accessed 12 August 2013].
38.State Statistical Committee of the Republic of Azerbaijan,2013. Turnover of goods in transport sector, billion tonne -km. [Online] Available at: http://www.azstat.org/MESearch/details?lang=en&type=2&id=911&departament=22[Accessed 12 August 2013].
39.The State Statistical Committee of the Republic of Azerbai-jan, 2013. http://www.stat.gov.az. [Online] Available at: http://www.stat.gov.az/source/finance/[Accessed 12 August 2013].
40.The State Statistical Committee of the Republic of Azerbai-jan, 2013. Statistical Yearbook 2012. [Online] Available at: http://www.stat.gov.az/menu/6/statistical_
ZIYA ALILI RASHAD HASANOV FARHAD BAYRAMOV
FRIEDRICH-EBERT-STIFTUNG Regional Office for the South Caucasus
63

yearbooks/source/SYA2012/[Accessed 25 July 2013].
41.The State Statistical Committee of the Republic of Azerbai-jan, 2013. The State Statistical Committee of the Republic ofAzerbaijan. [Online] Available at: http://www.stat.gov.az/source/construction/[Accessed 08 August 2013].
42.Tourism, M. o., 2013. About Tourism in Azerbaijan. [Online]Available at: http://www.mct.gov.az/service/lang/az/page/35/ [Accessed 3 August 2013].
COMPETITIVENESS IN AZERBAIJAN ASSESSING SECTORIAL ECONOMIC POLICIES
Center for Economic & Social DevelopmentBetter Research, Better Reform, Better Policy
64

Friedrich-Ebert-Stiftung Regional Office for the South Caucasus
Appt. 7, Nino Ramishvili Street 4 0179 TbilisiTel: (+ 99532) 225 07 28, 291 26 15 (+ 99532) 291 26 95 Fax: (+ 99532) 222 67 27 E-mail: [email protected]:// www.fes.ge
Center for Economic and Social Development
115, Dilara Aliyeva str.Baku, AzerbaijanTel: (+99412) 497 56 84 (+99412) 597 06 91Fax: (+99412) 497 56 84E-mail: [email protected] http://www.cesd.az