Embed Size (px)
Citation preview

Economic Research Southern Africa (ERSA) is a research programme funded by the National
Treasury of South Africa. The views expressed are those of the author(s) and do not necessarily represent those of the funder, ERSA or the author’s affiliated
institution(s). ERSA shall not be liable to any person for inaccurate information or opinions contained herein.
Competition, Industrial Structure and
Economic Growth
J. W. Fedderke
ERSA working paper 330
February 2013

Competition, industrial structure and economic growth
J.W.Fedderke∗
December 6, 2012
Abstract
This paper takes as its starting point established findings on industrial conduct as measured by
pricing power in South African industry. The South African findings are contrasted with recent results
derived from firm-level data from China and India. A stark contrast emerges between China, with low
mark-ups of price over marginal cost of production, and South Africa and India with high mark-ups.
Given the impact of pricing power on productivity growth, we show that lack of competitive pressure
in the manufacturing sector, contributes one important explanation of why China has a relatively large,
while South Africa and India have a relatively small manufacturing sector. We also provide an estimate
of foregone employment opportunities due to the presence of pricing power has carried for South Africa.
We provide a framework in terms of which the impact of success of potential policy intervention in the
labour market can be assessed, given the findings on industrial structure. Returning to Chinese firm level
data, we also examine whether there is a case to be made for differential policy treatment of established,
new entrant, and struggling firms - and find that there is little evidence to support such a claim. For
China we find that state intervention in the manufacturing sector has primarily served to suppress pricing
power. We conclude with reflections on competitive pressures in other sectors of the economy, as well as
final inferences on desirable policy interventions designed to stimulate growth and employment creation.
∗Pennsylvania State University, Economic Research Southern Africa, and the University of the [email protected]
1

1 Introduction: South African Exceptionalism
The fundamental concern of this paper is the growth performance of the South African economy.
Reason for this focus is that South Africa has not been successful in addressing poverty. As Figure 1
demonstrates, according to World Bank data in terms of either the $1 a day or the $2 a day poverty head
count measures, the proportion of the South African population falling below the poverty lines has not
declined significantly from the 1990s through the 2000s. Indeed, if anything the proportion has risen. By
contrast, China over the same period has been able to halve the proportion of its population falling under
the two poverty measures - though it started from a much higher incidence of poverty than did South Africa.
What is more, this differential ability to reduce poverty between the two economies did not arise from
closer Chinese focus on welfare policies targeted on the poor. As Figure 2 shows, South African welfare policy
allocated a proportion of GDP to welfare policy seven times as high as that maintained by China during
the 2000s. Instead, the dramatic difference between China and South Africa is that the former maintained
growth rates in GDP close to 10% per annum over the past two decades - while that for South Africa has
averaged between 2 and 3% per annum. It is difficult to avoid the conclusion that better growth performance
in the South African economy is at least part of the answer to any attempt to address, let alone eliminate
poverty.
Which raises the question of how higher growth for South Africa might be achieved.
Previous work on growth constraints on South Africa raises three broad areas in which higher growth
might be constrained. The first is the quantity and quality of human capital in the economy. The second
concerns the nature of the labour market, and the rigidities to which it is subject. The third concerns the
level of competitive pressure, and the levels of efficiency realized in South Africa’s output markets, which
can be linked both to the nature of physical capital accumulation in the economy, as well as employment
creation.
While all three are important, in the present paper it is competitive pressure, and the impact it has on
industrial structure and performance that will be the focus of analysis. An immediate means of illustrating
that South Africa has peculiarities in terms of industrial performance and structure, is to consider the
distribution of output across its principal aggregate sectors - as reported in Table 1. What is evident is that
2

Figure 1: Poverty Headcounts: China and South Africa. Source: World Development Indicators.
Figure 2: Percentage of GDP Spent on Welfare: China and South Africa.
3

Primary Manufac. EGWC PvtServ. CSocServ. GenGov1970-74 16.41 15.53 5.62 29.07 20.65 12.731975-79 13.47 16.36 5.48 29.83 21.41 13.441980-84 11.79 17.38 5.18 30.50 21.63 13.521985-89 11.18 16.49 4.68 30.39 22.99 14.281990-94 10.43 15.42 4.60 30.38 24.12 15.041995-99 9.40 15.25 4.52 32.78 23.84 14.222000-04 8.53 15.35 4.31 36.99 22.40 12.422005-09 7.42 14.73 4.91 39.86 21.46 11.62
Table 1: Sectoral Share of GDP; Primary denotes Agriculture, Forestry, Fishing and Mining; EDWC de-notes Electricity, Gas, Water and Construction; PvtServ denotes private service sectors; CSocServ denotesCommunity and Social Services; GenGov denotes General Government
Mining Manufac. Construction Trade Financial Public Sector1970-74 0.18 0.33 0.11 0.05 0.03 0.301975-79 0.17 0.33 0.09 0.05 0.03 0.341980-84 0.17 0.33 0.09 0.04 0.03 0.341985-89 0.17 0.32 0.08 0.04 0.03 0.361990-94 0.14 0.32 0.08 0.04 0.04 0.381995-99 0.12 0.32 0.07 0.05 0.05 0.402000-04 0.09 0.28 0.06 0.06 0.15 0.352005-09 0.08 0.21 0.07 0.07 0.29 0.28
Table 2: Sectoral Share of Employment
over the last four decades, the relative contribution of primary sectors as well as manufacturing in South
Africa has steadily declined. Instead, it is the services sector that has come to contribute more than 50%
of GDP. In effect, South Africa’s industrial structure has come to resemble that of developed economies,
despite the fact that it remains a developing country in the upper middle income classification.
In the case of the distribution of employment, the evidence is equally unusual. Table 2 also shows that
the relative contribution of primary and manufacturing sectors to total employment has declined - and that
financial and business services in particular have been the area of strongest growth.
The concern of this paper is to provide an account of why this unusual industrial structure might have
emerged, by considering evidence on industrial conduct in South Africa. The paper starts by considering
accumulated evidence on the level of pricing power in the South African economy, and by placing this in the
context of similar evidence from China and India. This allows for a counterfactual analysis of how South
Africa’s industrial structure might have differed, under lower levels of pricing power, and the associated
higher growth rates in output and employment that might have been realized. We demonstrate that under
plausible assumptions, industrial structure might have been closer to that of China, than that actually
4

reported in Tables 1 and 2.
Some policy inferences are then drawn with respect to firms that are new entrants into industry, the
impact of mark-ups on international competitiveness, and finally whether there is evidence to suggest that
there is a role for the state in influencing the level of the mark-up.
2 Some Core Findings on Industrial Conduct
We begin our exposition by noting a number of fundamental results that relate to industrial conduct in
South Africa, before turning our attention to the implications of this conduct for economic growth.
A number of papers have examined the evidence on the strength of the mark-up over marginal cost of
production for South Africa.
In all instances, the strength of the mark-up was found to be substantial. In Fedderke et al (2007) the
average mark-up of price over the marginal cost of production for South African manufacturing sectors, for
the 1970-97 period, was found to be between 77% and 79% - a mark-up approximately twice as high as
that reported for the United States.1 Aghion et al (2008), repeating the exercise for the 1971-2004 period
reported an average of 54% for South African manufacturing over the full sample period, without evidence
of a downward trend over sample sub-periods. Figure 3 summarizes the findings.
These findings of a high mark-up are not just an artefact of a few sectors with exceptionally high mark-ups
biasing the average mark-up for the manufacturing sector upward. To illustrate this, Figure 4 reports the
average estimated mark-up by three digit manufacturing sector, over the 1971-2004 period, as reported by the
Aghion et al (2008) study. More than half the sectors have a mark-up in excess of 50%, and approximately
a third of the sectors have a mark-up in excess of 77%. What is more, for the majority of manufacturing
sub-sectors (eighteen), the magnitude of the mark-up rose from the 1971-1990 to the 1985-2004 period, in
some instances dramatically so - see the evidence of Figure 5.
The level of the mark-up of price over marginal cost of production in South African manufacturing is
thus high relative the USA, and appears to be rising over time. But is the level of the mark-up high relative
1See Roeger (1995) and Oliviera Martins and Scarpetta (1999). While the mark-up was found to be considerably lower onceintermediate inputs in production were controlled for, the findings nonetheless confirm a mark-up considerably higher than forthe USA.
5

Figure 3: Estimated Mark-ups of Price over Marginal Cost of Production in South Africa. FKM denotes theFedderke et al (2007) and ABF the Aghion et al (2008) study. Dates indicate sample periods.
to a more general set of comparators than the USA? In short, how does the South African mark-up compare
with the rest of thew world? Arguably the level of the South African mark-up may simply be a reflection of
the rate of return that is standard for manufacturing sectors internationally, and thus lack exceptionalism.
To explore this question, we consider firm level data both for South Africa and a sample of 56 countries
drawn from the Worldscope database. We then compare the ratio of Net Income to Assets of South African
listed firms, to that reported on average in the remaining 55 countries in the data base. The data covers
the 1980-2004 period. Figure 5 reports the ratio of the Net Income to Assets ratio for listed South African
companies to the same ratio for listed companies across the world, for a range of sectoral classifications,
including but not restricted to the manufacturing sectors.2 What is striking is that across all sectors of the
South African economy, the return on assets is considerably higher than in the rest of the world. For no
sector is the ratio lower than 1.42 as high as elsewhere in the world, and in the majority of sectors the return
2While we report only the Net Income to Asset ratio results, note that Aghion et al (2008) establish that symmetrical resultsfollow for Net Income to Sales, Net Income to Equity, the Gross Margin, the Market Value to Book Asset ratio, and the PriceEarnings ratios.
6

Figure 4: Estimated Mark-ups of Price over Marginal Cost of Production by Three-Digit ManufacturingSector, 1971-2004. Source: Aghion et al (2008).
on assets in South Africa is twice as high as elsewhere in the world. What is more, for a number of sectors
returns on assets are three times as high as elsewhere in the world, and in one instance 4.5 times as high.
To the extent that mark-ups are related to the net return on assets therefore, the inference is thus not only
that mark-ups are high in South Africa, but that they are high in comparison with other countries.
What is more, the high rates of return on assets are not restricted solely to the manufacturing sectors.
Note that the Transport and Financial sectors return the second and fourth highest rate of return on assets
relative to the rest of the world (a return on assets approximately three times as high as elsewhere), while
the Retail, Construction and Recreational service sectors all show rates of return on assets approximately
twice that observed on average elsewhere in the world. Once again therefore, not only are South African
mark-ups high, but the manufacturing sector does not appear to be exceptional relative to other sectors in
the economy.
It is also worth noting that over time, the structure of returns on assets (and by inference the mark-up)
in South Africa has changed from favouring small firms, to dramatically favouring large producers. Consider
7

Figure 5: Estimated Change in Mark-ups of Price over Marginal Cost of Production, by Three-digit Manu-facturing Sector, between the 1971-1990 and the 1985-2004 sample subperiods. Source: Aghion et al (2008).
by way of evidence the ratio of Net Income to Sales. In Figure 7 we report the ratio of the Net Income
to Sales of large to small South African listed firms. While for most of the sample period the Net Income
to Sales ratio was lower for large than for small firms in South Africa, with the ratio of ratios consistently
below 1 for the 1980-94 period. However, during the 1990s the pattern began to reverse. By the 2000’s, the
rate of return for large relative to small firms in South Africa began to rise dramatically, with Net Income
to Sales ratios between two and six times as high for large as for small firms. What is more, this pattern
is not simply a reflection of international trends. Figure 7 also reports the large to small firm ratio of Net
Income to Sales, between South Africa and the rest of the world in our firm level data set. What emerges is
that while the Net Income to Sales ratio of large to small firms rose on average across the world, the increase
in South Africa was considerably stronger - with the result that the differential rate of return between large
and small firms was three times as great in South Africa relative to the rest of the world by the mid 2000s.
In summary then, the evidence on South African industrial conduct suggests that the mark-up of price
over the marginal cost of production is high. Moreover, the mark-up is high not only in absolute terms,
8

Figure 6: Ratio of South African Net Income to Asset Ratio to World Net Income to Asset Ratio. Source:Aghion et al (2008). Blue bars denote manufacturing sectors. Red bars denote sectors other than manufac-turing.
9

Figure 7: Ratio of Large Firm to Small Firm Net Income to Sales Ratios. Source: Aghion et al (2008).
but it is high relative to mark-ups elsewhere in the world - not solely relative to the USA. Over time, the
structure of mark-ups between large and small firms also appears to have changed, from favouring small
firms, to favouring large firms. While there is some evidence to suggest that the move to higher rates of
return for large firms is an international phenomenon, the rate of increase for South African large firms has
considerably outpaced that of large firms internationally.
3 Why Does Industrial Conduct Matter for Growth?
Why does the evidence on industrial conduct matter - particularly in the context of economic policy formu-
lation?
To address this question, in this section of the paper we consider three separate pieces of evidence.
In the first, we note the impact of differential mark-ups of price over the marginal cost of production, on
the long-term industrial structure of an economy. We do so on the basis of concrete evidence from China
and India.
10

Second, we consider evidence on the productivity-growth impact of mark-ups in South Africa, in order
to undertake a set of simulation exercises on some counterfactual scenarios, that consider how South African
industrial structure might have been different under lower mark-ups in the manufacturing sector.
Finally, we consider the implications of lower mark-ups on conditions in South African labour markets,
and consider how the structure of the market might have differed under the alternative industrial conduct
assumption.
3.1 An International Comparison - China and India
To consider the impact of the size of mark-ups on the long term industrial structure of an economy, we
estimated the size of the mark-up in the Chinese and Indian manufacturing sectors, and considered the
differential patterns of industrial structure between China and India. To do so we employ firm-level data
sourced from Chinese and Indian official statistical sources.3
3.1.1 The Methodology
We employ the same methodology as employed for the South African studies reported above, and that have
been applied to the USA also. Since the method is established, we provide only a brief exposition.
Under constant returns to scale, the primal of the Solow residual (SR, or growth in Total Factor Pro-
ductivity, TFP ), is related to the mark-up of prices over marginal cost. Hall (1990) demonstrates that:
TFP = SR = ∆q − α ·∆l − (1− α) ·∆k
= (μ− 1) · α · (∆l −∆k) + θ (1)
where μ = P/MC, with P denoting price, and MC denoting marginal cost. Under perfect competition
μ = 1, while imperfectly competitive markets allow μ > 1. ∆ denotes the first difference, lower case denotes
the natural log transform, q, l, and k denote real value-added, labour, and capital inputs, α is the labour
share in value-added, and θ =•A/A denotes exogenous (Hicks-neutral) technological progress, where is A is
the technology parameter.
3Comparative results on China and India were produced jointly with Chandana Kularatne of the World Bank.
11
Estimation of equation (1) faces the difficulty that the explanatory variables (∆l −∆k) will be correlated
with the productivity shocks θ, with resultant bias and inconsistency in the estimates of μ. The standard
instrumentation solution leads to implausibly high μ-estimates.4 An alternative approach proposed by Roeger
(1995), notes that the dual of the Solow residual (DSR), provides a symmetrical relation of the price-based
productivity measure to the mark-up:
DSR = α ·∆w − (1− α) ·∆r −∆p
= (μ− 1) · α · (∆w −∆r) + θ (2)
with w, r denoting the natural logs of the wage rate and rental price of capital respectively. While equation
(2) is of course subject to the same endogeneity problems as equation (1), subtraction of equation (2) from
equation (1) gives the nominal Solow residual (NSR):
NSR = ∆ (p+ q)− α ·∆ (w + l)− (1− α) ·∆ (r + k)
= (μ− 1) · α · [∆ (w + l)−∆ (r + k)] (3)
in which the productivity shocks (θ) have cancelled out, removing the endogeneity problem, and hence the
need for instrumentation. The mark-up is now accessible either to simple estimation or computation directly
from equation (3).5
3.1.2 The Data
For China the data is obtained from the Chinese National Bureau of Statistics. The Statistical Bureau
conducts an annual survey of industrial plants, which includes manufacturing firms as well as firms that
4See for instance the discussion in Oliveira Martins and Scarpetta (1999).5Trivially, μ− 1 = ∆(p+q)−α·∆(w+l)−(1−α)·∆(r+k)
α·[∆(w+l)−∆(r+k)] . While problems of endogeneity are addressed by equation (3), there isan additional difficulty arising from the assumption of constant returns to scale, and the use of value-added measures of output.Oliveira Martins and Scarpetta (1999) demonstrate that where the assumption of constant returns to scale is dropped, equation(3) is actually:
NSR =μ
λ− 1 · α · [∆ (w + l)−∆ (r + k)] (4)
where λ > 1 denotes increasing returns to scale. Thus any estimate of mark-up that follows from Solow residuals should beinterpreted as lower-bound values if increasing returns to scale are present.
12

produce and supply electricity, gas, and water. It is firm-level based, including all state-owned enterprises
(SOEs), regardless of size, and non-state-owned firms (non-SOEs) with annual sales of more than 5 million
yuan. We use a ten-year unbalanced panel data set, from 1998 to 2007. The number of firms per year varies
from a low of 162,033 in 1999 to a high of 336,768 in 2007. The sampling strategy is the same throughout
the sample period (all firms that are state-owned or have sales of more than 5 million yuan are selected into
the sample).
Note that the data set allows for firm entry and exit. As a consequence, while the maximum number of
firms observed in any one period is 336,768, we in fact observe a total of 373,558 firms over the full sample
period. In what follows, we exploit the data on entry and exit explicitly - see sections 4.1 and 4.3. In the
context of China, the role of state is of particular importance, and its influence is deemed to be pervasive.
For this reason, in what follows we pay particular attention to the distinction between SOEs and non-SOEs,
while recognizing that this might not fully capture to full extent of state influence - see the discussion of
section 4.3.
For India the data is drawn from the Prowess Database which is constructed by the Centre for Monitoring
of the Indian Economy (CMIE). The data has advantages over the Annual Survey of Industries since the ASI
is constructed from a repeated cross section of firms whereas the Prowess data set includes a panel of firms.
The database contains information on income statements and balance sheets of publicly listed (relatively
large firms as in the China data set). Only manufacturing firms are included in the analysis. The data
provides a panel of 6242 publicly listed firms, over the sample period 1991-2011. The panel is constructed
over the 1991 to 2010 period, since 1991 defines the implementation of the liberalizing reforms in India.
3.1.3 The Empirical Findings
The empirical specification we estimate is given by:
NSRit = γ0i + γ1RGRit + εit (5)
where RGRit = αit · [∆ (w + l)−∆ (r + k)]
13

with αit denoting the share of labour in value-added of sector i, ∆ (w + l)it the log change in nominal labour
cost for sector i, ∆ (r + k)it the log change in total capital stock for firm i, in period t. γ1 now estimates
(μ− 1) directly μ = P/MC is the mark-up.
What emerges is a stark difference between China and India in terms of the magnitude of the mark-up -
see the illustrated mark-ups for the two countries in Figure 8, which contrasts the estimated mark-ups with
those found for the South African manufacturing sector. While for China the mark-up is approximately 35%
(about half that estimated for South Africa),6 for India the mark-up in manufacturing is approximately 98%
(even higher than in South Africa).7
This difference has had a profound impact on the industrial structure of the two countries. The empirical
observation that the growth performance of China is strongly linked to the manufacturing sector, while that
of India is linked to the service sector, is well established in the literature.8 As Figure 9 illustrates, China
has experienced strong labor productivity growth in manufacturing, while for India productivity growth
in manufacturing is effectively zero, over the 1991-2005 period. The net result of these differential growth
patterns in productivity are revealed in the industrial structure of the two countries.
Figure 10 shows that over the 1990 - 2005 period China’s manufacturing and industrial sectors have either
maintained a constant share of GDP, or arguably have even gained as a proportion of total GDP (primarily
at the expense of Agriculture). By contrast, in India the share of GDP that grown most dramatically has
been that of the Service sector - with Services coming to contribute more than 50% of GDP by the mid-2000s.
3.2 A Direct Consideration of the Growth Impact of Industrial Conduct
The implication of the evidence on Chinese and Indian manufacturing sectors, is that differences in industry
mark-ups, can come to carry long-term implications for industrial structure. Specifically, the suggestion is
that lower mark-ups in Chinese manufacturing supported productivity growth in its manufacturing sector
that explain the much larger manufacturing base of China relative to India.
In this section we consider more direct evidence on this linkage, and do so directly on South African
6Note that the mark-up reported is that estimated under fixed, but not time effects. Once time effects are controlled for,the China mark-up is even more moderate, at 14%.
7Full estimation results including diagnostics are available from the author.8 See for instance Chaudhuri and Ravallion (2006), Rajan (2006), Pack (2008), and Bosworth and Maertens (2010). See also
Kochhar et al (2006) and the discussion of some of the reasons for the relative strength of the Indian service sector.
14

Figure 8: Mark-ups in China and India. Estimation is on firm-level data, correcting for fixed effects.Estimation for China is on 373,558 firms and 1,178,670 observations. Estimation for India is on 6,242 firms,and 38,291 observations. Source: own estimations, FKM refers to Fedderke et al (2007) study, ABF toAghion et al (2008) study.
Figure 9: Service and Manufacturing Labor Productiivty Growth, 1991-2005. Source: Ghani (2011).
15

Figure 10: China and India: Industry Composition, 1990 - 2005. Source: World Development Indicators.
16

evidence. On the basis of the evidence a symmetrical point to that made for China and India can be made
for the South African case.
Two separate studies have explored the impact of the mark-up on productivity growth for the South
African manufacturing sector. Both have found the impact to have been not only statistically significant,
but substantively large.
In Aghion et al (2008), the focus of the study was directly whether the size of the mark-up, computed
annually on a three-digit manufacturing sector basis has an impact on productivity growth (as measured
by TFP growth). The study finds that it does, with coefficients ranging from -0.12 for the full 1970-2004
sample period, to -0.2 for the 1988-2004 sub-sample, and with the finding robust to controlling for possible
endogeneity of the mark-up to productivity growth.
One concern with the results of the Aghion et al (208) study was that it did not control explicitly for
trade liberalization (though it included fixed and time effects), while estimating the impact of the mark-up
on productivity growth over a period in which South Africa liberalized its trade dispensation, such that
the growth impact derived in the study may be overstated.9 Aghion et al (2012) therefore controls for
both direct and indirect impacts of the level of trade protection (measured by effective as well as nominal
protection rates), and tests whether the growth impact of pricing power (the mark-up) is in any way affected.
The findings of the study are that the coefficient on the mark-up ranges between -0.18 and -0.2, once a
comprehensive set of direct and indirect impacts of trade protection are controlled for in estimation.
The inference is that the growth impact is certainly no lower, and potentially is up to twice as large in
estimations that control for trade liberalization, relative to those that do not. Specifically, the inference is
that an increase in the mark-up of 10 percentage points, would result in an annual productivity growth loss
of between 1 and 2 percentage points.
The implied long-term impact on the South African economy is dramatic.
To illustrate the point, consider how South Africa’s industrial structure might have differed if over the
1970-2004 period it had successfully lowered the level of the mark-up in its manufacturing industries. We
9This concern was expressed particularly by Rodrik (2008), who noted falling relative manufacturing prices in the SouthAfrican economy. While falling relative manufacturing prices are not inconsistent with constant mark-ups of price over cost ofproduction, it raised the question of the robustness of the findings.
17

Figure 11: Estimated Impact of Mark-up on Productivity Growth. ABF denotes Aghion et al (2008). AFHVdenotes Aghion et al (2012). ABF (1) and ABF (2) are for the 1970-2004 and 1988-2004 sample periodsrespectively; ABF (3) for the 1988 - 2004 sample period under IV estimation. The AFHV (1) coefficient isobtained while controlling for the level of trade protection and distance from the international technologicalfrontier, while AFHV (2) allows for interaction between the mark-up and protection. AFHV (3) and (4) aresymmetrical, while also controlling for industry scale effects.
18
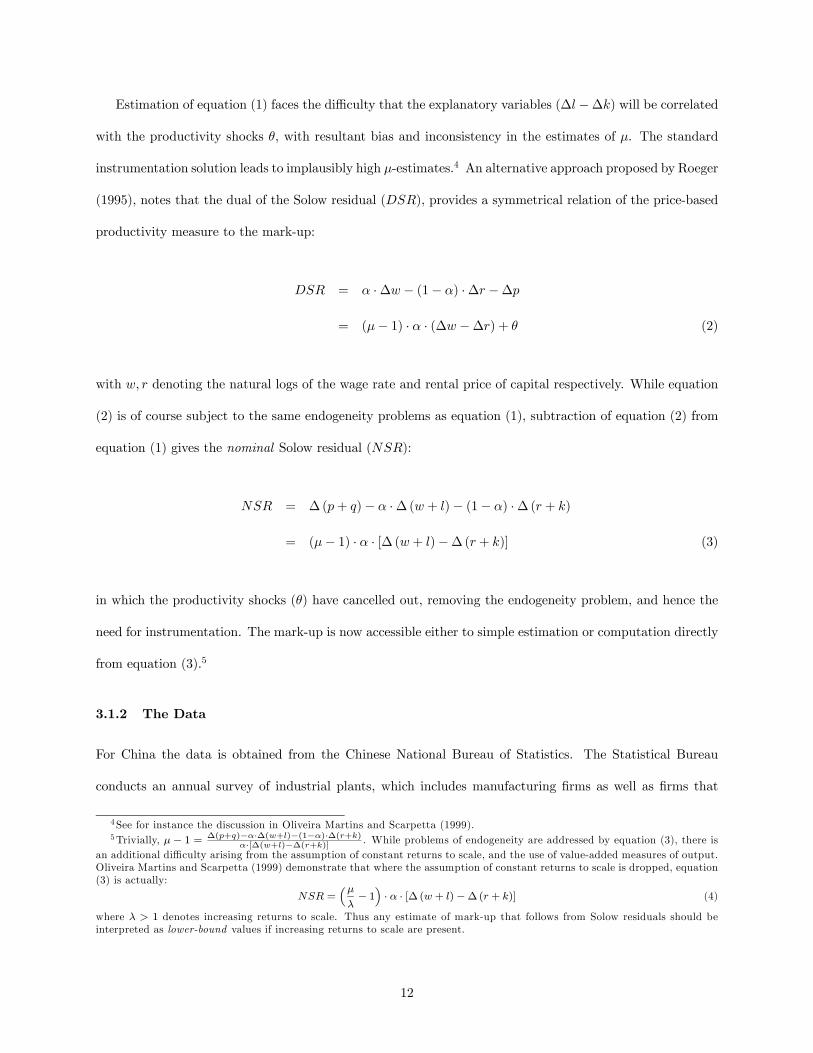
noted at the outset of this paper that South Africa’s industrial structure was unusual for a developing country
- with primary and manufacturing industries contributing considerably smaller proportions of GDP than did
services, and with declining trends over time - recall Table 1. By the end of the 2000s the proportion of
GDP contributed by manufacturing had declined to approximately 15%. In effect, South Africa’s industrial
structure looks more like that we observe for India, than that we noted for China in Figure 10.
Now consider the impact of the lower-bound estimate of the productivity growth impact of the mark-up
(the 1% impact of a 10 percentage point lowering of the mark-up), under two alternative scenarios. In the
first, we allow the mark-up to be consistently 10 percentage points lower than the average 54% mark-up
reported in the Aghion et al (2008) study over the 1970-2009 period, thereby generating a growth rate that is
consistently one percentage point higher for the manufacturing sector.10 This can be thought of as lowering
the magnitude of the manufacturing sector mark-up in South Africa roughly half-way from the level found
by Aghion et al (2008) for South Africa to that we reported above for the Chinese manufacturing sector (of
approximately 30%). The implied impact on South African industrial structure is noted in Table 3.11
Second, we allow the mark-up to be consistently 20 percentage points lower than the Aghion et al
(2008) 54% level over the 1970-2009 period, thereby generating a consistent two percentage point gain in
productivity growth for the manufacturing sector. This can be thought of as lowering the magnitude of the
manufacturing sector mark-up in South Africa from the level found by Aghion et al (2008) for South Africa
approximately to that we reported above for the Chinese manufacturing sector (30%). The implied impact
on South African industrial structure is also noted in Table 3.
Under either scenario, the structure of the South African economy would have been markedly different
from that we actually observe. Under scenario 1, with a 10 percentage point lowering of the mark-up, the
share of manufacturing sector in total South African GDP by the close of the 2000s approximates 30% - see
10Note that we do not simply project a cumulative growth rate from the starting period. Instead, we consistently allow growthto be 1% higher than actually observed, with a cumulative component on the previous period’s additional growth. Thus:
ysimt = yt + γyt−1 + γyt−2 (1 + γ)
where ysimt is the simulated value of manufacturing sector GDP in period t, yt denotes actual GDP, and γ denotes the additionalgrowth due the lower pricing power in the manufacturing sector. As such, simulated output remains tied to actual output levelsmore closely than uner a pure cumulative growth rate from initital starting values, thereby remaining tied to the underlyingstructural conditions for the sector.11Readers should note that since the simulation models the impact of the higher growth rate on manufacturing without
taking into consideration the full set of forward and backward linkages between manufacturing and the rest of the economy, thesimulation will likely overstate the impact on industrial structure, but understate the growth impact.
19

1% Growth Scenario SimulationPrimary Manufac.-Sim EGWC PvtServ. CSocServ. GenGov Manufac.-Actual
1970-74 0.16 0.17 0.06 0.29 0.20 0.13 15.531975-79 0.13 0.20 0.05 0.29 0.21 0.13 16.361980-84 0.11 0.22 0.05 0.29 0.20 0.13 17.381985-89 0.10 0.26 0.04 0.27 0.20 0.13 16.491990-94 0.09 0.29 0.04 0.26 0.20 0.13 15.421995-99 0.08 0.30 0.04 0.27 0.20 0.12 15.252000-04 0.07 0.30 0.04 0.30 0.18 0.10 15.352005-09 0.06 0.29 0.04 0.33 0.18 0.10 14.73
2% Growth Scenario SimulationPrimary Manufac.-Sim EGWC PvtServ. CSocServ. GenGov Manufac.-Actual
1970-74 0.16 0.19 0.05 0.28 0.20 0.12 15.531975-79 0.12 0.25 0.05 0.27 0.19 0.12 16.361980-84 0.10 0.31 0.04 0.25 0.18 0.11 17.381985-89 0.09 0.37 0.04 0.23 0.17 0.11 16.491990-94 0.07 0.41 0.03 0.21 0.17 0.10 15.421995-99 0.06 0.43 0.03 0.22 0.16 0.10 15.252000-04 0.06 0.44 0.03 0.24 0.15 0.08 15.352005-09 0.05 0.43 0.03 0.26 0.14 0.08 14.73
Table 3: Sectoral Share of GDP under Growth Simulation; Primary denotes Agriculture, Forestry, Fishingand Mining; EDWC denotes Electricity, Gas, Water and Construction; PvtServ denotes private servicesectors; CSocServ denotes Community and Social Services; GenGov denotes General Government
1% Growth Scenario 2% Growth ScenarioActual GDP (R Millions) 314814 314814Simulated GDP (R Millions) 381695 476443% Simulated GDP Higher 21 51
Table 4: Growth Impact of Lower Manufacturing Sector Mark-ups
the share of manufacturing under Manufac-Sim in Table 3. Under the more aggressive scenario in which
mark-ups are lowered by 20 percentage points, manufacturing’s share in GDP approximates 40%. In effect,
South Africa’s industrial structure would be more akin to the Chinese, than to the Indian case.
What is more, the implied growth impact on the economy is substantial. In Table 4 we note the difference
between actual South African GDP and that implied by the two alternative growth scenarios under a lower
mark-up structure in manufacturing. Under either scenario the impact over the past 40 years is substantial
- even under the moderate mark-up reduction scenario, aggregate GDP is found to be 21 % higher, while
under a reduction of mark-ups to Chinese levels, the implication is that GDP would have been 50% higher.
The implication of these findings is thus that the structure of mark-ups of prices over the cost of production
carries with it direct implications for productivity growth. Using the established findings of the magnitude
of this growth impact, and simulating the counterfactual scenario of higher productivity growth in South
20

Figure 12: South African Manufacturing Sector Output and Labour:Output Ratio Index Series. Source:SARB data.
Africa’s manufacturing sector over the 1970-2009 period, demonstrates that one possible reason for the
unusual industrial structure in South Africa that we noted in the introduction, may well be due to the high
levels of pricing power found in the South African manufacturing sector.
3.3 The Labour Market Impact
To mirror the output market simulations, we also consider the possible impact of lower levels of pricing
power in the manufacturing sector on employment. We consider only the impact of the lower-bound growth
stimulus from lower pricing power (the 1% estimate). Production in the South African manufacturing sector
has been significantly labour saving, particularly since 1990. Figure 12 illustrates. For this reason, we adjust
the higher output growth implied by lower pricing power in the manufacturing sector, for the underlying
growth in the labour-output ratio.
The resultant employment series for the manufacturing sector is reported in Table 5. While employment
under the simulation falls below actual manufacturing sector employment during the 1970s, during the second
21

Actual Add. 1% Growth Percent Dev. of Sectoral Composition (Sim)
less L/Y Adj Sim. from Act. Mining Manufac. Constr. Trade Financial Public Sector
1970-74 1178091 1080670 -8 0.19 0.31 0.11 0.05 0.03 0.31
1975-79 1327987 1221690 -8 0.17 0.31 0.10 0.05 0.03 0.35
1980-84 1503747 1359980 -10 0.17 0.30 0.09 0.04 0.03 0.35
1985-89 1536281 1666681 8 0.16 0.33 0.08 0.04 0.03 0.35
1990-94 1535957 2068919 35 0.13 0.39 0.07 0.04 0.04 0.34
1995-99 1406340 2200818 56 0.10 0.43 0.06 0.04 0.04 0.34
2000-04 1262142 2308307 83 0.08 0.42 0.05 0.05 0.12 0.29
2005-09 1275508 2564279 101 0.07 0.35 0.06 0.06 0.24 0.23
Table 5: Actual and Simulated Manufacturing Sector Employment
half of the sample period through the end of the 2000s this is reversed. Even taking into account the falling
labour to output ratio, the higher growth rate associated with lower pricing power in manufacturing, implies
a level of employment that is twice that actually observed by 2009. As Table 5 also clarifies, under the
projected additional employment creation in manufacturing due to higher output growth under lower mark-
ups, the distribution of employment across sectors of the economy would also have deviated substantially
from that actually observed. instead of manufacturing employment declining to approximately 20% of total
employment by 2005-09 (see Table 2), under the higher growth scenario the projections suggest that more
than 30% of employment would have remained in manufacturing.
We also considered the implications for the unemployment rate in South Africa, and note the results in
Table 6. Using the actual unemployment rates reported in Banerjee et al (2008) over the 1995-2005 period,
we considered what the additional manufacturing sector employment that emerges under our additional 1%
growth simulation scenario, would have implied for the aggregate unemployment rate in South Africa, under
the assumption that the additional employment would have left employment in other sectors unaffected.
The net result is that the narrow unemployment rate would have peaked at approximately 13% in 2000
and would have declined to 10.5% (simulated) rather than the observed value of 26.7% by 2005. The broad
unemployment rate would still have been substantial, peaking at 29%, but nonetheless by 2005 it would have
stood at 28% (simulated) rather than the 41% actually observed. In short, while unemployment would have
continued to be a substantial concern for the economy, its implied magnitude is considerably lower under
the projected additional output growth due to lower pricing power in manufacturing.
The labour market impact of pricing power in the manufacturing sector does not end here, however. In
22

Actual SimulatedNarrow Broad Narrow Broad
1995 15.6 28.2 3.1 17.61997 22.1 38 8.6 27.31999 24.85 39.9 7.6 26.12001 30.3 42.5 12.9 28.12003 28.6 42.5 12.1 29.22005 26.7 41.1 10.5 28.1
Table 6: Actual and Simulated Unemployment Rates
Fedderke and Hill (2011) we demonstrated that the size of the mark-up and labour market flexibility are
linked by means of:
1
1− α
µ∆ logμ− ((∆q +∆p)−∆w)
μ− α∆l
¶=
µ1
σ− 1¶∆k − 1
σ
L
L− L∆l
where σ denotes the elasticity of substitution between capital and labour, Q, L, and K denote real value-
added, labour, and capital inputs, α is the labour share in value-added, μ = P/MC, with P denoting price,
and MC denoting marginal cost, μ the steady-state mark-up, and W denotes the wage rate. Lower case
notation denotes log transforms, and ∆ the first difference operator. L/¡L− L
¢, is the ratio of total labour
employed (L) to the employed labour that is not associated with rigidities in the labour market (L−L), such
that L denotes employment associated with labour market rigidities. Then L/¡L− L
¢can be interpreted
as an indicator of the degree of downward rigidities in labour adjustment. Its plausible range is from unity
(indicating no rigidity) to infinity (complete rigidity). For example, a value of two means that of the total
labour employed, half is associated with rigidities in the labour market. Simple manipulation then gives:
L
L− L=
∙((∆q +∆p)−∆w)σ
μ (1− α)∆l+(1− σ)∆k
∆l− σα
1− α
¸−∙µ
σ
1− α
¶µ1
∆l
¶¸µ∆ logμ
μ
indicating that pricing power and labour market rigidity are inversely related. The intuition is that with
rising pricing power, for any given level of rigid labour input, L, the ability to price above marginal cost
of production allows a more ready expansion of flexible labour input into production ((since firms have
enhanced capacity to pass on costs), and hence a fall in the index of labour market inflexibility L/¡L− L
¢.
Conversely, as competitive pressure on output markets increases, for a given level of rigid labour input, the
23
Period Inflexibility Index Percent Inflexible1972-86 4.25 771973-87 3.58 721974-88 3.09 681975-89 2.76 641976-90 2.58 611977-91 2.51 601978-92 2.55 611979-93 2.66 621980-94 2.84 651981-95 3.05 671982-96 3.28 701983-97 3.51 721984-98 3.72 731985-99 3.89 741986-00 3.99 751987-01 4.01 751988-02 3.93 751989-03 3.72 73
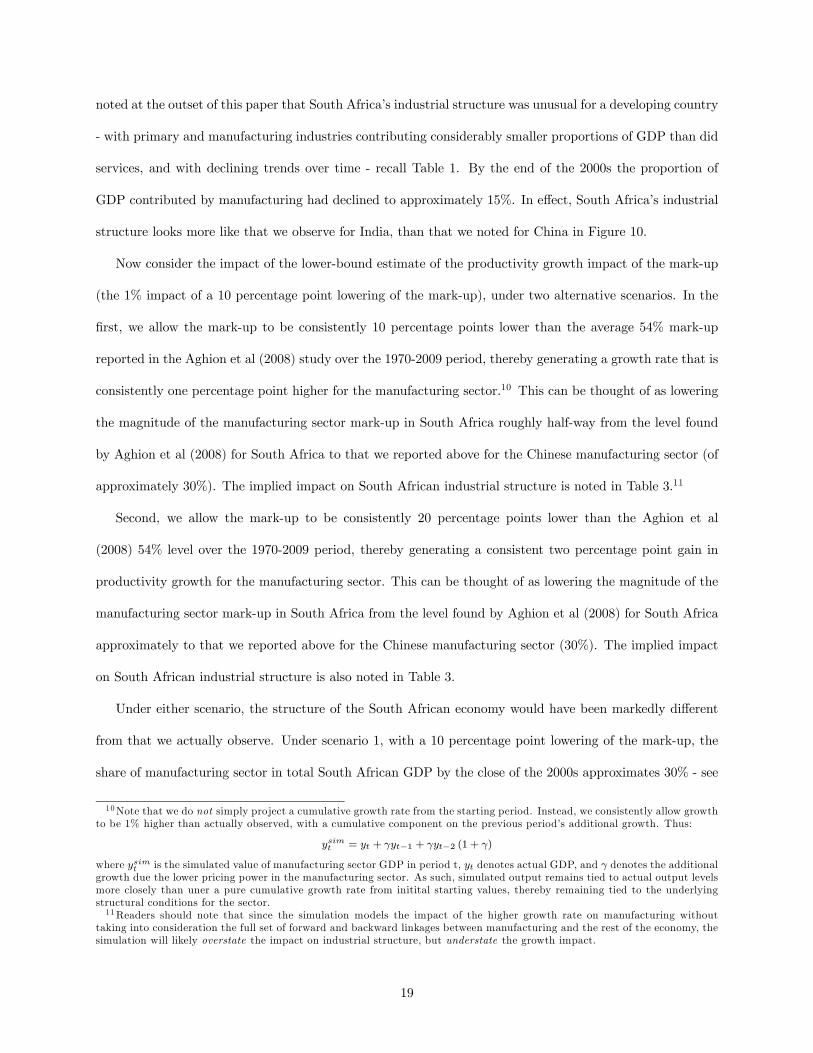
Table 7: Labour Market Inflexibility
willingness of firms to employ flexible labour inputs declines (since there is reduced capacity to pass on the
cost), and hence the index of labour market inflexibility rises.
The result from Fedderke and Hill (2011) was that the measure of labour market inflexibility, L/¡L− L
¢,
in South Africa has been rising over the 1970-2004 period. In Table 7 we report the values of the L/¡L− L
¢index found in that study, and as well as the implied proportion of the labour force that is subject to
rigidities. The implication is that the proportion of the labour force in manufacturing that has been subject
to rigidities, has consistently been in the 60-75% range. What is more, while there is some evidence of cyclical
variation, and increases in labour market inflexibility toward the end of the sample, there is no evidence of
a consistent trend downward or upward over the whole sample - consistent with the findings of a constant
mark-up reported in Aghion et al (2008).
A further implication of these findings is that a reduction of the pricing power of industry, in the absence
of any lowering of employment associated with rigidities (L), would serve to raise the proportion of labour
that is subject to inflexibilities further, by decreasing L in relation to L. In Table 8 we detail the impact
of incrementally reducing the level of the mark-up from the average found in the Aghion et al (2008) study
in the South African manufacturing sector (0.54), through the range of values to the level of the mark-up
found in China (0.34). We consider the impact both for the value of σ actually found in the data (0.875)
24
for South Africa, as well as the higher elasticity value associated with standard Cobb-Douglas production
technology under constant returns to scale (1). We also consider the impact both under a labour share in
value added of 0.5, and a share of 0.7.
The implication of the simulations is that, in the absence of labour market reform that would serve to
change employment associated with rigidities (i.e. which would leave L unchanged), the reduction in the
mark-up would be associated with an increase in the labour market inflexibility index from 3.72, the actual
value found by Fedderke and Hill (2011) for the 1989-2003 period, to a minimum of 6.1, and a maximum of
8.26. This range of values of the labour market inflexibility index implies a proportion of the total labour
force subject to inflexibilities between 84 and 88%.
Given that the falling pricing power of industry is associated with lower employment of flexible labour
inputs (thereby raising the proportion of the labour force that is subject to inflexibilities), the implication is
further that the decline in the mark-up of price over marginal cost of production will be associated with job
losses in the manufacturing sector. Again, Table 8 details the magnitude of these losses, under the alternative
assumptions concerning σ and α. we find that for the full reduction in the mark-up from 0.54 to 0.34, job
losses would range between approximately 185,000 and 242,000, equivalent to 13% and 17% of average total
manufacturing employment for the 1989-2003 period, or 15% and 19% of actual employment at the close of
2008.
The magnitude of these job losses, under the reality of labour market inflexibility in South Africa, may
provide the political economy explanation of why pricing power in the manufacturing sector has not been
more aggressively pursued by South African policy makers.
Finally, note that there are a further set of implications that are relevant to policy interventions designed
to stimulate employment growth. Fedderke (2012) shows that under a simple growth model in which the
production function is homogeneous of degree one, in which equilibrium labour demand sets the marginal
product of labor equal to the real wage, and in which labour supply responds to the wage and structural
25

σ : 0.875 0.875 1 1
α : 0.5 0.7 0.5 0.7
μ: 0.34 0.34 0.34 0.34
In fl e x % Em p l In fl e x % Em p l In fl e x % Em p l In fl e x % Em p l
In d ex In fl e x . L o s s In d e x In fl e x . L o s s In d e x In fl e x . L o s s In d e x In fl e x . L o s s
μ :0.54 3.72 73 3.72 73 3.72 73 3.72 73
0.53 3.82 74 19178 3.88 74 19178 3.83 74 19178 3.90 74 19178
0.52 3.91 74 19178 4.04 75 37845 3.94 74 19178 4.09 76 56021
0.51 4.01 75 37845 4.21 76 56021 4.06 75 37845 4.28 77 73725
0.50 4.12 76 56021 4.38 77 73725 4.17 76 56021 4.47 77 73725
0.49 4.22 76 56021 4.55 78 90974 4.29 77 73725 4.67 78 90974
0.48 4.33 77 73725 4.73 79 107787 4.41 77 73725 4.87 79 107787
0.47 4.43 77 73725 4.91 79 107787 4.54 78 90974 5.08 80 124180
0.46 4.55 78 90974 5.10 80 124180 4.66 78 90974 5.29 81 140168
0.45 4.66 78 90974 5.28 81 140168 4.79 79 107787 5.51 82 155766
0.44 4.77 79 107787 5.48 82 155766 4.92 79 107787 5.73 83 170988
0.43 4.89 79 107787 5.67 83 170988 5.06 79 107787 5.95 83 170988
0.42 5.01 80 124180 5.88 83 170988 5.20 80 124180 6.18 84 185848
0.41 5.14 80 124180 6.08 84 185848 5.34 81 140168 6.42 85 200358
0.40 5.26 81 140168 6.29 84 185848 5.49 82 155766 6.66 85 200358
0.39 5.39 81 140168 6.51 85 200358 5.63 83 170988 6.91 86 214530
0.38 5.53 82 155766 6.73 85 200358 5.79 83 170988 7.17 86 214530
0.37 5.67 83 170988 6.96 86 214530 5.94 83 170988 7.43 86 214530
0.36 5.81 83 170988 7.20 86 214530 6.11 84 185848 7.70 87 228377
0.35 5.95 83 170988 7.44 86 214530 6.27 84 185848 7.97 88 241909
0.34 6.10 84 185848 7.69 87 228377 6.44 85 200358 8.26 88 241909
Table 8: Labour Market Inflexibility Impacts and Employment Losses under Mark-up Reductions
26

conditions in the labour market:
ηNY =εSNW ζNKεKY
1− εSNW ζNN
ηWY =ζNKεKY
1− εSNW ζNN
where εSNW denotes the labor supply elasticity with respect to the real wage, ζNK denotes the elasticity of
the marginal product of labor with respect to capital, ζNN denotes the elasticity of the marginal product
of labor with respect to labor, ηNY denotes the employment elasticity with respect to output, ηWY denotes
the wage elasticity of output growth, and εKY denotes the elasticity of output with respect to capital.
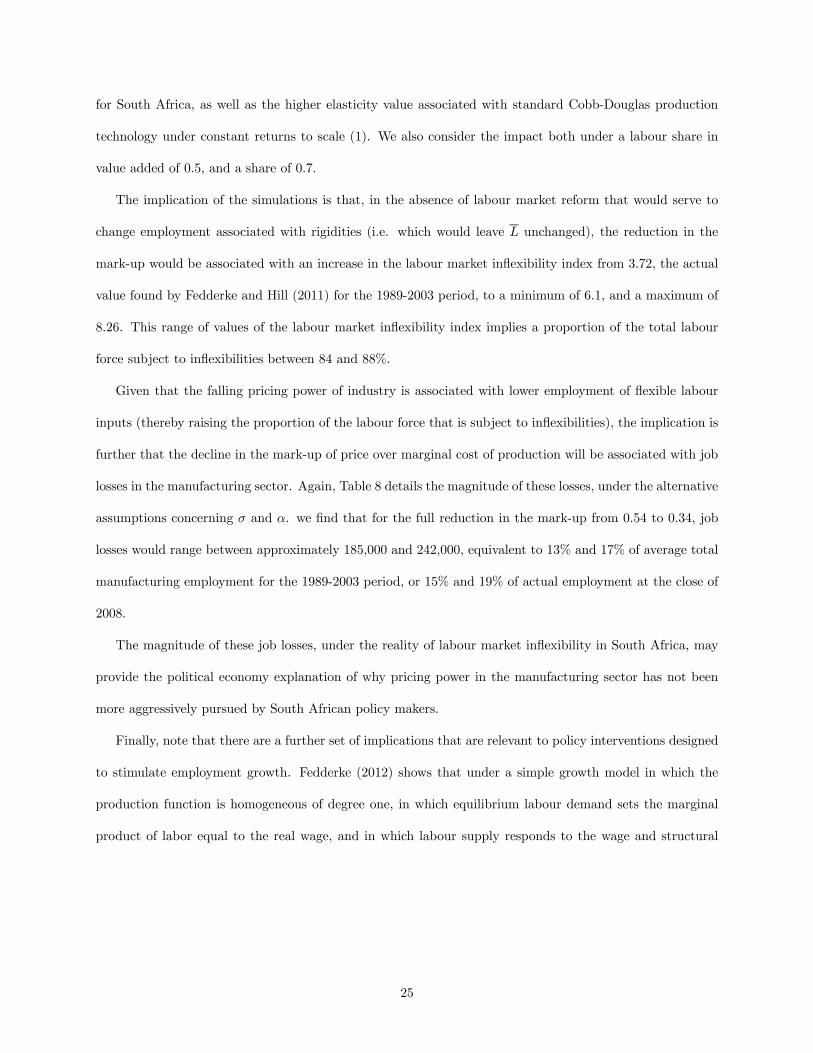
The point is that the elasticity relations associated with the labour market are interdependent, so that
findings on one elasticity, carry implications for the remaining elasticities that relate to the labor market.
Specifically:
∂ηNY
∂εSNW
=ζNKεKY¡
1− εSNW ζNN
¢2 > 0
∂ηWY
∂εSNW
=ζNKεKY ε
SNW ζNN − ζNKεKY¡
1− εSNW ζNN
¢2 < 0
given ζNK > 0, εKY > 0, ζNN < 0, εSNW > 0
as illustrated in Figure 13.
For our purposes the interdependencies are relevant in terms of inferring plausible means of stimulating
employment creation.
Consider first the implications of the current existing condition of the existence of strong pricing power
in output markets. In the presence of a high mark-up (without changing labour market rigidities), the
implication is that the labour market has a relatively high proportion of variable cost labour (L/¡L− L
¢→
1), which suggests that the elasticity of employment with respect to output is relatively high (ηNY is relatively
high). Evidence supporting this inference is evident from Figure 14, showing the employment response in
South Africa to the downturn in output following the sub-prime financial crisis of 2007/8. The evidence
shows that South African output was negatively impacted by the international financial crisis of 2007, with
27

a decline in real output from the middle of 2008 through the middle of 2009. The decline in real aggregate
output in South Africa was of the order of 1.5%, while aggregate employment fell by 6.7%. The inference of
a high elasticity of employment with respect to output is thus consistent with the evidence. It now follows
that if ηNY is relatively high, then the elasticity of labour supply with respect to the wage (εSNW ) must also
be relatively high, while the responsiveness of wages to changes in output (ηWY ) is relatively low. Figure 15
illustrates.
Under these conditions, efficient policies focussed on job creation should favour economic growth, since
employment responds relatively strongly to economic growth, growth does not generate excessive wage
pressure, while labor supply responds strongly to whatever wage increases do emerge.
Now consider the implications of lowering the strength of pricing power in South African industry (again
without changing labour market rigidities, L). With reduced pricing power, the labour market has a relatively
low proportion of variable cost labour (L/¡L− L
¢→∞), which suggests that the elasticity of employment
with respect to output is relatively low (ηNY is relatively low). It now follows that if ηNY is relatively low,
then the elasticity of labour supply with respect to the wage (εSNW ) must also be relatively low, while the
responsiveness of wage to changes in output (ηWY ) is relatively high. Figure 16 illustrates.
Under the conditions of lowered pricing power (and continued labour market rigidity), policies likely to
be efficient at creating employment growth will be changed from those that would be appropriate under high
pricing power. Since employment does not respond significantly to economic growth, while economic growth
generates upward pressure on real wage costs without much of a labor supply response, the policy recourse
would be one of moderating real wage growth, or conceivably lowering real wages.
3.4 Some Preliminary Conclusions
In this section of the paper we have considered in some detail the possible consequences of maintaining lower
pricing power in manufacturing industry.
We noted that lower pricing power is associated with higher productivity growth. Both international
evidence (China and India), and the concrete evidence available for South Africa on the magnitude of the
growth impact, suggests that if South Africa had maintained lower pricing power in its manufacturing, both
28
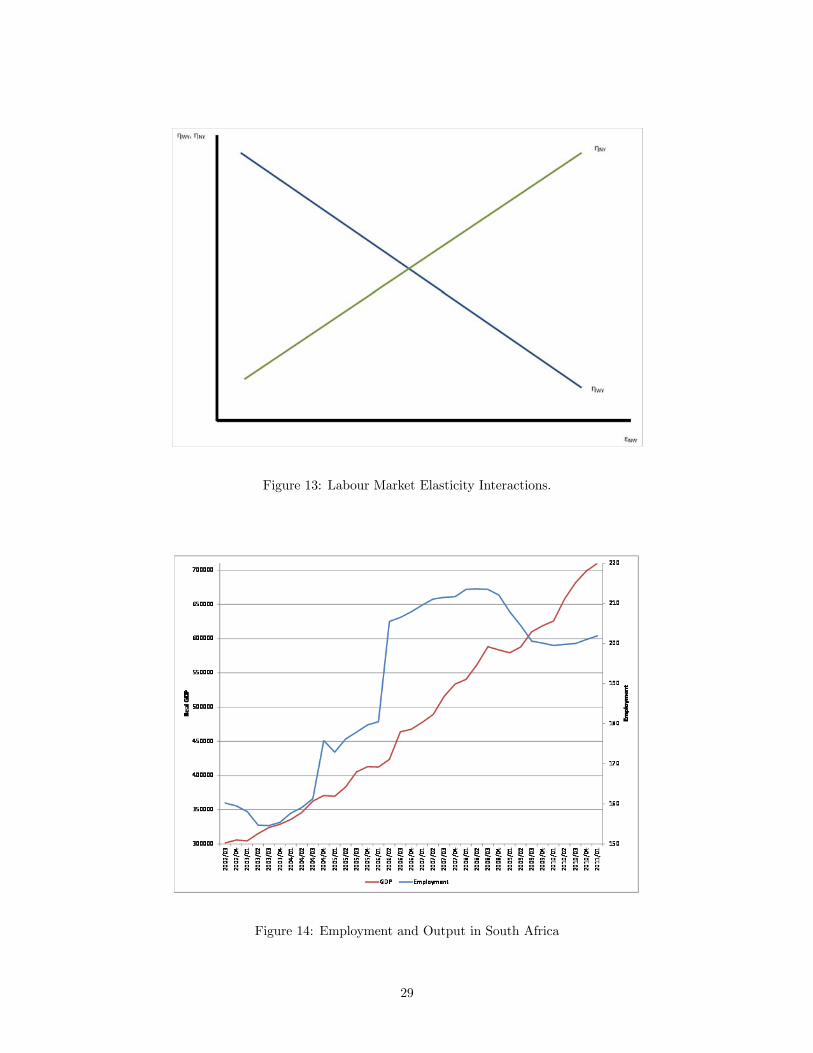
Figure 13: Labour Market Elasticity Interactions.
Figure 14: Employment and Output in South Africa
29

Figure 15: Actual Labour Market Elasticities
Figure 16: Labour Market Elasticities under Lowered Pricing Power
30

the absolute and the relative size of manufacturing in South Africa would have been substantially larger
than it actually was by the close of the 2000s.
What is more, even when taking into account significant labour-saving trends in the manufacturing sector,
the additional output growth would nevertheless have generated significant employment. Again, the impact
would have been both in absolute terms, as well as in terms of the relative contribution of manufacturing to
total employment.
However, we also noted significant caveats to these findings. Reductions in pricing power in manufacturing
sector output markets, without changing the extent to which employment is subject to rigidities, would
necessitate a shift in policies targeted at employment creation from output-growth generating policies, to
policies that emphasize wage restraint, and possibly real wage reductions.
It follows, that such policy is likely to face significant political economy constraints. This may provide
one account for the relative absence of policies in South Africa targeted at reducing pricing power on the
part of producers.
4 Policy and Pricing Power
The implication of the discussion thus far is that there are significant benefits that follow from the promotion
of competitive pressure, thereby limiting the pricing power of producers.
This is austere medicine, embracing a Schumpeterian view of economic development that emphasizes a
relentless pursuit of efficiency, and the acceptance of the inevitability that growth will be associated with
creative destruction that eliminates inefficient producers and allows the entry of new producers that replace
established firms.
In this section we consider three possible limits to the need to promote competitive pressure on industry.
First, we consider whether there is evidence to suggest that new start-ups are more fragile than established
firms, and thus would stand to benefit from a higher mark-up of price over marginal cost as they become
established. Second, we consider whether there is any evidence that might suggest that high domestic mark-
ups (and industry concentration) improves the ability of firms to export more successfully. Third, we explore
the question of whether there is any conceivable role for industrial policy.
31
Finally, we also turn to the question of whether there exist any macroeconomic policy implications from
our findings.
4.1 Does It Harm New Firms?
One concern with any policy intervention designed to lower pricing power in industry, is that it might destroy
the viability of new start-ups.
Entry, growth, and establishment of a new venture might require rates of return that compensate entre-
preneurs for risk-taking behaviour. Such arguments are often invoked in order to justify industrial policy
designed to maintain high rates of return for new ventures, to maintain rates of return for sectors or firms
that are experiencing failing viability, and in lieu of raising competitive pressure on industry.
Such concerns appear plausible.
To investigate whether they receive empirical support, we examine evidence on the magnitude of mark-
ups maintained by firms in a successful manufacturing sector, but account for the fact that there is both entry
and exit during the sample period. Having data on both entry and exit of firms allows us to differentiate
amongst range of firm-types. It allows us to identify stable firms that are present from the outset of the
sample period, and remain present at the end of the sample period. It allows for the identification of all firms
that fail and hence exit during the sample period, irrespective of whether they were previously established
in the industry or not. It also allows for the isolation of firms that both enter their industry, but then fail
before the close of the sample period - in effect start-up ventures that fail. We can distinguish new ventures
that fail, from those that succeed, in the sense that they enter their industry in the sample period, and stay
until the close of the sample.
To do so, we return to our sample of Chinese manufacturing firms, over the 1998-2008 period. we
reestimate under equation (5), and distinguish between the following classes of firms:
• All firms: All firms observed in the sample, regardless of whether the firms were continuously present,
entered or exited during the sample period. This provides a sample total of 373,558 firms, for a total
of 1,178,670 observations.
• Stable firms: Firms that were continuously present in the sample - i.e. that neither entered, nor
32
(1) (2) (3) (4) (5) (6)
Firms Always Present All Firms in Exiting Firms Firms Present Firms that Firms that
No Entry or Exit Sample Only 1998-2003 Entered and Exited Entered and Stayed
μ− 1 0.14∗∗∗(0.0064)
0.20∗∗∗(0.0021)
0.21∗∗∗(0.0040)
0.25∗∗∗(0.0060)
0.21∗∗∗(0.0082)
0.22∗∗∗(0.0040)
R2 0.16 0.16 0.11 0.08 0.15 0.19
# Firms 20850 373558 130739 86605 43459 171645
N 172024 1178670 308781 155510 76947 454740
Figures in round parentheses denote standard errors. *** and ** denotes significance at the 1% and 5% level respectively.
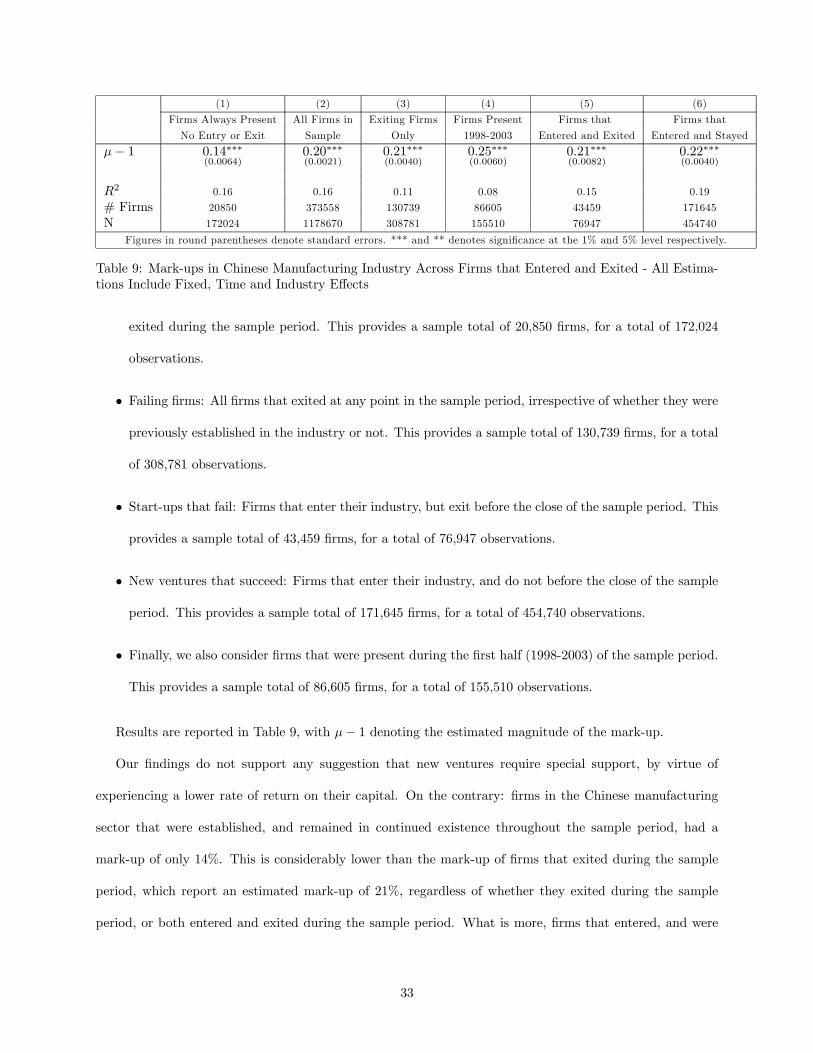
Table 9: Mark-ups in Chinese Manufacturing Industry Across Firms that Entered and Exited - All Estima-tions Include Fixed, Time and Industry Effects
exited during the sample period. This provides a sample total of 20,850 firms, for a total of 172,024
observations.
• Failing firms: All firms that exited at any point in the sample period, irrespective of whether they were
previously established in the industry or not. This provides a sample total of 130,739 firms, for a total
of 308,781 observations.
• Start-ups that fail: Firms that enter their industry, but exit before the close of the sample period. This
provides a sample total of 43,459 firms, for a total of 76,947 observations.
• New ventures that succeed: Firms that enter their industry, and do not before the close of the sample
period. This provides a sample total of 171,645 firms, for a total of 454,740 observations.
• Finally, we also consider firms that were present during the first half (1998-2003) of the sample period.
This provides a sample total of 86,605 firms, for a total of 155,510 observations.
Results are reported in Table 9, with μ− 1 denoting the estimated magnitude of the mark-up.
Our findings do not support any suggestion that new ventures require special support, by virtue of
experiencing a lower rate of return on their capital. On the contrary: firms in the Chinese manufacturing
sector that were established, and remained in continued existence throughout the sample period, had a
mark-up of only 14%. This is considerably lower than the mark-up of firms that exited during the sample
period, which report an estimated mark-up of 21%, regardless of whether they exited during the sample
period, or both entered and exited during the sample period. What is more, firms that entered, and were
33

successful in the sense that they did not exit during the sample period, recorded an estimated mark-up of
22% that is not statistically significantly different from that estimated for firms that failed (21%).
As a result, there is little evidence to suggest that new entrants require higher mark-ups (hence return
on capital) in order to be successful.
4.2 Industry Structure and Possible International Competitiveness
But do firms and industries that have a higher mark-up on marginal cost of production, prove to be more
successful in export markets?
The presence of significant pricing power in industry carries with it implications for industry structure
beyond the sectoral composition of output. Specifically, it leads to the expectation of significant industry
concentration also. This is confirmed by the empirical evidence, which documents rising concentration levels
over the last three decades of the twentieth century.12 More recent evidence from the large sample survey of
manufacturing firms for 2005 confirms that the trend has continued - see the average levels of concentration
as measured by the CR4 and CR10 ratios in Figure 17.13
But there is an alternative account for the rising industry concentration. This would attribute rising
industry concentration in South Africa to the exploitation of productive efficiencies due to internal economies
of scale in production, which would favour large firms over small firms in efficiency terms. Combining internal
scale economies with a domestic South African market that is small relative to efficient scale of production,
would favour the emergence of concentrated industrial structures. Small market size would also likely limit
the extent to which significant external scale economies could be realized - with large numbers of small to
moderately sized firms servicing a relatively large market. The net implication is that a break-out by firms
into a realization of efficiencies through scale economies in countries with small domestic markets, would of
necessity require a significant focus on export markets. Figure 18 provides an illustration.
Productive efficiency as a function of scale of operation due to for instance specialization of capital
stock, impacts of setup and downtime costs, and of "learning-by-doing" effects are well documented in the
12See Fedderke and Szalontai (2009) and Fedderke and Naumann (2011).13The summary evidence is not driven by outlier sectors with high concentration levels. Fedderke (2010) presents evidence
that confirms that the rise in concentration is general across most manufacturing sectors.
34

Figure 17: Concentration Ratios in South African Manufacturing 2001 and 2005: CR4 and CR10 denote theproportion of output contributed by the largest 4 and 10 firms respectively.
Figure 18: Internal and External Scale Economies and Market Size.
35

literature.14 Losses in allocative efficiency due to market concentration through non-competitive pricing,
X-inefficiency and potential rent-seeking are of course foundational to any microeconomic analysis of market
structure, while recent contributions have identified the possibility of negative impacts on the rate of pro-
ductivity growth.15 This conflict has been particularly emphasized in the context of small open economies.16
The inference drawn for policy purposes has been that for small open economies competition per se cannot
be regarded as necessarily welfare enhancing, such that focusing on market structure and market concentra-
tion is misleading, and that productive efficiency considerations should be the primary, perhaps sole focus
of competition policy.17
However, the evidence does not support that either the presence of pricing power, or market concentration
has supported the exploitation of scale economies in order to access export markets.
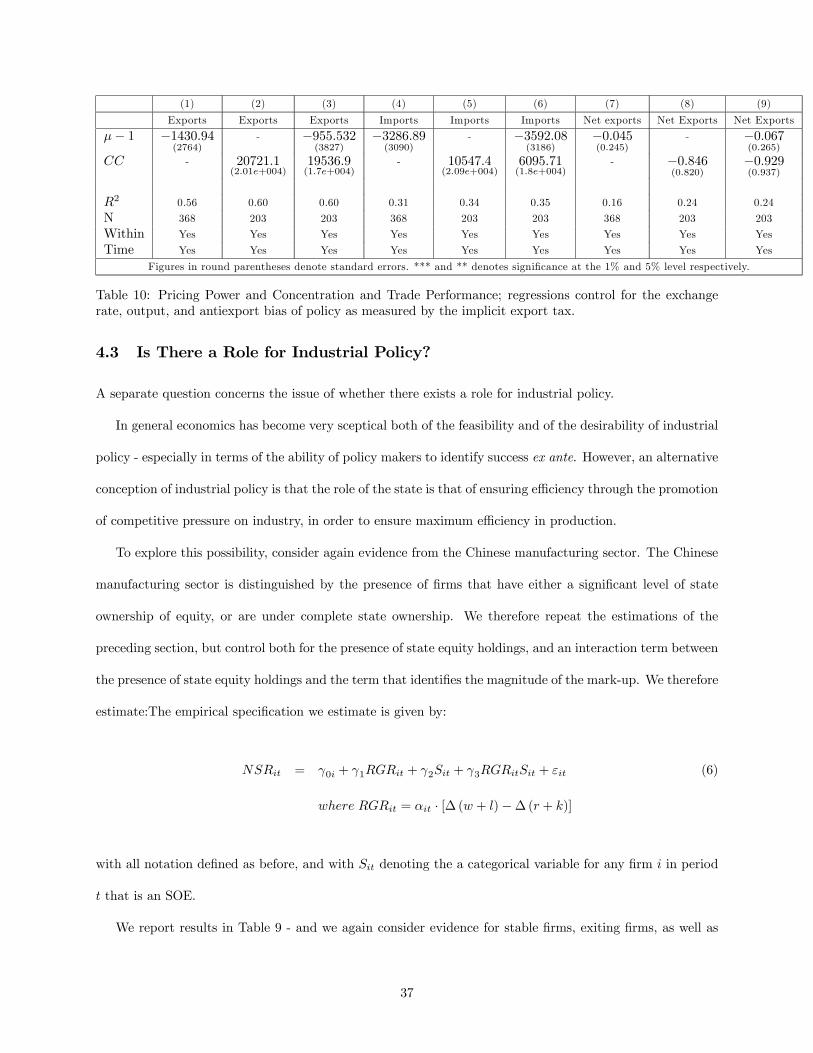
In Table 10 we report the impact of both pricing power (as measured by the mark-up) and industry
concentration as measured by the Rosenbluth Index of concentration on export, import and net export
levels (controlling for output, the exchange rate, anti-export bias, fixed and time effects).18 Neither pricing
power nor industry concentration is statistically significantly associated with any of the trade variables -
though pricing power is negatively associated with export, import and net export levels, while concentration
levels are positively associated. There is thus no support for the suggestion that significant market power
in the domestic market, allows South African manufacturers to pursue more aggressive export strategies in
international markets. If anything the reverse is true. Moreover, the negative impact of pricing power on
imports, suggests that the presence of pricing power in domestic markets, may prevent entry into markets
by foreign producers, thereby limiting competitive pressures on domestic markets.
14 See for instance the discussion in Fuss and Gupta (1981) on the former, and Arrow (1962) and Romer (1986) on "learning-by-doing."15 See Aghion et al (2004).16For Australia see Caves (1984), on Canada see Kemani (1991), and for New Zealand Evans and Hughes (2003). In other
small and developing country contexts the conflict appears to be less fully understood as affecting competition policy - see Gal(2001) for Israel.17 See for example Singh and Dhumale (1999), Hoekman (2003) and Gal (2001)18Due to data constraints in South Africa, we do not employ the more conventional Herfindahl index. The Rosenbluth index,
defined as:
RI = 2n
i=1
(i.msi)− 1−1
where msi denotes the market share of the i’th ranked firm, and n denotes the number of firms in the market, loads on thesame underlying indicators as the Herfindahl.
36
(1) (2) (3) (4) (5) (6) (7) (8) (9)
Exports Exports Exports Imports Imports Imports Net exports Net Exports Net Exports
μ− 1 −1430.94(2764)
- −955.532(3827)
−3286.89(3090)
- −3592.08(3186)
−0.045(0.245)
- −0.067(0.265)
CC - 20721.1(2.01e+004)
19536.9(1.7e+004)
- 10547.4(2.09e+004)
6095.71(1.8e+004)
- −0.846(0.820)
−0.929(0.937)
R2 0.56 0.60 0.60 0.31 0.34 0.35 0.16 0.24 0.24
N 368 203 203 368 203 203 368 203 203
Within Yes Yes Yes Yes Yes Yes Yes Yes Yes
Time Yes Yes Yes Yes Yes Yes Yes Yes Yes
Figures in round parentheses denote standard errors. *** and ** denotes significance at the 1% and 5% level respectively.
Table 10: Pricing Power and Concentration and Trade Performance; regressions control for the exchangerate, output, and antiexport bias of policy as measured by the implicit export tax.
4.3 Is There a Role for Industrial Policy?
A separate question concerns the issue of whether there exists a role for industrial policy.
In general economics has become very sceptical both of the feasibility and of the desirability of industrial
policy - especially in terms of the ability of policy makers to identify success ex ante. However, an alternative
conception of industrial policy is that the role of the state is that of ensuring efficiency through the promotion
of competitive pressure on industry, in order to ensure maximum efficiency in production.
To explore this possibility, consider again evidence from the Chinese manufacturing sector. The Chinese
manufacturing sector is distinguished by the presence of firms that have either a significant level of state
ownership of equity, or are under complete state ownership. We therefore repeat the estimations of the
preceding section, but control both for the presence of state equity holdings, and an interaction term between
the presence of state equity holdings and the term that identifies the magnitude of the mark-up. We therefore
estimate:The empirical specification we estimate is given by:
NSRit = γ0i + γ1RGRit + γ2Sit + γ3RGRitSit + εit (6)
where RGRit = αit · [∆ (w + l)−∆ (r + k)]
with all notation defined as before, and with Sit denoting the a categorical variable for any firm i in period
t that is an SOE.
We report results in Table 9 - and we again consider evidence for stable firms, exiting firms, as well as
37

(1) (2) (3) (4) (5) (6)
Firms Always Present All Firms in Exiting Firms Firms Present Firms that Firms that
No Entry or Exit Sample Only 1998-2003 Entered and Exited Entered and Stayed
μ− 1 0.15∗∗∗(0.0067)
0.20∗∗∗(0.0021)
0.21∗∗∗(0.0040)
0.27∗∗∗(0.0060)
0.22∗∗∗(0.0085)
0.22∗∗∗(0.0033)
(μ− 1)× S −0.07∗∗(0.01)
−0.09∗∗∗(0.0062)
−0.11∗∗∗(0.0091)
−0.11∗∗∗(0.0154)
−0.07∗∗(0.0285)
−0.01(0.0236)
S −0.03∗∗∗(0.0085)
−0.02∗∗∗(0.0059)
−0.02(0.0111)
−0.02(0.0190)
−0.02(0.0421)
−0.02(0.0192)
R2 0.16 0.16 0.11 0.08 0.15 0.19
# Firms 20850 373558 130739 86605 43459 171645
N 172024 1178670 308781 155510 76947 454740
Figures in round parentheses denote standard errors. *** and ** denotes significance at the 1% and 5% level respectively.
Table 11: Mark-ups in Chinese Manufacturing Industry Across Firms that Entered and Exited - All Esti-mations Include Fixed, Time and Industry Effects
successful new entrants into the market as defined for section 4.1.
Our findings are that state equity holdings appear to significantly affect the behaviour of firms in the
Chinese manufacturing sector. In particular, state equity holdings appear to moderate the size of the mark-
up of price over the marginal cost of production, regardless of the class of firms for which we estimate the
magnitude of the mark-up.
Thus we find that for all firms in the sample (irrespective of entry or exit) the mark-up is 20% over
marginal cost of production, while for firms with state equity holdings, the mark-up is lower by 9%, giving
a net mark-up of 11%. This is also true for established firms that are present in the sample throughout the
sample period. While for all such firms the mark-up is 15%, those with state equity holdings the mark-up is
lower by 7%, giving a net mark-up of 8%.
The implication is that the role of the state in Chinese manufacturing has been such as to moderate
pricing behaviour, keeping rates of return in manufacturing low (considerably below those observed in South
Africa and India) in favour of output growth. What is more, the constrained pricing behaviour of firms with
significant state equity holdings, may have served to limit the ability of firms without state equity to impose
higher mark-ups through direct competition effects.
A question that then follows is whether this significant degree of policy pressure to moderate mark-ups,
might explain the incidence of failure in manufacturing firms. Specifically, whether for those firms that have
experienced failure (exiting their industry) were subject to much more severe disciplining action on the size
of their mark-up from firms with state equity holdings, rendering their operation unsustainable.
38

The evidence does not suggest that failing firms are subject to pressure from firms with state equity
holdings of such significance as to have reduced their rate of return below those of firms that remain in the
sample. Thus while all firms that exited had an average mark-up of 21%, and those that exited and had
state equity holdings had a mark-up 11% lower and hence with a net mark-up of 10%, this is not statistically
distinct from the 11% net mark-up for all firms in the sample, and above the 8% net mark-up for established
firms. For firms that both entered and exited in the sample period, the evidence suggests that the mark-up
lay above that of all firms in the sample - on average the mark-up for start-ups that exit is 22%, while those
firms with state equity holdings the net mark-up is 7% lower, or 15% in net terms - no lower than the average
for established firms. Failing firms thus do not appear to have either lower rates of return, nor do they seem
to have been subject to particularly strong pressure from the state to keep their mark-ups low.
However, we do find that for firms that are successful new ventures (enter the sample, and do not
exit), the average mark-up is higher than for established firms (22% versus 15%), but also that there is no
evidence of statistically significant downward pressure on the mark-up from firms with state equity holdings.
Conceivably therefore, new start-ups benefit from lower policy discipline on their pricing behaviour, until
they have become established. On the other hand, we also note that the level of the mark-up even for the new
start-ups remains substantially below the level of the mark-up reported for South Africa (54% as a lower
bound, 77% as an upper bound), or India (98%). Thus extent to which the Chinese policy environment
favour higher mark-ups on successful start-ups, is strictly limited.19
Thus the implication is that one form of state intervention in the Chinese manufacturing sector has
been to use state equity holdings to constrain the pricing power of firms. This may be one reason for the
rapid growth of Chinese manufacturing. In this rather limited sense, therefore, arguably there is a role for
industrial policy - by increasing the intensity of competitive pressure, limiting pricing power and thereby
raising the potential for sustained productivity growth.
19State equity holdings under new start-ups might also be projected to be lower than in the historical firm population as awhole. This might also serve to explain the absence of a significant disciplining effect.
39

4.4 Are There Macroeconomic Policy Implications?
The concern in this paper with industrial conduct, its impact on industrial structure and economic growth,
of necessity places its focus in a more microeconomic context. Any inference for macroeconomic policy is
therefore of necessity a little forced, potentially speculative. This is exacerbated by the fact that in the
South African context, more detailed consideration of related evidence, given the absence of national firm
level data, is at present not really possible.
Nonetheless, one way to approach this question is through a framework provided by Acemolgu and
Zilibotti (1997). They present an overlapping generations growth model, subject to uncertainty, in which the
intermediate goods sector is subject to minimum size requirements (in effect a minimum scale requirement
in production), which renders the realization of specific projects in the production of intermediate goods
uncertain. Savings therefore faces a choice between a safe asset with certain return (r), and risky assets
associated with intermediate goods production projects subject to higher productivity and hence return
(R > r), but subject to uncertainty.20
They demonstrate that under these conditions, a number of crucial features relevant to our discussion
follow. First, the number of risky assets hence the production of intermediate inputs into production (a.)
increases in the rate of return of on the risky assets, conversely (b.) increases as the rate of return of on the
safe asset falls, and (c.) increases in the level of savings in the economy as a whole. Reason for the third
association is that the supply of funds to cover the minimum size requirement of a greater number of risky
intermediate good production projects is increased, thereby triggering the necessary investment. They show
that the result generalizes under the presence of financial intermediation, and the presence of international
trade and capital flows.
This framework provides an account of why South Africa may have continued to observe such high
mark-ups, despite liberalization of the economy. Given the limited ability of the South African economy
to generate savings (and/or attract sufficient international capital inflows), where investment is subject to
minimum scale requirements, the rate of return on capital (the mark-up over marginal cost of production)
20Coincidentally, the model also provides a plausible account of the dual economy structure of South Africa, and of whymark-ups have proved persistent despite trade liberalization. An alternative answer is that the unusually high intensity ofregulation in the South African economy favours incumbent firms - see the evidence and discussion in Fedderke (2010).
40

has to be high to cover the risk generated by uncertainty.21
Second, it provides a possible link to the conduct of macroeconomic policy. The immediate policy
implication is to increase the supply of savings (and/or capital flows) to the economy, in order to circumvent
the constraint that the high mark-ups represent for the South African economy (in growth and employment
creation terms). An alternative would be to divert existing savings from safe assets, to more risky but
high productivity assets - for instance by lowering the interest rate on government bonds (through a lower
borrowing requirement), thereby lowering the return on safe assets, and diverting funds to the more risky
asset class.
Finally, note that the inference that follows from the minimum scale constraint is that policy more widely
might have to focus not on small firms and start-ups, but on helping firms to grow sufficiently in order to
pass the minimum scale criterion.
5 Conclusions and Evaluation
In this paper we explored the implications of accumulated evidence on industrial conduct in South African
manufacturing sectors. We noted accumulated findings of high, persistent mark-ups of price over the marginal
cost of production, both in absolute terms and in international comparative context.
Comparison of South African evidence with comparable evidence for China and India, provides one
possible account for the unusual industrial structure of South Africa for its level of development. Simulation
exercises, based on evidence detailing the growth impact of pricing power on the South African economy,
shows that under reduced levels of pricing power the relative contribution of manufacturing in both output
and employment terms could have been much closer to the Chinese case, with its strong manufacturing
sector, than what is actually observed for South Africa, which is much closer to the Indian case with a
preponderance of service over manufacturing sectors.
Additional evidence confirms that higher mark-ups have not contributed significantly to export perfor-
mance in South Africa. Evidence from China does not support the hypothesis that it is lower mark-ups that
21This might also account for the high and rising rate of return on assets recorded for large relative to small firms, that wenoted in section 2 of the paper.
41
account for firm failure (in the sense of exit). Moreover, state owned enterprises in China appear to have
lowered mark-ups in the Chinese manufacturing sector - suggesting that one role that state intervention can
play is to moderate pricing power in industry, as a means of raising productivity growth.
References
[1] Acemoglu, D., and Zilibotti, F., 1997, Was Prometheus Unbound by Chance? Risk, Diversification, and
Growth, Journal of Political Economy, 105(4), 709-751.
[2] Aghion, P., Blundell, R., Griffith, R., Howitt, P., and Prantl, S., 2004, Entry and Productivity Growth:
Evidence from Microlevel Panel Data, Journal of the European Economic Association, 2(2-3), 265-276.
[3] Aghion, P., Braun, M., and Fedderke, J.W., 2008, Competition and Productivity Growth in South
Africa, Economics of Transition, 16(4), 741-68.
[4] Aghion, P., Fedderke, J.W., Howitt, P., and Viegi, N., 2012, Testing Creative Destruction in an Opening
Economy: the Case of the South African Manufacturing Industries, Economics of Transition, revise and
resubmit.
[5] Arrow, K.J., 1962, The Economic implications of Learning by Doing, Review of Economic Studies, 29,
155-73.
[6] Banerjee, A., Galiani, S., Levinsohn, J., and Woolard, I., 2008, Why Has Unemployment Risen in the
New South Africa? Economics of Transition, 16(4), 715-40.
[7] Bosworth, B. and Maertens, A., 2010, Economic Growth and Employment Generation: The Role of the
Service Sector, in E Ghani (ed.), The Service Revolution in South Asia, Oxford University Press.
[8] Caves, R.E., 1984, Scale, Openness, and Productivity in Manufacturing Industries, in R.E.Caves and
L.B.Krause (eds.), The Australian Economy: A View from the North, Washington: Brookings Institu-
tion, pp313-45.
[9] Chaudhuri, S., and Ravallion, M., 2006, Partially Awakened Giants: Uneven Growth in China and
India, World Bank Policy Research Paper No. 4069.
42

[10] Evans, L., and Hughes, P., 2003, Competition Policy in Small Distant Open Economies: Some Lessons
from the Economics Literature, New Zealand Treasury Working Paper 03/31.
[11] Fedderke,J.W., 2010, Sustainable growth in South Africa, in L. de Mello (ed.), Growth and Sustainability
in Brazil, China, India, Indonesia and South Africa, Paris: Organization of Economic Cooperation and
Development (OECD), pp147-88.
[12] Fedderke, J.W., 2012, The Cost of Rigidity: the case of the South African labor market, Comparative
Economic Studies, forthcoming.
[13] Fedderke, J.W., and Hill, A.J., 2011, Industry Structure and Labour Market Flexibility in the South
African Manufacturing Sector: A Time Series and Panel Data Approach. Economic Modelling, 28,
1291-302.
[14] Fedderke J.W., Kularatne, C., and Mariotti, M., 2007, Mark-up Pricing in South African Industry,
Journal of African Economies, 16(1), 28-69.
[15] Fedderke, J.W., and Naumann, D., 2011, An Analysis of Industry Concentration in South African
Manufacturing, 1972-2001, Applied Economics, 43(22), 2919-39.
[16] Fedderke J.W. and Szalontai, G.,2009, Industry Concentration in South African Manufacturing: Trends
& Consequences, 1970-1996. Economic Modelling, 26(1), 241-50.
[17] Fuss, M.A., and Gupta, V.K., 1981, A Cost Function Approach to the Estimation of Minimum Efficient
Scale, Returns to Scale and Suboptimal Capacity, European Economic Review, 15, 123.
[18] Gal, M.S., 2001, Size does matter: the Effects of Market Size on Optimal Competition Policy, University
of Southern California Law Review, 74: 1437 — 1478.
[19] Ghani, E., 2011, The Service Revolution, Paper Presented at the ILO Conference, Geneva.
[20] Hall, R.E., 1990, The Invariance Properties of Solow’s Productivity Residual, in P. Diamond (Ed..)
Growth, Productivity, Unemployment, Cambridge MA: MIT Press.
43
[21] Hoekman B., 1997, Competition policy and the Global Trading System, The World Economy, 20, 383-
406.
[22] Kemani, R.S., 1991, Merger Policy in Small vs. Large Economies, in R. Shyam Kemani and
W.T.Standbury (eds.), Canadian Competition Policy at the Centenary.
[23] Oliveira Martins, J., and Scarpetta, S., 1999, The Levels and Cyclical Behaviour of Mark-ups Across
Countries and Market Structures, OECD Economics Department Working Papers No. 213.
[24] Pack, H., 2008, Should South Asia Emulate East Asian Tigers?, in E Ghani and Sadiq Ahmed (eds.),
Accelerating Growth and Creating Jobs in South Asia, Oxford University Press.
[25] Rajan, R.G., 2006, India: The Past and the Future, Asian Development Review, 23(2):36-52.
[26] Rodrik, D., 2008, Understanding South Africa’s Economic Puzzles, Economics of Transition, 16(4),
769-97.
[27] Roeger, W., 1995, Can Imperfect Competition explain the Difference between Primal and Dual Produc-
tivity Measures? Estimates for US Manufacturing, Journal of Political Economy, 103, 316-30.
[28] Romer, P.M., 1986, Increasing Returns and Long-Run Growth, Journal of Political Economy, 94(5),
1002-37.
[29] Singh, A. and Dhumale, R., 1999, Competition Policy, Development and Developing Countries. TRADE
Working Papers.
44