Embed Size (px)
Citation preview

Competition in Visual Working Memory
by
Stephen M. Emrich
A thesis submitted in conformity with the requirements
for the degree of Doctor of Philosophy
Department of Psychology
University of Toronto
© Copyright by Stephen M. Emrich 2011

ii
Competition in Visual Working Memory
Stephen M. Emrich
Doctor of Philosophy
Department of Psychology
University of Toronto
2011
Abstract
The processing of information within the visual system is limited by several cognitive and neural
bottlenecks. One critical bottleneck occurs in visual working memory (VWM), as the amount of
information that can be maintained on-line is limited to three to four items. While numerous
theories have addressed this limited capacity of VWM, it is unclear how processing bottlenecks
in the initial selection and perception of visual information affect the number or precision of
representations that can be maintained in VWM. The purpose of this dissertation was to examine
whether early competition for resources within the visual system limits the number or precision
of representation that can be maintained in VWM. To establish whether competitive interactions
affect VWM, Chapters 1 – 4 tested whether performance on VWM tasks was related to the
distance between memory items. The results of these experiments reveal that when objects are
presented close together in space, VWM performance is impaired relative to when those same
objects are presented further apart. Using a three-component model of continuous responses in a
recall task, Chapters 3 – 4 demonstrated that the distance between objects primarily affects the
precision of responses, and increases the number of non-target errors. Chapter 5 extended these

iii
findings to distractors, demonstrating that multiple distractors affect the precision and accuracy
of VWM responses. Chapters 6 – 7 tested how attentional selection can bias memory
representations, revealing that objects that are given high attentional priority were reported with
greater precision. Finally, Chapters 8 and 9 examined bias-signals as a potential source of
individual differences in VWM performance, revealing that high-performers have more precise
representations of sub-capacity representations than low-performers. Together, these results
reveal that VWM performance is limited by competition for representation within the visual
system, and that attention plays a critical role in resolving competition and consequently,
determining the contents of VWM.

iv
Acknowledgements
I am incredibly grateful to the support and guidance of my primary advisor and mentor,
Susanne Ferber. Over the last eight years she has been a constant source of encouragement, and I
greatly appreciate everything she has done to help foster my growth as a researcher. I am also
indebted to Jay Pratt for always providing words of encouragement and wisdom. Many thanks as
well to Adam Anderson for always helping me see the bigger picture.
I have been fortunate to be surrounded by an incredible group of collaborators and
colleagues that have not only challenged and inspired me, but have also made research much
more enjoyable. I am most indebted to Maha Adamo and Naseem Al-Aidroos for years of
discussions that have shaped my ideas and my research in incalculable ways. Thank you also to
Ben Amsel, Doug Garrett, Taylor Schmitz, Bobby Stojanoski, Josh Susskind, Greg West, and
Kristin Wilson for years of enjoyable exchanges I hope will continue. I also owe a great deal to
Carson Pun who has always been around helping make much of this work possible. Thank you to
a great group of undergraduate research assistants who have helped me in the last 6 years: Justin
Ruppel, Felix Lee, Paul Lu, and Steve Thomas. A special thanks to Stefan Bostan who
contributed to all aspects of the research reported in Chapters 4 to 9 and Kuhan
Puvanenthiranathan, who helped collect data for Chapter 2.
I am also incredibly indebted to Paul Bays at University College – London for sharing his
analysis methods with me, and to Matthew Hilimire at Georigia Tech for helpful discussions
about the Ptc.
Finally, I would also like to thank my entire family for their support, encouragement, and
understanding.
Most of all, I would like to thank my wife. You gave me both the inspiration and support
to see this through. Thank you.

v
Table of Contents
Abstract ......................................................................................................................................................... ii
Acknowledgements ...................................................................................................................................... iv
Table of Contents .......................................................................................................................................... v
List of Figures .............................................................................................................................................. vii
Introduction .................................................................................................................................................. 1
Chapter 1: Spatial Competition Affects VWM Performance ...................................................................... 18
Chapter 2: Competition Affects VWM for Complex More than Simple Objects ........................................ 25
Method ................................................................................................................................................... 26
Results and Discussion ............................................................................................................................ 27
Chapter 3: Competitive Interactions Increase Recall Errors ....................................................................... 31
Method ................................................................................................................................................... 33
Results and Discussion ............................................................................................................................ 36
Chapter 4: Competitive Interactions Affect the Precision of VWM Representations ................................ 41
Method ................................................................................................................................................... 41
Results and Discussion ............................................................................................................................ 43
Chapter 5: Multiple Distractors Affect the Precision and Number of VWM Representations ................... 47
Method ................................................................................................................................................... 48
Results and Discussion ............................................................................................................................ 50
Chapter 6: Bottom‐Up Attentional Capture Biases VWM Responses ........................................................ 59
Method ................................................................................................................................................... 60
Results and Discussion ............................................................................................................................ 61
Chapter 7: Colour and Location Cues Bias VWM Responses Independently ............................................. 66
Method ................................................................................................................................................... 67
Results and Discussion ............................................................................................................................ 68
Chapter 8: VWM Capacity is Correlated with Response Precision ............................................................. 74
Method ................................................................................................................................................... 76
Results and Discussion ............................................................................................................................ 76
Chapter 9: Ptc Predicts VWM Capacity ....................................................................................................... 80
Method ................................................................................................................................................... 81

vi
Results and Discussion ............................................................................................................................ 85
General Discussion ...................................................................................................................................... 93
References ................................................................................................................................................ 109

vii
List of Figures Figure 1 ‐ Example of the continuous‐response method of measuring and modeling VWM performance. (Left
Panel) During the probe, the observer’s goal is to select the colour of the colour wheel that
corresponds to the probed (highlighted) item. Note that this paradigm is the one that is used in
Chapter 3. (Right Panel) Responses can be modeled according to a number of factors. Target responses
are assumed to be normally distributed around the target value (T). The amount of spread in
responses (error) provides a measure of precision (1/SD). In a two‐factor model, guesses are modeled
as a uniform distribution across all responses. In a three‐factor model, non‐target responses are
considered to be normally distributed around non‐target values (N), with the same concentration as
the target responses. Adopted from Bays, Catalo & Hussain (2009). ........................................................ 6
Figure 2 ‐ Stimuli and procedure used in the experiment in Chapter 1. (A) Examples of the low‐ and high‐
competition displays. Stimuli are presented within a smaller area in the high‐competition condition. (B)
Example of the sequence of events of the change‐detection task employed in the experiment in
Chapter 1. The observer’s goal is to detect changes to the target stimuli. ............................................ 21
Figure 3 ‐ Average accuracy observed in the remember‐all condition in the experiment in Chapter 1. Accuracy was
higher overall in the low spatial‐competition condition. Error bars denote within‐subject 95%
confidence intervals (CIs). ........................................................................................................................ 23
Figure 4 ‐ Average accuracy as a function of filtering and spatial competition condition presented in Chapter 1,
collapsed across set size. Accuracy was higher overall in the low‐competition condition, as well as in
the remember‐all condition. Error bars denote within‐subject 95% confidence intervals. .................... 24
Figure 5 ‐ Examples of complex stimuli used in Chapter 2. For the simple stimuli condition, shaded cubes were
replaced with coloured squares. .............................................................................................................. 27
Figure 6 ‐ Accuracy for simple and complex objects, averaged across competition condition. Error bars denote 95%
within‐subject CIs. .................................................................................................................................... 28
Figure 7 ‐ Accuracy for simple and complex objects under low and high competition, averaged across set size. Error
bars denote within‐subject 95% CIs. ........................................................................................................ 29
Figure 8 ‐ Examples of the low‐ and high‐competition conditions used in the experiment in Chapter 3. .................. 34
Figure 9 ‐ Measures of relative precision (top left) and mean maximum likelihood estimate values for the three
factors used to model responses in Chapter 3. Error bars denote within‐subject SEM. (Top Left) As in
previous experiments, relative precision decreased according to a power‐law function. The fit lines
represent the power‐law fit for both low and high competitions. (Top Right) The proportion of target
responses decreases as a function of the number of sample items, with no difference between high‐
and low‐competition conditions. (Bottom Left) The proportion of non‐target responses increases with
set size, and is greater in the high‐competition than in the low‐competition condition. (Bottom Right)
The proportion of guesses increases with set size, and is unaffected by the distance between objects.
................................................................................................................................................................. 37

viii
Figure 10 ‐ Example schematics of the stimulus configurations in Chapter 4. Stimuli are not drawn to scale. .......... 41
Figure 11 – Precision, PT, PNT, and PG obtained for each separation condition in the experiment in Chapter 4, plotted
by the distance between two items. Dashed lines correspond to linear contrasts. Error bars denote
within‐subject SEM. ................................................................................................................................. 44
Figure 12 – Example of Targets Only and Targets + Distractors condition used in experiment 5. Circles were used as
targets for half of the participants. The set size 4 condition is shown for both conditions..................... 49
Figure 13 ‐ Results of experiment in Chapter 5. In the targets + distractors condition, set size indicates the total
number of items (50% distractors). Error bars denote within‐subject SEM. ........................................... 51
Figure 14 – Correlation between VWM capacity (K) and the change in precision when the display contains two
distractors and two targets, relative to when only two targets are present. .......................................... 54
Figure 15 ‐ Schematic of the experiment used in Chapter 6. The locations of the two onset and two no‐onset
memory items are highlighted by solid and dotted lines, respectively. .................................................. 60
Figure 16 ‐ The precision of responses (top left), and the proportion of target, non‐target, and random responses
observed in the experiment in Chapter 6. The x‐axis indicates the number of onset targets. Two
additional no‐onset targets were presented in each condition. Error bars indicate within‐subject SEM.
................................................................................................................................................................. 62
Figure 17 ‐ Stimulus and trial schematics for the experiment in Chapter 7. (Top Panel) The four cues created by
colour and spatial cues. For colour matching trials (Col+), the cue colour matches the colour of the
probed sample item. In the location matching trials (Loc+), the cue is presented at the location of the
target sample item. Thus, both colour and location matches are defined with respect to the probe,
rather than the sample. The dotted line marks the location of the eventual target probe (not present
during the task). (Bottom Panel) A schematic of a Col‐Loc+ cue trial. ..................................................... 67
Figure 18 ‐ The precision of responses (top left), and the proportion of target, non‐target, and random responses
as a function of cue validity and cue type. Error bars indicate within‐subject SEM. The solid horizontal
line indicates neutral cue performance, with the dotted lines indicating +/‐ within‐subject SEM. ........ 69
Figure 19 – Correlation between VWM capacity and overall response precision for a single object. ........................ 77
Figure 20 ‐ Schematic of trials performed in experiment in Chapter 9. In the filter condition, participants were
instructed to only try to remember only the circles or the squares. In the remember‐all task,
participants were instructed to remember all four items on the cued side. For display purposes, the
stimuli on the uncued side are displayed in grey. .................................................................................... 83
Figure 21 – ERP results observed in the experiment presented in Chapter 9. (Top Panel) ERP waveforms for the
channel pairs of interest. The dotted lines indicate the windows used for calculating each of the
averages. (Bottom Panel) Average waveforms for each of the ERPs, calculated at the peak channels
(see text). Error bars denote within‐subject SEM. ................................................................................... 87

ix
Figure 22 ‐ Relationship between memory capacity and Ptc amplitude. (Left Panel) ERP waveforms for high‐ and
low‐capacity participants in the remember‐all condition. (Right Panel) The change in Ptc amplitude
between high‐ and low‐competition conditions is significantly correlated with VWM capacity. ........... 88
Figure 23 ‐ A schematic of a biased‐competition model of VWM. Blue regions identify local competition for
representation. Green regions identify those where global competition for VWM resources may occur.
Red regions identify potential sources of top‐down feedback that serve as bias signals for target
selection. Solid arrows indicate recurrent interactions between local and global competition. Dashed
arrows indicate possible sources of top‐down selection mechanisms. ................................................... 99

1
Introduction
In order to perform many everyday tasks, it is necessary to maintain and manipulate
information that is no longer present in the environment. The cognitive process of maintaining
information online is known as working memory; it enables us to hold information in mind after
it has been removed from view. As with all cognitive processes, however, working memory is
limited by information processing bottlenecks in the human nervous system (Marois & Ivanoff,
2005). As a result of these processing bottlenecks, there are limits on the amount of information
that can be simultaneously maintained in working memory.
In the visual domain, studies have typically demonstrated that individuals can
successfully retain roughly three or four items in working memory over short delays, with
performance decreasing thereafter (Luck & Vogel, 1997). Thus, for the last decade, the
predominant model has suggested that visual working memory (VWM) has a “capacity” limit –
i.e., that the number of items that can be stored online in VWM is limited to three or four items.
Currently, however, there are debates as to whether in fact VWM has a limited number of
“slots”, or whether VWM draws upon a limited pool of resources that restricts the precision with
which items can be represented (Bays & Husain, 2008). Accordingly, processing bottlenecks
may not limit the number of items that can be maintained in VWM, but may instead limit the
precision of those representations that can be stored (Bays & Husain, 2008). Whether it is the
number or precision of VWM representations that are limited, the neurobiological mechanisms
underlying these limits have remained elusive. That is, although it is clear that there are
representational limitations in VWM, it is currently unknown what the exact factors are that limit
the number or precision of those representations.
In the present thesis, I report a series of studies that investigate how factors that influence
the initial selection and representation of visual objects may limit VWM performance. In other
words, these studies will examine whether processing bottlenecks prior to the stage of
maintenance limit the number or precision of representations accessible to VWM. Specifically,
using behavioural and event-related potential (ERP) experiments, I address the question of
whether the capacity or precision of VWM representations is limited by competitive interactions.
By examining competition as a neurobiological factor limiting information processing in VWM,
these studies attempt to elucidate the origins of representational limits in working memory.

2
The experiments presented in this thesis reveal three main findings about the nature of
VWM: First, inter-item competition affects VWM performance; specifically, increasing
competitive interactions by presenting items closer together in space reduces the precision of
VWM responses, without affecting the number of items that can be stored. Second, competition
affects the ability to correctly recall the location of target information, leading to an increase in
the proportion of non-target response errors. Third, competition for representation in VWM can
be biased via bottom-up or top-down selection mechanisms. Before outlining the motivation for
the current thesis in more detail, I will first provide an overview of VWM, as well as describe the
techniques used for assessing VWM that are employed in the present thesis.
Working Memory – An Overview
The experimental study of different memory systems has a long and rich history in
psychology. For the purposes of this thesis, it is important to distinguish between iconic or
sensory memory on the one hand and working memory on the other. Iconic or sensory memory
is the shortest form of informational persistence in the nervous system. Information in this
memory system is typically considered to be an “icon” of the original sensory stimulus that
extends the sensory percept of the stimulus for very brief durations (~100 – 150 ms) and is
sensitive to transients such as spatial displacement and masking (Irwin & Thomas, 2008). As
such, iconic memory can be considered a high-capacity but low-stability buffer system for visual
information.
Short-term memory (STM) can be distinguished from iconic memory in a number of
ways. First, STM has a duration that can be an order of magnitude longer than sensory memory,
lasting around four seconds or longer (Zhang & Luck, 2009). Second, in contrast to iconic
memory, STM is relatively insensitive to exposure duration and visual transients (Irwin &
Thomas, 2008). Finally, and most important for the purposes of this thesis, STM has a limited
capacity for high-precision information which is in stark contrast to the virtually limitless
amount of information that is represented in sensory memory (Sperling, 1960). Thus, STM
cannot be seen as temporally-extended sensory memory, even though similar physiological
mechanisms may underlie both processes (i.e., sustained neural activity). Instead, STM
represents neurobiological and cognitive processes distinct from iconic memory that serve to
maintain a small amount of high-fidelity information that can be used across saccades and the
physical displacement of the visual scene.

3
The term working memory (WM) largely replaced the term short-term memory (STM)
following the publication of Baddeley and Hitch’s (1974) multiple component model of working
memory. The term working memory was intended to emphasize that STM is often involved in
the active manipulation of information in service of other cognitive tasks or operations
(Baddeley & Hitch, 1974). On theoretical grounds, the model proposed a central executive that
controls and oversees the active manipulation of information in the slave systems that are
specific to the sensory modality of that information (i.e., visual and auditory).
Measuring Capacity and Precision in Visual Working Memory
The focus of the present thesis is the system responsible for the maintenance of visual
information after it has been removed from view. Visual working memory (VWM) or visual
short-term memory (VSTM1) has been most widely studied using the one-shot change-detection
task developed by Phillips (1974) and first studied extensively by Luck and Vogel (1997). In the
change-detection task, participants are presented with simultaneous simple visual stimuli. These
objects are typically simple coloured shapes, although more complex object and symbolic stimuli
have been used (Alvarez & Cavanagh, 2004). This sample display is presented only briefly
(typically 100 – 500 ms), and is followed by a delay interval lasting from several hundred
milliseconds to several seconds. The participant’s task is to remember as many of the items as
possible over the delay period. Following the delay, a change-detection probe is presented, cuing
participants to make a forced-choice discrimination as to whether the items in the probe display
contain a change in some dimension relative to the original sample display.
Using the change-detection task, individual VWM capacity can be estimated using a
formula originally developed by Pashler (1988) and modified by Cowan (2001). Using this
formula it is possible to estimate the average number of items successfully remembered for any
given set-size. That is, given a set size of S, capacity, K, is estimated as:
* ( 1)K S H CR
where H and CR correspond to the proportion of hits and correct rejections. Thus, this formula
yields an estimate of the average number of items successfully remembered (K) for any given set
size (S) while accounting for guessing (CR – 1). Applying this formula across a range of
experiments, it has been found that the average number of items that can be successfully
1 Although the terms VSTM and VWM are sometimes used to distinguish between the perceptual and executive aspects of visual memory, for the purposes of this thesis these terms are interchangeable.

4
remembered is typically between three and four, independent of set size (Cowan, 2001). That is,
even though overall change-detection accuracy decreases above a set size of three to four items,
applying the Pashler-Cowan formula indicates that an average of roughly three or four items is
correctly reported, indicating that VWM capacity plateaus around three items and remains
relatively constant. Between individuals, however, VWM capacity varies greatly, from as low as
one to as high as six items (Fukuda, Awh, & Vogel, 2010).
The use of K-estimates for measuring memory capacity across a range of set sizes has
helped to elucidate the neural mechanisms that mediate VWM. For example, by examining K-
estimates across a range of set sizes, functional MRI (fMRI) studies have identified VWM-
related activity in the bilateral intraparietal sulcus (IPS), lateral occipital (LO) and anterior
cingulate (AC) regions (Todd & Marois, 2004; Xu & Chun, 2006). That is, activity in these
regions increases with increasing set size, and reaches an asymptote around three or four items
(i.e., the capacity of VWM). Furthermore, individual differences in peak IPS activity during the
delay period correspond closely to individual K-estimates (Todd & Marois, 2005), suggesting
that this region plays a critical role in the active storage of information in VWM.
Although working memory performance and capacity can be measured using other tasks
(e.g., visual search: Alvarez & Cavanagh, 2004; Emrich, Ruppel, Al-Aidroos, Pratt, & Ferber,
2008; Emrich, Al-Aidroos, Pratt, & Ferber, 2009), the one-shot change-detection paradigm has a
number of advantages over these alternatives. First, the change-detection task provides a simple
yet elegant means to incrementally vary the load placed on VWM resources. That is, by
manipulating the number of items presented in the memory sample, it is possible to measure WM
performance across a range of information loads, while holding the task demands constant. In a
seminal study, Luck and Vogel (1997) demonstrated that individuals could successfully maintain
about three or four simple coloured objects in VWM; above four items, however, overall
accuracy decreased as a function of the number of items presented. This effect of decreasing
change-detection performance for memory displays containing more than three or four items was
found to be consistent across a range of different stimuli, sample times, and other manipulations
(Vogel, Woodman, & Luck, 2001). Thus, these experiments provided strong evidence that the
capacity of VWM is limited to roughly three or four items.
A second advantage of the one-shot change-detection paradigm is that it is possible to
elucidate multiple aspects of VWM encoding and maintenance independent of changes in task

5
demands. For example, in one study (Awh, Barton, & Vogel, 2007), the sample items were either
simple or complex objects, and the changes to the probe display could be either within-category
or between-category changes. While overall capacity estimates were reduced with complex
objects, performance for complex objects was similar to that of simple objects when the change
between the sample and test displays required a between-category comparison. Thus, using a
simple modification of the change-detection technique, this study demonstrated that it may be
possible to store a similar number of simple and complex objects in VWM, but that complex
objects are stored at a lower resolution.
Third, the one-shot change-detection paradigm is advantageous over other paradigms in
that it emphasizes the perceptual aspects of STM rather than the executive control aspects of
working memory. That is, the change-detection task can be performed without needing to
perform cognitive manipulations to the information stored in VWM. Although the ability to
manipulate and use information that is stored in WM is clearly important for the performance of
many real-world tasks, these functions are largely independent of the capacity of information
stored in VWM (i.e., executive control functions are downstream of memory storage; Postle,
Berger, & D'Esposito, 1999). Thus, by minimizing the retrieval and manipulation demands, any
observed differences in capacity (across individuals or stimulus conditions) can be largely
attributed to differences in encoding or maintenance, rather than differences in executive
function.
Although the change-detection paradigm offers many advantages, one significant draw-
back is that change detection is a high-threshold approach to studying VWM capacity. That is,
individuals are assumed to have a perfect representation of items that are correctly reported, and
no representation of items which are not correctly reported. Typically, approaches based on
signal-detection theory can better account for psychophysical performance than high-threshold
approaches. Recently, several studies have applied a signal-detection approach to measuring
VWM performance by using a simple variant of typical change-detection tasks. For example, in
an approach first used by Wilken and Ma (2004) and recently adopted by number of recent
studies (Bays, Catalao, & Husain, 2009; Fougnie, Asplund, & Marois, 2010; Johnson, Spencer,
Luck, & Schöner, 2009; Zhang & Luck, 2008, 2009), observers indicate the identity of the
probed item by selecting its colour from a colour wheel (Figure 1). Rather than assessing a high-
threshold binary response (i.e., whether an item is or is not in memory), performance in this type

6
of task is measured by calculating the amount of error in each response relative to the target
value.
The principal advantage of using a continuous-response method over the one-shot
change-detection task is that responses can be analyzed to reveal multiple characteristics of
performance. The primary measure of interest observed in a continuous-response task is the trial-
to-trial variability in the responses, or precision, which is measured as the inverse of the standard
deviation (SD) of error of all responses. Studies examining the precision of VWM
representations have revealed that precision decreases as a function of the number of to-be-
remembered items (Bays & Husain, 2008; Wilken & Ma, 2004). As such, these findings have
provided evidence against the theory that VWM has a limited number of “slots”, and instead
suggest that representing a large number of items in VWM comes at the expense of precision.
That is, as the number of items in the display increases, the precision of responses decreases,
indicating that there is not a discrete shift in VWM performance related to the number of items
Figure 1 ‐ Example of the continuous‐response method of measuring and modeling VWM performance. (Left Panel) During the probe, the observer’s goal is to select the colour of the colour wheel that corresponds to the probed (highlighted) item. Note that this paradigm is the one that is used in Chapter 3. (Right Panel) Responses can be modeled according to a number of factors. Target responses are assumed to be normally distributed around the target value (T). The amount of spread in responses (error) provides a measure of precision (1/SD). In a two‐factor model, guesses are modeled as a uniform distribution across all responses. In a three‐factor model, non‐target responses are considered to be normally distributed around non‐target values (N), with the same concentration as the target responses. Adopted from Bays, Catalo & Hussain (2009).

7
that can be stored. Thus, these findings suggest that VWM is a flexible pool of resources, rather
than a system with a fixed-resolution capacity.
In addition to measuring the precision of VWM responses, it is possible to utilize
probabilistic mixture models to account for multiple aspects of performance. In an influential
study, Zhang and Luck (2008) used a two-factor mixture model to describe both the error of
responses, as well as the probability that items were correctly recalled from memory. This model
assumed that responses should fall into two categories: if an item is remembered, it should be
recalled with some amount of error around the target response; if, however, the target item is not
successfully maintained in VWM, then the responses should be random with respect to the target
colour. Thus, this model assumes that all responses should be a mixture of a normal distribution
with some amount of error (the trials on which the target was correctly recalled) and a uniform
distribution (the trials on which the target was forgotten). Using this method, the authors
demonstrated that while the probability of correctly recalling an item from memory (Pm) changes
from loads of three to six items, the amount of error (SD) in those responses does not. This
changes, however, for smaller set sizes. The amount of error (or its inverse precision) of target
responses does change from one to three items, along with a small decrease in Pm, leading the
authors to suggest that because no changes in SD are observed beyond three items, VWM can
maintain a limited number of discrete fixed-resolution representations. According to this
account, it is also possible to average memory resources across all items when the set size is
below VWM capacity, which is why precision for a small number of items is greater than that for
set sizes at or above VWM capacity (but see Bays & Husain, 2008).
The two component (Pm and precision) mixture-model has proven to be an important
tool for probing the nature of VWM representations providing insights that are unavailable from
a change-detection task, or even from examining precision alone. For example, this two-
component model has been used to identify that the probability of forgetting an item increases
with longer retention intervals, while the amount of error in those representations remains
unchanged (Zhang & Luck, 2009).Furthermore, the number of features (e.g., colour and
orientation) that need to be maintained has significant effects on the precision of responses,
while having no effect on the number of objects that can be maintained (Fougnie et al., 2010).
Despite its success, a recent study has demonstrated that an additional component may be
required for fully understanding the pattern of responses observed in continuous-response VWM

8
tasks (Bays et al., 2009). According to this study, responses that are assumed to be random
guesses in a two-component model (because they fall within a seemingly uniform distribution
relative to the target) are in fact responses in which the observer mistakenly reports the colour of
one of the non-target (uncued) items. That is, these responses are in fact not guesses, but are
instead correctly-recalled items that are reported at the wrong location (possibly indicating an
error in spatial working memory). Thus, the three-component mixture model (in which PNT
represents the probability of misremembering the target location) provides a method for
elucidating aspects of VWM performance that are unavailable with other methods, and provides
a more accurate description of performance than a two-factor model; however, the precise
constraints and limitations on representations in VWM remain unclear.
In summary, both the change-detection paradigm and continuous-response
psychophysical approaches have advantages for measuring VWM performance. Although studies
using either of these approaches have provided a mixture of evidence in favour of both fixed-
capacity “slot”-models and resource models, it has been consistently demonstrated that the
amount of information that can be stored in VWM is limited. Thus, the aim of the remainder of
this thesis is to attempt to elucidate the nature of this information-processing limit.
Evidence for Early Representation Limits in VWM
Few studies have examined whether the processing bottleneck of VWM capacity emerges
at the level of initial representation and encoding. That is, it is typically assumed that the
processing bottleneck in VWM emerges from a limitation in the available resources or “slots” to
maintain objects in memory, rather than in the initial selection, representation, and encoding of
visual information. This assertion follows from the finding that increases in the duration of the
sample stimulus beyond 500 ms tends not to have an effect on VWM capacity (Vogel et al.,
2001, 2006).The primary aim of the present thesis is to examine how early representational
bottlenecks affect VWM performance. Specifically, I will address whether competition for
processing resources in the visual system can limit the number or resolution of information
stored in VWM.
There are three lines of evidence that indicate that bottlenecks in the initial stage of
perceiving and encoding visual objects may limit the number or precision of VWM
representations. First, numerous findings indicate that VWM depends on the same neural
resources that mediate the perception of visual stimuli. Both neuroimaging and primate

9
neurophysiology studies have demonstrated convincingly that the maintenance of visual
information depends on the same brain regions that mediate the perception of that information
(Fuster & Alexander, 1971; Fuster & Jervey, 1981, 1982; Nakamura & Kubota, 1995; Miyashita
& Chang, 1988). For example, the maintenance of faces in VWM depends on activity in the
face-sensitive fusiform face area (FFA; Druzgal & D'Esposito, 2003; Postle, Druzgal, &
D'Esposito, 2003), and memory for gratings can be decoded from activity in early visual cortex
(Harrison & Tong, 2009; Serences, Ester, Vogel, & Awh, 2009).
The finding that VWM may depend on the activation of the same brain regions that are
involved in perception is consistent with the proposal by Postle (2006) that working memory is
an “emergent” property of information processing in the brain. According to this account,
working memory does not comprise a set of specialized systems, but instead is a property that
exists across sensory-, representation-, and action-related systems in the brain. Specifically,
Postle argues that working memory functions arise by recruiting these specialized perceptual and
motor systems via controlled, directed attention. Consistent with this proposal, recent studies
have called into question the role of the IPS as a specialized VWM system. That is, the
recruitment of the IPS in VWM tasks may reflect other aspects of object processing (Mitchell &
Cusack, 2008) or attention (Magen, Emmanouil, McMains, Kastner, & Treisman, 2009) that are
not specific to VWM maintenance.
Based on the evidence that VWM requires sustained activation of the same brain regions
that are involved in the initial perception and representation of those features, it follows that
factors that affect non-working memory functions (i.e., sensation, representation, and action)
may also impact the ability to encode the same information into working memory. Put another
way, if working memory does not comprise a set of specialized systems, then working memory
may not be subject to a set of specialized factors limiting its capacity (e.g., number of “slots” in
the IPS) or the resolution of its representations. Instead, the number or precision of VWM
representations may be limited by the same neurobiological factors that affect initial processing
stages, and are therefore upstream of VWM maintenance. Furthermore, even if VWM does
depend on the activation of a specialized set of regions (e.g., IPS), the number or precision of
items that can be maintained in memory should be limited by the earliest processing bottlenecks.
Therefore, if there are limits to the number of sufficiently high-resolution representations that

10
can be created by the regions that mediate the perception of visual information, this bottleneck
will place severe restrictions on the amount of information successfully maintained in VWM.
The second line of evidence that bottlenecks limiting VWM representations may emerge
prior to the maintenance stage is that VWM performance is affected by the complexity of the
comparison between stimuli. For example, using a wide range of stimuli – including coloured
squares, cubes, line drawings, letters, and Chinese characters – a study by Alvarez and Cavanagh
(2004) demonstrated that change-detection performance decreased as the complexity of the
stimuli increased. Importantly, complexity was measured by examining the search slope for
those same stimuli in a visual search task. Across object complexity, the search slope was almost
perfectly correlated with change-detection performance, indicating that mechanisms that govern
visual search efficiency affect the number of items that can be successfully stored in VWM. The
obvious conclusion that can be drawn from this finding (and the one that has been the focus of
subsequent studies) is that VWM capacity may be limited by the complexity of the items that are
being stored.
An additional conclusion from the Alvarez and Cavanagh study, however, is that the
effect of complexity on VWM storage is not arbitrary, but instead may be related to the difficulty
of encoding those stimuli and/or making comparisons between them. That is, the search rate for
a given stimulus reflects, among other things, the amount of time required to perceive and
encode those items. Consequently, the strong correlation between VWM capacity and search rate
suggests that the observed differences in VWM performance for different stimuli may reflect
differences in the difficulty of encoding and comparison. Put another way, it is possible that
fewer complex items can be stored in VWM not because of storage limitations for complex
items, but because complex items are more difficult to perceive, creating a processing bottleneck
that is upstream of VWM maintenance.
A third line of research that suggests that bottlenecks of VWM performance occur prior
to encoding comes from the observation that VWM performance is affected by the number of
competing representations in the visual scene. In other words, as the number of to-be-
remembered items increases the probability of correctly recalling any item decreases (Luck &
Vogel, 1997). While this finding has been taken as evidence that the number of items that can be
stored in VWM is limited, it may also be accounted for by considering the role of competition
for representation within limited perceptual resources.

11
Evidence for Competitive Interactions in VWM
Recent studies by Bays and colleagues (Bays et al., 2009; Bays & Husain, 2008)
demonstrated that the precision with which objects and locations are recalled from memory
showed the largest decrease between set sizes one and two. As mentioned above, precision is
measured as the inverse of the standard deviation of the response function around the target
value. Thus, as the number of items increased, there was more variation in the proportion of
responses, indicating a noisier representation. Modeling this data revealed that precision
decreased according to a power law function, indicating that the decrease in precision may be
directly related to a proportional decrease in available resources.
Other studies have similarly demonstrated that the amount of noise in a VWM
representation increases as a function of the number of presented items (Wilken & Ma, 2004),
even when the number of items is less than the “capacity” of VWM (Zhang & Luck, 2008).
These results are ambiguous, however, as they could be taken as evidence for either a limitation
in the ability to store information in VWM, or a limitation in perceptual/representational
resources. Given the well-documented finding that perceptual representations are impoverished
for multiple objects relative to a single object (Duncan, 1984, 1980), it is likely that the
presentation of multiple objects results in increased competition for limited resources prior to the
maintenance stage of VWM. Put another way, as the number of presented objects increases, the
number of items competing for limited perceptual resources increases, potentially resulting in
noisier VWM representations.
In addition to the effects of load on the precision of VWM responses, previous studies
have demonstrated that VWM performance decreases in the presence of irrelevant distractors
(Vogel, McCollough, & Machizawa, 2005; McNab & Klingberg, 2008; Fukuda & Vogel, 2009).
That is, these studies demonstrated that high-capacity subjects are better able to exclude
irrelevant distractors from VWM, as well as resist the capture of attention by irrelevant
distractors, relative to low-capacity subjects. Importantly, the low-capacity subjects typically
suffer from a filtering-cost, in which performance is impaired in the presence of distractors
relative to when no distractors are present. These findings suggest that irrelevant distractors
compete for limited VWM resources, particularly in low-capacity subjects. Although this finding
has been taken as evidence of a poor selection mechanism (Fukuda & Vogel, 2009), these
findings could similarly provide evidence that competition between items in the visual scene

12
affects the ability to encode and maintain information in VWM. In other words, the presentation
of irrelevant distractors increases the number of objects competing for representation by limited
perceptual resources, as well as memory resources. Consequently, the observed decreases in
performance in the presence of distractors may be the result of competition for early perceptual
representation. Although this competition may ultimately be overcome via selection mechanisms
(Fukuda & Vogel, 2009), these findings suggest that competition for resources may play an
important role in limiting VWM performance.
In summary, the evidence presented above suggests strongly that there are early
representation limits in the visual system that limit the amount of information that can be
accurately encoded, maintained and recalled in VWM. Moreover, numerous findings
demonstrate that VWM performance is affected by the number of competing representations.
This competition can come in the form of competition between targets (target-target
competition), or competition between targets and distractors (target-distractor competition). In
both cases, the addition of items to the visual display negatively impacts VWM performance. In
other words, every item in the visual scene competes for perceptual representations, as well as
for representation in VWM (Duncan & Humphreys, 1989). Consequently, understanding the
precise effects of competition on the ability to encode and maintain information in VWM may be
critical to understanding the nature of VWM limits. Therefore, the aim of the present thesis is to
examine what effect competition for representation has on the number or precision of
representations that can be stored in VWM. This question is largely motivated by the framework
of the biased-competition model of attention (Desimone & Duncan, 1995).
Mechanisms of Competition in the Visual System
Cells in the visual system are tuned to respond to a preferred stimulus in a particular
region of space. The region of space over which a cell will respond (the receptive field) is
smallest at the level of V1, and becomes larger at higher areas of the extra-striate cortex.
Competition arises if two objects fall within the same receptive field of a cell, as both objects
compete for that neuron’s response (Desimone & Duncan, 1995). Consequently, competing
objects interact in a mutually suppressive way, leading to suppressed responses for a stimulus
relative to when no competition exists between objects (Kastner, De Weerd, Desimone, &
Ungerleider, 1998; Kastner et al., 2001). Importantly, the effects of competition can be mitigated
via selective attention.

13
It is important to distinguish competition within a receptive field from spatial summation.
For competition to occur, two objects must fall within a single receptive field, thereby competing
for that cell’s response. In contrast, spatial summation occurs when the inputs to a cell are
averaged, thereby altering the response and receptive field properties of a given cell (Movshon,
Thompson, & Tolhurst, 1978). That is, information that is outside of the classical receptive field
can have an effect on how a neuron responds to a given stimulus, relative to when that stimulus
appears alone. Furthermore, these responses are typically facilitatory, leading to reduced
detection thresholds for simple visual features (Kapadia, Ito, Gilbert, & Westheimer, 1995;
Kapadia, Westheimer, & Gilbert, 1999). Thus, while competition occurs within the receptive
field of a particular neuron, spatial summation occurs by summing the inputs to a particular cell.
Although these processes are somewhat distinct, spatial summation may serve to mitigate the
effects of competition, as attention may alter the weight of particular inputs to facilitate the
processing of one or another stimulus (Ghose & Maunsell, 2008).
Behavioural impairments as a result of competition are well documented. For example,
reporting one feature of two objects is much more difficult than reporting two features of the
same object (Duncan, 1984). Importantly, psychophysical studies have also demonstrated that
attending to one object reduces perceptual processing of nearby objects (Mounts, 2000; Bahcall
& Kowler, 1999), an effect referred to as localized attentional inhibition (LAI; McCarley,
Mounts, & Kramer, 2004). Furthermore, these studies have suggested that competition has its
greatest impact on performance when objects need to be individuated, as opposed to just
detecting target features (McCarley & Mounts, 2007).
In many ways, the effects of competition and LAI are similar to those of crowding.
Crowding refers to the impaired discrimination in the presence of nearby contours, and is a form
of inhibitory interaction similar to that of competition (Levi, 2008). Crowding has been observed
for a wide range of stimuli, including words (Toet & Levi, 1992), orientation discrimination
(Andriessen & Bouma, 1976), and face recognition (Louie, Bressler, & Whitney, 2007).
Although debated, crowding may only occur in peripheral vision (Toet & Levi, 1992), and the
distance over which crowding can occur depends on stimulus eccentricity (Levi, 2008). Although
the mechanisms of crowding are not fully known, some authors have suggested that crowding
depends on mechanisms similar to that of competition (Nandy & Tjan, 2007). There may be
some differences between crowding and competition, however. For example, Beck and Kastner

14
(2007), demonstrated that there is less suppressive interaction for identical stimuli than for
stimuli that differ in colour and orientation; in contrast, crowding is much stronger when flankers
are identical to targets (Levi, 2008). Thus, although crowding, LAI, and competition may not
reflect identical processes, they are likely all dependent on similar mechanisms of suppressive
interactions (i.e., target processing is affected by nearby objects).
Although competition has a negative impact on numerous perceptual tasks, several
studies have demonstrated that competition in the nervous system can be resolved via top-down
and bottom-up bias signals (Desimone & Duncan, 1995; Duncan & Humphreys, 1989). These
signals have the dual benefit of (a) increasing neural responses to the attended item and (b)
decreasing neural responses to unattended items, thereby acting as a filtering mechanism
(Kastner & Ungerleider, 2001). There may, however, be an upper-limit on the amount of
competition that can be resolved at any moment. For example, although abrupt onsets capture
attention, leading to prioritization of newly presented stimuli, there may be capacity limits on the
number of items that can be prioritized. Interestingly, this capacity limit may be similar to that of
VWM (Yantis & Johnson, 1990).
Previous authors have suggested that the objects that win out under competition will gain
access to further mnemonic processing (Bundesen, 1990; Duncan & Humphreys, 1989; Kastner
& Ungerleider, 2001). Consistent with this suggestion, a recent study has provided evidence that
competition between items may limit VWM performance. Specifically, Ihssen and colleagues
(Ihssen, Linden, & Shapiro, 2010) demonstrated that change-detection performance was greater
for two sequentially presented arrays compared to simultaneously presented arrays. Thus, this
study suggests that competitive interactions between simultaneously presented stimuli limited the
number or resolution of items that could be stored in VWM. As such, I will argue in this thesis
that the representations maintained in VWM are limited by these early processing bottlenecks
owing to competition between items in the display.
As mentioned above, the recent models of VWM capacity suggest that the precision of
VWM representations decreases according to a power law as a function of the number of to-be-
remembered items (Bays et al., 2009; Bays & Husain, 2008). Although this decrease could be
viewed as a simple decrease in the distribution of a common resource pool, it is possible that the
decrease could be understood as an increase in the amount of competition between items (Bays
et al., 2009). That is, as the number of items in the display increases, there is proportionally more

15
competition for representation within a finite number of visual fields. In support of this
interpretation, a recent study demonstrated how spatial competition could account for similar
capacity limitations in object tracking (Franconeri, Jonathan, & Scimeca, 2010). Although this
data set was interpreted within the framework of centre-surround activation-inhibition
mechanisms, a competition account in which objects interact in a mutually suppressive way
would explain the data equally well.
In summary, competition is an important neurobiological mechanism that affects the
neural and behavioural evaluation of visual information. As such, competitive interactions
between items in a visual scene may limit the number or precision of the representations that can
be maintained in memory. Importantly, these effects are likely to occur at the early stages of
representation or encoding, and thus, are likely to be independent of any storage “capacity” limit.
Therefore, the aim of the present thesis is to determine whether competition between objects
affects VWM performance. If competition is an important determinant of VWM performance, a
number of predictions can be made. First, VWM performance should vary as a function of the
amount of competition between items. When competition is greatest (i.e., when many items fall
within the same receptive fields), VWM performance should be most impaired. Second, VWM
performance should decrease as a function of the number of items in the display, independent of
any storage “capacity.” Although the observation that performance decreases as a function of the
number of items has been borne out in past experiments (Barton, Ester, & Awh, 2009; Bays &
Husain, 2008), this hypothesis has not been tested directly with respects to a competition
framework. Third, if the number or precision of VWM representations are affected by
competition, then biasing responses in favour of some items should increase the probability and
precision of recalling those items, while similarly reducing performance for items which are not
given priority.
Although biased-competition is a theory of visual attention, it is important to emphasize
that the present research is not simply aimed at examining interactions between VWM and
attention. Instead, the studies presented in this thesis are aimed at exploring the physiological
mechanism of competition as a potential limiting factor in VWM performance. Attention will
ultimately play an important role in a competition-account of VWM, as attention can serve as the
mechanism for resolving competitive interactions and for determining the contents of VWM
(Desimone & Duncan, 1995; Kastner & Ungerleider, 2001). Competition, however, is considered

16
in this framework to be a neurobiological mechanism that affects all aspects of visual cognition,
including the encoding and maintenance of information in VWM.
Thesis Overview
The purpose of the present thesis is to examine whether VWM performance is mediated
by known information-processing limitations of the visual system, namely, competitive
interactions. That is, in order for information to be successfully encoded, maintained, and
retrieved from VWM, that information must first overcome early processing bottlenecks (i.e.,
those that occur prior to VWM maintenance). Thus, competition for early representation may
limit the number or precision of representations that can be maintained in VWM.
The studies presented in this thesis address two broad questions. First, how is VWM
performance affected by competition? I will address the mechanisms of VWM performance at
the group level (i.e., why performance is affected by factors such as complexity and number of
items). To examine how VWM performance is affected by competition, the studies of Chapters 1
to 5 focus on the effect of spatial separation on VWM performance, as competition between
stimuli is increased as the spatial separation between two objects decreases. Using a variant of
the one-shot change-detection paradigm, the effect of competition on VWM performance is
established for target-target and target-distractor separation (Chapter 1), and for simple and
complex objects (Chapter 2). These experiments demonstrate that increasing competition for
representation decreases change-detection performance, consistent with the competition
hypothesis. Using a continuous-response method, Chapters 3 to 5 examine the effect of
competition on the number and precision of representations in VWM, as well as on the number
and types of memory errors. Performance is examined on multiple objects relative to a single
item (Chapter 3), and for a larger number of items and locations (Chapter 4). Overall, the results
reveal that increasing competition affects the precision of VWM responses. Specifically, the
precision of responses decreased under high competition, resulting in an increase in the number
of non-target errors. The subsequent experiment (Chapter 5) demonstrates that distractors and
targets have similar effects on VWM performance, although the effect of distractors is mitigated
relative to the effects of targets.
The second question to be addressed in this thesis is how is competition for
representation overcome? Specifically, Chapters 6 through 9 test the hypothesis that competition
can be overcome via bias signals (selective attention). Using a continuous-response method, the

17
effects of bias via bottom-up sensory signals (Chapter 6) and spatial and feature cues (Chapter 7)
on the precision and number of VWM representations are examined. These studies demonstrate
that both bottom-up and top-down selection can bias the contents of VWM and mitigate the
effects of competition on responses. Also, individual-differences in perceptual representations
mediate individual-differences in VWM performance (Chapter 8), as VWM capacity correlates
significantly with the precision of a single VWM representation. Finally, the neural signals
associated with competition are examined in an ERP experiment (Chapter 9) to test whether this
activity is related to individual differences in VWM capacity. Together, the findings presented in
this thesis reveal that competition for representation significantly affects VWM performance.
Specifically, competition for neural representation affects the precision of responses, and this
competition results in an increase in the proportion of trials on which the target location is mis-
remembered. Furthermore, these studies indicate that all objects compete for representation
within capacity-limited VWM storage, but the contents of VWM can be biased by spatial or
object-based selection mechanisms. In addition, the ability to bias selection (thereby resolving
competition) is a significant predictor of VWM capacity. Together, these findings have
significant implications for our understanding of the nature of processing limitations in visual
cognition.

18
Chapter 1: Spatial Competition Affects VWM Performance
As described in the Introduction, if multiple objects are presented in the visual display,
they interact in a mutually suppressive way and compete for neural representation (Desimone &
Duncan, 1995; Kastner et al., 1998; Kastner et al., 2001). Furthermore, the effects of these
competitive interactions are spatially graded. That is, because the size of receptive fields in the
visual stream increases from less than 2˚ in primary visual cortex to 4-6˚ in V4 (Kastner et al.,
2001), two objects that fall within 2˚ should, on average, compete for representation in both V1
through V4, but when separated by several degrees should only compete for representation
within areas V4 and beyond. The behavioral consequences of this change in receptive field size
has been demonstrated in the form of localized attentional interference (LAI), whereby the
processing of multiple targets is most impaired when both items are contained within a very
small region of space, with performance increasing as a function of the distance between items
(Bahcall & Kowler, 1999; McCarley & Mounts, 2007, 2008; McCarley et al., 2004; Mounts,
2000; Mounts & Gavett, 2004; Mounts, McCarley, & Terech, 2007). Thus, as the distance
between targets decreases, the competition for neural representation increases, resulting in
greater impairments in the identification and representation of those stimuli.
If competition also affects the ability to encode or maintain information in VWM, similar
decreases in performance should be observed when the distance between memory stimuli is
reduced. Consequently, the present study aimed to test whether competition for neural
representation (defined as the distance between objects) has a similar effect on VWM
performance as is observed during LAI. In other words, if the distance between objects affects an
observer’s ability to attend to and perceive multiple visual objects, do these competitive
interactions similarly affect the ability to encode and maintain information in VWM?
In addition to the effects of spatial separation, there are other ways through which VWM
performance may be affected by competition between items. For example, competition for
representation should increase as a function of the number of competing elements in the visual
display. In other words, each target item added to the display reflects an additional item that is
competing for neural representation. This suggests that if competition affects VWM
performance, then performance should decrease as a function of the number of items in the
display. Evidence in support of this competition account comes from the finding that both the

19
probability of recalling an item and the precision of those representations decreases even from
one to two items (Bays & Husain, 2008; Wilken & Ma, 2004; Zhang & Luck, 2008). These
findings support the proposal that competitive interactions between stimuli in the visual field
may affect the number and precision of items that are maintained in VWM. Moreover, these
effects occur with even only two items, suggesting that competition affects VWM independent of
any capacity limitations. Thus, competition may not necessarily be restricted to local effects, but
may extend globally (across the entire visual field).
In addition to competition increasing as a function of the number of targets, evidence
suggests that task-irrelevant distractors compete for representation in VWM. Specifically, neural
measures of VWM storage increase in the presence of distractors (McNab & Klingberg, 2008;
Vogel et al., 2005), suggesting that all items in the visual scene compete for access to capacity-
limited VWM, regardless of whether or not they are relevant for the task. In other words, as more
items are added to the display (whether targets or distractors), VWM performance suffers,
indicating that this increased competition plays a critical role in creating or maintaining
representations in VWM.
In summary, the goal of the first experiment is to test whether competition for
representation affects VWM performance. Competition between items in a change-detection task
was manipulated either spatially (i.e., by decreasing the distance between items) or by
manipulating the degree of competition for capacity-limited resources (i.e., by varying the
number of elements in the display). If spatial competition is a limiting factor of VWM, then
change-detection performance should be directly related to the distance between sample items;
performance should decline when target items are close together and are competing for
representation within a greater number of receptive fields. If this spatial competition affects the
ability to create high-resolution representations of target items at early stages of visual
processing, then manipulating the distance between objects should affect change-detection
accuracy at set sizes that are both above and below the capacity of VWM. In other words, items
should compete for representation in early visual processing independent of capacity limitations
in VWM. Increasing the number of targets or distractors in the display should, however, increase
the competition for representation by capacity-limited resources, in addition to increasing the
amount of spatial competition between items. Therefore, if competition for representation affects
VWM performance, change-detection accuracy should decrease in the presence of additional

20
targets and distractors, independent of whether the number of target items is below or above
VWM capacity.
Method
Participants. Fifteen (1 male, 13 right-handed, ages: 18 – 27 years; M = 20.7) individuals
participated in this experiment. Participants were recruited from undergraduate psychology
courses at the University of Toronto and were compensated with partial course-credit or $10/hr.
All procedures were approved by the University of Toronto Research Ethics Board.
Stimuli. Participants were seated in front of the test monitor at a distance of
approximately 57 cm. Stimuli were presented using Presentation (Neurobehavioral Systems), and
displayed on a 19-inch CRT-monitor using a refresh rate of 60-Hz. The memory stimuli
extended 0.8˚ x 0.8˚ of visual angle for both circles and squares and could appear in 9 potential
colours, selected randomly without re-sampling on each trial: black (RGB: 0, 0, 0), white (255,
255, 255), light blue (0, 162, 232), dark blue (63, 72, 204), green (0, 146, 63), magenta (255, 0,
128), purple (144, 30, 120), yellow (255, 245, 0) and red (218, 37, 29).
Procedure. The task consisted of two trial types, which were presented in alternating
blocks. The participant’s task in both types of trials was to remember 2, 4, or 6 coloured memory
stimuli. Target stimuli were either squares or circles, assigned randomly to each individual. All
results are presented averaged across target types. In the filter condition, target items (e.g., 4
squares) were presented along with 2 additional distractor items (e.g., 2 circles). Participants
were instructed to remember the target items while ignoring the distractor items. In the
remember-all condition, target items were both circles and squares. That is, in the remember-all
condition, 2 of the items from the filter condition were removed from each set size, resulting in
the same number of target stimuli. In the filter condition, the number of circles and squares on
each trial were randomly assigned in pairs.
At the start of each trial, a black fixation cross was presented at the centre of the display
for 750 ms to prepare the subject for the upcoming memory sample. Immediately afterwards, the
sample array was presented for 150 ms, during which the fixation was removed from the display
to eliminate any competitive effects of the fixation. Although encoding time is known to have
important effects on perceptual and memory processes (e.g., Vogel, Woodman & Luck, 2006),
the amount of encoding time was kept short throughout this thesis to minimize the effect of eye
movements, as well as to remain consistent with the majority of previous studies. Eye position

21
was not monitored in any of the tasks. Following the sample display, a 1,000 ms delay period
was presented. After the delay, the probe display was presented until a response was made. The
probe and sample displays contained the same number of stimuli in the same spatial
configuration, with no changes to the circles:squares ratio. Participants were instructed to
indicate with a keyboard response whether any of the target stimuli changed colour between the
initial sample and probe displays (50% of trials). In the filter condition, changes could occur only
to one of the target shapes (e.g., squares). In the remember-all condition, changes were randomly
assigned to one of either the circle or square items. The next trial (beginning with the fixation
cross) was presented immediately after each response.
Critically for the purposes of the present experiment, the distance between the stimuli
was manipulated in two conditions. In the high-competition condition, stimuli were presented
centered on 9 locations on an invisible 2˚ x 2˚grid. Thus, two stimuli could be separated by 0.2˚ –
1.2˚ and were contained within 1.8˚ – 2.8˚ of visual angle. In the low-competition condition, the
grid was extended by 6˚, resulting in 2.2˚ - 5.2˚ separation between two stimuli, which were
contained within 3.8˚ - 6.8˚ of visual angle (Figure 2).
Figure 2 ‐ Stimuli and procedure used in the experiment in Chapter 1. (A) Examples of the low‐ and high‐competition displays. Stimuli are presented within a smaller area in the high‐competition condition. (B) Example of the sequence of events of the change‐detection task employed in the experiment in Chapter 1. The observer’s goal is to detect changes to the target stimuli.
Participants performed 60 trials of each instruction (filter and remember all) x
competition (high and low competition) x set size (2, 4, and 6) cell, for a total of 720 trials.
Instructions for each set of instructions (filter and remember all) were provided at the beginning

22
of each block of 60 trials. Participants were instructed to take a short break between blocks. To
familiarize participants with the procedure, and to obtain a baseline measure of VWM-capacity,
participants performed 50-trials each of a 2, 4 and 6 item change-detection task prior to
beginning the experimental task. The stimuli used were seven square stimuli (excluding magenta
and dark blue) that were 0.65˚ x 0.65˚, and were presented around the fixation on an invisible 4˚
x 4˚ grid. Capacity (K) was estimated for each task using the Pashler-Cowan formula described
above. K-estimates were all between 2 and 6 items, with an average capacity of 3.1. All subjects
performed both tasks above chance, and thus none of the participants were excluded from
analysis.
Results and Discussion
To establish whether inter-item competition affects change-detection performance,
accuracy (% hits - % false alarms) was first analyzed for the remember-all condition using a 2
(high vs. low competition) x 3 (set size) repeated-measures analysis of variance (ANOVA).
Consistent with previous studies, accuracy decreased as the number of to-be-remembered items
increased, F(2,28) = 104.3, MSE = .017, p < .001. Importantly, accuracy was also impaired under
the high-competition condition, relative to the low-competition condition, F(1,14) = 6.6, MSE =
.008, p = .02. Thus, decreasing the inter-item distance between targets had a detrimental effect on
VWM performance (Figure 3). Furthermore, no significant interaction between set-size and
competition was observed, F(1,14) = .21, MSE = .009, p = .81, indicating that the effect of
competition on change-detection performance was consistent across all set sizes.
To examine whether non-target items similarly compete for representation, a full 2 (filter
vs. remember-all) x 2 (high vs. low competition) x 3 (set size) repeated measures ANOVA was
performed. Consistent with the above results, main effects of set size and spatial competition
were observed, F(2,28) = 181,7, MSE = .02, p < .001 and F(1,14) = 14.2, MSE = .007, p = .002,
respectively. The main effect of filtering condition was also significant, F(1,14) = 26, MSE =
.008, p < .001 (Figure 3). Importantly, none of the interactions were significant, all Fs < 1.3, ps >
.28, indicating that spatial competition has a similar effect on change-detection performance
regardless of the number of targets or the presence of distractors.
The results of the present experiment reveal two important findings. First, accuracy
decreased as the number of stimuli competing for representation was increased. That is,
increasing the number of sample items, or presenting the target items along with distractors, both

23
significantly reduced change-detection accuracy. Second, change-detection performance is
affected by the distance between sample items: when sample items are presented close together
in space, change-detection performance is impaired relative to when those items are presented
further apart. This was true for all set sizes, indicating that spatial competition has an important
effect on VWM accuracy, independent of capacity. These findings are consistent with
behavioural evidence that suppressive interactions have a spatially graded effect on the selection
and identification of multiple targets (Mounts, 2000; Mounts & Gavett, 2004). In other words, as
memory items are presented over a smaller region of space, they compete for representation by
more neurons (i.e., those with small receptive fields). Thus, this finding provides strong support
for the hypothesis that competition for representation affects VWM processes.
This novel finding that spatial competition affects VWM independent of capacity
limitations suggests that the typically observed effects of set size on change-detection
performance may also be attributed, at least in part, to the effects of competition. That is, as more
items are added to the display, each item competes for representation within a finite number of
visual fields. Thus, the competition account may provide an alternative explanation to the finding
that the fidelity of VWM representations decrease as a function of set size (Barton et al., 2009;
Bays & Husain, 2008); rather than competing for a limited pool of memory resources, each
Figure 3 ‐ Average accuracy observed in the remember‐all condition in the experiment in Chapter 1. Accuracy was higher overall in the low spatial‐competition condition. Error bars denote within‐subject 95% confidence intervals (CIs).

24
additional item competes for neural representation at the earlier stages of perception or encoding.
This increased spatial competition would therefore likely result in a more noisy and less precise
representation maintained downstream in capacity-limited VWM.
To summarize, the absence of any observed interactions of spatial competition with set
size or filtering condition indicates that items in the visual scene compete for representation
irrespective of the number of items in the display. Importantly, because these effects are
observed with even two items, it precludes any possibility that decreases in performance are the
result of constraints placed on storage capacity limits. These results are consistent with findings
that multiple objects compete for early perceptual representation (Desimone & Duncan, 1995;
Kastner et al., 2001), in addition to competing for capacity-limited VWM resources. In other
words, spatial competition for representation likely occurs upstream of VWM maintenance, and
may affect the ability to encode high-resolution representations. Consequently, the next chapter
will address whether competition similarly affects VWM performance for simple and complex
objects.
Figure 4 ‐ Average accuracy as a function of filtering and spatial competition condition presented in Chapter 1, collapsed across set size. Accuracy was higher overall in the low‐competition condition, as well as in the remember‐all condition. Error bars denote within‐subject 95% confidence intervals.

25
Chapter 2: Competition Affects VWM for Complex More than Simple
Objects
The results of Chapter 1 indicate that reducing the distance between items (thereby
increasing competition for representation) impairs change-detection accuracy. These results
support the hypothesis that spatial competition is an important limiting factor in the formation of
visual representations, including those that are encoded and maintained in VWM. That is, not
only does the distance between objects affect the ability to attend to and identify objects (e.g.,
Duncan, 1984; Mounts, 2000; Mounts & Gavett, 2004), it also affects the ability to create and
maintain representations in VWM. Importantly, the absence of any interaction with set size
indicates that these effects are likely not the result of capacity limitations in VWM storage;
instead, spatial competition likely affects the earliest stages of representation (i.e., encoding or
consolidation). That is, competition is likely to affect the resolution of VWM representations,
rather than imposing capacity constraints on the number of items that can be stored.
If spatial competition affects VWM performance at the stage of initially perceiving and
identifying object stimuli, rather than at the stage of maintenance, then objects that are more
difficult to represent and perceive should be more affected by manipulations that increase
competition (i.e., the distance between objects). For example, as mentioned in the Introduction, a
study by Alvarez and Cavanagh (2004) demonstrated that the number of items that could be
stored in VWM was largely predicted by the time required to represent, encode, and compare
those objects in a visual search task. As such, it is possible that the typical finding of lower
VWM capacity estimates for more complex items may not be the result of storage limitations,
but instead may be due to the nature of these complex items: complex items are more difficult to
perceive, resulting in less precise representations maintained downstream in VWM (Awh et al.,
2007). Consequently, the goal of Chapter 2 is to examine the effects of spatial separation on
simple and complex objects. If VWM performance for complex objects is impaired because they
are more difficult to initially perceive and identify, then increasing the amount of competition
between sample items should have a greater effect on change-detection performance for complex
objects than for simple objects.
Why should the distance between objects affect complex objects more than simple
objects? If complex objects are comprised of a conjunction of features, then it is unlikely that

26
these objects can be represented by neurons in early visual cortex alone, as early visual cortex
codes for only simple features (i.e., colour, line orientation, etc). Instead, in order to represent
more complex stimuli, simple features are pooled in regions of higher visual cortex. Thus, the
earliest regions at which these complex items could be represented as bound objects would be
further along the visual pathway where neurons have larger receptive fields. Consequently,
decreasing the spatial separation between complex objects should have a detrimental effect on
performance, since these would be competing for representation in the entirety of the neurons
that could code for them. In contrast, simple objects could be uniquely represented by neurons
with smaller receptive fields in earlier stages of visual processing. Thus, simple objects should be
less affected by reducing the distance between objects, as they would likely be able to maintain
some unique representation in areas of early visual cortex (where there are smaller receptive
fields).
In addition, if complex objects are comprised of shared features, then they will compete
for the representation of those neurons that code for those features. This means that competition
should be even more difficult to resolve for these complex objects with shared features than for
simple objects comprised of unique features. Thus, when complex objects are presented close
together they will be subject to spatial competition (competition for representation within
receptive fields) as well as feature-based competition. In contrast, simple objects, when
presented close together, should only exhibit the effects of spatial competition, resulting in a less
dramatic impairment. Therefore, the second experiment examines whether reducing the space
between sample items has a greater effect on complex objects than on simple objects.
Method
Participants. Fifteen (2 male, 14 right-handed, ages: 18 – 36 years; M = 21.3) individuals
participated in the experiment. Participants were recruited from undergraduate psychology
courses at the University of Toronto and were compensated with partial course credit or $10/hr.
Stimuli and Procedure. The procedure was similar to that of Chapter 1. Following a 750
ms central fixation, a memory sample of 2, 4 or 6 items was presented for 150 ms, and
participants were instructed to remember as many of the items as possible over a 1,000 ms delay.
After the delay, the probe display was presented, and participants indicated whether any of the
items in the probe display differed from those presented in the initial sample display (50% of
trials). The probe display contained the same number of objects as the sample display.

27
In alternating blocks of 50 trials, participants were presented with simple (coloured
squares) or complex (shaded cubes) stimuli (Figure 5). The simple stimuli consisted of the same
set of coloured squares used in Chapter 1. Cube stimuli were composed of three sides, one each
of black, grey and white. As with the simple stimuli, a total of 9 different cube stimuli were used.
To make the cube details easier to identify, the size of the stimuli were increased to
extend a maximum of 1.2˚ x 1.2˚ visual angle. As in the previous experiment, the distance
between sample stimuli was manipulated. In the high-competition condition, stimuli were
presented centered on an invisible 9 x 9 grid extending 2.8˚ x 2.8˚. Thus, the centre-to-centre
distance between objects was 0.2˚ - 1.6˚, and two objects could be contained within a total area
of 2.6˚ – 4.0˚. In the low-competition condition, the size of the grid was extended to 8.4˚ x 8.4˚,
with stimuli separated by 3.0˚ - 7.2˚ and contained within an area of 5.4˚ – 9.6˚.
Participants performed 60 trials of each set size (2, 4, and 6) x object complexity (simple
and complex) x competition (low and high) cell, for a total of 720 trials. As with the experiment
in Chapter 1, participants first performed 150 trials of practice using simple stimuli. K-estimates
ranged from 2.7 – 5 items (M = 3.6).
Results and Discussion
Analyzing accuracy (% hits - % false alarms) for the simple stimuli, repeated measures
ANOVA revealed a significant main effect of set size, F(2,28) = 86.48, MSE = .012, p < .001,
along with a moderately significant effect of competition, F(1,14) = 3.83, MSE = .004, p = .07.
No significant interaction was observed, F(2,28) = 2.1, MSE = .006, p = .15. These results
largely confirm the effects of Chapter 1, with a slightly diminished effect of competition (see
discussion below).
Figure 5 ‐ Examples of complex stimuli used in Chapter 2. For the simple stimuli condition, shaded cubes were replaced with coloured squares.

28
Examining accuracy for the full comparison of the 2 (object complexity) x 2 (spatial
competition) x 3 (set size) ANOVA, significant main effects of complexity, F(1,14) = 336.7,
MSE = .02, p < .001, spatial competition, F(1,14) = 15, MSE = .009, p = .002, and set size,
F(2,28) = 328.1, MSE = .007, p < .001, were observed. A significant interaction between object
complexity and set size was observed, F(2,28) = 7.77, MSE = .01, p = .002 (Figure 6).
Importantly, a moderately significant interaction between complexity and spatial competition
was also detected, F(1,14) = 3.23, MSE = .009, p = .09. Thus, collapsing across set sizes to
compare the simple effects, reducing the distance between objects had a significant effect on
complex objects, t(14) = 3.24, SEM = .024, p = .006, while the effect of the spatial competition
manipulation on the simple stimuli was much smaller, t(14) = 2, MSE = .014, p = .07 (Figure 7).
No other significant interactions were observed, Fs > 1.2, ps > .26.
The results of the present experiment reveal two important findings. First, the results
confirm the effects observed in Chapter 1, demonstrating that reducing the distance between
objects impairs change-detection performance. This observation is extended in the present
experiment to complex as well as simple visual objects. Second, this effect was found to be
larger for the complex stimuli (shaded cubes) than for the simple stimuli (coloured squares). As
outlined above, this effect is predicted by a competition account, as complex objects should
compete for the representation of shared features, and can only be fully represented by neurons
with larger receptive fields (i.e., those in higher visual cortex). This additional level of
competition likely accounts for the observed interaction between competition and complexity.
Figure 6 ‐ Accuracy for simple and complex objects, averaged across competition condition. Error bars denote 95% within‐subject CIs.

29
Although the effect of spatial competition on simple objects was mitigated when
compared with the results of the first experiment, this difference is likely the result of the
changes to the size of the stimuli and the area over which stimuli were presented. That is,
increasing the size of the stimuli resulting in the high-competition configuration to be presented
over a larger area than that of Experiment 1. Thus, since objects could only compete for
representation in regions with larger receptive fields (those large enough to encompass both
objects), this increase in sample area likely resulted in overall less competition relative to that of
the first experiment.
Previous studies have suggested that fewer complex objects can be stored in VWM.
Consistent with this account, we observed lower overall change-detection performance for
complex objects than for simple objects, as well as a significant interaction between set size and
object complexity. While it is possible that these findings support the proposal that fewer
complex objects can be maintained in VWM, the absence of any interaction between spatial
competition and set size argues against this account. That is, increasing the competition between
sample items had a greater effect on complex objects than on simple objects, regardless of
whether the number of simple or complex objects was below or above the capacity of VWM.
This suggests that the effect of spatial competition on change-detection accuracy was
independent of the number of simple or complex objects that can be stored in VWM. Instead,
these results support the hypothesis that competition affects VWM performance upstream of
VWM maintenance, altering the ability to establish high-fidelity visual representations.
Figure 7 ‐ Accuracy for simple and complex objects under low and high competition, averaged across set size. Error bars denote within‐subject 95% CIs.

30
In summary, the results of the experiments in Chapters 1 and 2 indicate that increasing
the competition between items by reducing the distance between them significantly impairs
VWM, as revealed by a reduction in change-detection accuracy. Furthermore, the competition
hypothesis could also account for the effects of set size (Chapters 1 and 2), distractors (Chapter
1) and stimulus complexity (Chapter 2) on change-detection performance. That is, all of these
manipulations increase the degree of competition for representation within the visual system.
Consequently, these findings suggest that competition for representation may play a critical role
in determining the contents of VWM. Importantly, the findings presented in Chapters 1 and 2
strongly suggest that competition affects the front-end of VWM performance by limiting
information at the perceptual, encoding stages, rather than imposing capacity limitations that
affect the number of items that can maintained in VWM. Consequently, Chapters 3 – 5 use a
psychophysical approach to determine the precise effect of spatial competition on the number
and precision of VWM representations.

31
Chapter 3: Competitive Interactions Increase Recall Errors
The results of Chapters 1 and 2 demonstrate that change-detection performance is
impaired when objects are presented over a small region of space, and are therefore competing
for representation in a larger number of receptive fields. These effects parallel the behavioral
impairments observed in the selection and perception of multiple visual stimuli (Bahcall &
Kowler, 1999; Duncan, 1984; Mounts, 2000), suggesting that spatial competition plays a critical
role in many aspects of visual cognition.
The results of Chapters 1 and 2 suggest that competition affects change-detection
performance independent of capacity limitations, indicating that it likely affects performance
upstream of VWM maintenance during initial perception or encoding, before information is
consolidated into VWM. This hypothesis is consistent with findings that spatial competition
affects performance at the level of early perceptual and representational stages, as even the
identification of simple objects is impaired when objects compete for representation (Bahcall &
Kowler, 1999; Duncan, 1980, 1984; Mounts, 2000; Mounts & Gavett, 2004). Thus, these results
strongly suggest that competition affects the precision of VWM representations, rather than the
number of items that can be maintained. Consequently, the goal of the present experiment is to
use a psychophysical approach to assess the precise effect of competition on the number and
precision of representations stored in VWM.
Precision is a measure of error defined as the inverse of the standard deviation of error of
all responses (Bays & Husain, 2008). Thus, since low-resolution representations are likely to be
reported with more error than high-resolution representations, precision can be used as a proxy
for measuring resolution. Importantly, multiple studies have demonstrated using a recall task that
the precision of VWM responses decreases as a function of the number of to-be-remembered
items (Bays & Husain, 2008; Wilken & Ma, 2004). Although this finding may indicate that
precision is affected by competition, it is unclear whether this competition is spatial in nature
(i.e., objects compete for representation with receptive fields) or whether it is related only to
competition for cognitive resources (i.e., memory capacity).
Examining precision alone, however, does not reveal the number of items that are
correctly recalled during the task. That is, examining trial-to-trial variability alone makes no
assumptions about how an observer might respond if they forgot the target and simply guessed.
Accordingly, Zhang and Luck (2008) used a two-factor mixture model to describe both the error

32
of responses, as well as the probability that items were correctly recalled from memory. In this
study, participants had to select the colour of the target item from a colour wheel. The analysis
used by Zhang and Luck to model the responses in this task assumed that if the target item is not
successfully maintained in VWM, then the responses should be random with respect to the target
colour. Thus, this model holds that all responses should be a mixture of a normal distribution
with some amount of error (the trials on which the target was correctly recalled) and a uniform
distribution (the trials on which the target was forgotten). This model was updated by Bays and
colleagues (Bays et al., 2009), who demonstrated that some of the responses that are assumed to
be random guesses in a two-component model (because they fall within a seemingly uniform
distribution relative to the target) are in fact responses in which the observer mistakenly reports
the colour of one of the non-target (uncued) items (Figure 1). That is, these responses are not
“guesses,” but are instead correctly-recalled items that are reported at the wrong location. These
non-target responses, therefore, indicate that the reported item was in fact contained in memory,
but possibly reflect errors in spatial working memory (misremembering the target location).
Thus, the three-component model not only provides a second measure of error that may be
important to understanding the entirety of VWM performance, but it also provides a more
accurate or complete picture of the number of items correctly recalled.
Accordingly, the goal of the present experiment was to use the three-component model
described by Bays and colleagues (Bays et al., 2009) to examine the effect of competition on the
precision of VWM representations, as well as on the number of items correctly and incorrectly
recalled. Building on the findings of Chapters 1 and 2, competition was manipulated by varying
the distance between sample items in a continuous-response task similar to that of previous
studies (Bays et al., 2009; Wilken & Ma, 2004; Zhang & Luck, 2008). If competition does affect
the perception and identification of high-resolution representations that are to be encoded and
maintained in VWM, then competition should affect only the precision of those representations,
rather than the number of items correctly recalled. If instead competition imposes constraints on
the storage of items in capacity-limited VWM, then increasing competition between objects
should affect the number of items correctly recalled, as well as potentially decrease the precision
of those representations.

33
Method
Participants. Eighteen undergraduates (4 male, 17 right-handed, ages: 19 – 36; M = 22)
from the University of Toronto participated in this experiment for partial course credit. All
participants had normal or corrected-to-normal vision, and had self-reported normal colour
vision.
Apparatus. Participants were seated in front of a 19-inch CRT monitor at a distance of
approximately 57 cm. The screen resolution was 1280 x 960 and the refresh-rate was 60 Hz.
Stimuli were generated and presented using Matlab and the Psychophysics Toolbox 3 extensions
(Brainard, 1997; Kleiner et al., 2007).
Stimuli and Procedure. Each trial began with the presentation of 1 – 3 coloured squares
for 100 ms, presented around a central black fixation cross 1.2˚ x 1.2˚. Following a 1,000 ms
blank delay containing only the fixation, the probe display was presented. During the probe, the
locations of the sample items were indicated by black placeholder boxes. One of the sample
locations was identified as the target location by displaying a placeholder with a line width of 8
pixels. The remaining non-target locations were indicated with a line width of 4 pixels. In
addition to the memory placeholders, a colour-wheel containing all possible sample colours was
presented surrounding the test area (Figure 1).
Participants were instructed to remember as many of the sample items as possible over
the delay period, and to indicate the colour of the target square by clicking on the location on the
colour-wheel that most closely matched the colour of the cued item. During instructions,
emphasis was placed on accuracy, and participants were instructed to make multiple responses if
the selected colour did not match closely enough to the remembered colour of the target item.
Each time a colour was selected, the placeholder at the target location was replaced with a
coloured square that matched the shade of the participant’s response. The trial ended when the
subject pressed the keyboard spacebar, and the final selected colour was taken as the
participant’s response for that trial. Participants were also instructed to guess a random colour if
they could not accurately recall the colour of the target item, and to actively avoid selecting the
colour of a non-target item if they knew that it was not the colour of the probed location. Each
trial was followed by a 500 ms ITI, with only the fixation cross displayed.
Memory stimuli were selected from an array of 252 colours, each of which corresponded
to an equally-spaced point on the HSV (hue – saturation –value) colour wheel. Saturation and

34
value (brightness) were held constant at the maximum value. Thus, the intensity and brightness
of the stimuli remained largely constant regardless of particular stimulus hue. For the probe
display, the colour-wheel contained all 252 colours arranged on an annulus with an outer radius
of 8.3˚ and an inner radius of 6˚. The colours of all target and sample stimuli were selected
randomly, with the constraint that any two sample colours had to be separated by a minimum of
20 values on the colour wheel (28.5˚).
Sample squares were 1.2˚ x 1.2˚, and were presented at one of 18 locations on an
invisible circle with a radius of 5.4˚. To examine the effects of competition, the distance
between sample stimuli was manipulated. In the high-competition condition, two stimuli were
located at adjacent locations, while in the low-competition condition, two empty locations
occupied the locations between two stimuli. Thus, for a set size of two items, high-competition
stimuli were separated by a centre-to-centre distance of 1.9˚, and were contained within 3.1˚,
while low-competition stimuli were separated by a distance of 5.4˚, and were contained within
6.6˚. For the set size 3 condition, the same configuration of stimuli was used, such that each
display contained two stimuli in a high-competition configuration, with the third item located in
a low-competition configuration relative to one of the other stimuli (Figure 8). Thus, the total
area over which three items were presented was 6.6˚, as in the Load 2 condition. When two items
were presented, the location target square was assigned randomly. For set size three, the target
item in the high-competition was randomly sampled from either of the two high-competition
items.
Participants performed a total of 80 trials of each condition in blocks of 50 trials. Prior to
beginning the experimental task, participants performed 50 trials each of a 2-, 4- and 6-item
change-detection task to establish baseline VWM capacity and to become familiarized with the
Figure 8 ‐ Examples of the low‐ and high‐competition conditions used in the experiment in Chapter 3.

35
general procedure. K-estimates ranged between 1.7 – 5.0 (M = 3.2). This practice task was
followed by instructions for the experimental task, and a practice of 5 – 15 trials. The length of
the entire experiment was approximately 1 hour.
Analysis. The analysis was performed using the method of Bays and colleagues (Bays et
al., 2009). For each trial, the angular distance between the selected colour value and the target
colour value was calculated to obtain a measure of error. For each participant and condition,
precision was calculated as the inverse of the SD of responses, as in Bays in Husain (2008). The
SD was adjusted for a circular response distribution, as well as corrected for guessing as in Bays
et al. (2009).
In addition, a probabilistic model of responses was calculated according to the method of
Bays and colleagues (Bays et al., 2009). The model assumes a mixture of three components that
are each fit to the distribution of responses for each participant and condition: target responses
(PT), which are normally distributed around the target value using a circular analogue of the
Gaussian distribution (the Von Mises distribution); non-target responses (PNT), which are drawn
from a normal distribution of responses around the non-target value with the same SD as the
target responses; and random guesses (Pg) which have a uniform distribution across all potential
values. This method differs from the method of Zhang & Luck (2008), in that the proportion of
responses which are assumed to be guesses will be smaller, as some of these responses will be
extracted by PNT. Values for each parameter were obtained separately for each participant and
condition using maximum likelihood estimation according to the method of Bays et al. (2009).
Hypothesis tests for experimental manipulations were performed using repeated-
measures analysis of variance (ANOVA) and t-tests for the maximum likelihood estimates of
each of the measures obtained from each subject and condition. Effects of set size were
examined across loads 1 – 3, while the effects of spatial competition (low vs. high) were
considered only for loads 2 and 3.
Parameter estimates for each observer were examined for outliers prior to analysis. To
exclude the possibility that participants adopted a strategy of attending to only the low- or high-
competition items in the load 3 configuration, differences in accuracy between the two types of
probes were examined for outliers. Two individuals demonstrated a greater than 20% change in
PT between the two conditions, and were therefore eliminated from analysis. The SD of the
difference in accuracy for the remaining 16 participants was 6%.

36
Results and Discussion
The aim of the present experiment is to examine the effect of competition on the
precision of all responses, as well as on the proportion and error of target and non-target
responses. For example, if spatial competition affects the fidelity of VWM representations, the
distance between items should have a significant effect on the precision of responses.
Overall precision. To determine the effect of competition on the precision of VWM
responses, precision was first examined using the method of Bays and colleagues (Bays et al.,
2009; Bays & Husain, 2008) by calculating the reciprocal of the SD of error of all responses.
Averaging across competition conditions, precision of responses decreased as the number of
memory items increased, F(2,30) = 63.7, MSE = .28, p < .001, including between one and two
items, t(15) = 6.4, SEM = .217, p < .001. In addition, the precision of responses relative to the
proportion of resources available per item was examined by dividing the precision of each
condition by the precision obtained for a single item. Using this method revealed that precision
decreased according to a power-law function (Figure 9 – top left). This effect was observed for
both low- and high-competition conditions. Thus, these results confirm the findings of Bays and
colleagues (Bays et al., 2009; Bays & Husain, 2008) suggesting that as the number of to-be-
remembered items increases, the precision of any single memory representation decreases
proportionally according to a power law.
Examining the effect of competition revealed that while precision was reduced by
increasing the number of items from two to three, F(1,15) = 62.04, MSE = .13, p < .001,
reducing the distance between memory items had no observable effect on precision, F(1,15) =
.514, MSE = .071, p = .48. Furthermore, no interaction was observed between set size and
competition, F(1,15) = .366, MSE = .10, p = .554. Thus, contrary to the hypothesis that
competition affects the precision of representations, the fidelity of VWM was unaffected by the
distance between competing objects.
Target precision (three-component model). To examine the precision of target responses
alone, the SD of the normal distribution obtained from the three-component mixture model was
examined (Zhang & Luck, 2008). That is, this measure reflects the precision of only those items
that are correctly reported (PT). As with the precision of all responses, a significant effect of set
size was found when collapsing across competition condition, F(2,30) = 22.6, MSE = .002, p <
.001. Thus, each sample item added to the display increased the error of target responses,

37
including between one and two items, t(15) = -7.38, SEM = .009, p < .001. Neither the effect of
competition, F(1,15) = 1.45, MSE = .003, p = .25, nor the interaction with set size, F(1,15), MSE
= .003, p = .37, were significant. Thus, the precision of target representations was affected by the
number of sample items, but not by the distance between items.
Figure 9 ‐ Measures of relative precision (top left) and mean maximum likelihood estimate values for the three factors used to model responses in Chapter 3. Error bars denote within‐subject SEM. (Top Left) As in previous experiments, relative precision decreased according to a power‐law function. The fit lines represent the power‐law fit for both low and high competitions. (Top Right) The proportion of target responses decreases as a function of the number of sample items, with no difference between high‐ and low‐competition conditions. (Bottom Left) The proportion of non‐target responses increases with set size, and is greater in the high‐competition than in the low‐competition condition. (Bottom Right) The proportion of guesses increases with set size, and is unaffected by the distance between objects.

38
Proportion of target responses (three-component model). To determine whether
competition affects whether sample items are correctly recalled, the maximum likelihood
estimates of the proportion of target responses (PT) from the mixture model were examined.
Collapsing across competition conditions, a significant effect of set size on PT was observed,
F(2,30) = 27.5, MSE = .004, p < .001. As with precision, this effect was found to be significant
between one (M = .97) and two (M = .92) items, t(15) = 3.11, SEM = .015, p = .007, indicating
that increasing the number of items in the display has a consistent effect on VWM performance,
even when the number of sample items is well within the four-item “capacity” of VWM (Figure
9 – Top Right). Examining the effects of competition for loads two and three revealed a
significant main effect of set size, F(1,15) = 39.5, MSE = .005, p < .001, but no effect of spatial
competition, F(1,15) = .41, MSE = .002, p = .53, and no interaction, F(1,15) = .96, MSE = .001,
p = .34. Thus, while increasing the number of items in the display reduces the probability of any
item being correctly recalled, the distance between objects had no effect on target accuracy.
Proportion of non-target responses (three-component model). An important additional
question is whether spatial competition between items affects the ability to correctly recall the
location of each item. Thus, using the three-component model of Bays and colleagues (Bays et
al., 2009), the effect of competition on the number of non-targets reported (PNT) was examined.
Confirming previous findings, PNT increased as the number of to-be-remembered items
increased, F(1,15) = 12.2, MSE = .001, p = .003. Importantly, the distance between items (i.e.,
competition) also had a significant effect on PNT, F(1,15) = 8.4, MSE = .002, p = .011. Thus,
more non-target responses were made under high spatial competition (M = .05) relative to when
the sample objects were located further apart (M = .019). In addition, a significant interaction
between set size and competition was observed, F(1,15) = 5.8, MSE = .001, p = .029. That is, the
effect of competition was stronger at the larger set size (Figure 9 – Bottom Left).
Proportion of guesses (three-component model). The proportion of guesses (PG) also
increased with set size, F(2,30) = 13.1, MSE = .004, p < .001, collapsed across competition
condition. In contrast, neither the effect of competition, F(1,15) = 3.1, MSE = .003, p = .098, nor
the interaction were significant, F(1,15) = .816, MSE = .003, p = .38 (Figure 9 – Bottom Right).
Thus, although competition had a significant effect on the number of non-target responses,
competition between items had no effect on the proportion of guesses.

39
Overall, the results of this experiment confirm the results of Chapters 1 and 2 by
demonstrating that competitive interactions affect VWM performance, and extend this finding
beyond those available through high-threshold approaches. The results are mixed, however,
neither confirming nor refuting the hypothesis that competition affects the resolution of VWM
representations, rather than the number of items stored. As spatial competition had no effect on
the proportion of target responses (PT), these results suggest that competition acts independently
of VWM maintenance. That is, the number of items that were correctly reported was unaffected
by changes in competitive interactions, indicating that the distance between objects has no effect
on the ability to maintain or recall information from VWM. Competition also had no observable
affect on the precision of target responses (either the precision of target responses, or overall
precision), indicating that the items that were stored in memory were stored with a similar
resolution irrespective of the amount of spatial competition between items.
Although both the number and precision of targets reported was unaffected by the
competition manipulation, more non-target responses (PNT) were made under high-competition
compared to low-competition. Thus, these results are consistent with the effects observed in
Chapters 1 and 2, confirming that competitive interactions do affect VWM performance. It is
unclear, however, why spatial competition affected the PNT without affecting target accuracy or
precision. One possibility is that the ability to correctly recall the locations of each sample item
was affected by competition. That is, Xu and Chun (2009) have argued that there are two
important processes necessary to both VWM and object recognition: each item must first be
individuated, followed by a second stage during which the features of those objects must be
enhanced and encoded. Accordingly, when two items compete for neural representation within a
receptive field, it is possible that it is more difficult to individuate each item and subsequently
bind the correct features to the right location. Therefore, if competition affects the ability to
perform these processes of individuation and feature binding, this may impair the ability to recall
which item was presented at the target location, leading to an increase in the number of non-
target responses.
Another possible explanation for why spatial competition affected only the proportion of
non-target responses may be that mutually-suppressive interactions between high-competition
items may decrease the strength (or gain) of the memory signal, thereby increasing the amount of
decision errors. That is, when competition is low, the gain on the memory representation may be

40
higher, reducing the decision threshold for reporting the low competition item. When spatial
competition is high, however, the signal corresponding to the memory representation may be
lower. In other words, low-competition items may be easy to remember as well as easy to reject
when another item is forgotten, since the strength of the representation is high. On the other
hand, while high-competition items may be remembered just as easily, they may be more
difficult to reject under conditions of uncertainty, resulting in a greater number of incorrect
responses towards those items.
In summary, the results of the present experiment neither confirm nor refute the
hypothesis that spatial competition affects the resolution of VWM representations, rather than
the number of items stored, since both precision and PT were unaffected by the distance between
items. The finding that non-target responses ( PNT) were affected by competition, particularly at
larger set sizes, does confirm that competition affects VWM performance. One possibility is that
the tested distances between items was not large enough to observe effects of competition on the
number or precision of memory representations. Furthermore, it is possible that below the
“capacity” of VWM, the available remaining resources can mitigate the effects of competition on
the resolution of those representations. Accordingly, in Chapter 4, the effect of competition was
tested using a set size of four items that were presented over a larger range of inter-item
distances.

41
Chapter 4: Competitive Interactions Affect the Precision of VWM
Representations
The results of Chapter 3 indicate that competition increases the number of non-target
responses (errors) in a recall task, but that the proportion of target responses, as well as the
precision of target responses, remained unaffected. It is possible, however, that competition was
not tested over a large enough area to observe effects on PT or precision. That is, previous studies
have demonstrated that behavioural effects of competition are spatially graded, as the ability to
select and identify multiple objects improves as the distance between objects increases (Bahcall
& Kowler, 1999; Mounts, 2000; Mounts & Gavett, 2004); consequently, increasing the distance
between objects even further may reduce the effects of competition, resulting in stronger
differences. Furthermore, the effects of competition on PNT observed in Chapter 3 were larger at
set size 3 than at set size 2, indicating that competition may have a greater effect on responses at
larger set sizes. Accordingly, the goal of Chapter 4 is to examine the effects of competition
between four objects presented over a larger range of inter-item distances.
Method
Participants. Fourteen University of Toronto undergraduates (1 male, 13 right-handed,
ages: 18 – 23 years; M = 20.0) participated in this experiment for partial course credit.
Figure 10 ‐ Example schematics of the stimulus configurations in Chapter 4. Stimuli are not drawn to scale.

42
Stimuli and Procedure. The procedure was identical to that of Chapter 3, with the
following exceptions. On each trial, participants were presented with four coloured sample
stimuli for 150 ms, randomly presented in one of four conditions. Thus, the set size in this task
was held constant. Critically, the distance between objects was manipulated, as the stimuli were
presented with increasing separation between items (Separation 1 – 4). That is, all four sample
items were presented at adjacent locations in Separation 1, and with 1 – 3 empty locations
between items in Separations 2 – 4, respectively (Figure 10). The linear distances between items
and total area are presented in Table 1. As in the experiment in Chapter 3, the goal for
participants was to remember as many of the items as possible over a 1,000 ms delay period, and
to select from a colour-wheel the colour of the probed item. Responses were analyzed using the
same method as in the previous chapter, calculating the precision of all responses (1/SD), as well
as obtaining maximum likelihood estimates for each of the three factors in the model described
by Bays and colleagues (Bays et al., 2009). The colours and locations of each of the sample
patters were assigned randomly, with the constraint that any two sample colours had to be
separated by a minimum of 20 values on the colour wheel (28.5˚). Participants performed 50
trails each of a 2-, 4-, and 6-item change-detection task prior to beginning the experiment. K-
estimates in this task ranged between 1.6 and 4.8 items (M = 3.4). All participants performed
above chance and were included in analysis.
Table 1. Distances between stimuli for Experiment in Chapter 4.
Centre-to-Centre Distance Total Area
Minimum Maximum Minimum Maximum
Separation 1 1.9˚ 7.5˚ 3.1˚ 8.7˚
Separation 2 3.7˚ 10.6˚ 4.9˚ 11.8˚
Separation 3 5.4˚ 10.8˚ 6.6˚ 12˚
Separation 4 7.5˚ 10.8˚ 8.7˚ 12˚

43
Results and Discussion
As in Chapter 3, the precision of all responses were examined, as were the maximum
likelihood estimates for each of the values in the three-factor model. No effect of spatial
separation on any measure of precision was observed in Chapter 3, possibly because spatial
separation between stimuli was insufficient.
Overall precision. Contrary to the results of Chapter 3, a repeated measures ANOVA
revealed a significant effect of separation on the precision of all responses, F(3,33) = 2.9, MSE =
.04, p = .05 (Figure 11). This effect was largely due to the improvements observed at Separation
4, although the linear contrast was nearly significant, F(1,11) = 4.7, p = .053. Thus, increasing
the distance between items significantly reduced the amount of error in responses, indicating a
higher-fidelity representation in VWM.
Target precision (three-component model). Examining the precision of these target
representations revealed that there was no effect of competition on the SD of target responses,
F(3,33) = .94, SEM = .02, p = .43. Thus, although competition affected the precision of all
responses, targets were reported with similar precision independent of the amount of spatial
competition between them. This contradiction is discussed in detail below.
Proportion of target responses (three-component model). Examining the mean values
obtained from the three-factor model revealed that increasing the separation between items had
no effect on PT, F(3,33) = .46, MSE = .01, p = .71. That is, consistent with the effects of Chapter
3, spatial competition had no effect on the number of correctly reported targets.
Proportion of non-target responses (three-component model). The distance between
memory items did have a significant effect on the number of non-target items reported, F(3,33) =
3.42, MSE = .006, p = .028. That is, consistent with the effects presented in Chapter 3, more non-
target errors were made when competition was greater. Furthermore, the effect of separation on
PNT demonstrated a significant linear contrast, F(1,11) = 8.09, p = .016. Thus, these results
extend the findings of Chapter 3 by demonstrating that the effect of competition on the number
of incorrectly reported non-targets is linearly proportional to the distance between items.
Proportion of guesses (three-component model). Finally, examining the effect of
competition on PG indicated that the proportion of guesses remained unaffected by the separation
between memory items, F(3,33) = .4, MSE = .02, p = .76, just as in Chapter 3. Thus, although the

44
number of non-target responses was greater under high-competition, the number of random
responses remained unchanged.
Figure 11 – Precision, PT, PNT, and PG obtained for each separation condition in the experiment in Chapter 4, plotted by the distance between two items. Dashed lines correspond to linear contrasts. Error bars denote within‐subject SEM.
The results of the current experiment extend the findings of Chapter 3 by providing
further evidence that VWM performance is affected by competition. The results demonstrate that
while the distance between items had a significant effect on the number of non-target items
reported, the degree of competition had no effect on the number of correctly reported targets,
even when presented over a larger area. Unlike the results of Chapter 3, however, competition
did have a significant effect on the precision of responses. The finding that competition affected
the precision of responses without affecting the number of targets correctly recalled is consistent

45
with the proposal that competition affects performance independently of capacity limitations in
VWM storage. That is, competition for representation appears to affect aspects of visual
processing that are independent of the number of items that can be stored in, and accurately
recalled from, VWM.
Interestingly, although spatial competition did have a significant effect on the precision
of all responses (1/SD of all responses), the distance between objects had no effect on the SD of
the normal distribution of reported targets obtained in the mixture model. That is, when targets
were reported, they were reported with a similar amount of precision, regardless of the amount of
competition between items. How does competition affect overall precision without affecting the
resolution of target representations? Because precision represents the amount of error in all
responses (including those that are incorrect), precision may reflect many aspects of performance
that are unrelated to the ability to correctly and accurately report target items. Specifically, there
appears to be a significant relationship between precision and the proportion of non-target
responses (PNT), as these properties demonstrate similar but opposing effects (Figure 11). Thus, a
decrease in overall precision may reflect the increased tendency to report non-target items under
high competition. Accordingly, if competition biases participants to make a non-target response,
rather than respond at random, this change in response pattern may account for the decrease in
precision.
Importantly, the effect of spatial competition on PNT and precision was found to be
linearly related to the distance between objects. This provides evidence that the effects of
competition on precision and PNT are likely to occur upstream of VWM maintenance, impacting
performance at the initial perception and representation of the to-be-remembered objects. That is,
as objects are presented over a smaller area, they compete for representation within the smaller
receptive fields of early visual cortex. This increased competition results in a proportional
decrease in the ability to identify, encode, and maintain visual representations, consistent with
the effects of LAI (Bahcall & Kowler, 1999; McCarley & Mounts, 2007; Mounts, 2000; Mounts
& Gavett, 2004). Thus, overall the results suggest that competition affects the precision, but not
the number of items stored in VWM. While the resolution of targets remains relatively constant,
spatial competition likely affects the perceptual processing of sample items that leads to in an
increase in the number of non-target responses.

46
So far, the experiments presented in Chapters 3 and 4 examined the effects of competing
target information on memory performance. In the next chapter, I will examine the effects of
competing distractors on the number and precision of VWM representations.

47
Chapter 5: Multiple Distractors Affect the Precision and Number of
VWM Representations
In Chapters 3 and 4, the effect of competition on the precision and number of VWM
representations was examined. In addition to demonstrating that increased spatial competition
reduces precision and increases response errors, the results confirm the findings of Bays and
colleagues (Bays et al., 2009; Bays & Husain, 2008) that adding items to the memory array
reduces precision according to a power-law function. Furthermore, the proportion of target
responses and non-target errors are also affected by the total number of items in the display.
Thus, the number of to-be-remembered items has a critical effect on all aspects of memory
performance.
The finding that memory performance decreases as a function of the number of items has
previously been interpreted in a number of ways. While some argue that this change in
performance is related to a reduction or the averaging memory resources allocated to each item
(Bays et al., 2009; Zhang & Luck, 2008), others have suggested that this effect indicates a
reduction in the mnemonic resolution (the quality of the representations) of the objects stored in
memory (Barton et al., 2009). A third possibility may be that performance decreases at larger set
sizes because more items are competing for representation within a finite number of receptive
fields. Thus, adding more items to the display may increase the number of competitive
interactions, resulting in greater impairments in VWM performance. This account may also be
compatible with a resolution account, in which the increased competition between additional
items results in less precise representations.
One way to examine whether memory resources or mnemonic resolution are affected by
the total number of items may be to examine whether distractors presented during the sample
display have the same effect as targets. That is, if additional targets affect only the proportion of
memory resources allocated to each item, then distractors should have virtually no effect on the
precision and number of responses, since very few memory resources should be allocated to
them. If, however, additional targets increase the number of competitive interactions, and
therefore reduce the resolution of memory representations, then distractors may have a similar
effect on the precision and types of responses as targets. In other words, if targets and distractors
compete equally for perceptual representation, but not for memory representation, then

48
distractors should affect the front-end of VWM (perception and encoding) more so than the
back-end of VWM (maintenance and recall). Accordingly, the goal of the present experiment is
to examine the effects of distractors on the number and precision of VWM representations.
Method
Participants. Twelve University of Toronto undergraduate (1 male, 10 right-handed,
ages: 19 – 22 years; M = 20.2) participated in this experiment for partial course credit.
Participants had normal or corrected-to-normal vision.
Stimuli and Procedure. The procedure was similar to that of Chapter 3, with the
following exceptions. The goal of the task was to remember and report the colours of target
items presented during the sample display, while ignoring the distractor items. Target and
distractor stimuli could be either circles or squares, and participants were alternately assigned to
one of the two target types (Figure 12). Target and distractor stimuli remained constant
throughout the task. That is, the target for one subject could be squares on every trial, with
circles as the distractors.
During the sample display, observers were presented with 1, 2 or 4 items for 150 ms,
along with a central fixation (presented throughout). For set size 1, a single target item was
presented. For set sizes 2 and 4, sample items were presented randomly in one of two conditions:
in the targets only condition, all the items presented were targets (e.g., squares); in the targets +
distractors condition, half of the items presented were targets (e.g., squares) while the other half
were distractors (e.g., circles). Both the locations and the colours of target and distractor stimuli
were assigned randomly. Following the 1,000 ms delay, the locations of all stimuli (targets and
distractors) were highlighted by black boxes, and the probed item, corresponding to the location
of one of the target stimuli, was highlighted by a thick black line. Thus, the placeholders
indicated the locations of targets and distractors, but not their identities. Only target items could
be probed as the target. Participants were instructed to select the colour from the colour-wheel
that most-closely matched that of the probed target item. The first colour selected was taken as
the participant’s response and ended the trial. A 500 ms ITI was presented between trials.
Participants performed 70 trials of each of the 5 set size x filtering task cells, for a total of 350
trials. The task was performed in blocks of 50 trials, with a self-paced break between trials. As in
the previous experiments, participants first performed 50 trials each of a 2-, 4-, and 6-item

49
change-detection task to obtain a measure of working memory capacity (K). Capacity was
estimated using the formula described in the Introduction. K-estimates were between 1.9 and 4.3
with an average capacity of 2.9 items.
Analysis. Analysis was performed using the same method used in Chapter 3. Precision
was calculated as the inverse of the SD of all responses. In addition, maximum likelihood
estimates were obtained for the three factors of PT, PNT and PG. The values obtained from the
maximum likelihood estimates were analysed using a 2 (filtering condition) x 3 (set size)
repeated-measures ANOVA. The set size was defined as the total number of items (targets or
distractors), where the set size 1 condition was used as the baseline performance for both
conditions. The exception to this was the analysis performed on the proportion of non-target
responses (PNT) as the set-size of 1 cannot contain any non-target responses. Accordingly, only
the set sizes of 2 and 4 were analyzed for this variable. Importantly, all of the colour values were
entered in the analysis as potential non-target values. That is, the analysis was performed
assuming the distractor colours could have an equivalent effect on responses as other non-target
values, but that no effects on responses would be observed if participants successfully ignored
these distractors. Responses were analyzed for outliers, and all subjects were included in the final
analysis.
Figure 12 – Example of Targets Only and Targets + Distractors condition used in experiment 5. Circles were used as targets for half of the participants. The set size 4 condition is shown for both conditions.

50
Results and Discussion
The goal of the present experiment is to examine whether distractors have a similar effect
as targets on the precision and number of responses in a VWM task. If distractors only compete
for representation with targets in the initial (perceptual) stages of representation, then the
addition of distractors should affect the precision of responses, but without affecting the number
of target items (PT) correctly recalled. In other words, if individuals are successfully able to
ignore the distractor items, distractors should have very little effect on the number of target
responses. If, however, distractors compete with targets for VWM resources, then the addition of
distractors should affect the proportion of target responses, in addition to affecting precision. If
individuals can partially-ignore the distractor items, however, then the effect a distractor has on
PT may be mitigated relative to the effect of adding the same number of targets. Moreover, if
distractors do compete for memory resources, as opposed to just affecting the ability to encode
targets, then the number of non-target responses (PNT) should similarly be affected by the
presence of distractors.
Overall precision. Consistent with the results of Chapter 3, repeated-measure ANOVA
revealed that the precision of responses decreased as the set size increased, F(2,22) = 28.191,
MSE = .139, p < .001. The effect of filtering condition was also significant, F(1,11) = 56.145,
MSE = .432, p < .001, as was the interaction, F(2,22) = 10.043, MSE = .139, p = .001. That is,
the effect of set size on precision was mitigated in the targets + distractors condition relative to
the targets only condition (Figure 13). Planned paired t-tests revealed that while the addition of
one distractor to a display containing only one target had no effect on precision, t(11) = .319,
SEM = .1836, p = .756, precision for two targets was significantly reduced compared to a single
target, t(11) = 6.089, SEM = .16804, p < .001.That is, adding one distractor had no effect on
precision, but adding a second target to the display did. Adding two distractors to a display of
two targets did affect precision, however, as precision was reduced relative to the presentation of
two targets alone t(11) = 4.429, SEM = .15982, p = .001. The precision for two distractors and
two targets was greater than the precision for four targets, t(11) = -3.91, SEM = .1107, p = .002,
indicating that while distractors did affect precision, they did not have the same effect as targets.
Overall, these effects demonstrate that targets and distractors have different effects on precision.
Specifically, the effect of distractors on precision is mitigated in comparison to the effect of
adding the same number of targets.

51
Target precision (three-component model). Examining the effect of set size and filtering
condition on the SD of target responses revealed that, in addition to the significant effect of set
size, F(1,11) = 6.427, MSE = .004, p = .028, a significant effect of filtering condition was
observed, F(2,22) = 3.657, MSE = .003, p = .043. Thus, the SD of responses was greater in the
targets only condition than in the targets + distractors condition, indicating that targets were
encoded with less error when some of the items were distractors. The interaction between set size
and filtering condition was not significant, F(2,22) = 2.47, MSE = .003, p = .108, indicating that
while the targets were reported with less error when some of the items were distractors,
additional targets and distractors increased the SD of responses at a similar rate. In other words,
adding distractors to the display could affect the resolution of target items stored in memory,
although this effect was mitigated relative to the effect of adding targets.
Figure 13 ‐ Results of experiment in Chapter 5. In the targets + distractors condition, set size indicates the total number of items (50% distractors). Error bars denote within‐subject SEM.

52
Proportion of target responses (three-component model). Examining the effects of set
size and filtering condition on PT revealed that the proportion of target responses decreased as a
function of set size, F(2,22) = 24.836, MSE = .006, p < .001. In addition, a significant effect of
filtering condition was observed, F(1,11) = 41.153, MSE = .018, p < .001, as PT was greater in
the targets + distractors condition than in the target-only condition. Thus, adding distractors to
the display had a smaller effect on the proportion of target responses relative to adding the same
number of target items. The interaction between set size and filtering condition was also
significant, F(2,22) = 17.427, MSE = .003, p < .001. Planned comparisons revealed that while the
presentation of two targets significantly reduced PT relative to a single target, t(11) = 2.857, SEM
= .024, p = .016, the addition of one distractor had no effect, t(11) = 1.088, SEM = .028, p = .3.
The addition of two distractors along with two targets did, however, have a significant effect on
PT relative to presentation of when two targets presented alone, t(11) = 3.519, SEM = .03936, p =
.005; however, this effect was significantly smaller than those observed when presenting the
same number of targets, t(11) = -5.162, SEM = .03659, p < .001. Thus, while the addition of
distractors reduced the proportion of target responses, this effect overall was mitigated relative to
the addition of targets, particularly when only a single distractor was presented along with one
target item.
Proportion of non-target responses (three-component model). To examine changes in the
PNT, only those conditions with more than one item were examined. Increases in the total set size
had a significant effect on the proportion of non-target responses, F(1,11) = 9.066, MSE = .003,
p = .012, indicating that as the number of items presented increased, observers made more errors
reporting a non-target colour. The effect of filtering condition was also significant, F(1,11) =
26.103, MSE = .005, p < .001, indicating that PNT was larger when only targets were presented.
The interaction between set size and filtering condition was not significant, F(1,11) = .055, MSE
= .005, p = .82. That is, although PNT was lower overall in the targets + distractors condition, the
rate of non-target responses increased at the same rate as the targets only condition when more
items were added to the display. Planned one-sample t-tests revealed that, while the proportion of
non-target responses was significantly greater than zero when two targets were presented, t(11) =
3.099, SEM = .00209, p = .01, the addition of a single distractor had no effect on PNT, t(11) =
1.483, SEM = .00209, p = .17. Thus, although the presentation of two targets increases the
number of non-target responses, participants are able to successfully ignore one distractor. The
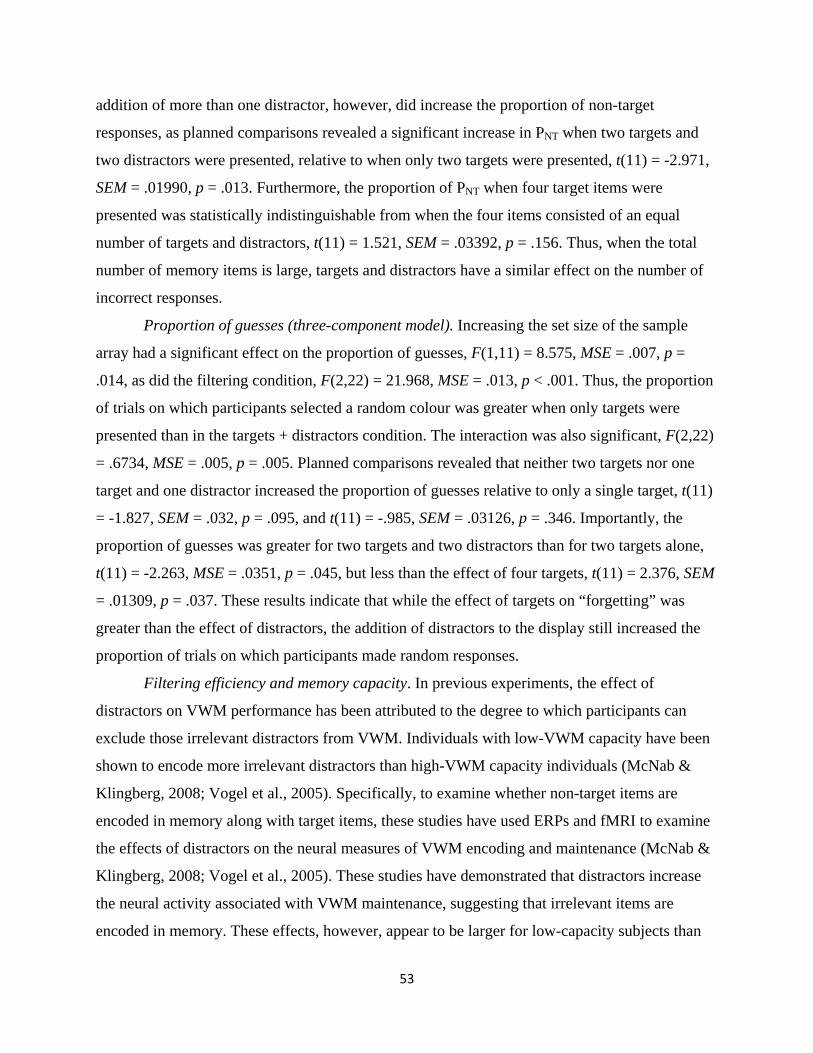
53
addition of more than one distractor, however, did increase the proportion of non-target
responses, as planned comparisons revealed a significant increase in PNT when two targets and
two distractors were presented, relative to when only two targets were presented, t(11) = -2.971,
SEM = .01990, p = .013. Furthermore, the proportion of PNT when four target items were
presented was statistically indistinguishable from when the four items consisted of an equal
number of targets and distractors, t(11) = 1.521, SEM = .03392, p = .156. Thus, when the total
number of memory items is large, targets and distractors have a similar effect on the number of
incorrect responses.
Proportion of guesses (three-component model). Increasing the set size of the sample
array had a significant effect on the proportion of guesses, F(1,11) = 8.575, MSE = .007, p =
.014, as did the filtering condition, F(2,22) = 21.968, MSE = .013, p < .001. Thus, the proportion
of trials on which participants selected a random colour was greater when only targets were
presented than in the targets + distractors condition. The interaction was also significant, F(2,22)
= .6734, MSE = .005, p = .005. Planned comparisons revealed that neither two targets nor one
target and one distractor increased the proportion of guesses relative to only a single target, t(11)
= -1.827, SEM = .032, p = .095, and t(11) = -.985, SEM = .03126, p = .346. Importantly, the
proportion of guesses was greater for two targets and two distractors than for two targets alone,
t(11) = -2.263, MSE = .0351, p = .045, but less than the effect of four targets, t(11) = 2.376, SEM
= .01309, p = .037. These results indicate that while the effect of targets on “forgetting” was
greater than the effect of distractors, the addition of distractors to the display still increased the
proportion of trials on which participants made random responses.
Filtering efficiency and memory capacity. In previous experiments, the effect of
distractors on VWM performance has been attributed to the degree to which participants can
exclude those irrelevant distractors from VWM. Individuals with low-VWM capacity have been
shown to encode more irrelevant distractors than high-VWM capacity individuals (McNab &
Klingberg, 2008; Vogel et al., 2005). Specifically, to examine whether non-target items are
encoded in memory along with target items, these studies have used ERPs and fMRI to examine
the effects of distractors on the neural measures of VWM encoding and maintenance (McNab &
Klingberg, 2008; Vogel et al., 2005). These studies have demonstrated that distractors increase
the neural activity associated with VWM maintenance, suggesting that irrelevant items are
encoded in memory. These effects, however, appear to be larger for low-capacity subjects than

54
for high-capacity subjects, indicating that to some extent, VWM capacity may be related to
individual differences in the selective control of attention (Fukuda & Vogel, 2009). Thus, it is
possible that high-capacity individuals may be less affected by the presence of distractors in the
present task, leading to more precise VWM representations. Accordingly, peak VWM-capacity
obtained from the change-detection task performed at the beginning of the session was correlated
with the difference in performance observed between the condition with only two targets, and the
targets + distractors condition with the same number of targets. This analysis revealed that VWM
capacity was significantly correlated with the decrease in precision that occurred when two
distractors were added to the display, r = .582, p = .047 (Figure 14). Interestingly, this
relationship demonstrated a positive correlation, such that the addition of distractors affected the
precision of all responses more for high-capacity individuals than for that of low-capacity
individuals. This difference was not due to floor effects for low-capacity individuals, as all
participants demonstrated a 15% or greater decrease in precision. The addition of distractors,
however, was not related to the proportion of target responses, r = -.045, p = .889, or to the
proportion of non-target responses, r = .388, p = .213.
The observed relationship between VWM capacity and precision seems to contradict
previous findings that high-capacity subjects encode fewer irrelevant distractors than low-
capacity subjects (McNab & Klingberg, 2008; Vogel et al., 2005). That is, contrary to previous
Figure 14 – Correlation between VWM capacity (K) and the change in precision when the display contains two distractors and two targets, relative to when only two targets are present.

55
findings, the addition of distractors negatively affected the precision of responses more for high-
capacity subjects than for low-capacity subjects. Since PT and PNT were unrelated to capacity,
however, the change in precision likely does not reflect a greater number of non-target items
stored in memory for high-capacity subjects than for low-capacity subjects. Interestingly, in the
two targets + two distractors condition, overall precision tended to be higher for high-capacity
individuals, r = .539, p = .071. Thus, even though the presence of distractors had a greater effect
on precision for high-capacity individuals, they still had more precise responses than low-
capacity subjects. One possible explanation for this discrepancy is that the process of filtering
distractors may take cognitive resources away from encoding target information. In other words,
even though high-capacity subjects start out with more precise representations, it may be
possible that by dedicating more resources to filtering distractors, high-capacity individuals may
suffer a greater reduction in response precision. Future research is needed to explore this
possibility.
Overall, the results of this experiment demonstrated that while distractors can have an
effect on all aspects of VWM performance, this is not the case for a single distractor. That is,
adding a single distractor to the display had no effect on the precision of VWM responses.
Likewise, a single distractor had no effect on the proportion of target or non-target responses, or
on the proportion of random guesses. Thus, a single target was reported with as much accuracy
and precision whether it was presented with or without a distractor. These effects are in stark
contrast to the observation that two targets significantly reduce response precision and PT relative
to a single target, while the proportion of non-target responses and guesses increase. These
findings indicate that observers are able to successfully exclude a single distractor, almost as
though that item were not even present.
In contrast, the addition of two distractors to the display had a significant and consistent
effect on memory responses. That is, the addition of two distractors significantly reduced
precision, as well as the proportion of target responses, relative to when two targets were
presented alone. Importantly, the proportion of non-target responses also increased relative to the
presence of two targets, indicating that participants occasionally reported the colour of a
distractor item when two distractors were presented. The effect of these distractors, however,
was consistently reduced relative to the effects of the same set size of targets only, indicating that
targets and distractors did not have an equivalent effect on performance. Interestingly, the

56
performance observed with two targets and two distractors was consistently similar to the
extrapolated performance for three targets in the targets only condition. This effect is consistent
with the observation that participants are successfully able to exclude one distractor in the targets
+ distractors condition. In other words, these results suggest that, independent of the total set size
or the number of distractors, observers were able to consistently prevent one distractor from
affecting VWM performance; the effect of adding additional distractors, however, is equivalent
to the effect of adding a single target.
Alternatively, it is possible that each distractor is only partially inhibited, resulting in a
mitigated effect of distractors on VWM performance relative to targets. These effects may be
small enough for a single distractor that performance is indistinguishable from performance
without distractors, but may accumulate with the addition of more distractors.
What might be the mechanism underlying the partial inhibition of distractors? One
possibility is that participants are successfully able to bias neural responses to selectively
enhance responses to targets while minimizing responses to distractors. That is, because the
shape of the targets and distractors are known, top-down selective attention could be used to
enhance the responses of the features of those targets, while simultaneously reducing the
responses to the features of the distractor. This type of top-down biasing of attention is one of the
central tenants of the biased-competition model of attention (Desimone & Duncan, 1995;
Kastner & Ungerleider, 2001), and has been shown to be an effective means of reducing the
effects of competition within the visual system (Chelazzi, Duncan, Miller, & Desimone, 1998;
Chelazzi, Miller, Duncan, & Desimone, 1993, 2001).
Although the top-down biasing of attention may eliminate the effects of competition from
a single object, this may be more difficult when more items are added, as the non-target item can
no longer be distinguished by a unique feature. That is, Duncan and Humphreys (1989)
demonstrated that visual search time increases as non-targets become more heterogeneous. That
is, similar non-targets can be grouped together and excluded from the search; however, if the
non-targets are dissimilar to each other, then they will need to be individually matched against
the template of the search target and rejected. Thus, in the present task, when only a single
distractor is presented along with a target, both the colour and shape of the target and distractor
are different from the target, resulting in a relatively efficient selection of target features. In
contrast, when more targets and distractors are added, the dissimilarity between distractors (as a

57
result of having different colours) will prevent these items from being uniformly rejected,
resulting in an increased effect of distractor interference.
As mentioned above, a number of studies have demonstrated that the neural measures of
VWM encoding and maintenance increase in the presence of distractors (McNab & Klingberg,
2008; Vogel et al., 2005). Importantly, one study demonstrated that preparatory activity in
response to the trial instructions preceded the presentation of the memory display. Activity in the
middle frontal gyrus, as well as the basal ganglia, differed depending on whether the instructions
were to remember all of the presented items, or to filter some pre-defined target. Furthermore,
activity in the basal ganglia was strongly predictive of both memory capacity, and filtering
efficiency. Thus, activity in these regions may correspond to the types of bias signals required to
mitigate the effects of competing distractors on VWM performance.
Finally, the finding that distractors affect PT and PG in addition to PNT indicates that not
only do distractors compete for perceptual representation, but they also compete for
representation in capacity-limited VWM. This is consistent with previous findings which
demonstrate that distractors increase the neural activity associated with the maintenance of
information in VWM (McNab & Klingberg, 2008; Vogel et al., 2005). These effects, however,
are in contrast to the effects observed in Chapters 3 and 4, which suggested that increases in
competition affect the precision of VWM responses, as well as the proportion of non-target
errors, but not the proportion of correctly-recalled targets. This suggests a distinction between
two different effects of competition: increasing spatial competition between items (by decreasing
distance) affects the resolution of encoded information, without affecting the amount of
information stored in VWM; in contrast, adding items to the display (targets or distractors)
affects both the resolution of memory representations as well as the proportion of representations
maintained in VWM. Thus, each item in the visual scene obligatorily competes for VWM
resources, consistent with previous proposals (Duncan & Humphreys, 1989; Kastner &
Ungerleider, 2001). In other words, adding items to a display has the potential to affect both the
front-end of VWM (i.e., selection and encoding) as well as the back end of VWM (maintenance
and retrieval); in contrast, the distance between those items can affect the ability to form high-
precision representations (front-end of VWM), while having no effect on the number of items
maintained or recalled (back-end of VWM).

58
Overall, the results of this study provide further evidence that competition for
representation affects the ability to accurately encode, maintain, and report items in VWM. The
next two experiments will examine whether bottom-up or top-down attentional mechanisms can
bias the contents of VWM and reduce the effects of competition.

59
Chapter 6: Bottom‐Up Attentional Capture Biases VWM Responses
The results of the previous experiment demonstrate that top-down selection mechanisms
can play an important role in determining the contents of VWM. That is, individuals could
selectively ignore a single distractor, although this selection mechanism breaks down in the
presence of multiple competing distractors. This is consistent with one of the central tenants of
the biased-competition model. That is, neural responses can be biased to respond to some stimuli
more than others, thereby eliminating some of the mutually suppressive effects of competition.
Specifically, attention serves to bias competition towards highly-salient or task-relevant items.
Consequently, the goal of the experiments in Chapters 6 and 7 is to examine the effects of
different kinds of attentional bias on VWM performance.
The attentional system can largely be divided into two separate mechanisms: bottom-up
attention, which is driven by the salience of the stimuli in the environment, and top-down
attention, which is driven by the goals and objectives of the observer (Posner & Cohen, 1984).
According to competition models of attention, these two methods of attention serve to resolve
competition within the visual system, resulting in enhanced perceptual processing of attended
information (Desimone & Duncan, 1995; Kastner & Ungerleider, 2001). For example, previous
studies have demonstrated that items that appear with abrupt onsets automatically capture
attention and receive prioritized processing (Yantis & Johnson, 1990), indicating that attention is
captured by bottom-up stimulus signals. In contrast, top-down attention can be voluntarily
directed to particular locations in space, or to particular target features, depending on the task
goals (Folk, Remington, & Johnston, 1992). Importantly, bottom-up and top-down attention are
subserved by distinct neural regions within the parietal lobes (Posner, Walker, Friedrich, &
Rafal, 1984; Shulman, d'Avossa, Tansy, & Corbetta, 2002). The goal of the present experiment
is to examine the effects of bottom-up attention on VWM responses. Chapter 7 will examine the
effects of top-down attention.
In addition to enhancing perceptual processes, numerous authors have suggested that
attended information receives priority for entry into capacity-limited VWM resources
(Bundesen, 1990; Duncan & Humphreys, 1989). This question was tested in a study by Schmidt
and colleagues (Schmidt, Vogel, Woodman, & Luck, 2002). In this study, they demonstrated that
change-detection performance was better for items that were presented at a cued location than it
was for items presented at uncued locations. This effect was observed both for spatial cues

60
(cueing the location of a potential target), as well as for abrupt onsets. Thus, this study
demonstrates that both top-down (spatial) and bottom-up (onset) cues capture attention, and that
the attended information gets prioritized entry into VWM. The question remains, however, how
bottom-up prioritization affects the precision and number of VWM representations. It is possible
that attentional prioritization can serve to bias responses, thereby mitigating the effects of
competition (e.g., by decreasing the number of non-target errors). Consequently, the goal of the
present experiment is to examine the effects of abrupt onsets on the number and precision of
VWM representations.
Method
Participants. Twelve University of Toronto undergraduate students (6 male, 11 right-
handed, ages: 18 – 22 years; M = 19.9) participated in this experiment for partial course credit.
Stimuli and Procedure. The procedure was similar to that of Chapters 3 – 5, with the
following exceptions. Each trial began with the presentation of four bright grey squares (RGB =
250, 250, 250) on a light grey background (RGB = 128, 128, 128). The squares were presented at
random locations on an invisible circle around the central black fixation cross (Figure 15). These
gray squares were the same size as the sample memory stimuli, and served as placeholders for
the no-onset memory items. After 1,000 ms, two of the grey squares were removed from the
display. At the same time, four or six coloured sample memory stimuli were presented for 100
ms. Importantly, two of the sample squares were presented at the locations of the two remaining
placeholders (no-onset items). The other two or four sample items were presented at locations
that did not previously contain placeholders (onset items). Thus, these stimuli were presented
with a larger transient than the stimuli presented at the no-onset placeholders. The colours of the
Figure 15 ‐ Schematic of the experiment used in Chapter 6. The locations of the two onset and two no‐onset memory items are highlighted by solid and dotted lines, respectively.

61
sample squares were randomly selected from the available colour-space. Following a 1,000 ms
delay, the probe screen appeared, and subjects were cued to report the colour of one of the
sample items. The probe could appear with equal probability at the location of an onset or no-
onset stimulus. The probe location was randomly selected on each trial.
Participants performed 70 trials in each of the target type (onset vs. no-onset) x set size
(2-onset vs. 4-onset) conditions. Responses were analyzed for precision, PT, PNT, and PG,
according to the method described above. To identify individuals who adopted a strategy of
attending to only onset or no-onset items, the proportion of non-target responses were analyzed
for outliers (indicating incorrect responses). The results of two subjects were excluded for
demonstrating a bias towards reporting non-onset targets in one condition (M = .66); the SD of
PNT for the remaining 10 participants was .10. No outliers were observed in any other condition.
Results and Discussion
Overall precision. Results were analyzed using a 2 (set size) x 2 (target type) repeated-
measures ANOVA. Increasing the number of onset targets had a significant effect on the
precision of responses, F(1,9) = 27.701, MSE = .035, p = .001. That is, precision decreased as the
total set size increased, consistent with previous results. The type of target (onset vs. no onset)
also had a significant effect on precision, F(1,9) = 5.945, MSE = .011, p = .037, indicating that
responses were more precise for onset targets than for no-onset targets. The interaction was also
significant, F(1,9) = 5.512, MSE = .005, p = .043, as paired-comparisons revealed that precision
was higher for onset targets in the 2-onsets condition, t(9) = 3.166, SEM = .04168, p = .011, but
not in the 4-onsets condition, t(9) = .733, SEM = .03729, p = .482. That is, while precision for
two onset targets was greater than that of the non-onset targets, presenting four onset targets
mitigated any benefit of onsets on the precision of responses (Figure 16).
Target precision (three-component model). The SD of target responses was unaffected by
any of the manipulations, Fs <.6, ps > .45, indicating that targets were reported with a similar
amount of error, regardless of whether they appeared with or without onsets. In other words, the
fidelity of items that were encoded and maintained in memory was similar for high-priority
(exogenously selected) and low-priority (unselected) items.
Proportion of target responses (three-component model). Examining the effect of the
number of onset targets on the proportion of target responses revealed a significant effect of set
size, F(1,9) = 12.662, MSE = .029, p = .006, as PT decreased as the number of targets increased.

62
Although a significant effect of target type (onset vs. no-onset) was also observed F(1,9) =
9.597, MSE = .009, p = .013, paired-comparisons revealed that the effect was only marginally
significant for the 4-onsets condition, t(9) = 2.006, SEM = .06374, p = .076, and not significant
for the 2-onsets condition, t(9) = 1.362, SEM = .04281, p = .206. The interaction between set size
and target type was not significant, F F(1,9) = .592, MSE = .020, p = .462, Thus, while
participants were better overall at reporting onset targets, these effects tended to be small.
Proportion of non-target responses (three-component model). An important question is
whether the bottom-up capture of attention by onset targets can bias responses towards those
items, leading to an increase in incorrectly reported onset items. The number of onset targets had
Figure 16 ‐ The precision of responses (top left), and the proportion of target, non‐target, and random responses observed in the experiment in Chapter 6. The x‐axis indicates the number of onset targets. Two additional no‐onset targets were presented in each condition. Error bars indicate within‐subject SEM.

63
a significant effect on PNT, F(1,9) = 16.453, MSE = .008, p = .003, indicating that more errors
were made as set size increased. Importantly, however, the type of target had a significant effect
on the proportion of non-target responses, F(1,9) = 10.522, MSE = .004, p = .01. That is, PNT was
higher when no-onset items were probed than when onset targets were probed. In other words,
when no-onset items were probed, the number of non-target responses increased, reflecting an
increased bias to report those items that appeared with transients, even when they were not
targets. Furthermore, although the interaction between the number of onset targets and target
type was not significant, F(1,9) = 1.963, MSE = .011, p = .18, the proportion of non-target
responses was noticeably larger for no-onset targets when four onset targets were presented, t(9)
= -2.421, SEM = -.2191, p = .039. In contrast, the type of target probe had no effect on the
proportion of non-target responses when only two onset targets were presented, t(9) = -.651,
SEM = -.08695, p = .531. Thus, errors in reporting onset and no-onset items occurred roughly
equally when only two onsets appeared, but responses were biased in favour of the onset items
when the number of onset targets increased to four. This suggests that only a limited number of
representations could be formed, and that when the set size was large, onset items were
prioritized over the no-onset targets. This finding is discussed in more detail below.
Proportion of guesses (three-component model). The proportion of random responses
increased marginally when four onset targets were presented instead of two onset targets, F(1,9)
= 4.967, MSE = .06, p = .053, while the type of target probed had no effect on the proportion of
guesses, F(1,9) = .426, MSE = .007, p = .53. The interaction was not significant, F(1,9) = .043,
MSE = .034, p = .84.
Overall, the results of the present experiment confirm the results of Schmidt and
colleagues (Schmidt et al., 2002), indicating that items that are presented with abrupt onsets are
more likely to be reported, and reported with more accuracy, than those that appear without
abrupt onsets. This finding indicates that the contents of attentional selection are given priority
for entry into VWM. Furthermore, the results of this experiment extend the current knowledge
by showing that PNT was greater for the no-onset targets, indicating that the non-targets that
appeared with onsets were incorrectly reported more often than the non-targets that appeared
without abrupt onsets. This finding is consistent with a biased-competition model of VWM, as it
suggests that attention biases responses in favour of those high-priority objects, leading to an
increase in non-target responses for those objects over those that are given less priority. In other

64
words, items that were presented with onsets captured attention, and as a result were reported far
more frequently than those that appeared without onsets. Moreover, those items that appeared
with onsets were reported more frequently even when they were not targets, indicating that this
kind of attentional bias has significant implications for how items are encoded, maintained, and
recalled from VWM. Specifically, the increase in non-target responses indicates that in addition
to affecting front-end processes by determining whether an item gets into capacity limited
VWM, strong attentional biases also affect back-end processes by increasing response bias
towards those items.
Interestingly, the effect of onsets on the precision and number of responses was largely
dependent on the number of items that appeared with onsets relative to the total number of item
presented. That is, when there were only four items presented (two with onsets), no differences
between onset- and no-onset targets were observed in either the proportion of target responses, or
in the proportion of non-target responses. The precision of responses, however, was higher for
the two-onset targets than for the targets that appeared without onsets. Thus, when the total
number of items was within the capacity of VWM (i.e., around four), the allocation of attention
largely had no effect on whether an item was correctly recalled. Instead, items that were attended
were encoded with better precision, suggesting that the effect of attention was to increase the
fidelity of the perceptual and mnemonic representations in favour of the selected objects. In other
words, when the total number of items was small, attentional selection seems to have improved
the resolution of the selected objects, without affecting the number of items encoded or
maintained in VWM.
In contrast, when four targets were presented with onsets, in addition to two no-onset
items, significant differences in the proportion of target and non-target responses were observed.
That is, by biasing attention towards the four onset targets, all onset items were recalled correctly
more often than those that appeared without onsets. Furthermore, the onset non-targets were also
incorrectly reported more often, suggesting a strong response bias to report these items over
those that did not capture attention. These effects, however, were independent of the precision of
responses. Thus, when the number of onset targets was large, the contents of VWM were biased
in favour of those items, at the expense of the lower-priority no-onset targets.
Together, these results suggest that the effect of attentional selection on VWM
representations depends on the number of items in a visual scene. When the total number of

65
items is within the capacity of VWM, both low- and high-priority stimuli are encoded in VWM.
Those items that are the focus of attention do gain some processing advantage, however, as they
are encoded with greater precision than those that are given less priority. In contrast, when the
number of items exceeds the capacity of VWM, low-priority objects are often excluded from
VWM entirely. Only those items that are the focus of attention will be encoded and maintained
in VWM, and with similar precision. Thus, these findings support the proposals made by many
authors that items that are selected by attention win out in the competition for limited processing
resources, enabling those items to be encoded into VWM for further processing (Bundesen,
1990; Duncan & Humphreys, 1989; Kastner & Ungerleider, 2001). This experiment adds to this
literature by demonstrating that the focus of attention also has an effect on the precision of sub-
capacity VWM representations.
In the next chapter, I will examine the effects of top-down attentional cues on the number
and precision of VWM representations.

66
Chapter 7: Colour and Location Cues Bias VWM Responses
Independently
The results of the experiment in Chapter 6 demonstrate that when the number of items is
small, the precision of VWM representations is biased by the automatic capture of bottom-up
attention. The aim of the present experiment is to examine the effect of top-down spatial and
colour cues on biasing the number and precision of VWM representations.
As mentioned above, previous studies have demonstrated that spatial cues can bias the
contents of VWM (Schmidt et al., 2002). That is, cueing observers to the location of a potential
target improves performance at the cued location, while reducing accuracy at the uncued
locations. Furthermore, Zhang and Luck (2008) demonstrated that the probability of reporting a
spatially-cued target was improved relative to the uncued locations. Because the experiment by
Zhang and Luck only examined responses using a two-factor model, it is unclear what effect
these cues have on the proportion of non-target responses. That is, the results of the experiment
presented in Chapter 6 indicate that attentional priority can increase the likelihood of reporting
the selected item, even when that item is not the target. Thus, one of the goals of the present
experiment is to examine the effects of spatial cues on the proportion of non-target responses.
In addition, a central tenet of the biased-competition model of attention is the idea that
responses can be biased in favour of the features of desired objects, in addition to locations
(Chelazzi et al., 1998; Chelazzi et al., 1993, 2001). That is, when performing a search for a
target, holding a template of the target in memory biases neural responses in favour of objects
that match the desired target. Thus, an important question is whether the contents of VWM can
be similarly biased by feature-based attentional effects. Previous studies have suggested that cues
can facilitate the uploading of target information into VWM, but only when both the location and
the colour of the cue match the target information (Adamo, 2010; Al-Aidroos, 2010). Thus, the
second aim of the present experiment is to examine the effect of cueing a target-matching or non-
matching colour on the VWM accuracy, and compare and contrast those effects with those
observed by spatial cues. That is, if top-down biases are critical for VWM encoding and
maintenance, then cuing a participant to the location or feature of an upcoming item may help
facilitate these top-down biases. In other words, knowing the colour or location of an upcoming
target should facilitate encoding processes for those items, resulting in more robust and precise
representations for the cued items. In contrast, cueing the incorrect location or colour should
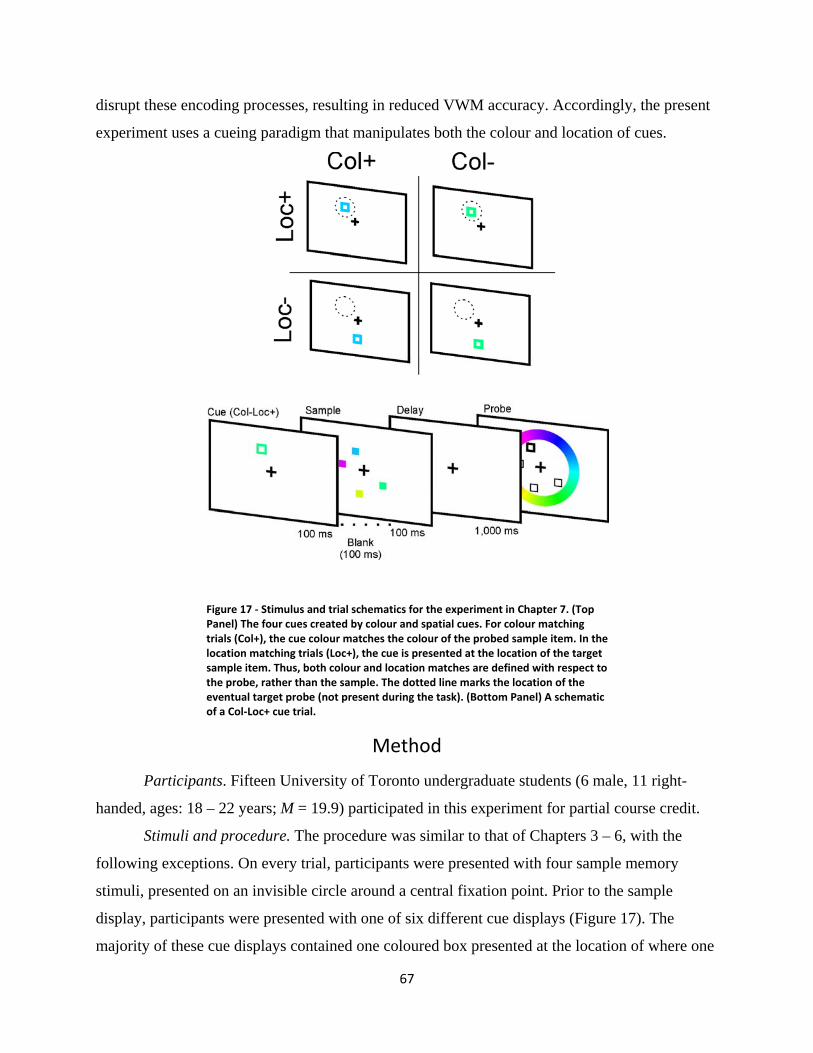
67
disrupt these encoding processes, resulting in reduced VWM accuracy. Accordingly, the present
experiment uses a cueing paradigm that manipulates both the colour and location of cues.
Method
Participants. Fifteen University of Toronto undergraduate students (6 male, 11 right-
handed, ages: 18 – 22 years; M = 19.9) participated in this experiment for partial course credit.
Stimuli and procedure. The procedure was similar to that of Chapters 3 – 6, with the
following exceptions. On every trial, participants were presented with four sample memory
stimuli, presented on an invisible circle around a central fixation point. Prior to the sample
display, participants were presented with one of six different cue displays (Figure 17). The
majority of these cue displays contained one coloured box presented at the location of where one
Figure 17 ‐ Stimulus and trial schematics for the experiment in Chapter 7. (Top Panel) The four cues created by colour and spatial cues. For colour matching trials (Col+), the cue colour matches the colour of the probed sample item. In the location matching trials (Loc+), the cue is presented at the location of the target sample item. Thus, both colour and location matches are defined with respect to the probe, rather than the sample. The dotted line marks the location of the eventual target probe (not present during the task). (Bottom Panel) A schematic of a Col‐Loc+ cue trial.

68
of the sample stimuli would appear. The colour and location of the cue was manipulated in
relationship with the colour and location of the probed target: The colour of the cue could either
match the colour of the probed target (col+) or one of the un-probed sample items (col-). The
location of the cue was presented either at the location of the probed target (loc+) or at the
locations of one of the other un-probed sample items (loc-). Thus, four different conditions were
created by crossing the features of colour and location. In addition, neutral trials were also
presented, in which all four of the target locations were cued with colours that matched each of
the sample items at the same locations. Finally, to offset the predictability of the col+ loc+
conjunction, an additional control condition was also presented using a cue that matched the
colour of the cued location, with the probe appearing at a non-matching location (control-). Thus,
this condition was similar to the col-loc- trials, with the exception that the cue matched the
colour of the cued non-target. Cues lasted 100 ms and were 1.8˚ x 1.8˚ with a line width of 0.15˚.
The sample was presented for 100 ms immediately following the cue, and the delay lasted for
1,000 ms. Sample locations and colours were selected randomly, as was the location of the
probe.
The number of trials in each condition was: 60 trials of col+ loc+; 70 trials each of col+
loc- and col- loc+; and 80 trials of each of the other conditions. Thus, neither the cues (colour or
location) nor the conjunctions were predictive of the target probe. Participants were instructed
that the cue was not predictive of the target location or colour, and were instructed to ignore the
initial cue display. Responses were analyzed for measures of precision, PT, PNT, and PG. Mean
values for each of these measures were analyzed for outliers (> 3 SDs). None of the participants
exceeded these criteria, so all subjects were included in analysis.
Results and Discussion
To determine the effect of cues on the precision and number of VWM representations,
responses were analyzed using a 2 (colour validity) x 2 (location validity) repeated-measures
ANOVA. In addition, measures of performance in each of these conditions were compared with
neutral cues, to determine whether the cue manipulations significantly improved or impaired
performance. Performance in the control condition was similar to that of the col-loc- condition,
and is not discussed.
Overall precision. The validity of the colour cue had a significant effect on response
precision, F(1,13) = 5.159, MSE = .048, p = .041, as precision was consistently higher when the

69
cue matched the colour of the probed target than when the colour did not match the probed item
(Figure 18). In addition, the location of the cue had a significant effect on precision, F(1,13) =
11.66, MSE = .067, p = .005, as precision was better when cue was presented at the target
location than at a non-target location. These effects were largely additive, as the interaction did
not reach significance, F(1,13) = 4.063, MSE = .019, p = .065. Thus, precision was highest when
a colour-matching cue was presented at the target location, and lowest when neither dimension
matched the probed item. Planned comparisons confirmed this effect: thus, the col+ loc+ cue
significantly improved precision over neutral cues, t(13) = 3.349, SEM = .09258, p = .005, and
the col- loc- cue marginally impaired performance, t(13) = -1.877, SEM = .0315, p = .083,
although this effect was not significant. The presence of only a single matching feature, however,
had no effect on precision relative to neutral cues, ts < 1.49, ps > .16. Therefore, although both
the colour and location of the cue affected the precision of VWM responses, the presence of only
one matching feature was not sufficient to affect performance.
Figure 18 ‐ The precision of responses (top left), and the proportion of target, non‐target, and random responses as a function of cue validity and cue type. Error bars indicate within‐subject SEM. The solid horizontal line indicates neutral cue performance, with the dotted lines indicating +/‐ within‐subject SEM.

70
Target precision (three-component model). Neither the colour of the cue, F(1,13) = .913,
MSE = .01, p = .357, nor the cue location, F(1,13) = .38, MSE = .005, p = .584, significantly
affected the amount of error (SD) in target responses. A significant interaction was observed,
however, F(1,13) = 5.56, MSE = .004, p = .035. That is, the col+ cues reduced error in target
responses when presented at the target location (loc+), but increased error when presented at a
non-target location (loc-). None of the effects of cueing colour or location were significantly
different from neutral cues, ts < 1.4, ps > .21, however, indicating that the effects of cues on
target error were small.
Proportion of target responses (three-component model). Examining the effect of cuing
condition on the proportion of target responses revealed a moderately-significant effect of cue
colour, F(1,13) = 4.126, MSE = .017, p = .063. Moreover, the location of the cue had a
significant effect on PT, F(1,13) = 15.239, MSE = .016, p = .002. That is, the proportion of target
responses was larger when the cue was presented at the location of the probed item, than at a
non-target location. The interaction between colour and location cues was not significant,
F(1,13) = .458, MSE = .008, p = .51. Comparing the effects of the cues with neutral cues
revealed that the col+ loc+ cue had a significant effect on performance relative to a neutral cue,
t(13) = 3.364, SEM = .04724, p = .005, while performance in the other conditions was not
significantly different from the neutral condition, ts < 1.6, ps > .13. Thus, the effects of colour
and locations cues did not significantly improve the probability that a memory item was recalled
unless the cue matched both the location and colour of the probed target.
Proportion of non-target responses (three-component model). The type of colour cue did
not have a significant effect on PNT, as non-target responses were lower when the cue matched
the colour of the probed target, F(1,13) = 6.56, MSE = .009, p = .0924. Moreover, the location of
the cue did not have a significant effect on PNT, F(1,13) = 1.797, MSE = .011, p = .203.
Furthermore, the interaction between colour and location cues was not significant, F = .428, MSE
= .007, p = .524. Although none of the main effects were significant, planned paired comparisons
revealed that the proportion of non-target responses was reduced in both col+ conditions relative
to neutral cues, ts < -2.8, ps < .02, and not significantly different from the neutral cues in the col-
conditions, ts < 1, ps > .35. Thus, when the colour of the cue matched the colour of the probed
items, the number of non-target responses was reduced relative to neutral cues. Interestingly,

71
these effects are distinct from the effects of the cues on target responses. The different effects of
the cues on target and non-target responses are discussed in more detail below.
Proportion of guesses (three-component model). Examining the proportion of random
responses revealed that the colour of the cue had no effect on PG, F(1,13) = .015, MSE = .031, p
= .905. The location of the cue did, however, have a significant effect on the proportion of
guesses, F(1,13) = 7.910, MSE = .016, p = .015, as significantly more guesses were made in the
col- conditions. No interaction was observed, F(1,13) = .9, MSE = .015, p = .36. Paired-
comparisons revealed, however, that none of the cueing conditions significantly increased or
reduced the proportion of guesses relative to the neutral cues, ts < 1.49, ps > .163.
Overall, the results of this experiment demonstrate that the colour and location of cues
have significant effects on the number and precision of memory items reported, without any
strong indication that these cues interact. Cues that matched the location of the probed item
significantly improved the probability that the target was reported correctly, relative to an
invalidly-cued location, but had little effect on the proportion of non-target responses. That is,
targets were reported more accurately when participants were cued to the target location, but the
number of errors did not increase when cued to an invalid location. In contrast, the colour of the
cue did not have an effect on the proportion of target responses, but a valid colour cue
significantly reduced the number of non-target responses relative to a neutral cue. In other words,
cueing participants to the colour of the target reduced the likelihood that a non-target colour was
reported. This reduction in non-target responses occurred even though target performance did not
always improve when the cue matched the colour of the target (i.e., in the col+ loc- condition).
Although the effects of colour and location cues were somewhat independent, the conjunction of
colour-matching and location-matching cues benefited performance the most, indicating that the
benefits (as well as the impairments) associated with these different cues are additive.
Overall, the greatest benefits of performance tended to occur in the col+ loc+ condition,
when the cue matched both the color and location of the target. This suggests that the effects of
the two types of cues can combine to facilitate VWM encoding and maintenance. Although it
could be argued that the addition of a col+ loc+ cue extends the encoding time for target
information, the effect of these cues exceeds that of the neutral cues which also match both the
colour and location of the targets. While the neutral cues also match the targets on both features,
however, they do so for all four sample items, rather than biasing encoding towards a single

72
item. Thus, the effect of cueing on VWM performance appears to be restricted to conditions in
which the cue helps facilitate top-down processing of target information (i.e., when only a single
cue is present).
The different effects observed for colour and location cues suggests that these features
potentially operate on different aspects of the visual system, which may in turn affect different
aspects of VWM performance. A number of authors have suggested that accurate VWM
performance depends on the activation of two distinct systems. In particular, Xu and Chun
(2009) have argued that one system selects and individuates a limited number of visual objects
from the scene, while a second system enhances and encodes the features of those selected
objects. These processes likely depend on different neural substrates, with object individuation
depending on the inferior IPS, while feature enhancement and encoding depends on the superior
IPS and LOC. Thus, one possibility is that location and colour cues operate on these distinct
systems necessary for VWM. That is, location cues may serve to bias the selection and
individuation of a particular object. Consequently, by cueing attention to a particular location,
cued objects may be more likely to be encoded and subsequently recalled, leading to an increase
in PT. Non-target responses may not be affected by these location cues, however, as invalidly-
cued objects may similarly benefit from the effects of selection, enabling these objects to be
easily rejected when other locations are probed. In contrast, colour cues may serve to facilitate
the second system, by biasing the encoding and enhancement of those colour features. If colour
cues don’t facilitate the selection and individuation of any of the sample items, colour cues alone
may not affect the likelihood that a particular target is recalled; instead, these cues may help to
bind the cued features to selected objects more accurately, resulting in a reduction in the number
of colours reported incorrectly at the probed location.
Independent of the effects of colour and location cues on the two systems proposed by
Xu and Chun (2009), it is clear that these cues serve to improve aspects of VWM performance.
Thus, cueing the location or colour of a sample item likely serves to bias neural responses in
favour of that cued item, while minimizing the interference of competing representations. That
is, just as spatial cues or search templates can bias neural responses in favour of a target in a
perceptual task (e.g., visual search), top-down attentional selection may similarly bias the
selection and encoding of those targets into VWM. In other words, mechanisms that mitigate
neural competition for representation in the perceptual system similarly increase VWM accuracy

73
and reduce memory errors for those items. Those items that are selected as targets (either by
spatial or featural selection) are given enhanced perceptual processing, resulting in more stable
and higher-fidelity VWM representations. Thus, biasing responses in favour of a particular item
may play a critical role in determining whether that item is successfully encoded, maintained and
recalled from VWM.
Overall, the results of the experiments in Chapters 6 and 7 demonstrate that both bottom-
up and top-down biasing of attention plays in important role in prioritizing mnemonic as well as
perceptual processing. Interestingly, Yantis and Johnson (1990) demonstrated that the number of
items that could be prioritized by abrupt onsets was limited to roughly four items. This limit
corresponds closely to the roughly four-item capacity limit of VWM (Cowan, 2001; Luck &
Vogel, 1997). Furthermore, the neural substrates that mediate VWM largely overlap with those
that mediate attentional selection (Corbetta, Kincade, Ollinger, McAvoy, & Shulman, 2000;
Corbetta & Shulman, 2002; Mitchell & Cusack, 2008; Shulman et al., 2002; Todd & Marois,
2004). Consequently, given that the selection of information appears to play such an important
role in determining the contents of VWM, this raises the possibility that the capacity limit of
VWM is related to the ability to select and prioritize information, enabling the efficient encoding
of information into VWM. This question will be examined in more detail in Chapters 8 and 9.

74
Chapter 8: VWM Capacity is Correlated with Response Precision
The results of the previous two chapters demonstrate that objects compete for capacity-
limited storage, with priority given to items that are the focus of attention. Attentional biases,
therefore, may act as a gateway for encoding and updating of information in VWM. While the
previous experiments have examined VWM performance at the group level, the aim of the
experiments in Chapters 8 and 9 is to examine VWM performance at the individual level. That
is, these experiments will attempt to address how resolving competition through bias signals may
contribute to individual differences in VWM performance2.
Although theories abound as to why the number of representations that can be stored in
VWM is limited (Cowan, 2001), it remains unknown precisely why VWM performance (or
capacity) is limited, or why it differs dramatically between individuals. A number of experiments
have provided evidence that VWM capacity may be related to attentional mechanisms; namely,
the ability to select and encode target information, while excluding irrelevant distractors, has
been shown to be strongly correlated with VWM capacity (Vogel et al., 2005). Furthermore, the
origin of this ability may reside in activation in the frontal cortex and the basal ganglia (McNab
& Klingberg, 2008); that is, these regions may send top-down signals to posterior parietal cortex
to exert attentional control over which environmental stimuli should have access to VWM
resources. Moreover, it has been demonstrated that high-capacity subjects are better able to resist
the capture of selective attention, suggesting that VWM capacity is related to the ability to
control attention (Fukuda et al., 2010).
Although the capture of attention by irrelevant information can explain why low-capacity
subjects encode more irrelevant items in VWM than high-capacity subjects, this mechanism does
not explain why high-capacity subjects are better able to encode relevant information, even in
the absence of distractors. In other words, the ability of high-capacity subjects to store more
items in VWM cannot be explained only by a gateway mechanism in which irrelevant
information is excluded; instead, a mechanism explaining differences in VWM ability must also
be able to explain differences in the ability to select and encode relevant information.
2 Independent of storage limitations, there are dramatic differences in VWM performance between individuals that must be explained by either resource or slot‐based theories. Although the previous experiments do not address the issue of resource vs. slot‐based models directly, they are largely supportive of a system in which the number of high‐precision representations that can be maintained is limited (i.e., a slot model). Accordingly, for the purposes of this chapter, VWM is assumed to have a limited capacity. The issue of how the results of this thesis relate to resource or slot‐based models will be discussed in detail in the General Discussion.

75
As mentioned above, Xu and Chun (2009) have described a two-stage mechanism of
VWM and perception: in the first stage, a limited number of objects are selected and
individuated; in the second stage, the features of those selected objects must be enhanced and
encoded in VWM in order for a high-precision representation to be formed. The former process
appears to be served primarily by the inferior IPS, while the latter process is mediated by the
superior IPS, as well as the LOC. Thus, one possibility is that individual differences in VWM
ability may reflect differences related to these two processes. In other words, these stages may
determine the ability to select and encode relevant information into VWM, and may therefore
mediate individual differences in VWM abilities.
In the first stage proposed by Xu and Chun (2009), a limited number of objects is
selected from the visual scene for further visual processing. Thus, individuals who are able to
select more items may have a higher VWM capacity than those who are able to select fewer
items. This process may in fact be similar to the control mechanism required for selecting
relevant information while ignoring distractors (Fukuda & Vogel, 2009). Because this selection
operates independently of feature processing, this stage is likely to have little effect on the
fidelity of mnemonic representations. In other words, if VWM capacity is related to the ability to
select a large number of items, then high-capacity individuals will be able to store a greater
number of items in VWM, but these representations may not necessarily have greater precision
than those maintained by low-capacity individuals.
In the second stage described by Xu and Chun (2009), the features of selected objects
must be enhanced and encoded in order for them to gain access to higher cognitive processes
such as object recognition and VWM. This process of enhancing features may represent a type of
top-down bias signal, resolving the suppressive-interactions between competing representations.
By enhancing the features of selected objects, these objects become high-fidelity VWM
representations, whereas objects which are poorly enhanced may be poorly remembered or
forgotten entirely. Thus, if VWM capacity depends on this second stage, high-capacity subjects
may be better able to enhance the features of selected targets, resulting in more precise
representations. Furthermore, this ability to enhance target features should be independent of
storage limitations in VWM; thus, high-capacity individuals should have more precise mnemonic
representations even when the number of items is below the capacity of VWM. For example, in
Chapter 5 it was demonstrated that high-capacity individuals had more precise representations

76
than low-capacity individuals. It is unclear, however, whether this effect is related to the filtering
requirements when distractors are presented along with targets.
Accordingly, the goal of the present experiment is to examine whether the precision of
VWM representations is predictive of individual differences in VWM performance. If
differences in VWM-capacity are limited only by the ability to select and individuate objects,
then only the number of targets correctly reported, and not the precision of those representations,
should be related to VWM capacity. If, however, VWM capacity is related to the ability to
enhance relevant features of selected objects, than the precision of VWM representations (even
those below capacity) should be predictive of individual differences in VWM capacity.
Method
To examine the relationship between VWM-capacity and precision, further analysis was
performed on data from Chapter 3 (Experiment A). In addition, 24 subjects (4 male, 22 right-
handed, ages: 19 – 23 M = 20) who participated in the experiments in Chapters 4 and 5
performed an additional task (Experiment B). The procedure was similar to that of Chapters 3
and 4, with the following exceptions: Participants were presented with one coloured square for
50, 150, 300, or 500 ms. The colour and location of the sample items were selected randomly.
After the 1,000 ms delay, participants reported the colour of the sample item as accurately as
possible by clicking the location on the colour wheel. As in the experiment in Chapter 3,
participants could adjust responses and ended the trial by pressing the space bar. 60 trials of each
ISI length were presented in a random order.
To identify the relationship between VWM capacity and memory performance, precision
and target accuracy (PT) in each of the set size conditions (Experiment A) and ISIs (Experiment
B) were correlated with the maximum K-estimates obtained from the change-detection task
(loads 2, 4 and 6) performed at the beginning of the session.
Results and Discussion
In order to examine whether VWM-capacity is related to the ability to enhance features
and form high-fidelity representations, the precision of responses from set sizes 1 – 3 (collapsed
across competition conditions) were correlated with VWM capacity (K). Of critical interest is
whether VWM capacity correlates with the precision of remembering one or two objects. That is,
if capacity is related to the ability to enhance and encode features, then this relationship should

77
exist independent of differences in the control of selective attention, as well as differences in
storage ability. In other words, if VWM performance is related to the ability to enhance target
features, high-capacity individuals should be able to form more precise representations even
when the number of items maintained is small (i.e., within the capacity of both low- and high-
capacity subjects). Supporting this hypothesis, VWM capacity was significantly correlated with
the precision of responses at set size one, r(16) = .50, p = .046 (Figure 19), and marginally
significant at set size two, r = .469, p = .067. The correlation between VWM capacity and
precision was not-significant at set size three, r = .341, p = .197. In other words, high-capacity
subjects have more precise representations for a small number of items relative to low-capacity
subjects; however, when multiple objects are presented, response precision is unrelated to VWM
capacity. Importantly, the probability of reporting the target (PT) was uncorrelated with memory
capacity at set size one, r = .20, p = .49. Thus, even though high- and low-capacity subjects are
similarly accurate at reporting the identity of one target, high-capacity subjects do so with much
greater precision.
These results support the hypothesis that individual differences in VWM capacity are
related to the ability to enhance and encode target features. Importantly, this effect is strongest
when only a single item is presented. That is, high-capacity subjects are better able to create
high-fidelity representations of below-capacity representations, indicating that this effect is
unrelated to storage limitations. Furthermore, because this relationship exists for only a single
object, it also argues against an attentional selection or gating mechanism. Consequently, the
Figure 19 – Correlation between VWM capacity and overall response precision for a single object.

78
relationship between VWM capacity and precision suggests that VWM may depend on processes
that mediate the formation of high-resolution representations, namely the enhancement and
encoding of target features.
Although the relationship between VWM capacity and precision of responses for a single
object suggests that these effects are independent of storage limits, it is possible that the
relationship reflects differences in the ability to maintain precise representations over extended
periods of time. That is, it is possible that low-capacity subjects start off with high-precision
representations that degrade by the end of the 1,000 ms delay. Accordingly, to examine this
relationship independent of maintenance demands, 24 subjects performed an additional task to
examine precision for a single object at ISIs that were within (50 – 300 ms) the range of iconic
memory, as well as for longer durations that depend on VWM (500 ms). Although capacity was
not significantly correlated with precision at 150, 300, or 500 ms, rs < .27, ps > .21, capacity was
significantly correlated at the 50 ms ISI, r = .46, p = .022. Thus, the precision of representations
formed within the first 50 ms of perception are a significant predictor of VWM capacity.
Overall, these results support the hypothesis that the enhancement and encoding of object
features (via top-down feedback) may mediate individual differences in VWM performance.
That is, at both 50 ms and 1,000 ms delays, VWM capacity was significantly correlated with the
precision of responses for a single object. That these effects were observed for only one object
and as early as 50 ms suggest that this relationship cannot be attributed to differences in VWM
storage limitations. That is, although all subjects could correctly recall a single object for 50 or
1,000 ms, high-capacity individuals could report targets with much greater precision than low-
capacity individuals. These results suggest that processes that affect the formation of
representations as early as 50 ms are directly related to VWM capacity.
Although the relationship between VWM capacity and precision was not significant
across all ISIs, a repeated measures ANOVA revealed there was a significant effect of ISI on
precision, F(3,69) = 7.708, MSE = .341, p < .001, as precision increased linearly as a function of
ISI, F(1,23) = 16.852, MSE = .394, p < .001. Importantly, these effects were observed without
ISI significantly affecting the probability of reporting the target (PT), F(3,69) = 2.118, MSE =
.001, p = .106. That is, the precision of responses significantly increased at longer ISIs, without
any changes in PT. This finding is consistent with evidence that it takes time for representations
to consolidate or “vulcanize” in VWM (Vogel et al., 2006), although the effect of consolidation

79
on precision observed here occurs over a longer period of time than that observed on change-
detection performance in previous studies. Consequently, the process of consolidation may
suggest an explanation for why no relationship between capacity and precision was observed at
intermediate ISIs. Precision may be established very early on by early perceptual processes; this
may be followed by a second stage that occurs gradually over time, in which the precision of
representations are enhanced and vulcanized via top-down feedback. In other words, high-
capacity subjects may be able to first select and individuate objects (within the 150 ms sample)
better than low-capacity subjects, consistent with an attentional control mechanism; second,
high-capacity subjects may be better able to enhance features of selected targets. The result is a
greater number of high-precision representations stored in VWM.
Overall, the results of the present experiment suggest that enhancing the features of
targets may play as important a role in determining VWM capacity as the initial selection of
target items (Fukuda & Vogel, 2009). Although object selection and feature enhancement may
appear at first blush to be different processes, in reality, they may represent different aspects of
top-down control (i.e., bias signals). Without cognitive intervention, competing representations
interact in a mutually suppressive way. Some objects may receive attentional priority via the
bottom-up capture of attention, but these objects may be task-irrelevant. Thus, without top-down
control of the visual system, the contents of perception, VWM, and ultimately consciousness,
would be driven primarily by the physical strength of the incoming visual stimuli. By applying
top-down bias signals, however, the observer derives more control over what information gains
access to higher-processing. In other words, by biasing responses in favour of a particular
location, or by matching incoming stimuli against target templates, these top-down bias signals
operate as gating mechanisms controlling what information gains access to further processing.
The stronger and more accurate these top-down bias signals, the better the control over access to
higher cognition further downstream.
In the next section, I will examine potential ERP markers of top-down bias and their
relationship to VWM capacity.

80
Chapter 9: Ptc Predicts VWM Capacity
The results of the previous experiments suggest that top-down attentional biases play an
important role in determining the contents of VWM. Furthermore, VWM capacity seems to be
driven by individual differences in the ability to select and enhance target features among
competing items. Consequently, the goal of the present chapter is to find neural markers of
individual differences in VWM performance that are predictive of resolving competition.
Potential neural correlates associated with resolving competition have been identified in a
series of recent studies by Hilimire and colleagues (Hilimire, Mounts, Parks, & Corballis, 2009,
2010). In one experiment (Hilimire et al., 2009), participants were told to search for a target
letter (“T”) that could appear in either green or orange. This target was flanked by a distractor
(“L”) that could be one, three, or five locations away from the target. Thus, competition was
greatest at the smallest target-distractor separation. The authors reported effects related to this
competition manipulation in two ERPs: they found that the amplitude of the N2pc increased as
target-distractor separation increased; in addition, they also reported a novel ERP that
demonstrated decreasing amplitude with increasing target-distractor separation. This latter
component, which occurred around 300 ms, was named the Ptc for positive temporal
contralateral.
While the N2pc is thought to reflect processes related to selecting targets from distractors
(Eimer, 1996; Luck & Hillyard, 1994a, 1994b; Woodman, Arita, & Luck, 2009; Hopf et al.,
2000; Hopf, Boelmans, Schoenfeld, Luck, & Heinze, 2004), the change in amplitude in both the
N2pc and Ptc as a function of the distance between objects suggests that both components reflect
the amount of competition between multiple visual items. Importantly, in a control experiment,
the amplitude of the Ptc was drastically reduced when participants were only required to indicate
on which side of the display the target appeared. This finding, in combination with the lateral-
temporal topography of the Ptc, led the authors to suggest that the Ptc reflects the bias signal
required to resolve competition between targets and distractors. Thus, it is possible that this
activity reflects the processes associated with LOC activity that enables target features to be
enhanced and encoded for further cognitive processing (Xu, 2007; Xu & Chun, 2006).
Specifically, because the onset of the Ptc occurs prior to the onset of the ERP associated with
VWM maintenance (the CDA), the Ptc likely reflects processes upstream of VWM maintenance

81
(e.g., feature selection or encoding). Furthermore, given that the N2pc is related to spatial
selection, it is possible that this activity reflects the individuation and selection of targets that
will subsequently be enhanced and encoded in memory. In other words, the N2pc and Ptc may
reflect, respectively, the two stages necessary for items to be successfully encoded into VWM
(Xu & Chun, 2009).
The goal of the present experiment is to examine whether the Ptc is evident during a
VWM task, and whether either the Ptc or N2pc are related to individual differences in VWM
capacity. If either the Ptc or the N2pc are related to the selection and encoding of target
information into VWM, then this activity should be related to VWM performance even when the
memory task contains only targets. In other words, if N2pc and Ptc are evident only in the
presence of distractors, this would suggest these components reflect the filtering of irrelevant
information, rather than the active selection and encoding of target information. Consequently,
the current task will use a variant of a VWM task in which both targets and distractors are
presented, and compare this activity to a condition in which only targets are present.
Furthermore, if VWM performance depends on the biased selection and encoding of target
information, then this activity should be greater when the selection and encoding of target items
is more difficult (i.e., under high spatial competition). Thus, in the current experiment, the
distance between items (targets and distractors) will be manipulated to examine the effect of
competition on these ERPs.
Method
Participants. Twenty-two adults, including the author, from the University of Toronto
community participated in this experiment. Four participants were excluded from analyses (see
below), resulting in a total of 18 participants (7 male, 16 right-handed, ages: 19 – 29 years; M =
22.2). Participants received partial course credit and/or were provided $15/hour for participating.
All participants were right-handed and had normal or corrected-to-normal vision. The procedures
were approved by the University of Toronto Research Ethics Board.
Stimuli and Procedure. The task was displayed on a 20-inch CRT monitor using a
resolution of 1600 x 1200 and a 60-Hz refresh rate. Stimuli were presented on a grey background
(RGB = 128, 128, 128). Participants were seated roughly 57-cm from the display, and instructed
to maintain central fixation during all trials.

82
The experiment consistent of two conditions performed in alternating blocks. Each trial
began with the presentation of a central fixation cross and arrow cue, presented for 200 ms. The
arrow cue indicated the side of the screen that the participant was to attend, but without moving
their eyes away from the fixation. After a 600 – 800 ms ISI, selected randomly, four coloured
stimuli (two circles; two squares) were presented on the cued side of the display for 100 ms. In
the filter condition, participants were instructed to remember only the colours of the target
stimuli (circles or squares) while ignoring the two non-target stimuli. In the remember-all
condition, participants were instructed to remember the colours of all four stimuli (Figure 20).
Participants were randomly assigned either circle or square targets, and all results are described
collapsed across target type. The colours of the four shapes were randomly assigned, with no
single colour being repeated on the target side. Four stimuli were also presented on the
unattended side, and the colours, shapes, and locations of these stimuli were randomly selected.
Circle and square stimuli subtended 1˚ x 1˚. The nine colours used for the sample stimuli were:
black (RGB = 31; 26; 23); blue (0; 124; 195); green (0; 146; 163); purple (144; 30; 120); red
(218; 37; 29); white (255; 255; 255); and yellow (255; 245; 0);
Sample stimuli were presented at one of nine locations on an invisible semi-circle on
each half of the display. Each semi-circle had a radius of 6˚ and was centred around the fixation.
To investigate the effect of spatial competition on the Ptc and filtering performance, the distance
between the stimuli on the cued side was manipulated. Thus, targets and distractors (e.g., circles
and squares) were presented in pairs. In the high-competition condition, circles and squares were
presented in adjacent locations, while the pairs of stimuli were separated by four to six locations.
In the low-competition condition, circles and squares were separated by three locations, and these
pairs were separated by one or two locations. Thus, in the high-competition condition, each
circle-square pairing was separated by 2.08˚ (centre-to-centre) while the pairs of stimuli were
separated by at least 7.71 – 10.39˚; in the low-competition condition, each circle-square pairing
was separated by 6˚ (centre-to-centre), while the pairs of stimuli were separated by a minimum
of 2.08 – 4.16˚. Importantly, in the low-competition configuration, the two closest stimuli were
both either circles or squares. Thus, although stimuli could appear next to each other in the low-
competition condition, these two items were always both either targets or distractors in the
filtering condition. The configurations of sample stimuli were assigned randomly on each trial.

83
The memory sample was followed by a 917 ms delay, after which a probe display was
presented for 1,000 ms. The probe contained one stimulus presented at the location of one of the
target stimuli on the cued side. On half of the trials, the probe stimulus matched the colour of the
object presented at the probed location during the sample display (match trials), while on the
other 50% of trials, the probe stimulus was presented in a colour that was not present in the
original sample display. The shape of the probe stimulus never changed from the sample array.
In the filter condition, the probed item was always one of the target shapes (circles or squares).
In the remember-all trials, the probed item was selected randomly from any of the four stimuli.
After each trial, participants were given the opportunity to blink, and the next trial was initiated
with a space bar response. Participants performed 96 trials of each condition, on each side, for a
total of 768 trials. Each participant practiced 10 – 30 trials before starting the experiment, with
feedback. No feedback was given during the experiment.
Figure 20 ‐ Schematic of trials performed in experiment in Chapter 9. In the filter condition, participants were instructed to only try to remember only the circles or the squares. In the remember‐all task, participants were instructed to remember all four items on the cued side. For display purposes, the stimuli on the uncued side are displayed in grey.
84
Before the experiment, participants performed 50 trials each of a 2-, 4- and 6- item
change-detection task, using a similar design as the one used in Chapters 1 – 8. Estimates of
VWM capacity (K-estimates) were obtained using this task.
Electrophysiological recording and analysis. The electroencephalogram (EEG) was
obtained from 64 active Ag/AgCl electrodes (Biosemi ActiveTwo system), digitally recorded at
512 Hz, mounted on an elastic cap using the international 10/20 system. Digital file conversion
was performed used PolyRex software, and analysis was performed in MATLAB using the
EEGlab and ERPlab extensions. All electrodes were referenced off-line to the average of the left
and right mastoids. The horizontal electrooculogram (HEOG), recorded as the difference in
activity between electrodes placed lateral to the external canthi, was used to measure horizontal
eye movements. The vertical electrooculogram (VEOG), used to detect eye blinks, was recorded
from electrodes mounted beneath the left and right eyes and referenced to the frontal electrodes
directly above the eyes. EEG and EOG signals were digitally down-sampled to 250 Hz. Prior to
averaging and analysis, the HEOG and VEOG were band-pass filtered at 0.1 – 30 Hz, applied
offline. The EEG was low-pass filtered 50-Hz for statistical analysis, and a 30-Hz low-pass filter
was applied to average ERPs for display purposes.
Trials that were contaminated with eye blinks (> 80 V VEOG) were excluded from
analysis. The HEOG was analyzed for horizontal eye-movements, and trials that contained step-
functions greater than 30 V were excluded from analysis. Four subjects with trial rejection rates
greater than 20% in any condition were excluded from analysis. The remaining subjects had a
mean rejection rate of 4.26%, with an average maximum rejection rate of 7.4%.
The ERPs were computed by averaging the EEG form 200 ms prior to the onset of the
sample display and ending 900 ms post stimulus onset. The ERPs were baseline-corrected to the
200 ms window prior to the onset of sample array. Analysis of ERPs was restricted to the two
posterior electrode pairs used by Hilimire et al. (2009), P7/P8 and PO3/PO4. We also included
the electrode pairs PO7/P08, as the Ptc was observed to be largest at these channels. Ipsilateral
and contralateral waveforms were computed for each condition, defined relative to the attended
(cued) side. Analysis was performed on difference waves computed by subtracting ipsilateral
from contralateral responses. For the ERP analysis, averages were calculated for three time
windows: the N2pc, from 190 – 240 ms; the Ptc, from 290 – 340 ms; and the CDA, from 400 –
800 ms.

85
Results and Discussion
Behavioural Analysis. Prior to the experiment, a measure of VWM-capacity was obtained
using a standard change-detection task. Maximum K-estimates were obtained using the formula
developed by Pashler (1988) and revised by Cowan (2001). All K-estimates fell between 1 and 5
(M = 3.2), consistent with previous studies. A median-split was performed on the maximum
values to obtain high- and low-capacity groups.
Performance on both the filter and remember-all trials was analyzed by calculating K-
estimates for each condition, weighted by the number of target items, and analyzed using a 2
(filter vs. remember-all) x 2 (high- vs. low-competition) repeated-measures ANOVA. The
analysis revealed a main-effect of filtering condition, F(1,17) = 56.588, MSE = .165, p < .001.
That is, significantly more items were recalled in the remember-all condition, where all four
items were targets. No effect of spatial competition condition was observed, F(1,17) = .435, MSE
= .029, p = .518. The interaction between filtering condition and competition was also not
significant, F(1,17) = .001, MSE = .025, p = .979. Thus, the configuration of stimuli in the high-
and low-competition conditions had no effect on the number of items recalled.
In previous studies it was found that low-capacity subjects were more affected by
filtering demands than high-capacity subjects. That is, the difference in change-detection
performance between the filtering condition and the no-filter condition with the same number of
targets was significantly correlated with VWM capacity (McNab & Klingberg, 2008; Vogel et
al., 2005). To examine this effect, the filtering cost was calculated as the difference between K-
estimates obtained in the load-2 condition of the change-detection task performed before the
experiment and the K-estimates obtained in the filter condition (averaged across competition
conditions). Consistent with previous findings, the presence of distractors affected low-capacity
subjects more than high-capacity individuals, as revealed by a significant correlation between
VWM capacity and filtering cost, r = -.53, p = .023.
Electrophysiological Analysis. Activity in posterior channels contralateral to the attended
search array was compared to the activity in ipsilateral channels for each condition. The resulting
difference-waves revealed three ERPs of interest: the negative N2pc, with an onset around 190
ms; the positive Ptc, immediately following the N2pc and beginning around 290 ms; and the
negative, sustained CDA, occurring immediately after the offset of the Ptc.

86
N2pc. First, the amplitude of the N2pc was compared for the three electrode pairs over
the 50 ms window around the peak (200 – 250 ms). The analysis revealed a significant effect of
channel location, F(2,34) = 10.497, MSE = .473, p < .001 as the N2pc was larger over PO3/PO4
than over PO7/PO8, t(17) = -3.307, SEM = .13562, p = .004, as well as P7/P8, t(17) = -4.224,
SEM = .10911, p = .001. Consequently, the subsequent analyses were restricted to the PO3/PO4
pair.
Examining the amplitude of the N2pc using a 2 (filter vs. remember-all) x 2 (high vs. low
competition) repeated-measures ANOVA revealed a significant effect of filtering condition,
F(1,17) = 5.948, MSE = .231, p = .026. That is, the amplitude of the N2pc was greater when
distractors had to be ignored than when all the items were to be selected, consistent with
previous studies. Furthermore, N2pc amplitude was significantly greater under the high-
competition condition, F(1,17) = 19.735, MSE = .521, p < .001. No significant interaction was
observed, F(1,17) = .861, MSE = .260, p = .37. Thus, the amplitude of the N2pc increases when
the difficulty of selecting targets is increased (i.e., under high competition), particularly when
targets must be separated from distractors (Figure 21).
Ptc. Using repeated-measures ANOVA, the mean amplitude of the positive Ptc from 290
– 340 ms was compared across the three channel sets. The analysis revealed a significant effect
of channel location F(2,34) = 4.048, MSE = .662, p = .026, as the amplitude of the Ptc was larger
over P7/P8 than over PO3/PO4, t(17) = -2.991, SEM = .1138, p = .008. The Ptc was also
marginally larger over PO7/PO8 than over PO3/PO4, t(17) = -2.005, SEM = .16335, p = .061,
and was not significantly different between PO7/PO8 and P7/P8, t(17) = -.103, SEM = .25018, p
= .92. Thus, the Ptc demonstrated a more anterior and lateral distribution compared to that of the
N2pc, consistent with previous studies. Accordingly, analysis was restricted to PO7/PO8 and
P7/P8 pairs.
Averaging across the electrode pairs, repeated-measures ANOVA revealed a moderately
significant effect of filtering condition, F(1,17) = 4.395, MSE = .794, p = .051. In contrast to the
N2pc, however, the amplitude of the Ptc was larger in the remember-all condition than in the
filtering condition. This suggests that while the N2pc plays an important role in the filtering of
distractor information, the Ptc may play a larger role in the selection or enhancement of target
information. That is, the N2pc may reflect distractor-processing, whereas the Ptc may reflect the
processing of target information. Although no significant effect of spatial competition was

87
observed for the average Ptc amplitude, F(1,17) = 1.745, MSE = .346, p = .204, analysis of
PO7/PO8 revealed a moderately significant effect of competition, F(1,17) = 1.689, MSE = .529,
p = .092. Thus, consistent with previous studies, the amplitude of the Ptc tended to be larger
under high-competition. The interaction between filtering and competition conditions was not
significant, F(1,17) = .170, MSE = .391, p = .391.
Figure 21 – ERP results observed in the experiment presented in Chapter 9. (Top Panel) ERP waveforms for the channel pairs of interest. The dotted lines indicate the windows used for calculating each of the averages. (Bottom Panel) Average waveforms for each of the ERPs, calculated at the peak channels (see text). Error bars denote within‐subject SEM.

88
CDA. Examining the amplitude of the CDA using a 400 ms window revealed no
significant effect of channel location, F(2,34) = 1.080, MSE = .633, p = .35. Accordingly, further
analysis was performed over an average of all three channel pairs. The effect of filtering
condition on CDA amplitude was not significant, F(1,17) = .169, MSE = .281, p = .69. That is,
the amplitude of the CDA was not larger in the remember-all condition, despite the presence of
two additional targets. Examining memory-capacity as a between-subjects factor revealed that
this effect was not driven primarily by low-capacity subjects, F(1,16) = .000, MSE = .298, p =
.99. That is, neither high-capacity nor low-capacity subjects demonstrated a significantly greater
CDA in the remember-all condition than in the filter condition, suggesting a similar number of
items were encoded into VWM in both conditions. Interestingly, a significant main effect of
competition was observed, F(1,17) = 19.606, MSE = .132, p < .001. Furthermore, no significant
interaction was found, F(1,17) < .001, MSE = .286, p = .99. That is, the amplitude of the CDA
was greater in the high-competition condition, regardless of whether some of the items were to
be ignored. This suggests that under high-spatial competition, individuals had a more difficult
time excluding distractors from VWM, consistent with the effects observed in earlier chapters.
Overall, the results of this study are largely consistent with the findings of Hilimire et al.
(2009, 2010), as the Ptc was found to be distinct from the N2pc, both in terms of its spatial
topography and its sensitivity to target and distractor information. Consistent with previous
Figure 22 ‐ Relationship between memory capacity and Ptc amplitude. (Left Panel) ERP waveforms for high‐ and low‐capacity participants in the remember‐all condition. (Right Panel) The change in Ptc amplitude between high‐ and low‐competition conditions is significantly correlated with VWM capacity.
89
studies, both the N2pc and the Ptc were observed to be greater when items were presented close
together in space (i.e., under high-spatial competition), although this effect was not as strong for
the Ptc. These findings extend the findings of Hilimire et al., however, as the Ptc was greater
when all the items presented were targets. This is in contrast to the N2pc which is typically larger
when targets have to be selected among distractors. Thus, while the N2pc may play an important
role in both target selection and distractor filtering, the Ptc may primarily reflect the
enhancement or recognition of target features. Importantly, these two steps correspond to the
two-stage model of Xu and Chun (2009). That is, while the N2pc may reflect the initial selection
and individuation of a limited number of targets, the Ptc may reflect the subsequent enhancement
and encoding of target information.
If the N2pc and the Ptc reflect processes critical to forming high-resolution
representations and encoding them in VWM, it is possible that this activity is related to VWM
capacity. In particular, the results of Chapter 8 suggest that the ability to enhance object features
and create high-resolution representations is predictive of VWM capacity. Consequently, if
VWM depends on the ability to select and enhance target features, then VWM capacity should
be related to Ptc activity, but not necessarily to the amplitude of the N2pc, as the Ptc appears to
reflect target-related processing. To test this question, the increase in N2pc and Ptc amplitude
from the low- to high-competition condition was compared with VWM capacity. For the N2pc,
the change in amplitude between high- and low-competition conditions was unrelated to VWM
capacity, regardless of whether the goal was to filter distractors, r = .01, p = .97, or to remember
all the targets, r = .329, p = .18. Across both filtering and remember-all conditions, the change in
amplitude of the Ptc was also not significantly correlated with VWM capacity when averaged
over PO7/PO8 and P7/P8, rs < .34, ps > .18. Examining PO7/PO8 only, however, revealed a
significant correlation between the change in Ptc amplitude in the remember-all condition and
VWM capacity, r = .47, p .049. Thus, whereas low-capacity subjects exhibited little difference in
the amplitude of the Ptc between high- and low-competition targets, high-capacity subjects
showed a much larger Ptc response when targets were presented in close proximity (Figure 22).
The results of this experiment provide further support for the model described by Xu and
Chun, and provide potential ERP correlates of selection and encoding stages. That is, when
presented with a visual scene, there are two stages that must occur for items to gain access to
higher cognitive processes such as working memory and object recognition. First, a limited

90
number of targets must be selected and individuated. This may be particularly true in the
presence of distractors, otherwise task-irrelevant information may be processed at the expense of
relevant targets. Given that the N2pc is larger in the presence of distractors, and occurs prior to
the onset of both the Ptc and the CDA, it is likely that the N2pc may reflect this process. That is,
the N2pc may reflect the process of selecting and individuating targets to enable further
processing of those items. This is consistent with findings that the amplitude of the N2pc is
larger when the number of target items increases. Thus, when more items need to be selected, or
when targets are more difficult to individuate (e.g., under high-spatial competition), the
amplitude of the N2pc increases, consistent with a selection and individuation mechanism.
In the second stage of VWM and perception proposed by Xu and Chun (2009), the
features of the selected objects are enhanced and encoded. Thus, the Ptc likely reflects these
feature enhancement and encoding processes, as it is not evident when targets do not need to be
identified. Furthermore, the Ptc occurs immediately after the N2pc, but before the CDA,
suggesting that it may play a critical role in encoding stages after targets have already been
selected. Critically, the amplitude of the Ptc was not greater when some of the items were
distractors; in contrast, the Ptc was largest when all four items were targets, suggesting that this
activity reflects processes related to target processing, rather than those related to distractor
filtering.
In addition, the finding that changes in Ptc amplitude are correlated with VWM capacity
provides further support that the Ptc reflects target enhancement and encoding processes. That is,
if VWM depends on top-down bias signals to enhance and encode target features for further
cognitive processing, then those individuals who are better able to enhance and encode target
features should perform better on VWM-dependent tasks. Thus, the finding that the Ptc
amplitude changes between high and low-competition conditions is consistent with this account:
When targets compete for representation, high-capacity individuals are better able to enhance
and encode relevant features, enabling more items to be maintained in and recalled from VWM.
In other words, high-capacity individuals are better able to bias the selection of competing
representations. This account is consistent with the results of Chapter 8, in which VWM capacity
was correlated with the precision of VWM responses. In other words, top down selection,
enhancement and encoding of target features leads to more precise VWM representations, and
therefore, better VWM performance.

91
Although these results provide further support for the biased-competition account of
VWM, there are a few discrepancies from previous findings that are worth mentioning. First,
unlike in previous studies, the effect of target-distractor or target-target separation on the
amplitude of the Ptc was not significant at P7/P8, and only marginally significant at PO7/PO8.
There are a number of possible explanations for this discrepancy. The configuration in the
present design used four items rather than two. Consequently, the overall amount of competition
between all the items in the display may have mitigated the effects of the Ptc. In fact,
behavioural performance in the low-competition condition was no worse than in the high-
competition condition, suggesting that the current configuration may not have optimized the
competitive interactions between items. Alternatively, the difference in effects between the
current and previous studies may be methodological, as previous studies have applied high-pass
filters during data analysis, which can increase the amplitude of a positive ERP that is situated
between two negative ERPs (i.e., the N2pc and the CDA). Thus, future studies are required to
fully disentangle the electrophysiological nature of the Ptc. The finding that competition
marginally increased the Ptc amplitude does, however, confirm that general finding that the Ptc
is sensitive to the distance between items.
In addition, although previous studies have demonstrated differences in CDA amplitude
between filtering and remember-all conditions, particularly for high-capacity subjects, no such
difference was observed here. In other words, even though the remember-all condition contained
twice as many targets compared to the filtering condition, the amplitude of maintenance-related
activity was similar in both conditions. Although the absence of a difference between these
conditions is somewhat surprising, the finding that the CDA was larger under high competition
compared to the low-competition condition may reveal a potential explanation. That is,
maintenance-related activity was greater when items were presented in a high-competition
configuration, regardless of whether some of those items were distractors. This suggests that
competition for representation may have a greater effect on whether or not irrelevant items are
encoded in memory. Thus, even high-capacity subjects may have failed to exclude the distractors
from VWM, resulting in an increase in CDA amplitude. In other words, when competition
between targets and distractors was high, distractors may have gained obligatory access to VWM
resources. Thus, this seemingly contradictory finding provides further support that competition
for representation is a critical aspect of VWM.

92
Finally, it is unclear why the distance between objects had a significant effect on the
amplitude of the CDA in the present study when a similar manipulation had no effect on the
CDA in a previous study (McCollough, Machizawa, & Vogel, 2007). The difference between
these findings may be due to differences in stimuli parameters, as in the present study the stimuli
were presented in pairs with a constant distance from fixation, whereas stimuli in the previous
study were randomly located throughout the display in pairs of two or four. In particular, if the
effect of distance on VWM performance depends on competition for representation within a
receptive field, then an object’s distance from fixation, as well as the distance between objects,
could significantly alter the extent of competition.
In summary, the results of this present chapter demonstrate two important findings: first,
the Ptc is present during a VWM task, particularly when only targets are presented, indicating
that this ERP reflects the processing of target information; second, changes in Ptc amplitude are
correlated with VWM capacity, indicating that this ERP likely reflects the enhancement and
encoding of target features necessary for VWM. Thus, this experiment reveals the Ptc as a likely
neural correlate of top-down target processing necessary for resolving competition and
establishing high-precision mnemonic representations.

93
General Discussion
The purpose of the present thesis was to examine the effects of competition on VWM
performance. Specifically, this thesis aimed to determine how the number and precision of
VWM representations is affected by competitive interactions, and how competition for
representation can be overcome by selection biases. To demonstrate that competitive interactions
affect VWM performance, Chapters 1 – 4 tested whether performance on VWM tasks was
affected by the distance between memory items. The results of these experiments revealed that
when objects are presented close together in space, VWM performance is impaired relative to
when those same objects are presented further apart. In other words, spatial competition for
representation within the visual system affects the ability to establish and maintain information
on-line in working memory. The effects of competition on VWM were observed for simple and
complex objects, as well as for both targets and distractors. Using a three-component model of
continuous responses in a recall task, chapters 3 – 4 demonstrated that while increasing the
number of items (targets or distractors) affects the probability of correctly recalling an item (PT),
decreasing the distance between objects primarily affects the precision of responses (1/SD), as
well as increasing the number of incorrectly-recalled non-targets (PNT). Chapter 5 extended
these findings to distractors, demonstrating that multiple distractors affect the precision and
accuracy of VWM responses. To demonstrate how competition for representation in VWM is
overcome via selection bias, Chapters 6 – 7 examined VWM performance for high- and low-
priority objects. Objects given high attentional priority were typically reported with greater
precision and accuracy than those given less priority. Paradoxically, high-priority objects (i.e.,
those presented with onsets) were also sometimes reported incorrectly more often than lower-
priority items indicating a strong bias towards these objects. Finally, Chapters 8 and 9 examined
bias-signals as a potential source of individual differences in VWM performance, revealing that
high-performers have more precise representations of sub-capacity representations than low-
performers. The neural correlate of this bias could be the Ptc, occurring around 300 ms over
lateral occipital and temporal cortex. Overall, the results of this thesis support the conclusion that
VWM performance is limited by competition for representation within the visual system. Before
outlining a model of how competition affects VWM performance, I will first address how
competition affects the various measures of performance observed in the present experiments.

94
Precision, Resolution, and Accuracy in VWM
The experiments presented in Chapters 3 – 8 used the method of recall established by
Wilken and Ma (2004), and the data were analyzed using the method of Bays, Catallo and
Husain (Bays et al., 2009). These studies were aimed at determining whether competition affects
the number or the precision of representations in VWM. Thus, these studies examined both the
precision of overall responses (1/SD), as well as the proportion of responses to targets (PT), non-
targets (PNT), and random responses (PG). As in previous studies, increasing the set size had a
significant effect on all aspects of performance. Within a set size, however, increasing the
competition between items (by decreasing the distance between objects) had either no effect
(Chapter 3) or a small effect (Chapter 4) on the precision of responses. In both cases, however,
competitive interactions between objects significantly increased the number of non-target
responses. Importantly, the extent of spatial competition had no effect on the number of target
responses, or on the SD of target responses. Thus, while the number of items stored and correctly
recalled was unaffected by within-set size changes in spatial competition, overall accuracy was
affected, as revealed by an increase in the number of non-target errors. These results suggest that
while competition can affect VWM performance (as was observed in the change-detection task
in Chapters 1 and 2), changes in within-set-size competition largely have no effect on either the
number of items stored, or on the fidelity of those correctly-recalled items.
How does competition affect both change-detection performance and response precision,
without affecting the number or accuracy of recalled items? One possibility is that the number of
non-target responses reflects low-resolution memory for objects that are not the focus of
selection biases (see below). For example, Sligte and colleagues (Sligte, Scholte, & Lamme,
2008; Sligte, Vandenbroucke, Scholte, & Lamme, 2011) have suggested that there are three
forms of visual memory: a high-capacity and fleeting iconic memory; a low-capacity but stable
VSTM; and an intermediate memory, which they termed fragile VSTM. This intermediate
memory store is thought to contain a larger number of low-resolution representations than the
number of high-resolution items stored by VWM that can be probed through the use of
attentional cues that appear before a change-detection probe. Thus, when subjects are cued to a
particular location, participants can report more items than if no cue were presented, indicating a
larger capacity memory than is available during a typical change-detection task (Griffin &
Nobre, 2003; Makovski, Sussman, & Jiang, 2008; Sligte et al., 2008; Sligte et al., 2011).

95
According to this account, if an item is not the focus of attention, and therefore, not a
high-precision representation recalled in VWM, it may instead be a low-precision representation
stored by fragile-VSTM. This was revealed in one study by demonstrating that a smaller
percentage of sample items can be recalled (i.e., identified from memory) than the percentage of
changes detected (Sligte et al., 2011). In other words, a large number of low-resolution items can
be used to perform detection tasks, while a smaller number of those can actually be recalled,
suggesting that change-detection performance depends on the presence of additional low-
resolution memory representations.
The possibility that there exist low-resolution representations that are outside the focus of
attention could potentially explain the totality of results observed in these studies. If an item is
recalled correctly, it is likely a high-resolution representation becomes the focus of selective
attention, and therefore, stored within capacity-limited VWM. When the probed target is
forgotten, it is easy to reject the high-resolution items stored in VWM because, as the identities
and locations of those objects are known. Low-resolution representations, however, may affect
performance by biasing responses towards these non-targets, particularly under a high-
competition configuration. That is, when target items are forgotten, responses are biased towards
the low-resolution, low-fidelity representations. As the competition between items increases, the
threshold for reporting these low-resolution items decreases, resulting in an increase in
incorrectly-reported items.
The possibility that low-resolution representations affect performance on the types of
responses in a recall task has important implications. In the model described by Bays and
colleagues and used in the present design (Bays et al., 2009), the concentration (distribution) of
non-target responses is assumed to be equivalent to that of correctly reported targets. If,
however, non-target responses reflect the contribution of lower-resolution representations than of
those that are correctly recalled, these responses should encompass a wider distribution. Thus,
the proportion of non-target responses may in fact be greater than that assumed by current
models. This question should be addressed in future studies.
Another possible explanation for the present findings is that competitive interactions may
increase the difficulty of binding the features of objects to particular locations. For example,
studies have demonstrated that performing a change-detection task becomes increasingly
difficult as the number of original sample items is removed from the probe display (Nasr,

96
Moeeny, & Esteky, 2008). That is, as the context of the original sample display becomes less
intact, accuracy decreases and reaction times increase. This may be in part because VWM for
object features depends on configural relationships (Jiang, Chun, & Olson, 2004; Jiang, Olson, &
Chun, 2000). Consequently, items that compete for representation may be more susceptible to
errors in spatial memory, as the competing objects increase the difficulty of identifying which
feature belongs to which object. While these types of errors may reduce overall change-detection
accuracy (e.g., errors in spatial memory may be misidentified as changes, or may prevent the
accurate identification of changes), spatial errors may be exhibited primarily as non-target
responses in a recall task (i.e., identifying the correct colour at the incorrect location). That is,
when target items are outside the focus of attention, non-target items may have an increased
weight under high competition, resulting in a non-target response, rather than a random guess.
Thus, errors in spatial memory may affect non-target responses without simultaneously affecting
the probability or precision of target responses.
Overall, although the precision of all responses is proportional to the number of items
presented, as demonstrated by Bays and colleagues, precision does not always accurately reflect
VWM performance (Bays et al., 2009; Bays & Husain, 2008). In the present series of
experiments, decreases in precision were frequently observed in response to increases in
competition. These changes in precision, however, were often not accompanied by changes in
the probability of recalling a target, or in the amount of error in these target responses. Instead,
losses in precision were most frequently associated with increases in response errors (in the form
of non-target responses). Furthermore, it is unclear whether measures of precision also reflect
contributions from intermediate (fragile) forms of memory, or how overall precision relates to
resolution. Thus, while precision may serve as a catch-all measure of VWM performance that
describes overall performance, it may not be a useful measure for describing the number or
quality of representations stored in VWM. Instead, the three-factor model likely serves as a
better method of describing the totality of VWM responses.
A Biased-Competition Model of VWM
From the moment information reaches visual cortex, objects in the visual scene compete
for representation. In the initial stages of cortical processing, the most prevalent mode of
competition is local competition. That is, mutually-suppressive interactions occur between
objects, resulting in mitigated neural responses relative to when objects are presented in isolation

97
(Kastner & Ungerleider, 2001). Because this competition is localized (i.e., spatially specific),
competition for representation increases as processing ascends the visual pathways. That is, as
information moves from V1 to V4 and beyond, the receptive field size of neurons increase,
resulting in competition for representation over a larger region of space (Kastner et al., 2001).
Furthermore, competition for representation at early levels of visual processing is proportional to
the distance between objects: as objects compete for representation for a greater number of
receptive fields, the effects of competition increase.
It is worth mentioning that because local competition is happening at the level of the
receptive field, effects of competition on VWM performance should be greater when all objects
are presented within a single hemifield. Thus, further support for the competition account comes
from previous studies that have demonstrated that change-detection performance is greater when
items are presented bilaterally, rather than within only a single hemifield (Umemoto, Drew,
Ester, & Awh, 2010). One may argue, therefore, that the effects of distance on memory
performance in the present studies may be the result of a greater number of bilateral trials in the
low-competition conditions (when items were spread further apart). While competition may have
a greater effect on unilateral stimuli, however, they should also exist for bilaterally presented
stimuli, as previous studies have established that competition occurs both within- and between-
hemifields (Geng et al., 2006; Mathôt, Hickey, & Theeuwes, 2010).
The most significant way of increasing competition for representation in early visual
cortex is by increasing the number of objects in the scene, thereby increasing the number of
competitive interactions. That is, in the present thesis (Chapter 3) as well as in previous studies
(Bays et al., 2009; Zhang & Luck, 2008), the largest decreases in resolution (or the precision of
responses) appears to occur between one and two items (i.e., when competitive interactions are
introduced). Further increases in the number of presented objects continue to affect the precision
of responses, suggesting further decreases in the resolution of perceptual representations. Thus,
as the number of items (and therefore, the number of competitive interactions) increases, the
resolution of objects appears to decrease proportionally. Importantly, these effects appear to
occur independently of any capacity limits of VWM, suggesting that competition likely affects
the resolution of representations upstream of VWM maintenance. That is, competition affects the
precision of representations below the capacity of VWM, suggesting that these effects are
independent of limitations on VWM storage. Furthermore, adding distractors to the display also

98
appears to have a significant effect on the resolution of representations, although the suppressive
interactions of distractors may be somewhat mitigated by selection biases (Chapter 5; see below).
Overall, however, the results of these and other experiments suggest an inverse relationship
between competition and resolution: as competition for neural representation increases, the
resolution of the resulting representations decrease.
In addition to local competitive interactions, the results of the current experiments
suggest that objects compete globally for capacity-limited cognitive resources. This competition
likely occurs in two stages, as proposed by Xu and Chun (Xu & Chun, 2009). First, a limited
number of objects will be selected or individuated. Because the number of objects that can be
selected is limited by neural resources, objects compete for this selection. Second, the features of
some of the selected objects are enhanced and encoded, enabling those objects to be fully
processed (e.g., identified or stored in VWM). The first stage of capacity-limited processing
likely occurs in the iIPS, and the second stage originates predominately in the sIPS and LOC (Xu
& Chun, 2006). Importantly, while the activation of iIPS is largely independent of information
load, activity in the sIPS and LOC appears to be highly sensitive to the complexity of objects
(Xu, 2007; Xu & Chun, 2006). Thus, it is in this second stage that the resolution information
resolved in early visual cortex is extracted.
The final resolution of these representations is ultimately still limited by competitive
interactions in early visual cortex. In others words, local competition in early perceptual areas
largely sets the resolution of representations, at least with limited exposure times. Activation of
the IPS and LOC likely serves to stabilize (or vulcanize) representations, making them more
resistant to interference from eye movements, or changes in the display. These two stages,
therefore, can likely account for differences in VWM performance that result from different
probe types (Sligte et al., 2008): low-resolution, fragile representations may be extracted for
numerous objects, while further constraints limit the number of high-resolution, stable
(vulcanized) representations that can be formed. Importantly, both of these stages are capacity
limited, either in terms of the number of items that can be represented within a receptive field, or
in terms of the number of cognitive resources to represent those items. Therefore, items compete
for representation at both stages, and those items that win-out gain access to further cognitive
processing that facilitate such processes as object recognition and VWM.

99
Figure 23 ‐ A schematic of a biased‐competition model of VWM. Blue regions identify local competition for representation. Green regions identify those where global competition for VWM resources may occur. Red regions identify potential sources of top‐down feedback that serve as bias signals for target selection. Solid arrows indicate recurrent interactions between local and global competition. Dashed arrows indicate possible sources of top‐down selection mechanisms.
Although all objects in the scene compete for global representation (i.e., representation
by capacity-limited cognitive resources), they do not compete for representation equally.
Numerous selection biases can alter the relative weights of particular objects, increasing the
likelihood that these objects gain access to VWM. These selection biases can largely be

100
considered attentional effects, and are consistent with the mechanisms for resolving competition
within the attentional system (Desimone & Duncan, 1995). The means of biasing selection can
largely be divided into the two forms of selective attention: bottom-up, and top-down.
Bottom-up mechanisms of selection are largely automatic processes that do not depend
on cognition or task demands. Primarily, stimuli that have strong physical salience and stand out
from the background will be given higher priority than those objects that have weaker physical
signal. Thus, those objects that appear with abrupt onsets (Chapter 6) are prioritized over those
that appear without onsets, as onsets are typically predictive of new information. If the contents
of VWM were determined solely by the bottom-up, stimulus-driven capture of attention, VWM
would be of limited use, as the contents of memory would often not support the individual’s
current goals. Fortunately, in addition to bottom-up biases, top-down feedback can also affect
visual processing and the control of selection. Top down selection can occur either by spatial or
object (feature) selection, although these processes may interact (Chapter 7). The mechanism by
which top-down selection may affect early perceptual processes is by altering the responses of
neurons in early visual cortex, thereby enhancing the processing of relevant (cued) information,
and mitigating the suppressive effects of distractors (Desimone & Duncan, 1995).
The biasing of spatial location has been shown to improve performance on numerous
discrimination tasks, and furthermore, has been shown to improve VWM performance (Schmidt
et al., 2002). In the experiment presented in Chapter 7, cuing a particular location with a
peripheral cue increased the probability that the target at the cued location was recalled correctly.
This is consistent with previous findings that central cues can increase the probability of
correctly reporting the target (Zhang & Luck, 2008). Thus, top-down spatial cues appear to bias
the selection of the cued target, thereby reducing the effects of competing distractors, and
supports stronger encoding and consolidation of the information at the cued location. In fact,
aside from the number of sample items, cueing the target was the only manipulation in the series
of experiments presented in this thesis to have a significant effect on the SD of target responses.
Therefore, biasing selection via spatial attention may be one of the primary means of both
reducing local competition (i.e., competition for receptive fields in early visual cortex), as well as
biasing the contents of selection for further cognitive processing by capacity-limited resources
(i.e., global competition).

101
In addition to spatial bias, top-down selection can bias responses towards object features.
This may be particularly important when the location of a target is unknown (Desimone &
Duncan, 1995). In order for object selection to occur, the features of the desired target must be
held on-line in WM to bias competition in favour of the target objects. In one series of studies
(Chelazzi et al., 1998; Chelazzi et al., 1993, 2001), monkeys were presented with a target
stimulus at the beginning of a visual search trial. Responses to the target stimulus were sustained
in inferior temporal (IT) cortex, indicating that these object features had become activated and
held on-line. When the search was presented, cells responded to both the target stimulus and the
distractor. Very quickly, however, responses to the distractor object become suppressed, while
the target responses remain high. Thus, top-down selection can bias responses in favour of
particular targets, thereby mitigating the effects of competition.
Just as spatial selection is an effective way of biasing the contents of VWM, object
selection may also serve to determine which items gain access to capacity-limited resources. For
example, in tasks in which targets and distractors can be distinguished by colour and shape,
preparatory activity was exhibited in bilateral middle frontal gyrus (MFG) and the basal ganglia
in response to the instructions to remember or ignore the critical distractors (McNab &
Klingberg, 2008). Activation in these regions may therefore reflect the top-down bias signal to
select and ignore particular items. Although it is unclear whether the selection of targets and the
filtering of distractors depends on the same type of preparatory activity, it is likely the case that if
features of target items are known, this information could be used to bias the selection and
encoding of those items into VWM. Furthermore, because search templates require that target
information be stored online in VWM (Chelazzi et al., 1998; Chelazzi et al., 1993, 2001), storing
target features may be a much more effective way of selecting and encoding that information
than biases that depend on suppressing distractor information, as holding target information in
VWM already primes responses in favour of the target (Soto, Heinke, Humphreys, & Blanco,
2005; Soto, Humphreys, & Rotshtein, 2007).
As mentioned above, Xu and Chun (2009) suggested that a two-stage process is
necessary for object recognition and VWM. While the first stage involves object individuation
and selection (i.e., spatial selection), the second stage involves the selection and enhancement of
target features (i.e., object selection). Thus, it is possible that these two processes reflect similar
mechanisms to those that are involved in the a priori selection of target features. That is, after the

102
onset of competing stimuli, it may be necessary to bias responses related to the location of
objects (spatial bias) as well as bias the responses to each of the relevant target features (object
bias). These post-hoc selection biases may be particularly important with short stimulus
durations, as well as with large sample sizes. As with other bottom-up or top-down biases,
selecting and enhancing relevant target locations and features may mitigate the effects of
competitive interactions, thereby enabling these items to form high-precision, VWM
representations. Consequently, the ability to select and enhance relative information may be an
important determinate of VWM processes. For example, although encoding time was kept brief
(< 200 ms) throughout this thesis, it is possible that longer encoding times may enable bias
signals to operate more effectively, resulting in the consolidation of more robust and stable
representations (Vogel et al., 2006). The data presented in Chapters 8 and 9 suggest that
processes related to the selection and enhancement of target features may in fact be related to
VWM capacity. That is, individuals who are better able to enhance the features of target
representations are able to establish higher-precision representations, enabling the storage and
recollection of a greater number of visual objects (Chapter 8). Moreover, the N2pc and the Ptc
may represent processes related to the selection of targets and the biasing of object features,
respectively (Chapter 9). Thus, these ERP components may represent the analogue of processes
demonstrated by the iIPS the sIPS/LOC during VWM tasks.
The results of the present experiments are also consistent with the idea that VWM has a
fixed capacity for high-resolution representations, although a greater number of lower-resolution
items may also be stored. That is, even with the biasing of attention, only a limited number of
items can be successfully reported (Chapter 7). The question remains, however, why VWM
capacity is limited at all. One possibility is that VWM capacity represents the upper limits of the
selection bias within the visual system. Thus, items that are not the focus of selective attentional
biases would be excluded from VWM, but potentially stored as lower-resolution, fragile
representations (Sligte et al., 2008; Sligte et al., 2011). In support of this account, previous
studies have demonstrated that the number of items that can be prioritized through abrupt onsets
is limited to about four items (Yantis & Johnson, 1990). That is, observers are more accurate at
reporting items that appear with onsets than those that appear without onsets, but this effect is
limited to four items. Consequently, if only a limited number of items can be prioritized by
attention, this bottleneck would limit the number of high-precision representations that could be

103
maintained downstream in VWM. This account could further explain why the SD of target
responses is largely unaffected by set size manipulations above four items, but is affected by
below-capacity manipulations: as items are added to the display, competitive interactions reduce
the precision and resolution with which items can be perceived and encoded in VWM; however,
beyond the capacity of VWM, increasing the number of items may not affect the precision of
target responses, as attentional biases would mitigate the competitive effects of the additional
(unselected) items. The (four) selected targets would continue to compete for representation,
resulting in representations that are no more or less precise than would be observed for the four
stand-alone targets. In other words, attentional biases may fix the precision of target responses,
as well as the number of targets that could be stored.
As stated in the Introduction, the present thesis was largely motivated by the biased-
competition model of attention first proposed by Desimone and Duncan (1995). As such, the
model of VWM outlined in here bears several similarities to the biased competition model of
attention. In fact, the biased-competition model of attention was largely a model describing how
information was first selected for processing, with the implicit or explicit assumption that
selected information would be available for subsequent cognitive processing, including (or
especially) VWM (Duncan & Humphreys, 1989; Kastner & Ungerleider, 2001). Thus, in many
ways, a biased-competition account of VWM is not distinct from a model of attention, but
merely an extension of it.
Relationship to Other Models of VWM
As stated in the Introduction, most current models of VWM assume that limits in VWM
performance are related to limits in storage ability, rather than earlier processing bottlenecks.
The results of this current thesis suggest, however, that competition for representation may play a
critical role in both the number of mnemonic representations that can be formed, as well as in the
fidelity of those representations. Consequently, in the final section I will explore how the current
findings relate to current models of VWM, as well as identify potential implications for these
theories.
Currently, the predominant debate in the literature surrounding the nature of information
processing in VWM relates to whether VWM capacity represents a limited number of fixed-
resolution slots (e.g., Cowan & Rouder, 2009; Fukuda et al., 2010), or whether VWM represents
a limited pool of resources that can be flexibly allocated to items in the visual scene (e.g., Bays

104
& Husain, 2009; Huang, 2010). While the experiments in the present thesis were not designed
specifically to address the debate of fixed-slot vs. flexible-resource models, the results may
provide some insight into this debate. Specifically, the results of the present thesis are largely
consistent with theories of VWM in which the fidelity and resolution of VWM is affected by the
amount of object information contained within target items, but in which there is an upper-limit
on the number of items that can be stored (Alvarez & Cavanagh, 2004). That is, the number of
items that can be stored is affected by both the number of items in the display (Chapters 1 – 3),
as well as the complexity of those objects (Chapter 2); however, the results do not support a pure
resource theory, as the fidelity items stored in memory was not affected by increases in set size
beyond 4 items (Chapter 6). In other words, the results of Chapter 6 are consistent with the
findings of Zhang and Luck (2008) that there is a fixed limit on the resolution of the items
correctly recalled from VWM, suggesting an upper limit in the number of items that can be
stored.
In order to account for the decreases in resolution for representations below the capacity
of VWM (e.g., from one to three items), Zhang and Luck (2008) proposed that memory
resources could be averaged for those items below the capacity of VWM. Thus, according to this
account, resources can never be completely allocated to only one representation, but are instead
averaged across many representations (up to the number of available slots). Thus, this
slots+averaging model provides an alternative to a model in which resources can be allocated
preferentially to a single item. This model assumes, however, that resolution is determined
purely by storage resources.
The results of the present thesis may provide an alternative account for why the number
of items that can be stored is fixed, while the resolution of those representations depends on the
set size. Specifically, it is possible that the precision of a single representation is greater than the
precision for three representations not because memory resources are averaged across multiple
items, but because competitive interactions between multiple items degrade the precision of
those representations. That is, the resolution of mnemonic representations may be determined by
competitive interactions upstream of VWM maintenance; the more items competing for
representation, the lower the precision of those representations. Selection biases, however, may
serve to minimize the effects of those items which are outside of the selection limit, resulting in a
plateau in mnemonic resolution.

105
There are three advantages of the competition account over a slots+averaging model.
First, a competition account does not require strict constraints on cognitive operations (i.e.,
averaging of resources, without pure resource flexibility). Instead, this account is parsimonious
with the known behavioural and neurobiological effects of competition on perceptual
representations (Desimone & Duncan, 1995). Second, a competition account may be more
parsimonious with the neural mechanisms of VWM than a slots+averaging model. That is, if
memory resources can be allocated over many items, it is unclear why neural measures of VWM
increase with memory load (Todd & Marois, 2004; Vogel & Machizawa, 2004; Xu & Chun,
2006). If memory resources could be averaged over multiple items, one might expect neural
measures of VWM maintenance to plateau at one or two items, as all available memory
resources could be allocated to these items. Instead, a competition account could explain a loss
of precision with increasing set size while still maintaining a one-to-one relationship between set
size and VWM-related activity. Third, a competition account may also explain how attentional
cues can affect the likelihood of recalling a cued item, while having little-to-no effect on the
precision of those representations (Zhang & Luck, 2008): that is, while attentional cues may bias
the encoding of cued items, the precision of the cued items and uncued items are largely
determined by competition for perceptual, rather than mnemonic, resources. In other words,
selection biases can mitigate the effects of competition, but they cannot eliminate them entirely.
Thus, a competition account could be considered a slots+resource model in which memory
capacity represents a fixed number of slots, while precision is determined by a common pool of
perceptual, rather than mnemonic, resources.
As mentioned above, the present results may also share some similarities with a recent
model proposed by Sligte and colleagues (Sligte et al., 2011). That is, under high competition the
number of non-target errors increase even when the proportion and precision of target responses
is unaffected. This suggests that VWM performance is perhaps affected by additional
representations (i.e., those that are affected by competition). This is consistent with the proposal
by Sligte and colleagues (Sligte et al., 2011) that in addition to a very limited-capacity, high-
resolution and stable VSTM, there is also a lower-resolution, fragile form of VSTM. This
“fragile-VSTM” can store a much larger number of representations than are available to stable-
VSTM, and can therefore affect task performance (e.g., change-detection). In other words,
targets that are the focus of attention may be high-precision representations that are stored in

106
stable-VSTM and correctly recalled; in contrast, those that are outside the focus of attention may
be stored as lower-precision fragile-VSTM representations that are reported with greater error.
These representations may therefore account for the increase in the number of errors under high
competition observed here.
Although it is not fully clear from the present results whether non-target responses reflect
fragile-VSTM representations, it is possible that the model proposed by Sligte and colleagues,
along with a competition account, could account for some of the evidence in support of resource
models of VWM. Specifically, Bays and colleagues (Bays et al., 2009; Bays & Husain, 2008)
have demonstrated convincingly that the precision of responses in memory tasks decrease as a
function of the number of items in the visual scene. These findings suggest that VWM represents
a limited pool of resources that are distributed among all items in the display, but that resources
can be allocated preferentially to particular items (e.g., those that are the targets of planned
saccades). If fragile-VSTM representations can affect performance, however, this could
potentially account for the results of Bays and colleagues, while still supporting a limited-
capacity and high-fidelity VWM. That is, some of the low-precision responses at large set sizes
observed in the studies by Bays could be attributed to the influence of a high-capacity, low-
resolution memory system. Thus, when the number of items is large, the responses are made up
both of low-capacity VWM responses, and higher-capacity fragile-VSTM responses. The
precision of representations stored by both the high- and low-capacity systems may be
determined primarily by the competition for representation in early visual processing. Thus,
competition for perceptual representation could be the limiting resource determining the
precision of responses, as opposed to the limited resource of a single memory system. In other
words, because objects compete for representation and the initial selection and encoding stages,
the precision of responses could appear to follow a continuous exponential function, even though
responses are determined by two different memory systems. Independent of the precise
mnemonic mechanism, a competition account may provide an alternative account for the
systematic decrease in precision that occurs with increasing set size: as the number of competing
representations increase, there is a proportional decrease in the precision of representations
maintained downstream.
As mentioned in the previous chapters, the results of the present thesis are also consistent
with the model of VWM and perception proposed by Xu and Chun (2009). Specifically, the

107
results support the idea that VWM represents a fixed capacity limit, but that the capacity and
precision of VWM may be limited in part by the total amount of information contained within
objects (i.e., fewer high-precision complex items can be maintained in VWM). Furthermore, one
experiment demonstrated that the superior IPS stores only the number of relevant features, not
integrated objects (Xu, 2007). This finding may provide support for the competition account,
since it provides further evidence that the limited memory capacity for complex objects may not
necessarily be the result of storage limitations for complex, bound objects. Instead, the lower
capacity for complex objects may be a consequence of the increased difficulty of representing
complex objects in perceptual regions, and the additional resources necessary for encoding and
resolving the individual features. For example, activation of the superior IPS could represent a
bias signal necessary for selecting and maintaining activation of multiple features in perceptual
regions. Features that are more difficult to perceive and resolve may require greater top-down
selection bias, resulting in a reduced VWM capacity.
One outstanding question is how the activation of brain regions that subserve VWM
encoding and maintenance are affected by competition. That is, it is unclear what effect, if any,
competition has on the activation of the inferior and superior IPS, or the LOC. An interesting
next step in exploring the competition model of VWM would be to examine whether greater
activity is observed in these regions when sample items are presented under high- and low-
competition configurations. Given the distinct patterns of VWM-related activity exhibited by the
iIPS and the sIPS/LOC, any differences in activation under high- and low-competition could
elucidate whether spatial competition primarily affects the selection and individuation of objects
(iIPS) or whether competition affects the encoding and enhancement of target features
(sIPS/LOC). The results of Chapter 9 suggest, however, that competition may affect object
individuation more than feature encoding. That is, both the N2pc and Ptc were affected by the
distance between objects, although this effect was only marginally significant for the Ptc. Thus,
if these ERPs correspond respectively to the processes subserved by the iIPS and sIPS/LOC, this
would indicate that competition may have a greater effect on the selection and individuation of
target objects. Although further research is required to relate these ERPs to the processes
identified using fMRI, this study and others (Adamo, 2010) reveal ERPs as a viable method for
elucidating the distinct neural processes that mediate VWM. It also remains unclear whether
competition between object features has a similar effect on memory performance, although a

108
number of studies have begun to investigate this question (Bays, Wu, & Husain, 2010; Lin &
Luck, 2009).
Conclusions
In summary, based on the results of this thesis a biased-competition model of VWM has
been proposed. According to this model, the fidelity of representations encoded in VWM is
limited by competitive interactions that occur upstream of VWM maintenance. As such, this
model provides a potential neurobiological mechanism for understanding the capacity and
fidelity limitations in VWM: As more items are added to the display, the number of competitive
interactions increases, resulting in less precise VWM representations. Furthermore, this model
appeals to the attentional literature to address the gating-mechanisms of capacity-limited
memory resources. Specifically, bottom-up and top-down selection biases can serve to limit the
effects of competition, and to bias the contents of VWM. Moreover, this model attempts to
explain between-individual differences in VWM capacity by proposing that the capacity and
fidelity of VWM representations may depend on top-down selection mechanisms. In other
words, capacity may not be related to differences in maintenance capacity, but rather to
differences in attentional or executive control. Therefore, this model derived from the results of
this thesis provides a novel framework for studying and interpreting information processing in
visual cognition.

109
References
Adamo, M. (2010). The nature of working memory: Separate, flexible resources for location- vs.
feature-based representations in visual short-term memory. (Unpublished doctoral
dissertation). University of Toronto, Toronto, Ontario, Canada.
Al-Aidroos, N. (2010). On the Reflexive Prioritisation of
Locations in Visual Space (Unpublished doctoral dissertation). University of Toronto,
Toronto, Ontario, Canada.
Alvarez, G. A., & Cavanagh, P. (2004). The capacity of visual short-term memory is set both by
visual information load and by number of objects. Psychological Science, 15(2), 106-111.
Andriessen, J. J., & Bouma, H. (1976). Eccentric vision: adverse interactions between line
segments. Vision Research, 16(1), 71-78.
Awh, E., Barton, B., & Vogel, E. K. (2007). Visual working memory represents a fixed number
of items regardless of complexity. Psychological Science, 18(7), 622-628.
doi:10.1111/j.1467-9280.2007.01949.x
Baddeley, A. D., & Hitch, G. J. (1974). Working memory. In G. H. Bower (Ed.), The Psychology
of Learning and Motivation (Vol. 8, pp. 47-89). New York: Academic Press.
Bahcall, D. O., & Kowler, E. (1999). Attentional interference at small spatial separations. Vision
Research, 39(1), 71-86.
Barton, B., Ester, E. F., & Awh, E. (2009). Discrete resource allocation in visual working
memory. Journal of Experimental Psychology. Human Perception and Performance,
35(5), 1359-1367. doi:10.1037/a0015792

110
Bays, P. M., Catalao, R. F. G., & Husain, M. (2009). The precision of visual working memory is
set by allocation of a shared resource. Journal of Vision, 9(10), 7.1-11.
doi:10.1167/9.10.7
Bays, P. M., & Husain, M. (2008). Dynamic shifts of limited working memory resources in
human vision. Science, 321(5890), 851-854. doi:10.1126/science.1158023
Bays, P. M., & Husain, M. (2009). Response to Comment on “Dynamic Shifts of Limited
Working Memory Resources in Human Vision.” Science, 323(5916), 877.
doi:10.1126/science.1166794
Bays, P. M., Wu, E. Y., & Husain, M. (2010). Storage and binding of object features in visual
working memory. Neuropsychologia. doi:10.1016/j.neuropsychologia.2010.12.023
Beck, D. M., & Kastner, S. (2007). Stimulus similarity modulates competitive interactions in
human visual cortex. Journal of Vision, 7(2), 19.1-12. doi:10.1167/7.2.19
Brainard, D. H. (1997). The Psychophysics Toolbox. Spatial Vision, 10(4), 433-436.
Bundesen, C. (1990). A theory of visual attention. Psychological Review, 97(4), 523–547.
Chelazzi, L., Duncan, J., Miller, E. K., & Desimone, R. (1998). Responses of neurons in inferior
temporal cortex during memory-guided visual search. Journal of Neurophysiology, 80(6),
2918.
Chelazzi, L., Miller, E. K., Duncan, J., & Desimone, R. (1993). A neural basis for visual search
in inferior temporal cortex. Nature, 363(6427), 345–347.
Chelazzi, L., Miller, E. K., Duncan, J., & Desimone, R. (2001). Responses of neurons in
macaque area V4 during memory-guided visual search. Cerebral Cortex, 11(8), 761.

111
Corbetta, M., Kincade, J. M., Ollinger, J. M., McAvoy, M. P., & Shulman, G. L. (2000).
Voluntary orienting is dissociated from target detection in human posterior parietal
cortex. Nature Neuroscience, 3, 292–297.
Corbetta, M., & Shulman, G. L. (2002). Control of goal-directed and stimulus-driven attention in
the brain. Nature Reviews Neuroscience, 3(3), 215–229.
Cowan, N. (2001). The magical number 4 in short-term memory: a reconsideration of mental
storage capacity. The Behavioral and Brain Sciences, 24(1), 87-114; discussion 114-185.
Cowan, N., & Rouder, J. N. (2009). Comment on “Dynamic shifts of limited working memory
resources in human vision.” Science (New York, N.Y.), 323(5916), 877; author reply 877.
doi:10.1126/science.1166478
Desimone, R., & Duncan, J. (1995). Neural mechanisms of selective visual attention. Annual
Review of Neuroscience, 18(1), 193–222.
Druzgal, T. J., & D'Esposito, M. (2003). Dissecting contributions of prefrontal cortex and
fusiform face area to face working memory. Journal of Cognitive Neuroscience, 15(6),
771-784. doi:10.1162/089892903322370708
Duncan, J. (1980). The locus of interference in the perception of simultaneous stimuli.
Psychological Review, 87(3), 272-300.
Duncan, J. (1984). Selective attention and the organization of visual information. Journal of
Experimental Psychology. General, 113(4), 501-517.
Duncan, J., & Humphreys, G. W. (1989). Visual search and stimulus similarity. Psychological
Review, 96(3), 433-58.
Eimer, M. (1996). The N2pc component as an indicator of attentional selectivity.
Electroencephalography and Clinical Neurophysiology, 99(3), 225–234.

112
Emrich, S. M., Ruppel, J. D. N., Al-Aidroos, N., Pratt, J., & Ferber, S. (2008). Out with the old:
inhibition of old items in a preview search is limited. Perception & Psychophysics, 70(8),
1552-1557. doi:10.3758/PP.70.8.1552
Emrich, S. M., Al-Aidroos, N., Pratt, J., & Ferber, S. (2009). Visual Search Elicits the
Electrophysiological Marker of Visual Working Memory. PLoS ONE, 4(11), e8042.
doi:10.1371/journal.pone.0008042
Folk, C. L., Remington, R. W., & Johnston, J. C. (1992). Involuntary covert orienting is
contingent on attentional control settings. Journal of Experimental Psychology. Human
Perception and Performance, 18(4), 1030-1044.
Fougnie, D., Asplund, C. L., & Marois, R. (2010). What are the units of storage in visual
working memory? Journal of Vision, 10(12), 27. doi:10.1167/10.12.27
Franconeri, S. L., Jonathan, S. V., & Scimeca, J. M. (2010). Tracking multiple objects is limited
only by object spacing, not by speed, time, or capacity. Psychological Science, 21(7),
920-925. doi:10.1177/0956797610373935
Fukuda, K., Awh, E., & Vogel, E. K. (2010). Discrete capacity limits in visual working memory.
Current Opinion in Neurobiology, 20(2), 177-182. doi:10.1016/j.conb.2010.03.005
Fukuda, K., & Vogel, E. K. (2009). Human variation in overriding attentional capture. The
Journal of Neuroscience: The Official Journal of the Society for Neuroscience, 29(27),
8726-8733. doi:10.1523/JNEUROSCI.2145-09.2009
Fuster, J. M., & Alexander, G. E. (1971). Neuron activity related to short-term memory. Science,
173(3997), 652.

113
Fuster, J. M., & Jervey, J. P. (1981). Inferotemporal neurons distinguish and retain behaviorally
relevant features of visual stimuli. Science (New York, N.Y.), 212(4497), 952-955.
Fuster, J. M., & Jervey, J. P. (1982). Neuronal firing in the inferotemporal cortex of the monkey
in a visual memory task. The Journal of Neuroscience: The Official Journal of the
Society for Neuroscience, 2(3), 361-375.
Geng, J. J., Eger, E., Ruff, C. C., Kristjánsson, A., Rotshtein, P., & Driver, J. (2006). On-line
attentional selection from competing stimuli in opposite visual fields: effects on human
visual cortex and control processes. Journal of Neurophysiology, 96(5), 2601-2612.
doi:10.1152/jn.01245.2005
Ghose, G. M., & Maunsell, J. H. R. (2008). Spatial summation can explain the attentional
modulation of neuronal responses to multiple stimuli in area V4. The Journal of
Neuroscience: The Official Journal of the Society for Neuroscience, 28(19), 5115-5126.
doi:10.1523/JNEUROSCI.0138-08.2008
Griffin, I. C., & Nobre, A. C. (2003). Orienting attention to locations in internal representations.
Journal of cognitive neuroscience, 15(8), 1176-94.
Harrison, S. A., & Tong, F. (2009). Decoding reveals the contents of visual working memory in
early visual areas. Nature, 458(7238), 632-635. doi:10.1038/nature07832
Hilimire, M. R., Mounts, J. R. W., Parks, N. A., & Corballis, P. M. (2009). Competitive
interaction degrades target selection: an ERP study. Psychophysiology, 46(5), 1080-1089.
doi:10.1111/j.1469-8986.2009.00846.x
Hilimire, M. R., Mounts, J. R. W., Parks, N. A., & Corballis, P. M. (2010). Event-related
potentials dissociate effects of salience and space in biased competition for visual
representation. PloS One, 5(9). doi:10.1371/journal.pone.0012677

114
Hopf, J. M., Boelmans, K., Schoenfeld, M. A., Luck, S. J., & Heinze, H. J. (2004). Attention to
features precedes attention to locations in visual search: evidence from electromagnetic
brain responses in humans. The Journal of Neuroscience: The Official Journal of the
Society for Neuroscience, 24(8), 1822-1832. doi:10.1523/JNEUROSCI.3564-03.2004
Hopf, J. M., Luck, S. J., Girelli, M., Hagner, T., Mangun, G. R., Scheich, H., & Heinze, H. J.
(2000). Neural sources of focused attention in visual search. Cerebral Cortex (New York,
N.Y.: 1991), 10(12), 1233-1241.
Huang, L. (2010). Visual working memory is better characterized as a distributed resource rather
than discrete slots. Journal of Vision, 10(14), 8. doi:10.1167/10.14.8
Ihssen, N., Linden, D. E. J., & Shapiro, K. L. (2010). Improving visual short-term memory by
sequencing the stimulus array. Psychonomic Bulletin & Review, 17(5), 680-686.
doi:10.3758/PBR.17.5.680
Irwin, D. E., & Thomas, L. E. (2008). Visual sensory memory. In S. J. Luck & A. Hollingworth
(Eds.), Visual Memory (pp. 9-41). New York: Oxford University Press US.
Jiang, Y. V., Chun, M. M., & Olson, I. R. (2004). Perceptual grouping in change detection.
Perception & Psychophysics, 66(3), 446-453.
Jiang, Y. V., Olson, I. R., & Chun, M. M. (2000). Organization of visual short-term memory.
Journal of Experimental Psychology. Learning, Memory, and Cognition, 26(3), 683-702.
Johnson, J. S., Spencer, J. P., Luck, S. J., & Schöner, G. (2009). A dynamic neural field model of
visual working memory and change detection. Psychological Science, 20(5), 568-577.
doi:10.1111/j.1467-9280.2009.02329.x

115
Kapadia, M. K., Ito, M., Gilbert, C. D., & Westheimer, G. (1995). Improvement in visual
sensitivity by changes in local context: parallel studies in human observers and in V1 of
alert monkeys. Neuron, 15(4), 843-856.
Kapadia, M. K., Westheimer, G., & Gilbert, C. D. (1999). Dynamics of spatial summation in
primary visual cortex of alert monkeys. Proceedings of the National Academy of Sciences
of the United States of America, 96(21), 12073-12078.
Kastner, S., De Weerd, P., Desimone, R., & Ungerleider, L. G. (1998). Mechanisms of directed
attention in the human extrastriate cortex as revealed by functional MRI. Science (New
York, N.Y.), 282(5386), 108-111.
Kastner, S., De Weerd, P., Pinsk, M. A., Elizondo, M. I., Desimone, R., & Ungerleider, L. G.
(2001). Modulation of sensory suppression: implications for receptive field sizes in the
human visual cortex. Journal of Neurophysiology, 86(3), 1398-1411.
Kastner, S., & Ungerleider, L. G. (2001). The neural basis of biased competition in human visual
cortex. Neuropsychologia, 39(12), 1263-1276.
Kleiner, M., Brainard, D. H., Pelli, D., Ingling, A., Murray, R., & Broussard, C. (2007). What’s
new in Psychtoolbox-3. Perception, 36.
Levi, D. M. (2008). Crowding - an essential bottleneck for object recognition: a mini-review.
Vision research, 48(5), 635-654. doi:10.1016/j.visres.2007.12.009
Lin, P.-H., & Luck, S. J. (2009). The Influence of Similarity on Visual Working Memory
Representations. Visual Cognition, 17(3), 356-372. doi:10.1080/13506280701766313
Louie, E. G., Bressler, D. W., & Whitney, D. (2007). Holistic crowding: selective interference
between configural representations of faces in crowded scenes. Journal of Vision, 7(2),
24.1-11. doi:10.1167/7.2.24

116
Luck, S. J., & Hillyard, S. A. (1994a). Electrophysiological correlates of feature analysis during
visual search. Psychophysiology, 31(3), 291-308.
Luck, S. J., & Hillyard, S. A. (1994b). Spatial filtering during visual search: evidence from
human electrophysiology. Journal of Experimental Psychology. Human Perception and
Performance, 20(5), 1000-1014.
Luck, S. J., & Vogel, E. K. (1997). The capacity of visual working memory for features and
conjunctions. Nature, 390(6657), 279-281. doi:10.1038/36846
Magen, H., Emmanouil, T., McMains, S. A., Kastner, S., & Treisman, A. (2009). Attentional
demands predict short-term memory load response in posterior parietal cortex.
Neuropsychologia, 47(8-9), 1790-1798. doi:10.1016/j.neuropsychologia.2009.02.015
Makovski, T., Sussman, R., & Jiang, Y. V. (2008). Orienting attention in visual working memory
reduces interference from memory probes. Journal of experimental psychology, 34(2),
369-80.
Marois, R., & Ivanoff, J. (2005). Capacity limits of information processing in the brain. Trends
in Cognitive Sciences, 9(6), 296–305.
Mathôt, S., Hickey, C., & Theeuwes, J. (2010). From reorienting of attention to biased
competition: evidence from hemifield effects. Attention, Perception & Psychophysics,
72(3), 651-657. doi:10.3758/APP.72.3.651
McCarley, J. S., & Mounts, J. R. W. (2007). Localized attentional interference affects object
individuation, not feature detection. Perception, 36(1), 17-32.
McCarley, J. S., & Mounts, J. R. W. (2008). On the relationship between flanker interference and
localized attentional interference. Acta Psychologica, 128(1), 102-109.
doi:10.1016/j.actpsy.2007.10.005

117
McCarley, J. S., Mounts, J. R. W., & Kramer, A. F. (2004). Age-related differences in localized
attentional interference. Psychology and Aging, 19(1), 203-210. doi:10.1037/0882-
7974.19.1.203
McCollough, A. W., Machizawa, M. G., & Vogel, E. K. (2007). Electrophysiological measures
of maintaining representations in visual working memory. Cortex, 43(1), 77-94.
McNab, F., & Klingberg, T. (2008). Prefrontal cortex and basal ganglia control access to
working memory. Nature Neuroscience, 11(1), 103–108.
Mitchell, D. J., & Cusack, R. (2008). Flexible, capacity-limited activity of posterior parietal
cortex in perceptual as well as visual short-term memory tasks. Cerebral Cortex, 18(8),
1788-98.
Miyashita, Y., & Chang, H. S. (1988). Neuronal correlate of pictorial short-term memory in the
primate temporal cortex. Nature, 331(6151), 68-70. doi:10.1038/331068a0
Mounts, J. R. W. (2000). Evidence for suppressive mechanisms in attentional selection: feature
singletons produce inhibitory surrounds. Perception & Psychophysics, 62(5), 969-983.
Mounts, J. R. W., & Gavett, B. E. (2004). The role of salience in localized attentional
interference. Vision Research, 44(13), 1575-1588. doi:10.1016/j.visres.2004.01.015
Mounts, J. R. W., McCarley, J. S., & Terech, A. M. (2007). Attentional templates regulate
competitive interactions among attended visual objects. Perception & Psychophysics,
69(2), 209-217.
Movshon, J. A., Thompson, I. D., & Tolhurst, D. J. (1978). Spatial summation in the receptive
fields of simple cells in the cat's striate cortex. The Journal of Physiology, 283, 53-77.
Nakamura, K., & Kubota, K. (1995). Mnemonic firing of neurons in the monkey temporal pole
during a visual recognition memory task. Journal of Neurophysiology, 74(1), 162-178.

118
Nandy, A. S., & Tjan, B. S. (2007). The nature of letter crowding as revealed by first- and
second-order classification images. Journal of Vision, 7(2), 5.1-26. doi:10.1167/7.2.5
Nasr, S., Moeeny, A., & Esteky, H. (2008). Neural correlate of filtering of irrelevant information
from visual working memory. PloS One, 3(9), e3282. doi:10.1371/journal.pone.0003282
Pashler, H. (1988). Familiarity and visual change detection. Perception & Psychophysics, 44(4),
369–378.
Phillips, W. A. (1974). On the distinction between sensory storage and short-term visual
memory. Perception & Psychophysics, 16(2), 283–290.
Posner, M. I., & Cohen, Y. (1984). Components of visual orienting. Attention and performance
X: Control of language processes, 32, 531–556.
Posner, M. I., Walker, J. A., Friedrich, F. J., & Rafal, R. D. (1984). Effects of parietal injury on
covert orienting of attention. Journal of Neuroscience, 4(7), 1863.
Postle, B. R. (2006). Working memory as an emergent property of the mind and brain.
Neuroscience, 139(1), 23–38.
Postle, B. R., Berger, J. S., & D'Esposito, M. (1999). Functional neuroanatomical double
dissociation of mnemonic and executive control processes contributing to working
memory performance. Proceedings of the National Academy of Sciences of the United
States of America, 96(22), 12959-12964.
Postle, B. R., Druzgal, T. J., & D'Esposito, M. (2003). Seeking the neural substrates of visual
working memory storage. Cortex; a Journal Devoted to the Study of the Nervous System
and Behavior, 39(4-5), 927-946.

119
Schmidt, B. K., Vogel, E. K., Woodman, G. F., & Luck, S. J. (2002). Voluntazy and automatic
attentional control of visual working memory. Perception & Psychophysics, 64(5), 754-
763.
Serences, J. T., Ester, E. F., Vogel, E. K., & Awh, E. (2009). Stimulus-specific delay activity in
human primary visual cortex. Psychological Science, 20(2), 207-214. doi:10.1111/j.1467-
9280.2009.02276.x
Shulman, G. L., d'Avossa, G., Tansy, A. P., & Corbetta, M. (2002). Two attentional processes in
the parietal lobe. Cerebral Cortex, 12(11), 1124.
Sligte, I. G., Scholte, H. S., & Lamme, V. A. F. (2008). Are there multiple visual short-term
memory stores? PloS One, 3(2), e1699. doi:10.1371/journal.pone.0001699
Sligte, I. G., Vandenbroucke, A. R. E., Scholte, H. S., & Lamme, V. A. F. (2011). Detailed
sensory memory, sloppy working memory. Frontiers in Psychology, 1(0), 12.
doi:10.3389/fpsyg.2010.00175
Soto, D., Heinke, D., Humphreys, G. W., & Blanco, M. J. (2005). Early, involuntary top-down
guidance of attention from working memory. Journal of Experimental Psychology:
Human Perception and Performance, 31, 248–261.
Soto, D., Humphreys, G. W., & Rotshtein, P. (2007). Dissociating the neural mechanisms of
memory-based guidance of visual selection. Proceedings of the National Academy of
Sciences, 104(43), 17186.
Sperling, G. (1960). The information available in brief visual presentations. Psychological
Monographs: General and Applied, 741, 1–29.
Todd, J. J., & Marois, R. (2004). Capacity limit of visual short-term memory in human posterior
parietal cortex. Nature, 428(6984), 751-754. doi:10.1038/nature02466

120
Todd, J. J., & Marois, R. (2005). Posterior parietal cortex activity predicts individual differences
in visual short-term memory capacity. Cognitive, Affective, and Behavioral
Neuroscience, 5, 144–155.
Toet, A., & Levi, D. M. (1992). The two-dimensional shape of spatial interaction zones in the
parafovea. Vision Research, 32(7), 1349-1357.
Umemoto, A., Drew, T., Ester, E. F., & Awh, E. (2010). A bilateral advantage for storage in
visual working memory. Cognition, 117(1), 69-79. doi:10.1016/j.cognition.2010.07.001
Vogel, E. K., & Machizawa, M. G. (2004). Neural activity predicts individual differences in
visual working memory capacity. Nature, 428(6984), 748-751. doi:10.1038/nature02447
Vogel, E. K., McCollough, A. W., & Machizawa, M. G. (2005). Neural measures reveal
individual differences in controlling access to working memory. Nature, 438(7067), 500-
503. doi:10.1038/nature04171
Vogel, E. K., Woodman, G. F., & Luck, S. J. (2001). Storage of features, conjunctions and
objects in visual working memory. Journal of Experimental Psychology. Human
Perception and Performance, 27(1), 92-114.
Vogel, E. K., Woodman, G. F., & Luck, S. J. (2006). The time course of consolidation in visual
working memory. Journal of Experimental Psychology. Human Perception and
Performance, 32(6), 1436-1451. doi:10.1037/0096-1523.32.6.1436
Wilken, P., & Ma, W. J. (2004). A detection theory account of change detection. Journal of
Vision, 4(12), 1120-1135. doi:10:1167/4.12.11
Woodman, G. F., Arita, J. T., & Luck, S. J. (2009). A cuing study of the N2pc component: an
index of attentional deployment to objects rather than spatial locations. Brain Research,
1297, 101-111. doi:10.1016/j.brainres.2009.08.011

121
Xu, Y. (2007). The role of the superior intraparietal sulcus in supporting visual short-term
memory for multifeature objects. Journal of Neuroscience, 27(43), 11676-11686.
Xu, Y., & Chun, M. M. (2006). Dissociable neural mechanisms supporting visual short-term
memory for objects. Nature, 440(7080), 91-95. doi:10.1038/nature04262
Xu, Y., & Chun, M. M. (2009). Selecting and perceiving multiple visual objects. Trends in
Cognitive Sciences, 13(4), 167–174.
Yantis, S., & Johnson, D. N. (1990). Mechanisms of attentional priority. Journal of Experimental
Psychology. Human Perception and Performance, 16(4), 812-825.
Zhang, W., & Luck, S. J. (2008). Discrete fixed-resolution representations in visual working
memory. Nature, 453(7192), 233-235. doi:10.1038/nature06860
Zhang, W., & Luck, S. J. (2009). Sudden Death and Gradual Decay in Visual Working Memory.
Psychological Science, 20(4), 423-428. doi:10.1111/j.1467-9280.2009.02322.x