Embed Size (px)
Citation preview

Full Terms & Conditions of access and use can be found athttp://www.tandfonline.com/action/journalInformation?journalCode=raec20
Download by: [University of Pireaus] Date: 04 May 2016, At: 07:33
Applied Economics
ISSN: 0003-6846 (Print) 1466-4283 (Online) Journal homepage: http://www.tandfonline.com/loi/raec20
Competition and efficiency in the MENA bankingregion: a non-structural DEA approach
Nicholas Apergis & Michael L. Polemis
To cite this article: Nicholas Apergis & Michael L. Polemis (2016): Competition and efficiencyin the MENA banking region: a non-structural DEA approach, Applied Economics, DOI:10.1080/00036846.2016.1176112
To link to this article: http://dx.doi.org/10.1080/00036846.2016.1176112
Published online: 28 Apr 2016.
Submit your article to this journal
Article views: 9
View related articles
View Crossmark data

Competition and efficiency in the MENA banking region: a non-structural DEAapproachNicholas Apergisa and Michael L. Polemisb
aDepartment of Banking and Financial Management, University of Piraeus, Piraeus, Greece; bDepartment of Economics, University of Piraeus,Piraeus, Greece
ABSTRACTThe goal of this article is to empirically assess the relationship between competition andefficiency in the banking sector of Middle East and North African (MENA) countries spanningthe period 1997–2011. To measure the level of competition, the article estimates the non-structural indicator known as the H-statistic, while the level of bank efficiency is estimatedthrough the nonparametric methodology of the Data Envelopment Analysis (DEA) and theBootstrap Data Envelopment Analysis (BDEA), respectively. The empirical results are robustunder six econometric methodologies, providing sufficient evidence for the presence of a one-way (negative) Granger causality, running from efficiency to competition. The empirical findingslead to the rejection of the ‘Efficient Structure Hypothesis’, implying that increases in competitiondo not precede increases in cost efficiency.
KEYWORDSMENA countries; Panzar andRosse index; competition;DEA; efficiency
JEL CLASSIFICATIONL10; L13; C23
I. Introduction
There is a consensus among economists and policy-makers that competition aims at improving alloca-tive and productive efficiency and boosting interna-tional competitiveness (Casu and Girardone 2006).The issue as whether competition stimulates alloca-tive and productive efficiency is not new(Leibenstein 1966; Winter 1984; Nickell 1999).From a theoretical point of view, competitioninduces reductions in prices and mark-ups overcosts, leading to higher social welfare and protectingconsumers from the abuse of monopoly power bythe incumbents (Tirole 1998). However, in the bank-ing industry which is characterized by highleverages, significant sunk costs and excessive risks,the role of competition in promoting efficiency isless profound (Schaeck and Cihak 2008). More spe-cifically, a concentrated banking system, consistingof few and large banks, is easier to monitor andthose large market players are usually better diversi-fied. On the other hand, large banking institutionsare also more prone to take risks, as in case ofdistress, and they are likely to receive more subsidies(‘too big to fail’ argument).
The complex relationship between competitionand efficiency in the banking industry is also evidentduring a financial crisis. Specifically, over the lastyears, increased competitive pressures inducedmany European banks to improve their efficiencyand productivity levels. Moreover, during the con-solidation process, weaker and poorly managedbanks were acquired by stronger players, whichimproved the efficiency of the entire banking systemand contributing to its further resilience (Casu andGirardone 2006). By contrast, countries with a frag-mented banking sector have experienced manyliquidity problems and public intervention has beennecessary to prevent the risk of a bailout.
The goal of this article is to empirically assess therelationship between competition and efficiency inthe banking sector in the case of Middle East andNorth African (MENA) countries. The analysisemploys the estimation of a non-structural indicator,namely the H-statistic, put forward by Panzar andRosse (1987) and drawing upon a comprehensivedata set of MENA commercial banks, spanning theperiod 1997–2011. The novelties of the article aretwofold. First, it goes beyond the current literaturein that it uses a non-structural indicator (H-statistic)
CONTACT Michael L. Polemis [email protected] Department of Economics, University of Piraeus, 80 Karaoli and Dimitriou Street, 185 34, Piraeus,Greece
APPLIED ECONOMICS, 2016http://dx.doi.org/10.1080/00036846.2016.1176112
© 2016 Informa UK Limited, trading as Taylor & Francis Group
Dow
nloa
ded
by [
Uni
vers
ity o
f Pi
reau
s] a
t 07:
34 0
4 M
ay 2
016

to assess the level of competition in the MENAcountries, an issue not adequately considered bythe current literature, and, second, unlike previousstudies, it attempts to investigate the relationshipbetween the competition and the level of bankingefficiency in these countries through the causalitymethodology.
The primary reason the article focuses on theMENA region is that it provides a fertile groundfor analysing the effects of changes in the intensityof competition. In the late 1990s, MENA banks haveexperienced significant changes in their regulatoryenvironment in order to increase the stability of thebanking sector and to create a level playing field forcompetition across banks. These changes includedthe abolition of regulatory restrictions (i.e. ceilingson interest rates) and the implementation of priva-tization schemes which allowed many banks to oper-ate across all MENA member countries withstandardized procedures for acquiring licenses, capi-tal requirements and supervisory guidelines. Thesechanges in the regulatory environment seem to haveled to substantial ramifications for competitionacross MENA banks.
Given the challenges that the MENA countriesface, the empirical findings of this study are expectedto help policy-makers and government officials tobetter understand how their decisions affect bothmarket conduct performance and the stability offinancial institutions under their supervision.
The novel feature of the present article is that itprovides a framework for the joint estimation of costefficiency and competition on the individual bank-level by applying a nonparametric approach (i.e. theData Envelopment Analysis-DEA) to a sample ofMENA banks. To the best of our knowledge, this isthe first study investigating these issues in theMENA banking region.
Our findings support the current empirical litera-ture, providing sufficient evidence in favour ofmonopolistic competition industry regimes acrossall the MENA countries. However, the magnitudeof the competition level varies significantly acrossthe MENA region, by following a geographical pat-tern. Moreover, the average cost efficiency is rela-tively high and is characterized by the absence ofdiversification within the MENA countries. Weargue that the latter has a statistically significantnegative impact on banking competition.
The remainder of this article is structured asfollows: Section II reviews the literature, whileSection III discusses the data and the methodologiesapplied. Section IV illustrates and evaluates theresults of the empirical analysis and, finally, SectionV concludes the article along with some policyimplications.
II. Review of the literature
A number of empirical studies have investigated thecompetitive conditions in various banking systemsby applying the Panzar–Rosse H-statistic. Themajority of these studies conclude that banks operatein a monopolistic competitive environment (Shaffer2002; Claessens and Laeven 2004; Beck, Demirguc-Kunt, and Levine 2006; Mamatzakis, Staikouras,and Koutsomanoli-Fillipaki 2005; Gutierrez 2007;Polemis 2015), while European banks seem to beless competitive than US banks, with larger banksbeing more competitive than smaller banks(Gutierrez 2007).
Though there is an extensive literature using non-structural measures to assess competition in manydeveloped and in some developing countries, thereexists a limited number of studies that conduct thiskind of analysis for the MENA region. In particular,Murjan and Ruza (2002) investigate the degree ofcompetition over the period 1993–1997 in nineMENA countries. They argue that MENA bankingsectors operate under monopolistic competition. Al-Muharrami, Matthews, and Khabari (2006) andTurk-Ariss (2009) also conclude that the bankingsectors in these economies operate under monopo-listic competitive conditions.
Anzoategui, Martinez Peria, and Rocha (2010)study the extent of bank competition in the MENAregion over the period 1994–2008, using both theH-statistic and the Lerner indexes methodologies.Both of these measures suggest that banking sectorcompetition in the region is lower relative to otherregions, albeit it has not improved over the recentyears. Furthermore, they argue that indicators ofmarket contestability and activity restrictions areimportant factors in determining the degree of com-petition across countries in the region. Similarly,Polemis (2015), by estimating various measures ofcompetition (H-statistic, Lerner index, conductparameter) argues that banking sector in the
2 N. APERGIS AND M. L. POLEMIS
Dow
nloa
ded
by [
Uni
vers
ity o
f Pi
reau
s] a
t 07:
34 0
4 M
ay 2
016

MENA region is characterized by a low level ofSignificant Market Power (SMP).
Almarzoqi, Ben Naceur, and Scopelliti (2015)claim that price competition has a positive effecton bank liquidity, as it induces self-discipline incen-tives on banks for the choice of bank fundingsources and for the holding of liquid assets. On theother hand, they argue that competitive banks maybe less solvent if the potential increase in the equitybase is not large enough to compensate for thereduction in bank profitability.
By contrast, bank efficiency has been analysedextensively by many surveys.1 Regarding theMENA region, Ben Naceur, Khedhiri, and Casu(2011) examine the effect of financial-sector reformson banks’ performance in selected MENA countriesover the period 1994–2008. They use a meta-frontierapproach to calculate efficiency scores in a cross-country setting. Their analysis shows that despitesimilarities in the process of financial reformsundertaken in the MENA countries, the observedefficiency levels of banks vary substantially acrossmarkets, with Morocco consistently outperformingthe rest countries in the region.
In addition, the evaluation of the relationshipbetween competition and bank efficiency is rarelyfound in the MENA region and is mainly focusedon the European Union (EU) countries (Casu andGirardone 2006; Delis and Tsionas 2009; Andriesand Capraru 2014; Castellanos and García 2013).More specifically, Casu and Girardone (2006) inves-tigate the relationship between competition and effi-ciency in the banking sectors of five EU countries(i.e. France, Germany, Italy, Spain and the UnitedKingdom) over the period 2000–2005 using Grangercausality tests. Their findings indicate that anincrease in banks’ monopolistic power does nottranslate into a decrease in cost efficiency.Moreover, they highlight a positive causality betweenmarket power and efficiency levels, running fromefficiency to competition in a weak pattern, implyingthat increases in efficiency do not foster marketpower.
Delis and Tsionas (2009), by applying the localmaximum likelihood methodological approach,
investigate the relationship between the level of mar-ket power as measured by the Lerner index and costefficiency in a sample of European Monetary Union(EMU) countries over the period 1999–2006. Marketpower estimates indicate a fairly competitive con-duct; however, heterogeneity in market power esti-mates is substantial across banks. They also claimthat efficiency and market power are negativelyrelated, which is in line with the so-called ‘QuietLife Hypothesis’. According to this hypothesis,monopolistic power allows managers to enjoy ashare of the monopoly rents in the form of discre-tionary expenses or a reduction of their efforts, lead-ing to the presence of inefficiencies (Hicks 1935). Inother words, this hypothesis posits that banks enjoythe advantages of market power in terms of foregonerevenues or cost savings (Delis and Tsionas 2009).
Andries and Capraru (2014) explore the competi-tion in banking systems in the EU as a whole for theperiod 2004–2010, providing mixed results towardsthe QLH in terms of cost and profit efficiency.Furthermore, they find significant evidence towardsthe validity of the ‘Competition-InefficiencyHypothesis’, denoting that competition does notlead to a decline in bank efficiency. According tothis hypothesis, higher competition is likely to beassociated with less stable, shorter relationshipsbetween customers and banks, amplifying informa-tion asymmetries and requiring additional resourcesfor screening and monitoring borrowers, resulting incost inefficiencies.
Castellanos and García (2013) study the relation-ship between the degree of banking competition andthe efficiency of the Mexican banking sector over theperiod 2002–2012, by employing Tobit regressions.They use the DEA and the Boone indicator to assessthe degree of competition among other possibledeterminants of bank efficiency.2 Their main resultsindicate a positive direct relationship between bank-ing competition and efficiency. Finally, Eisazadehand Shaeri (2012) use both Stochastic FrontierAnalysis (SFA) and second-stage Tobit regressionsto investigate the impact of institutional and finan-cial factors on banking efficiency in the case of theMENA countries. They argue that the main drivers
1For an extensive review see Andries and Capraru (2014).2The Boone indicator is based on the efficient structure hypothesis that associates firms’ performance with differences in efficiency (Boone 2001, 2008). Thebasic motivation is that more efficient firms achieve superior performance in the sense of higher profits or higher market shares, while this effect isincreasing by the degree of competition (Schaeck and Cihak 2008).
APPLIED ECONOMICS 3
Dow
nloa
ded
by [
Uni
vers
ity o
f Pi
reau
s] a
t 07:
34 0
4 M
ay 2
016
of banking efficiency are related with the macroeco-nomic stability, the financial development and thedegree of market openness.
III. Data and methodology
This section is divided into four parts. The first sub-section briefly describes the sample selection alongwith the main descriptive statistics of the variablesused in our analysis. The second sub-section refersto the methodology applied in the estimation of theH-statistic, while the DEA is fully discussed in thethird part. In the last sub-section, we link the twomethodologies described above in order to performthe Granger causality testing and infer about thedirection of causality between the two main elements(i.e. competition and cost efficiency).
Descriptive statistics
Our data set is drawn from the BankScope database.Data are collected for a sample of 3255 observations,relative to annual information from unconsolidatedbank statements of a balanced panel of 217 commer-cial banks operating in Lebanon, Bahrain, Algeria,Egypt, Jordan, Israel, Morocco, Oman, Saudi Arabiaand United Arab Emirates (UAE), spanning theperiod 1997–2011. The choice of countries is dic-tated strictly by data availability.3 Moreover, we limitour analysis to publicly traded commercial bankssince the services they offer are reasonably homo-geneous and comparable across countries, while,they do follow international accounting standardsas well (Ben Naceur, Khedhiri, and Casu 2011).
Summary statistics for the variables along with thecross-section dimension of the panel per country areprovided in the Appendix (Table A1). From therelevant table, it is evident that the sample data arewell behaved showing limited variability in relationto the mean. On the other hand, the variables are notnormally distributed since the relative values of theskewness and kurtosis measures are not equal to 0and 3, respectively. Finally, regarding the input/out-put variables, one cannot fail to notice that whilethere are no substantial differences in term of costs,Lebanese banks are on average much bigger in abso-lute terms of both total income and net loans.
Measuring competition level
In the first stage, we estimate the H-statistic in eachof the MENA countries by employing the Panzarand Rosse’s (1987) methodology. This method hasbeen used widely in the empirical banking literatureand it builds a competition indicator, the so-calledH-statistic, which provides a quantitative assessmentof the competitive nature of a market (Polemis2015). The H-statistic is calculated by means ofreduced-form revenue equations and measures theelasticity of total revenues with respect to changes infactor input prices. Furthermore, Shaffer (1982)shows that H is negative for a conjectural variations’oligopolistic market or for a short-run competitivemarket; it is equal to 1 for a natural monopoly in acontestable market; or it is equal to zero for a firmthat maximizes sales subject to a breakeven con-straint. Owing to its relative simplicity, the Panzar–Rosse methodology has been extensively applied tothe banking sector, both in regional and in single-country studies (Molyneux, Lloyd-Williams, andThornton 1994; De Bandt and Philip Davis 2000;Bikker and Haaf 2002; Claessens and Laeven 2004).Bikker, Shaffer, and Spierdijk (2012) point out thatscaled revenues and price equations (including totalassets as a control variable) can lead to the over-estimation of the degree of competition in the bank-ing industry. In order to overcome this problem, weestimate the following unscaled revenue equation:
ln TIitð Þ ¼ aþ β1 ln X1;it
� �þ β2 ln X2;it
� �
þ β3 ln X3;it
� �þ γ1 ln Υ1;it� �
þ γ2 ln Υ2;it
� �þ γ3 ln Υ3;it
� �þ εit
(1)
where α and εit are the constant and the error term,respectively. The subscripts i and t denote the cross-section (number of banks) and the time dimensionelement, respectively. All the relevant variables are innatural logarithms. TIit is the total income (reven-ues), expressed as the sum of gross interest incomeplus other operating noninterest income. X1;it is theratio of interest expenses to total deposits andmoney market funding, as a proxy for the averagefunding rate, X2;it, is the ratio of personnel expensesto total assets, as an approximation of the wage rate,and X3;it is the ratio of other operating and admin-istrative expenses to total assets, as a proxy for the
3We excluded from our analysis two countries (Syrian Arab Republic and State of Libya) due to severe data constraints.
4 N. APERGIS AND M. L. POLEMIS
Dow
nloa
ded
by [
Uni
vers
ity o
f Pi
reau
s] a
t 07:
34 0
4 M
ay 2
016

price of physical capital. Moreover, Y1;it is the ratioof equity to total assets as a proxy for the leveragereflecting differences in the risk preferences acrossbanking institutions (Bikker, Shaffer, and Spierdijk2012), Y2;it is the ratio of net loans to total assets, asan approximation of the credit risk, and finally Y3;it
represents fixed assets to total banking assets as aproxy of the banking size. The sum of the three
elasticitiesP3
i¼1 βi� �
yields the H-statistic.
Measuring cost efficiency
In the second stage, we estimate the efficiency of thebanking systems through the methodology of a non-parametric ‘mathematical’ approach (DEA), origin-ally developed by Farrell (1957). In order to estimatebank efficiency, we use net loans (Output 1) andtotal income (Output 2) as outputs. The inputs inthe production process are fixed assets, as a proxyfor physical capital (Input 1), personnel expenses,as a proxy for labour (Input 2), and deposits andshort-term funding, as a proxy for financial capital(Input 3). The input-output selection is consistentwith the empirical banking literature (Webb 2003;Mamatzakis, Kalyvas, and Piesse 2013).
The DEA, given the data set, produces a frontierthat is optimal, while it represents the maximumoutput available for any Decision Making Unit(DMU) in the study, for its given inputs (Webb2003). Given that the nonparametric frontier esti-mation does not require the imposition of anyspecific production technology, this is a standardapproach in studies of transition and emergingeconomies, where assumptions of competitive mar-kets with cost-minimization may not be appropri-ate (Mamatzakis, Kalyvas, and Piesse 2013). For theabove reasons, we have decided to apply the DEAapproach.
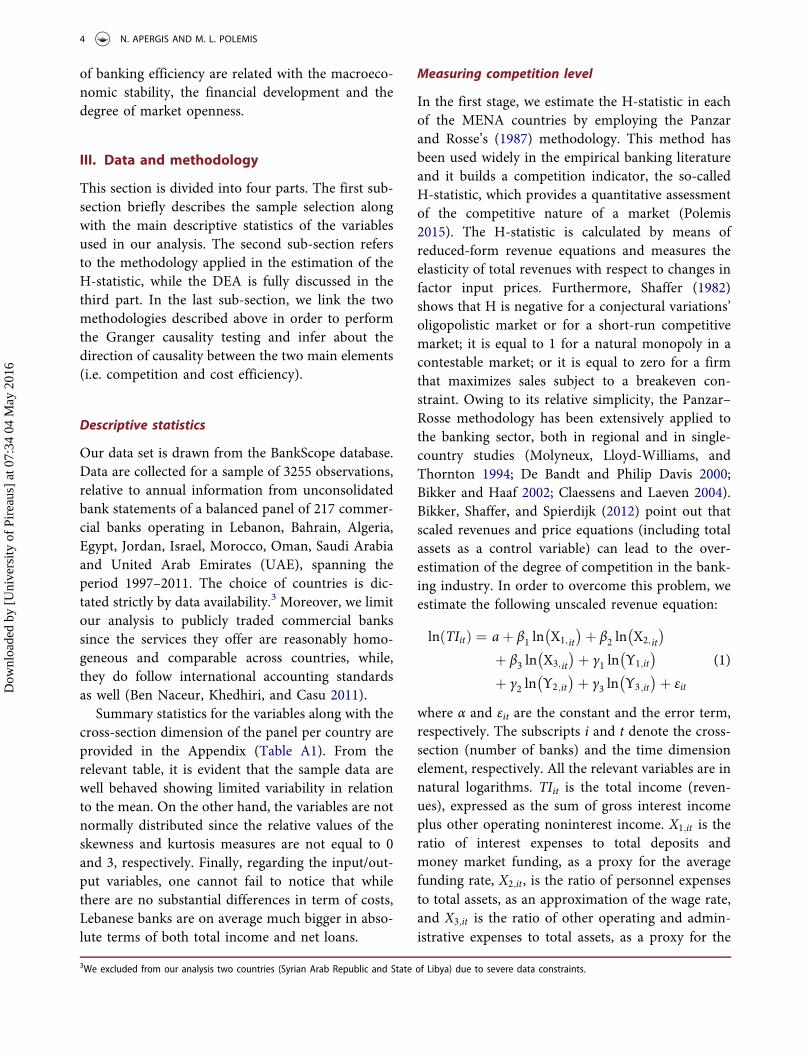
Following Charnes, Cooper, and Rhodes (1978),the input oriented measure of each bank under theconstant returns to scale (CRTS) assumptionrequires solving the following linear program:
minθ;λ θ;
Subject to�yi þ Yλ � 0;θxi � Xλ � 0;λ � 0
(2)
where θ � 1 is the scalar efficient score and l is anN × 1 vector of constant terms. The value of θobtained will be the efficiency score for the ithDMU (bank). If θ = 1, the bank is efficient as itlies on the frontier, whereas if θ < 1, the bank isinefficient and needs 1 – θ reduction in the inputlevels to reach the frontier (Mamatzakis, Kalyvas,and Piesse 2013). The linear programming is solvedN times, once for each bank in the sample, and avalue of θ is obtained for each bank representing itstechnical efficiency score (TES). It is important tonote that the CRTS assumption is only valid when allDMUs are operating at an optimal scale. However,this assumption is not realistic, since the bankingsector is characterized by imperfect competitionand certain financial constraints which lead manyDMUs (banks) not operating at an optimal scale.Alternatively, Banker, Charnes, and Cooper (1984)suggest an extension of the CRTS DEA model toaccount for variable returns to scale (VRS) situa-tions. In this specification, the CRTS problem ismodified to account for VRS by adding the convex-ity constraint N10λ ¼ 1 to Equation 2 in order toprovide
minθ;λ θ
Subject to
�yi þ Yλ � 0θxi � Xλ � 0N10λ ¼ 1λ � 0
(3)
where N1 is an N × 1 vector of units. By followingthis approach, a convex hull of intersecting planes isformed that envelopes the data points more tightlythan the CRTS conical hull and, thus, it providestechnical efficiency scores that are greater than orequal to those obtained using the CRTS model(Mamatzakis, Kalyvas, and Piesse 2013).
Testing for granger causality
Having estimated the efficient scores for each of thesample MENA countries, we then use a vectorAutoregressive Distributed Lag (ADL) model speci-fication with two lags in order to assess the directionof the relationship between competition and effi-ciency. This method has been widely used in theempirical literature (Berger and Humphrey 1997;Casu and Girardone 2006; Andries and Capraru
APPLIED ECONOMICS 5
Dow
nloa
ded
by [
Uni
vers
ity o
f Pi
reau
s] a
t 07:
34 0
4 M
ay 2
016

2014), while its main benefit is that it permits exam-ining the intertemporal relationship between compe-tition and efficiency (Schaeck and Cihak 2008).
In order to assess the magnitude and the directionof the Granger causality relationships between bankefficiency and the level of competition, we estimatethe following equations:
Hjt ¼ a0 þ a1Hj;t�1 þ a2Hj;t�2 þ β1DEAj;t�1
þ β2DEAj;t�2 þ ηit þ εit (4)
DEAij ¼ a0 þ a1DEAj;t�1 þ a2DEAj;t�2
þ β1Hj;t�1 þ β2Hj;t�2 þ ηit þ εit (5)
where a0 is the intercept, αj and βi are parameters tobe estimated, ηit is an individual bank specific effectand εit is a disturbance term. Hjt represents themeasure of competition index (H-statistic) in coun-try j in year t, and DEAjt, is the level of cost effi-ciency in country j in year t.4 The latter is estimatedusing the nonparametric DEA as described in theprevious section. We use two annual lags in thebaseline setup of our models in order to avoid drop-ping a vast amount of information by using largerlags (Schaeck and Cihak 2008).
To this end, we employ an array of econometricmethodologies to infer about the robustness of ourresults. First, we assess the relationship between com-petition and efficiency by using panel OLS methodol-ogy. However, there is a potential endogeneityissue regarding the use of the control variables.Endogeneity can be a problem because, if unobservedvariables jointly affect both the dependent and controlvariables, then the coefficient estimates for the inde-pendent variables may be biased (Hausman and Ros2013). In order to overcome this problem, we includethe GLS fixed and random effects estimators thatallow, among other things, the unobserved country-specific factors to be filtered out. We must stress thatthe use of the fixed effects specification is justifiedafter a Hausman test for each model.
To check out for the robustness of our findings, were-estimate the equations described above by employ-ing a GMM estimator that controls for the endogene-ity problem. To this end, we utilize a GMM estimatordeveloped by Hansen (1982). This estimator takesinto account the unobserved time-invariant bilateralspecific effects, while it can deal with the potential
endogeneity arising from the inclusion of several con-trol variables. In order to check for the robustness ofour findings and allow for dynamic effects, we addtime leads and lags to all variables as instruments tothe GMM two-step procedure. Models (4) and (5) areestimated through two dynamic GMM estimatorsdeveloped by Arellano and Bond (1991) andBlundell and Bond (1998), respectively. The formeris also known as a two-step difference GMM (DIF-GMM) estimator, where the lagged levels of theregressors are instruments for the equations in firstdifferences, while the latter (System GMM) combinesthe regression expressed in first differences with theoriginal equation expressed in levels and allows us toinclude some additional instrument variables (SYS-GMM). It is worth emphasizing that this estimatorwas designed to overcome some of the limitations ofthe DIF-GMM (Casu and Girardone 2006). In prin-cipal, GMM estimation deals with the dynamic panelbias that arises when the lagged dependent variablemay be correlated with the error term even when thebanking fixed effects are wiped out by first-differen-cing (Cambini and Rondi 2010). It is noteworthy thatboth estimators take into account the unobservedtime-invariant bilateral specific effects, while theycan deal with the potential endogeneity arising fromthe inclusion of the lagged dependent variable andother potentially endogenous variables (Sharma andMishra 2011).
In the model described in the above equations,the joint null β1 = β2 = 0 is interpreted as a paneldata test for Granger causality. If the two annual lagsare significant, we can predict that competitionGranger causes efficiency, in the sense of changesin competition preceding changes in efficiency(Andries and Capraru 2014). The sign of the causalrelationship is determined by the sum of the jointlysignificant coefficients. A positive and statisticallysignificant sum of the coefficients β1 and β2 can beinterpreted as evidence of the validity of the ‘EfficientStructure Hypothesis’ (Schaeck and Cihak 2008).
IV. Empirical results
This section reports the results of our analysis. In thefirst part, we report the estimated values of theH-statistic in each country within the MENA region
4We have used the country mean for all of the banks selected in the sample.
6 N. APERGIS AND M. L. POLEMIS
Dow
nloa
ded
by [
Uni
vers
ity o
f Pi
reau
s] a
t 07:
34 0
4 M
ay 2
016

based on the non-structural Panzar and Rosse (1987)methodology described above. The second sub-sec-tion, gives the efficiency cost scores for each MENAcountry generated by applying the DEA. Finally, thethird part, reports the magnitude and the directionof causality between competition and efficiency inMENA region.
Competition level estimates
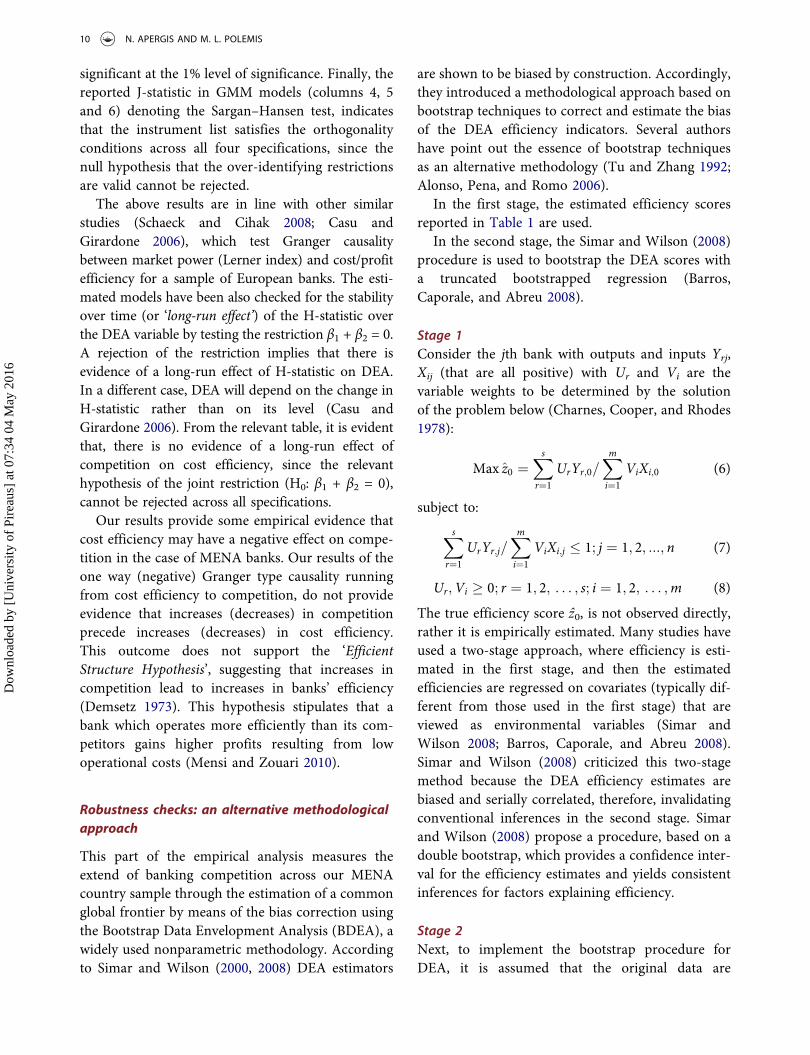
Table 1 reports the estimation results. It is evidentthat the H-statistic is less than one across all of theselected MENA countries, indicating that monopolis-tic competition is the appropriate market structure inthe MENA region. It is important to note that similarfindings can be traced in previous empirical studies,confirming the presence of monopolistic competitionin the MENA banking region (Murjan and Ruza2002; Al-Muharrami, Matthews, and Khabari 2006;Turk-Ariss 2009; Anzoategui, Martinez Peria, andRocha 2010).
The results presented in Table 1 document thepresence of inequalities in the level of competitionamong the banking sectors of the MENA region. Theaverage value of the H-statistic ranges from 0.536 inBahrain to 0.778 in Israel. It is worth mentioning thatsome geographic clusters emerge in terms of the levelof banking competition in the MENA region. Morespecifically, countries located in the Northern MiddleEastern states (i.e. Lebanon, Jordan and Israel) havethe highest H-statistic, ranging from 0.658 to 0.778;the Northern Western African countries (i.e. Algeriaand Morocco) are characterized by medium competi-tion levels (0.644 and 0.632, respectively), while theSouthern Middle Eastern states (i.e. Bahrain, Oman,Saudi Arabia and UAE) have the lowest competitionlevels (from 0.536 for Bahrain to 0.592 for UAE). Thefinding of monopolistic competition can be traced insimilar studies (Molyneux, Lloyd-Williams, andThornton 1994; De Bandt and Philip Davis 2000;Bikker and Haaf 2002; Claessens and Laeven 2004;Staikouras and Koutsomanoli-Fillipaki 2006; Yildirimand Philippatos 2007; Delis and Tsionas 2009).
Efficiency estimates
DEA estimates of the country frontiers and themeta-frontier are obtained using the DEAP 2.1 pro-gramme (Coelli 1996). All results are obtained using Ta
ble1.
DEA
efficiencyscores
andtheH-statistic
perMEN
Acoun
try.
Year
Lebano
nBahrain
Algeria
Egypt
Israel
Jordan
Morocco
Oman
Saud
iArabia
UAE
DEA
H-statistic
DEA
H-statistic
DEA
H-statistic
DEA
H-statistic
DEA
H-statistic
DEA
H-statistic
DEA
H-statistic
DEA
H-statistic
DEA
H-statistic
DEA
H-statistic
1997
0.738
0.650
0.904
0.458
0.901
0.648
0.932
0.744
0.967
0.785
0.845
0.658
0.894
0.887
0.991
0.456
0.957
0.654
0.958
0.515
1998
0.729
0.623
0.991
0.587
0.944
0.549
0.946
0.682
0.845
0.779
0.823
0.458
0.821
0.857
1.000
0.459
0.962
0.554
0.967
0.592
1999
0.844
0.698
0.985
0.548
0.944
0.547
0.911
0.610
0.929
0.757
0.838
0.589
0.845
0.814
0.979
0.558
0.961
0.485
0.932
0.534
2000
0.827
0.570
0.975
0.515
0.968
0.621
0.916
0.664
0.920
0.761
0.875
0.698
0.795
0.879
0.986
0.586
0.958
0.587
0.932
0.652
2001
0.952
0.590
0.964
0.498
0.894
0.605
0.885
0.735
0.840
0.850
0.864
0.789
0.758
0.765
0.994
0.537
0.986
0.698
0.921
0.702
2002
0.936
0.689
0.975
0.459
0.943
0.710
0.863
0.782
0.868
0.883
0.871
0.952
0.753
0.770
0.979
0.636
0.970
0.448
0.919
0.655
2003
0.935
0.781
0.983
0.598
0.908
0.691
0.869
0.636
0.926
0.822
0.869
0.626
0.706
0.732
0.967
0.558
0.987
0.589
0.928
0.551
2004
0.948
0.699
0.912
0.601
0.868
0.777
0.844
0.663
0.949
0.754
0.845
0.587
0.698
0.714
0.962
0.537
0.908
0.366
0.912
0.710
2005
0.955
0.625
0.961
0.598
0.975
0.569
0.893
0.691
0.963
0.611
0.884
0.689
0.705
0.796
0.966
0.688
0.980
0.658
0.914
0.748
2006
0.964
0.549
0.944
0.459
0.970
0.637
0.906
0.804
0.973
0.733
0.912
0.790
0.771
0.822
0.962
0.689
0.984
0.489
0.936
0.754
2007
0.936
0.646
0.878
0.458
0.950
0.619
0.889
0.781
0.942
0.843
0.905
0.845
0.764
0.872
0.979
0.698
0.990
0.588
0.901
0.657
2008
0.923
0.626
0.844
0.584
0.823
0.598
0.802
0.631
0.947
0.859
0.962
0.825
0.799
0.845
0.990
0.790
0.993
0.645
0.961
0.684
2009
0.903
0.789
0.915
0.586
0.906
0.686
0.796
0.655
0.923
0.810
0.924
0.698
0.805
0.704
0.949
0.851
0.976
0.564
0.954
0.600
2010
0.876
0.715
0.926
0.540
0.838
0.689
0.787
0.747
0.935
0.850
0.967
0.790
0.809
0.712
0.961
0.950
0.974
0.648
0.944
0.648
2011
0.938
0.625
0.928
0.547
0.980
0.715
0.759
0.624
0.983
0.768
0.972
0.984
0.815
0.797
0.943
0.889
0.978
0.555
0.932
0.601
1997–2011
0.894
0.658
0.939
0.536
0.921
0.644
0.866
0.696
0.927
0.791
0.890
0.732
0.782
0.797
0.974
0.658
0.971
0.569
0.934
0.640
Thetablerepo
rtsthemeanefficiencyscores
bycoun
tryover
thescrutin
ized
perio
d(1997–2011).Thecostefficiencies(DEA
)wereestim
ated
with
thedata
envelopm
entanalysismetho
dology
usingannu
alfron
tiersand
variablereturnsto
scale(VRS).Thebenchm
arkbestpracticefron
tierfor
DEA
isefficiencyequalto1.TheH-statistic
iscompu
tedby
thesum
ofthethreeestim
ated
inpu
telasticities
ofEquatio
n1(X
1,X 2
andX 3)for
each
year.For
theperio
d1997–2011theaverageH-statistic
isrepo
rted.
Source:A
utho
rs’elabo
ratio
n.
APPLIED ECONOMICS 7
Dow
nloa
ded
by [
Uni
vers
ity o
f Pi
reau
s] a
t 07:
34 0
4 M
ay 2
016

the Variable Returns Scale (VRS) input-orientatedDEA, which allows us to employ both the inputand output variants in order to test if the expectedresults are confirmed under every production andtechnology assumption (Siriopoulos and Tziogkidis2010). Table 2 reports the efficiency scores across allthe sample countries.
One cannot fail to notice that the average bankcost efficiency across all the sample countries isrelatively high at the 77.6%, implying that MENAbanks need to improve only by 22.4%, to reach thecost efficiency frontier. In terms of the time seriesanalysis, the average annual efficiency scores ofbanks in each country relative to the country’s fron-tier reveal stability or a slight general improvementfor the cases of the Lebanese, Algerian and Jordanianbanks and a slight decline in overall efficiency levelsfor the cases of Bahrain and Egyptian banks. Themean efficiency score of the Lebanese and Algerianbanks is 89.4% and 92.1%, respectively, while theaverage for the Jordanian and Egyptian banks is89.0% and 86.6%, respectively.
By contrast, the lowest mean efficiency scores arereported in the cases of Morocco (78.2%) and Egypt(86.6%). These levels are within the range of the costefficiency scores recorded in the empirical literatureon developed countries, ranging from 55% to 95%(Ben Naceur, Khedhiri, and Casu 2011). However, itis important to notice that these efficiencies arecalculated relative to each country’s frontier. As aconsequence, the high efficiency levels displayed arerelative only to the other institutions in a givencountry and the available production technology inthat given country (Ben Naceur, Khedhiri, and Casu2011).
Causality testing
Table 2 reports the results of the Granger causalitytests. In the first set of estimations, competition,measured as the H-statistic, is estimated as a func-tion of lagged competition and lagged cost effi-ciency (DEA).
As a general statement we argue that all alterna-tive econometric methodologies provide us with verylittle variation in similar results, revealing therobustness of our findings. It is noteworthy thataccording to the Hausman test, the null hypothesis(random effects) has been rejected, indicating that
the fixed effects specification is the appropriate one.More specifically, Panel A shows that the first andsecond lags of competition are significantly differentfrom zero across the majority of the specifications,indicating that competition at time t is influenced byprevious years’ competition. Contrary to otherempirical studies (Casu and Girardone 2006), thecoefficients of the lagged cost efficiency variable atthe first and second levels, respectively, are statisti-cally significant. In other words, past years’ bankingefficiency in MENA region Granger causes themarket structure of the industry.
From the implementation of the Wald tests it isevident that the null hypothesis of no-causation(β1 = β2 = 0) is rejected in nearly all of the specifica-tions under study. As described above, the joint nullβ1 = β2 = 0 is interpreted as a panel data test forGranger causality and is distributed as χ2 with ndegrees of freedom. A positive (negative) sumimplies that the causal relationship is also positive(negative), that is an increase (decrease) in theH-statistic in the past increased (decreased) theDEA in the present. Τhe sign of the causal relation-ship is negative, implying that an increase in bankingefficiency Granger causes a decrease in the level ofcompetition and vice versa. In other words, the moreefficient the banks are, the less competitive condi-tions prevail across the banking industry, implyingthat increases in cost efficiency precedes increases inthe market power and resulting to lower competitionlevels. This outcome dictates that banks are moreprone to minimize costs, offer services at lowerprices, and at the same time forces them to increaseprofits (i.e. through shifts in outputs). In this case,efficient banks in terms of superior management andproduction technologies will increase in size andmarket share at the expense of less efficient banks.This is likely to lead to higher market concentrationand therefore to less competition (Vander Vennet2002). However, we shall bear in mind that Grangercausality does not constitute causality in the eco-nomic sense (Schaeck and Cihak 2008; Casu andGirardone 2006).
Panel B reports the results for causality, runningfrom competition to cost efficiency. More specifi-cally, the significance of the coefficients for the firstand second lags of efficiency suggests that the depen-dent variable (efficiency) is affected significantly bythe previous years’ efficiency. However, we cannot
8 N. APERGIS AND M. L. POLEMIS
Dow
nloa
ded
by [
Uni
vers
ity o
f Pi
reau
s] a
t 07:
34 0
4 M
ay 2
016

reach the same conclusion when testing the signifi-cance of the lagged competition levels since therelevant coefficients, albeit positive in most of thecases, are not statistically different from zero, imply-ing that cost efficiency at time t is not influenced byprevious years’ competition levels.
Granger causality running from competition tocost efficiency is positive, but not statistically signif-icant, which gives further evidence in favour of therejection of the QLH, as banks with higher mono-polistic powers (lower competition) do not seem toallow costs to rise as a consequence of slack
management. Furthermore, the absence of a negativerelationship between variations in the level of bank-ing competition towards cost efficiency scores pro-vides strong support to the rejection of the‘Competition-Inefficiency Hypothesis’, denoting thatcompetition does not lead to a decline in bankefficiency.
The two underlying estimated equations pass abattery of diagnostic tests. The adjusted R2 is in themost cases high (ranging from 0.43 to 0.75) and theF-statistic of the joint presence of all the indepen-dent variables in the two ADL models is statistically
Table 2. Empirical results of the Granger causality tests.
Dependent variable Control variables(1)OLS
(2)PGLS_FE
(3)PGLS_RE
(4)GMM
(5)DIF-GMM
(6)SYS-GMM
Panel A – H-statistic Intercept 0.388*** 0.472*** 0.400*** 0.409*** 0.483*** 0.427***(0.147) (0.066) (0.142) (0.059) (0.044) (0.088)
H(−1) 0.567*** 0.433*** 0.549*** 0.514*** 0.562*** 0.549***(0.089) (0.071) (0.088) (0.097) (0.116) (0.093)
H(−2) 0.096 −0.149** 0.115 0.086** 0.218*** 0.236***(0.090) (0.070) (0.087) (0.041) (0.062) (0.081)
DEA(−1) −0.417** −0.269*** −0.467** −0.438*** −0.482*** −0.514***(0.203) (0.071) (0.202) (0.093) (0.074) (0.063)
DEA(−2) 0.248 0.285*** 0.283** 0.273*** 0.296*** 0.318***(0.200) (0.069) (0.200) (0.085) (0.071) (0.065)P ðDEAÞ −0.170 0.017 −0.183 −0.165 −0.186 −0.196
Diagnostics and testingAdjusted R2 0.44 0.74 0.43 0.59 0.64 0.61F-statistic 27.21*** 28.919*** 7.13*** 26.94*** 32.40*** 35.61***
[0.00] [0.00] [0.00] [0.00] [0.00] [0.00]Wald test{H0 β1 = β2 = 0}
2.351* 9.64 3.011** 13.48*** 20.36*** 24.38***[0.09] [0.00] [0.05] [0.01] [0.00] [0.00]
Wald test{H0 β1 + β2 = 0}
1.79 0.079 2.29 1.85 1.57 1.68[0.18] [0.77] [0.13] [0.29] [0.38] [0.33]
J-statistic – – – 2.048 1.082 1.014[0.15] [0.33] [0.28]
Hausman test – – 26.303*** – – –[0.00]
Panel B – DEA Intercept 0.160*** 0.394*** 0.127** 0.236** 0.209** 0.247***(0.063) (0.077) (0.057) (0.103) (0.098) (0.071)
DEA(−1) 0.597*** 0.394*** 0.601*** 0.563*** 0.581*** 0.619***(0.087) (0.087) (0.081) (0.062) (0.091) (0.085)
DEA(−2) 0.246*** 0.152* 0.270*** 0.247*** 0.278*** 0.307***(0.086) (0.084) (0.080) (0.071) (0.064) (0.058)
H(−1) −0.031 −0.015 −0.031 −0.026 −0.049* −0.062**(0.038) (0.038) (0.035) (0.049) (0.032) (0.029)
H(−2) 0.008 0.046 0.020 0.017 0.035 0.028(0.039) (0.039) (0.035) (0.053) (0.047) (0.059)P ðHÞ −0.023 0.031 −0.011 −0.009 −0.014 −0.034
Diagnostics and testingAdjusted R2 0.70 0.75 0.72 0.58 0.53 0.55F-statistic 77.45 31.35 21.89 18.74 20.36 27.64
[0.00] [0.00] [0.00] [0.00] [0.00] [0.00]Wald test{H0 β1 = β2 = 0}
0.396 0.689 0.765 0.638 0.594 0.611[0.67] [0.50] [0.68] [0.73] [0.79] [0.74]
Wald test{H0 β1 + β2 = 0}
0.465 0.496 0.112 0.085 0.060 0.074[0.50] [0.48] [0.74] [0.81] [0.86] [0.79]
J-statistic – – – 1.509 2.071 2.92[0.58] [0.41] [0.27]
Hausman test – – 33.161*** – – –[0.00]
OLS = Ordinary Least Squares, PGLS_FE = Panel Generalized Least Squares with Fixed Effects, PGLS_RE = Panel Generalized Least Squares with RandomEffects, GMM = Generalized Method of Moments, DIF-GMM = Difference GMM, SYS-GMM = System GMM. Asymptotic standard error in parentheses.Figures in square brackets denote p-values. The use of the fixed effects specification is justified after a Hausman test for each model. J-statistic is a Sargan–Hansen test of the over-identifying restrictions for the GMM estimators. Significant at ***1%, **5% and *10% levels, respectively.
APPLIED ECONOMICS 9
Dow
nloa
ded
by [
Uni
vers
ity o
f Pi
reau
s] a
t 07:
34 0
4 M
ay 2
016
significant at the 1% level of significance. Finally, thereported J-statistic in GMM models (columns 4, 5and 6) denoting the Sargan–Hansen test, indicatesthat the instrument list satisfies the orthogonalityconditions across all four specifications, since thenull hypothesis that the over-identifying restrictionsare valid cannot be rejected.
The above results are in line with other similarstudies (Schaeck and Cihak 2008; Casu andGirardone 2006), which test Granger causalitybetween market power (Lerner index) and cost/profitefficiency for a sample of European banks. The esti-mated models have been also checked for the stabilityover time (or ‘long-run effect’) of the H-statistic overthe DEA variable by testing the restriction β1 + β2 = 0.A rejection of the restriction implies that there isevidence of a long-run effect of H-statistic on DEA.In a different case, DEA will depend on the change inH-statistic rather than on its level (Casu andGirardone 2006). From the relevant table, it is evidentthat, there is no evidence of a long-run effect ofcompetition on cost efficiency, since the relevanthypothesis of the joint restriction (H0: β1 + β2 = 0),cannot be rejected across all specifications.
Our results provide some empirical evidence thatcost efficiency may have a negative effect on compe-tition in the case of MENA banks. Our results of theone way (negative) Granger type causality runningfrom cost efficiency to competition, do not provideevidence that increases (decreases) in competitionprecede increases (decreases) in cost efficiency.This outcome does not support the ‘EfficientStructure Hypothesis’, suggesting that increases incompetition lead to increases in banks’ efficiency(Demsetz 1973). This hypothesis stipulates that abank which operates more efficiently than its com-petitors gains higher profits resulting from lowoperational costs (Mensi and Zouari 2010).
Robustness checks: an alternative methodologicalapproach
This part of the empirical analysis measures theextend of banking competition across our MENAcountry sample through the estimation of a commonglobal frontier by means of the bias correction usingthe Bootstrap Data Envelopment Analysis (BDEA), awidely used nonparametric methodology. Accordingto Simar and Wilson (2000, 2008) DEA estimators
are shown to be biased by construction. Accordingly,they introduced a methodological approach based onbootstrap techniques to correct and estimate the biasof the DEA efficiency indicators. Several authorshave point out the essence of bootstrap techniquesas an alternative methodology (Tu and Zhang 1992;Alonso, Pena, and Romo 2006).
In the first stage, the estimated efficiency scoresreported in Table 1 are used.
In the second stage, the Simar and Wilson (2008)procedure is used to bootstrap the DEA scores witha truncated bootstrapped regression (Barros,Caporale, and Abreu 2008).
Stage 1Consider the jth bank with outputs and inputs Yrj,Xij (that are all positive) with Ur and Vi are thevariable weights to be determined by the solutionof the problem below (Charnes, Cooper, and Rhodes1978):
Max z0 ¼Xs
r¼1
UrYr;0=Xm
i¼1
ViXi;0 (6)
subject to:
Xs
r¼1
UrYr;j=Xm
i¼1
ViXi;j � 1; j ¼ 1; 2; :::; n (7)
Ur;Vi � 0; r ¼ 1; 2; . . . ; s; i ¼ 1; 2; . . . ;m (8)
The true efficiency score ẑ0, is not observed directly,rather it is empirically estimated. Many studies haveused a two-stage approach, where efficiency is esti-mated in the first stage, and then the estimatedefficiencies are regressed on covariates (typically dif-ferent from those used in the first stage) that areviewed as environmental variables (Simar andWilson 2008; Barros, Caporale, and Abreu 2008).Simar and Wilson (2008) criticized this two-stagemethod because the DEA efficiency estimates arebiased and serially correlated, therefore, invalidatingconventional inferences in the second stage. Simarand Wilson (2008) propose a procedure, based on adouble bootstrap, which provides a confidence inter-val for the efficiency estimates and yields consistentinferences for factors explaining efficiency.
Stage 2Next, to implement the bootstrap procedure forDEA, it is assumed that the original data are
10 N. APERGIS AND M. L. POLEMIS
Dow
nloa
ded
by [
Uni
vers
ity o
f Pi
reau
s] a
t 07:
34 0
4 M
ay 2
016

generated by a data generating process which is ableto simulate this process by using a new (pseudo)data set that is drawn from the original data set.Then, we re-estimate the DEA model with this newdata. By repeating this process 2000 times (suggestedby Simar and Wilson 2000) and it is able to derive anempirical distribution of these bootstrap values(Balcombe et al. 2008). One hundred bootstrap repli-cations are used to compute the bias-corrected esti-mates. The efficiency scores of bank j obtained in thefirst stage are regressed on the recommended expla-natory variables used before. However, these second-stage estimates are inconsistent and biased and abootstrap procedure is needed to overcome this pro-blem (Efron and Tisbhirani 1993). The second stageregression is given by:
zi;t ¼ βzi þ εi (9)
or, equivalently:
zi;t ¼ αþ β1 lnX1;it þ β2 lnX2;it þ β3 lnX3;it
þ γ1lnY1;it þ γ2lnY2;it þ γ3 lnY3;it þ εit
(10)
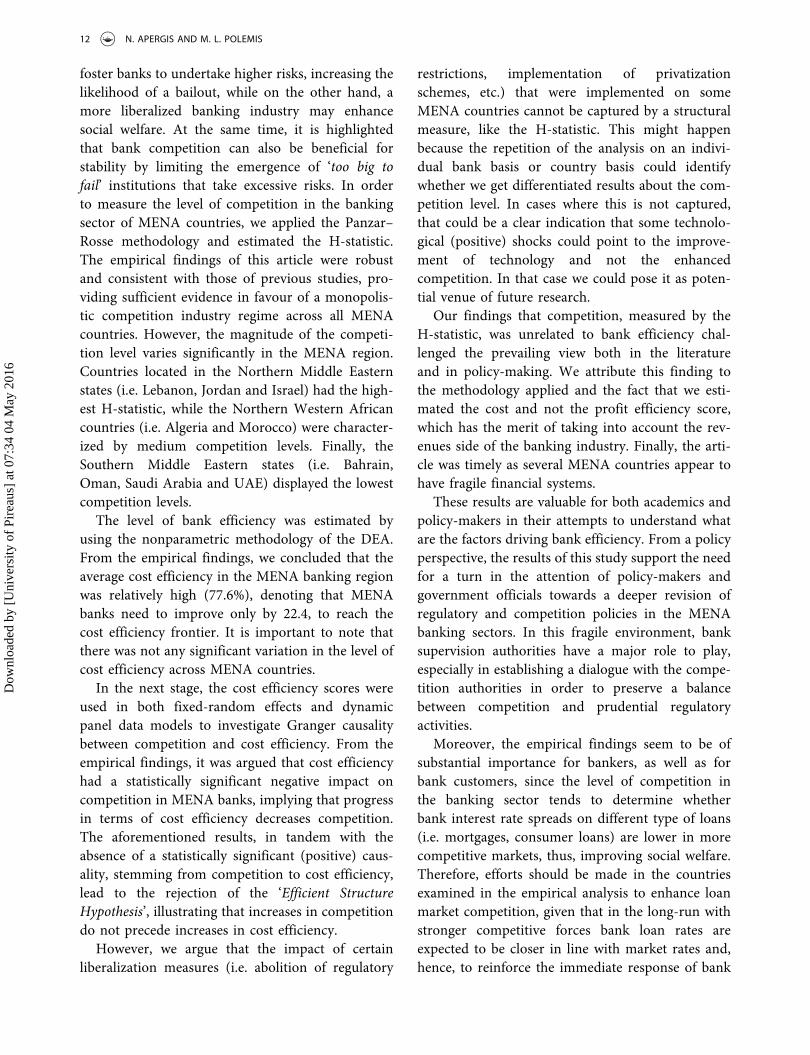
where ẑi,t represents the efficiency score, estimated instage 1, and the other independent variables are theenvironmental covariates reported in Equation 1.The new parametric results are reported in Table 3.The new findings still provide supportive evidence infavour of the monopolistic competition across theMENA banking systems, though the quantitativeimportance is lower than that provided in Table 1.
V. Conclusions and policy implications
This was the first study that examined the relation-ship between cost efficiency and competition in thebanking industry across 10 MENA countries (i.e.Lebanon, Bahrain, Algeria, Egypt, Israel, Jordan,Morocco, Oman, Saudi Arabia and UAE) spanningthe period 1997–2011. Over the last decade, thesecountries experienced significant structural reformsunder the auspices of the International MonetaryFund and many of them are in the process of imple-mentation privatization programmes in order tofacilitate growth and economic prosperity.
Assessing bank competition in MENA regionconstitutes a crucial, but controversial issue. On theone hand, it is argued that fierce competition may Ta
ble3.
BootstrapDEA
efficiencyscores
andtheH-statistic
perMEN
Acoun
try.
Year
Lebano
nBahrain
Algeria
Egypt
Israel
Jordan
Morocco
Oman
Saud
iArabia
UAE
DEA
H-statistic
DEA
H-statistic
DEA
H-statistic
DEA
H-statistic
DEA
H-statistic
DEA
H-statistic
DEA
H-statistic
DEA
H-statistic
DEA
H-statistic
DEA
H-statistic
1997
0.719
0.628
0.883
0.429
0.884
0.629
0.901
0.718
0.940
0.752
0.821
0.629
0.861
0.862
0.954
0.428
0.930
0.628
0.930
0.486
1998
0.703
0.601
0.962
0.563
0.918
0.525
0.914
0.650
0.828
0.748
0.794
0.427
0.785
0.827
0.948
0.427
0.934
0.525
0.942
0.558
1999
0.816
0.677
0.960
0.526
0.920
0.521
0.883
0.579
0.901
0.727
0.806
0.560
0.818
0.774
0.948
0.530
0.948
0.459
0.901
0.501
2000
0.797
0.546
0.952
0.486
0.936
0.598
0.875
0.642
0.892
0.744
0.852
0.668
0.752
0.849
0.957
0.549
0.925
0.550
0.898
0.624
2001
0.921
0.571
0.939
0.469
0.860
0.577
0.856
0.709
0.815
0.829
0.839
0.757
0.720
0.736
0.960
0.506
0.961
0.662
0.875
0.682
2002
0.903
0.654
0.954
0.430
0.914
0.682
0.838
0.742
0.838
0.860
0.850
0.921
0.725
0.742
0.952
0.600
0.948
0.423
0.871
0.629
2003
0.910
0.749
0.948
0.571
0.882
0.658
0.840
0.600
0.896
0.796
0.845
0.594
0.663
0.701
0.935
0.527
0.959
0.551
0.894
0.536
2004
0.922
0.656
0.884
0.582
0.840
0.758
0.816
0.638
0.919
0.720
0.819
0.550
0.639
0.684
0.938
0.505
0.874
0.348
0.869
0.689
2005
0.929
0.592
0.939
0.574
0.949
0.544
0.866
0.659
0.932
0.589
0.848
0.649
0.672
0.759
0.929
0.662
0.962
0.629
0.872
0.719
2006
0.934
0.533
0.910
0.426
0.951
0.601
0.881
0.779
0.940
0.702
0.875
0.754
0.748
0.798
0.936
0.669
0.950
0.450
0.905
0.724
2007
0.905
0.629
0.855
0.430
0.932
0.585
0.857
0.754
0.921
0.818
0.881
0.821
0.733
0.852
0.939
0.670
0.959
0.555
0.869
0.629
2008
0.901
0.601
0.829
0.563
0.801
0.568
0.776
0.601
0.926
0.824
0.940
0.794
0.768
0.818
0.962
0.768
0.965
0.619
0.920
0.647
2009
0.885
0.765
0.891
0.549
0.879
0.649
0.764
0.619
0.895
0.786
0.896
0.658
0.775
0.673
0.918
0.826
0.943
0.531
0.929
0.578
2010
0.852
0.683
0.902
0.521
0.811
0.660
0.750
0.725
0.903
0.821
0.911
0.755
0.773
0.671
0.925
0.914
0.949
0.625
0.920
0.616
2011
0.901
0.598
0.909
0.529
0.962
0.682
0.731
0.602
0.957
0.739
0.926
0.956
0.780
0.759
0.917
0.847
0.950
0.524
0.901
0.580
1997–2011
0.870
0.551
0.910
0.511
0.902
0.621
0.842
0.673
0.901
0.761
0.863
0.704
0.752
0.773
0.941
0.632
0.944
0.541
0.902
0.614
APPLIED ECONOMICS 11
Dow
nloa
ded
by [
Uni
vers
ity o
f Pi
reau
s] a
t 07:
34 0
4 M
ay 2
016
foster banks to undertake higher risks, increasing thelikelihood of a bailout, while on the other hand, amore liberalized banking industry may enhancesocial welfare. At the same time, it is highlightedthat bank competition can also be beneficial forstability by limiting the emergence of ‘too big tofail’ institutions that take excessive risks. In orderto measure the level of competition in the bankingsector of MENA countries, we applied the Panzar–Rosse methodology and estimated the H-statistic.The empirical findings of this article were robustand consistent with those of previous studies, pro-viding sufficient evidence in favour of a monopolis-tic competition industry regime across all MENAcountries. However, the magnitude of the competi-tion level varies significantly in the MENA region.Countries located in the Northern Middle Easternstates (i.e. Lebanon, Jordan and Israel) had the high-est H-statistic, while the Northern Western Africancountries (i.e. Algeria and Morocco) were character-ized by medium competition levels. Finally, theSouthern Middle Eastern states (i.e. Bahrain,Oman, Saudi Arabia and UAE) displayed the lowestcompetition levels.
The level of bank efficiency was estimated byusing the nonparametric methodology of the DEA.From the empirical findings, we concluded that theaverage cost efficiency in the MENA banking regionwas relatively high (77.6%), denoting that MENAbanks need to improve only by 22.4, to reach thecost efficiency frontier. It is important to note thatthere was not any significant variation in the level ofcost efficiency across MENA countries.
In the next stage, the cost efficiency scores wereused in both fixed-random effects and dynamicpanel data models to investigate Granger causalitybetween competition and cost efficiency. From theempirical findings, it was argued that cost efficiencyhad a statistically significant negative impact oncompetition in MENA banks, implying that progressin terms of cost efficiency decreases competition.The aforementioned results, in tandem with theabsence of a statistically significant (positive) caus-ality, stemming from competition to cost efficiency,lead to the rejection of the ‘Efficient StructureHypothesis’, illustrating that increases in competitiondo not precede increases in cost efficiency.
However, we argue that the impact of certainliberalization measures (i.e. abolition of regulatory
restrictions, implementation of privatizationschemes, etc.) that were implemented on someMENA countries cannot be captured by a structuralmeasure, like the H-statistic. This might happenbecause the repetition of the analysis on an indivi-dual bank basis or country basis could identifywhether we get differentiated results about the com-petition level. In cases where this is not captured,that could be a clear indication that some technolo-gical (positive) shocks could point to the improve-ment of technology and not the enhancedcompetition. In that case we could pose it as poten-tial venue of future research.
Our findings that competition, measured by theH-statistic, was unrelated to bank efficiency chal-lenged the prevailing view both in the literatureand in policy-making. We attribute this finding tothe methodology applied and the fact that we esti-mated the cost and not the profit efficiency score,which has the merit of taking into account the rev-enues side of the banking industry. Finally, the arti-cle was timely as several MENA countries appear tohave fragile financial systems.
These results are valuable for both academics andpolicy-makers in their attempts to understand whatare the factors driving bank efficiency. From a policyperspective, the results of this study support the needfor a turn in the attention of policy-makers andgovernment officials towards a deeper revision ofregulatory and competition policies in the MENAbanking sectors. In this fragile environment, banksupervision authorities have a major role to play,especially in establishing a dialogue with the compe-tition authorities in order to preserve a balancebetween competition and prudential regulatoryactivities.
Moreover, the empirical findings seem to be ofsubstantial importance for bankers, as well as forbank customers, since the level of competition inthe banking sector tends to determine whetherbank interest rate spreads on different type of loans(i.e. mortgages, consumer loans) are lower in morecompetitive markets, thus, improving social welfare.Therefore, efforts should be made in the countriesexamined in the empirical analysis to enhance loanmarket competition, given that in the long-run withstronger competitive forces bank loan rates areexpected to be closer in line with market rates and,hence, to reinforce the immediate response of bank
12 N. APERGIS AND M. L. POLEMIS
Dow
nloa
ded
by [
Uni
vers
ity o
f Pi
reau
s] a
t 07:
34 0
4 M
ay 2
016

interest rates to changes in corresponding marketrates, providing stronger efficiency of the transmis-sion of monetary policy activities to the real econ-omy, thus, underlining the fact that enhanced bankcompetition is expected to have a substantial impacton the monetary policy transmission mechanism byincreasing the speed of monetary policy decisions.
In addition, the findings recommend that theMENA countries could use a higher price competi-tion that could improve their liquidity position byinducing the adoption of self-discipline mechanismsin relevance to the choice of bank funding sources,since the higher competition will render their fund-ing research process more costly. At the same time,bank regulators (i.e. central banks) could demandhigher capital ratios, which could also strengthentheir liquidity-enhancing effect of price competition.The higher competition level may also exert a posi-tive effect on the banks’ solvency, since they will bein an environment conducive to pursuing activemanagement of their capital though increases intheir capital base. These recommendations constitutestrong evidence on the need for prudential require-ments that could provide an effective mechanismwhich will allow banking institutions to safely man-age their additional profit margins and increase theircapital buffers. Finally, the avoidance of a competi-tive environment across MENA banks could alleviatepotential bank risks (i.e. credit and solvency risks).
To this end, policy-makers should opt for reformsthat promote higher competition, while theyimprove the quality and independence of prudentialsupervision and reduce the control of governmentson the banking sector, in order to limit the impact ofdistortionary incentives on bank behaviour. Suchsupportive activities include the adoption of moreappropriate risk management in their lendingmechanisms, the avoidance of excessive and riskyexpansions of credit for increasing their profitability,and the reduction of moral hazard incentives thatthe adoption of imprudent management of theirliquidity concurs.
Acknowledgements
The authors wish to thank two referees from this journalwhose comments and suggestions enhanced the merit of thiswork. Special thanks also go to Dr Marco Lau for his specialassistance for providing the code of bootstrap DEA.
Disclosure statement
No potential conflict of interest was reported by the authors.
References
Almarzoqi, R., S. Ben Naceur, and A. Scopelliti. 2015. HowDoes Bank Competition Affect Solvency, Liquidity andCredit Risk? Evidence from the MENA Countries.Working Paper 15/210. Washington, DC: InternationalMonetary Fund.
Al-Muharrami, S., K. Matthews, and Y. Khabari. 2006.“Market Structure and Competitive Conditions in theArab GCC Banking System.” Journal of Banking &Finance 30: 3487–3501. doi:10.1016/j.jbankfin.2006.01.006.
Alonso, A. M., D. Pena, and J. Romo. 2006. “Introducing ModelUncertainty by Moving Blocks Bootstrap.” Statistical Papers47: 167–179. doi:10.1007/s00362-005-0282-7.
Andries, A. M., and Capraru, B. 2014. “The Nexus BetweenCompetition and Efficiency: The European BankingIndustries Experience.” International Business Review 23:566–579.
Anzoategui, D., M. Martinez Peria, and R. Rocha. 2010.“Bank Competition in the Middle East and NorthernAfrica Region.” Review of Middle East Economics andFinance 6: 26–48. doi:10.2202/1475-3693.1313.
Arellano, M., and S. R. Bond. 1991. “Some Tests ofSpecification for Panel Data: Monte Carlo Evidence andan Application to Employment Equations.” The Review ofEconomic Studies 58: 277–297. doi:10.2307/2297968.
Balcombe, K., I. Fraser, L. Latruffe, M. Rahman, and L.Smith. 2008. “An Application of the DEA DoubleBootstrap to Examine Sources of Efficiency inBangladesh Rice Farming.” Applied Economics 40: 1919–1925. doi:10.1080/00036840600905282.
Banker, R. D., A. Charnes, and W. W. Cooper. 1984. “SomeModels for Estimating Technical and Scale Inefficienciesin Data Envelopment Analysis.” Management Science 30:1078–1092. doi:10.1287/mnsc.30.9.1078.
Barros, C. P., G. M. Caporale, and M. Abreu (2008).“Productivity Drivers in European Banking: CountryEffects, Legal Tradition and Market Dynamics.” WorkingPaper. London: Brunel University.
Beck, T., A. Demirguc-Kunt, and R. Levine. 2006. “BankConcentration, Competition, and Crises: First Results.”Journal of Banking and Finance 30: 1581–1603.doi:10.1016/j.jbankfin.2005.05.010.
Ban Naceur, S., H. Khedhiri, and B. Casu. 2011. What Drivesthe Performance of Selected MENA Banks? A Meta-FrontierAnalysis. Working Paper, 11/34. Washington, DC:International Monetary Fund.
Berger, A. N., and D. B. Humphrey. 1997. “Efficiency ofFinancial Institutions: International Survey andDirections for Future Research.” European Journal ofOperational Research 98: 175–212. doi:10.1016/S0377-2217(96)00342-6.
APPLIED ECONOMICS 13
Dow
nloa
ded
by [
Uni
vers
ity o
f Pi
reau
s] a
t 07:
34 0
4 M
ay 2
016

Bikker, J. A., and K. Haaf. 2002. “Competition, Concentrationand their Relationship: An Empirical Analysis of theBanking Industry.” Journal of Banking & Finance 26:2191–2214. doi:10.1016/S0378-4266(02)00205-4.
Bikker, J. A., S. Shaffer, and L. Spierdijk. 2012. “AssessingCompetition with the Panzar-Rosse Model: The Role ofScale, Costs, and Equilibrium.” The Review of Economicsand Statistics 94 (4): 1025–1044. doi:10.1162/REST_a_00210.
Blundell, R., and S. R. Bond. 1998. “Initial Conditions andMoment Restrictions in Dynamic Panel Data Models.”Journal of Econometrics 87: 115–143. doi:10.1016/S0304-4076(98)00009-8.
Boone, J. 2001. “Intensity of Competition and the Incentiveto Innovate.” International Journal of IndustrialOrganization 19: 705–726. doi:10.1016/S0167-7187(00)00090-4.
Boone, J. 2008. “A New Way to Measure Competition.” TheEconomic Journal 118: 1245–1261. doi:10.1111/ecoj.2008.118.issue-531.
Cambini, C., and L. Rondi. 2010. “Incentive Regulation andInvestment: Evidence from European Energy Utilities.”Journal of Regulatory Economics 38 (1): 1–26.
Castellanos, S., and J. García. 2013. Competition andEfficiency in the Mexican Banking Sector. Working Paper13/29. Mexico City: BBVA Bancomer.
Casu, B., and C. Girardone. 2006. “Bank Competition,Concentration and Efficiency in the Single EuropeanMarket.” The Manchester School 74: 441–468.doi:10.1111/manc.2006.74.issue-4.
Charnes, A., W. W. Cooper, and E. Rhodes. 1978.“Measuring the Efficiency of Decision Making Units.”European Journal of Operational Research 2: 429–444.doi:10.1016/0377-2217(78)90138-8.
Claessens, S., and L. Laeven. 2004. “What Drives BankCompetition? Some International Evidence.” Journal ofMoney Credit and Banking 36: 563–583. doi:10.1353/mcb.2004.0044.
Coelli, T. 1996. A Guide to DEAP Version 2.1: A DataEnvelopment Analysis (Computer) Program. CEPAWorking Paper 96/08. Brisbane, QLD: CEPA.
De Bandt, O., and E. Philip Davis. 2000. “Competition,Contestability and Market Structure in European BankingSectors on the Eve of EMU.” Journal of Banking & Finance24: 1045–1066. doi:10.1016/S0378-4266(99)00117-X.
Delis, M., and E. Tsionas. 2009. “The Joint Estimation ofBank-Level Market Power and Efficiency.” Journal ofBanking & Finance 33: 1842–1850. doi:10.1016/j.jbankfin.2009.04.006.
Demsetz, H. 1973. “Industry Structure, Market Rivalry andPublic Policy.” The Journal of Law and Economics 16: 1–9.doi:10.1086/466752.
Efron, B., and R. J. Tisbhirani. 1993. An Introduction to theBootstrap. New York: Chapman and Hall.
Eisazadeh, S., and Z. Shaeri. 2012. “An Analysis of BankEfficiency in the Middle East and North Africa.” TheInternational Journal of Banking and Finance 9 (4): 28–47.
Farrell, M. J. 1957. “The Measurement of ProductiveEfficiency.” Journal of the Royal Statistical Society 120:253–290. doi:10.2307/2343100.
Gutierrez, L. 2007. Testing for Competition in the SpanishBanking Industry: The Panzar-Rosse Approach Revisited.Working Paper No. 0726. Madrid: National Central Bankof Spain.
Hansen, L. P. 1982. “Large Sample Properties of GeneralizedMethod of Moments Estimators.” Econometrica 50: 1029–1054. doi:10.2307/1912775.
Hausman, J. A., and A. Ros. 2013. “An EconometricAssessment of Telecommunications Prices andConsumer Surplus in Mexico Using Panel Data.” Journalof Regulatory Economics 43: 284–304. doi:10.1007/s11149-013-9212-0.
Hicks, J. 1935. “Annual Survey of Economic Theory: The Theoryof Monopoly.” Econometrica 3: 1–20. doi:10.2307/1907343.
Leibenstein, H. 1966. “Allocative Efficiency versusX-Efficiency.” American Economic Review 56: 392–415.
Mamatzakis, E., A. N. Kalyvas, and J. Piesse. 2013. “DoesRegulation in Credit, Labour and Business Matter forBank Performance in the EU-10 Economies?”International Journal of the Economics of Business 20:341–385. doi:10.1080/13571516.2013.835981.
Mamatzakis, E., C. Staikouras, and N. Koutsomanoli-Fillipaki. 2005. “Competition and Concentration in theBanking Sector of the South Eastern European Region.”Emerging Markets Review 6: 192–209. doi:10.1016/j.ememar.2005.03.003.
Mensi, S., and A. Zouari. 2010. “Efficient Structure versusMarket Power: Theories and Empirical Evidence.”International Journal of Economics and Finance 2 (4):151–167. doi:10.5539/ijef.v2n4p151.
Molyneux, P., D. M. Lloyd-Williams, and J. Thornton. 1994.“Competitive Conditions in European Banking.” Journal ofBanking & Finance 18: 445–459. doi:10.1016/0378-4266(94)90003-5.
Murjan, W., and C. Ruza. 2002. “The Competitive Nature ofthe Arab Middle Eastern banking Markets.” InternationalAdvances in Economic Research 8: 267–274. doi:10.1007/BF02295501.
Nickell, S. J. 1999. “Product Markets and Labour Markets.”Labour Economics 6: 1–20. doi:10.1016/S0927-5371(99)00005-6.
Panzar, J. C., and J. N. Rosse. 1987. “Testing for ‘Monopoly’Equilibrium.” The Journal of Industrial Economics 35: 443–456. doi:10.2307/2098582.
Polemis, M. 2015. “Does Monopolistic Competition Exist inthe MENA Region? Evidence from the Banking Sector.”Bulletin of Economic Research 67: S74-S96. doi:10.1111/boer.2015.67.issue-S1.
Schaeck, K., and M. Cihak. 2008. How Does CompetitionAffect Efficiency and Soundness in Banking? EmpiricalEvidence. ECB Working Paper Series No. 932. Frankfurt:European Central Bank.
Shaffer, S. 1982. “Competition, Conduct and DemandElasticity.” Economics Letters 10: 167–171.
14 N. APERGIS AND M. L. POLEMIS
Dow
nloa
ded
by [
Uni
vers
ity o
f Pi
reau
s] a
t 07:
34 0
4 M
ay 2
016

Shaffer, S. 2002. “Conduct in a Banking Monopoly.” Reviewof Industrial Organization 20: 221–238. doi:10.1023/A:1015091407841.
Sharma, C., and R. K. Mishra. 2011. “Does Export andProductivity Growth Linkage Exist? Evidence from theIndian Manufacturing Industry.” International Review ofApplied Economics 25 (6): 633–652. doi:10.1080/02692171.2011.557046.
Simar, L., and P. W. Wilson. 2000. “A General Methodologyfor Bootstrapping in Nonparametric Frontier Models.”Journal of Applied Statistics 27: 779–802. doi:10.1080/02664760050081951.
Simar, L., and P. W. Wilson. 2008. “Statistical Interference inNonparametric Frontier Models: Recent Developments andPerspectives.” In The Measurement of Productive Efficiencyand Productivity Change, edited by Fried, H., C. A. K.Lovell, and S. Schmidt. New York: Oxford University Press.
Siriopoulos, C., and P. Tziogkidis. 2010. “How Do GreekBanking Institutions React after Significant Events? - A DEAApproach.” Omega 38 (5): 294–308. doi:10.1016/j.omega.2009.06.001.
Staikouras, C., and A. Koutsomanoli-Fillipaki. 2006.“Competition and Concentration in the New EuropeanBanking Landscape.” European Financial Management12: 443–482. doi:10.1111/eufm.2006.12.issue-3.
Tirole, J. 1998. Theory of Industrial Organization. Cambridge:MIT Press.
Tu, D., and L. Zhang. 1992. “On the Estimation of Skewnessof a Statistic Using the Jackknife and the Bootstrap.”Statistical Papers 33: 39–56. doi:10.1007/BF02925311.
Turk-Ariss, R. 2009. “Competitive Behavior in Middle Eastand North Africa Banking Systems.” The Quarterly Reviewof Economics and Finance 49: 693–710. doi:10.1016/j.qref.2008.03.002.
Vander Vennet, R. 2002. “Cost and Profit Efficiency ofFinancial Conglomerates and Universal Banks inEurope.” Journal of Money, Credit, and Banking 34: 254–282. doi:10.1353/mcb.2002.0036.
Webb, R. 2003. “Levels of Efficiency in UK Retail Banks: ADEA Window Analysis.” International Journal of theEconomics of Business 10: 305–322. doi:10.1080/1357151032000126256.
Winter, S. 1984. “Schumpeterian Competition in AlternativeTechnological Regimes.” Journal of Economic Behavior &Organization 5: 287–320. doi:10.1016/0167-2681(84)90004-0.
Yildirim, H., and G. Philippatos. 2007. “Competition andContestability in Central and Eastern European BankingMarkets.” Managerial Finance 33: 195–209. doi:10.1108/03074350710718275.
APPLIED ECONOMICS 15
Dow
nloa
ded
by [
Uni
vers
ity o
f Pi
reau
s] a
t 07:
34 0
4 M
ay 2
016

Appendix
Table A1. Descriptive statistics.Statistical measures Lebanon Bahrain Algeria Egypt Israel Jordan Morocco Oman Saudi Arabia UAE
Total income (TI)Observations 775 215 141 338 180 131 90 90 137 249Cross section dimension (number of banks) 65 15 19 32 18 11 15 11 11 20Mean −2.94 −2.17 −2.89 −2.47 −2.64 −2.68 −2.86 −2.64 −2.82 −2.70Median −2.73 −2.33 −2.83 −2.44 −2.62 −2.64 −2.81 −2.66 −2.75 −2.68Maximum −1.65 −1.75 −1.75 −1.79 −1.31 −2.19 −2.37 −2.26 −1.69 −2.00Minimum −3.86 −3.92 −4.86 −3.99 −3.97 −3.22 −5.14 −3.40 −3.35 −4.35Standard deviation 0.41 0.18 0.44 0.29 0.37 0.22 0.35 0.24 0.25 0.27Skewness −0.74 −1.11 −0.89 −2.17 0.04 −0.51 −4.00 −0.66 0.32 −0.92Kurtosis 4.62 7.17 5.55 11.13 4.62 2.68 23.49 3.34 4.86 7.44
Average funding rate (X1)Observations 971 223 153 339 154 142 86 89 137 249Cross section dimension (number of banks) 65 15 19 32 18 11 15 11 11 20Mean −3.59 −3.49 −4.31 −2.88 −3.26 −3.39 −3.80 −3.58 −3.90 −3.60Median −3.52 −3.41 −4.28 −2.78 −3.12 −3.41 −3.80 −3.53 −3.72 −3.49Maximum −2.45 −2.46 −2.38 −2.31 −1.19 −2.56 −3.02 −2.71 −2.78 −2.67Minimum −6.32 −5.86 −9.51 −5.79 −8.46 −4.51 −6.18 −5.07 −5.84 −5.19Standard deviation 0.63 0.57 1.03 0.41 0.84 0.49 0.48 0.56 0.73 0.51Skewness −1.21 −1.26 −0.82 −2.88 −2.08 −0.17 −1.77 −0.46 −0.77 −0.72Kurtosis 6.98 7.17 5.60 17.17 13.13 1.98 9.99 2.53 2.66 2.74Wage rate (X2)Observations 887 204 159 338 180 142 90 90 137 248Cross section dimension (number of banks) 65 15 19 32 18 11 15 11 11 20Mean −4.01 −3.99 −4.14 −4.09 −3.70 −3.82 −4.03 −3.85 −4.21 −4.23Median −3.97 −3.95 −4.09 −4.06 −3.75 −3.76 −3.87 −3.81 −4.17 −4.23Maximum −2.81 −2.92 −2.03 −2.14 −2.69 −2.80 −2.92 −3.45 −3.40 −3.07Minimum −5.57 −5.39 −6.88 −5.21 −5.13 −4.49 −7.78 −4.50 −5.15 −5.44Standard deviation 0.44 0.40 0.75 0.40 0.37 0.30 0.80 0.21 0.28 0.43Skewness −0.58 −0.59 −0.45 0.11 −0.91 0.23 −3.25 −0.51 −0.21 0.39Kurtosis 5.05 5.26 3.52 4.00 7.03 2.77 13.79 2.89 3.62 2.75
Price of physical capital (X3)Observations 970 208 153 338 180 142 96 90 137 247Cross section dimension (number of banks) 65 15 19 32 18 11 15 11 11 20Mean −0.50 −0.50 −0.54 0.53 −0.05 −0.32 −2.59 −0.02 −0.52 −0.50Median −0.50 −0.49 −0.50 0.50 −0.23 −0.36 −2.43 −0.02 −0.46 −0.46Maximum 1.44 1.44 1.45 2.99 1.75 0.96 −0.79 1.09 0.41 3.67Minimum −2.48 −2.32 −3.62 −1.68 −1.06 −1.39 −4.96 −1.61 −1.84 −3.70Standard deviation 0.65 0.63 0.79 0.73 0.62 0.52 0.65 0.55 0.44 0.89Skewness −0.13 −0.08 −0.45 0.12 1.45 0.34 −1.72 −0.83 −0.57 0.66Kurtosis 4.76 4.84 4.16 3.66 4.34 2.98 7.56 3.75 3.15 8.45
Leverage (Y1)Observations 965 198 165 339 180 137 96 90 137 249Cross section dimension (number of banks) 65 15 19 32 18 11 15 11 11 20Mean −2.03 −2.00 −2.26 −2.50 −2.73 −2.19 −0.63 −1.96 −2.16 −1.83Median −2.04 −2.01 −2.26 −2.46 −2.85 −2.10 −0.69 −2.00 −2.14 −1.83Maximum −0.61 −0.69 −0.09 −1.37 −1.37 −1.49 1.76 −0.03 −1.31 −1.00Minimum −4.11 −4.00 −4.90 −9.81 −3.93 −3.26 −2.11 −2.60 −3.52 −2.78Standard deviation 0.52 0.45 1.01 0.64 0.40 0.41 0.72 0.40 0.27 0.33Skewness −0.21 −0.20 −0.28 −4.37 1.65 −0.70 0.60 2.79 −1.08 −0.28Kurtosis 11.22 12.41 2.86 50.52 5.84 2.73 4.16 12.18 8.68 2.76
Credit risk (Y2)Observations 972 221 164 340 180 142 94 90 137 249Cross section dimension (number of banks) 65 15 19 32 18 11 15 11 11 20Mean −0.69 −0.64 −1.02 −0.89 −0.46 −0.82 −0.69 −0.37 −0.75 −0.53Median −0.63 −0.59 −0.89 −0.82 −0.38 −0.83 −0.57 −0.37 −0.72 −0.44Maximum −0.22 −0.24 −0.12 −0.19 −0.06 −0.49 −0.21 −0.19 −0.42 −0.11Minimum −2.39 −1.86 −6.09 −2.34 −1.70 −1.31 −3.97 −0.66 −1.43 −1.61Standard deviation 0.34 0.29 0.70 0.36 0.32 0.17 0.53 0.10 0.23 0.29Skewness −1.57 −1.37 −2.96 −1.25 −1.99 −0.10 −3.32 −0.46 −0.59 −1.90Kurtosis 7.96 6.39 18.95 5.21 6.83 2.50 18.45 2.61 2.75 6.36Asset composition (Y3)Observations 964 202 159 340 180 142 96 90 137 249Cross section dimension (number of banks) 65 15 19 32 18 11 15 11 11 20Mean −4.41 −4.47 −4.03 −4.75 −4.52 −4.20 −3.97 −4.65 −4.54 −4.64Median −4.36 −4.41 −4.03 −4.69 −4.37 −4.12 −3.80 −4.58 −4.58 −4.70Maximum −2.84 −3.00 −1.68 −2.97 −3.29 −2.98 −2.84 −3.52 −3.17 −2.23Minimum −6.62 −6.76 −5.59 −6.59 −7.10 −5.97 −7.78 −5.71 −5.55 −8.65Standard deviation 0.69 0.67 0.81 0.71 0.69 0.59 0.77 0.51 0.57 0.87Skewness −0.69 −0.84 0.37 −0.31 −1.83 −0.43 −2.89 0.07 0.49 −0.96Kurtosis 5.14 5.45 2.97 2.68 6.72 3.06 12.66 2.67 2.70 7.66
Variables are in natural logarithms.Source: Author’s calculations based on data retrieved from the BankScope database.
16 N. APERGIS AND M. L. POLEMIS
Dow
nloa
ded
by [
Uni
vers
ity o
f Pi
reau
s] a
t 07:
34 0
4 M
ay 2
016